Embed Size (px)
Citation preview
BMO Private Bank
Outlook for Financial Markets
MARCH 2017
“You may be disappointed if you fail, but you are doomed if you don’t try.” – Beverly Sills
President Trump has argued that his 4% growth target can be achieved by fixing the tax code, boosting infrastructure spending, lifting the regulatory wet blanket and negotiating new bilateral trade deals to narrow the imbalances. History suggests that deficit spending and debt acceleration can boost economic growth above its long-run potential in the near term. One key question facing the Trump administration is whether or not tax cuts and regulatory rollbacks are enough to power the economy to a consistently steeper trajectory over longer horizons.
One metric that has the potential to throw cold water on Mr. Trump’s economic parade is a strong U.S. dollar. Talking the dollar down will not be enough; the $5 trillion foreign-exchange market is simply too big and too liquid to shape with Twitter posts.
If “Dow 20,000” ends up looking anything like “Dow 10,000,” traders could be donning and removing their party hats for a while. The index first hit five digits in April 1999, but then it moved above and below that level 50 times in the next five years!
Unctuous corporate chieftains are playing an awkward game of Twister as they attempt to balance the needs of shareholders, customers, employees and the Trump Administration. We suspect these Ermenegildo Zegna-clad executives will be contorting for a while more.
We think foreign equities have the potential to outpace domestic markets this year.
EconomyHaving pledged to deliver 4% economic growth, President Trump may soon realize the U.S. is looking more like a donkey than a racehorse. The Commerce Department reported that GDP rose at an annualized pace of 1.9% in the fourth quarter, an amount that was exactly equal to the cumulative growth over the previous year. This makes the current growth rate just short of the post-crisis 2.1% norm.
Household spending was in good shape; final sales grew at a 2.5% annualized pace, the best showing since mid-2015. Business spending was up 3.1% on elevated equipment expenditures, according to the report. However, investments in office buildings and factories fell at a 5% annualized rate last quarter, a big disappointment after a 12% jump over the previous three months. While households opened their wallets, a strong dollar-induced trade gap stole 1.7% from overall growth.
Achieving 4% growth in a 2% environment is a challenge that carries unintended consequences. Central banks have resorted to historically low (and in some cases negative) interest rates to spur economic activity. Cheap money has fueled corporate debt accumulation, stock buybacks and financial risk-taking. Corporate debt growth has outpaced overall economic growth for the last five years, with the total outstanding rising from 64% of GDP in 2012 to 71% today. Yearly productivity gains have remained stubbornly below 2% for the last six years.
President Trump has argued that his 4% growth target can be achieved by fixing the tax code, boosting infrastructure spending, lifting the regulatory wet blanket and negotiating new bilateral trade deals to narrow the imbalances. History suggests that deficit spending and debt acceleration can boost economic growth above its long-run potential in the near term. One key question facing
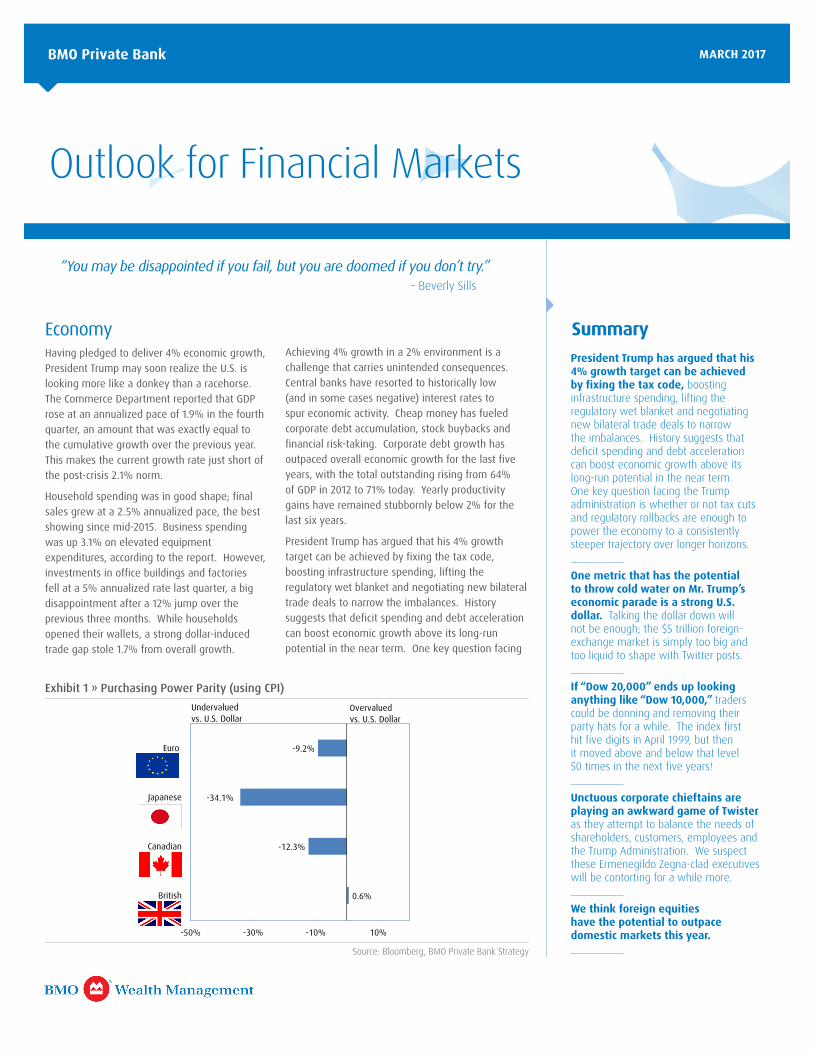
Exhibit 1 » Purchasing Power Parity (using CPI)
Source: Bloomberg, BMO Private Bank Strategy
Summary
0.6%
-12.3%
-34.1%
-9.2%
-50% -30% -10% 10%
British
Canadian
Japanese
Euro
Overvaluedvs. U.S. Dollar
Undervalued vs. U.S. Dollar
Outlook for Financial Markets • March 2017 2
MARCH 2017
the Trump administration is whether or not tax cuts and regulatory rollbacks are enough to power the economy to a consistently steeper trajectory over longer horizons.
Bond MarketOne metric that has the potential to throw cold water on Mr. Trump’s economic parade is a strong U.S. dollar. Talking the dollar down will not be enough; the $5 trillion foreign-exchange market is simply too big and too liquid to shape with Twitter posts. While most analysts agree that the U.S. economy is somewhat insulated from higher rates, thanks to the preponderance of fixed-rate borrowing, the threat of dollar strength could undermine the Administration’s goal of boosting exports. Restoring U.S. manufacturing and tilting the trade balance are central planks in Trump’s “America First” platform. It’s no secret that the White House is concerned about currency strength, especially after the U.S. dollar index surged 7.3% in the fourth quarter.
One of the key drivers of the dollar’s value is “real” rates, interest rates adjusted for inflation. Real rates are high when interest rates exceed the inflation rate, and that tends to correspond to dollar strength, as attractive U.S. bond yields attract foreign capital. Since the Federal Reserve’s Federal Open Market Committee sets the overnight benchmark rate, Fed Chair Janet Yellen can influence the direction of real rates and the dollar’s value. Given the central bank’s preference for inflation, she will likely keep real rates as low as possible.
The dollar flexed its muscles in recent years, reducing the likelihood of continued strengthening in the future. The greenback has gained 26% against a basket of trading partners’ currencies since mid-2014, thanks in part to the nation’s relative economic and interest rate advantage. Fundamentally, our purchasing power parity metrics indicate the dollar is about 9%, 12% and 30% overvalued relative to the Canadian dollar, euro and Japanese yen, respectively (Exhibit #1). However, one factor in the dollar’s favor is the nominal yield advantage U.S. Treasurys carry over their foreign counterparts. Yielding 1.2%, 2-year U.S. Treasury notes carry a 1-2 percentage point advantage over the 2-year sovereign notes of the U.K., Germany, France and Japan, with the latter three offering negative yields over that horizon. The dollar’s direction over the next several quarters will likely determine the level of success Trump’s mercantilism strategy has. It will have broad
implications for profit growth, inflation and interest rates.
Equity MarketsThe DOW hit 20,000 for the first time in January. Is it a milestone or an achievement? We don’t share CNBC’s quixotism. With all due respect to Dow Jones, the index is a somewhat arbitrary amalgam of stocks, with those having the highest share prices carrying the biggest weight. That is unlike capitalization-weighted indexes such as the S&P 500, where the largest companies are proportionally the largest components. Because of its price-weighting methodology, a quarter of the Dow is made up of just Goldman Sachs, 3M, IBM and Boeing. None of those companies is as large as firms like Apple or Microsoft.
Additionally, just five of the 30 stocks account for half of the Dow’s return since the election – and many of them are the ones that dominate the index, according to the Financial Times. The Dow’s outsized allocation to financials was part of the reason it surpassed the 20,000 level. If “Dow 20,000” ends up looking anything like “Dow 10,000,” traders could be donning and removing their party hats for a while. The index first hit five digits in April 1999, but then it moved above and below that level 50 times in the next five years!
Stock market returns are a function of three factors: dividends, earnings growth and valuation adjustments, the latter being measured by the change in calculations such as the price-earnings ratio. Projecting earnings and dividend growth is critical for forecasting market performance over long timeframes. That’s why investment firms and analysts spend so much time trying to get the numbers right. Distortions
occur when the market becomes misaligned with fundamentals and P-E ratios expand or collapse to unsustainable levels, with the late 1990s tech bubble and the post-Lehman collapse being the two most notable extreme examples.
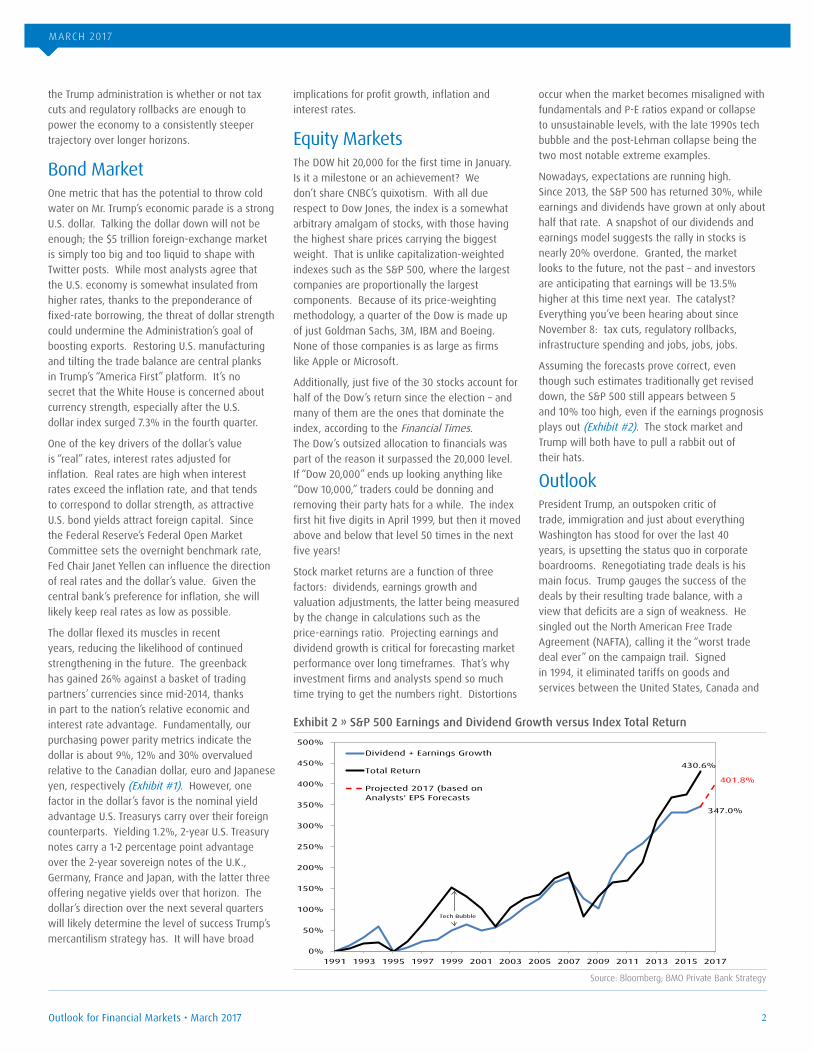
Nowadays, expectations are running high. Since 2013, the S&P 500 has returned 30%, while earnings and dividends have grown at only about half that rate. A snapshot of our dividends and earnings model suggests the rally in stocks is nearly 20% overdone. Granted, the market looks to the future, not the past – and investors are anticipating that earnings will be 13.5% higher at this time next year. The catalyst? Everything you’ve been hearing about since November 8: tax cuts, regulatory rollbacks, infrastructure spending and jobs, jobs, jobs.
Assuming the forecasts prove correct, even though such estimates traditionally get revised down, the S&P 500 still appears between 5 and 10% too high, even if the earnings prognosis plays out (Exhibit #2). The stock market and Trump will both have to pull a rabbit out of their hats.
OutlookPresident Trump, an outspoken critic of trade, immigration and just about everything Washington has stood for over the last 40 years, is upsetting the status quo in corporate boardrooms. Renegotiating trade deals is his main focus. Trump gauges the success of the deals by their resulting trade balance, with a view that deficits are a sign of weakness. He singled out the North American Free Trade Agreement (NAFTA), calling it the “worst trade deal ever” on the campaign trail. Signed in 1994, it eliminated tariffs on goods and services between the United States, Canada and
Exhibit 2 » S&P 500 Earnings and Dividend Growth versus Index Total Return
Source: Bloomberg; BMO Private Bank Strategy
0%
50%
100%
150%
200%
250%
300%
350%
400%
450%
500%
1991 1993 1995 1997 1999 2001 2003 2005 2007 2009 2011 2013 2015 2017
Dividend + Earnings Growth
Total Return
Projected 2017 (based onAnalysts' EPS Forecasts
430.6%
347.0%
Tech Bubble
401.8%
MARCH 2017
Outlook for Financial Markets • March 20173
Mexico and set a process in place to remove additional regulatory barriers. Many have argued that NAFTA was responsible for the loss of U.S. manufacturing jobs, particularly in the communities that supported the new president.
U.S. trade with Canada and Mexico amounts to more than $1 trillion annually. That’s more than twice the annual trading volume with China and 10 times that of the U.K. U.S. exports to Mexico have multiplied 3.5-fold since 1993, adjusted for inflation. While trade between the U.S. and Canada has been balanced over time, the U.S. runs a $60 billion trade deficit with Mexico. NAFTA may have expanded economic growth and bolstered average incomes in the United States, but it came at a cost of manufacturing jobs held by high school educated, blue collar wage earners. As economist and Trump trade advisor Peter Navarro put it, “this is another case in which corporate America wins but Mr. and Mrs. America lose.”
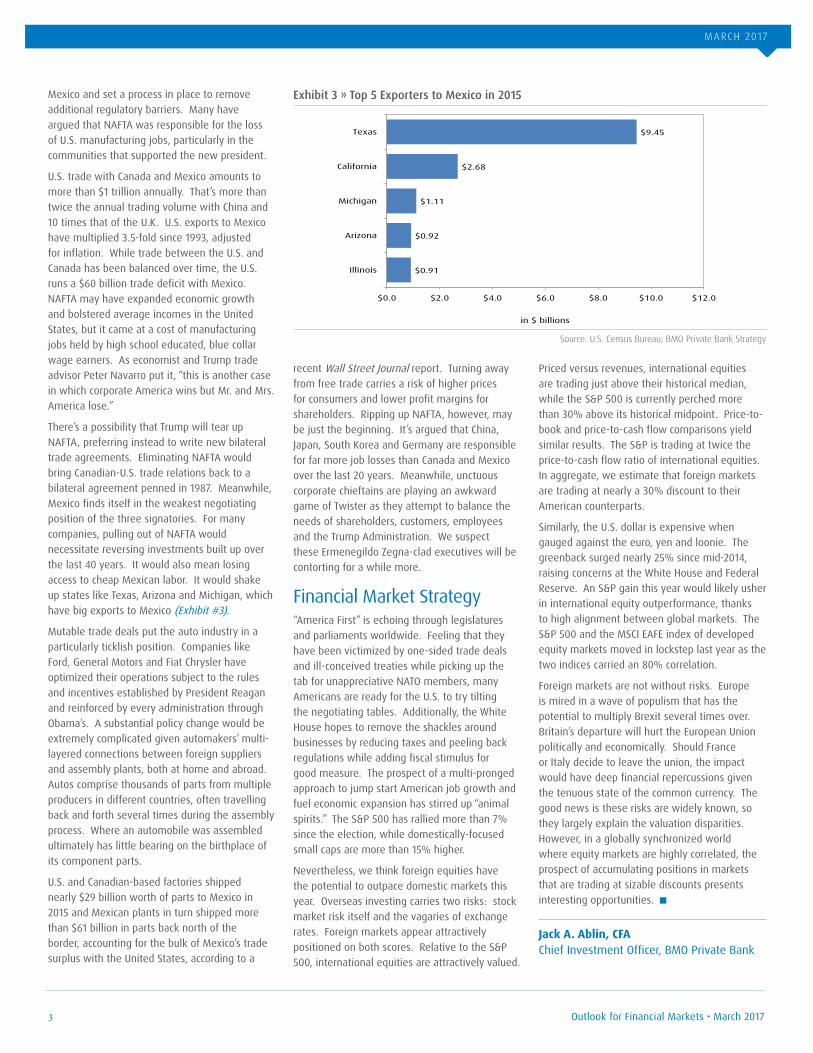
There’s a possibility that Trump will tear up NAFTA, preferring instead to write new bilateral trade agreements. Eliminating NAFTA would bring Canadian-U.S. trade relations back to a bilateral agreement penned in 1987. Meanwhile, Mexico finds itself in the weakest negotiating position of the three signatories. For many companies, pulling out of NAFTA would necessitate reversing investments built up over the last 40 years. It would also mean losing access to cheap Mexican labor. It would shake up states like Texas, Arizona and Michigan, which have big exports to Mexico (Exhibit #3).
Mutable trade deals put the auto industry in a particularly ticklish position. Companies like Ford, General Motors and Fiat Chrysler have optimized their operations subject to the rules and incentives established by President Reagan and reinforced by every administration through Obama’s. A substantial policy change would be extremely complicated given automakers’ multi-layered connections between foreign suppliers and assembly plants, both at home and abroad. Autos comprise thousands of parts from multiple producers in different countries, often travelling back and forth several times during the assembly process. Where an automobile was assembled ultimately has little bearing on the birthplace of its component parts.
U.S. and Canadian-based factories shipped nearly $29 billion worth of parts to Mexico in 2015 and Mexican plants in turn shipped more than $61 billion in parts back north of the border, accounting for the bulk of Mexico’s trade surplus with the United States, according to a
recent Wall Street Journal report. Turning away from free trade carries a risk of higher prices for consumers and lower profit margins for shareholders. Ripping up NAFTA, however, may be just the beginning. It’s argued that China, Japan, South Korea and Germany are responsible for far more job losses than Canada and Mexico over the last 20 years. Meanwhile, unctuous corporate chieftains are playing an awkward game of Twister as they attempt to balance the needs of shareholders, customers, employees and the Trump Administration. We suspect these Ermenegildo Zegna-clad executives will be contorting for a while more.
Financial Market Strategy“America First” is echoing through legislatures and parliaments worldwide. Feeling that they have been victimized by one-sided trade deals and ill-conceived treaties while picking up the tab for unappreciative NATO members, many Americans are ready for the U.S. to try tilting the negotiating tables. Additionally, the White House hopes to remove the shackles around businesses by reducing taxes and peeling back regulations while adding fiscal stimulus for good measure. The prospect of a multi-pronged approach to jump start American job growth and fuel economic expansion has stirred up “animal spirits.” The S&P 500 has rallied more than 7% since the election, while domestically-focused small caps are more than 15% higher.
Nevertheless, we think foreign equities have the potential to outpace domestic markets this year. Overseas investing carries two risks: stock market risk itself and the vagaries of exchange rates. Foreign markets appear attractively positioned on both scores. Relative to the S&P 500, international equities are attractively valued.
Priced versus revenues, international equities are trading just above their historical median, while the S&P 500 is currently perched more than 30% above its historical midpoint. Price-to-book and price-to-cash flow comparisons yield similar results. The S&P is trading at twice the price-to-cash flow ratio of international equities. In aggregate, we estimate that foreign markets are trading at nearly a 30% discount to their American counterparts.
Similarly, the U.S. dollar is expensive when gauged against the euro, yen and loonie. The greenback surged nearly 25% since mid-2014, raising concerns at the White House and Federal Reserve. An S&P gain this year would likely usher in international equity outperformance, thanks to high alignment between global markets. The S&P 500 and the MSCI EAFE index of developed equity markets moved in lockstep last year as the two indices carried an 80% correlation.
Foreign markets are not without risks. Europe is mired in a wave of populism that has the potential to multiply Brexit several times over. Britain’s departure will hurt the European Union politically and economically. Should France or Italy decide to leave the union, the impact would have deep financial repercussions given the tenuous state of the common currency. The good news is these risks are widely known, so they largely explain the valuation disparities. However, in a globally synchronized world where equity markets are highly correlated, the prospect of accumulating positions in markets that are trading at sizable discounts presents interesting opportunities.
Exhibit 3 » Top 5 Exporters to Mexico in 2015
Source: U.S. Census Bureau; BMO Private Bank Strategy
Jack A. Ablin, CFAChief Investment Officer, BMO Private Bank
$0.91
$0.92
$1.11
$2.68
$9.45
$0.0 $2.0 $4.0 $6.0 $8.0 $10.0 $12.0
Illinois
Arizona
Michigan
California
Texas
in $ billions
BMO Wealth Management is a brand name that refers to BMO Harris Bank N.A. and certain of its affiliates that provide certain investment, investment advisory, trust, banking, securities, insurance and brokerage products and services. BMO Private Bank is a brand name used in the United States by BMO Harris Bank N.A. Member FDIC. Not all products and services are available in every state and/or location.Investment products offered are: NOT A DEPOSIT – NOT INSURED BY THE FDIC OR ANY FEDERAL GOVERNMENT AGENCY – NOT GUARANTEED BY ANY BANK – MAY LOSE VALUE.Securities, investment advisory services and insurance products a re offered through BMO Harris Financial Advisors, Inc. Member FINRA/SIPC. SEC-registered investment adviser. BMO Harris Financial Advisors, Inc. and BMO Harris Bank N.A. are affiliated companies. Securities and insurance products offered are: NOT A DEPOSIT – NOT INSURED BY THE FDIC OR ANY FEDERAL GOVERNMENT AGENCY – NOT GUARANTEED BY ANY BANK – MAY LOSE VALUE.CFA® and Chartered Financial Analyst® are registered trademarks owned by CFA Institute. BMO Private Bank may have a material fiduciary, lending, or other banking relationship with any Company mentioned above or any of their affiliates, however, applicable laws, regulations and policies prohibit the disclosure of such relationship to employees who are not directly involved, as well as external disclosure without client consent.The research analysts who contributed to this report do not know if BMO Harris Bank N.A. or its affiliates have any significant relationship with any Company mentioned above. BMO Capital Markets, an affiliate of BMO Harris N.A., may from time-to-time engage in underwriting, making a market, distributing or dealing in securities mentioned herein.Please consult with your advisor for your own personal situation. The research analysts contributing to the report have certified that:•All the views expressed in the research report accurately reflect his/her personal views about any and all of the subject securities or issues; and•No part of his/her compensation was, is, or will be, directly or indirectly, related to the specific recommendation or views expressed by him/her in this research report.The information and opinions expressed herein are obtained from sources believed to be reliable and up-to-date; however, their accuracy and completeness cannot be guaranteed. Opinions expressed reflect judgment current as of publication and are subject to change.Past performance is not indicative of future results. International investing, especially in emerging markets, involves special risks, such as currency exchange and price fluctuations, as well as political and economic risks. There are risks involved with investing in small cap companies, including price fluctuations and lower liquidity. Commodities may be subject to greater volatility than investments in traditional securities and pose special risks. Investments in commodities may be affected by overall market movements, changes in interest rates, and other factors such as weather, disease, embargoes, and international economic and political developments.BMO and BMO Financial Group are trade names used by Bank of Montreal. © 2017 BMO Financial Group. All rights reserved Financial Group. All rights reserved
Jack A. Ablin, CFA Executive Vice President and Chief Investment Officer, BMO Private BankAs Head of Macro Strategy, Jack chairs the Asset Allocation, Mutual Fund Re-Optimization and Harriscreen Stock Selection Committees and is responsible for establishing investment policy and strategy within BMO Private Bank throughout the U.S. He joined the organization in 2001 and has three decades of experience in money management.
Jack earned a bachelor’s degree from Vassar College in New York, where he graduated with honors with an A.B. in Mathematics and Computer Science. A member of the Beta Gamma Sigma International Honor Society, Jack received an M.B.A. with honors and graduated cum laude from Boston University in Massachusetts. He holds the Chartered Financial Analyst designation and is a member of the CFA Society of Chicago.
• Author of Reading Minds and Markets: Minimizing Risk and Maximizing Returns in a Volatile Global Marketplace, published in July 2009 by F.T. Press; Wall Street Journal’s best-seller list, 2009
• Frequent contributor to CNBC, Bloomberg, The Wall Street Journal and Barron’s
• Served as a Professor of Finance at Boston University, Graduate School of Management
• Spent five years as a Money and Markets correspondent for WTLV, the NBC affiliate in Jacksonville, Florida
• Named one of the Top 100 Wealth Advisors in North America by Citywealth magazine, in 2006, 2010 — 2016
You can subscribe to receive Outlook for Financial Markets in the Insights section of www.bmoprivatebank.com
Written: February 9, 2017