Embed Size (px)
Citation preview
YOU ARE WHAT YOU EAT (AND DRINK):
IDENTIFYING CULTURAL BOUNDARIES BY ANALYZING FOOD AND DRINK HABITS IN
FOURSQUARE
Presenter: LEUNG Pak Him
METHODS USED TO ANALYZE CROSS-CULTURAL DIFFERENCES
Traditional method
• Surveys
New method in this paper
• Foursquare check-ins
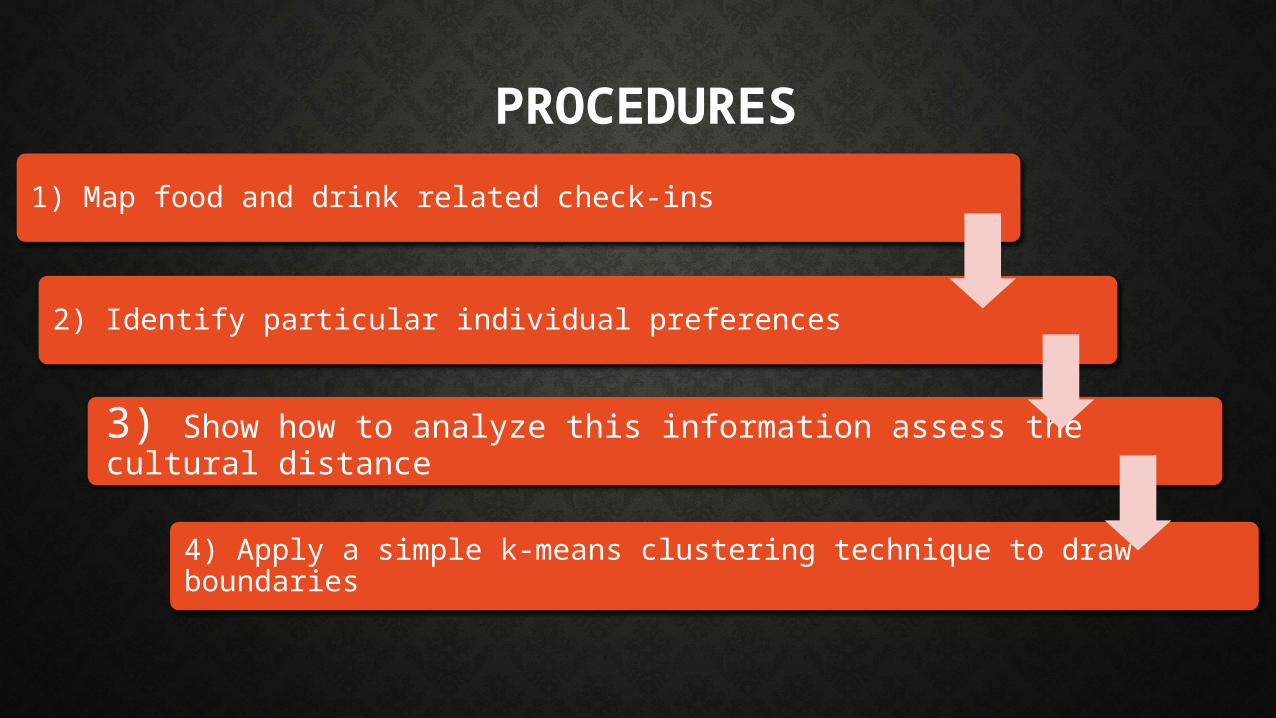
PROCEDURES
1) Map food and drink related check-ins
2) Identify particular individual preferences
3) Show how to analyze this information assess the cultural distance
4) Apply a simple k-means clustering technique to draw boundaries
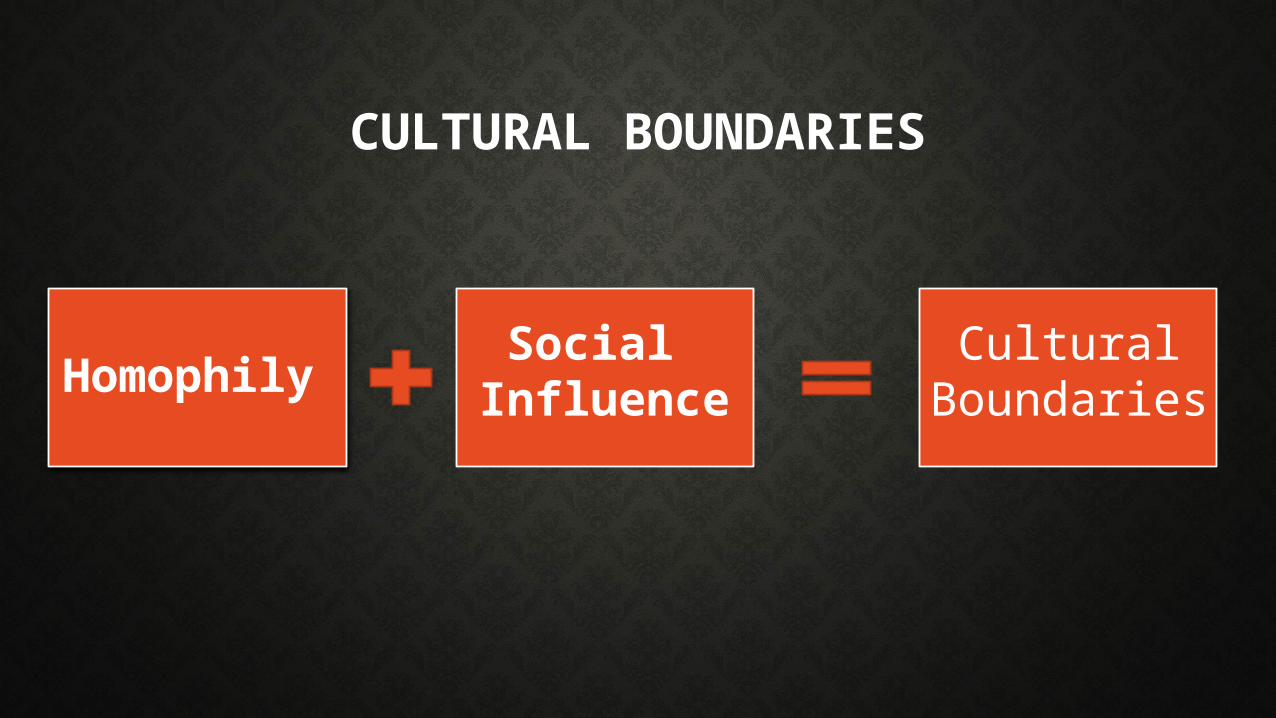
CULTURAL BOUNDARIES
HomophilySocial
InfluenceCultural
Boundaries

TRADICTIONAL METHOD CONSTRAINTS
BIGGEST CHALLENGE IN THE ANALYSIS
•Problem: No appropriate empirical data to use
•Solution: data collected from questionnaires filled during face-to-face interviews
CONSTRAINTS IN USING SURVEY DATA
1) costly and do not scale up
2) provide only static information

NEW METHOD
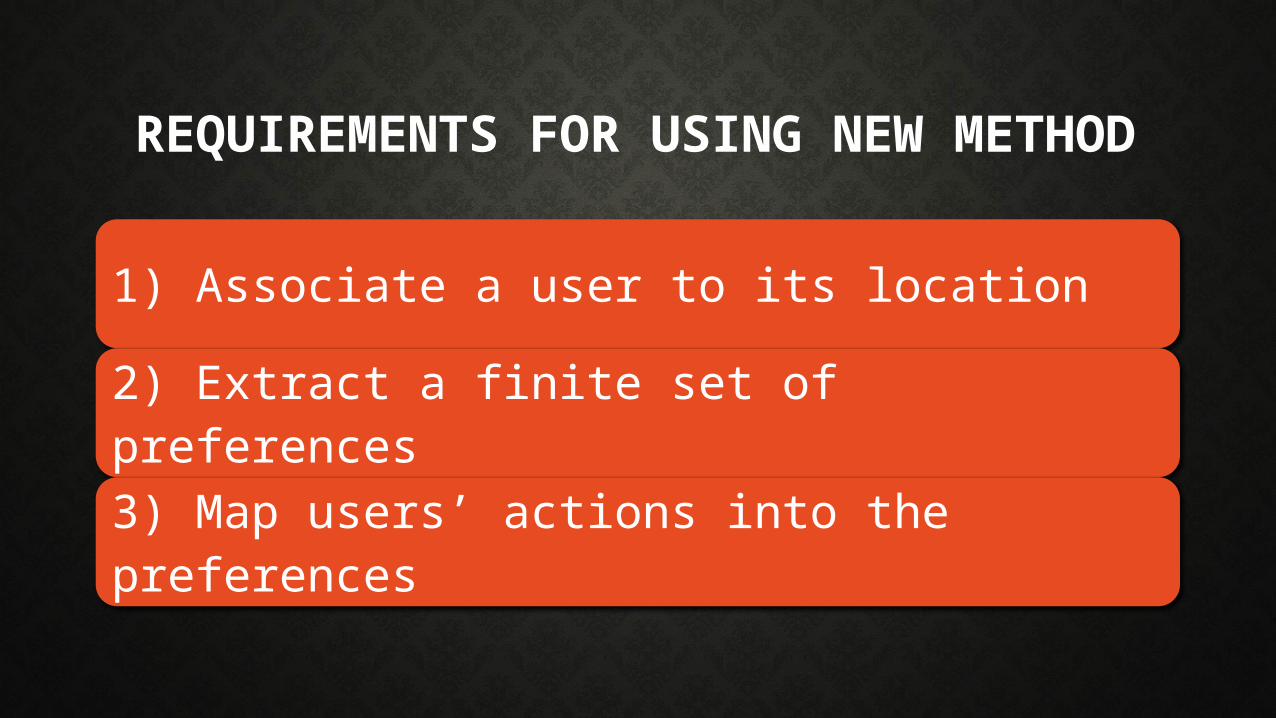
REQUIREMENTS FOR USING NEW METHOD
1) Associate a user to its location
2) Extract a finite set of preferences
3) Map users’ actions into the preferences

MAPPING PREFERENCES
1) Associate each user into a location
2) Define a set of m individual preferences
3) Map the activities of each individual into an m-dimensional vector of preferences
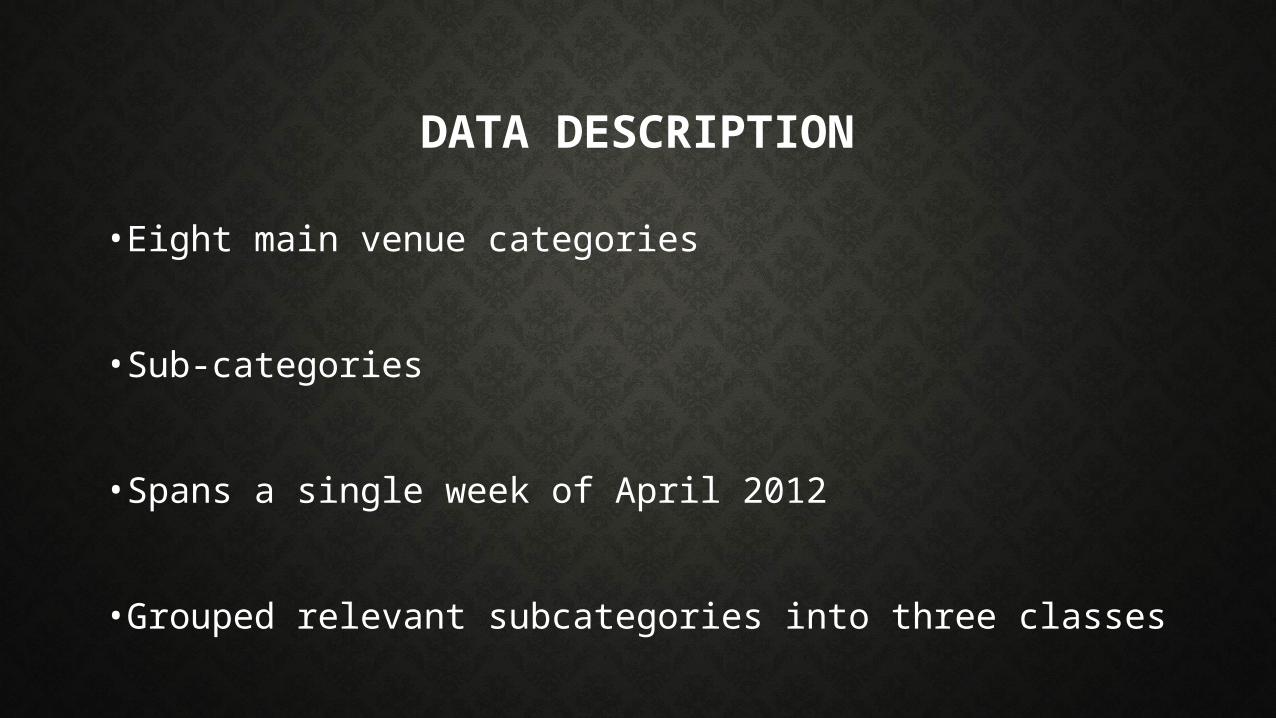
DATA DESCRIPTION
• Eight main venue categories
• Sub-categories
• Spans a single week of April 2012
• Grouped relevant subcategories into three classes
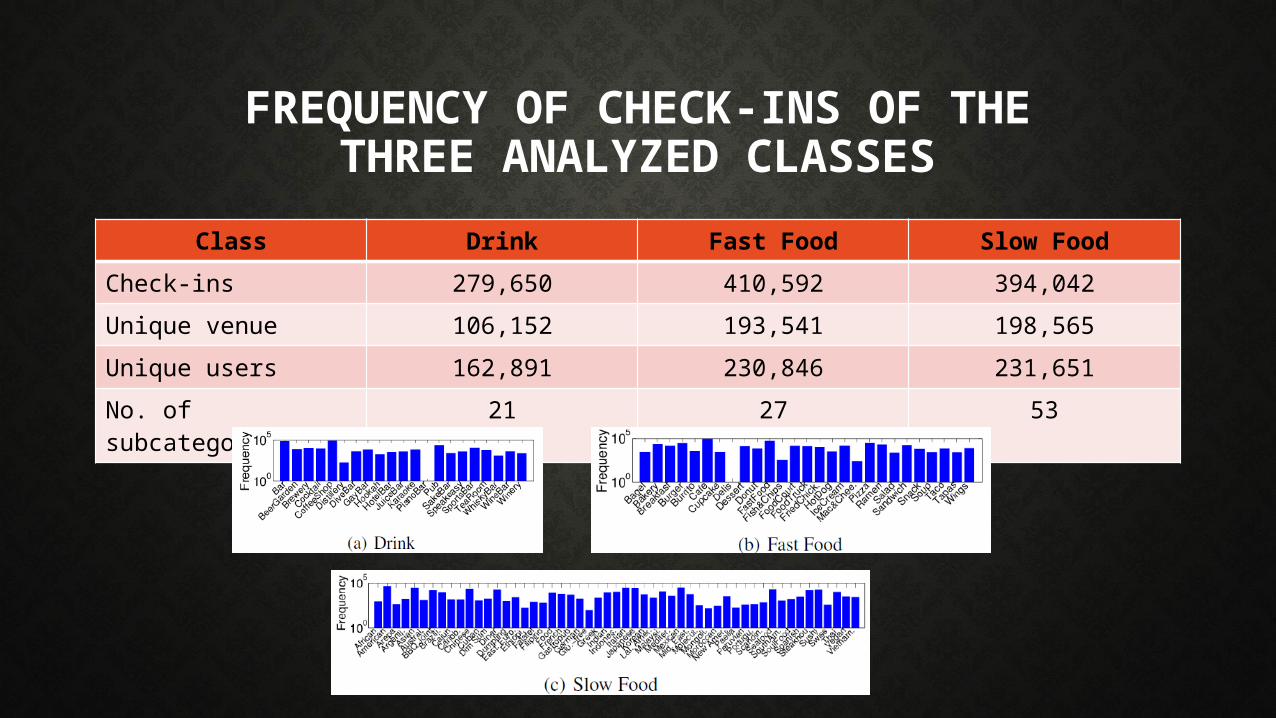
FREQUENCY OF CHECK-INS OF THETHREE ANALYZED CLASSES
Class Drink Fast Food Slow Food
Check-ins 279,650 410,592 394,042
Unique venue 106,152 193,541 198,565
Unique users 162,891 230,846 231,651
No. of subcategories 21 27 53
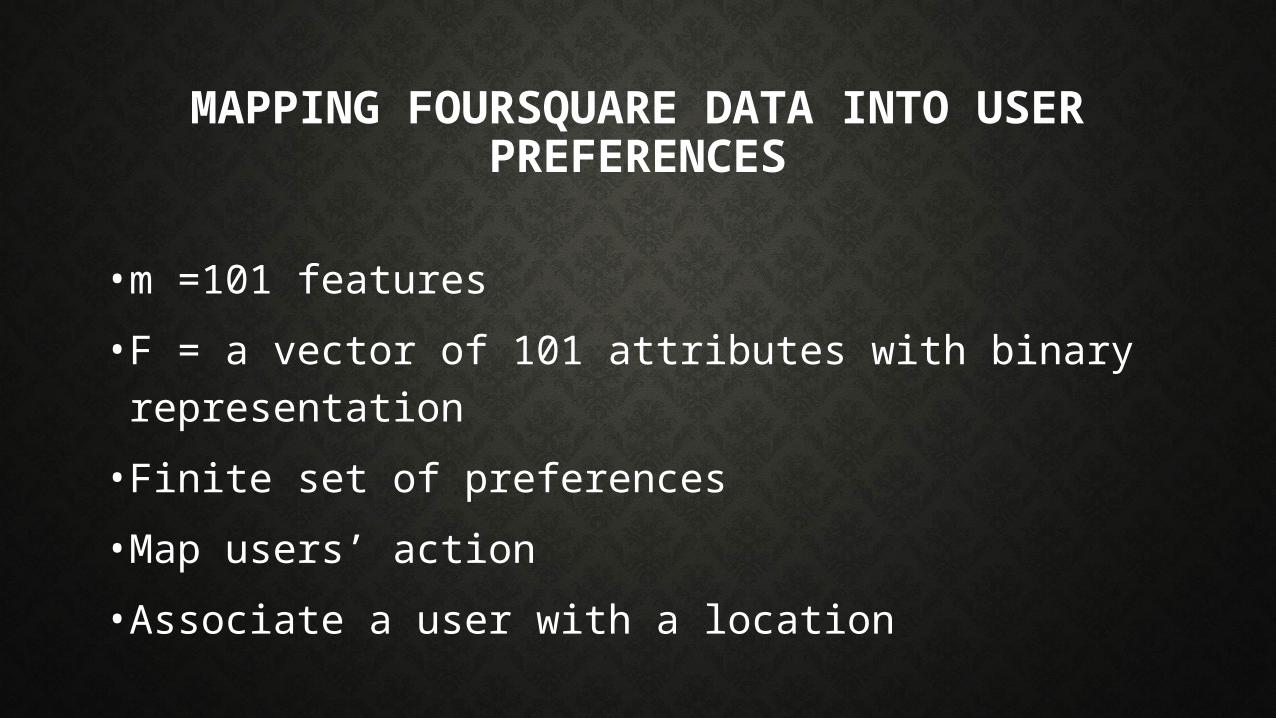
MAPPING FOURSQUARE DATA INTO USERPREFERENCES
•m =101 features
• F = a vector of 101 attributes with binary representation
• Finite set of preferences
•Map users’ action
• Associate a user with a location
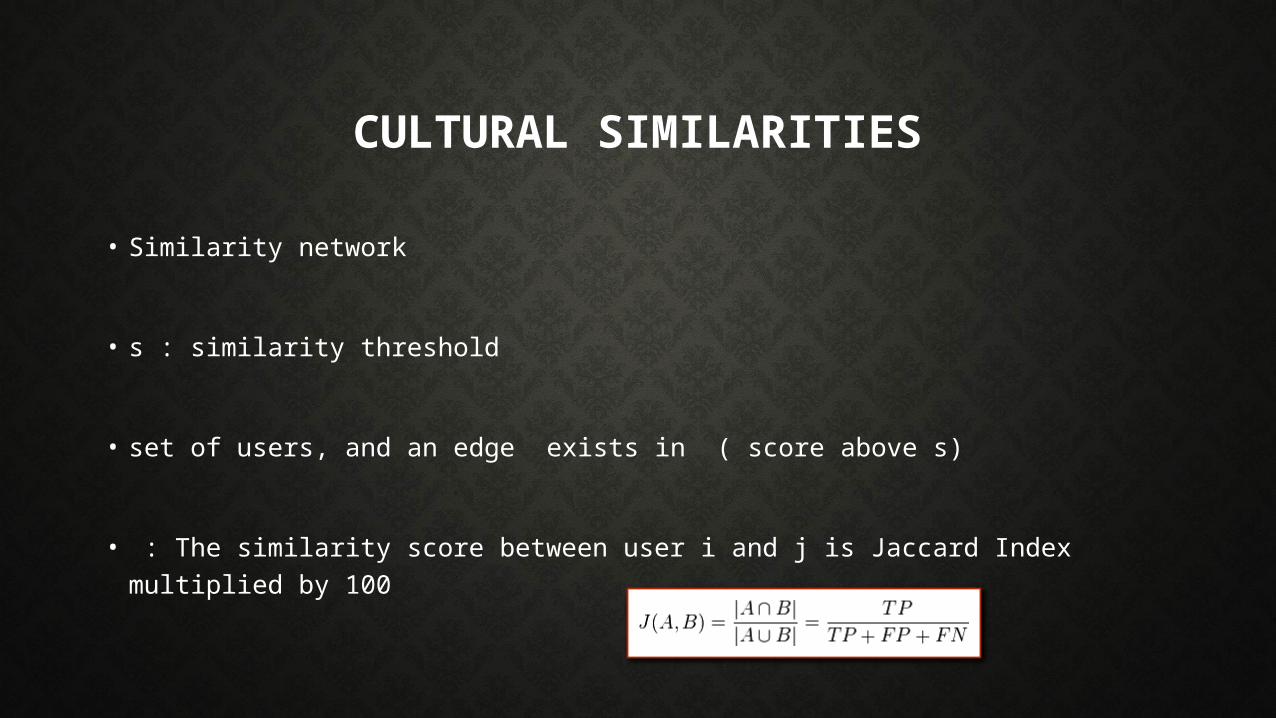
CULTURAL SIMILARITIES
• Similarity network
• s : similarity threshold
• set of users, and an edge exists in ( score above s)
• : The similarity score between user i and j is Jaccard Index multiplied by 100
EXAMPLE NETWORKS IN THE PAPER
• Two similarities networks
• : only food and drink preferences
• : all preferences
• Users with at least 7 check-ins
• Different threshold,
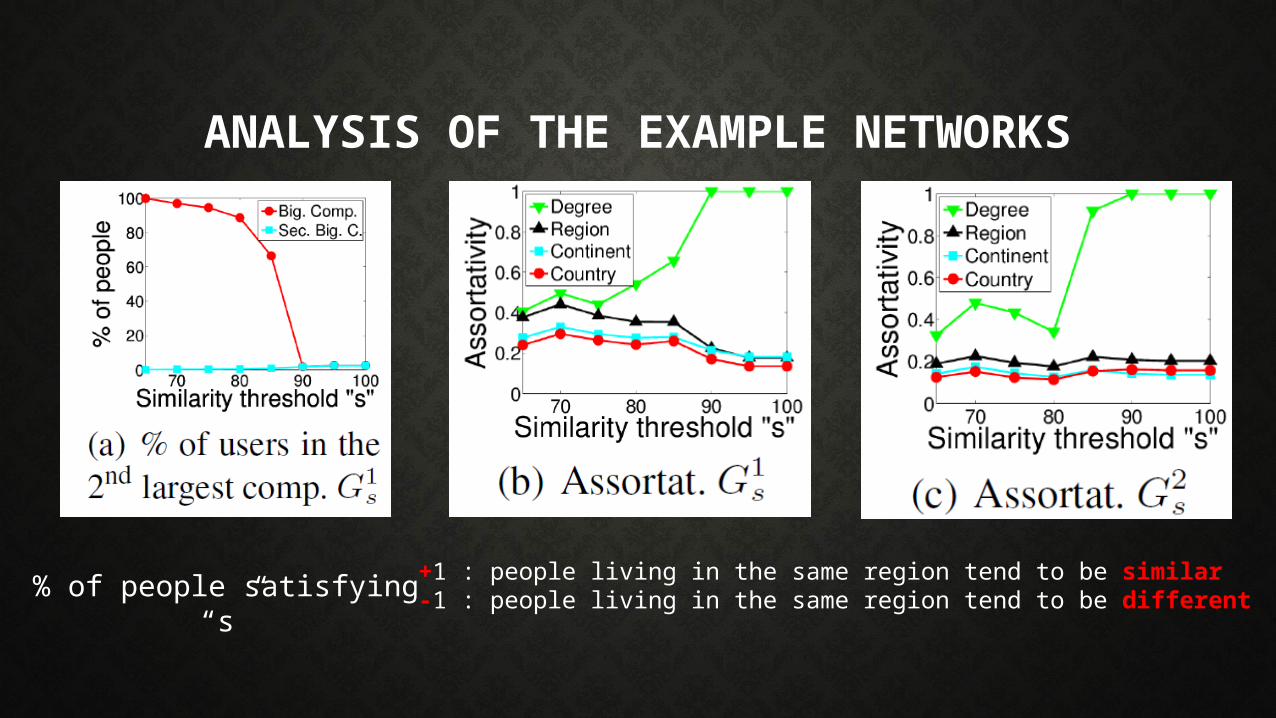
ANALYSIS OF THE EXAMPLE NETWORKS
% of people satisfying “s” +1 : people living in the same region tend to be similar-1 : people living in the same region tend to be different
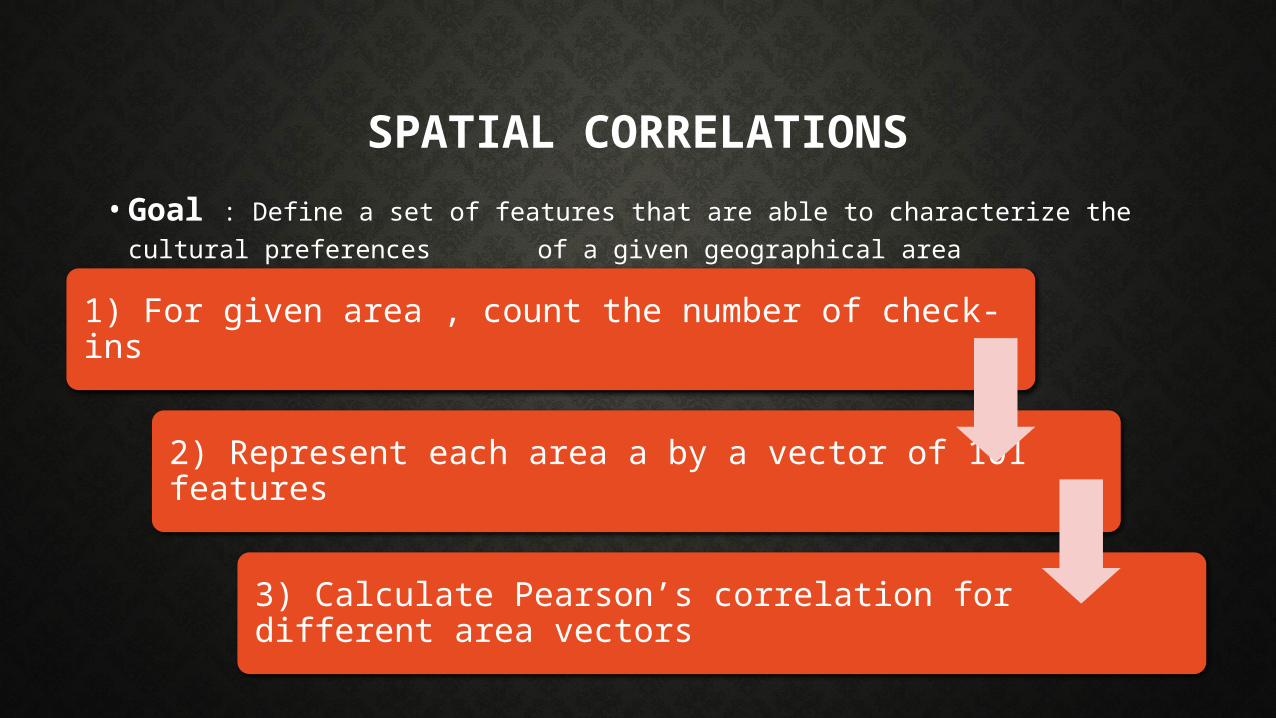
SPATIAL CORRELATIONS
• Goal : Define a set of features that are able to characterize the cultural
preferences of a given geographical area
1) For given area , count the number of check-ins
2) Represent each area a by a vector of 101 features
3) Calculate Pearson’s correlation for different area vectors
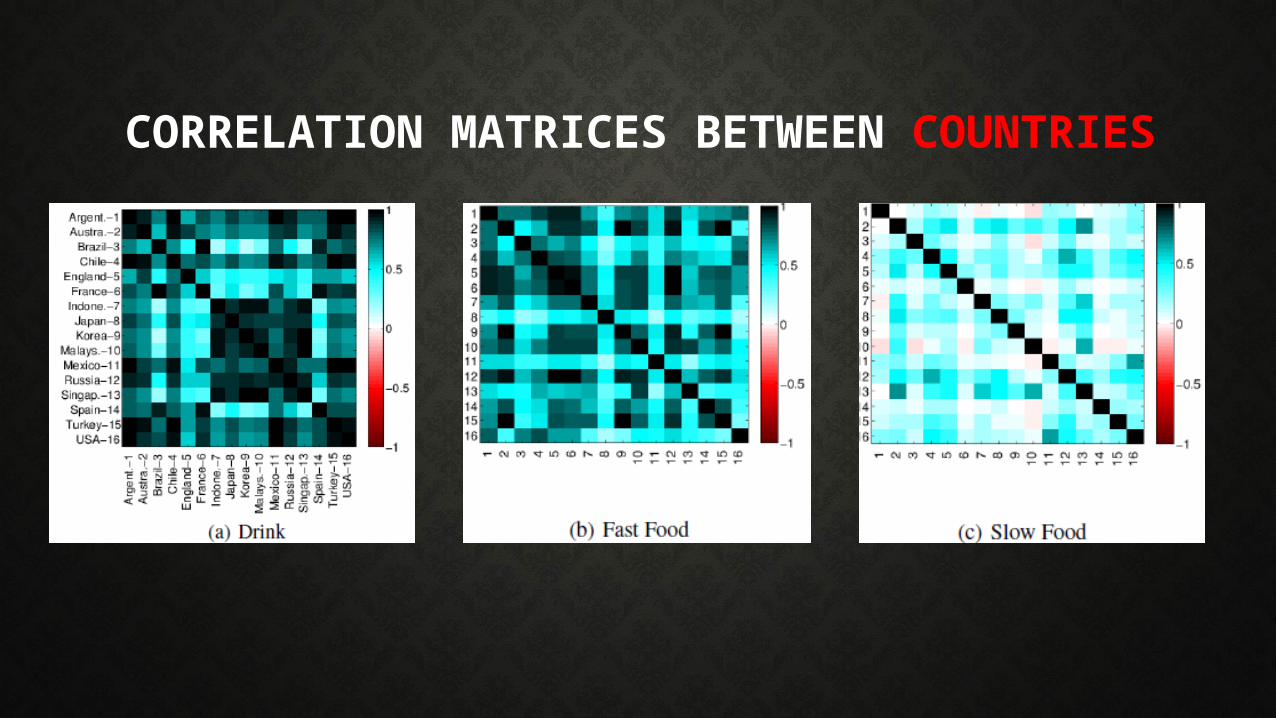
CORRELATION MATRICES BETWEEN COUNTRIES
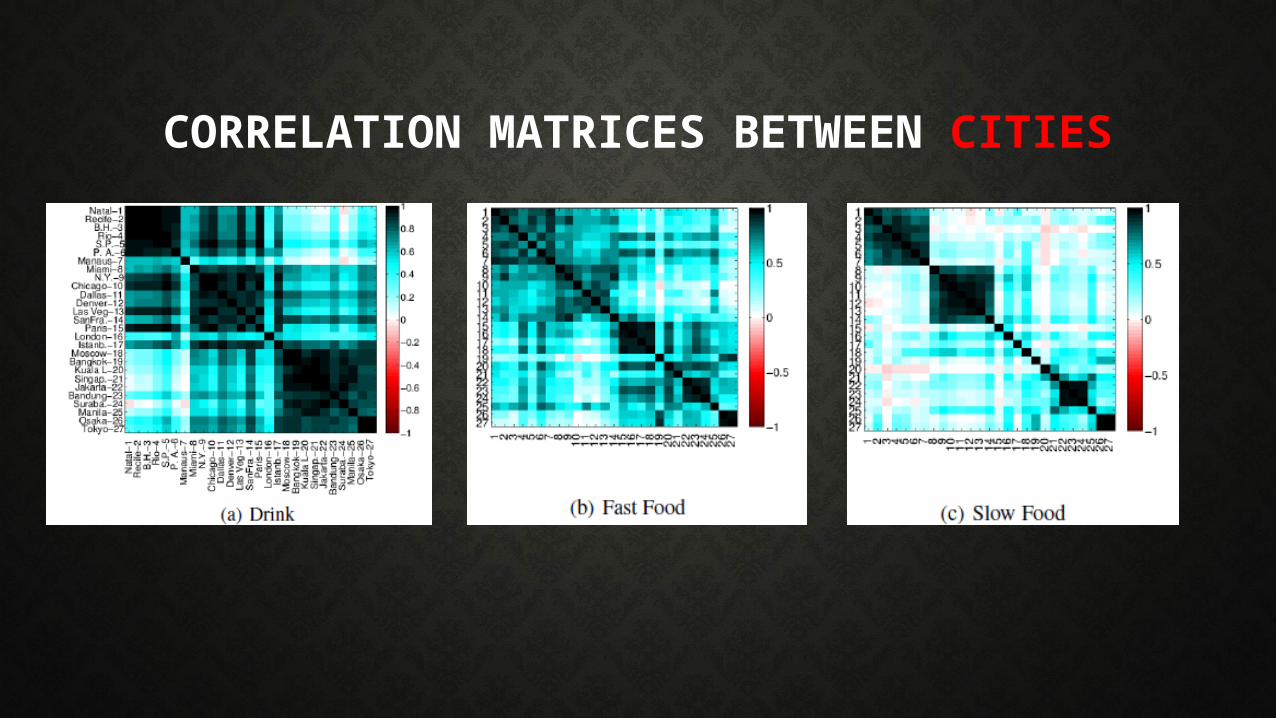
CORRELATION MATRICES BETWEEN CITIES
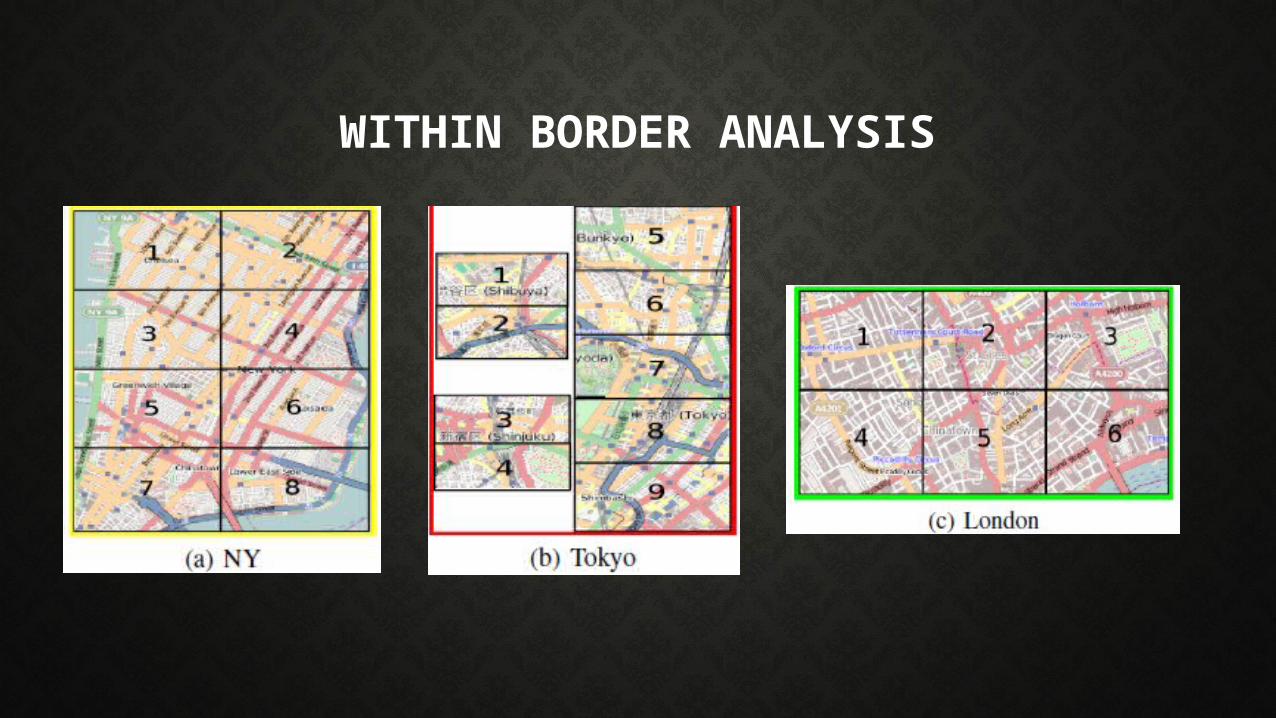
WITHIN BORDER ANALYSIS
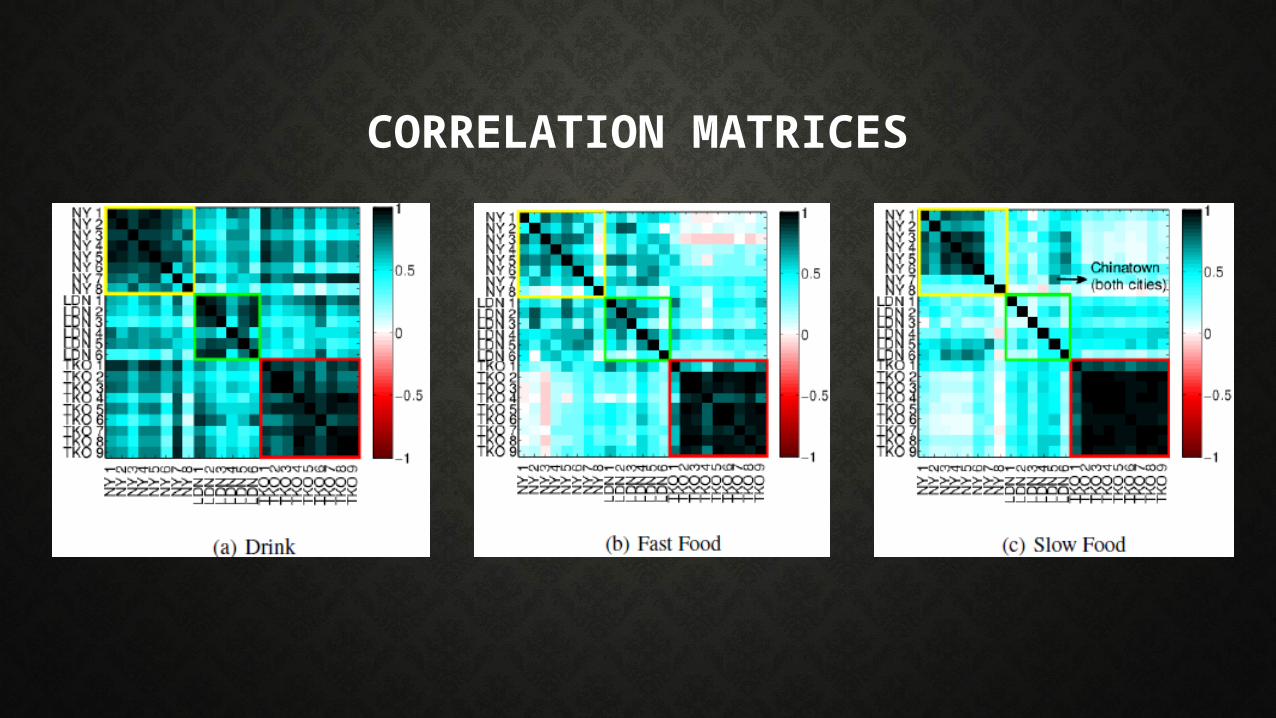
CORRELATION MATRICES
TEMPORAL ANALYSIS
1) Count the number of check-ins per hour
3) Normalize the combined number
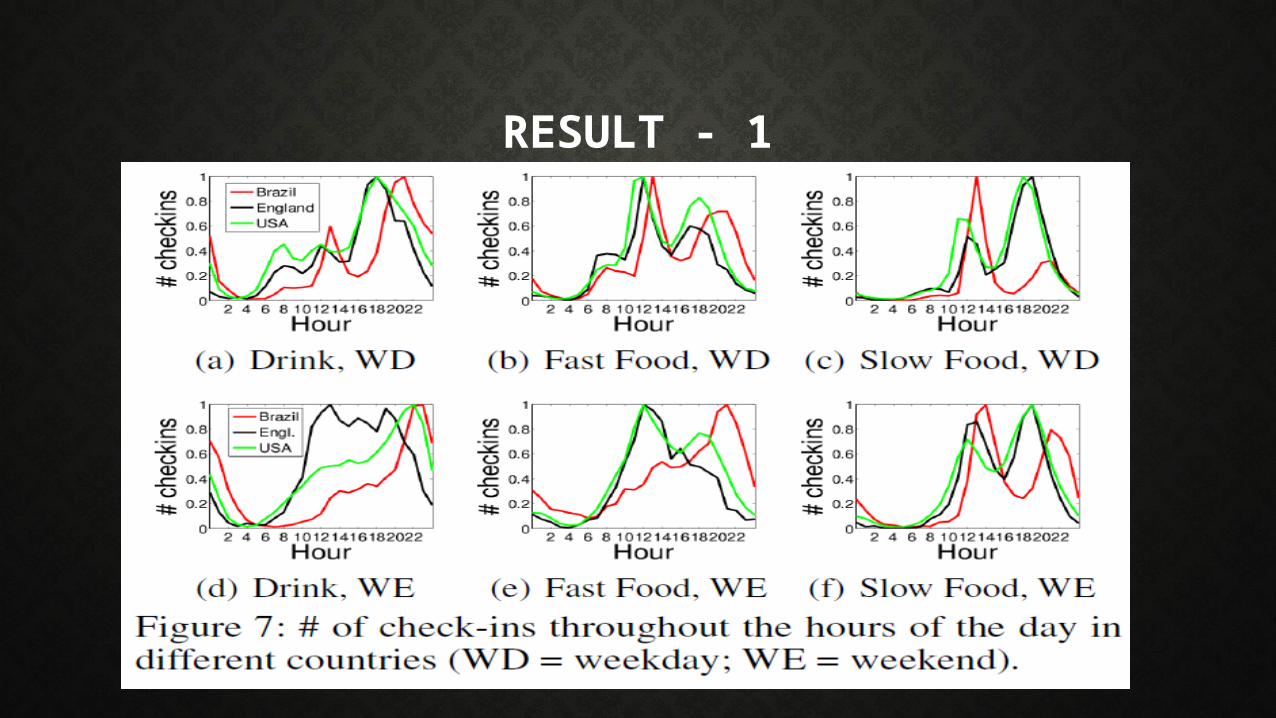
RESULT - 1

IDENTIFYING CULTURAL BOUNDARIES
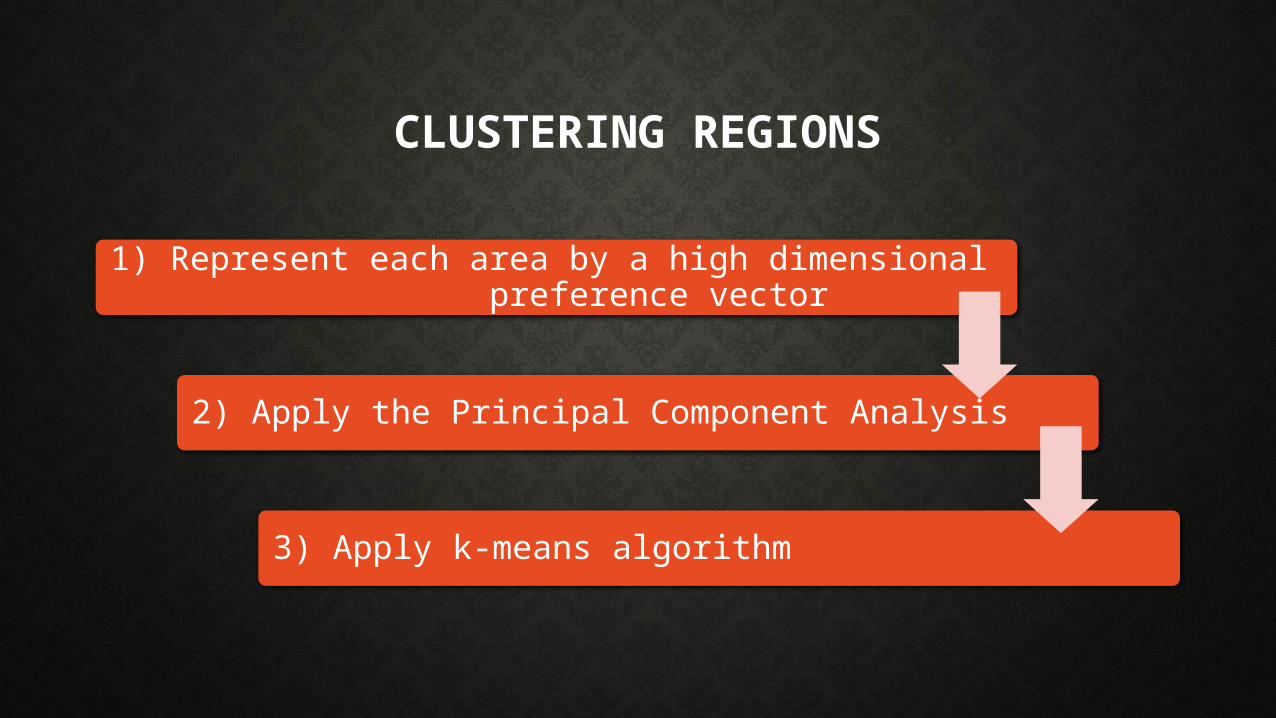
CLUSTERING REGIONS
1) Represent each area by a high dimensional preference vector
2) Apply the Principal Component Analysis
3) Apply k-means algorithm
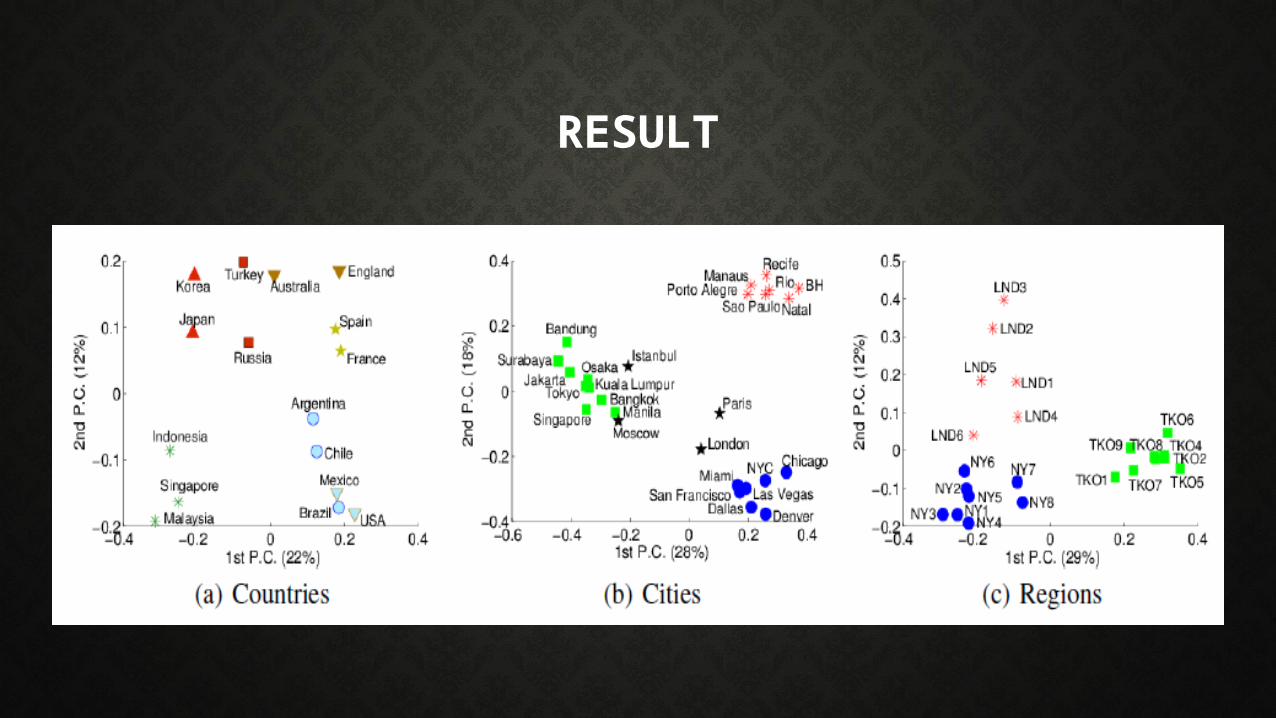
RESULT

Q & A