Embed Size (px)
Citation preview
1
Applying Multidimensional Item Response Theory Models
in Validating Test Dimensionality:
An Example of K–12 Large-scale Science Assessment
Ying Li
American Institutes for Research
Washington, D.C.
Hong Jiao & Robert W. Lissitz
University of Maryland
College Park, MD
© Journal of Applied Testing Technology, 2012, Volume 13, Issue #2
2
Abstract
This study investigated the application of multidimensional item response theory (IRT)
models to validate test structure and dimensionality. Multiple content areas or domains within a
single subject often exist in large-scale achievement tests. Such areas or domains may cause
multidimensionality or local item dependence, which both violate the assumptions of the
unidimensional IRT models currently used in many statewide large-scale assessments. An
empirical K–12 science assessment was used as an example of dimensionality validation using
multidimensional IRT models. The unidimensional IRT model was also included as the most
commonly used model in current practice. The procedures illustrated in this real example can be
utilized to validate the test dimensionality for any testing program once item response data are
collected.
Keywords: Test validity, test dimensionality, item response theory (IRT), multidimensional IRT
models, large-scale assessments.
3
Applying Multidimensional Item Response Theory Models
in Validating Test Dimensionality:
An Example of K–12 Large-scale Science Assessment
Under the item response theory (IRT) framework, test dimensionality is one of the major
issues explored at the beginning of test development, along with a validity foundation that
identifies the test purposes, uses, and the inferences to be made about examinees (Schmeiser &
Welch, 2006). Generally, test dimensionality reflects the number of latent traits test developers
would like to extract from the test; items are therefore constructed and assembled into test forms
to align with the intended trait(s) or dimension(s). More technically, McDonald (1981, 1982)
defined the dimensionality of a test as the number of traits that must be considered to achieve
weak local independence between the items in the test, where weak local independence requires
the conditional pair-wise covariance among items in a test to be equal to zero for all values of
latent trait θ as shown in the equation below.
)|()|,()|,( θθθ jjiijjii xXPxXPxXxXP =====
where iX is the score on item i, and jX is the score on item j.
Stout (1987, 1990) further relaxed the requirement of weak local independence by
defining essential independence to require the average value of these covariances to approach
zero as test length increases.
Several researchers have addressed the process for validating the intended test
dimensionality. Kane (2006) pointed out that the validation of proposed test purposes, uses, and
interpretations should be separated into two stages: development and appraisal. Similarly,
Schmeiser and Welch (2006) stated that the inextricable link between the test development
4
process and validation serves two functions: (a) to provide support that the test is serving the
intended test purposes and dimensionality or (b) to suggest that the test design must be refined
and improved through further empirical analysis.
In practice, as a part of test development, field test items are administered before the
operational items or embedded within the operational tests; one of the functions of such piloting
is to obtain quantitative evidence to ensure the intended test dimensionality. At the appraisal
stage, when tests are finalized and operationally administered and scored, evidence of test
dimensionality must be collected and documented. This study addresses the process for
developing evidence regarding test dimensionality after tests have been administered and
examinee item response data have been collected.
Various methods are used to assess test dimensionality; such methods include linear
factor analysis, nonparametric tests for essential unidimensionality, and the use of
multidimensional IRT models. Multidimensional IRT models were selected in this study as the
main method for several reasons. First, as Lane and Stone (2006) stated, one advantage of IRT
models over linear factor analytic methods is that information from examinee response patterns
is analyzed as opposed to the more limited information from correlation matrices. Second,
nonlinear models such as IRT models may better reflect the relationship between item
performance and the latent ability (Hattie, 1985). Third, the nonparametric test proposed by Stout
(1987, 1990) has limited power to detect divergence from unidimensionality for short test lengths
and for small latent trait inter-correlations (Nandakumar, Yu, Li, & Stout, 1998; Stout, Douglas,
Kim, Roussos, & Zhang, 1996). This may not be a critical issue because longer tests and
moderate to high latent ability correlations are common in operational settings. Fourth,
Embretson and Reise (2000) pointed out that multidimensional IRT models have been used to
5
assess dimensionality of tests in which items reflect different skills, knowledge, or cognitive
processes. Multiple content areas are commonly used for required assessment subjects by the No
Child Left Behind Act of 2001 (NCLB, 2002) (e.g., reading, math, science).
Depending on the subject matter, certain tests tend to measure the same construct within
and across some grades better than others. For example, Skaggs and Lissitz (1988) suggested that
reading and vocabulary tests might be more unidimensional or may provide more invariant
scaling results. Wang and Jiao (2009) found evidence for unidimensionality within and across
grades for a K–12 large-scale reading test using empirical datasets. In contrast to the results for
reading tests, Wang and Jiao found that two adjacent grade math tests are expected to measure
some common constructs and have some unique content emphases (e.g., algebra, geometry),
according to national and state math content standards. The content of science tests is likely to
shift in many different ways (Reckase & Martineau, 2004), which may be due to the diverse
content domains defined by the National Science Education Standards (e.g., physical science, life
science, earth and space science, science and technology, science in personal and social
perspectives, history and nature of science).
Although science tests have been constructed and field tested to ensure the
unidimensionality in many K–12 large-scale assessments, science assessment with multiple
content areas may be more prone to multidimensionality when compared to reading and math.
For this reason, science assessment was selected in our study to explore validating test
dimensionality and documenting the quantitative evidence using IRT models at the appraisal
stage when tests have been administered and item response data are available. However, our
approach can be equally well applied to reading and math testing.
6
Objective
The objective of our study is to apply IRT models to collect validity evidence for test
dimensionality once a test has been administered. The IRT models used as quantitative
approaches to validating and documenting the test dimensionality are the simple-structure
multidimensional item response theory (MIRT) model and the testlet model (a complex-structure
MIRT model) as well as the unidimensional item response theory (UIRT) model. An empirical
K–12 large-scale science assessment is used in this study to illustrate how these models can be
applied.
Applying different IRT models to test data reflects different assumptions or beliefs about
test structure and dimensionality. In the case of the K–12 science assessment, when the simple-
structure MIRT model is applied, abilities in different content areas are treated as different latent
dimensions (e.g., earth science, life science, physical science); when the testlet model is applied,
different content areas are modeled as different testlet residual dimensions in addition to a
dominant dimension that measures students’ general science ability. These two competing
models are compared to the currently used UIRT model in terms of model data fit as well as item
and person parameter estimation consistency. No prior study has been found that compared the
MIRT model, the testlet model, and the UIRT model analyzing K–12 large-scale science
assessment data to validate test dimensionality.
7
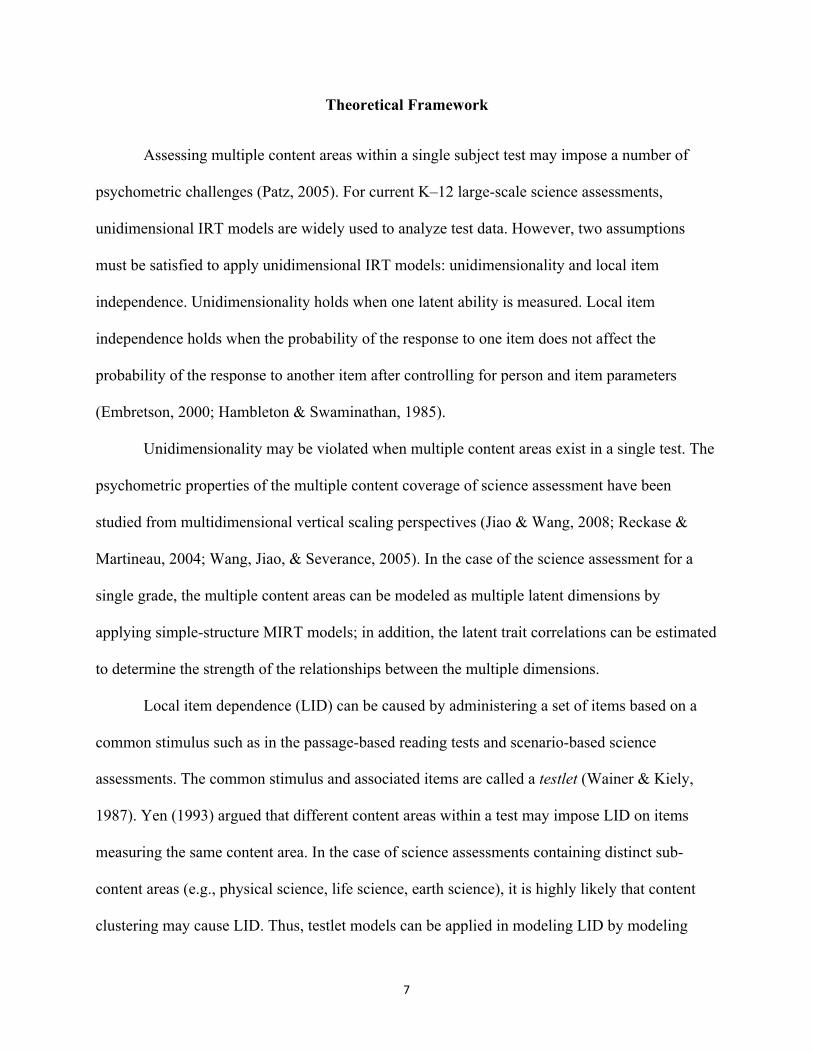
Theoretical Framework
Assessing multiple content areas within a single subject test may impose a number of
psychometric challenges (Patz, 2005). For current K–12 large-scale science assessments,
unidimensional IRT models are widely used to analyze test data. However, two assumptions
must be satisfied to apply unidimensional IRT models: unidimensionality and local item
independence. Unidimensionality holds when one latent ability is measured. Local item
independence holds when the probability of the response to one item does not affect the
probability of the response to another item after controlling for person and item parameters
(Embretson, 2000; Hambleton & Swaminathan, 1985).
Unidimensionality may be violated when multiple content areas exist in a single test. The
psychometric properties of the multiple content coverage of science assessment have been
studied from multidimensional vertical scaling perspectives (Jiao & Wang, 2008; Reckase &
Martineau, 2004; Wang, Jiao, & Severance, 2005). In the case of the science assessment for a
single grade, the multiple content areas can be modeled as multiple latent dimensions by
applying simple-structure MIRT models; in addition, the latent trait correlations can be estimated
to determine the strength of the relationships between the multiple dimensions.
Local item dependence (LID) can be caused by administering a set of items based on a
common stimulus such as in the passage-based reading tests and scenario-based science
assessments. The common stimulus and associated items are called a testlet (Wainer & Kiely,
1987). Yen (1993) argued that different content areas within a test may impose LID on items
measuring the same content area. In the case of science assessments containing distinct sub-
content areas (e.g., physical science, life science, earth science), it is highly likely that content
clustering may cause LID. Thus, testlet models can be applied in modeling LID by modeling
8
content-based testlets or random-effects nuisance dimensions (Cohen, Cho, & Kim, 2005) in
addition to a general dimension that measures the student’s general science ability.
The two perspectives of modeling content clustering in a single subject test can be
realized by applying both simple-structure MIRT and testlet models. A brief review of the
mathematic formulations for Rasch MIRT and Rasch testlet models follows.
Rasch Multidimensional Item Response Theory Model
By constraining the discrimination parameters in the two-parameter multidimensional
IRT model proposed by Reckase (1997), the Rasch multidimensional IRT model is expressed as
( )[ ]ikji bp
−+++−+=
θθθ ...exp11
21
where jip is the probability of examinee j responding to item i correctly, kθθθ ,...,, 21 represent k
latent traits or abilities of examinee j, ib is related to an overall multidimensional difficulty level,
and jip is the probability of examinee j responding to item i correctly.
Rasch Testlet Model
Wang and Wilson (2005) proposed Rasch testlet models by viewing the model as a
special case of the multidimensional random coefficients multinomial logit model (MRCMLM;
Adams, Wilson, & Wang, 1997). They treated each testlet effect as a different dimension in
addition to one general factor underlying each testlet. They proposed the following Rasch testlet
model:
)](exp[11
)(ijdijjdi bp
γθ +−−+=
where jθ is the person j’s latent ability, ib is the item i's difficulty parameter, )(ijdγ is the
interaction between the person j and item i within testlet d, and jdip is the probability of a correct
9
response. The magnitude of testlet effect is represented by 2)( ijdγσ , which is the variance of the
)(ijdγ parameter.
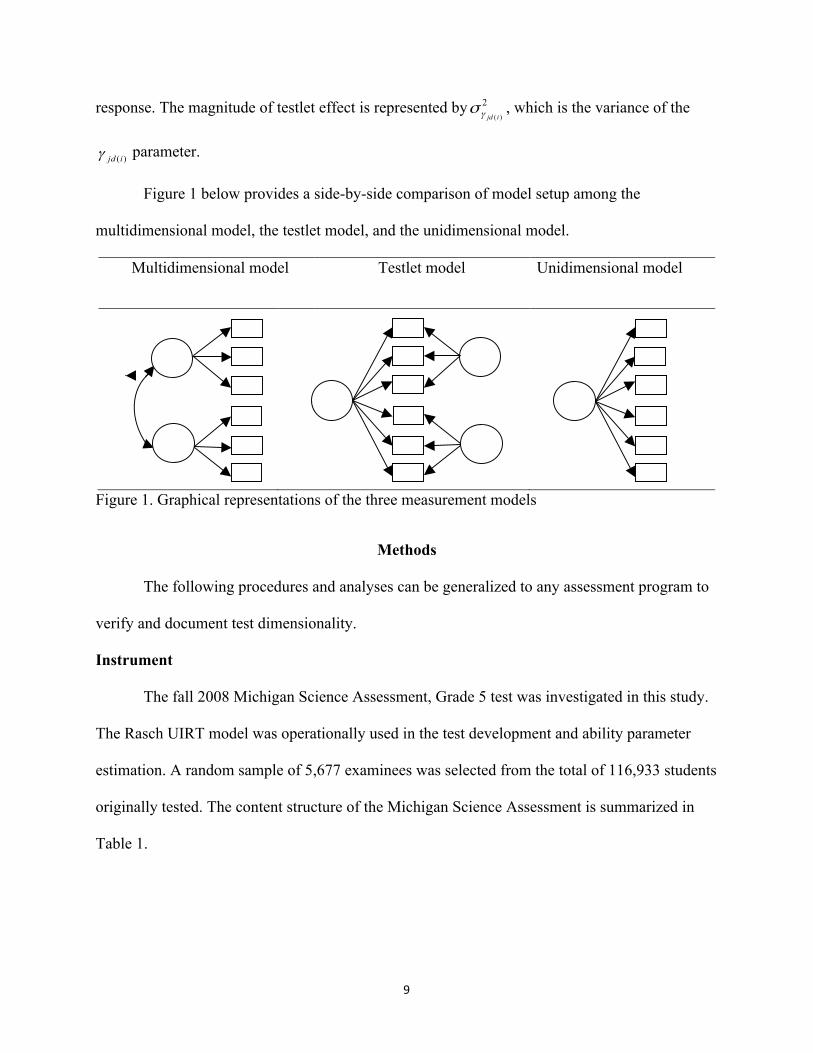
Figure 1 below provides a side-by-side comparison of model setup among the
multidimensional model, the testlet model, and the unidimensional model.
Multidimensional model Testlet model Unidimensional model
Figure 1. Graphical representations of the three measurement models
Methods
The following procedures and analyses can be generalized to any assessment program to
verify and document test dimensionality.
Instrument
The fall 2008 Michigan Science Assessment, Grade 5 test was investigated in this study.
The Rasch UIRT model was operationally used in the test development and ability parameter
estimation. A random sample of 5,677 examinees was selected from the total of 116,933 students
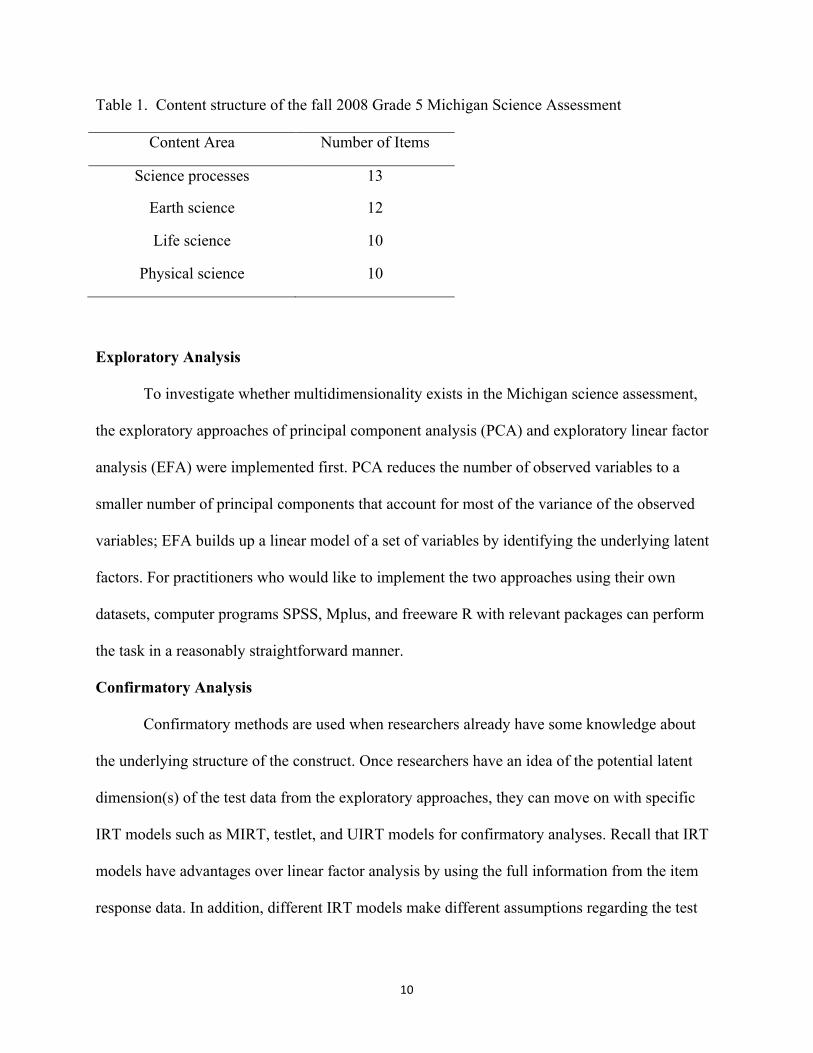
originally tested. The content structure of the Michigan Science Assessment is summarized in
Table 1.
10
Table 1. Content structure of the fall 2008 Grade 5 Michigan Science Assessment
Content Area Number of Items
Science processes 13
Earth science 12
Life science 10
Physical science 10
Exploratory Analysis
To investigate whether multidimensionality exists in the Michigan science assessment,
the exploratory approaches of principal component analysis (PCA) and exploratory linear factor
analysis (EFA) were implemented first. PCA reduces the number of observed variables to a
smaller number of principal components that account for most of the variance of the observed
variables; EFA builds up a linear model of a set of variables by identifying the underlying latent
factors. For practitioners who would like to implement the two approaches using their own
datasets, computer programs SPSS, Mplus, and freeware R with relevant packages can perform
the task in a reasonably straightforward manner.
Confirmatory Analysis
Confirmatory methods are used when researchers already have some knowledge about
the underlying structure of the construct. Once researchers have an idea of the potential latent
dimension(s) of the test data from the exploratory approaches, they can move on with specific
IRT models such as MIRT, testlet, and UIRT models for confirmatory analyses. Recall that IRT
models have advantages over linear factor analysis by using the full information from the item
response data. In addition, different IRT models make different assumptions regarding the test
11
content and structure. Thus, estimating different IRT models allows practitioners to find the most
appropriate representation of test dimensionality for the data.
Multidimensional item response theory and testlet model estimation setup
In the MIRT model with simple structure (i.e., each item measures only one latent
dimension), each content area is treated as a latent dimension. In this case, 45 items measure the
four dimensions: 13 items measuring science processes, 12 items measuring earth science, 10
items measuring life science, and 10 items measuring physical science. These four dimensions
were set to be correlated with one another so that the amount of association among the four latent
traits can be estimated. In addition, the variances of the latent traits were freely estimated, and
the importance of the four latent traits can be compared and discussed.
In the testlet model, each content area was treated as a nuisance testlet dimension in
addition to the dominant dimension that measures the overall science ability. Specifically, all
items measure the dominant dimension, and items from the same content area also measure one
of the four nuisance testlet dimensions. By convention, all dimensions (i.e., both dominant and
nuisance dimensions) in testlet models were constrained to be orthogonal with each other; thus,
no correlations were estimated. Variances of dominant and nuisance dimensions were estimated
and discussed.
The Marginal Maximum Likelihood (MML) method was used to estimate the three IRT
models (i.e., MIRT, testlet, and UIRT models) implemented in the computer program ConQuest
(Wu, Adams, & Halden, 2001). As noted previously, in addition to estimating item and person
parameters, latent trait variances for the three models as well as the latent traits’ correlations in
the MIRT model were also estimated.
12
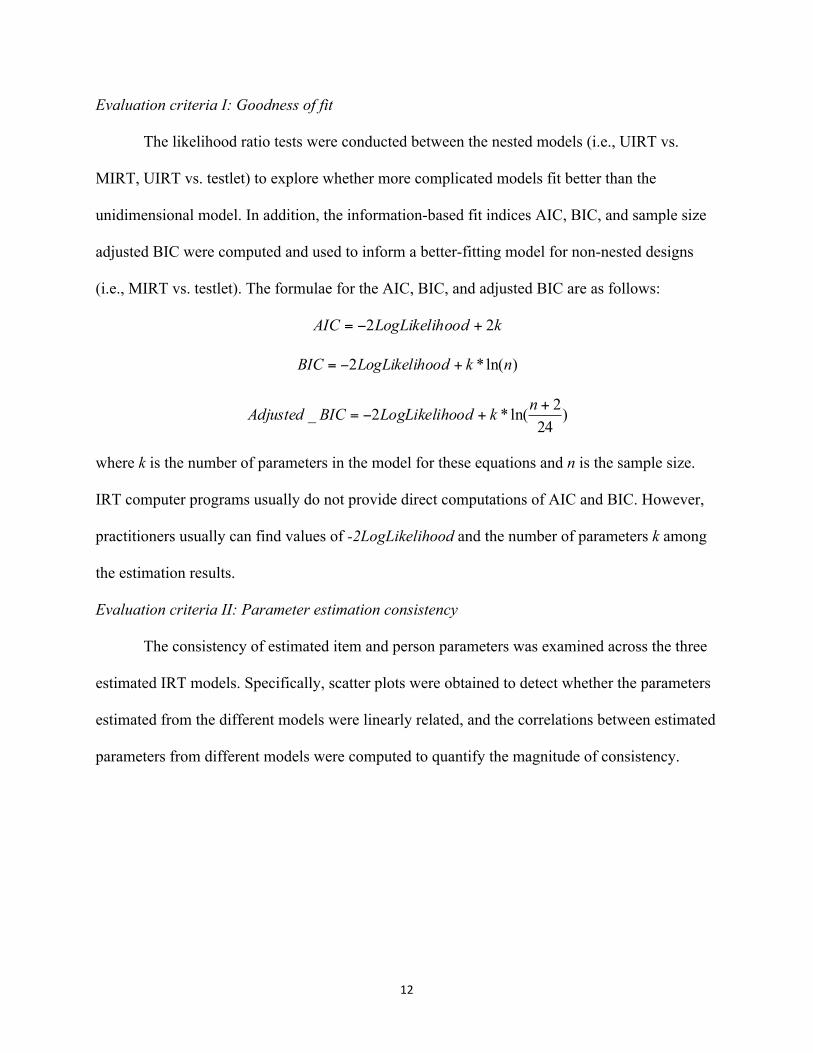
Evaluation criteria I: Goodness of fit
The likelihood ratio tests were conducted between the nested models (i.e., UIRT vs.
MIRT, UIRT vs. testlet) to explore whether more complicated models fit better than the
unidimensional model. In addition, the information-based fit indices AIC, BIC, and sample size
adjusted BIC were computed and used to inform a better-fitting model for non-nested designs
(i.e., MIRT vs. testlet). The formulae for the AIC, BIC, and adjusted BIC are as follows:
koodLogLikelihAIC 22 +−=
)ln(*2 nkoodLogLikelihBIC +−=
)242ln(*2_ +
+−=nkoodLogLikelihBICAdjusted
where k is the number of parameters in the model for these equations and n is the sample size.
IRT computer programs usually do not provide direct computations of AIC and BIC. However,
practitioners usually can find values of -2LogLikelihood and the number of parameters k among
the estimation results.
Evaluation criteria II: Parameter estimation consistency
The consistency of estimated item and person parameters was examined across the three
estimated IRT models. Specifically, scatter plots were obtained to detect whether the parameters
estimated from the different models were linearly related, and the correlations between estimated
parameters from different models were computed to quantify the magnitude of consistency.
13
Results
Exploratory Analysis
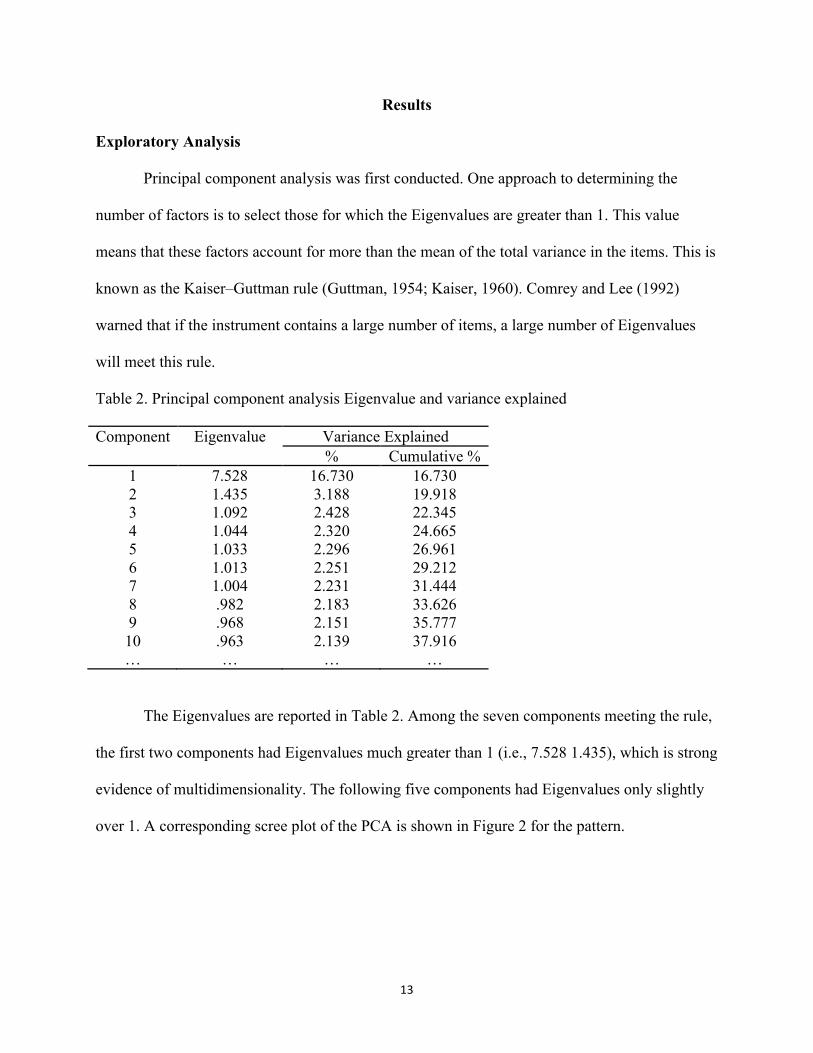
Principal component analysis was first conducted. One approach to determining the
number of factors is to select those for which the Eigenvalues are greater than 1. This value
means that these factors account for more than the mean of the total variance in the items. This is
known as the Kaiser–Guttman rule (Guttman, 1954; Kaiser, 1960). Comrey and Lee (1992)
warned that if the instrument contains a large number of items, a large number of Eigenvalues
will meet this rule.
Table 2. Principal component analysis Eigenvalue and variance explained
Component Eigenvalue Variance Explained % Cumulative % 1 7.528 16.730 16.730 2 1.435 3.188 19.918 3 1.092 2.428 22.345 4 1.044 2.320 24.665 5 1.033 2.296 26.961 6 1.013 2.251 29.212 7 1.004 2.231 31.444 8 .982 2.183 33.626 9 .968 2.151 35.777 10 .963 2.139 37.916 … … … …
The Eigenvalues are reported in Table 2. Among the seven components meeting the rule,
the first two components had Eigenvalues much greater than 1 (i.e., 7.528 1.435), which is strong
evidence of multidimensionality. The following five components had Eigenvalues only slightly
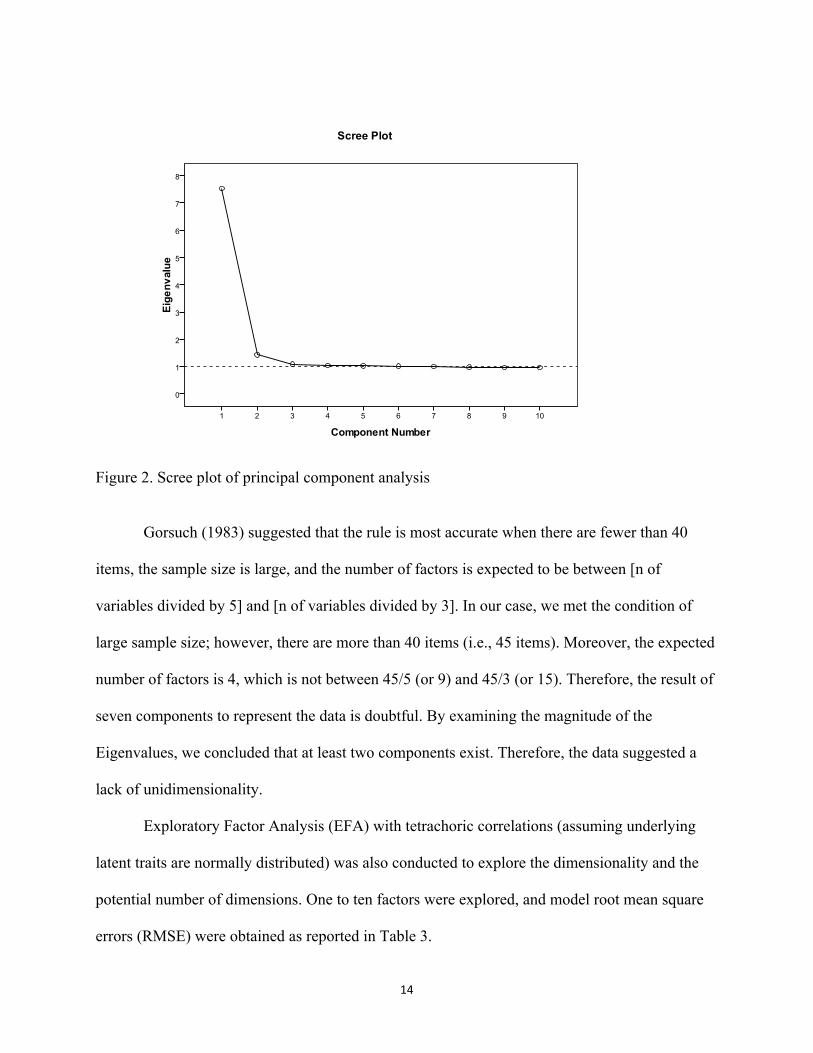
over 1. A corresponding scree plot of the PCA is shown in Figure 2 for the pattern.
14
Figure 2. Scree plot of principal component analysis
Gorsuch (1983) suggested that the rule is most accurate when there are fewer than 40
items, the sample size is large, and the number of factors is expected to be between [n of
variables divided by 5] and [n of variables divided by 3]. In our case, we met the condition of
large sample size; however, there are more than 40 items (i.e., 45 items). Moreover, the expected
number of factors is 4, which is not between 45/5 (or 9) and 45/3 (or 15). Therefore, the result of
seven components to represent the data is doubtful. By examining the magnitude of the
Eigenvalues, we concluded that at least two components exist. Therefore, the data suggested a
lack of unidimensionality.
Exploratory Factor Analysis (EFA) with tetrachoric correlations (assuming underlying
latent traits are normally distributed) was also conducted to explore the dimensionality and the
potential number of dimensions. One to ten factors were explored, and model root mean square
errors (RMSE) were obtained as reported in Table 3.
15
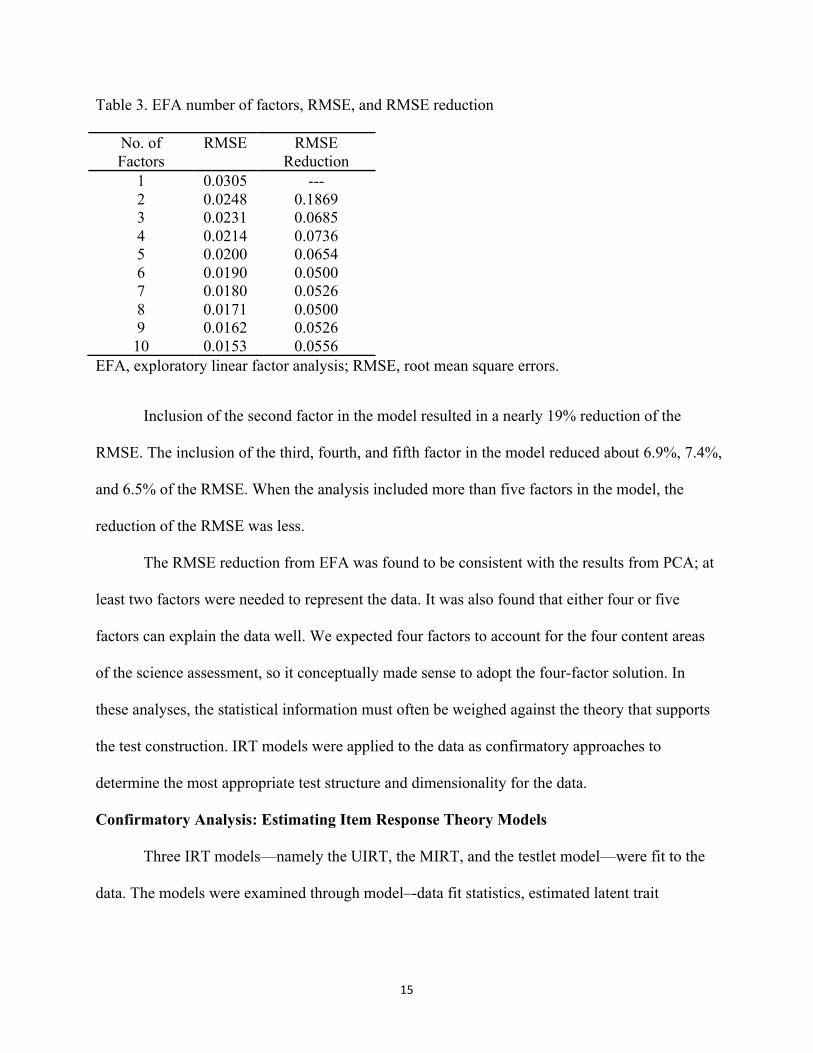
Table 3. EFA number of factors, RMSE, and RMSE reduction
No. of Factors
RMSE RMSE Reduction
1 0.0305 --- 2 0.0248 0.1869 3 0.0231 0.0685 4 0.0214 0.0736 5 0.0200 0.0654 6 0.0190 0.0500 7 0.0180 0.0526 8 0.0171 0.0500 9 0.0162 0.0526 10 0.0153 0.0556
EFA, exploratory linear factor analysis; RMSE, root mean square errors.
Inclusion of the second factor in the model resulted in a nearly 19% reduction of the
RMSE. The inclusion of the third, fourth, and fifth factor in the model reduced about 6.9%, 7.4%,
and 6.5% of the RMSE. When the analysis included more than five factors in the model, the
reduction of the RMSE was less.
The RMSE reduction from EFA was found to be consistent with the results from PCA; at
least two factors were needed to represent the data. It was also found that either four or five
factors can explain the data well. We expected four factors to account for the four content areas
of the science assessment, so it conceptually made sense to adopt the four-factor solution. In
these analyses, the statistical information must often be weighed against the theory that supports
the test construction. IRT models were applied to the data as confirmatory approaches to
determine the most appropriate test structure and dimensionality for the data.
Confirmatory Analysis: Estimating Item Response Theory Models
Three IRT models—namely the UIRT, the MIRT, and the testlet model—were fit to the
data. The models were examined through model–-data fit statistics, estimated latent trait
16
structures (i.e., latent trait variances and correlations), and the item and person parameter
estimation consistency.
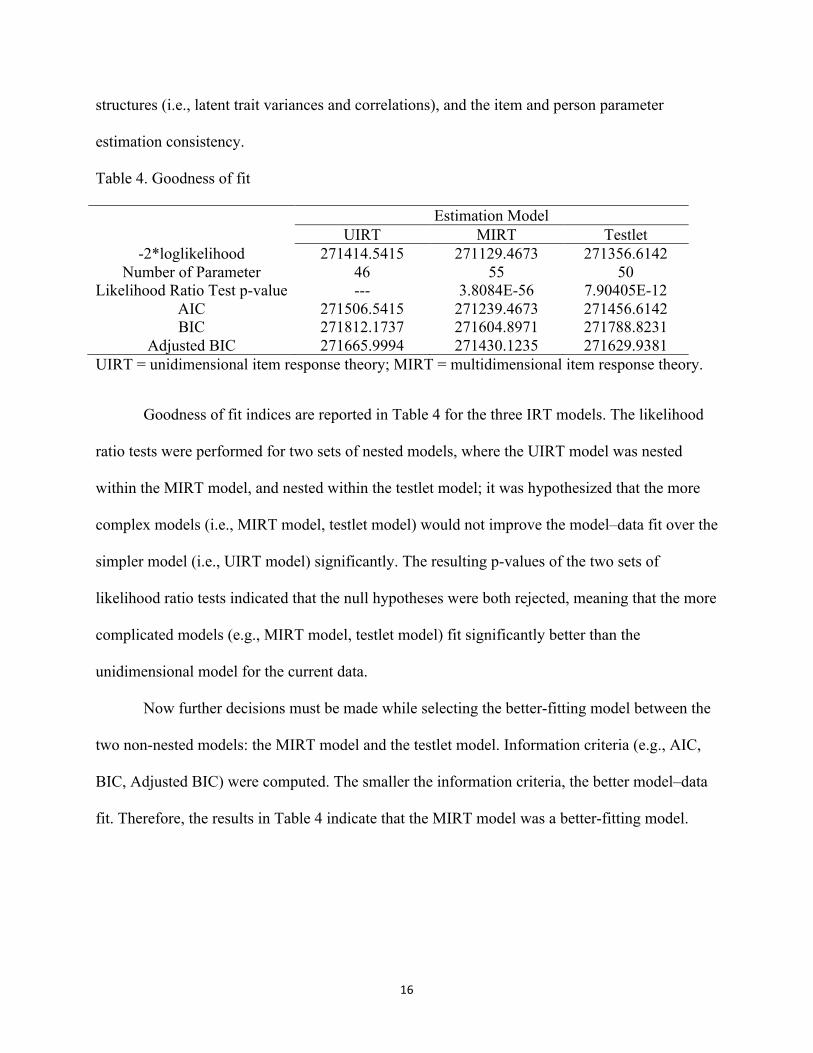
Table 4. Goodness of fit
Estimation Model UIRT MIRT Testlet
-2*loglikelihood 271414.5415 271129.4673 271356.6142 Number of Parameter 46 55 50
Likelihood Ratio Test p-value --- 3.8084E-56 7.90405E-12 AIC 271506.5415 271239.4673 271456.6142 BIC 271812.1737 271604.8971 271788.8231
Adjusted BIC 271665.9994 271430.1235 271629.9381 UIRT = unidimensional item response theory; MIRT = multidimensional item response theory.
Goodness of fit indices are reported in Table 4 for the three IRT models. The likelihood
ratio tests were performed for two sets of nested models, where the UIRT model was nested
within the MIRT model, and nested within the testlet model; it was hypothesized that the more
complex models (i.e., MIRT model, testlet model) would not improve the model–data fit over the
simpler model (i.e., UIRT model) significantly. The resulting p-values of the two sets of
likelihood ratio tests indicated that the null hypotheses were both rejected, meaning that the more
complicated models (e.g., MIRT model, testlet model) fit significantly better than the
unidimensional model for the current data.
Now further decisions must be made while selecting the better-fitting model between the
two non-nested models: the MIRT model and the testlet model. Information criteria (e.g., AIC,
BIC, Adjusted BIC) were computed. The smaller the information criteria, the better model–data
fit. Therefore, the results in Table 4 indicate that the MIRT model was a better-fitting model.
17
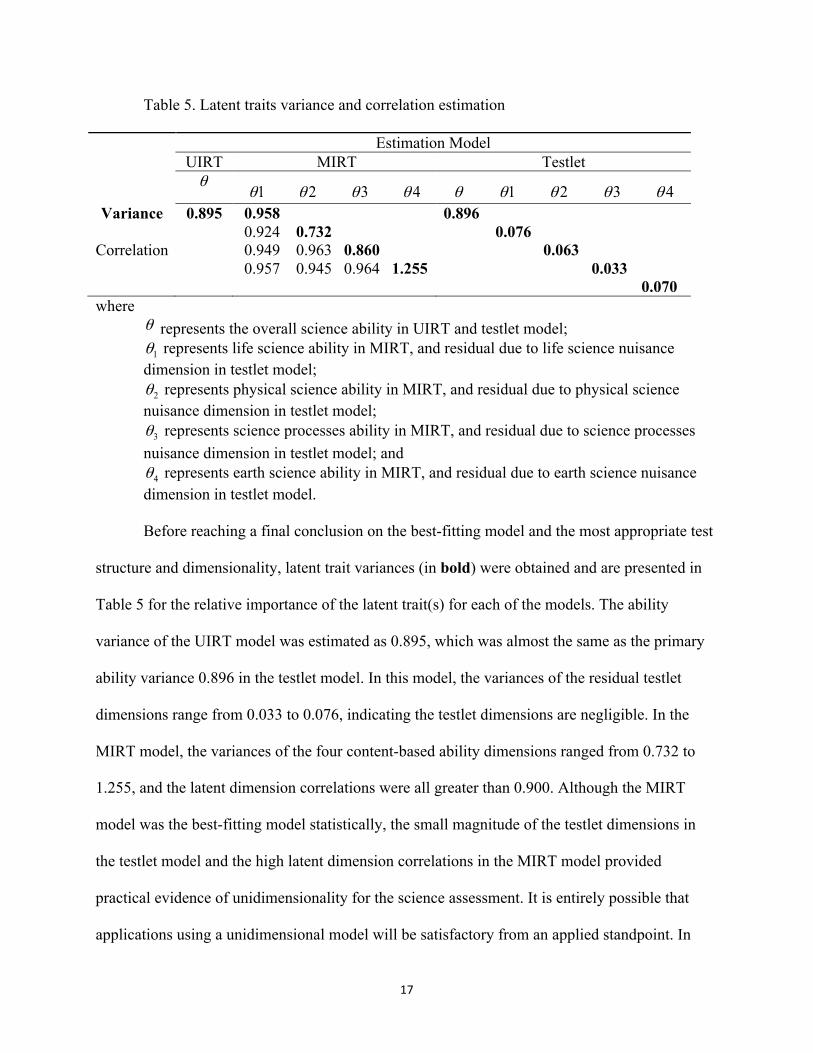
Table 5. Latent traits variance and correlation estimation
Estimation Model UIRT MIRT Testlet θ
4321 θθθθ 4321 θθθθθ Variance
Correlation
0.895
0.958 0.924 0.732 0.949 0.963 0.860 0.957 0.945 0.964 1.255
0.896 0.076 0.063
0.033 0.070
where θ represents the overall science ability in UIRT and testlet model; 1θ represents life science ability in MIRT, and residual due to life science nuisance
dimension in testlet model; 2θ represents physical science ability in MIRT, and residual due to physical science
nuisance dimension in testlet model; 3θ represents science processes ability in MIRT, and residual due to science processes
nuisance dimension in testlet model; and 4θ represents earth science ability in MIRT, and residual due to earth science nuisance
dimension in testlet model. Before reaching a final conclusion on the best-fitting model and the most appropriate test
structure and dimensionality, latent trait variances (in bold) were obtained and are presented in
Table 5 for the relative importance of the latent trait(s) for each of the models. The ability
variance of the UIRT model was estimated as 0.895, which was almost the same as the primary
ability variance 0.896 in the testlet model. In this model, the variances of the residual testlet
dimensions range from 0.033 to 0.076, indicating the testlet dimensions are negligible. In the
MIRT model, the variances of the four content-based ability dimensions ranged from 0.732 to
1.255, and the latent dimension correlations were all greater than 0.900. Although the MIRT
model was the best-fitting model statistically, the small magnitude of the testlet dimensions in
the testlet model and the high latent dimension correlations in the MIRT model provided
practical evidence of unidimensionality for the science assessment. It is entirely possible that
applications using a unidimensional model will be satisfactory from an applied standpoint. In
18
contrast, from a conceptual standpoint, one can debate whether a single dimension, two
dimensions, or even four dimensions provide the best conceptual solution.
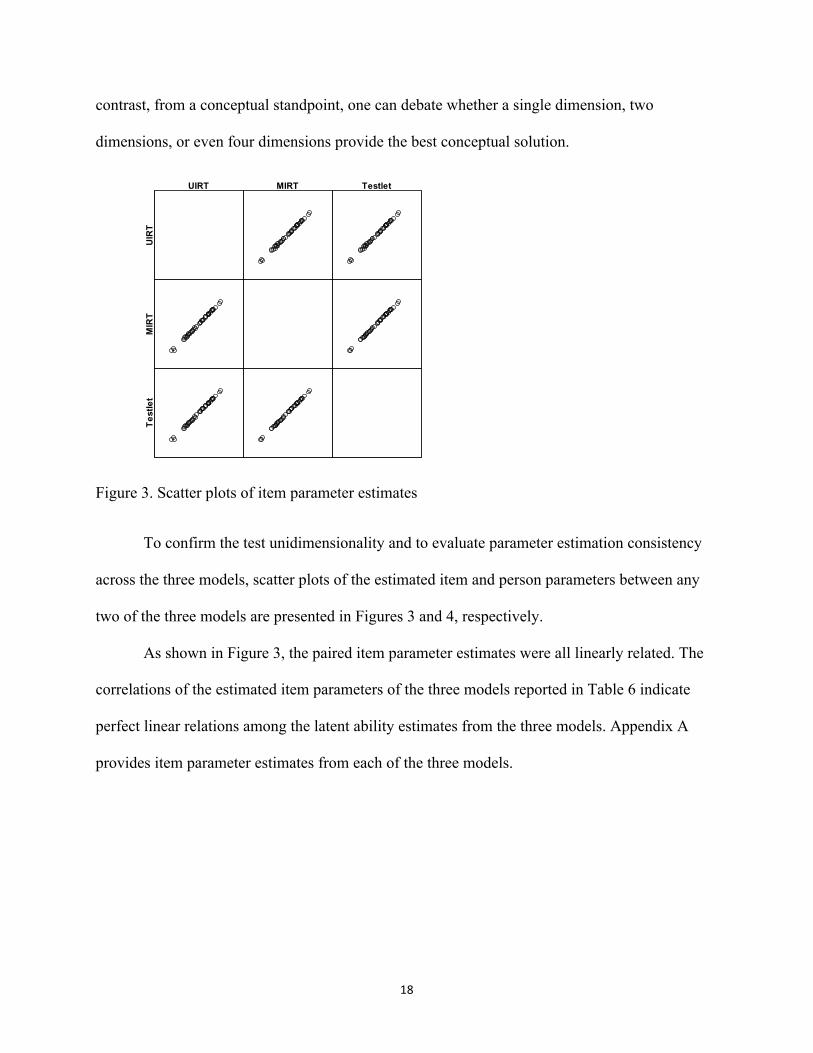
Figure 3. Scatter plots of item parameter estimates
To confirm the test unidimensionality and to evaluate parameter estimation consistency
across the three models, scatter plots of the estimated item and person parameters between any
two of the three models are presented in Figures 3 and 4, respectively.
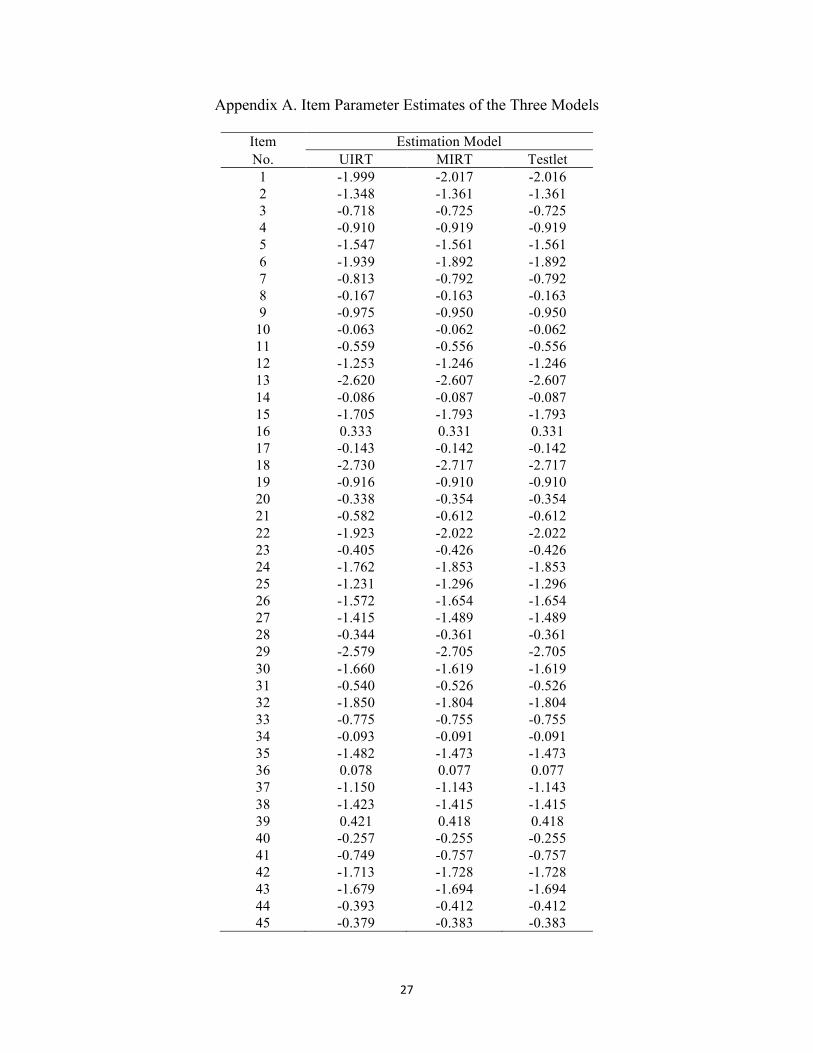
As shown in Figure 3, the paired item parameter estimates were all linearly related. The
correlations of the estimated item parameters of the three models reported in Table 6 indicate
perfect linear relations among the latent ability estimates from the three models. Appendix A
provides item parameter estimates from each of the three models.
19
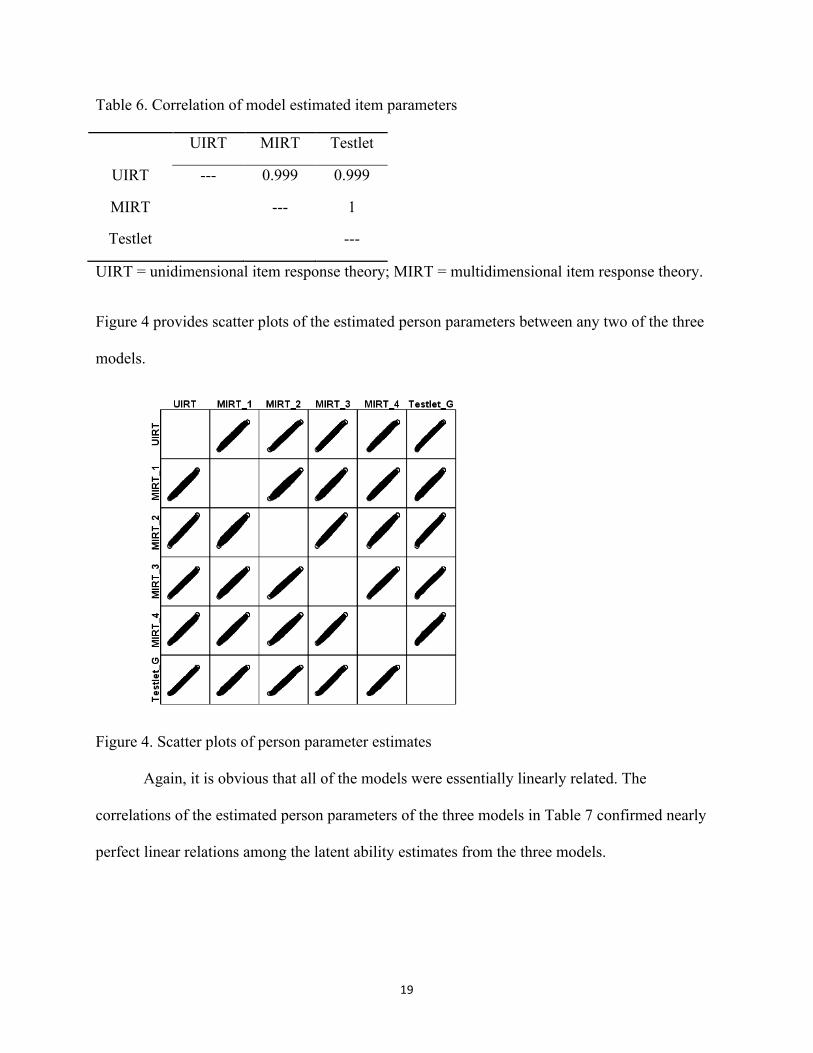
Table 6. Correlation of model estimated item parameters
UIRT MIRT Testlet
UIRT --- 0.999 0.999
MIRT --- 1
Testlet ---
UIRT = unidimensional item response theory; MIRT = multidimensional item response theory.
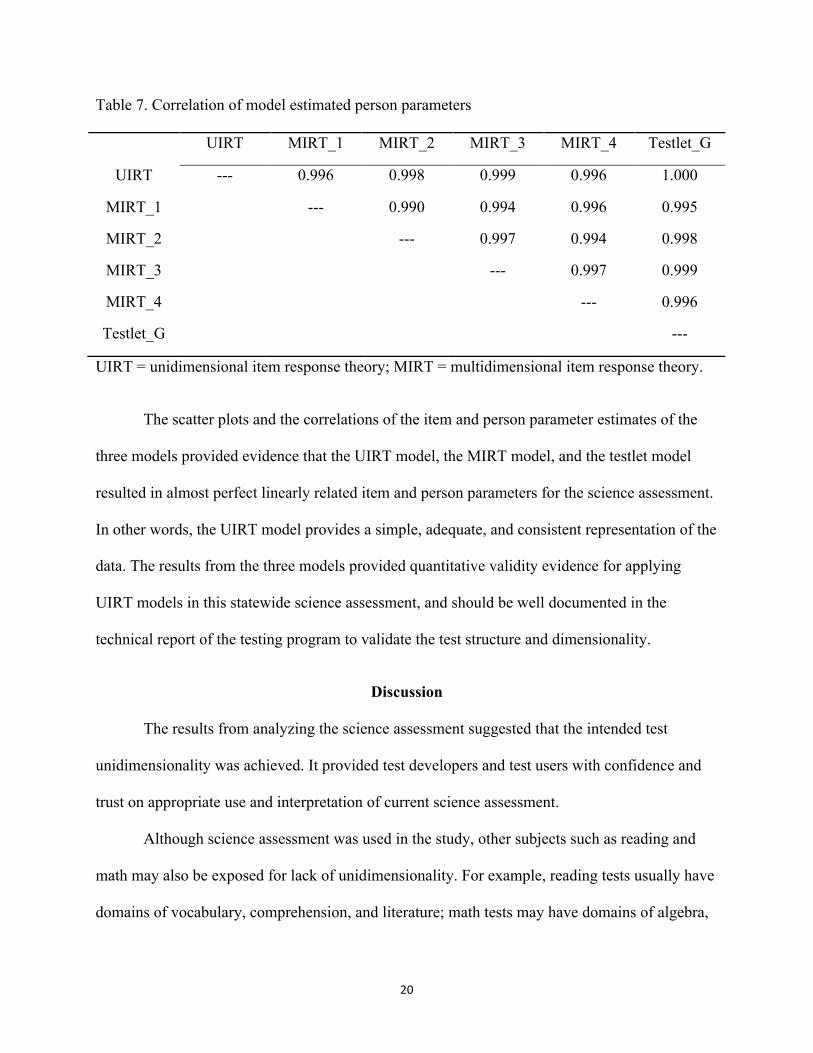
Figure 4 provides scatter plots of the estimated person parameters between any two of the three
models.
Figure 4. Scatter plots of person parameter estimates
Again, it is obvious that all of the models were essentially linearly related. The
correlations of the estimated person parameters of the three models in Table 7 confirmed nearly
perfect linear relations among the latent ability estimates from the three models.
20
Table 7. Correlation of model estimated person parameters
UIRT MIRT_1 MIRT_2 MIRT_3 MIRT_4 Testlet_G
UIRT --- 0.996 0.998 0.999 0.996 1.000
MIRT_1 --- 0.990 0.994 0.996 0.995
MIRT_2 --- 0.997 0.994 0.998
MIRT_3 --- 0.997 0.999
MIRT_4 --- 0.996
Testlet_G ---
UIRT = unidimensional item response theory; MIRT = multidimensional item response theory.
The scatter plots and the correlations of the item and person parameter estimates of the
three models provided evidence that the UIRT model, the MIRT model, and the testlet model
resulted in almost perfect linearly related item and person parameters for the science assessment.
In other words, the UIRT model provides a simple, adequate, and consistent representation of the
data. The results from the three models provided quantitative validity evidence for applying
UIRT models in this statewide science assessment, and should be well documented in the
technical report of the testing program to validate the test structure and dimensionality.
Discussion
The results from analyzing the science assessment suggested that the intended test
unidimensionality was achieved. It provided test developers and test users with confidence and
trust on appropriate use and interpretation of current science assessment.
Although science assessment was used in the study, other subjects such as reading and
math may also be exposed for lack of unidimensionality. For example, reading tests usually have
domains of vocabulary, comprehension, and literature; math tests may have domains of algebra,
21
geometry, and statistics. Therefore, the methods presented in this study can be applied to any
subject test designed with different content and domain coverage for exploration and, hopefully,
verification of the test structure and dimensionality.
This approach to validating test dimensionality was applied to K–12 assessments in
which measuring students’ achievement, differentiating students on a wide span of ability, and
assigning students to different proficiency categories (e.g., basic, proficient, advanced) are the
primary goals. Other testing programs such as college entrance exams (e.g., SAT, ACT),
licensure, and certification testing with the focus on selecting students who demonstrate mastery
of the specific knowledge and skills can also be subject to these analyses and procedures. Tests
are designed to measure certain latent ability dimension(s). Whether the test is intended to
differentiate or select examinees, the intended test structure and dimensionality must be
empirically validated. Moreover, the admission, licensure, and certification tests usually contain
more items measuring the same knowledge and skill. Thus multidimensionality or local item
dependence caused by item clustering may be even a more important issue to be investigated.
The procedures to validate the test structure and dimensionality are summarized for
practitioners as follows:
First, one should examine the test’s intended structure and dimensionality: How many
intended dimensions of ability does the test encompass? Which IRT model was used to calibrate
the data? How many domains or content areas does the test include? Gathering this information
will help practitioners understand the theoretical design of the test, so that analyses and
procedures confirming test dimensionality can be conducted effectively.
22
Second, exploratory approaches (e.g., PCA, EFA) should be conducted to identify the
existence of multidimensionality and to determine the potential latent dimension(s) considering
the intended test dimensionality.
Third, confirmatory analysis can then be implemented by estimating several potential
IRT models with different assumptions of the test structure using MIRT, testlet, and UIRT
models.
Fourth, comparisons must be made across the models in terms of model–data fit,
parameter estimates, covariance matrix estimates, and consistency of parameter estimates to
determine the best-fitting model as well as the most appropriate test structure and number of
dimensions.
Practitioners will always discuss when to apply multidimensional IRT models and when
to apply UIRT models for a testing program at both developmental and appraisal stages. At the
initial test formation stage, the important question test designers should ask is how many ability
dimensions the test needs to assess. If a single ability (e.g., general math ability) is being
measured, a UIRT model should be adopted. If more than one ability is being measured (e.g.,
algebra, geometry), multidimensional IRT models should be adopted. The model a practitioner
selects is determined by the intended inferences regarding the latent abilities and how complex
the test needs to be. At the final appraisal stage, it is always safer to start with multidimensional
IRT models (e.g., MIRT, testlet models) even if the test was developed with UIRT models; more
complex models (e.g., MIRT, testlet models) provide multiple-dimensional estimates for
practitioners. This permits practitioners to determine if the complex models supply unique
information or just redundant information by examining the latent ability corrections in MIRT
23
models and the testlet variances in the testlet models. High correlations and small testlet
variances provide evidence for test unidimensionality.
This study is limited by investigating only one empirical assessment dataset; thus, the
conclusion of its test unidimensionality is not generalizable to other K–12 large-scale
assessments. Future simulation studies can be designed to determine under what test condition
each of the UIRT, MIRT, and testlet models would be more appropriate for modeling
assessments with content clustering. The intent of this paper is not to settle that issue. Instead,
the intent is to provide guidelines for the practitioner who is interested in such matters. We hope
all practitioners will be interested because users will want to draw inferences from student
performance. The accuracy of these inferences will depend, in part, on the complexity of the
dimensionality of the tests that serve as their basis.
References
Adams, R. J., Wilson, M. R., & Wang, W.-C. (1997). The multidimensional random
coefficients multinomial logit model. Applied Psychological Measurement, 21, 1–23.
Cohen, A., Cho, S., & Kim, S. (2005). A mixture testlet model for educational tests. Paper
presented at the Annual Meeting of the American Educational Research Association,
Montreal, Canada.
Comrey, A. L., & Lee, H. B. (1992). A first course in factor analysis. Hillsdale, NJ: Erlbaum.
Embretson, S. E., & Reise, S. P. (2000). Item response theory for psychologists. Mahwah, NJ:
Erlbaum.
Gorsuch, R. L. (1983). Factor analysis (2nd ed.). Hillsdale, NJ: Erlbaum.
24
Guttman, L. (1954). Some necessary conditions for common-factor analysis. Psychometrika,19,
149–161.
Hambleton, R. K., & Swaminathan, H. (1985). Item response theory: Principles and
applications. Boston, MA: Kluwer-Nijhoff.
Hattie, J. (1985). Methodology review: Assessing dimensionality of items and items. Applied
Psychological Measurement, 9, 139–164.
Jiao, H., & Wang, S. (2008). Construct equivalence for vertically scaled science
assessment. Paper presented at the Annual Meeting of the American Educational
Research Association, New York, NY.
Kaiser, H. F. (1960). The application of electronic computers to factor analysis. Educational and
Psychology Measurement, 34, 111–117.
Kane, M. T. (2006). Validation. In R. L. Brennan (Ed.), Educational measurement (4th ed., pp.
17–64). Westport, CT: American Council on Education and Praeger Publishers.
Lane, S., & Stone, C. (2006). Performance assessment. In R. L. Brennan (Ed.), Educational
measurement (4th ed., pp. 387–431). Westport, CT: American Council on Education and
Praeger Publishers.
McDonald, R. P. (1981). The dimensionality of tests and items. British Journal of Mathematical
and Statistical Psychology, 34, 100–117.
McDonald, R. P. (1982). Linear versus nonlinear models in item response theory. Applied
Psychological Measurement, 6(4), 379–396.
Nandakumar, R., Yu, F., Li, H.-H., & Stout, W. F. (1998). Assessing unidimensionality of
polytomous data. Applied Psychological Measurement, 22, 99–115.
Patz, R. J. (2005). Building NCLB science assessments: Psychometric and practical
25
considerations. Final Report submitted to the National Research Council Committee on
Test Design for K-12 Science Achievement. Retrieved September 26, 2012 from:
http://www7.nationalacademies.org/bota/Test_Design_K-12_Science.html
Reckase, M.D. (1997). A linear logistic multidimensional model for dichotomous item response
data. In W.J. van der Linden & R. K. Hambleton (Eds.), Handbook of Modern Item
Response Theory (pp. 271–286). NewYork: Springer-Verlag.
Reckase, M. D., & Martineau, J. A. (2004). The vertical scaling of science achievement tests.
Unpublished Report. East Lansing, MI: Michigan State Unversity.
Schmeiser, C. B., & Welch, C. J. (2006). Test development. In R. L. Brennan (Ed.), Educational
measurement (4th ed., pp. 307–353). Westport, CT: American Council on Education and
Praeger Publishers.
Skaggs, G., & Lissitz, R. W. (1988). Effect of examinee ability on test equating invariance.
Applied Psychological Measurement, 12(1), 69–82.
Stout, W. (1987). A nonparametric approach for assessing latent trait unidimensionality.
Psychometrika, 52(4), 589–617.
Stout, W. (1990). A new item response theory modeling approach with applications to
unidimensionality assessment and ability estimation. Psychometrika, 55(2), 293–325.
Stout, W. F., Douglas, J., Kim, H. R., Roussos, L., & Zhang, J. (1996). Conditional covariance-
based nonparametric multidimensionality assessment. Applied Psychological
Measurement, 10, 331–354.
Wainer, H., & Kiely, G. (1987). Item clusters and computerized adaptive testing: A case
for testlets. Journal of Educational Measurement, 24, 185–202.
26
Wang, S., & Jiao, H. (2009). Construct equivalence across grades in a vertical scale for a K-12
large-scale reading assessment. Educational and Psychological Measurement, 69(5),
760–777.
Wang, S., Jiao, H., & Severance, N. (2005). An investigation of growth patterns of student
achievement using unidimensional and multidimensional vertical scaling methods. Paper
presented at the Annual Meeting of the National Council on Measurement in Education,
Montreal, QB: Canada.
Wang, W.-C., & Wilson, M. R. (2005). The Rasch Testlet model. Applied Psychological
Measurement, 29, 126–149.
Wu, M. L., Adams, R. J., & Halden, M. R. (2001). ConQuest: Generalized item response
modeling software [Computer software and manual]. Camberwell, Victoria: Australian
Council for Educational Research.
Yen, W. M. (1993). Scaling performance assessments: Strategies for managing local item
dependence. Journal of Educational Measurement, 30, 187–213.
27
Appendix A. Item Parameter Estimates of the Three Models
Item Estimation Model No. UIRT MIRT Testlet 1 -1.999 -2.017 -2.016 2 -1.348 -1.361 -1.361 3 -0.718 -0.725 -0.725 4 -0.910 -0.919 -0.919 5 -1.547 -1.561 -1.561 6 -1.939 -1.892 -1.892 7 -0.813 -0.792 -0.792 8 -0.167 -0.163 -0.163 9 -0.975 -0.950 -0.950
10 -0.063 -0.062 -0.062 11 -0.559 -0.556 -0.556 12 -1.253 -1.246 -1.246 13 -2.620 -2.607 -2.607 14 -0.086 -0.087 -0.087 15 -1.705 -1.793 -1.793 16 0.333 0.331 0.331 17 -0.143 -0.142 -0.142 18 -2.730 -2.717 -2.717 19 -0.916 -0.910 -0.910 20 -0.338 -0.354 -0.354 21 -0.582 -0.612 -0.612 22 -1.923 -2.022 -2.022 23 -0.405 -0.426 -0.426 24 -1.762 -1.853 -1.853 25 -1.231 -1.296 -1.296 26 -1.572 -1.654 -1.654 27 -1.415 -1.489 -1.489 28 -0.344 -0.361 -0.361 29 -2.579 -2.705 -2.705 30 -1.660 -1.619 -1.619 31 -0.540 -0.526 -0.526 32 -1.850 -1.804 -1.804 33 -0.775 -0.755 -0.755 34 -0.093 -0.091 -0.091 35 -1.482 -1.473 -1.473 36 0.078 0.077 0.077 37 -1.150 -1.143 -1.143 38 -1.423 -1.415 -1.415 39 0.421 0.418 0.418 40 -0.257 -0.255 -0.255 41 -0.749 -0.757 -0.757 42 -1.713 -1.728 -1.728 43 -1.679 -1.694 -1.694 44 -0.393 -0.412 -0.412 45 -0.379 -0.383 -0.383