Embed Size (px)
Citation preview
Accelerating success.
YIELDS AND CAPITAL GAINS TAXTACTICAL REPORT | JANUARY 2012
In association with
EASTERN EUROPE RESEARCH
Executive Summary 3
What’s in a Yield: Introduction 4
Factors Impacting Gross to Net 5
Pricing Impact of Latent Capital Gains Tax (LCGT) Liability 5
Warsaw Scenarios 6
Budapest Scenarios 7
Market Impact 7
Contact Details 7
TABLE OF CONTENTS
EASTERN EUROPE RESEARCH | YIELDS AND CAPITAL GAINS TAX
COLLIERS INTERNATIONAL | P. 2
JANUARY 2012
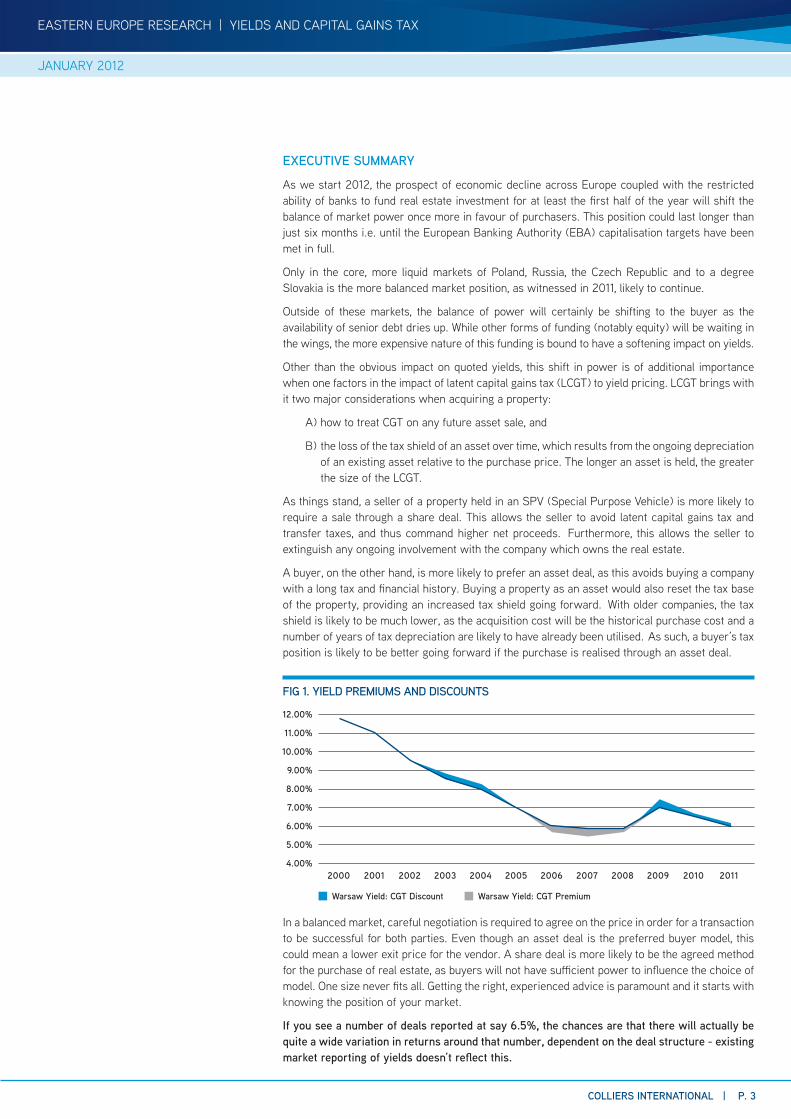
EXECUTIVE SUMMARY
As we start 2012, the prospect of economic decline across Europe coupled with the restricted ability of banks to fund real estate investment for at least the first half of the year will shift the balance of market power once more in favour of purchasers. This position could last longer than just six months i.e. until the European Banking Authority (EBA) capitalisation targets have been met in full.
Only in the core, more liquid markets of Poland, Russia, the Czech Republic and to a degree Slovakia is the more balanced market position, as witnessed in 2011, likely to continue.
Outside of these markets, the balance of power will certainly be shifting to the buyer as the availability of senior debt dries up. While other forms of funding (notably equity) will be waiting in the wings, the more expensive nature of this funding is bound to have a softening impact on yields.
Other than the obvious impact on quoted yields, this shift in power is of additional importance when one factors in the impact of latent capital gains tax (LCGT) to yield pricing. LCGT brings with it two major considerations when acquiring a property:
A) how to treat CGT on any future asset sale, and
B) the loss of the tax shield of an asset over time, which results from the ongoing depreciation of an existing asset relative to the purchase price. The longer an asset is held, the greater the size of the LCGT.
As things stand, a seller of a property held in an SPV (Special Purpose Vehicle) is more likely to require a sale through a share deal. This allows the seller to avoid latent capital gains tax and transfer taxes, and thus command higher net proceeds. Furthermore, this allows the seller to extinguish any ongoing involvement with the company which owns the real estate.
A buyer, on the other hand, is more likely to prefer an asset deal, as this avoids buying a company with a long tax and financial history. Buying a property as an asset would also reset the tax base of the property, providing an increased tax shield going forward. With older companies, the tax shield is likely to be much lower, as the acquisition cost will be the historical purchase cost and a number of years of tax depreciation are likely to have already been utilised. As such, a buyer’s tax position is likely to be better going forward if the purchase is realised through an asset deal.
In a balanced market, careful negotiation is required to agree on the price in order for a transaction to be successful for both parties. Even though an asset deal is the preferred buyer model, this could mean a lower exit price for the vendor. A share deal is more likely to be the agreed method for the purchase of real estate, as buyers will not have sufficient power to influence the choice of model. One size never fits all. Getting the right, experienced advice is paramount and it starts with knowing the position of your market.
If you see a number of deals reported at say 6.5%, the chances are that there will actually be quite a wide variation in returns around that number, dependent on the deal structure - existing market reporting of yields doesn’t reflect this.
EASTERN EUROPE RESEARCH | YIELDS AND CAPITAL GAINS TAX
COLLIERS INTERNATIONAL | P. 3
2000 2001 2002 2003 2004 2005 2006 2007 2008 2009 2010 2011
FIG 1. YIELD PREMIUMS AND DISCOUNTS
12.00%
11.00%
10.00%
9.00%
8.00%
7.00%
6.00%
5.00%
4.00%
Warsaw Yield: CGT Discount Warsaw Yield: CGT Premium
JANUARY 2012
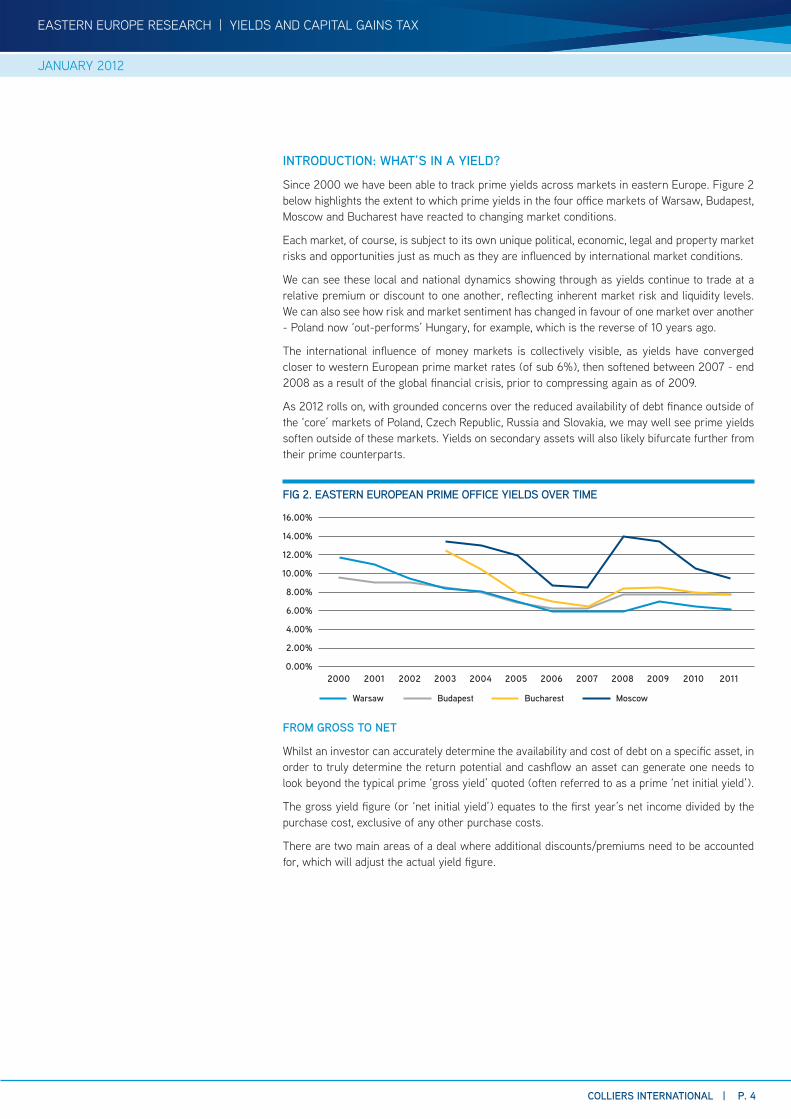
INTRODUCTION: WHAT’S IN A YIELD?
Since 2000 we have been able to track prime yields across markets in eastern Europe. Figure 2 below highlights the extent to which prime yields in the four office markets of Warsaw, Budapest, Moscow and Bucharest have reacted to changing market conditions.
Each market, of course, is subject to its own unique political, economic, legal and property market risks and opportunities just as much as they are influenced by international market conditions.
We can see these local and national dynamics showing through as yields continue to trade at a relative premium or discount to one another, reflecting inherent market risk and liquidity levels. We can also see how risk and market sentiment has changed in favour of one market over another - Poland now ‘out-performs’ Hungary, for example, which is the reverse of 10 years ago.
The international influence of money markets is collectively visible, as yields have converged closer to western European prime market rates (of sub 6%), then softened between 2007 - end 2008 as a result of the global financial crisis, prior to compressing again as of 2009.
As 2012 rolls on, with grounded concerns over the reduced availability of debt finance outside of the ‘core’ markets of Poland, Czech Republic, Russia and Slovakia, we may well see prime yields soften outside of these markets. Yields on secondary assets will also likely bifurcate further from their prime counterparts.
FROM GROSS TO NET
Whilst an investor can accurately determine the availability and cost of debt on a specific asset, in order to truly determine the return potential and cashflow an asset can generate one needs to look beyond the typical prime ‘gross yield’ quoted (often referred to as a prime ‘net initial yield’).
The gross yield figure (or ‘net initial yield’) equates to the first year’s net income divided by the purchase cost, exclusive of any other purchase costs.
There are two main areas of a deal where additional discounts/premiums need to be accounted for, which will adjust the actual yield figure.
EASTERN EUROPE RESEARCH | YIELDS AND CAPITAL GAINS TAX
COLLIERS INTERNATIONAL | P. 4
2000 2001 2002 2003 2004 2005 2006 2007 2008 2009 2010 2011
FIG 2. EASTERN EUROPEAN PRIME OFFICE YIELDS OVER TIME
16.00%
14.00%
12.00%
10.00%
8.00%
6.00%
4.00%
2.00%
0.00%
Warsaw Budapest Bucharest Moscow
JANUARY 2012

FACTORS IMPACTING GROSS TO NET
The two main areas where additional discounts/premiums can be applied to gross yields are:
1 At the asset level - such as non-recoverables, required capital expenditure, service charge losses and upcoming voids to name but a few.
2 In relation to the actual purchase cost - notably from taxes and professional transaction fees.
This report explores the impact of the second category - purchase costs, specifically the impact of latent capital gains tax (LCGT) liability and the subsequent triggering of profit & transfer taxes which may emanate from a deal as a result of LCGT being crystallised.
By analysing the impact of LCGT on the gross (net initial) yield under different transaction scenarios, we will highlight the extent to which a gross yield can range significantly from a quoted ‘spot‘ gross (net initial) yield figure.
TRANSACTION COSTS - TAXES AND PROFESSIONAL FEES
Every transaction carries with it costs and fees, which are not accounted for in a gross (net initial) yield.
In all markets a percentage fee will be paid towards agents/advisors and fixed fees are payable towards legal advisors as part of due diligence and other deal costs. Depending on the size of the deal this will typically range from 0.15% for large deals up to 2% for small lot sizes.
In addition, other taxation costs – notably LCGT, property and other transfer taxes - may apply which could significantly alter the price position.
CAPITAL GAINS TAX
Depending on the legal structure of the transaction, the actual incidence of LCGT can be, and is often, diversified. This depends on whether a transaction is conducted as either:
> an ‘asset’ deal i.e. the sale of the actual physical property, or
> a ‘share’ deal i.e. the sale of shares of the special purpose vehicle (SPV) in which the physical asset is held.
In asset deals, taxes are always crystallised as a result of the transaction closing. In share deals, the SPV structure is created to utilise the numerous planning opportunities and exemptions available in most tax jurisdictions in order to defer away or minimise any such crystallisation of taxes on the sale.
The chart opposite highlights the extent to which share deals have been by far the most popular form of investment vehicle across the region for the past ten years. In almost every year, bar 2009, shares have been the preferred medium for property investment trading in the region.
Tax, however, doesn’t go away. All you can do is defer it. That is why it is prudent for the pricing of any share deal to always account for an LCGT provision.
In order to highlight the impact that LCGT may have on investment pricing in different markets, we have created scenarios of how LCGT can impact on a yield on an ‘identical’ hypothetical prime office deal in the markets of Warsaw and Budapest.
EASTERN EUROPE RESEARCH | YIELDS AND CAPITAL GAINS TAX
COLLIERS INTERNATIONAL | P. 5
Source: PWC/Colliers International
Source: Colliers International
* for Hungary, the 10% rate applies up to ca. €1.7million,19% for the residual value above the €1.7million.
** typically carries a transfer tax equivalent of 2-3% *** variable rates apply for Romania **** set to decrease from 2012
TAX RATES BY COUNTRY
FIG 3. CEE: SHARE VS. ASSET DEALS
Country CIT/CGT Stamp Duty/ Transfer Tax
Bulgaria 10% 0.1% - 3%
Czech Rep. 19% 3%
Hungary 10-19%* 4%**
Poland 19% 0%
Romania 16% ***
Slovakia 19% 0%
Ukraine 23% **** 1-2%
2011
2010
2009
2008
2007
2006
2005
2004
2003
2002
2001
2000
1999
0% 50% 100%
Share Deals Asset Deals
JANUARY 2012

WARSAW - PRIME OFFICE EXAMPLEIn order to highlight the impact that LCGT liability may have on investment pricing, we have developed three scenarios for the sale of a prime office building in Warsaw. Each scenario is based on a ‘hypothetical’ transaction being conducted for the same property, but differs according to the balance of the market (in favour of vendors or purchasers); and the type of legal structure used for the transaction i.e. share or asset deal.
The specifics of the deal are identified in the Property Particulars table, opposite. Essentially this deal would create a capital gain of € 16.8 million for the vendor, which in turn would generate a capital gains tax liability of € 3.2 million (at a CGT rate of 19.0%).
Firstly, let’s consider the position of the seller as to what is most ideal for them. Ultimately they want the highest price and capital return they can achieve, so how they configure their LCGT (and other tax) obligations will be a big part of this.
Secondly, even though any LCGT is non-payable using the share/SPV structure, the current/future owner must consider that at some point in time they may/will have to pay the CGT owed.
SCENARIO 1: BUYERS’ MARKET, SHARE DEAL
Negotiations take place when market conditions are most favourable to the buyer. As a result, the buyer can command a sizeable discount to the purchase price in lieu of the LCGT liability they are likely to face, as owners, in future. It is not, however, such a strong buyers market allowing them to cajole the vendor into an asset deal.
In this instance, the vendor agrees to assume 80% of the latent capital gains tax liability. This equates to a discount of € 2.56 million off the purchase price.
In yield terms, the subsequent re-pricing softens the yield by 32 basis points, equating to a new ‘LCGT net’ yield of 6.82%.
SCENARIO 2: BALANCED MARKET, SHARE DEAL
In scenario 2, negotiations take place in a more balanced market such as those of most of 2011. In this case the buyer and seller agree to split the potential LCGT liability 50/50, resulting in a pricing discount for the buyer.
The subsequent re-pricing softens the yield by 20 basis points, equating to a new ‘LCGT net’ yield of 6.70%.
SCENARIO 3: SELLERS’ MARKET, SHARE DEAL
Going back to the good old days of 2005-2007is the last time we had classic (aggressive) sellers markets. ‘Gross prime yields’ were down to sub 6% and vendors were able to offer no LCGT discount to purchasers in the market.
It is unlikely we will see such circumstances again for some time, but if we did – as per this example - the vendor would seek to maximise the sum received from the sale of the property and effectively pass the entire LCGT liability position on to the buyer.
In effect the purchaser pays a flat gross yield of 6.5%, as they are in no position to negotiate a discount – there is no yield spread at all. On the other hand no premium is payable either (although there were some examples of buyers paying premiums in the market at the time, but these were one-off cases).
However, it is worth considering that the purchaser has actually inherited a €3.2million ‘hidden premium’ comprised of the existing LCGT liability. In future if they cannot pass this on to the next purchaser, or at least part of it (which will be partly determined by the balance of the market at the time), the worst case scenario for the purchaser is that they have paid an effective net yield of 6.14% taking into account this hidden premium.
SUMMARY
While the total yield spread from these three scenarios is only 32 basis points, this still represents a fair quantum of cash. If we take into account the ‘hidden premium’ factor, the spread could be as much as 69 basis points from this deal.
EASTERN EUROPE RESEARCH | YIELDS AND CAPITAL GAINS TAX
COLLIERS INTERNATIONAL | P. 6
CALCULATING LCGT LIABILITIES
Source: PWC/Colliers International
Scenario 1: Buyers’ Market
> Share deal
> Seller accepts an 80% LCGT discount
> Effective Discount: € 2.56 million
> Yield Impact: 6.82%
Scenario 2: Balanced Market
> Share deal
> Seller accepts a 50% LCGT discount
> Effective Discount: € 1.6 million
> Yield Impact: 6.70%
Scenario 3: Sellers’ Market
> Share deal
> No discount/premium applicable
> Yield remains: 6.5%
> *Hidden premium of €3.2million (reduces actual yield to 6.14%)
Property Particulars
Gross (Net Initial) Yield 6.5%
Net Operating Income € 3.5 million p.a.
Remaining Lease Term 5 years
Purchase Value € 53.8 million
Book Value € 37.0 million
Capital Gain € 16.8 million
Capital Gains Tax Rate: 19.0%
Capital Gains Tax Liability € 3.2 million
JANUARY 2012
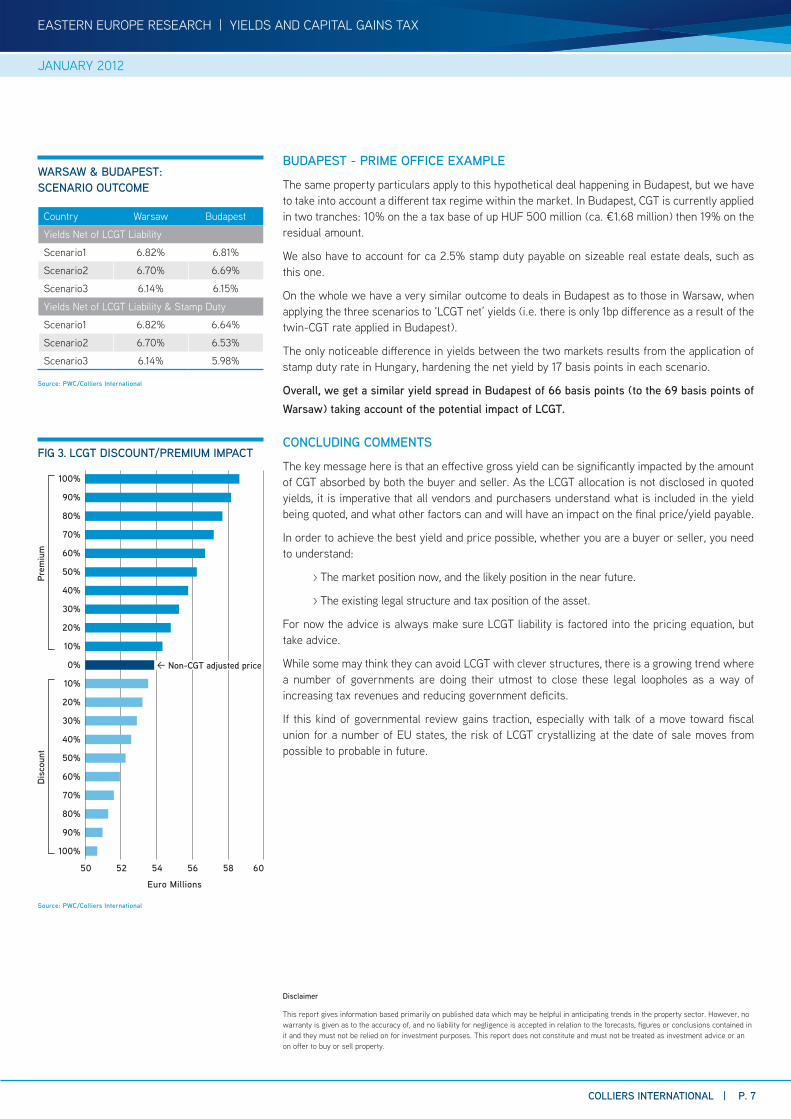
BUDAPEST - PRIME OFFICE EXAMPLE
The same property particulars apply to this hypothetical deal happening in Budapest, but we have to take into account a different tax regime within the market. In Budapest, CGT is currently applied in two tranches: 10% on the a tax base of up HUF 500 million (ca. €1.68 million) then 19% on the residual amount.
We also have to account for ca 2.5% stamp duty payable on sizeable real estate deals, such as this one.
On the whole we have a very similar outcome to deals in Budapest as to those in Warsaw, when applying the three scenarios to ‘LCGT net’ yields (i.e. there is only 1bp difference as a result of the twin-CGT rate applied in Budapest).
The only noticeable difference in yields between the two markets results from the application of stamp duty rate in Hungary, hardening the net yield by 17 basis points in each scenario.
Overall, we get a similar yield spread in Budapest of 66 basis points (to the 69 basis points of Warsaw) taking account of the potential impact of LCGT.
CONCLUDING COMMENTS
The key message here is that an effective gross yield can be significantly impacted by the amount of CGT absorbed by both the buyer and seller. As the LCGT allocation is not disclosed in quoted yields, it is imperative that all vendors and purchasers understand what is included in the yield being quoted, and what other factors can and will have an impact on the final price/yield payable.
In order to achieve the best yield and price possible, whether you are a buyer or seller, you need to understand:
> The market position now, and the likely position in the near future.
> The existing legal structure and tax position of the asset.
For now the advice is always make sure LCGT liability is factored into the pricing equation, but take advice.
While some may think they can avoid LCGT with clever structures, there is a growing trend where a number of governments are doing their utmost to close these legal loopholes as a way of increasing tax revenues and reducing government deficits.
If this kind of governmental review gains traction, especially with talk of a move toward fiscal union for a number of EU states, the risk of LCGT crystallizing at the date of sale moves from possible to probable in future.
Disclaimer
This report gives information based primarily on published data which may be helpful in anticipating trends in the property sector. However, no warranty is given as to the accuracy of, and no liability for negligence is accepted in relation to the forecasts, figures or conclusions contained in it and they must not be relied on for investment purposes. This report does not constitute and must not be treated as investment advice or an on offer to buy or sell property.
EASTERN EUROPE RESEARCH | YIELDS AND CAPITAL GAINS TAX
COLLIERS INTERNATIONAL | P. 7
WARSAW & BUDAPEST: SCENARIO OUTCOME
FIG 3. LCGT DISCOUNT/PREMIUM IMPACT
Source: PWC/Colliers International
Source: PWC/Colliers International
Country Warsaw Budapest
Yields Net of LCGT Liability
Scenario1 6.82% 6.81%
Scenario2 6.70% 6.69%
Scenario3 6.14% 6.15%
Yields Net of LCGT Liability & Stamp Duty
Scenario1 6.82% 6.64%
Scenario2 6.70% 6.53%
Scenario3 6.14% 5.98%
100%
90%
80%
70%
60%
50%
40%
30%
20%
10%
0%
10%
20%
30%
40%
50%
60%
70%
80%
90%
100%
Prem
ium
Disc
ount
Non-CGT adjusted price
50 52 54 56 58 60
Euro Millions
JANUARY 2012

EASTERN EUROPE RESEARCH | YIELDS AND CAPITAL GAINS TAX
COLLIERS INTERNATIONAL | P. 8
512 offices in 61 countries on 6 continentsUnited States: 125Canada: 38Latin America: 18Asia Pacific: 214EMEA: 117
• $1.5 billion in annual revenue
• 978.6 million square feet under management
• Over 12,500 professionals
The information contained herein has been obtained from sources deemed reliable. While every reasonable effort has been made to ensure its accuracy, we cannot guarantee it. No responsibility is assumed for any inaccuracies. Readers are encouraged to consult their professional advisors prior to acting on any of the material contained in this report.
Damian Harrington, MRICS; MSc Regional Director - Research & ConsultingCEE Investment Services Eastern Europe Regional Team
Colliers InternationalGalerie Mysak Vodickova 710/31 Prague 1, 11000 Czech Republic
TEL +420 226 537 624 FAX +420 226 013 579 EMAIL [email protected]
CENTRAL & EASTERN EUROPE - INVESTMENT SERVICESColliers International’s elite team of investment sales specialists see beyond the bricks and mortar to analyse how property acquisition, ownership and disposition can accelerate the success of your financial portfolio.
We work with national and global institutions and investors to identify, evaluate and select assets that best complement their portfolio, property performance, income goals, and risk profile.
This often requires complex analysis and innovative thinking to provide a defensible, well-researched strategy for asset acquisition. When the time is right for disposition, we provide a clear competitive analysis and transaction history of comparable assets to maximise the property’s momentum in the market.
Through our best-in-class marketing technology and our creative approach, we drive strong investor interest in properties. At the same time, we work with you to preserve confidentiality, minimise disruption to tenants and prevent surprises in the due diligence process.
Through our integrated platform, we offer owners debt placement, valuation and advisory services, property assessment and management, development strategy and project management services to increase the asset’s income stream and overall value.
Our proven system of investment sales takes into account each investor’s unique priorities and weighted concerns for price, closure and risk. The outcome of our specialized approach is strategic development of the property’s competitive profile, speed to market and careful negotiation to ensure a smooth closure and investment return.
COLLIERS RESEARCHKnowledge is a critical part of the service we offer our clients, and research is a key component of this knowledge.
Our research teams work in partnership with our service professionals to provide clients with the market intelligence required to support practical business decisions and provide
multi-level support across all property types, ranging from data collection to comprehensive market analysis.
Our expansive databases house detailed information on properties nationally, regionally and globally, including historical supply, demand, and absorption data, as well as leasing and investment transaction comparables.
From this data, our research analysts produce quarterly reports on products and market conditions in virtually every major market. We combine this information with forward thinking expertise to deliver more than what is readily available in terms of market data, including custom reports based on your specific needs. This approach helps you respond to current conditions and plan for the future.
RESEARCH WHITE PAPERSColliers eastern European research team has been working on a number of articles, reports and white papers on all matter of events impacting the real estate market. Topics we have covered include:
> The future role of Banking and the impact on the real estate industry
> Generational change and the impact on office space demand and supply
> The market positioning of the Business Process Outsourcing industry in eastern Europe – scope for change and growth and the impact on real estate.
> Infrastructure change and the impact on the logistics industry, and logistics space demand
Feel free to get in touch if you would like to know more.
JANUARY 2012
EASTERN EUROPE RESEARCH | YIELDS AND CAPITAL GAINS TAX
COLLIERS INTERNATIONAL | P. 9
Updated 6-2011
ST. PETERSBURGTALLINN
RIGA
VILNIUS
MINSK
KYIV
WARSAWWROCLAW
KRAKOWPRAGUE
BRATISLAVA
BUDAPEST
ZAGREBBELGRADE BUCHAREST
SOFIA
TIRANA
ATHENS
PODGORICANIS
MOSCOW
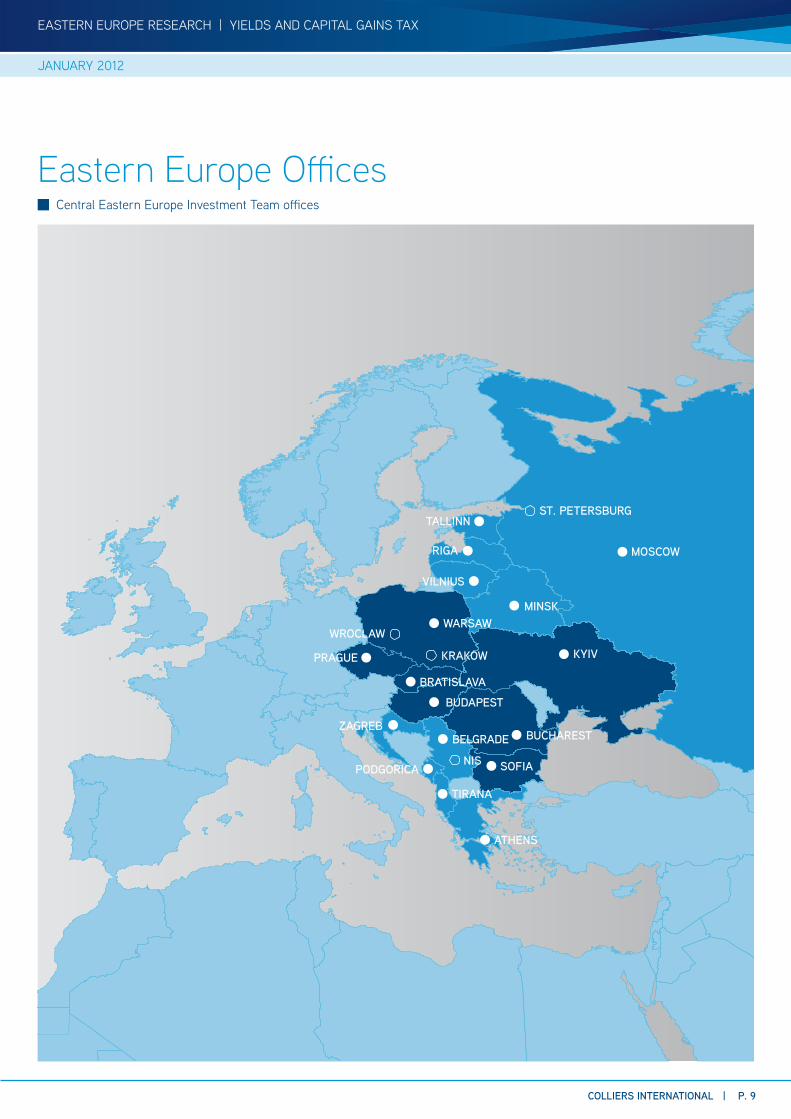
Eastern Europe Offices Central Eastern Europe Investment Team offices
JANUARY 2012

EASTERN EUROPE RESEARCH | YIELDS AND CAPITAL GAINS TAX
COLLIERS INTERNATIONAL | P. 10
JANUARY 2012
Glen LoniePartnerPrague
TEL +420 2 5115 2619FAX +420 2 5115 7619EMAIL [email protected]
Richard JonesDirectorPrague
TEL +420 251 152 161FAX +420 251 157 161EMAIL [email protected]
About PwC
PwC firms help organisations and individuals create the value they’re looking for. We’re a network of firms in 158 countries with close to 169,000 people who are committed to delivering quality in assurance, tax and advisory services. Tell us what matters to you and find out more by visiting us at www.pwc.com.
PwC’s real estate team advises listed and private property companies, developers, real estate investment funds, banks, occupiers and public sector organisations. We provide a range of integrated, specialist assurance, tax, legal and advisory services to help our clients deal effectively with their property requirements - for example, by tax efficient fund structuring, assistance with finance and transaction execution, dealing with regulatory issues and reporting requirements, providing assurance on financial data, advising on cost mitigation projects and occupational estate strategies as well as restructuring and workout.
www.pwc.cz/realestate

Accelerating success.www.colliers.com