Embed Size (px)
Citation preview
YYeeaarr 77 TTeerrmm 44
Name SOLUTION (TEACHER’S COPY)
Class
Centre
Ver.006121
© XJS Coaching School Page 2 2016 version 1
Course Outline Year 7 Term 4
© XJS Coaching School Page 3 2016 version 1
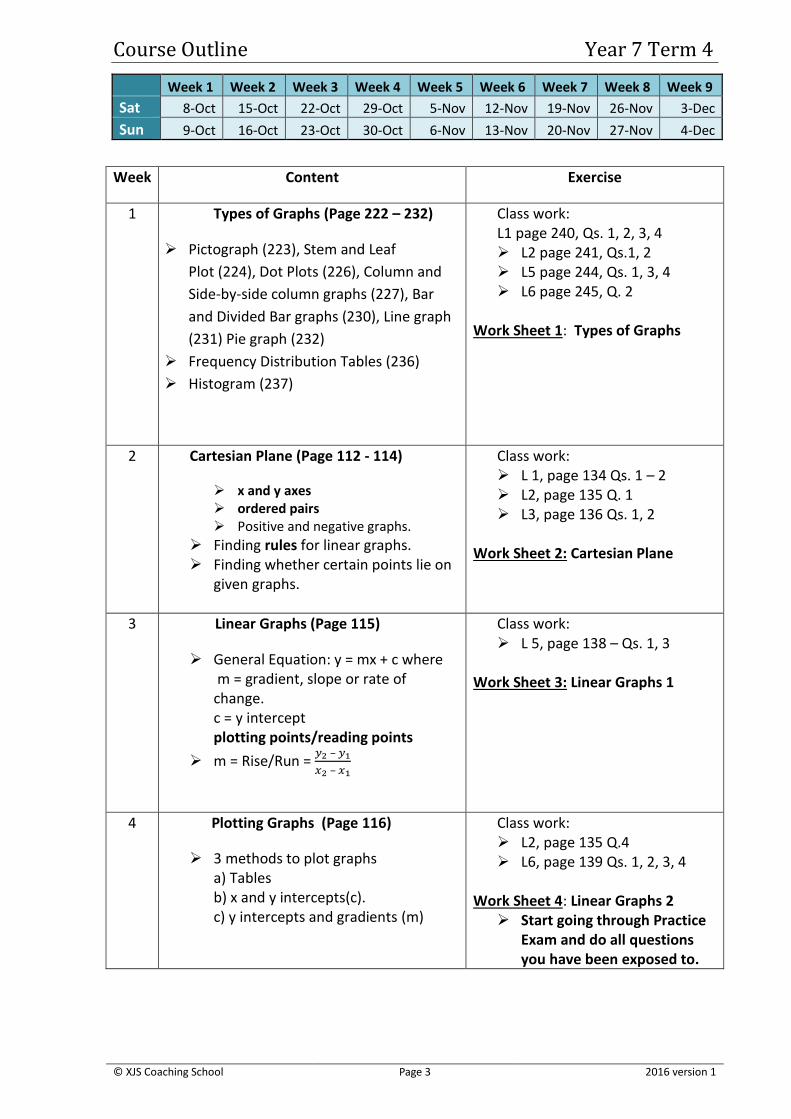
Week 1 Week 2 Week 3 Week 4 Week 5 Week 6 Week 7 Week 8 Week 9
Sat 8-Oct 15-Oct 22-Oct 29-Oct 5-Nov 12-Nov 19-Nov 26-Nov 3-Dec
Sun 9-Oct 16-Oct 23-Oct 30-Oct 6-Nov 13-Nov 20-Nov 27-Nov 4-Dec
Week Content Exercise
1 Types of Graphs (Page 222 – 232)
➢ Pictograph (223), Stem and Leaf
Plot (224), Dot Plots (226), Column and
Side-by-side column graphs (227), Bar
and Divided Bar graphs (230), Line graph
(231) Pie graph (232)
➢ Frequency Distribution Tables (236)
➢ Histogram (237)
Class work: L1 page 240, Qs. 1, 2, 3, 4 ➢ L2 page 241, Qs.1, 2 ➢ L5 page 244, Qs. 1, 3, 4 ➢ L6 page 245, Q. 2
Work Sheet 1: Types of Graphs
2 Cartesian Plane (Page 112 - 114)
➢ x and y axes ➢ ordered pairs ➢ Positive and negative graphs.
➢ Finding rules for linear graphs. ➢ Finding whether certain points lie on
given graphs.
Class work: ➢ L 1, page 134 Qs. 1 – 2 ➢ L2, page 135 Q. 1 ➢ L3, page 136 Qs. 1, 2
Work Sheet 2: Cartesian Plane
3 Linear Graphs (Page 115)
➢ General Equation: y = mx + c where m = gradient, slope or rate of change. c = y intercept plotting points/reading points
➢ m = Rise/Run = 𝑦2 – 𝑦1
𝑥2 – 𝑥1
Class work: ➢ L 5, page 138 – Qs. 1, 3
Work Sheet 3: Linear Graphs 1
4 Plotting Graphs (Page 116)
➢ 3 methods to plot graphs a) Tables b) x and y intercepts(c). c) y intercepts and gradients (m)
Class work: ➢ L2, page 135 Q.4 ➢ L6, page 139 Qs. 1, 2, 3, 4
Work Sheet 4: Linear Graphs 2
➢ Start going through Practice Exam and do all questions you have been exposed to.
Course Outline Year 7 Term 4
© XJS Coaching School Page 4 2016 version 1
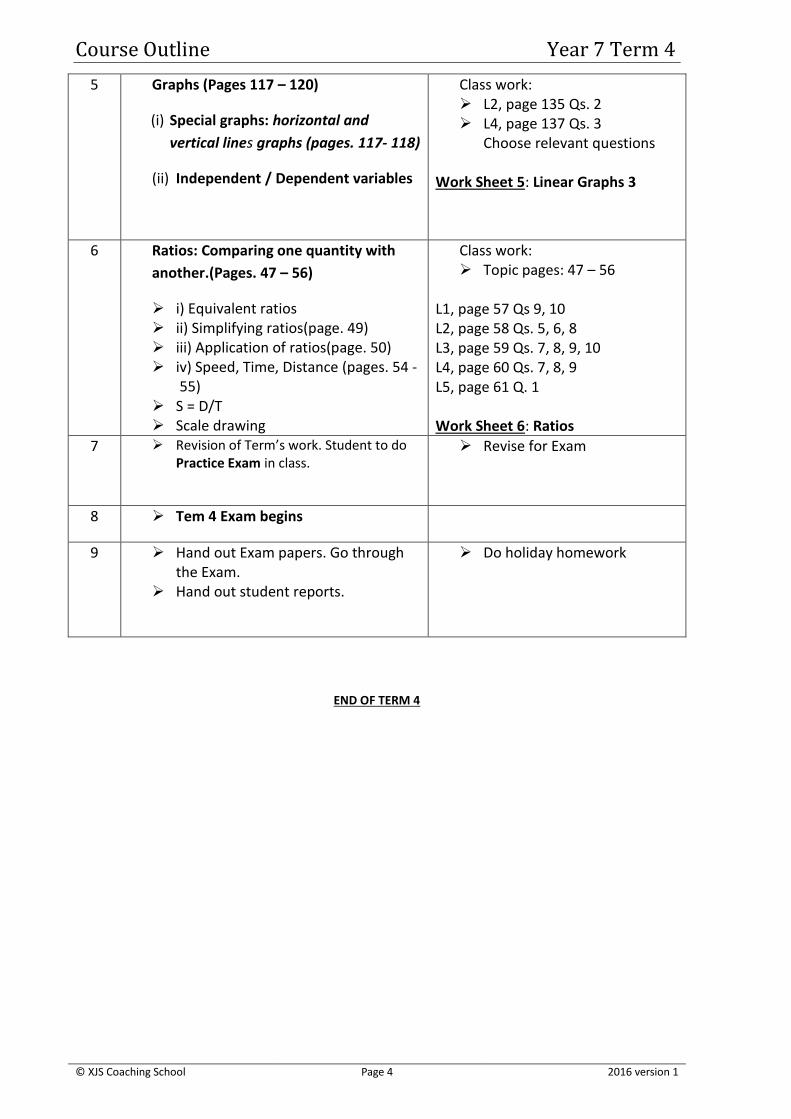
5 Graphs (Pages 117 – 120)
(i) Special graphs: horizontal and
vertical lines graphs (pages. 117- 118)
(ii) Independent / Dependent variables
Class work: ➢ L2, page 135 Qs. 2 ➢ L4, page 137 Qs. 3
Choose relevant questions Work Sheet 5: Linear Graphs 3
6 Ratios: Comparing one quantity with
another.(Pages. 47 – 56)
➢ i) Equivalent ratios ➢ ii) Simplifying ratios(page. 49) ➢ iii) Application of ratios(page. 50) ➢ iv) Speed, Time, Distance (pages. 54 -
55) ➢ S = D/T ➢ Scale drawing
Class work: ➢ Topic pages: 47 – 56
L1, page 57 Qs 9, 10 L2, page 58 Qs. 5, 6, 8 L3, page 59 Qs. 7, 8, 9, 10 L4, page 60 Qs. 7, 8, 9 L5, page 61 Q. 1 Work Sheet 6: Ratios
7 ➢ Revision of Term’s work. Student to do Practice Exam in class.
➢ Revise for Exam
8 ➢ Tem 4 Exam begins
9 ➢ Hand out Exam papers. Go through the Exam.
➢ Hand out student reports.
➢ Do holiday homework
END OF TERM 4

Worksheet 1 Types of Graphs Year 7 Term 4
© XJS Coaching School Page 5 2016 version 1
Name: ______SOLUTION_________ Date:_________
1 Use the column chart beside to answer the
following questions.
(a) How many students attend the Summer Camps? 18 students
(b) What is the title of the graph? Summer Camp Sign-ups
(c) Which summer camp is the most popular? The band
2 Use the chart beside to answer the following
questions.
(a) What type of graph is this referred to? Bar Graph
(b) What is the total number of sales? 55 items
(c) What item is the most popular interms of sales? The binder
3 Answer the following questions
(a) Which type of graph would best show the number of water bottles sold at four different stores, if water bottles come in packs of 20?
Pictograph
(b) What kind of graph would you use to represent the annual number of vehicle fatalities in your state for the last 10 years? Line graph
(c) What kind of graph would you use to represent the proportion of students in your class by their one most favourite subject? Pie Chart
Key words: Types of Graphs (pages 222 – 232)
➢ Pictograph,(p. 223) ➢ Column graph,(p. 227) ➢ Bar graph,(p. 230) ➢ Pie graph, (p. 232) ➢ Line graph(p. 231)

Worksheet 1 Types of Graphs Year 7 Term 4
© XJS Coaching School Page 6 2016 version 1
4 For a class project, students in Mr. Shaw's biology
course counted the number of red and grey
squirrels at each of the local parks.
Use the data in the table to construct a side by
side column graph on the right. (Don’t forget to
include your Legend)
Squirrels in town parks
Park Grey squirrel Red squirrel
Pinecone Park 70 80
Almond Park 100 100
Acorn Park 80 90
Oak Park 90 60
5 Chef Carlson teaches a cooking class to kids on the weekend. Last class, he showed his students a
bowl of melted butter. He asked them, "How many sticks of butter do you think I melted in order to
get this much melted butter?" He recorded their guesses on the board.
Amount of butter (sticks) guessed by
Ali Ben Cay Din Eli Fil Gigi Hin Ida Joe Kim Lye Min Nic Oji
43
4 4
3
4 4
1
4 2
3
4 2
3
4 3
1
2 3 4
1
2 3
1
4 4
3
4 3 4 3 4
1
2 3
Use the data in the list to complete the line plot below.
6 Kevin counted the number of desks in all the
classrooms in his school. He then drew up a stem
and leaf plot with the data he collected and
present it as follows:
Desks per classroom
Stem Leaf
1 4 7 7 7
2 4 5 5 6 7 7 8
3 0 0 9
4 1 4 7 9
(a) How many classrooms are there in his
school?
18
(b) What is the most common number of
desks in each classroom?
17
(c) How many classroom(s), if any, have at
least 30 desks?
7
(d) What is the difference between the most
number desks in a classroom with one
with the least?
49 – 14 = 35
(e) How many classrooms, if any, have
exactly 7 desks?
None
Grey Squirrel
Red Squirrel
Legend
Worksheet 1 Types of Graphs Year 7 Term 4
© XJS Coaching School Page 7 2016 version 1
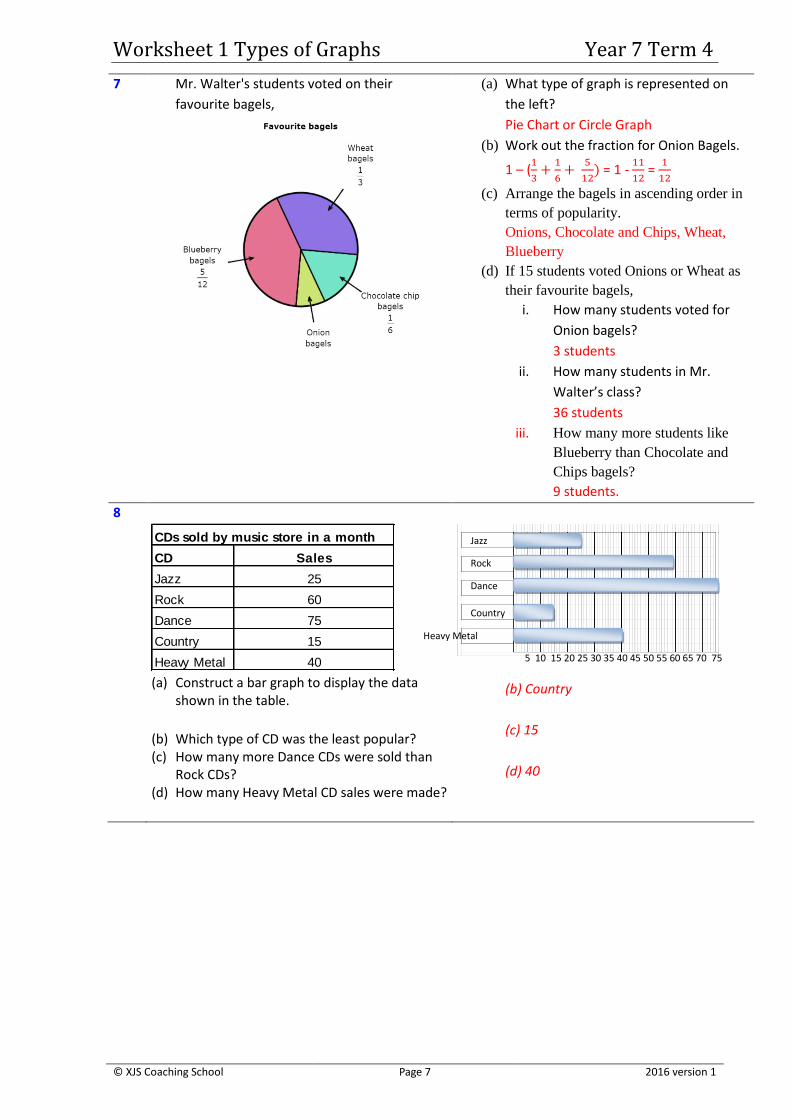
7 Mr. Walter's students voted on their
favourite bagels,
(a) What type of graph is represented on
the left?
Pie Chart or Circle Graph
(b) Work out the fraction for Onion Bagels.
1 – (1
3+
1
6+
5
12) = 1 -
11
12 =
1
12
(c) Arrange the bagels in ascending order in
terms of popularity.
Onions, Chocolate and Chips, Wheat,
Blueberry
(d) If 15 students voted Onions or Wheat as
their favourite bagels,
i. How many students voted for
Onion bagels?
3 students
ii. How many students in Mr.
Walter’s class?
36 students
iii. How many more students like
Blueberry than Chocolate and
Chips bagels?
9 students.
8
CDs sold by music store in a month
CD Sales
Jazz 25
Rock 60
Dance 75
Country 15
Heavy Metal 40 (a) Construct a bar graph to display the data
shown in the table.
(b) Which type of CD was the least popular? (c) How many more Dance CDs were sold than
Rock CDs? (d) How many Heavy Metal CD sales were made?
(b) Country
(c) 15
(d) 40
Heavy Metal
5 10 15 20 25 30 35 40 45 50 55 60 65 70 75
Country
Dance
Rock
Jazz
Worksheet 1 Types of Graphs Year 7 Term 4
© XJS Coaching School Page 8 2016 version 1
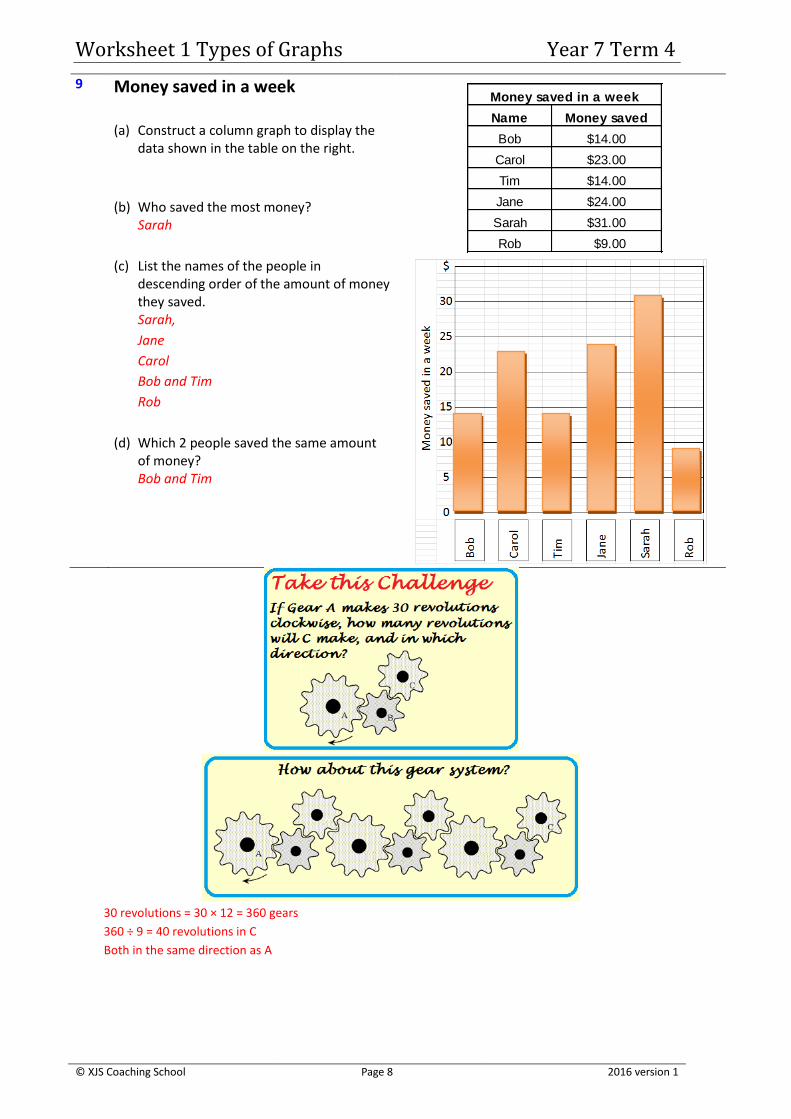
9 Money saved in a week
(a) Construct a column graph to display the data shown in the table on the right.
(b) Who saved the most money? Sarah
(c) List the names of the people in descending order of the amount of money they saved. Sarah,
Jane
Carol
Bob and Tim
Rob
(d) Which 2 people saved the same amount of money? Bob and Tim
30 revolutions = 30 × 12 = 360 gears
360 ÷ 9 = 40 revolutions in C
Both in the same direction as A
Money saved in a week
Name Money saved
Bob $14.00
Carol $23.00
Tim $14.00
Jane $24.00
Sarah $31.00
Rob 0$9.00
Worksheet 2 Linear Graphs 1 Year 7Term 4
© XJS Coaching School Page 9 2016 version 1
Name: ______SOLUTION_________ Date:_______
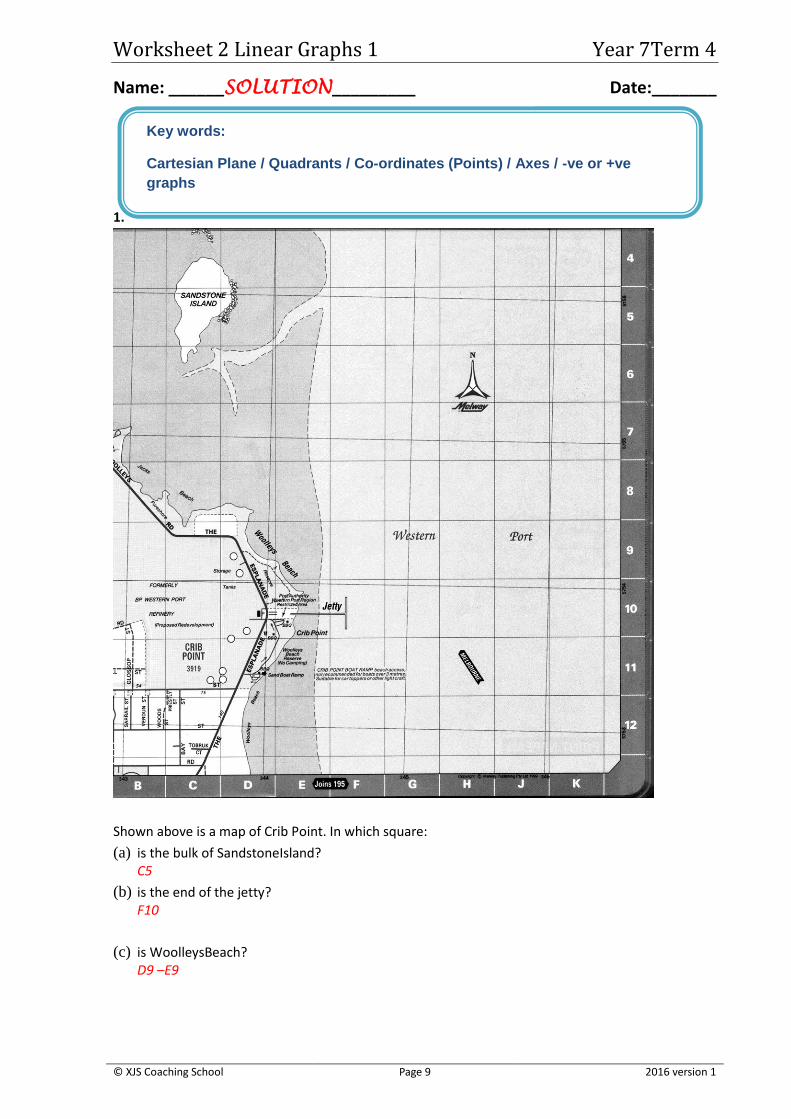
1.
Shown above is a map of Crib Point. In which square:
(a) is the bulk of SandstoneIsland? C5
(b) is the end of the jetty? F10
(c) is WoolleysBeach? D9 –E9
Key words:
Cartesian Plane / Quadrants / Co-ordinates (Points) / Axes / -ve or +ve
graphs
Worksheet 2 Linear Graphs 1 Year 7Term 4
© XJS Coaching School Page 10 2016 version 1
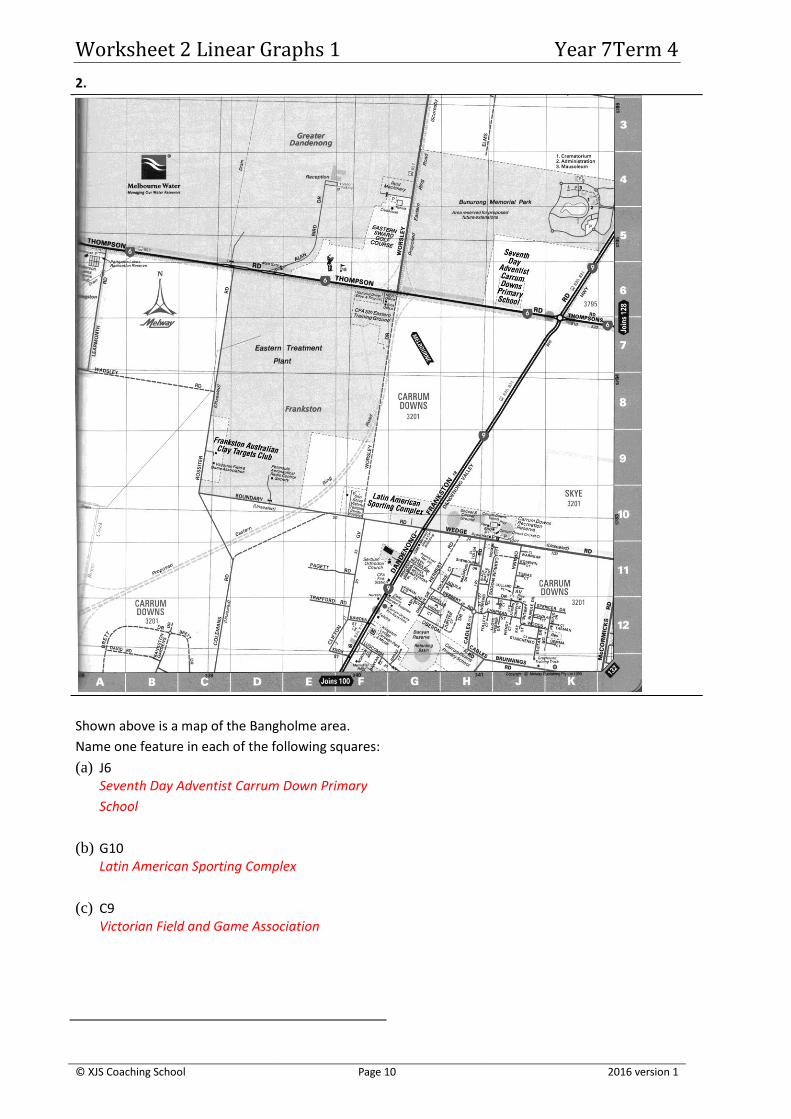
2.
Shown above is a map of the Bangholme area.
Name one feature in each of the following squares:
(a) J6 Seventh Day Adventist Carrum Down Primary
School
(b) G10 Latin American Sporting Complex
(c) C9 Victorian Field and Game Association

Worksheet 2 Linear Graphs 1 Year 7Term 4
© XJS Coaching School Page 11 2016 version 1
3. Label the axes with the right units as fully as possible in the Cartesian plane below. Put x and y correctly in the Cartesian plane.
4.
Place the following points on the Cartesian plane shown above.
(a) A (5, 3)
(b) B (2, 2)
(c) C (4, 1)
(d) D (0, 3)
(e) E (2, 4)
5. Give the Cartesian coordinates for the following points marked A to E in the figure below.
A (3, 4)
B (2, 0)
C (1, 5)
D (5, 2)
E (0, 3)
6. State whether the following are true or false:
(a) (0, 5) and (5, 0) lie on the same vertical line False
(b) (8, 3) and (8, 1) lie on the same vertical line True
(c) (4, 4) and (3, 4) lie on the same horizontal line. True

Worksheet 2 Linear Graphs 1 Year 7Term 4
© XJS Coaching School Page 12 2016 version 1
7. Give two Cartesian points which have the same x-coordinate. Answer may vary, but the x-coordinate must be the same (8, -2) and (8, 29)
8. List the points on the Cartesian plane which have been joined to make the following shape.
(5, 2) -> (7, 2) -> (7, 5) -> (5, 5) -> (4, 7) -> (2, 7) -> (2, 0) ->(4,
0) -> (5, 2)
9. Give
(a) two points which would lie on a common horizontal line on the Cartesian plane; Answer may vary, but the y-coordinate must be the same (8, -2) and (0, -2)
(b) two points which would lie on a vertical line on the Cartesian plane. Answer may vary, but the x-coordinate must be the same (8, -2) and (8, 29)
10. State whether the following linear graphs are positive (P) or negative (N)? (a) y = 2x (b) y = 5 + 3x (c) y = - 4x (d) y = 6 – 3x
Positive Positive Negative Negative
(e) y – 4x = 5 (f) y + 6 = 10x (g) y -7 = ½ x
(h) y + 5x -7 = 0
Positive Positive Positive Negative
11. State whether the following graphs are +ve (positive) or –ve (negative)?
Positive
Positive
Negative
zero undefined Negative
Worksheet 3 Linear Graphs 2 Year 7 Term 4
© XJS Coaching School Page 13 2016 version 1
Name: ______SOLUTION_________ Date:_________
1. Find the gradient (m) and y-intercept(c) of the following linear equations:
a) y = 4x + 1 b) y = 3x – 5 c) 12
1 xy
m = 4
c =1
m = 3
c =-5
m = ½
c =- 1
d) y = -2x + 3.5 e) y = - 3.5x – 3 f) 2.25
2
xy
m = - 2
c = 3.5
m = - 3.5
c =- 3
m = - 2/5
c = 2.2
g) y - x = 6 h) y + 3 = 2x i) y – x – 1 = 0
m = 1
c = 6
m = 2
c =- 3
m = 1
c =1
j) 2y + 4 = 6x k) 3y – 5x + 12 = 0 l) – 5y + 10x = 4
m = 3
c =- 2
m = 5/3
c =- 4
m = 2
c =- 4/5
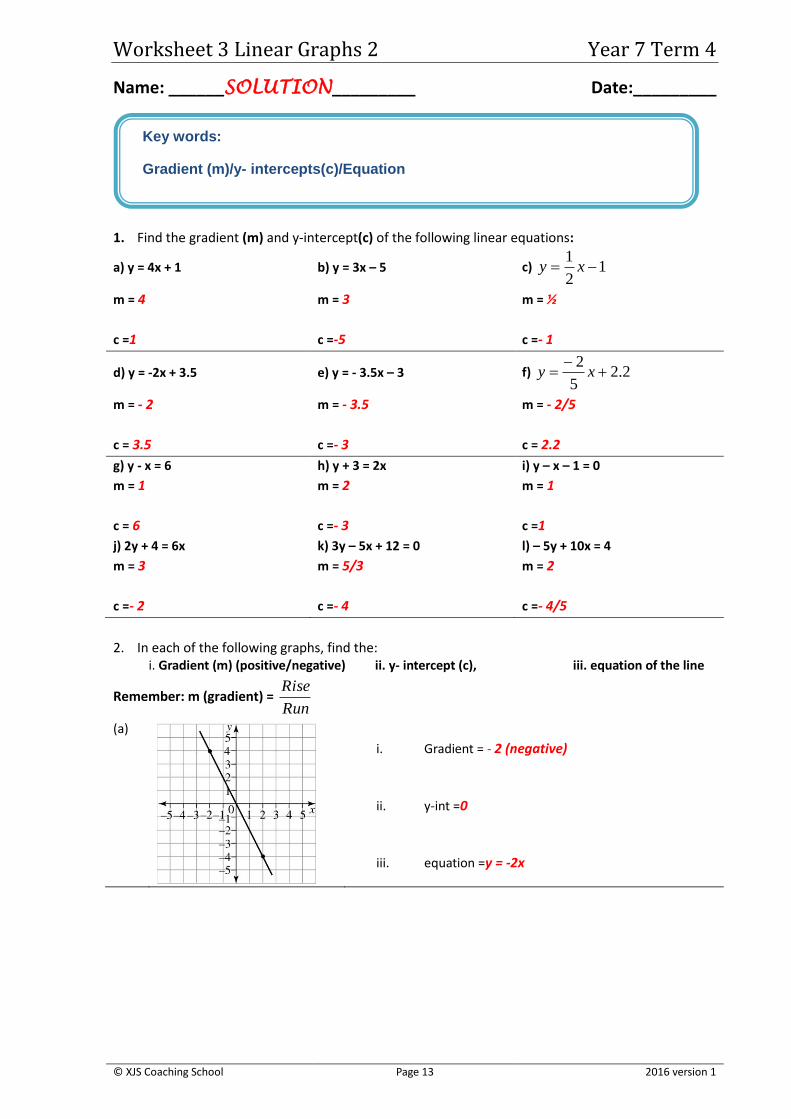
2. In each of the following graphs, find the: i. Gradient (m) (positive/negative) ii. y- intercept (c), iii. equation of the line
Remember: m (gradient) = Run
Rise
(a)
i. Gradient = - 2 (negative)
ii. y-int =0
iii. equation =y = -2x
Key words:
Gradient (m)/y- intercepts(c)/Equation
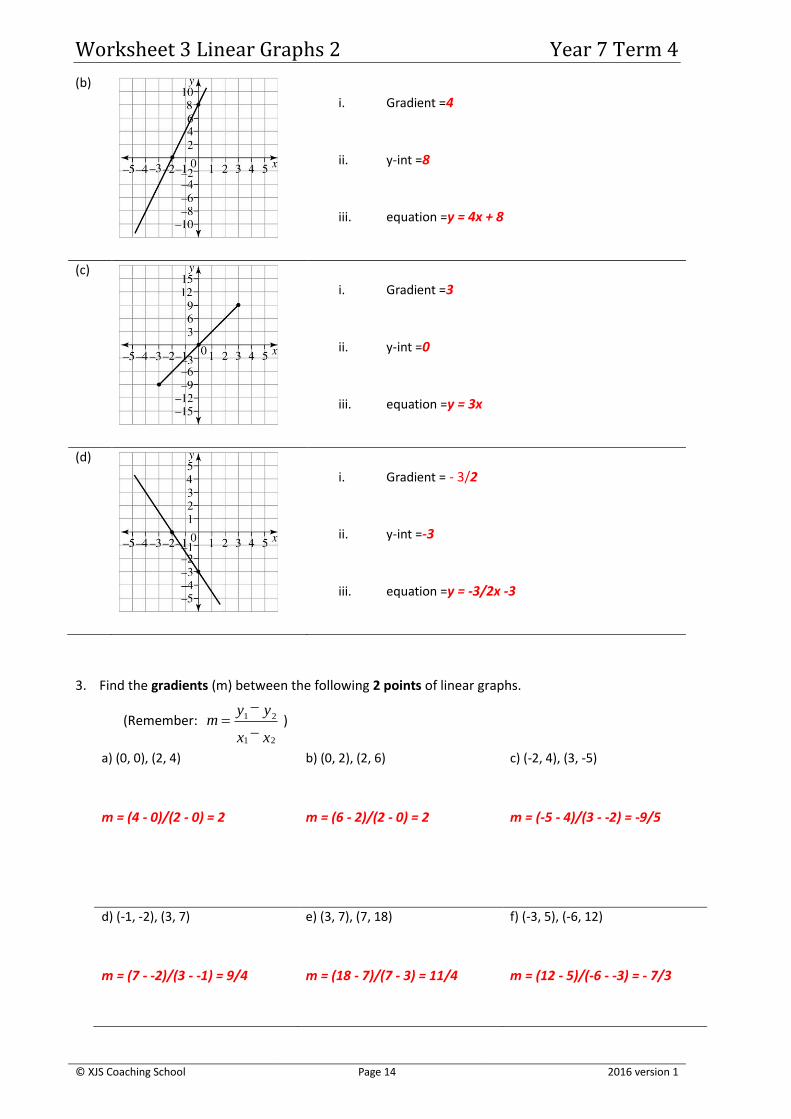
Worksheet 3 Linear Graphs 2 Year 7 Term 4
© XJS Coaching School Page 14 2016 version 1
(b)
i. Gradient =4
ii. y-int =8
iii. equation =y = 4x + 8
(c)
i. Gradient =3
ii. y-int =0
iii. equation =y = 3x
(d)
i. Gradient = - 3/2
ii. y-int =-3
iii. equation =y = -3/2x -3
3. Find the gradients (m) between the following 2 points of linear graphs.
(Remember: xx
yym
21
21
)
a) (0, 0), (2, 4) b) (0, 2), (2, 6) c) (-2, 4), (3, -5)
m = (4 - 0)/(2 - 0) = 2
m = (6 - 2)/(2 - 0) = 2
m = (-5 - 4)/(3 - -2) = -9/5
d) (-1, -2), (3, 7) e) (3, 7), (7, 18) f) (-3, 5), (-6, 12)
m = (7 - -2)/(3 - -1) = 9/4
m = (18 - 7)/(7 - 3) = 11/4
m = (12 - 5)/(-6 - -3) = - 7/3

Worksheet 3 Linear Graphs 2 Year 7 Term 4
© XJS Coaching School Page 15 2016 version 1
4. Circle the correct answer
The table of values for 43 xy is shown by: (Know your gradient (m) and y-intercept (c) first)
A 54321
21012
y
x D
97531
21012
y
x
B 107412
21012
y
x E
117415
21012
y
x
C 108642
21012
y
x
5. Find the rule of the linear graph by first finding the gradient and the y-intercept from the table: a)
X -1 0 1 2
Y 2 3 4 5
m =1
y-int =3 ∴ y= x + 3
b)
X -1 0 1 2
Y 2 1 0 -1
m =- 1
y-int =1 ∴ y= - x + 1
c)
X -1 0 1 2
Y -1.5 0.5 2.5 4.5
m =2
y-int =0.5 ∴ y= 2x + 0.5
d)
X -1 0 1 2
Y 3 0 -3 -6
m =- 3
y-int =0 ∴ y= - 3x
6. Use the tables in Q5 to draw the graphs of 5(a) and 5(b)
3
-3
y
x
1
1
y
x

Worksheet 3 Linear Graphs 2 Year 7 Term 4
© XJS Coaching School Page 16 2016 version 1
1. Gymnastics
2. Arts & Crafts
3. Drama
4. Tennis
5. Free Swim
6. Archery

Worksheet 4 Linear Graphs 3 Year 7 Term 4
© XJS Coaching School Page 17 2016 version 1
Name: ______SOLUTION_________ Date:_________
Q1.
a) Find the gradient of the line joining the points (1, 4) and (5, 9).
m = (9 – 4) / (5 – 1) = 5/4
b) Find the gradient of the line joining the points (-3, 4) and (5,-6).
m = (-6 – 4) / (5 – -3) = - 10/8 = - 5/4
c) Find the gradient of the rule 4x + 2y = 10
Make y the subject => y = -2x + 5, Hence m = - 2
d) Find the y intercept of the rule y = 4x – 3
y-int is the constant in the equation, hence c = -3
e) Find the gradient and y intercept for the rule: 2x + 3y – 6 = 0
Make y the subject => y = -2/3 x + 2, Hence m = - 2/3 and c = 2
Q2.
a) Determine the rule for the straight line with gradient = 2 and y intercept = 5.
y = 2x +5
b) Determine the rule for the straight line in which the x-intercept = 10 and y-intercept = -5.
x/10 – y/5 = 1 => x – 2y = 10 => y = ½ x -5
c) Determine the rule for the straight line passing through (-4, 10) and (10, 38). m = (38 – 10) / (10 - -4) = 2 => hence y = 2x + c. Substitute one of the point
10 = 2(-4) + c => c = 18
Hence the equation is y = 2x + 18
d) Determine the linear rule for the line passing through the origin and through the point (-5, 12). m = (12 – 0) / (-5 – 0) = -12/5
Hence the equation => y = -12/5 x or 5y + 12x = 0
Key words:
Gradient/x- and y- intercepts/points/plot/sketch/rules
Worksheet 4 Linear Graphs 3 Year 7 Term 4
© XJS Coaching School Page 18 2016 version 1
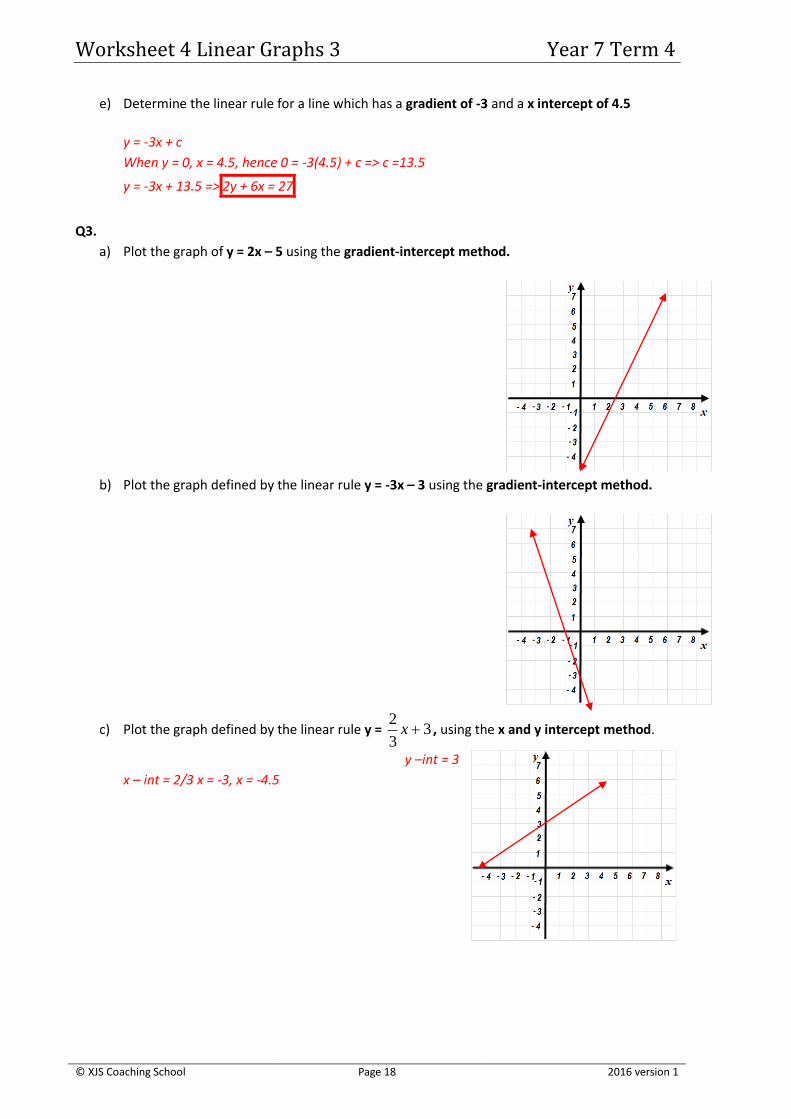
e) Determine the linear rule for a line which has a gradient of -3 and a x intercept of 4.5
y = -3x + c
When y = 0, x = 4.5, hence 0 = -3(4.5) + c => c =13.5
y = -3x + 13.5 => 2y + 6x = 27
Q3.
a) Plot the graph of y = 2x – 5 using the gradient-intercept method.
b) Plot the graph defined by the linear rule y = -3x – 3 using the gradient-intercept method.
c) Plot the graph defined by the linear rule y = 33
2x , using the x and y intercept method.
y –int = 3
x – int = 2/3 x = -3, x = -4.5
Worksheet 4 Linear Graphs 3 Year 7 Term 4
© XJS Coaching School Page 19 2016 version 1
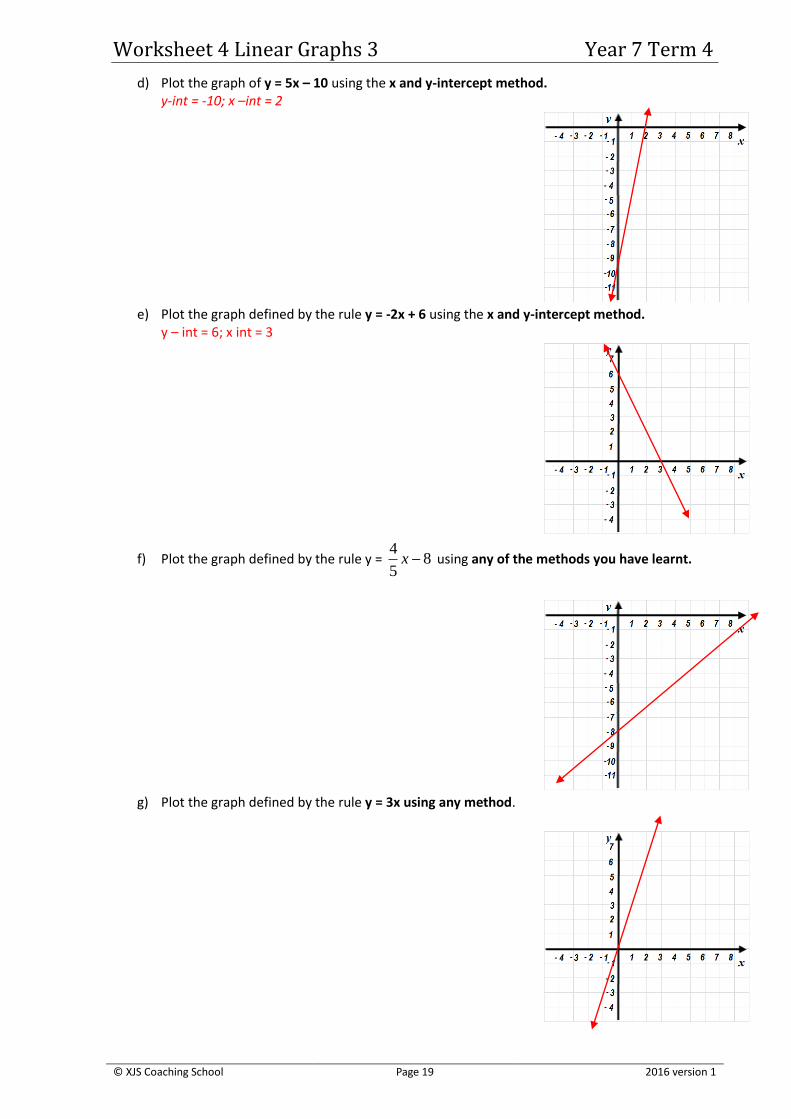
d) Plot the graph of y = 5x – 10 using the x and y-intercept method. y-int = -10; x –int = 2
e) Plot the graph defined by the rule y = -2x + 6 using the x and y-intercept method.
y – int = 6; x int = 3
f) Plot the graph defined by the rule y = 85
4x using any of the methods you have learnt.
g) Plot the graph defined by the rule y = 3x using any method.
Worksheet 4 Linear Graphs 3 Year 7 Term 4
© XJS Coaching School Page 20 2016 version 1
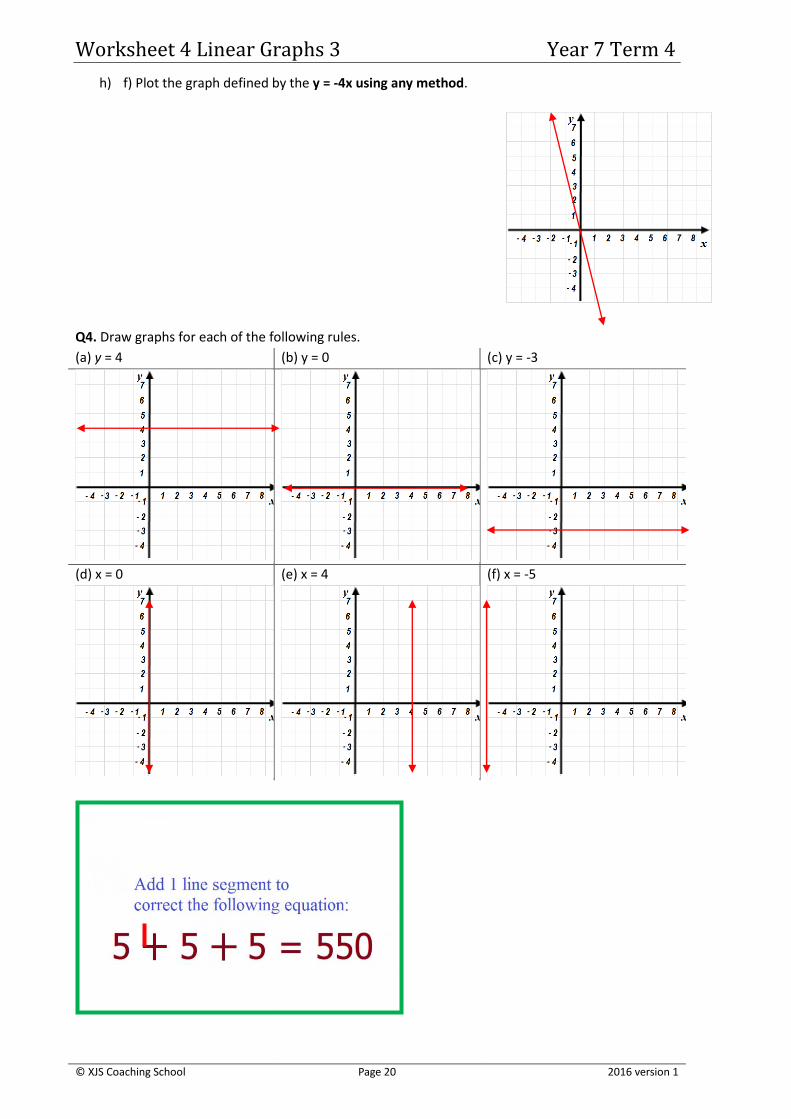
h) f) Plot the graph defined by the y = -4x using any method.
Q4. Draw graphs for each of the following rules.
(a) y = 4 (b) y = 0 (c) y = -3
(d) x = 0 (e) x = 4 (f) x = -5
Worksheet 5 Linear Graphs 4 Year 7 Term 4
© XJS Coaching School Page 21 2016 version 1
Name: ______SOLUTION_________ Date:_________
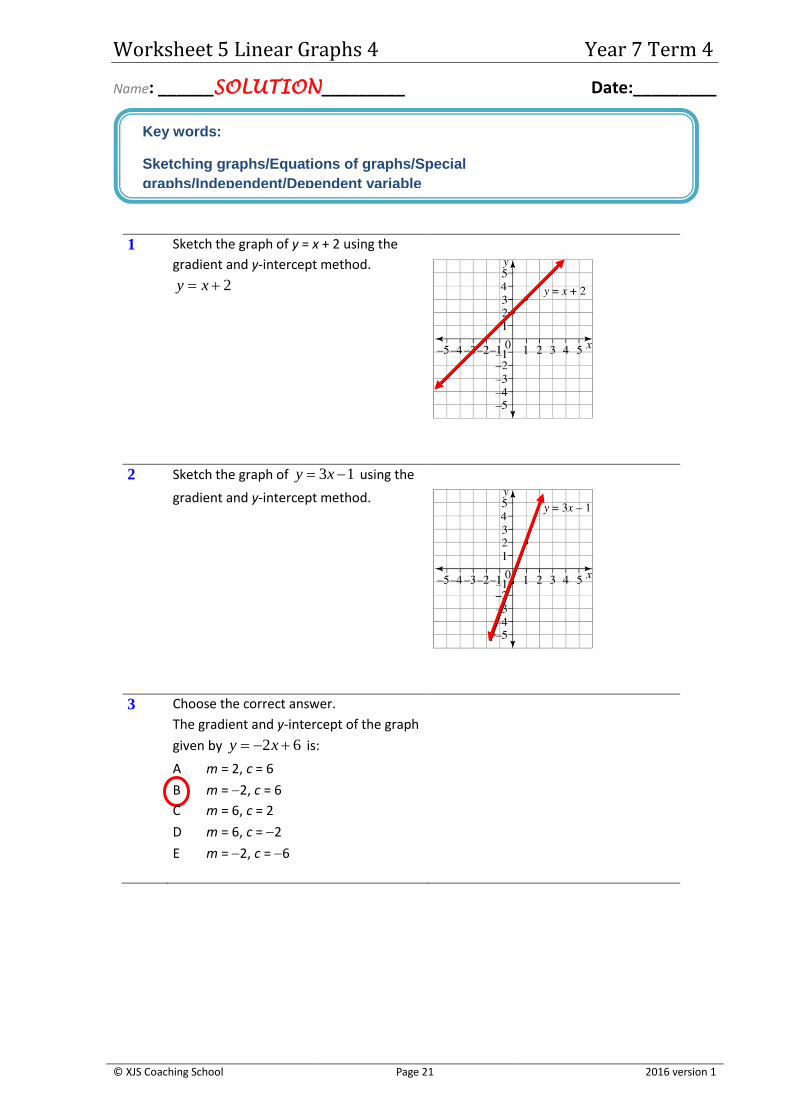
1 Sketch the graph of y = x + 2 using the
gradient and y-intercept method.
2 xy
2 Sketch the graph of 13 xy using the
gradient and y-intercept method.
3 Choose the correct answer.
The gradient and y-intercept of the graph
given by 62 xy is:
A m = 2, c = 6
B m = 2, c = 6
C m = 6, c = 2
D m = 6, c = 2
E m = 2, c = 6
Key words:
Sketching graphs/Equations of graphs/Special
graphs/Independent/Dependent variable
Worksheet 5 Linear Graphs 4 Year 7 Term 4
© XJS Coaching School Page 22 2016 version 1
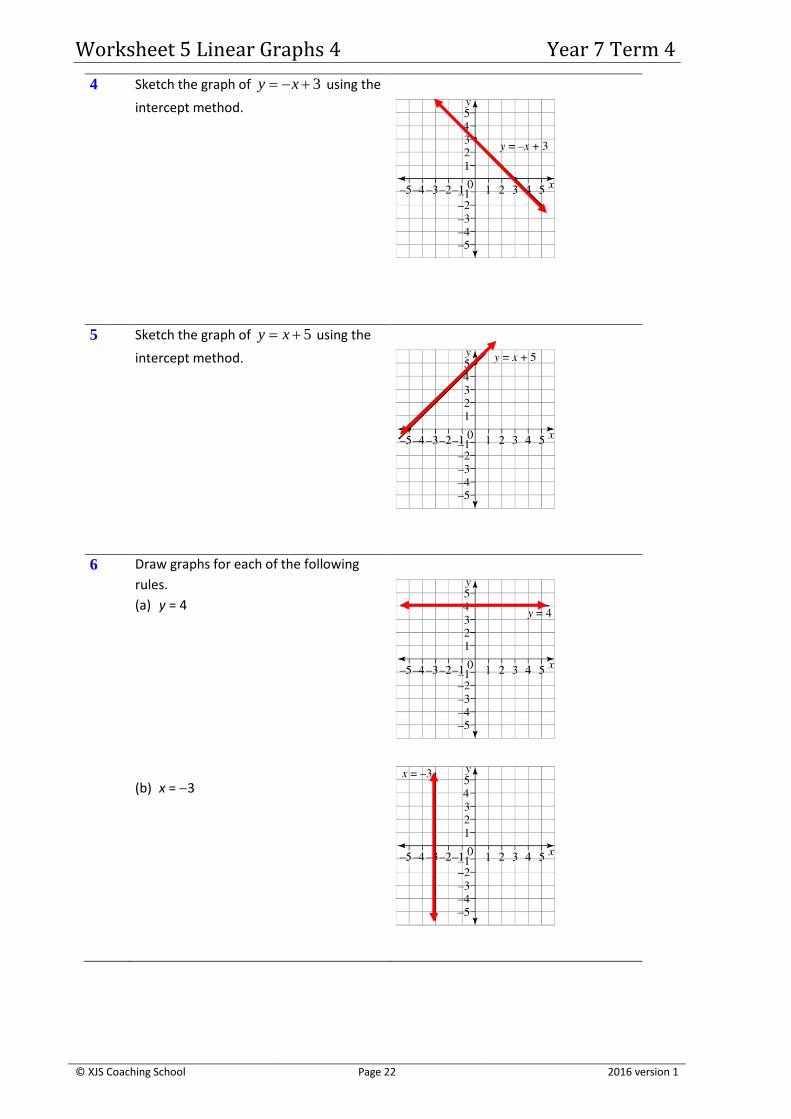
4 Sketch the graph of 3 xy using the
intercept method.
5 Sketch the graph of 5 xy using the
intercept method.
6 Draw graphs for each of the following
rules.
(a) y = 4
(b) x = 3
Worksheet 5 Linear Graphs 4 Year 7 Term 4
© XJS Coaching School Page 23 2016 version 1
7 Are the following statements true or
false?
(a) The x- and y-intercepts for the linear
graph 4 xy are 4 and 4
respectively.
(b) The x- and y-intercepts for the linear
graph 4 xy are 4 and 4
respectively.
(a) y = x + 4 x int, y = 0
0 = x + 4
0 4 = x + 4 4
x = 4
y int, x = 0
y = 0 + 4
= 4 False
(b) y = x 4 x int, y = 0
0 = x 4
0 + 4 = x 4 + 4
x = 4
y int, x = 0
y = 0 4
= 4 True
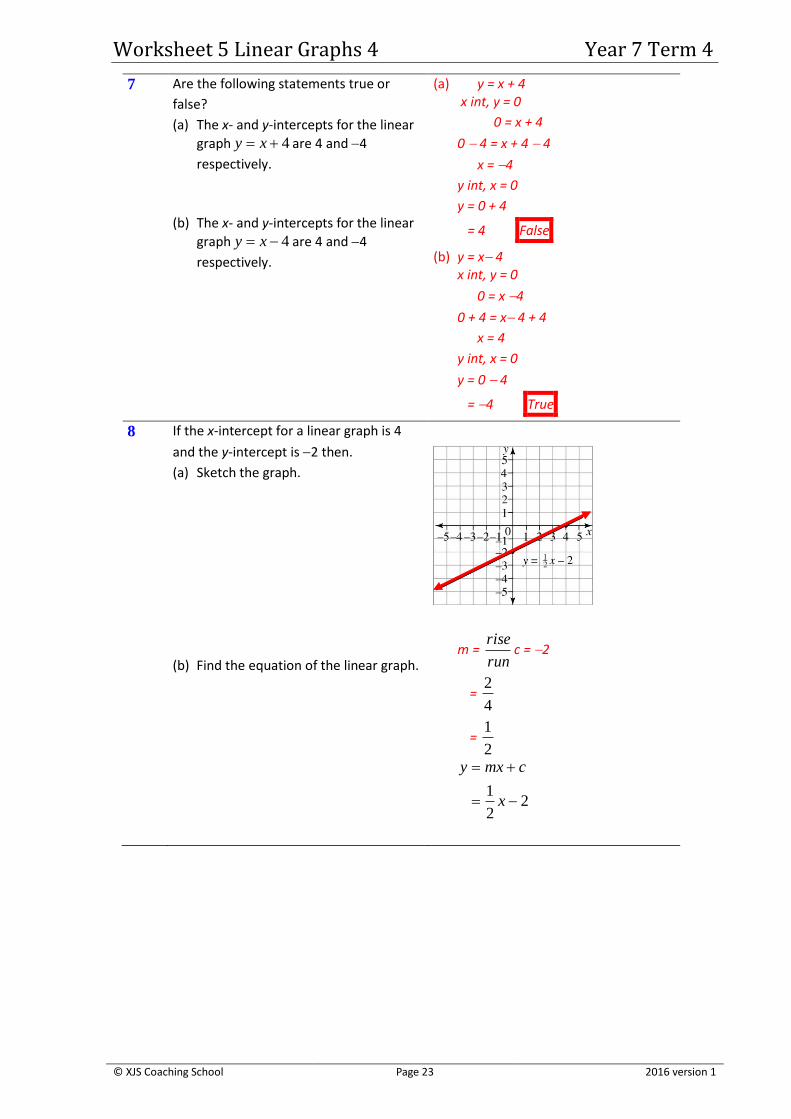
8 If the x-intercept for a linear graph is 4
and the y-intercept is 2 then.
(a) Sketch the graph.
(b) Find the equation of the linear graph.
m = run
risec = 2
= 4
2
= 2
1
2
2
1
x
cmxy
Worksheet 5 Linear Graphs 4 Year 7 Term 4
© XJS Coaching School Page 24 2016 version 1
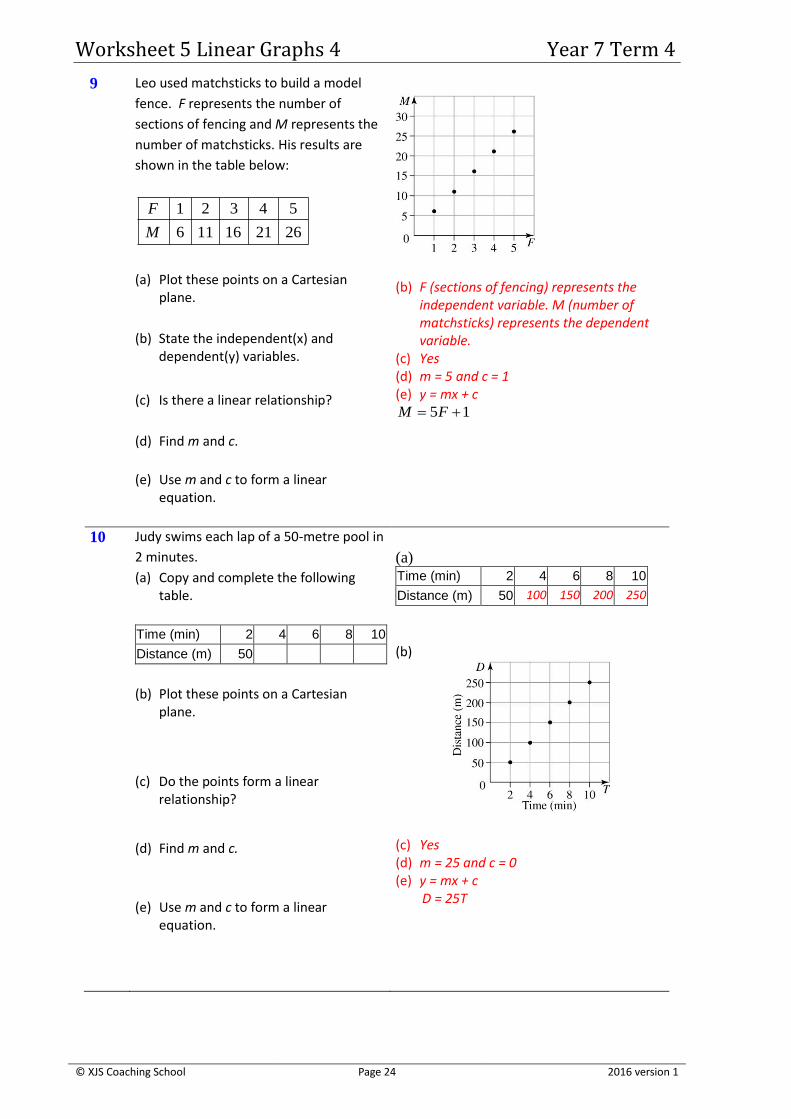
9 Leo used matchsticks to build a model
fence. F represents the number of
sections of fencing and M represents the
number of matchsticks. His results are
shown in the table below:
262116116
54321
M
F
(a) Plot these points on a Cartesian plane.
(b) State the independent(x) and dependent(y) variables.
(c) Is there a linear relationship?
(d) Find m and c.
(e) Use m and c to form a linear equation.
(b) F (sections of fencing) represents the independent variable. M (number of matchsticks) represents the dependent variable.
(c) Yes (d) m = 5 and c = 1 (e) y = mx + c
15 FM
10 Judy swims each lap of a 50-metre pool in
2 minutes.
(a) Copy and complete the following table.
Time (min) 2 4 6 8 10
Distance (m) 50
(b) Plot these points on a Cartesian plane.
(c) Do the points form a linear relationship?
(d) Find m and c.
(e) Use m and c to form a linear equation.
(a) Time (min) 2 4 6 8 10
Distance (m) 50 100 150 200 250
(b)
(c) Yes (d) m = 25 and c = 0 (e) y = mx + c D = 25T

Worksheet 6 Ratios Year 7 Term 4
© XJS Coaching School Page 25 2016 version 1
Name: ______SOLUTION_________ Date:________
Q1. The rail on the school stairs slopes upwards. If it rises 40 cm in 2 m,
a) How far does it rise in 3 m?
40 cm in 2m => 20 cm in 1 m => 60 cm in 3 m
b) How far does it rise in 90 cm?
20 cm in 100 cm => 2 cm in 10 cm => 18 cm in 90 cm
Q2. a) If the A$ is worth US$0.93, what is A$130 worth in US$(to the nearest dollar)?
A$1 = US$0.93 => A$130 = 130 × 0.93 = US$ 120.90 = US$121.00
b) What will US$130 be worth in A$(to the nearest dollar)?
US$130 = 130 ÷0.93 = A$ 139.78 = A$140.00
Q3. Sunlight takes 500 secs to reach Earth, a distance of 150 million km.
a) What is the speed of light in km/sec? Speed = D/T = 150 000 000 / 500 = 300 000 km/sec
b) What will this speed be in m/sec? Since 1 km = 1000 m Hence speed = 300 000 000 m/sec
c) How far (in km) will the light travel in minute? Remember to change 1 min to secs. Distance = S × T = 300 000 × 60 = 18 000 000 km
d) How far (in km) will the light travel in 1hour? Distance = 18 000 000 × 60 = 1 080 000 000 km
e) How far (in km) will light travel in 1 day? Distance = 1 080 000 000 X 24 = 25,920,000,000 km
Key words:
Compare / Scale

Worksheet 6 Ratios Year 7 Term 4
© XJS Coaching School Page 26 2016 version 1
Q4. A family uses 21 L of milk per week. How much do they use:
a) per day b) in 30 days c) in 30 weeks d) in 1year (365 days)
21 / 7 = 3 L
3 L× 30 = 90 L 21L × 30 = 630 L 3 L× 365 = 1,095 L
Q5. Two metres of fabric cost $3.80. What is the cost of:
i)
a) 1 metre b) 4 metres c) 3.5 metres
3.8/2 = $1.90
3.8 × 2 = $7.60 1.9 × 3.5 = $6.65
ii) There is a discount of 20% for all fabric over 6m long. What will be the cost of a 15m fabric?
Cost = 80% × 15 × $1.90 = $22.80
Q6. A brick layer lays 700 bricks in an 8 hour day.
a) At that rate, how many; bricks are laid per week?
We must assume he works 5 days a week. Hence he lays 700 × 5 = 3500 bricks
b) How many days will it take to lay 5000 bricks (to the nearest day)?
5000 / 700 = 7.14 days = 7 days
Q7. The ratio of cats to dogs is 10:2. If there are 40 dogs, how many cats are there?
Number of cats = 10 × 40/2 = 200 cats
Q8. Put the following quantities to ratios and then simplify:
a) 12cm to 2.4m b) 2kg to 250g c) 3.5L to 2000 mL d) 300m to 0.6km
12: 240
1:20
2000: 250
200:25
40:5
8:1
3500: 2000
35:20
7:4
300: 600
1:2

Worksheet 6 Ratios Year 7 Term 4
© XJS Coaching School Page 27 2016 version 1
Q9. $400.00 is to be shared between Lin and Huat. How much would each receive if the money
is to be divided in the ratios below?
a) 3:7 b) 5:3 c)15:5
Each part = $400 / 10 =$40
Lin = 3 × 40 = $120
Huat = 7× 40 = $280
Each part = $400 / 8 =$50
Lin = 5×50 = $250
Huat = 3×50 = $150
Each part = $400 / 20 =$20
Lin = 15×20 = $300
Huat = 5×20 = $100
Q10. The plan of a building has a scale of 1: 22. If the room measures 40 cm by 15cm, what are
the actuallengths of the room?
Room measures (40 × 22) cm by (15 ×22) cm = 880 cm by 330 cm = 8.8 m by 3.3 m
Q11. The scale for a map is 10 cm to 100km.
a) If the distance between 2 towns on the map is 25 cm, what is the actual distance between the towns?
Actual distance = 25/10 × 100 km = 250 km
b) The distance between Glen and Hunt is 450km. What will the nearest measurement (in cm) on the map?
Distance on map = 450/100 × 10 = 45 cm
Q12. Change the following speeds to m/min.
(a) 40 km /h (b) 50 km/h (c) 70 km/h
= 40 × 1000/60
= 666.67 m/min
Answers rounded to 2 d.p.
Students may return fraction
or even recurring decimals
=50 × 1000/60
= 833.33 m/min
= 70 × 1000/60
= 1166.67 m/min
Q13. Change the following speeds to m/sec.
(a) 45 km /h (b) 80km/h (c) 100 km/h
= 45 × 1000 / (60 × 60)
= 12.5 m/sec
Answers rounded to 2 d.p.
Students may return fraction
or even recurring decimals
= 80 × 1000 / (60 × 60)
= 22.22 m/sec
= 100 × 1000 / (60 × 60)
= 27.78 m/sec
Worksheet 6 Ratios Year 7 Term 4
© XJS Coaching School Page 28 2016 version 1
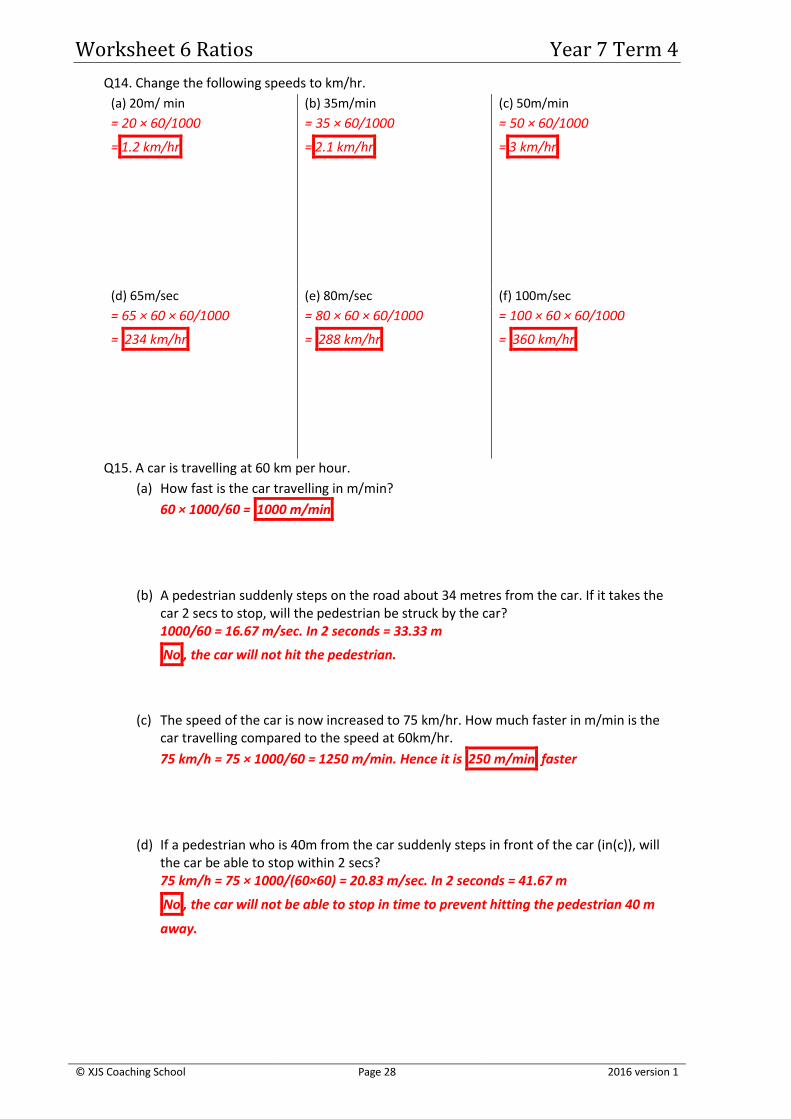
Q14. Change the following speeds to km/hr.
(a) 20m/ min (b) 35m/min (c) 50m/min
= 20 × 60/1000
= 1.2 km/hr
= 35 × 60/1000
= 2.1 km/hr
= 50 × 60/1000
= 3 km/hr
(d) 65m/sec (e) 80m/sec (f) 100m/sec
= 65 × 60 × 60/1000
= 234 km/hr
= 80 × 60 × 60/1000
= 288 km/hr
= 100 × 60 × 60/1000
= 360 km/hr
Q15. A car is travelling at 60 km per hour.
(a) How fast is the car travelling in m/min?
60 × 1000/60 = 1000 m/min
(b) A pedestrian suddenly steps on the road about 34 metres from the car. If it takes the car 2 secs to stop, will the pedestrian be struck by the car? 1000/60 = 16.67 m/sec. In 2 seconds = 33.33 m
No , the car will not hit the pedestrian.
(c) The speed of the car is now increased to 75 km/hr. How much faster in m/min is the car travelling compared to the speed at 60km/hr.
75 km/h = 75 × 1000/60 = 1250 m/min. Hence it is 250 m/min faster
(d) If a pedestrian who is 40m from the car suddenly steps in front of the car (in(c)), will the car be able to stop within 2 secs? 75 km/h = 75 × 1000/(60×60) = 20.83 m/sec. In 2 seconds = 41.67 m
No , the car will not be able to stop in time to prevent hitting the pedestrian 40 m
away.
Practice Exam (Linear Graphs, Ratios) Year 7 Term 4
© XJS Coaching School Page 29 2016 version 1
Name: __SOLUTION____________ Date:________
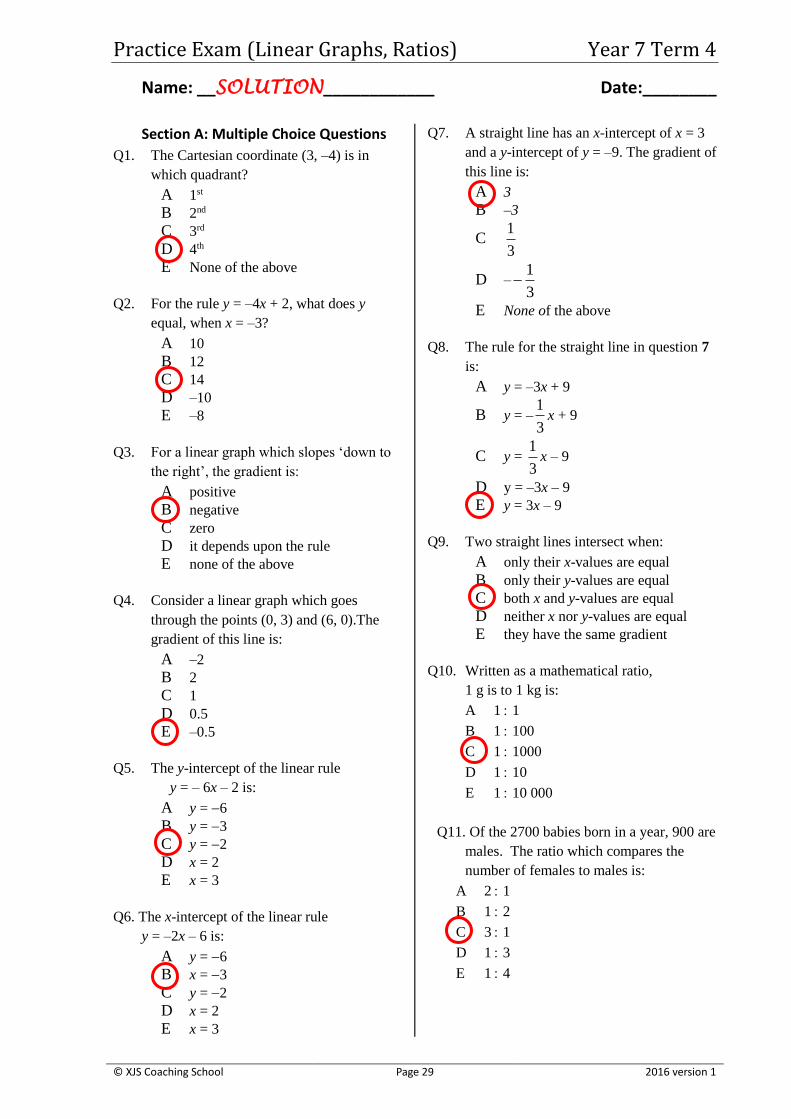
Section A: Multiple Choice Questions
Q1. The Cartesian coordinate (3, –4) is in
which quadrant?
A 1st
B 2nd
C 3rd
D 4th
E None of the above
Q2. For the rule y = –4x + 2, what does y
equal, when x = –3?
A 10
B 12
C 14
D –10
E –8
Q3. For a linear graph which slopes ‘down to
the right’, the gradient is:
A positive
B negative
C zero
D it depends upon the rule
E none of the above
Q4. Consider a linear graph which goes
through the points (0, 3) and (6, 0).The
gradient of this line is:
A –2
B 2
C 1
D 0.5
E –0.5
Q5. The y-intercept of the linear rule
y = – 6x – 2 is:
A y = 6
B y = 3
C y = 2
D x = 2
E x = 3
Q6. The x-intercept of the linear rule
y = –2x – 6 is:
A y = 6
B x = 3
C y = 2
D x = 2
E x = 3
Q7. A straight line has an x-intercept of x = 3
and a y-intercept of y = –9. The gradient of
this line is:
A 3
B –3
C 3
1
D –3
1
E None of the above
Q8. The rule for the straight line in question 7
is:
A y = –3x + 9
B y = –3
1x + 9
C y = 3
1x – 9
D y = –3x – 9
E y = 3x – 9
Q9. Two straight lines intersect when:
A only their x-values are equal
B only their y-values are equal
C both x and y-values are equal
D neither x nor y-values are equal
E they have the same gradient
Q10. Written as a mathematical ratio,
1 g is to 1 kg is:
A 1 1
B 1 100
C 1 1000
D 1 10
E 1 10 000
Q11. Of the 2700 babies born in a year, 900 are
males. The ratio which compares the
number of females to males is:
A 2 1
B 1 2
C 3 1
D 1 3
E 1 4
Practice Exam (Linear Graphs, Ratios) Year 7 Term 4
© XJS Coaching School Page 30 2016 version 1
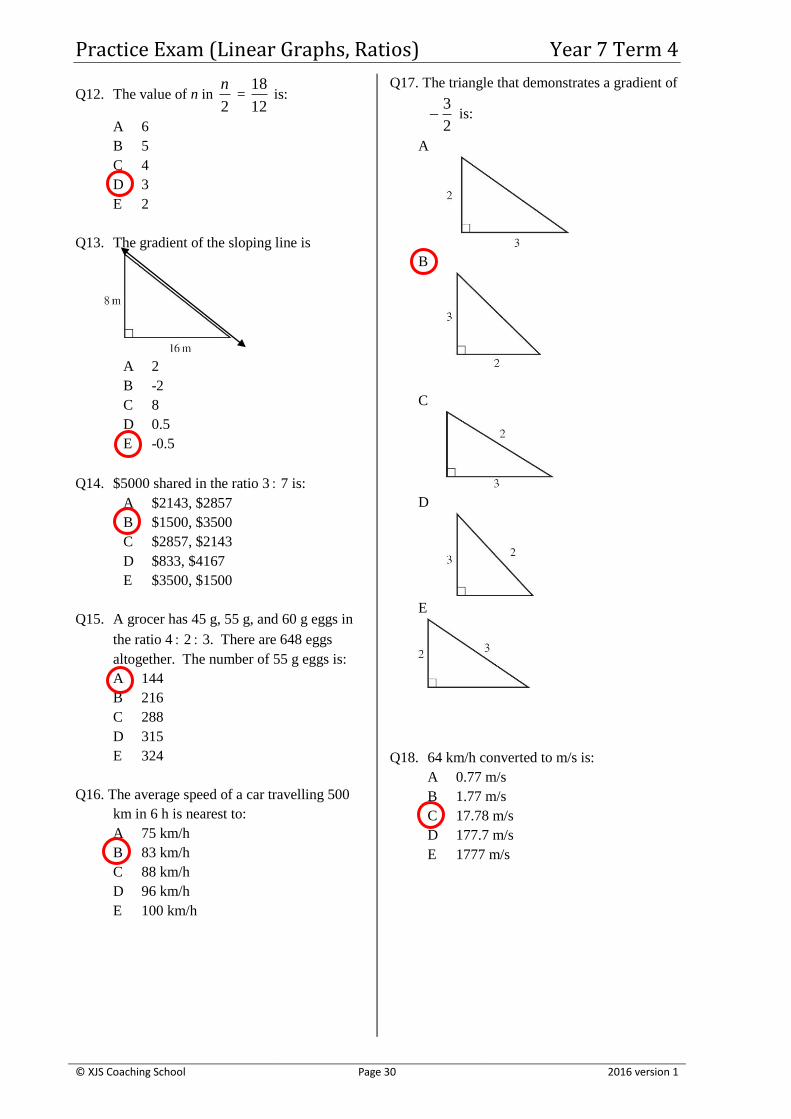
Q12. The value of n in 2
n =
12
18 is:
A 6
B 5
C 4
D 3
E 2
Q13. The gradient of the sloping line is
A 2
B -2
C 8
D 0.5
E -0.5
Q14. $5000 shared in the ratio 3 7 is:
A $2143, $2857
B $1500, $3500
C $2857, $2143
D $833, $4167
E $3500, $1500
Q15. A grocer has 45 g, 55 g, and 60 g eggs in
the ratio 4 2 3. There are 648 eggs
altogether. The number of 55 g eggs is:
A 144
B 216
C 288
D 315
E 324
Q16. The average speed of a car travelling 500
km in 6 h is nearest to:
A 75 km/h
B 83 km/h
C 88 km/h
D 96 km/h
E 100 km/h
Q17. The triangle that demonstrates a gradient of
2
3 is:
A
B
C
D
E
Q18. 64 km/h converted to m/s is:
A 0.77 m/s
B 1.77 m/s
C 17.78 m/s
D 177.7 m/s
E 1777 m/s

Practice Exam (Linear Graphs, Ratios) Year 7 Term 4
© XJS Coaching School Page 31 2016 version 1
Section B: Short Answer Questions
1. For the rule y = x – 8, complete the following table of values, plot the points and then join
them to form a linear graph.
x -2 -1 0 1 2
y
2. Calculate the gradient of the line shown.
Gradient = 15
3. Find the gradients of the line joining the two points given. State whether the gradients are positive or negative. (a) (2, 3) and (6, 7)
m = 1, positive
(b) (2, 4) and (1, 5) m = - 1/3 negative
(c) (-2, 2) and (2, 4) m = 0.5, positive
(d) (3, -5) and (-4, 8) m = - 13/7 negative
-10 -9 -8 -7 -6
-10
-5
It’s important student draw
within the given domain,
i.e., -2 ≤ x ≤ 2

Practice Exam (Linear Graphs, Ratios) Year 7 Term 4
© XJS Coaching School Page 32 2016 version 1
4. State the gradient and y intercept for the linear rules.
(a) y = 72
1x
gradient = ½, y-int = -7
(b) 5x – 12y = 70 gradient = 5/12, y-int = -35/6
(c) 2y + 10x – 15 = 0 gradient = - 5, y-int = 15/2
(d) 4 – 2y = 6x gradient = -3, y-int = 2
5. Sketch graphs of the following rules on a single Cartesian plane.
(a) y = 2
(b) x = 3
(c) y = 5
(d) x = -2
6. Sketch graphs of the following rules using the gradient and y intercept method (‘c’)
a) y = 2x
b) y = 3x +2
Practice Exam (Linear Graphs, Ratios) Year 7 Term 4
© XJS Coaching School Page 33 2016 version 1
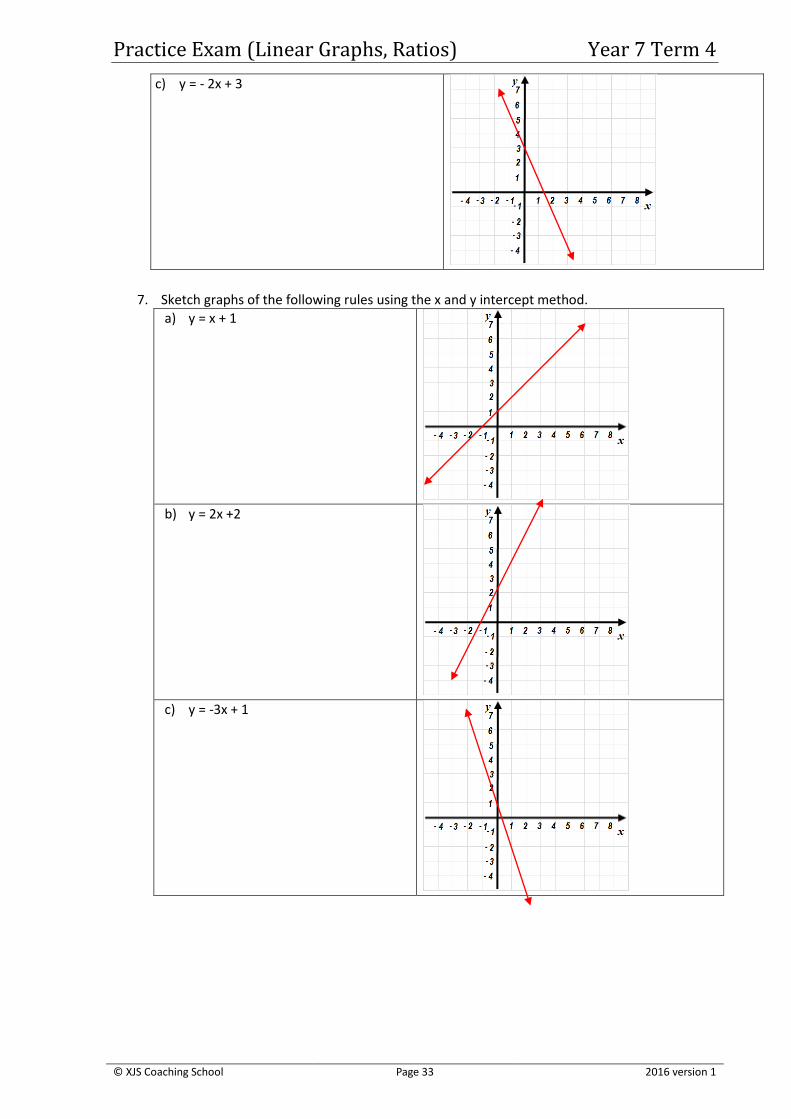
c) y = - 2x + 3
7. Sketch graphs of the following rules using the x and y intercept method.
a) y = x + 1
b) y = 2x +2
c) y = -3x + 1
Practice Exam (Linear Graphs, Ratios) Year 7 Term 4
© XJS Coaching School Page 34 2016 version 1
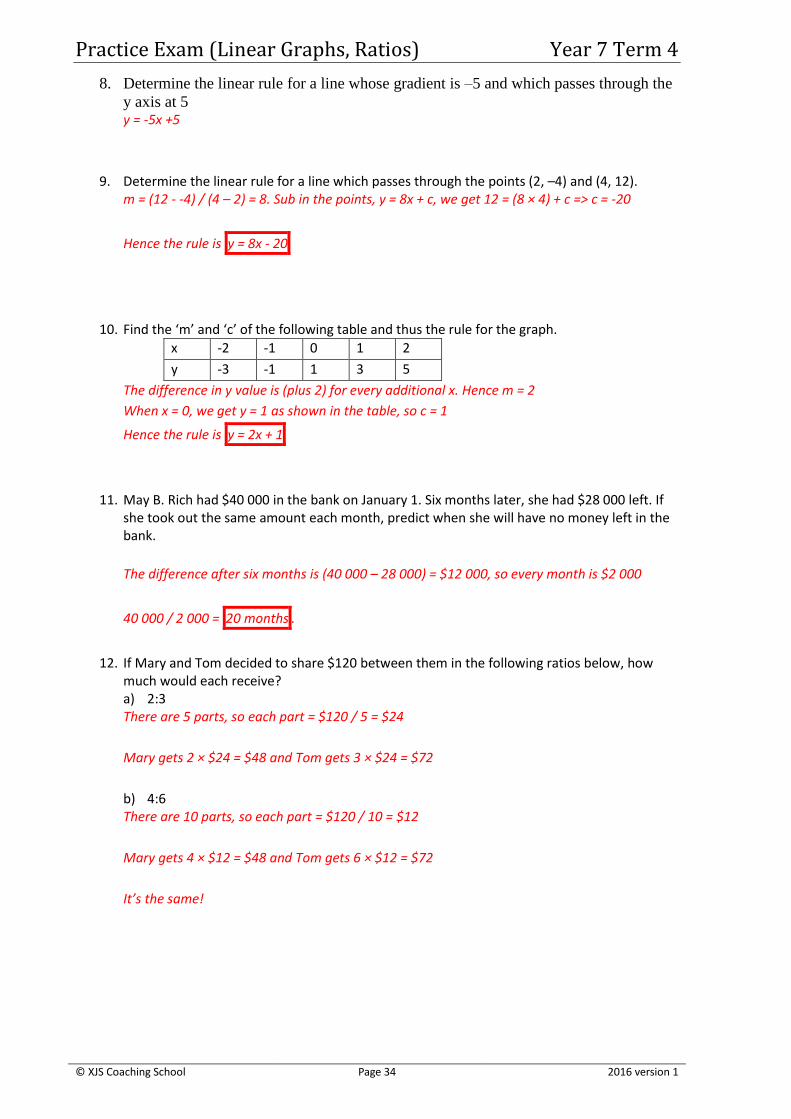
8. Determine the linear rule for a line whose gradient is –5 and which passes through the
y axis at 5 y = -5x +5
9. Determine the linear rule for a line which passes through the points (2, –4) and (4, 12). m = (12 - -4) / (4 – 2) = 8. Sub in the points, y = 8x + c, we get 12 = (8 × 4) + c => c = -20
Hence the rule is y = 8x - 20
10. Find the ‘m’ and ‘c’ of the following table and thus the rule for the graph.
x -2 -1 0 1 2
y -3 -1 1 3 5
The difference in y value is (plus 2) for every additional x. Hence m = 2
When x = 0, we get y = 1 as shown in the table, so c = 1
Hence the rule is y = 2x + 1
11. May B. Rich had $40 000 in the bank on January 1. Six months later, she had $28 000 left. If she took out the same amount each month, predict when she will have no money left in the bank.
The difference after six months is (40 000 – 28 000) = $12 000, so every month is $2 000
40 000 / 2 000 = 20 months .
12. If Mary and Tom decided to share $120 between them in the following ratios below, how much would each receive? a) 2:3 There are 5 parts, so each part = $120 / 5 = $24
Mary gets 2 × $24 = $48 and Tom gets 3 × $24 = $72
b) 4:6 There are 10 parts, so each part = $120 / 10 = $12
Mary gets 4 × $12 = $48 and Tom gets 6 × $12 = $72
It’s the same!
Practice Exam (Linear Graphs, Ratios) Year 7 Term 4
© XJS Coaching School Page 35 2016 version 1
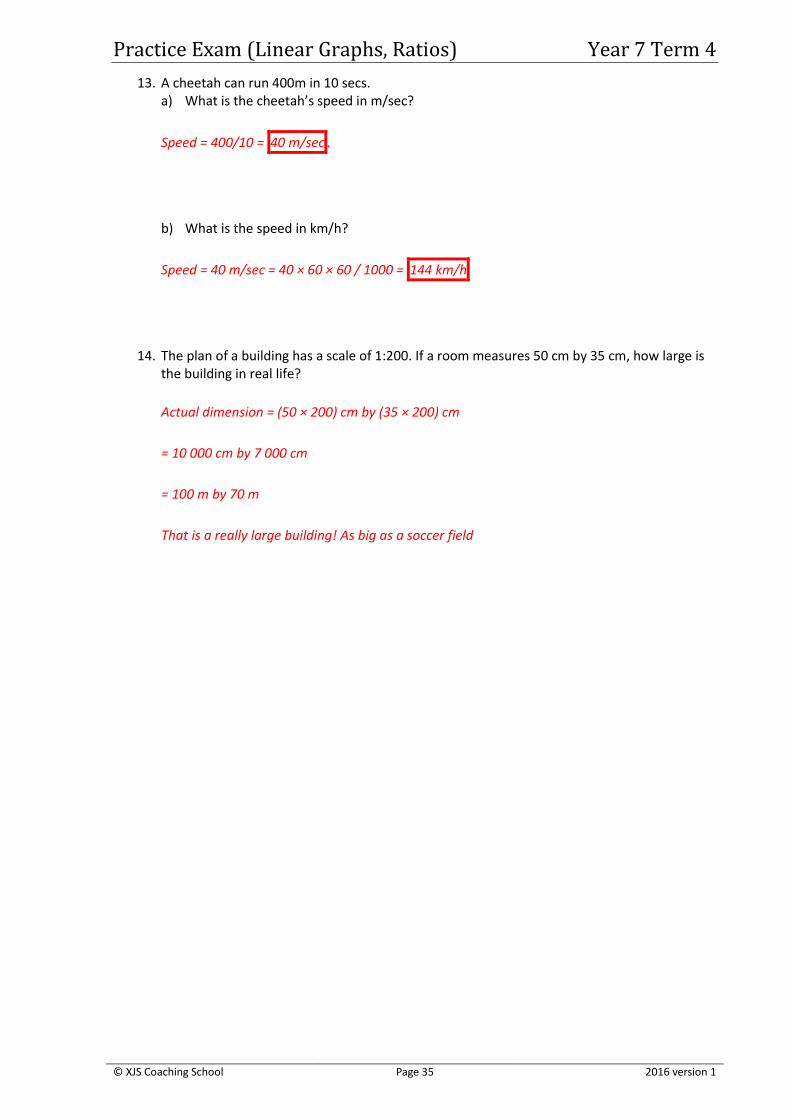
13. A cheetah can run 400m in 10 secs. a) What is the cheetah’s speed in m/sec?
Speed = 400/10 = 40 m/sec .
b) What is the speed in km/h?
Speed = 40 m/sec = 40 × 60 × 60 / 1000 = 144 km/h
14. The plan of a building has a scale of 1:200. If a room measures 50 cm by 35 cm, how large is the building in real life?
Actual dimension = (50 × 200) cm by (35 × 200) cm
= 10 000 cm by 7 000 cm
= 100 m by 70 m
That is a really large building! As big as a soccer field
Practice Exam (Linear Graphs, Ratios) Year 7 Term 4
© XJS Coaching School Page 36 2016 version 1
Holiday Homework Year 7 Term 4
© XJS Coaching School Page 37 2016 version 1
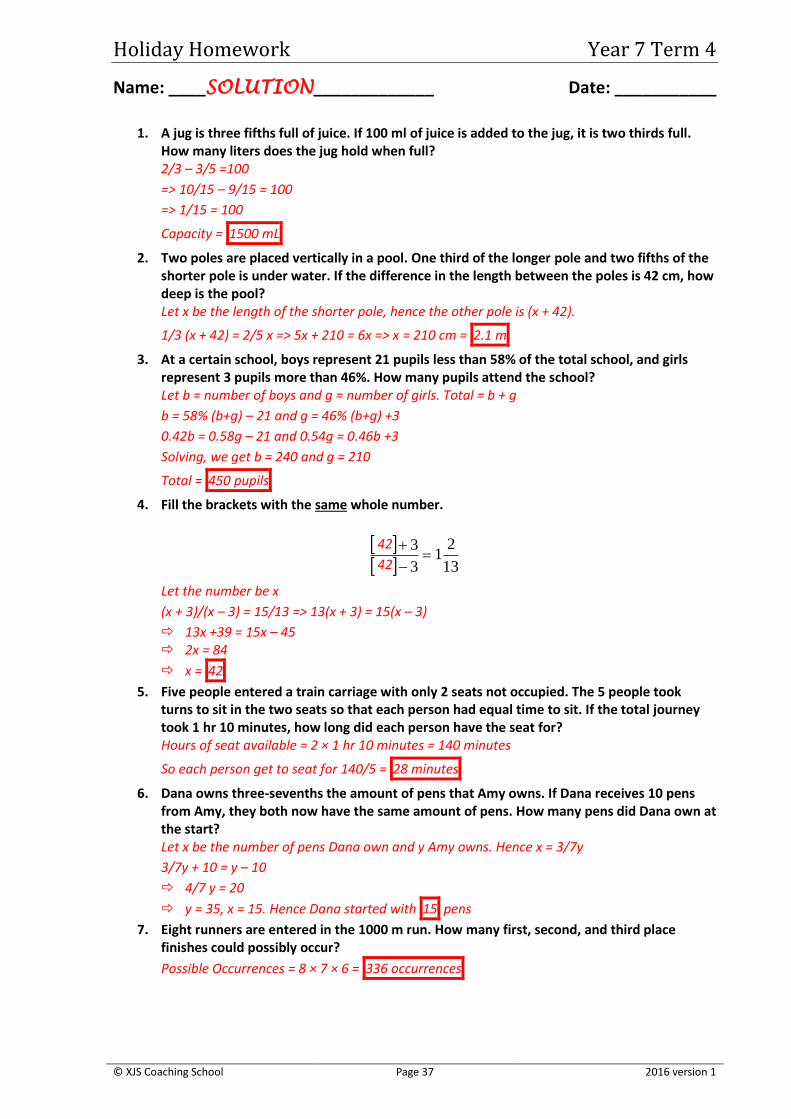
Name: ____SOLUTION_____________ Date: ___________
1. A jug is three fifths full of juice. If 100 ml of juice is added to the jug, it is two thirds full. How many liters does the jug hold when full? 2/3 – 3/5 =100
=> 10/15 – 9/15 = 100
=> 1/15 = 100
Capacity = 1500 mL
2. Two poles are placed vertically in a pool. One third of the longer pole and two fifths of the shorter pole is under water. If the difference in the length between the poles is 42 cm, how deep is the pool? Let x be the length of the shorter pole, hence the other pole is (x + 42).
1/3 (x + 42) = 2/5 x => 5x + 210 = 6x => x = 210 cm = 2.1 m
3. At a certain school, boys represent 21 pupils less than 58% of the total school, and girls represent 3 pupils more than 46%. How many pupils attend the school? Let b = number of boys and g = number of girls. Total = b + g
b = 58% (b+g) – 21 and g = 46% (b+g) +3
0.42b = 0.58g – 21 and 0.54g = 0.46b +3
Solving, we get b = 240 and g = 210
Total = 450 pupils
4. Fill the brackets with the same whole number.
3
3
13
21
Let the number be x
(x + 3)/(x – 3) = 15/13 => 13(x + 3) = 15(x – 3)
13x +39 = 15x – 45 2x = 84
x = 42
5. Five people entered a train carriage with only 2 seats not occupied. The 5 people took turns to sit in the two seats so that each person had equal time to sit. If the total journey took 1 hr 10 minutes, how long did each person have the seat for? Hours of seat available = 2 × 1 hr 10 minutes = 140 minutes
So each person get to seat for 140/5 = 28 minutes
6. Dana owns three-sevenths the amount of pens that Amy owns. If Dana receives 10 pens from Amy, they both now have the same amount of pens. How many pens did Dana own at the start? Let x be the number of pens Dana own and y Amy owns. Hence x = 3/7y
3/7y + 10 = y – 10
4/7 y = 20
y = 35, x = 15. Hence Dana started with 15 pens
7. Eight runners are entered in the 1000 m run. How many first, second, and third place finishes could possibly occur?
Possible Occurrences = 8 × 7 × 6 = 336 occurrences
42
42
Holiday Homework Year 7 Term 4
© XJS Coaching School Page 38 2016 version 1
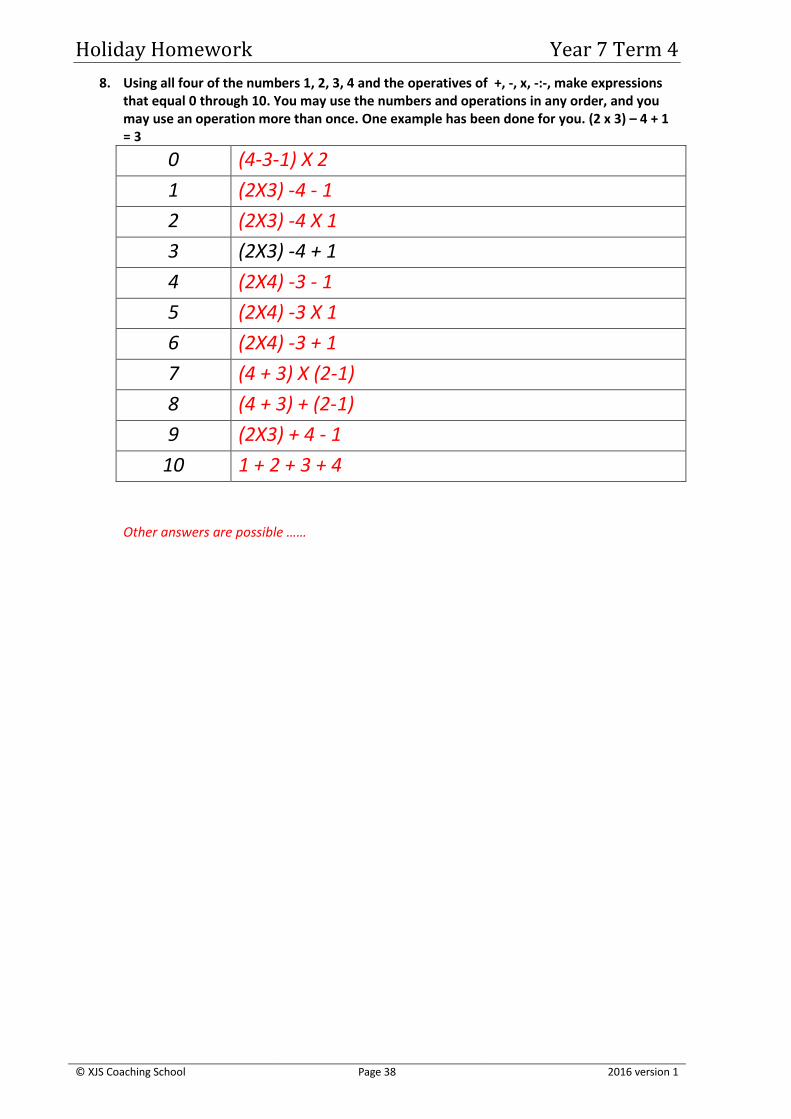
8. Using all four of the numbers 1, 2, 3, 4 and the operatives of +, -, x, -:-, make expressionsthat equal 0 through 10. You may use the numbers and operations in any order, and youmay use an operation more than once. One example has been done for you. (2 x 3) – 4 + 1= 3
0 (4-3-1) X 2
1 (2X3) -4 - 1
2 (2X3) -4 X 1
3 (2X3) -4 + 1
4 (2X4) -3 - 1
5 (2X4) -3 X 1
6 (2X4) -3 + 1
7 (4 + 3) X (2-1)
8 (4 + 3) + (2-1)
9 (2X3) + 4 - 1
10 1 + 2 + 3 + 4
Other answers are possible ……


联系地址:
电话:
传真:
电子邮箱:
Level 2, 13A Windsor Ave
Mt.Waverley VIC 3149
(03) 9888 1688
(03) 9888 1699
We are teaching your kids
Mt. Waverley 校区
Mt. Waverley Secondary College
Corner of Stephensons Rd & Lechte Rd, Mt
Waverley VIC 3149 (Melway P61 F11)
乘 733路公共汽车校门下车,或乘火车到Mt.
Waverley 车站,沿 Stephensons Rd 向北步行
10 分钟
Waverley Garden 校区
Nazareth College
Manning Drive, Noble Park North, VIC 3174
(Melway Ref: P80 K7)
乘 848或 814路公共汽车学校附近下车
Head Office 总办公室
新金山中文图书馆
13A Windsor Ave, Mt Waverley VIC 3149
(Melway P61 A12)
乘 Glen Waverley线火车或公共汽车 767到
Jordanville火车站下车
Box Hill 校区
Koonung Secondary College
615 Elgar Road Box Hill VIC 3127 (Melway
Ref: P47 B5)
乘 284, 270733路公共汽车校门前下车
Brighton 校区
Firbank Grammar Senior School
51 Middle Crt, Brighton VIC 3186 (Melway
Ref: P67 E9)
乘 216,219,703或 822路公共汽车校门附近
下车 . 乘 Sandringham 线火车到 North
Brighton火车站下车,向东步行 5分钟
City 校区
ANIBT - Australian National Institute of Business and Technology-
Level 13, 474 Flinders Street, Melbourne VIC
3000 (Melway Ref: 2F C7)
乘任何火车线至 Flinders Street 火车站下
车, 步行 5分钟
www.xjscs.com.au