Embed Size (px)
Citation preview
1
Yeast Flavohemoglobin, a Nitric Oxide Oxidoreductase, is Located both in the Cytosol and Mitochondrial Matrix
Effects of Respiration, Anoxia, and the Mitochondrial Genome on Its Intracellular Level and Distribution
Nina Cassanova, Kristin M. O’Brien‡, Brett T. Stahl, Travis McClure, and Robert O. Poyton*
The Department of Molecular, Cellular, and Developmental Biology, University of Colorado, Boulder, Colorado 80309-0347 This work supported by National Institutes of Health Grant GM30228 (to R.O.P), and a National Institutes of Health NRSA postdoctoral fellowship (to K.M.O.). ‡Present address: Institute of Arctic Biology, University of Alaska, Fairbanks, AK 99775-7000 *To whom correspondence should be addressed. Tel.: 303-493-3823; Fax: 303-492-3883; Email: [email protected]
Running title: Intracellular distribution of flavohemoglobin in yeast
JBC Papers in Press. Published on December 20, 2004 as Manuscript M411478200
Copyright 2004 by The American Society for Biochemistry and Molecular Biology, Inc.
by guest on August 20, 2019
http://ww
w.jbc.org/
Dow
nloaded from
2
Summary
Yeast flavohemoglobin, YHb, encoded by the nuclear gene, YHB1, has been implicated in
both the oxidative and nitrosidative stress responses in Saccharomyces cerevisiae. Previous studies
have shown that expression of YHB1 is optimal in normoxic or hyperoxic conditions yet respiring
yeast cells have low levels of reduced YHb pigment, detected by carbon monoxide (CO) photolysis
difference spectroscopy of glucose-reduced cells. Here, we have addressed this apparent
discrepancy by determining the intracellular location of the YHb protein and analyzing the
relationships among respiration, YHb level, and intracellular location. We have found that although
intact respiration-proficient cells lack a YHb CO-spectral signature, cell extracts from these cells
have both a YHb CO-spectral signature and nitric oxide (NO) consuming activity. This suggests
either that YHb can not be reduced in vivo or that YHb heme is maintained in an oxidized state in
respiring cells. By using an anti-YHb antibody, CO-difference spectroscopy, and by measuring NO
consumption we have found that YHb localizes to two distinct intracellular compartments, the
mitochondrial matrix and the cytosol, in respiring cells. Moreover, we have found that the
distribution of YHb between these two compartments is affected by the presence or absence of
oxygen and by the mitochondrial genome. The findings suggest that YHb functions in oxidative
stress indirectly by consuming NO, which inhibits mitochondrial respiration and leads to enhanced
production of reactive oxygen species, and that cells can regulate intracellular distribution of YHb in
accordance with this function.
by guest on August 20, 2019
http://ww
w.jbc.org/
Dow
nloaded from
3
Introduction
Hemoglobins are found in all major groups of organisms, including plants, vertebrates,
invertebrates, protozoa, bacteria, and fungi (1). They make up a diverse super-family of proteins
that are grouped together because they all bind oxygen reversibly and they all possess a conserved
heme binding domain, the “myoglobin fold” (2). Aside from these common features hemoglobins
are otherwise divergent in structure and complexity. Indeed, while most vertebrate hemoglobins
consist of two types of polypeptide subunits that have single heme domains and form tetrameric
oligomers microbial, invertebrate, and protozoan hemoglobins are far more varied. Bacterial,
fungal, and protozoan hemoglobins fall into two general types: dimeric hemoproteins composed of
two single heme domain polypeptides, and monomeric flavohemoproteins containing a single heme
binding domain at its N-terminus and a C-terminal FAD-binding domain that is related to those
found in proteins in the ferredoxin-NADP+ reductase (FNR) family (3). From DNA sequence
analysis these flavohemoglobins appear to form a distinct subgroup within the hemoglobin family
(1,4).
The role of vertebrate and invertebrate hemoglobins in the transport of O2 and CO2 has been
known for some time. Recently, it has been discovered that the hemoglobins of both eucaryotes and
prokaryotes have additional functions relating to nitric oxide (NO). For example, in mammals
hemoglobin functions to transport NO to effectors that regulate blood flow and, therefore, the rate of
delivery of oxygen to tissue cells (5-8). In contrast, the function of Escherichia coli hemoglobin
(HMP) is to protect cells against nitrosidative stress brought about by NO or NO-donating S-
nitrosothiols (9-11). This hemoglobin functions in both aerobic and anaerobic cells. In the presence
of air it functions as an NO oxygenase that generates mainly nitrate, and in the absence of air it
functions as an NO-reductase that generates nitrous oxide. HMP may also play a role in oxidative
stress (9). The flavohemoglobin of Ralsonia eutropha is involved in denitrification, with the
production of N2O (12). The genes that encode the flavohemoglobins of R. eutropha, and Bacillus
by guest on August 20, 2019
http://ww
w.jbc.org/
Dow
nloaded from
4
subtilis are up-regulated under oxygen limiting conditions (13, 14). Together, these findings suggest
a multiplicity of roles for hemoglobins.
The physiological role(s) of the flavohemoglobin found in S cerevisiae cells is (are) still
somewhat unclear. The expression of its gene, YHB1, is induced by oxygen, which is opposite to
the effects of oxygen on the expression of most bacterial hemoglobin genes. This has been taken to
indicate that the hemoglobins of yeast and bacteria may have different functions (15). Several
observations suggest physiological connections among the expression/ function of this protein,
mitochondrial respiration, and oxidative and nitrosidative stress. First, respiring S. cerevisiae cells
have low levels of reduced YHb pigment, detected by carbon monoxide (CO)- photolysis difference
spectroscopy (16). The intracellular levels of reduced YHb CO-photoproduct pigment are increased
in cells in which the mitochondrial respiratory chain has been compromised by either mutation (16)
or respiration inhibitors (17,18). Its level also increases in cells expressing the hypoxic isoform, Vb,
of cytochrome c oxidase subunit V under aerobic conditions (16). Second, yeast cells carrying a
deletion in YHB1, the structural gene for YHb become sensitive to some conditions that promote
oxidative (19) and other forms of stress (15). It has also been reported that some conditions
promoting oxidative stress increase the expression of YHB1 (19), but YHB1 expression under some
of these conditions have been questioned (15). Finally, it has been reported recently that YHb
metabolizes NO and functions as an NO oxygenase under aerobic conditions and an NO reductase
under anaerobic conditions (4).
To better understand the physiological function of YHb we have examined here the
relationship between respiration and the level of assembled YHb, have established the intracellular
location of YHb, and have looked at the effects of oxygen, respiration, oxidative stress, and the
mitochondrial genome on intracellular YHb localization.
by guest on August 20, 2019
http://ww
w.jbc.org/
Dow
nloaded from
5
Experimental Procedures
Strains, Media, and Growth Conditions. The following strains of S. cerevisiae were
used: JM43 (MATα his4-580 trp1-289 leu2-3, 112 ura3-52 [rho+]) (20) ; JM43 ρ°, an
isochromosomal respiratory-deficient derivative of JM43 that lacks a functional mitochondrial
genome (16); JM43GD5ab (JM43 with cox5b::LEU2 cox5aD::URA3), an isogenic derivative of
JM43 carrying gene disruptions in the COX5a and COX5b genes (21) and DR11 (JM43 with
yhb1::URA1), an isogenic derivative of JM43 carrying a YHB1 gene disruption (19). For aerobic
growth, cells were grown on a shaker (200 r.p.m.) at 28 - 30 0C in YPGal (1% Difco yeast extract,
2% Difco Bacto-peptone, 2% galactose). For anaerobic growth, cells were grown in a fermenter
sparged with 2.5% CO2 in O2-free N2, as described (22). Yeast strains used for examining the
effects of mutations in CuZn or Mn superoxide dismutase on YHb were: EG103 (MATα, leu2-3,
his3∆1, trp1-289, ura3-52), EG110 (EG103 with sod2∆::TRP1), EG118 (EG103 with
sod1∆A::URA3), EG133 (EG103 with sod1∆A::URA3, sod2∆::TRP1) (23). They were kindly
provided by Edith Gralla. For these experiments cells were grown to mid-exponential phase in YPD
media (1% Bacto-yeast extract, 2% bacto-peptone, and 2% dextrose) in a shaker at 200 rpm and
28°C.
Preparation of Whole Cell Lysates. Whole cell extracts were prepared from cells grown to
mid-exponential phase in YPGal or YPD. Cells were harvested by centrifugation (5,000 g for 10
min), washed twice with ice-cold distilled water and re-suspended at 0.5 g wet weight cells per ml in
0.5 ml of RIPA buffer (0.2 M NaCl, 0.125 M NaPO4, pH7.0, 0.0125% (v/v) NP40, 0.125% SDS,
0.03 M Na deoxycholate) in a conical microfuge tube containing 1 g of glass beads (0.25-0.5 mm
diameter). Cells were broken by vortexing in two one minute intervals, separated by one minute on
ice. Cell debris was removed by centrifugation at 5000 X gmax in a Beckman Microfuge 18. The
supernatant was saved and frozen at -80oC until ready for use.
Isolation of Mitochondrial and Cytosol Fractions. For preparation of mitochondrial and
cytosolic fractions, cells were grown to mid-exponential phase, harvested, and spheroplasted as
by guest on August 20, 2019
http://ww
w.jbc.org/
Dow
nloaded from
6
described (24). All subsequent steps were performed at 4o C. Spheroplasts were harvested by
centrifugation (5 min at 3,000 X g), washed gently in post-spheroplast buffer (1.5 M sorbitol, 1 mM
Na2EDTA, 0.1% BSA, pH 7.0), and sedimented at 3,000 X g for 5 min. Washed spheroplasts were
resuspended in lysis buffer (0.6 M mannitol, 2 mM Na2EDTA, 0.1% BSA, pH 7.4), lysed in a
Sorvall Omnimixer (Newton, CT) at low speed for 3 sec and at full speed for 45 seconds, and then
centrifuged for 5 min at 1,900 X g to pellet unbroken cells, nuclei, and debris. The resulting
supernatant was decanted and centrifuged for 10 min at 12,100 X g to pellet mitochondria. The
mitochondrial pellet was washed by resuspension in mitochondrial lysis buffer minus BSA (pH 7.0),
homogenized with a glass/teflon homogenizer, and centrifuged at 1,651 X g for 5 min. The
resulting supernatant was decanted and centrifuged at 23,500 X g for 10 min to pellet the
mitochondria. The post-mitochondrial supernatant, collected after the 23,500 X g centrifugation,
was used as the cytosolic fraction. Protein in the mitochondrial fractions from aerobically-grown
JM43 cells, anaerobically-grown JM43 cells, aerobically-grown JM43ρo cells, and aerobically-
grown JM43GD5ab cells accounts for 9.8%, 9%, 8.5%, and 9.8%, respectively, of the combined
protein in mitochondrial and cytosolic fractions.
Sub-fractionation of Mitochondria. Mitochondrial subfractions were prepared by a
modification of the digitonin fractionation procedure described (25). In this procedure, freshly
isolated mitochondria are converted to mitoplasts, during which the outer membrane and inter-
membrane space fractions are removed. The mitoplasts are then disrupted and the inner membrane
and matrix fractions are separated. To prepare mitoplasts, mitochondria were suspended at a protein
concentration of 10 mg per ml of mitoplast suspension buffer (0.6 M mannitol, 10 mM NaPO4, pH
7.0) and a 1 ml portion of the suspension was treated for 1 min on ice with 0.35 mg digitonin per mg
mitochondrial protein. All subsequent steps were performed at 4o C. The suspension was diluted
immediately with 5 volumes of mitoplast suspension buffer and centrifuged for 10 min at 12,000 x
gmax. The pellet is the mitoplast fraction. The supernatant was carefully separated from the pellet
and centrifuged for 60 min at 144,000 x gmax. The resulting pellet and the supernatant were used as
the outer mitochondrial membrane and the intermembrane space fractions, respectively. The inner
by guest on August 20, 2019
http://ww
w.jbc.org/
Dow
nloaded from
7
membrane and matrix fractions were prepared from the mitoplasts, collected above, as follows.
Mitoplasts were resuspended at 10 mg of protein per ml in 100mM NaPO4, pH 7.0, sonicated for 20
sec at 50 watts with a Branson Sonifier (Model W 185) equipped with a microtip. Sonicated
mitoplasts were centrifuged for 20 min at 95,000 X gmax. The pellet is the inner membrane fraction
and the supernatant is the matrix fraction. The pellet was washed by resuspension in 100mM
NaPO4, pH 7.0 and recovered by centrifugation at 95,000 X gmax for 20 minutes.
Partial Purification of Cytosolic YHb. Freshly isolated cytosolic fraction was subjected a
series of ammonium sulfate fractionations, as modified from Mok et al. 1969 (26). Briefly,
ammonium sulfate was added to 30% saturation, the sample incubated at 40C for 15 min with
stirring, and then centrifuged at 27,000 x gmax for 15 min at 4°C. The pellet was suspended in 100
mM NaPO4, pH 7.0 and saved. The supernatant was adjusted to 45% ammonium sulfate, the
suspension was incubated at 40C for 15 min with stirring, and then centrifuged at 27,000 x gmax for
15 min at 4°C. The pellet was suspended in 100 mM NaPO4, pH 7.0 and saved. The supernatant
was adjusted to 65% ammonium sulfate, the suspension was incubated at 40C for 15 min with
stirring, and then centrifuged at 27,000 x gmax for 15 min at 4°C. The pellet was suspended in 100
mM NaPO4, pH 7.0 and saved. The supernatant was adjusted to 95% saturation, incubated at 40C
for 15 min with stirring, and then centrifuged at 27,000 x gmax for 15 min at 4°C. The pellet was
suspended in 100 mM NaPO4, pH 7.0 and saved. The remaining supernatant was saved. All pellets
were re-suspended to a volume of 3 ml per 100 ml starting volume. All fractions were stored at 4°C
until spectra were recorded and then frozen at -70°C for immunoblot analysis.
Difference Spectroscopy. Whole cell suspensions were prepared for CO-photolysis spectra
as follows. A concentrated cell suspension (0.45 g wet weight /ml) was adjusted to 1 % (w/v)
glucose in a sealed small test tube and incubated without agitation for 5 min at room temperature to
achieve anaerobiosis. The suspension of reduced cells was then adjusted to 30% ethylene glycol
and bubbled with CO for 10 min, prior to transfer to a cuvette. The cuvette was frozen in liquid
nitrogen and CO-photolysis difference spectra on the frozen samples recorded as described (16).
Reduced, carbon monoxide (CO)-ligated difference spectra of cell fractions were recorded at room
by guest on August 20, 2019
http://ww
w.jbc.org/
Dow
nloaded from
8
temperature, as follows. Each cell fraction was reduced with sodium dithionite and a spectrum was
recorded. Then each was bubbled slowly with CO gas (99.5%) for 5 min. The visible/Soret spectra
of the same sample were recorded before and after exposure to CO. The base line spectrum,
obtained from the difference between the two spectra of the same reduced sample, was subtracted
from the reduced minus CO-ligated difference spectra. All spectra were recorded using an SLM
AMINCO DW2000 dual wavelength scanning UV-visible spectrophotometer (SLM Instruments,
Inc.) with the following settings: dual beam, wavelength acquisition, filter slow, slit width 0.8 nm,
recording monochrometer (monochrometer 2) 1 from 390 nm to 700 nm, and the reference
monochromator (monochrometer 1) set to a wavelength of 577nm.
Preparation of Antibodies. Polyclonal antibodies were prepared to YHb, PET100p and
cytochrome c oxidase subunit IV. For YHb, an antibody was obtained against a peptide synthesized
to correspond to amino acid residues 379 to 397 (17) and for PET100p an antibody was obtained
against a peptide synthesized to correspond to residues 95 to 111 (27). They were synthesized with
an amino terminal cysteine and coupled through this cysteine to Maleimide Activated Keyhole
Limpet Hemacyanin. The peptide-KLH conjugate was mixed with Freunds Complete Adjuvant and
1 mg of conjugate was injected subcutaneously into New Zealand white rabbits. Booster injections
(0.5 mg) were given with Freund's Incomplete Adjuvant at 2 and 8 weeks. Antiserum was collected
at 2 week intervals with the terminal collection at 12 days after the final boost. Antibodies to HPLC
purified cytochrome c oxidase subunit IV were prepared as described (28). Monoclonal antibodies
to yeast phosphoglycerate kinase (and porin) were obtained from Molecular Probes, Inc. (Eugene,
OR).
Measurement of NO Consumption. NO consumption was measured using a Clark-type NO
electrode (World Precision Instruments, Sarasota, FL). All measurements were done in triplicate in a
water jacketed chamber with stirring, at 30°C. The electrode was calibrated with a 50µM solution of
KNO2 to generate a series of known concentrations of NO (100, 200, 400 nM) in 10 ml of a 0.1M
KI, 0.1 M H2SO4 solution. NO consumption of whole cell extracts, mitochondrial or cytosolic
fractions was then measured in 2mls of PBS (80 mM Na2HPO4, 20 mM NaH2PO4, 100 mM NaCl),
by guest on August 20, 2019
http://ww
w.jbc.org/
Dow
nloaded from
9
250 µM NADH, and 0.1mM EDTA after the addition of 2µM NO from an NO-saturated solution of
distilled water. Preparation of the NO-saturated solution was as described by the manufacturer of
the NO electrode. Using a buffer control it is possible to determine the amount of NO injected into
the chamber as well as its stability in the absence of cell extract.
Northern Blotting. For Northern analysis, RNA samples (30 µg) were separated on 1.5%
agarose gels containing 0.22M formaldehyde (29), transferred to Scleicher and Schuell Nytran
membranes, and hybridized according to the manufacturer's suggestions. DNA probes were
prepared by random-primer labelling of double stranded DNA fragments using [α-32P] dCTP .
Probes were a 600-bp Ssp1 fragment for YHB1 and a 500-bp Sty1 fragment for ACT1. Blots were
quantitated with an Ambis Radioanalytic Imaging system.
SDS-PAGE Electrophoresis and Immunoblot Analysis. SDS-PAGE were performed either
on 16% SDS polyacrylamide gels containing 10% glycerol and 3.6 M urea (24) or 10% SDS
polyacrylamide gels (30), as indicated in the Figure Legends. Following electrophoresis, proteins
were electroblotted to nitrocellulose and immunoblots were quantitated from multiple exposures
using KODAK 1D image analysis software.
Miscellaneous Methods. Protein determination was performed using either the Lowry assay
(31) or the BCA assay (Pierce Biotechnology) with BSA as a standard.
by guest on August 20, 2019
http://ww
w.jbc.org/
Dow
nloaded from
10
Results
Expression of YHb in rho+ and rhoo cells. Previously, we have reported that the
level of the reduced YHb CO-photoproduct is low in respiration-proficient cells and is
increased in respiration-deficient mutants (16). This can be seen in Figure 1, which
compares the CO photolysis difference spectra (CO-reduced minus reduced) of whole
suspensions of JM43, a respiratory-proficient rho+ strain, and its isochromosomal derivative,
JM43ρo, a respiratory-deficient rho0 strain. The major CO- liganded pigment in JM43 is
cytochrome c oxidase. It absorption maxima are at 447 and 610 nm and absorption minima
at 434 and 590 nm. In contrast, the main CO- liganded pigment in JM43ρo is YHb. Its
absorption maxima are at 441, 557 and 590 nm with absorption minima at 423, 538 and 574
nm. From Figure 1 and from previous studies that have examined the CO- recombination
kinetics of JM43 (16) it is clear that JM43 lacks a spectrally detectable CO-binding pigment
that has the absorption characteristics of YHb. In contrast, JM43 ρo cells contain a CO-
binding pigment with all of the spectral signatures of YHb. Despite the absence of a CO-
spectral signature assignable to YHb in JM43 cells we have found that YHB1 mRNA levels
in JM43 and JM43ρo are essentially identical (Figure 1B).
The presence of YHb mRNA but absence of a CO-liganded YHb in JM43 cells
suggested one of three things. First, JM43 cells may not translate YHB1 mRNA and hence
lack the YHb apo-protein. Second, JM43 cells may lack assembled and functional YHb.
Third, JM43 cells may express and assemble YHb but maintain the heme of YHb in an
oxidized state, which is incapable of binding CO. In order to examine these possibilities we
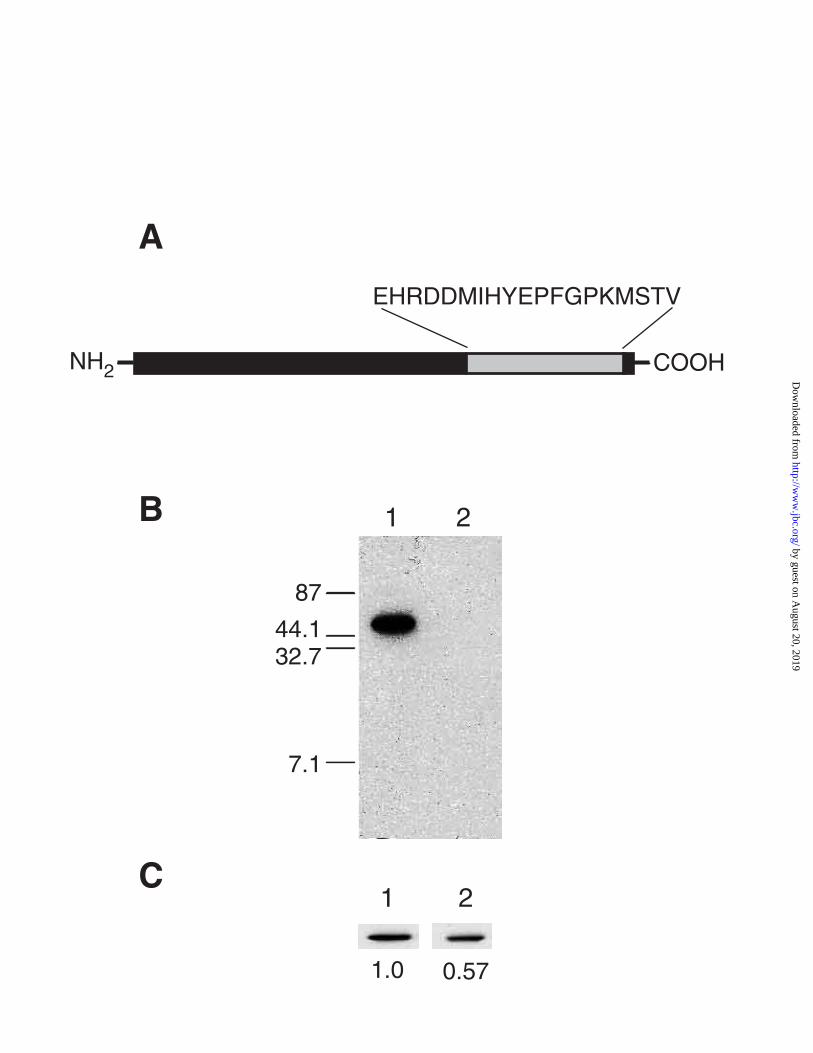
first asked if the YHb apoprotein is present in rho+ cells. A polyclonal antibody, anti-YHbC,
to a 19 amino acid synthetic peptide whose sequence corresponds to that predicted from the
carboxyl terminus of the YHB1 gene (Figure 2A), was produced to address this question.
The reactivity and specificity of this antibody was analyzed by immuno-blot analysis of
whole cell extracts prepared from JM43 and DR11, a derivative of JM43 that carries a null
mutation in the YHB1 gene. From Figure 2B it is clear that the antibody detects an antigen
by guest on August 20, 2019
http://ww
w.jbc.org/
Dow
nloaded from
11
in whole cell extracts from JM43 but not from DR11. Th is antigen has an apparent
molecular weight of 47,000 Da, which is consistent with the molecular weight predicted for
YHb from the sequence of its gene (17). Because the antigen recognized by anti-YHbC is
present in JM43 but not DR11 and has a size similar to that predicted from the DNA
sequence of YHB1 we conclude that anti-YHbC recognizes and is specific for YHb. We also
conclude that YHb apo-protein is expressed in JM43 cells. To compare levels of YHb
apoprotein in JM43 and JM43ρo cells we subjected whole cell extracts from both to
immuno-blot analysis. From Figure 2C it can be seen that YHb levels in JM43ρ0 cells are
57% of the level in JM43 cells. The finding that YHb protein is present in JM43 and at
higher levels than in JM43ρo allows us to conclude that the absence of a spectrally detectable
YHb protein in JM43 cells can not be explained by a low level of expression of the YHb
apoprotein.
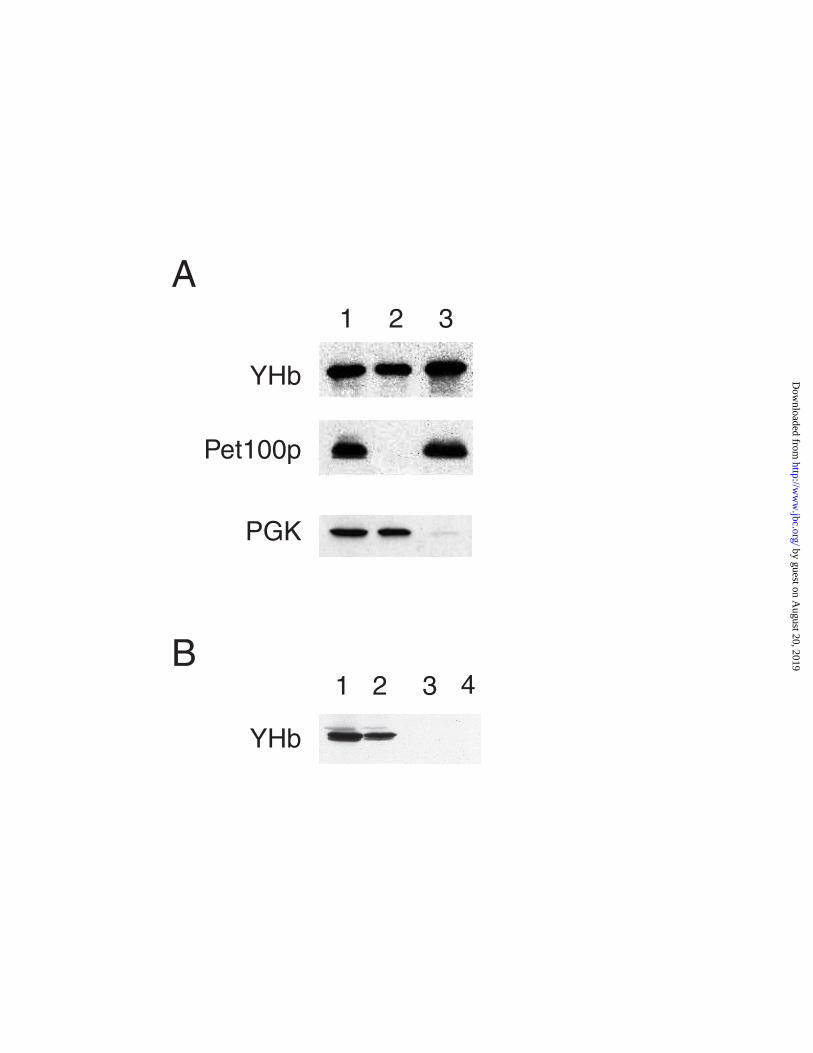
Assembled YHb is Present in Both the Cytosol and Mitochondrial Matrix of
Respiration-Proficient Cells. The results presented above make clear that the YHb apo-
protein is expressed in JM43 cells even though no CO-difference spectral signature for
assembled YHb can be detected in these cells. To gain further insight concerning this
apparent discrepancy we examined the intracellular location of YHb. We were particularly
interested in determining whether YHb is a mitochondrial protein because rhoo cells lack
both a mitochondrial genome and mitochondrial respiration. By immuno-blotting cellular
fractions against antisera to YHb, Pet100p (an inner mitochondrial membrane protein), and
3- phosphoglycerate kinase (a cytosolic protein) we find that YHb is present in both
mitochondrial and cytosolic fractions (Figure 3A) while, as expected, PET100p is present
only in the mitochondrial fraction, and PGK is present mainly in the cytosolic fraction.
Immunoblot analysis reveals the complete lack of detectable YHb in both the cytosolic and
mitochondrial fractions (Figure 3B) from strain DR11, indicating that the disruption of the
YHB1 gene alone is sufficient to abolish both cytosolic and mitochondrial forms of YHb.
by guest on August 20, 2019
http://ww
w.jbc.org/
Dow
nloaded from
12
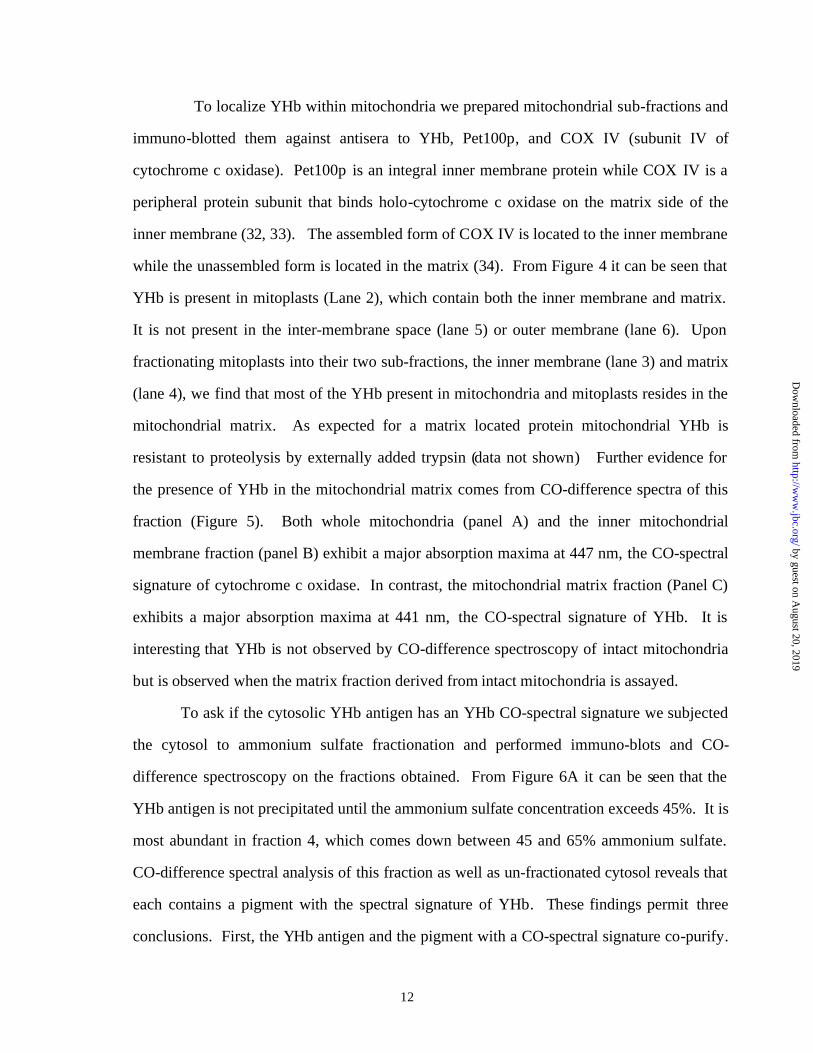
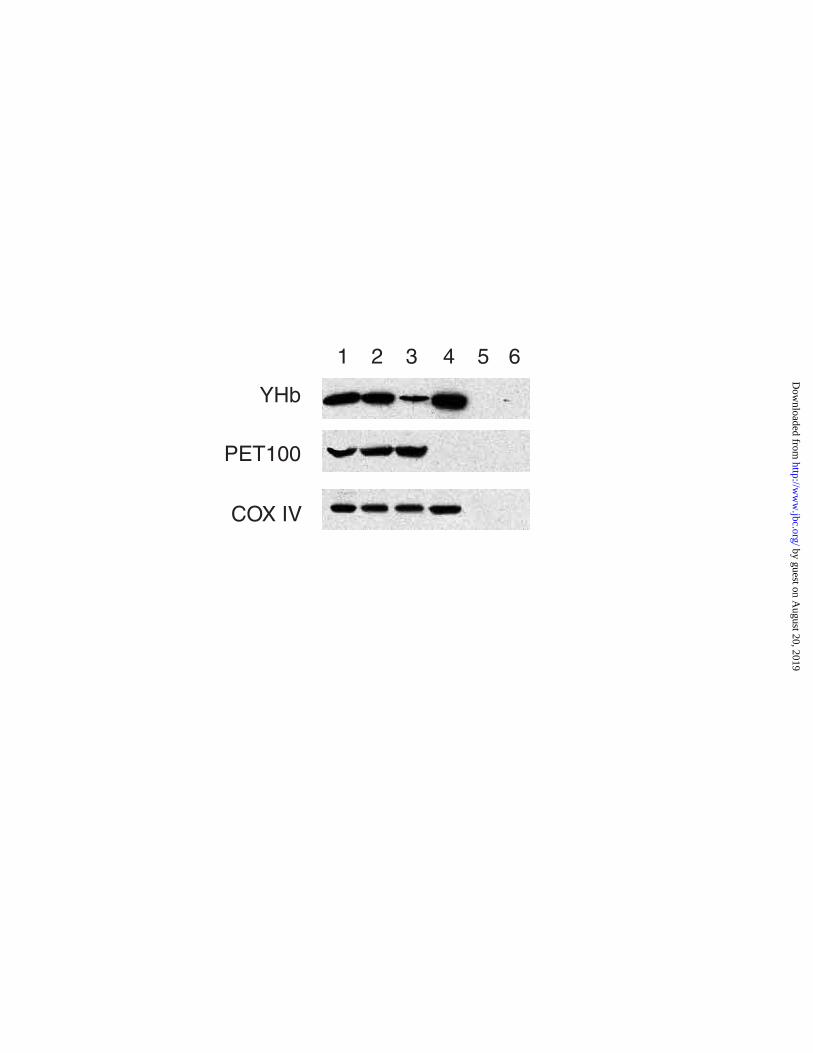
To localize YHb within mitochondria we prepared mitochondrial sub-fractions and
immuno-blotted them against antisera to YHb, Pet100p, and COX IV (subunit IV of
cytochrome c oxidase). Pet100p is an integral inner membrane protein while COX IV is a
peripheral protein subunit that binds holo-cytochrome c oxidase on the matrix side of the
inner membrane (32, 33). The assembled form of COX IV is located to the inner membrane
while the unassembled form is located in the matrix (34). From Figure 4 it can be seen that
YHb is present in mitoplasts (Lane 2), which contain both the inner membrane and matrix.
It is not present in the inter-membrane space (lane 5) or outer membrane (lane 6). Upon
fractionating mitoplasts into their two sub-fractions, the inner membrane (lane 3) and matrix
(lane 4), we find that most of the YHb present in mitochondria and mitoplasts resides in the
mitochondrial matrix. As expected for a matrix located protein mitochondrial YHb is
resistant to proteolysis by externally added trypsin (data not shown) Further evidence for
the presence of YHb in the mitochondrial matrix comes from CO-difference spectra of this
fraction (Figure 5). Both whole mitochondria (panel A) and the inner mitochondrial
membrane fraction (panel B) exhibit a major absorption maxima at 447 nm, the CO-spectral
signature of cytochrome c oxidase. In contrast, the mitochondrial matrix fraction (Panel C)
exhibits a major absorption maxima at 441 nm, the CO-spectral signature of YHb. It is
interesting that YHb is not observed by CO-difference spectroscopy of intact mitochondria
but is observed when the matrix fraction derived from intact mitochondria is assayed.
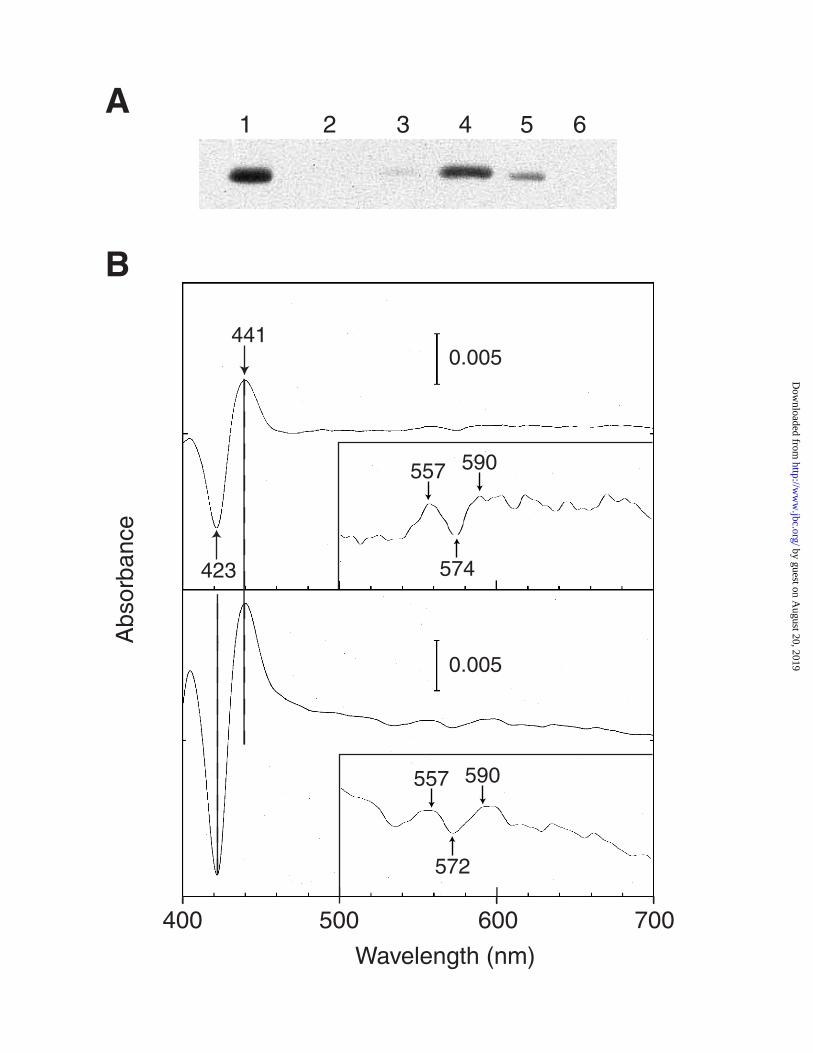
To ask if the cytosolic YHb antigen has an YHb CO-spectral signature we subjected
the cytosol to ammonium sulfate fractionation and performed immuno-blots and CO-
difference spectroscopy on the fractions obtained. From Figure 6A it can be seen that the
YHb antigen is not precipitated until the ammonium sulfate concentration exceeds 45%. It is
most abundant in fraction 4, which comes down between 45 and 65% ammonium sulfate.
CO-difference spectral analysis of this fraction as well as un-fractionated cytosol reveals that
each contains a pigment with the spectral signature of YHb. These findings permit three
conclusions. First, the YHb antigen and the pigment with a CO-spectral signature co-purify.
by guest on August 20, 2019
http://ww
w.jbc.org/
Dow
nloaded from
13
Second, the YHb antigen present in the cytosolic fraction is assembled with its prosthetic
groups. And third, even though the YHb pigment can not be observed in whole cells it is
nonetheless present and is easily observed in broken cell extracts.
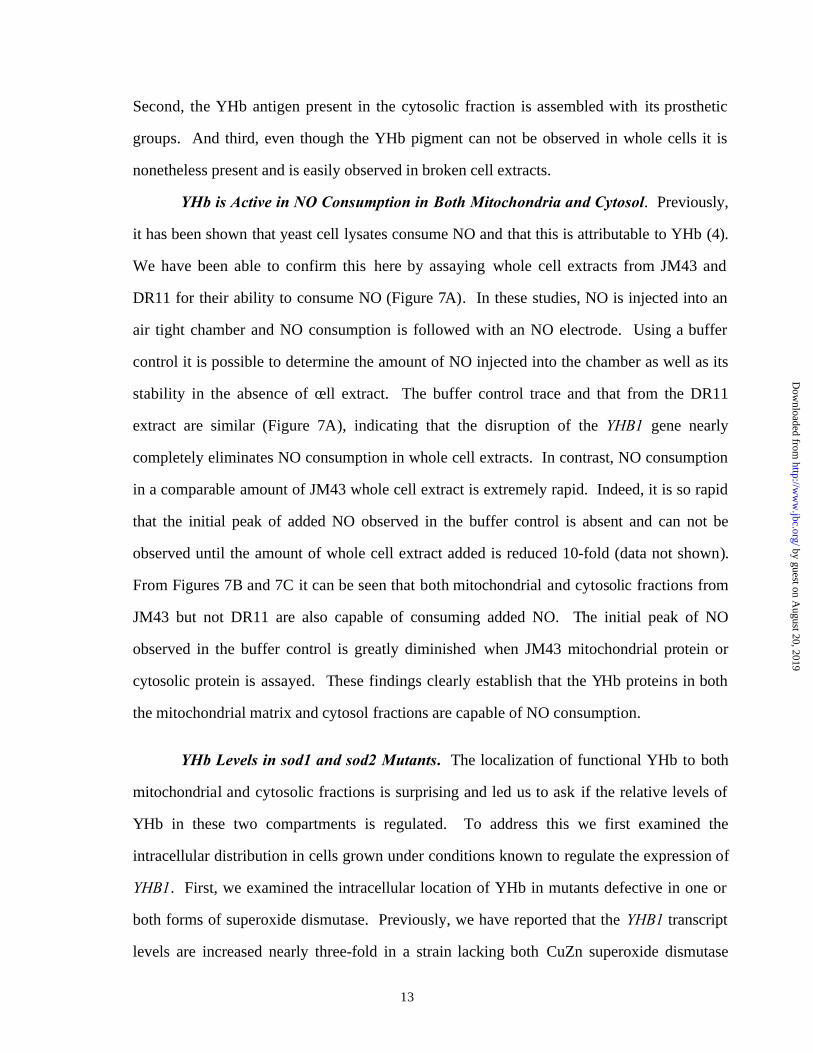
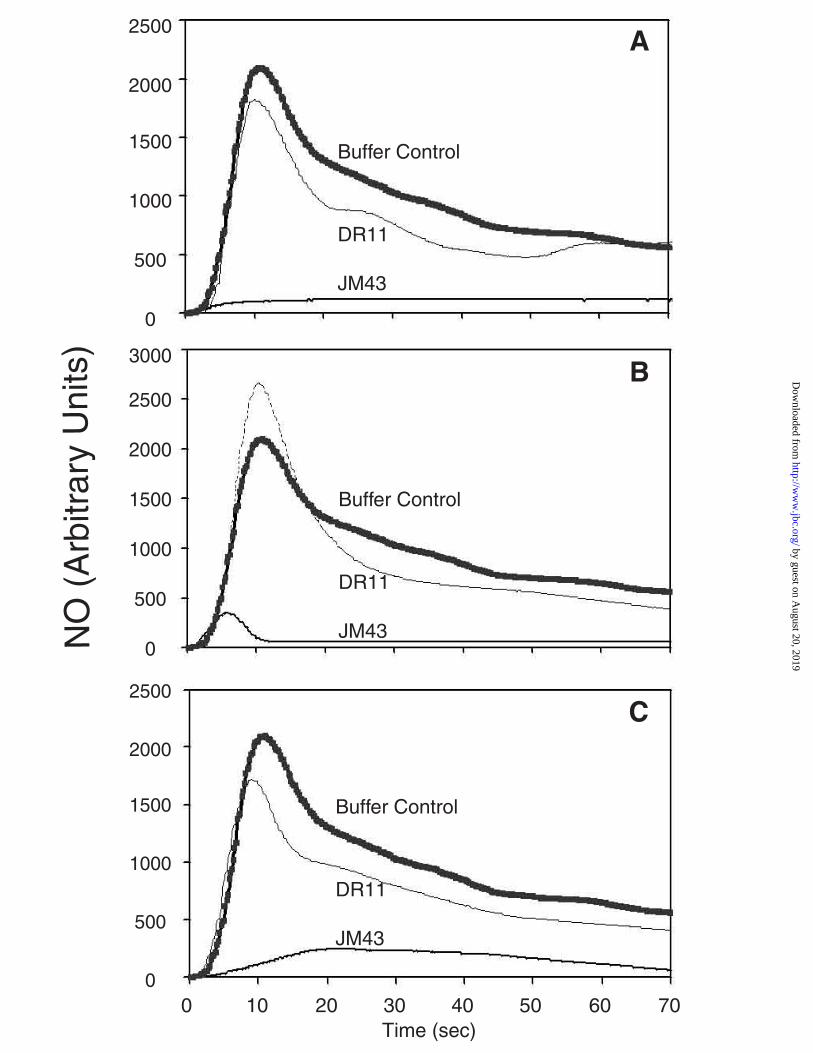
YHb is Active in NO Consumption in Both Mitochondria and Cytosol. Previously,
it has been shown that yeast cell lysates consume NO and that this is attributable to YHb (4).
We have been able to confirm this here by assaying whole cell extracts from JM43 and
DR11 for their ability to consume NO (Figure 7A). In these studies, NO is injected into an
air tight chamber and NO consumption is followed with an NO electrode. Using a buffer
control it is possible to determine the amount of NO injected into the chamber as well as its
stability in the absence of cell extract. The buffer control trace and that from the DR11
extract are similar (Figure 7A), indicating that the disruption of the YHB1 gene nearly
completely eliminates NO consumption in whole cell extracts. In contrast, NO consumption
in a comparable amount of JM43 whole cell extract is extremely rapid. Indeed, it is so rapid
that the initial peak of added NO observed in the buffer control is absent and can not be
observed until the amount of whole cell extract added is reduced 10-fold (data not shown).
From Figures 7B and 7C it can be seen that both mitochondrial and cytosolic fractions from
JM43 but not DR11 are also capable of consuming added NO. The initial peak of NO
observed in the buffer control is greatly diminished when JM43 mitochondrial protein or
cytosolic protein is assayed. These findings clearly establish that the YHb proteins in both
the mitochondrial matrix and cytosol fractions are capable of NO consumption.
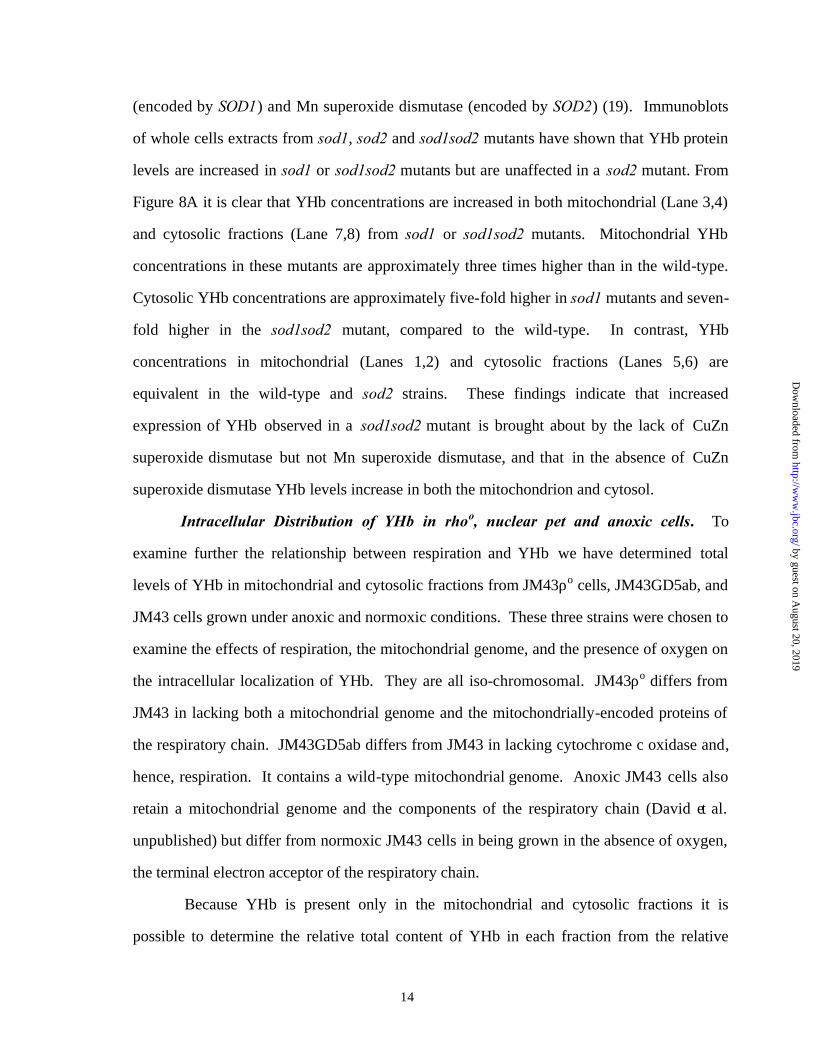
YHb Levels in sod1 and sod2 Mutants. The localization of functional YHb to both
mitochondrial and cytosolic fractions is surprising and led us to ask if the relative levels of
YHb in these two compartments is regulated. To address this we first examined the
intracellular distribution in cells grown under conditions known to regulate the expression of
YHB1. First, we examined the intracellular location of YHb in mutants defective in one or
both forms of superoxide dismutase. Previously, we have reported that the YHB1 transcript
levels are increased nearly three-fold in a strain lacking both CuZn superoxide dismutase
by guest on August 20, 2019
http://ww
w.jbc.org/
Dow
nloaded from
14
(encoded by SOD1) and Mn superoxide dismutase (encoded by SOD2) (19). Immunoblots
of whole cells extracts from sod1, sod2 and sod1sod2 mutants have shown that YHb protein
levels are increased in sod1 or sod1sod2 mutants but are unaffected in a sod2 mutant. From
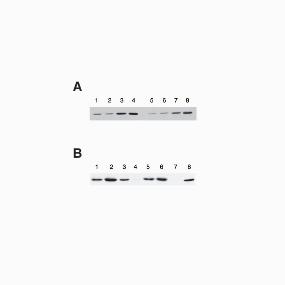
Figure 8A it is clear that YHb concentrations are increased in both mitochondrial (Lane 3,4)
and cytosolic fractions (Lane 7,8) from sod1 or sod1sod2 mutants. Mitochondrial YHb
concentrations in these mutants are approximately three times higher than in the wild-type.
Cytosolic YHb concentrations are approximately five-fold higher in sod1 mutants and seven-
fold higher in the sod1sod2 mutant, compared to the wild-type. In contrast, YHb
concentrations in mitochondrial (Lanes 1,2) and cytosolic fractions (Lanes 5,6) are
equivalent in the wild-type and sod2 strains. These findings indicate that increased
expression of YHb observed in a sod1sod2 mutant is brought about by the lack of CuZn
superoxide dismutase but not Mn superoxide dismutase, and that in the absence of CuZn
superoxide dismutase YHb levels increase in both the mitochondrion and cytosol.
Intracellular Distribution of YHb in rhoo, nuclear pet and anoxic cells. To
examine further the relationship between respiration and YHb we have determined total
levels of YHb in mitochondrial and cytosolic fractions from JM43ρo cells, JM43GD5ab, and
JM43 cells grown under anoxic and normoxic conditions. These three strains were chosen to
examine the effects of respiration, the mitochondrial genome, and the presence of oxygen on
the intracellular localization of YHb. They are all iso-chromosomal. JM43ρo differs from
JM43 in lacking both a mitochondrial genome and the mitochondrially-encoded proteins of
the respiratory chain. JM43GD5ab differs from JM43 in lacking cytochrome c oxidase and,
hence, respiration. It contains a wild-type mitochondrial genome. Anoxic JM43 cells also
retain a mitochondrial genome and the components of the respiratory chain (David et al.
unpublished) but differ from normoxic JM43 cells in being grown in the absence of oxygen,
the terminal electron acceptor of the respiratory chain.
Because YHb is present only in the mitochondrial and cytosolic fractions it is
possible to determine the relative total content of YHb in each fraction from the relative
by guest on August 20, 2019
http://ww
w.jbc.org/
Dow
nloaded from
15
concentration of YHb in each fraction and the relative total protein content of each fraction
(Table 1). The majority of YHb in aerobically grown JM43 cells is present in the cytosolic
fraction; this represents 36.3 arbitrary units of the protein. As seen above (Figure 1 and
Table 1), the level of YHb in JM43ρo cells is about 57 % of its level in JM43 cells.
Surprisingly, nearly all of the YHb protein in JM43ρo cells is found in the cytosol. (Figure
8B and Table 1). JM43ρo cells differ from JM43 cells both genotypically and
phenotypically; they lack a mitochondrial genome and they lack respiration. To address
whether the intracellular distribution of YHb is affected by the lack of the mitochondrial
genome or by the lack of respiration we examined mitochondrial and cytosolic YHb levels in
JM43GD5ab, a nuclear pet mutant that retains a wild type mitochondrial genome but carries
gene disruptions in both subunit V isoforms of cytochrome c oxidase and does not respire.
This strain distributes its YHb between mitochondrial and cytosolic fractions (Figure 8, lanes
5 and 6; Table 1) in the same way as JM43, its wild type parent. Hence, the altered
distribution of YHb in JM43ρo can not be attributed to the lack of respiration per se. Further
evidence for this comes from an examination of the intracellular distribution of YHb in
anoxically-grown JM43 cells. Anoxic growth has only a slight effect on total YHb protein
levels in JM43 cells (Table 1). Interestingly, however, it does affect the intracellular
distribution of YHb in a way that is opposite from that observed in rhoo cells. All of the YHb
in anoxic JM43 cells is located in the pro-mitochondrial fraction (Figure 8, lanes 7 and 8
Table 1). None can be observed in the cytosol. Interestingly, the number of arbitrary units
of YHb protein in promitochondria of anoxic JM43 cells is nearly identical to the number of
arbitrary units of units of YHb protein in the cytosolic fraction of aerobic JM43 cells.
When considered together, these findings suggest that the altered distribution of YHb
observed in rhoo cells is the result of the lack of the mitochondrial genome and not the lack
of respiration. These results and those obtained with the sod mutants, indicate that yeast
cells can differentially regulate the intracellular level of YHb and its intracellular distribution
between cytosolic and mitochondrial fractions.
by guest on August 20, 2019
http://ww
w.jbc.org/
Dow
nloaded from
16
Discussion
This study presents three novel findings concerning the YHb flavohemoglobin in yeast.
First, although CO-liganded YHb is not detectable in intact reduced rho+ cells it is detectable in cell
fractions from rho+ cells. Second, functional YHb localizes to two distinct intracellular
compartments: the cytosol and mitochondrial matrix. And third, the distribution of YHb between
the cytosol and mitochondrial matrix is affected by anoxia and the mitochondrial genome.
Our findings that YHB1 mRNA and YHb protein are expressed in Rho+ cells, and that a CO-
liganded YHb is not detectable in intact rho+ cells but is detectable in cell fractions from rho+ cells
seem to be paradoxical. There appear to be at least two plausible explanations. One explanation for
this apparent discrepancy is that accessibility of intracellular YHb to NAD(P)H or NADH, its
physiological reductants (35), is limited in vivo, most likely due to competition between YHb and
the mitochondrial respiratory chain. In order to bind CO the heme group in YHb must be reduced.
In the absence of reduced heme, CO can not bind to YHb in vivo and a spectral signature would not
be observed. According to this explanation, CO-liganded YHb would be observable in cell fractions
and in rhoo cells because the competition for NAD(P)H and/or NADH would be absent. A second,
and more likely, explanation is that YHb heme is maintained in the oxidized state in intact cells
because it has a high turnover rate with NO (35). As such, electrons would be released from the
heme group and act on NO as soon as it binds to the heme. According to this explanation, CO-
liganded YHb should be observed when levels of its substrate, NO, decrease. Because NO is very
unstable its level should decrease dramatically when cells are broken. This decreased level of NO in
broken cell extracts could explain why CO-liganded YHb is observed in cell fractions from rho+
cells but not in intact rho+ cells. Because CO-liganded YHb is observed in rhoo cells, this
explanation would also imply that the respiratory chain and/or the mitochondrial genome is required
for NO production. Involvement of the mitochondrial respiratory chain in NO production could
explain our observation that a CO-liganded YHb pigment can not be observed in intact respiring
mitochondria but can be observed when the mitochondrial matrix sub-fraction is isolated.
by guest on August 20, 2019
http://ww
w.jbc.org/
Dow
nloaded from
17
The presence of YHb that is functional in NO consumption in both cytosolic and
mitochondrial fractions of JM43 implies that NO is produced in both cellular compartments in yeast
cells. This is not surprising given a recent report that yeast cells express proteins that cross- react
with all three mammalian nitric oxide synthase isoforms – neuronal (NOS1), inducible (NOS2) and
endothelial (NOS3)(36). Although the intracellular location of the yeast isoforms has not been
established yet at least one of the mammlian nitric oxide isoforms (NOS3) is associated with
mitochondria (37, 38).
Localization of YHb to mitochondria can help explain how it functions both in oxidative
stress (19) and in nitrosidative stress (4). Indeed, it is likely that YHb protects yeast cells from
oxidative stress primarily by controlling levels of mitochondrial NO, which is a potent inhibitor of
cytochrome c oxidase and respiration (39) and a reactant that together with superoxide can form
peroxynitrite (40). Peroxynitrite participates in some forms of protein nitration (41). In the absence
of YHb, NO levels would increase (4) and inhibit cytochrome c oxidase, leading to the production
of superoxide, and hence enhanced levels of peroxynitrite. Thus, YHb can reduce superoxide levels
not by dismuting superoxide, like superoxide dismutase, but rather by reducing its formation via the
respiratory chain. Our finding that YHb is present mainly in the cytosol of rhoo cells is consistent
with this hypothesis because these cells lack important components of the mitochondrial respiratory
chain (cyochrome bc1 and cytochrome c oxidase) and hence are respiration-deficient and incapable
of producing superoxide. Our finding that YHb is present in both the cytosol and mitochondrion of
JM43GD5ab cells is also interesting because although these cells lack cytochrome c oxidase they
still retain the bc1 complex and a partial respiratory chain. Hence, they are capable of superoxide
production. The presence of YHb in the promitochondria of anoxic cells is somewhat surprising
considering that these cells are grown in the absence of oxygen and have greatly reduced levels of
oxidative stress (42). However, this finding implies that NO is present in anoxic mitochondria and
is consistent with recent studies that have demonstrated that the concentration of NO increases in rat
liver mitochondrial suspensions subjected to low oxygen tensions (43) and that mitochondrial
protein S-nitrosylation occurs in anoxic rat liver mitochondria (44).
by guest on August 20, 2019
http://ww
w.jbc.org/
Dow
nloaded from
18
Our finding that the ratio of YHb in mitochondrial and cytosolic fractions differs in rho+,
rho0, and anoxic cells indicates that yeast cells can differentially regulate the intracellular
distribution of YHb between cytosol and mitochondrion. Precedence for the regulated differential
targeting of a single yeast protein between two different intracellular locations comes from studies
on the dual targeting of catalase A to mitochondria and peroxisomes (45). The level of respiration
and/or growth on oleic acid influences the intracellular distribution of this protein. The presence or
absence of respiration does not appear to influence the intracellular distribution of YHb because the
mitochondrial/cytosolic ratio of YHb is identical in JM43, a respiration-proficient strain, and
JM43GD5ab, a respiratory-deficient derivative of JM43. Moreover, the ratios of
mitochondrial/cytosolic YHb in JM43ρo and anoxic JM43 cells are nearly the converse of one
another even though both cells are respiration-deficient. These findings clearly demonstrate that the
absence of respiration per se is not a determinant of the intracellular localization of YHb, and
indicate that anoxia and the mitochondrial genome influence the intracellular localization of YHb.
Previously, we have shown that the mitochondrial genome, acting independently of
respiration and oxidative phosphorylation, affects expression of a subset of nuclear genes (46) and
have termed this type of mitochondrial-nuclear crosstalk Intergenomic signaling. Genes that are
regulated by Intergenomic signaling are specifically down-regulated in cells that lack a
mitochondrial genome (46). More recently, using microarray analysis, we have been able to show
that this pathway affects the expression of over 100 nuclear genes in yeast (Dong, Liang, and
Poyton, unpublished). The target genes of this pathway are different than the target genes of the
better understood Retrograde Regulation pathway, which involves mitochondrial respiration and
which connects altered mitochondrial respiration to altered carbon and nitrogen metabolism (47). In
considering how the mitochondrial genome affects the intracellular distribution of YHb is seems
likely that one of the nuclear target genes affected by Intergenomic signaling encodes a protein that
functions in the intracellular partitioning of YHb.
Two lines of evidence indicate that the mitochondrial and cytosolic forms of YHb are
derived from a single nuclear gene, YHB1. First, a null mutation in YHB1 simultaneously abolishes
by guest on August 20, 2019
http://ww
w.jbc.org/
Dow
nloaded from
19
both proteins. Second, transformation of a yhb1 null mutant with a plasmid containing the YHb
protein leads to the appearance of YHb in both the mitochondrial matrix and the cytosol (19,
Fontaine and Poyton, unpublished observations). The presence of a single nuclear gene product in
multiple intracellular compartments is not without precedence. Indeed, a growing number of
mitochondrial proteins are being found in both the cytosol and mitochondrion (48, 49). These
include the histidyl-tRNA synthase (50), fumarase (51, 52), CuZn superoxide dismutase (53), and
dihydroxybutanone phosphate synthase (54) from yeast, thioredoxin from Drosophila (55) , the
thioredoxin glutathione reductase from Echinococcus (56), and several human proteins (48),
including aspartate aminotransferase (57) and the Wilson’s copper transport protein (58). Close
examination of several of these proteins has revealed a multiplicity of mechanisms for the
localization of proteins to the mitochondrion and cytosol (48). These include the use of multiple
transcription start sites, multiple translation start sites, and mitochondrial import followed by
retrograde movement out into the cytosol (52). Currently, it is not clear which of these mechanisms
is used by YHb. Moreover, because the DNA sequence of YHB1 does not predict the presence of a
mitochondrial signal peptide it is also not clear how YHb is targeted to the mitochondrial matrix.
One possibility is that, like some other nuclear-coded mitochondrial proteins, YHb uses an internal
targeting sequence (59, 60) for import into the mitochondrion. Alternatively, the YHb gene may
produce an alternative transcript that puts a mitochondrial targeting sequence on the YHb protein.
These possibilities are currently under study.
Acknowledgements We gratefully acknowledge the technical assistance provided by Susan Fontaine.
by guest on August 20, 2019
http://ww
w.jbc.org/
Dow
nloaded from
20
REFERENCES
1. Hardison, R. (1998) J. Exp. Biol. 201, 1099-1117.
2. Riggs, A. (1991) Am. Zool. 31, 535-545.
3. Poole, R.K. and Hughes, M.N. (2000) Mol. Microbiol. 36, 775-783.
4. Liu, L., Zeng, M., Hausladen, A., Heitman, J. and Stammler, J.S. (2000) Proc. Natl. Acad. Sci. USA. 97, 4672-4676.
5. Jia, L., Bonaventura, C., Bonaventura, J., and Stamler, J. S. (1996) Nature 380, 221-226.
6. Stamler, J.S., Jia, L., Eu, J.P., McMahon, T.J., Demchenko, I.T., Bonaventura, J., Gernett, K., and Piantosidase, C.A. (1997) Science 276, 2034-2037.
7. Gow, A. J., and Stamler, J.S. (1998) Nature, 391, 169-173.
8. Gow, A. J., Luchsinger, B.P., Pawloski, J.R., Singel, D.J., and Stamler, J.S. (1999) Proc. Natl. Acad. Sci USA 96, 9027-9032.
9. Membrillo-Hernandez, J., Coopamah, M.D.,Anjun, M.F., Stevanin, T.M., Kelly, A. Hughes, M.N., and Poole, R.K. (1999) J. Biol. Chem. 274, 748-754.
10. Gardner, P.R., Gardner, A.M., Martin, L.A. and Salzman, A.L.. (1998) Proc. Natl. Acad. Sci USA 95, 10378-10383.
11. Hausladen, A., Gow, A.J., and Stammler, J.S. (1998) Proc. Natl. Acad. Sci USA 95, 14100-14105.
12. Cramm, R., Siddiqui, R.A., and Friedrich, B. (1994) J. Biol. Chem. 269, 7349-7353.
13. La Celle, M., Kumano, M., Kurita, K., Yamane, K., Zuber, P. And Nakano, M.M. (1996) J. Bacteriol. 178, 3803-3808.
14. Frey, A.D., Bailey, J.E., and Kallio, P.T. (2000) Appl. Environ. Microbiol. 66, 98-104.
15. Buisson, N. and Labbe-Bois, R. (1998) J. Biol. Chem. 273, 9527-9533.
16. Waterland, R.A., Basu, A, Chance, B. and Poyton, R.O. (1991) J. Biol. Chem. 266, 4180-4186.
17. Zhu, H., and Riggs, A.F. (1992) Proc. Natl. Acad. Sci USA 89, 5015-5019.
18. Ycas, M. (1956) Exp. Cell Res. 11, 1-6.
19. Zhao, X-J., Raitt, D., Burke, P.V., Clewell, A.S., Kwast, K.E., and Poyton, R.O. (1996) J. Biol. Chem. 271, 25131-25138.
20. McEwen, J.E., Ko, C., Kloeckner-Gruissem, B., and Poyton, R.O. (1986). J. Biol. Chem. 261, 11872-11879.
by guest on August 20, 2019
http://ww
w.jbc.org/
Dow
nloaded from
21
21. Trueblood, C.E. and Poyton, R.O. (1987) Mol. Cell. Biol. 7, 3520-3526.
22. Poyton, R.O., Dirmeier, R., O’Brien, K., David, P. and Dodd, A. (2004) Meth. Enzymol. 381, 644-662.
23. Longo, V.D., Gralla, E.B., and Valentine, J.S. (1996). J. Biol. Chem. 271, 12275-12280.
24. Allen, L.A., Zhao, X.J., Caughey, W., and Poyton, R.O. (1995). J. Biol. Chem. 270, 110-118.
25. Velours, J., Guerin, B., and Duvert, M. (1977). Arch. Biochem. Biophys. 182, 295-304.
26. Mok, T.C.K., Richard, P.A.D., and Moss, F.J. (1969) Biochim. Biophys. Acta 172, 438-449.
27. Forsha, D., Church, C., Wazny, P., and Poyton, R. O. (2001) Biochem. Soc. Trans. 29, 436-441.
28. Poyton, R.O. and Schatz, G. (1975). J. Biol. Chem. 250, 762-766.
29. Tsang, S. S. X. Yin, C. Guzzo-Arkuran, V. S. Jones, and Davison, AJ. 1993. BioTechniques. 14, 380-381. 1993.
30. O’Brien, K.M., Dirmeier, R., Engle, M., Cassanova, N. and Poyton, R.O. (2004) J. Biol. Chem. In press.
31. Lowry, O.H., Rosebrough, N.J., Farr, A.L., and Randall, R.J. (1951). J. Biol. Chem. 193, 265-275.
32. Tsukihara, T., Aoyama, H., Yamashita, E., Tomizaki, T., Yamaguchi, H., Shinzawa-Itoh, K., Nakashima, R., Yaono, R., and Yoshikawa, S. (1995). Science 269, 1069-1074.
33. Burke, P. V. and Poyton, R. O. (1998) J. Exptl. Biol. 201, 1163-1175.
34. Church, C., Goehring, B., Forsha, D., Wazny, P., and Poyton, R.O. (2004) J. Biol. Chem. Published online, JBC papers in press
35. Gardner, P.R., Gardner, A.M., Martin, L., Dou, Y., Li, T., and Olson, J.S., Zhu, H., and Riggs, A.F. (2000) J. Biol. Chem. 275, 31581-31587.
36. Domitrovic, T., Palhano, F.L., Barja-Fidalgo, C., DeFreitas, M., Orlando, M.T.D., and Fernandes, P.M.B. (2003) FEMS Yeast Res. 3, 341-346.
37. Elfering, S.L., Sarkela, T.M. and Giulivi, C. (2002) J. Biol. Chem. 277, 38079-38086.
38. Gao, S., Chen, J., Brodsky, S.V., Huang, H., Adler, S., Lee, J.H., Dhadwell, N., Chen-Gould, L., Gross, S.S., and Goligorsky, M.S. (2004) J. Biol. Chem. 279, 15968-15974.
39. Boveris, A., Costa, L.E., Poderoso, J.J., Carreras, M.C., and Cadenas, E. (2000) Ann. NY Acad. Sci. 899, 121-135.
40. Cadenas, E., Poderoso, JJ, Antunes, F. and Boveris A. (2001). Free Radical Res. 33, 747-756.
41. Radi, R., Cassina, A., Hodara, R., Quijano, C. And Castro, L. (2002) Free. Radical Biol. And Med. 33, 1451-1464.
by guest on August 20, 2019
http://ww
w.jbc.org/
Dow
nloaded from
22
42. Dirmeier, R., O’Brien, K.M., Engle, M., Dodd, A., Spears, E., and Poyton, R.O. (2002). J. Biol. Chem. 277, 34773-34784.
43. Schild, L., Reinheckel, T., Reiser, M., Horn, T.F.W. , Wolf, G., and Augustin, W. (2003) FASEB J. 17, 2194-2201
44. Foster, M.W. and Stammler, J.S. (2004) J.Biol.Chem. 279, 25891-25897.
45. Petrova, V.Y., Drescher, D., Kujumdzieva, A.V., and Schmitt, M.J. (2004) Biochem J. 380, 393-400.
46. Dagsgaard, C., Taylor, L.E., O’Brien, K.M., and Poyton, R.O. (2001) J.Biol. Chem. 276, 7593-7601.
47. Butow, R.A. and N.G. Avadhani. (2004) Cell 14, 1-15.
48. Soltys, B.J. and Gupta, R.S. (1999) Trends Biochem. Sci . 24, 174-177.
49. Mueller, J.C., Andreoli, C., Prokisch, H., and Meitinger, T. (2004) Mitochondrion 3, 315-325.
50. Natsoulis, G., Hilger, F. and Fink, G.R. (1986) Cell 46, 235-243.
51. Wu, M. and Tzagoloff, A. (1987) J. Biol. Chem. 262, 12275-12282.
52. Sturtz, L.A., Diekert, K., Jensen, L.T., Lill, R., and Culotta, V.C. (2001). J. Biol. Chem. 276, 38084-38089
53. Knox, C., Sass, E., Neupert, W. and Pines, O. (1998) J. Biol. Chem. 273, 25587-25593.
54. Jin, C., Barrientos, A. and Tzagoloff, A. (2003) J. Biol.Chem. 278, 14698-14703.
55. Missirlis, F., Ulschmid, J.K, Hirosawa-Takamori, M., Gronke, S., Schafer, U., Becker, K., Phillips, J.P. and Jackle, H. (2002) J. Biol. Chem. 277, 11521-11526.
56. Agorio, A., Chalar, C., Cardozo, and Salinas, G. (2003) J. Biol. Chem. 278, 12920-12928.
57. Bradbury, M. and Berk, P.D. (2000) Biochem. J. 345, 423-427.
58. Lutsenko, S. and Cooper, M.J. (1998) Proc. Natl. Acad. Sci USA 95, 6004-6009.
59. Pfanner, N. and Geissler, A. (2001) Nat. Rev. Mol.Cell Biol. 2, 339-349.
60. Weidemann, N., Frazier, A.E., and Pfanner, N. (2004) J. Biol. Chem. 279, 14473-14476.
.
by guest on August 20, 2019
http://ww
w.jbc.org/
Dow
nloaded from
23
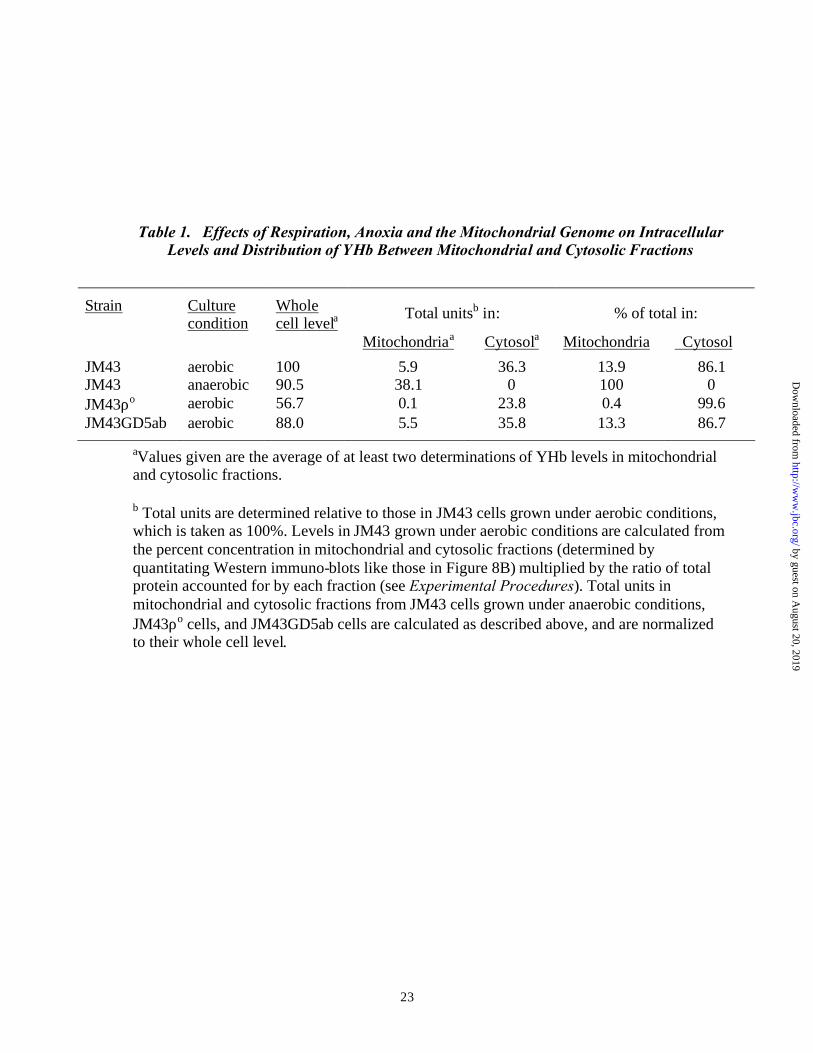
Table 1. Effects of Respiration, Anoxia and the Mitochondrial Genome on Intracellular Levels and Distribution of YHb Between Mitochondrial and Cytosolic Fractions
Strain Culture condition
Whole cell levela
Total unitsb in: % of total in:
Mitochondriaa Cytosola Mitochondria Cytosol
JM43 aerobic 100 5.9 36.3 13.9 86.1 JM43 anaerobic 90.5 38.1 0 100 0 JM43ρo aerobic 56.7 0.1 23.8 0.4 99.6 JM43GD5ab aerobic 88.0 5.5 35.8 13.3 86.7
aValues given are the average of at least two determinations of YHb levels in mitochondrial and cytosolic fractions.
b Total units are determined relative to those in JM43 cells grown under aerobic conditions, which is taken as 100%. Levels in JM43 grown under aerobic conditions are calculated from the percent concentration in mitochondrial and cytosolic fractions (determined by quantitating Western immuno-blots like those in Figure 8B) multiplied by the ratio of total protein accounted for by each fraction (see Experimental Procedures). Total units in mitochondrial and cytosolic fractions from JM43 cells grown under anaerobic conditions, JM43ρo cells, and JM43GD5ab cells are calculated as described above, and are normalized to their whole cell level.
by guest on August 20, 2019
http://ww
w.jbc.org/
Dow
nloaded from
24
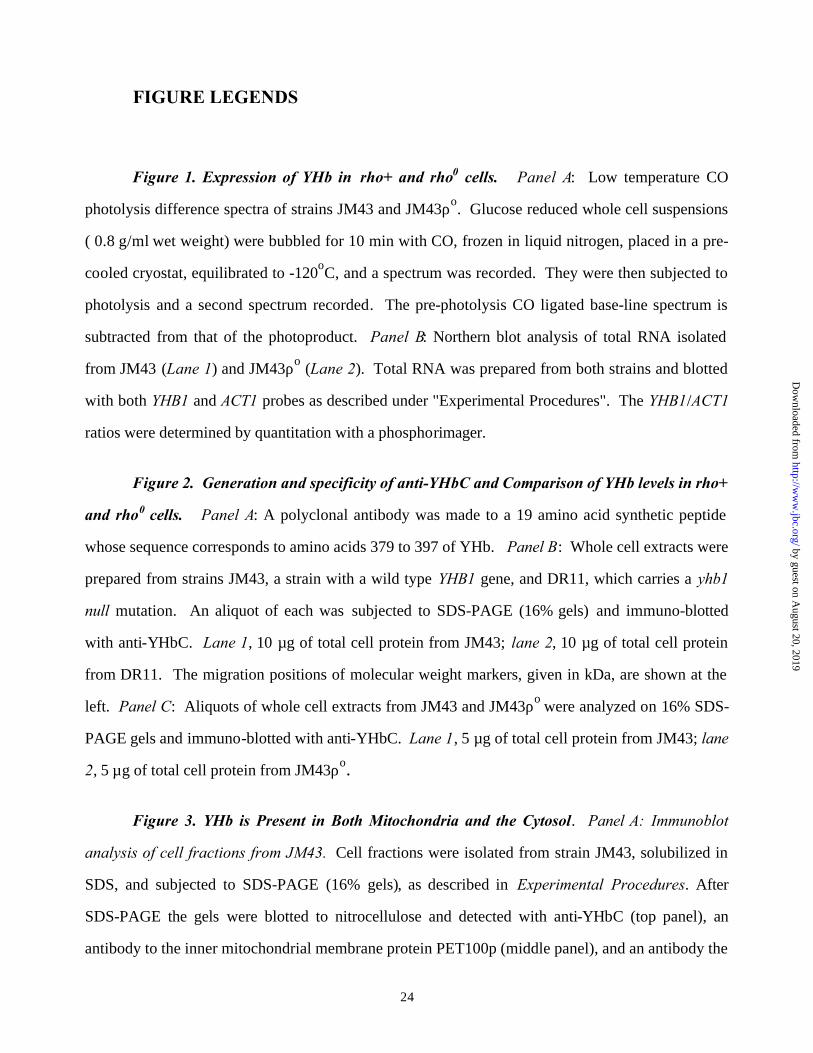
FIGURE LEGENDS
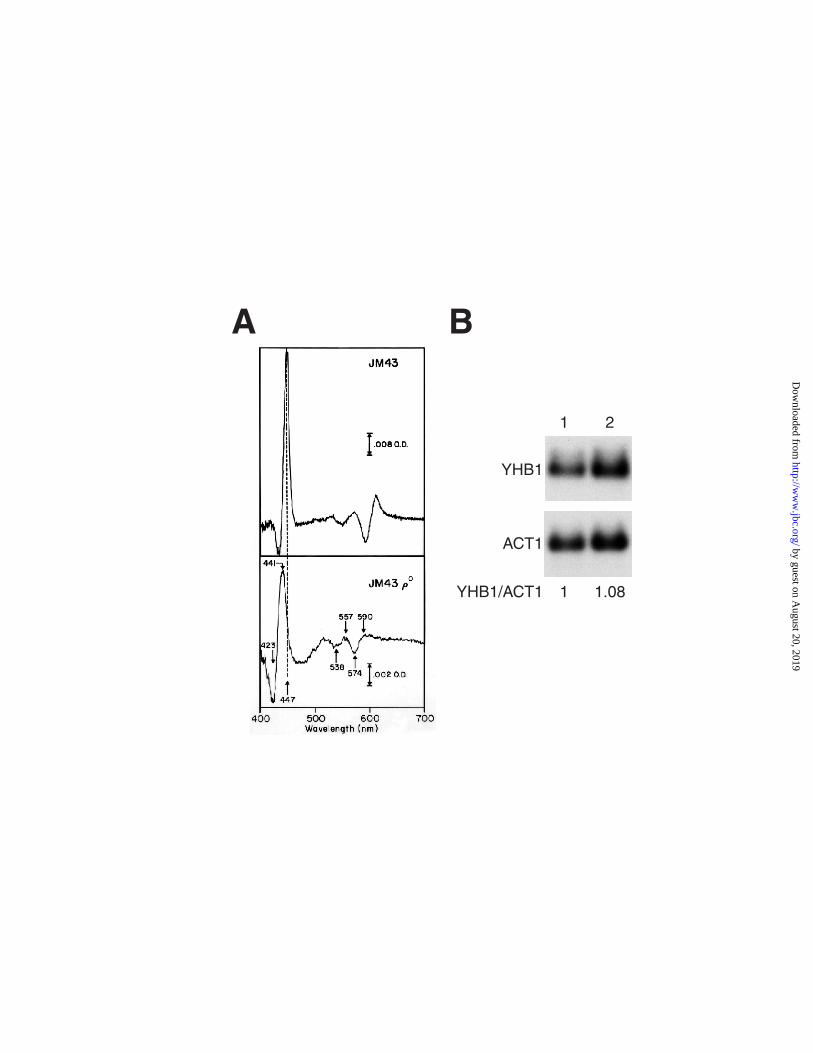
Figure 1. Expression of YHb in rho+ and rho0 cells. Panel A: Low temperature CO
photolysis difference spectra of strains JM43 and JM43ρo. Glucose reduced whole cell suspensions
( 0.8 g/ml wet weight) were bubbled for 10 min with CO, frozen in liquid nitrogen, placed in a pre-
cooled cryostat, equilibrated to -120oC, and a spectrum was recorded. They were then subjected to
photolysis and a second spectrum recorded. The pre-photolysis CO ligated base-line spectrum is
subtracted from that of the photoproduct. Panel B: Northern blot analysis of total RNA isolated
from JM43 (Lane 1) and JM43ρo (Lane 2). Total RNA was prepared from both strains and blotted
with both YHB1 and ACT1 probes as described under "Experimental Procedures". The YHB1/ACT1
ratios were determined by quantitation with a phosphorimager.
Figure 2. Generation and specificity of anti-YHbC and Comparison of YHb levels in rho+
and rho0 cells. Panel A: A polyclonal antibody was made to a 19 amino acid synthetic peptide
whose sequence corresponds to amino acids 379 to 397 of YHb. Panel B: Whole cell extracts were
prepared from strains JM43, a strain with a wild type YHB1 gene, and DR11, which carries a yhb1
null mutation. An aliquot of each was subjected to SDS-PAGE (16% gels) and immuno-blotted
with anti-YHbC. Lane 1, 10 µg of total cell protein from JM43; lane 2, 10 µg of total cell protein
from DR11. The migration positions of molecular weight markers, given in kDa, are shown at the
left. Panel C: Aliquots of whole cell extracts from JM43 and JM43ρo were analyzed on 16% SDS-
PAGE gels and immuno-blotted with anti-YHbC. Lane 1, 5 µg of total cell protein from JM43; lane
2, 5 µg of total cell protein from JM43ρo.
Figure 3. YHb is Present in Both Mitochondria and the Cytosol. Panel A: Immunoblot
analysis of cell fractions from JM43. Cell fractions were isolated from strain JM43, solubilized in
SDS, and subjected to SDS-PAGE (16% gels), as described in Experimental Procedures. After
SDS-PAGE the gels were blotted to nitrocellulose and detected with anti-YHbC (top panel), an
antibody to the inner mitochondrial membrane protein PET100p (middle panel), and an antibody the
by guest on August 20, 2019
http://ww
w.jbc.org/
Dow
nloaded from
25
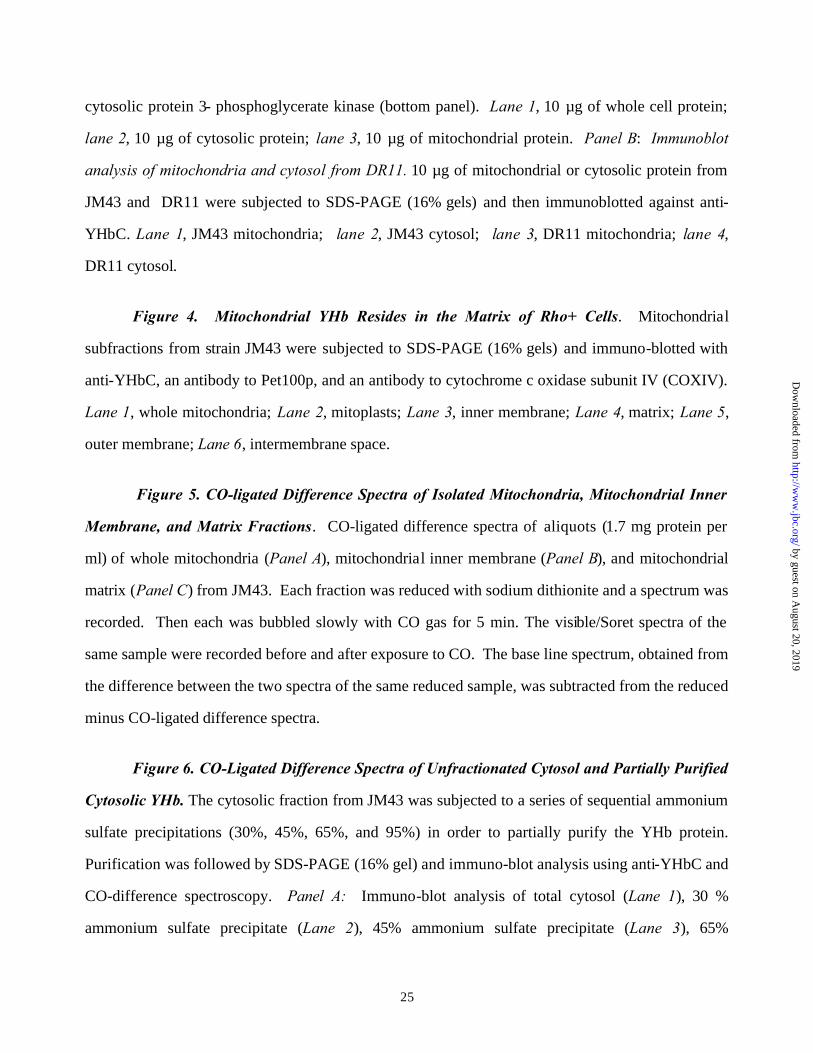
cytosolic protein 3- phosphoglycerate kinase (bottom panel). Lane 1, 10 µg of whole cell protein;
lane 2, 10 µg of cytosolic protein; lane 3, 10 µg of mitochondrial protein. Panel B: Immunoblot
analysis of mitochondria and cytosol from DR11. 10 µg of mitochondrial or cytosolic protein from
JM43 and DR11 were subjected to SDS-PAGE (16% gels) and then immunoblotted against anti-
YHbC. Lane 1, JM43 mitochondria; lane 2, JM43 cytosol; lane 3, DR11 mitochondria; lane 4,
DR11 cytosol.
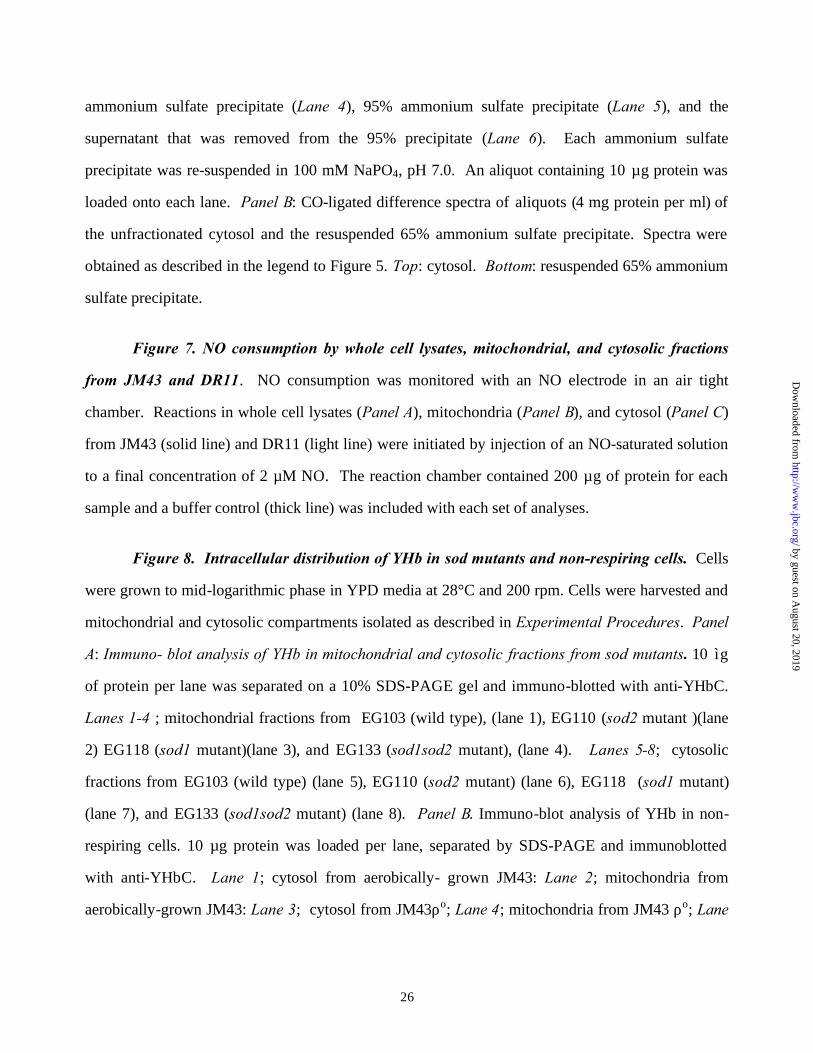
Figure 4. Mitochondrial YHb Resides in the Matrix of Rho+ Cells. Mitochondrial
subfractions from strain JM43 were subjected to SDS-PAGE (16% gels) and immuno-blotted with
anti-YHbC, an antibody to Pet100p, and an antibody to cytochrome c oxidase subunit IV (COXIV).
Lane 1, whole mitochondria; Lane 2, mitoplasts; Lane 3, inner membrane; Lane 4, matrix; Lane 5,
outer membrane; Lane 6, intermembrane space.
Figure 5. CO-ligated Difference Spectra of Isolated Mitochondria, Mitochondrial Inner
Membrane, and Matrix Fractions. CO-ligated difference spectra of aliquots (1.7 mg protein per
ml) of whole mitochondria (Panel A), mitochondrial inner membrane (Panel B), and mitochondrial
matrix (Panel C) from JM43. Each fraction was reduced with sodium dithionite and a spectrum was
recorded. Then each was bubbled slowly with CO gas for 5 min. The visible/Soret spectra of the
same sample were recorded before and after exposure to CO. The base line spectrum, obtained from
the difference between the two spectra of the same reduced sample, was subtracted from the reduced
minus CO-ligated difference spectra.
Figure 6. CO-Ligated Difference Spectra of Unfractionated Cytosol and Partially Purified
Cytosolic YHb. The cytosolic fraction from JM43 was subjected to a series of sequential ammonium
sulfate precipitations (30%, 45%, 65%, and 95%) in order to partially purify the YHb protein.
Purification was followed by SDS-PAGE (16% gel) and immuno-blot analysis using anti-YHbC and
CO-difference spectroscopy. Panel A: Immuno-blot analysis of total cytosol (Lane 1), 30 %
ammonium sulfate precipitate (Lane 2), 45% ammonium sulfate precipitate (Lane 3), 65%
by guest on August 20, 2019
http://ww
w.jbc.org/
Dow
nloaded from
26
ammonium sulfate precipitate (Lane 4), 95% ammonium sulfate precipitate (Lane 5), and the
supernatant that was removed from the 95% precipitate (Lane 6). Each ammonium sulfate
precipitate was re-suspended in 100 mM NaPO4, pH 7.0. An aliquot containing 10 µg protein was
loaded onto each lane. Panel B: CO-ligated difference spectra of aliquots (4 mg protein per ml) of
the unfractionated cytosol and the resuspended 65% ammonium sulfate precipitate. Spectra were
obtained as described in the legend to Figure 5. Top: cytosol. Bottom: resuspended 65% ammonium
sulfate precipitate.
Figure 7. NO consumption by whole cell lysates, mitochondrial, and cytosolic fractions
from JM43 and DR11. NO consumption was monitored with an NO electrode in an air tight
chamber. Reactions in whole cell lysates (Panel A), mitochondria (Panel B), and cytosol (Panel C)
from JM43 (solid line) and DR11 (light line) were initiated by injection of an NO-saturated solution
to a final concentration of 2 µM NO. The reaction chamber contained 200 µg of protein for each
sample and a buffer control (thick line) was included with each set of analyses.
Figure 8. Intracellular distribution of YHb in sod mutants and non-respiring cells. Cells
were grown to mid-logarithmic phase in YPD media at 28°C and 200 rpm. Cells were harvested and
mitochondrial and cytosolic compartments isolated as described in Experimental Procedures. Panel
A: Immuno- blot analysis of YHb in mitochondrial and cytosolic fractions from sod mutants. 10 ìg
of protein per lane was separated on a 10% SDS-PAGE gel and immuno-blotted with anti-YHbC.
Lanes 1-4 ; mitochondrial fractions from EG103 (wild type), (lane 1), EG110 (sod2 mutant )(lane
2) EG118 (sod1 mutant)(lane 3), and EG133 (sod1sod2 mutant), (lane 4). Lanes 5-8; cytosolic
fractions from EG103 (wild type) (lane 5), EG110 (sod2 mutant) (lane 6), EG118 (sod1 mutant)
(lane 7), and EG133 (sod1sod2 mutant) (lane 8). Panel B. Immuno-blot analysis of YHb in non-
respiring cells. 10 µg protein was loaded per lane, separated by SDS-PAGE and immunoblotted
with anti-YHbC. Lane 1; cytosol from aerobically- grown JM43: Lane 2; mitochondria from
aerobically-grown JM43: Lane 3; cytosol from JM43ρo; Lane 4; mitochondria from JM43 ρo; Lane
by guest on August 20, 2019
http://ww
w.jbc.org/
Dow
nloaded from
27
5; cytosol from JM43GD5ab: Lane 6; mitochondria from JM43GD5ab: Lane 7; cytosol from
anaerobically-grown JM43; Lane 8; promitochondria from anaerobically-grown JM43
by guest on August 20, 2019
http://ww
w.jbc.org/
Dow
nloaded from
YHB1
ACT1
YHB1/ACT1
1 2
1 1.08
A B
by guest on August 20, 2019
http://ww
w.jbc.org/
Dow
nloaded from
87
44.132.7
7.1
B
A
EHRDDMIHYEPFGPKMSTV
COOHNH2
1 2
C�1 2
1.0 0.57
by guest on August 20, 2019
http://ww
w.jbc.org/
Dow
nloaded from
1 2 3
YHb
Pet100p
PGK
A
1 2 3 4B
YHb
by guest on August 20, 2019
http://ww
w.jbc.org/
Dow
nloaded from
1 2 3 4 5 6
YHb
PET100
COX IV
by guest on August 20, 2019
http://ww
w.jbc.org/
Dow
nloaded from

500 600 700400
Abs
orba
nce
Wavelength (nm)
0.002
0.002
0.002
441
423
A
B
C
by guest on August 20, 2019
http://ww
w.jbc.org/
Dow
nloaded from
1 2 3 5 64A
B
441
423
400 500 600 700
0.005
0.005
Wavelength (nm)
Abs
orba
nce
590557
572
557 590
574
by guest on August 20, 2019
http://ww
w.jbc.org/
Dow
nloaded from
2500
2000
1500
1000
500
0
2500
2000
1500
1000
500
0
3000
2500
2000
1500
1000
500
0
NO
(A
rbitr
ary
Uni
ts)
0 10 20 30 40 50 60 70Time (sec)
Buffer Control
DR11
JM43
Buffer Control
DR11
JM43
Buffer Control
DR11
JM43
A
B
C
by guest on August 20, 2019
http://ww
w.jbc.org/
Dow
nloaded from
Nina Cassanova, Kristin M. O'Brien, Brett T. Stahl, Travis McClure and Robert O. Poytonmitochondrial matrix
Yeast flavohemoglobin, a nitric oxide oxidoreductase, is located both in the cytosol and
published online December 20, 2004J. Biol. Chem.
10.1074/jbc.M411478200Access the most updated version of this article at doi:
Alerts:
When a correction for this article is posted•
When this article is cited•
to choose from all of JBC's e-mail alertsClick here
by guest on August 20, 2019
http://ww
w.jbc.org/
Dow
nloaded from