Embed Size (px)
Citation preview

Year Ended March 31, 2013 Results of 1st Half
(July.1 to Sep.30,2012)
Nov 13 ,2012
Nichi-Iko Pharmaceutical Co., Ltd.
(Code No. 4541 1st section of TSE)
Challenge to global market with the Power of Creation

We, Nichi-Iko, provide value-added, high quality generic products which meet various
requirements from patients, doctors, pharmacists, wholesalers and pharmaceutical
companies in the global market as one of the most respected, well established
generic company in the world.
Mission statement The 6th Medium-term Business Plan
Copyright ©2013 Nichi-Iko Pharmaceutical Co., Ltd. All rights reserved. 2
Global Top 10 Generic Pharmaceutical Company Vision
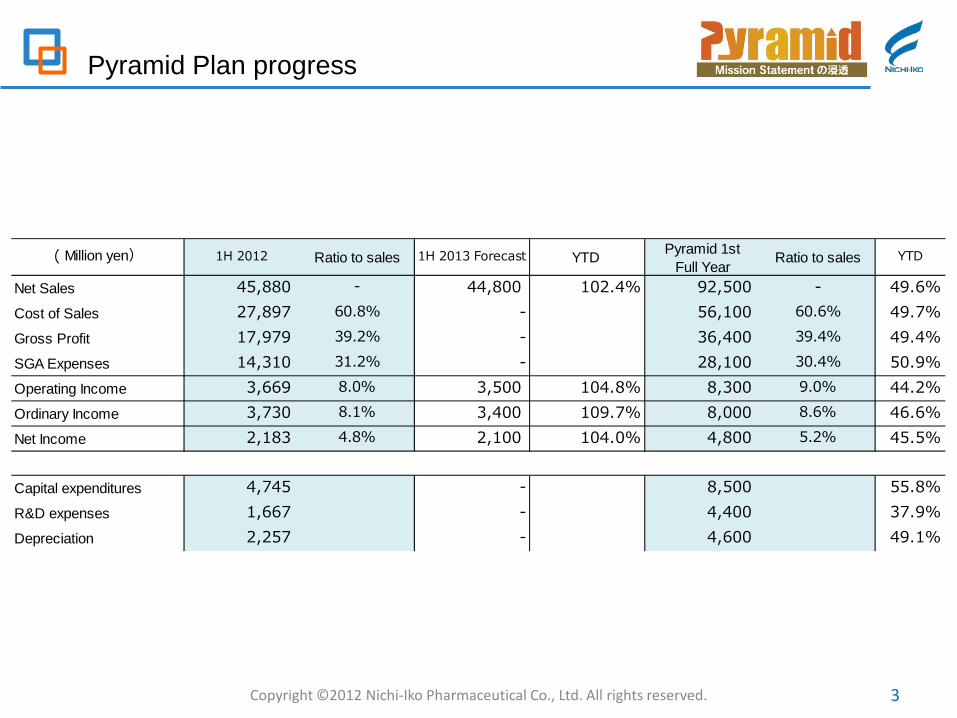
Pyramid Plan progress
Copyright ©2012 Nichi-Iko Pharmaceutical Co., Ltd. All rights reserved. 3
( Million yen) 1H 2012 Ratio to sales 1H 2013 Forecast YTD Pyramid 1stFull Year
Ratio to sales YTD
Net Sales 45,880 - 44,800 102.4% 92,500 - 49.6%Cost of Sales 27,897 60.8% - 56,100 60.6% 49.7%Gross Profit 17,979 39.2% - 36,400 39.4% 49.4%SGA Expenses 14,310 31.2% - 28,100 30.4% 50.9%Operating Income 3,669 8.0% 3,500 104.8% 8,300 9.0% 44.2%Ordinary Income 3,730 8.1% 3,400 109.7% 8,000 8.6% 46.6%Net Income 2,183 4.8% 2,100 104.0% 4,800 5.2% 45.5%
Capital expenditures 4,745 - 8,500 55.8%R&D expenses 1,667 - 4,400 37.9%Depreciation 2,257 - 4,600 49.1%

Consolidated fiscal year comparison in income statement
Copyright ©2012 Nichi-Iko Pharmaceutical Co., Ltd. All rights reserved. 4
*We have changed to March 31 fiscal year-end from November 30 from the year ended March 31, 2012. We have been compared with 1H Ended November 2011.
( Million yen) 1H 2011(Dec.2010 - May.2011)
Ratio to sales 1H 2012 Ratio to sales YOY
Net Sales 36,931 - 45,880 - 131.2%Cost of Sales 20,956 56.7% 27,897 60.8% 141.1%Gross profit 15,975 43.3% 17,979 39.2% 118.2%S&G Administration expenses 12,460 33.7% 14,310 31.2% 114.3%
Labor cost 2,222 6.0% 2,443 5.3% 110.0%R&D expenses 1,033 2.8% 1,667 3.6% 112.6%
Sales Promotion cost 5,932 16.1% 5,682 12.4% 102.2%Others 3,273 8.9% 4,517 9.8% 137.6%
Operating Income 3,515 9.5% 2,110 4.6% 132.3%Non-Operating Income 198 0.5% 0 0.0% 440.3%
Non-Operating Expense 308 0.8% 185 0.4% 54.7%Ordinary Income 3,406 9.2% 3,730 8.1% 152.4%
Exstraordinary Profit 25 0.1% 0 0.0% -Exstraordinary Loss 511 1.4% 157 0.3% 33.3%
Net Income 1,663 4.5% 2,183 4.8% 189.0%

Copyright ©2012 Nichi-Iko Pharmaceutical Co., Ltd. All rights reserved. 5
Performance comparison by institutions
Salescomposition ratio
Number of clients Salescomposition ratio
Clients Ratio SalesGrowth
No. ofClients
100% 117,964 100.0% 121,974 116.8% 103.4%
Hospoitals 6,997 9.9% 6,810 9.3% 6,824 97.5% 109.9% 100.2%
DPC Hospitals1,504 11.9% 1,483 11.8% 1,475 98.1% 116.1% 99.5%
HospitalsUndergoing
DPCPreparation129 0.2% 126 0.2% 127 98.4% 121.7% 100.8%
Clinic 103,403 18.4% 59,392 16.0% 61,629 59.6% 101.7% 103.8%
Pharmacy 54,951 52.3% 50,153 55.3% 51,919 94.5% 123.4% 103.5%
Others 7.3% 6,174 7.4% 4,906 118.0% 79.5%
InstitutionTotal No. ofInstitutionsin Japan
Apr.2011-Sep.2011 Apr.2012-Sep.2012 YOY
ALL

Performance comparison by distribution channel
Copyright ©2012 Nichi-Iko Pharmaceutical Co., Ltd. All rights reserved. 6
( Million yen)
31,538
38,232
3,831
3,960
3,487
3,688
0
5,000
10,000
15,000
20,000
25,000
30,000
35,000
40,000
45,000
50,000
Apr.-Sep. 2011 Apr.-Sep. 2012
Others
Agencies
Wholesalers
( Million yen)
Sales by Marketing Channel Apr.-Sep. 2011 Apr.-Sep. 2012 Sales Growth YOY
Wholesalers 31,538 38,232 6,694 121.2%
Agencies 3,831 3,960 129 103.4%
Others 3,487 3,688 201 105.8%
Total 38,856 45,880 7,024 118.1%

Copyright ©2012 Nichi-Iko Pharmaceutical Co., Ltd. All rights reserved. 7
Performance comparison by institutions
WholesalersSales
composition ratioApr.-Sep. 2011
Salescomposition ratio
1H 2012YOY
M 25% 26% 124%
S 20% 21% 121%
A 20% 20% 114%
T 16% 15% 112%
Ta 12% 12% 117%
Others 7% 6% 128%
Total 100% 100% 121%

Performance comparison by products
Copyright ©2012 Nichi-Iko Pharmaceutical Co., Ltd. All rights reserved. 8
Apr.-Sep. 2011
(Monthly
Base)Apr.-Sep. 2012 Sales Grow th YOY
GE 30,234 36,383 6,149 120.3%LLP 8,579 9,151 572 106.7%Other 43 346 303 802.2%Toatal 38,856 45,880 7,024 118.1%
30,234
36,383
8,579
9,151 43
346
0
5,000
10,000
15,000
20,000
25,000
30,000
35,000
40,000
45,000
50,000
Apr.-Sep. 2011(Monthly Base)
Apr.-Sep. 2012
Other
LLP
GE
(Million yen)
(Million yen)

Performance comparison by the year listed on NHI drug price list
Copyright ©2012 Nichi-Iko Pharmaceutical Co., Ltd. All rights reserved. 9
(Million yen)
(Million yen)
5,912 6,308
2,485 2,619
4,328 4,344
1,843 1,930 1,642
1,763
3,228 3,586
3,227 3,818
1,624
2,764 1,126
3,068
1,094
0
5,000
10,000
15,000
20,000
25,000
30,000
35,000
Apr.-Dec. 2011 Apr.-Dec. 2012
Listed in 2012
Listed in 2011
Listed in 2010
Listed in 2009
Listed in 2008
Listed in 2007
Listed in 2006
Listed in 2005
Listed in 2004
Listed in 2003
Apr.-Dec.2011
Apr.-Dec.2012
Sales Grow th YOY
Listed in 2003 5,912 6,308 397 106.7%
Listed in 2004 2,485 2,619 134 105.4%
Listed in 2005 4,328 4,344 16 100.4%
Listed in 2006 1,843 1,930 87 104.7%
Listed in 2007 1,642 1,763 121 107.3%
Listed in 2008 3,228 3,586 358 111.1%
Listed in 2009 3,227 3,818 591 118.3%
Listed in 2010 1,624 2,764 1,140 170.2%
Listed in 2011 1,126 3,068 1,942 272.5%
Listed in 2012 1,094 - -

Construction of the Pyramid Building • Production capacity: 7-8 billion tablets (at full capacity) combined with the Pentagon Building • Investment amount: Approx. ¥4.5 billion • Scheduled start in April 2012; completion in February 2013 Schedule: Start in April 2012; Finish in February 2013
Capex Plans: Pyramid Building & Aichi Plant Enhance production capacity
Copyright ©2012 Nichi-Iko Pharmaceutical Co., Ltd. All rights reserved. 10
Pyramid Building Completion
in February 2013
Pentagon Building Completed
in February 2010
Honeycomb Building Completed
in October 2011
Additional Equipment for Aichi Plant (Start running planned:June 2013 ) Introducing a freeze-dried line Object:Cost-reduction, Stable supply, Strengthening formulation technologies
Estimated capacity: 4 million units per annum
Investment amount: ¥2.7 billion

Manufacture all antiseptics at Yakuhan Pharmaceutical
Improving Productivity :amount of production160% UP
Schedule : Production start in Dec.2012 , ship in March 2013
Copyright ©2012 Nichi-Iko Pharmaceutical Co., Ltd. All rights reserved. 11
Strengthtehn Production: Enhance production capacity Additional Equipment for Aichi Plant &Yamagata Plant
Yamagata Plant
Lower costs through internal production
Introduce an external preparation production line

Business development plans
Infliximab (starter name: Remicade): anti-rheumatic medication
• Clinical trials in progress
• Co-development with Sanofi (enhance development speed and cost efficiency)
• Market listing targeted: in FY3/16
Volume: 100,000 (12% market share)
Amount: 5 billion yen / year
Next candidates: Initiate clinical trials during the Pyramid Mid-term Business Plan:
• Trastuzumab (starter name: HERCEPTIN): breast cancer drug
• Retuximab (starter name: RETUXSAN): malignant lymphoma drug
Bio-similar
Copyright ©2012 Nichi-Iko Pharmaceutical Co., Ltd. All rights reserved. 12

Oncology group started on 1 October
Strengthen information offerings
Enhance marketing activities for DPC and major hospitals (increase MRs)
Establish a new business model for oncology using generic pharmaceuticals
Anti-Cancer Agents
Copyright ©2012 Nichi-Iko Pharmaceutical Co., Ltd. All rights reserved. 13
Existing listed products and products development plan through FY 3/16
Number of listing (Standards)
Already Listed Products and Product Development Plans through FY3/16
Period of Listing FY13/3 FY14/3 FY15/4 FY16/4
Number of ListingStandards
1 4 5 7

Market development
Overseas Development
Copyright ©2012 Nichi-Iko Pharmaceutical Co., Ltd. All rights reserved. 14
Scheduled Product Applications by Country (Primary Selected Products)
Up to March 2012 FY3/13 FY3/14 FY3/15 FY3/16
Hong Kong 3 items 2 items
Maraysia 1 items 2 items 4 items
Thailand 1 items 6 items 2 items

Year Ended of March 2013 Forecast
Copyright ©2012 Nichi-Iko Pharmaceutical Co., Ltd. All rights reserved. 15
( Million yen) 1H 2012 Ratio to sales2H 2013Forecast Ratio to sales FY2012 Forecast Ratio to sales Pyramid 1st
Full YearRatio to sales YTD
Net Sales 45,880 - 48,120 - 94,000 - 92,500 - 101.6%Cost of Sales 27,897 60.8% 28,803 59.9% 56,700 60.3% 56,100 60.6% 101.1%Gross Profit 17,979 39.2% 19,321 40.2% 37,300 39.7% 36,400 39.4% 102.5%SGA Expenses 14,310 31.2% 14,490 30.1% 28,800 30.6% 28,100 30.4% 102.5%Operating Income 3,669 8.0% 4,831 10.0% 8,500 9.0% 8,300 9.0% 102.4%Ordinary Income 3,730 8.1% 4,570 9.5% 8,300 8.8% 8,000 8.6% 103.8%Net Income 2,183 4.8% 2,817 5.9% 5,000 5.3% 4,800 5.2% 104.2%
Capital expenditures 4,745 5,155 9,900 8,500 116.5%R&D expenses 1,667 2,333 4,000 4,400 90.9%Depreciation 2,257 2,543 4,800 4,600 104.3%

Forward – Looking Statements
The information contained in this document is not intended as solicitation material for
buying or selling the company’s shares.
Earnings forecasts and other future forecasts contained herein have been made by the
company based on information available at the time the material was compiled and
encompass potential risks and uncertainties.
Accordingly, actual results may differ from forecasts for a variety of reasons.
The company and any other information sources for this document bear no responsibility
for damages or losses resulting from the use of this information.
Please contact the number below for any related questions: Nichi-Iko Pharmaceutical Co., Ltd. Corporate Planning Office Phone: +81-76-442-7026 E-mail: [email protected]