Embed Size (px)
Citation preview

Year End Report for FYE 2020

FY 2019-2020 Kilgore EDC Year-End Report
About this report
The Kilgore Economic Development Corp.’s 2020 Fiscal Year End Report is a snapshot of the internal workings and results of the organization over the past fiscal year. The following document includes:
★ Summary of Accomplishments and Activities. ★ Accomplishments of companies with KEDC agreements. ★ The 2017-2022 Strategic Map and FYE 2020 Program of Work results. ★ Trend details. ★ New credentials. ★ End of year financials (unaudited).
Board of Directors
Bob Davis President
Bobby Beane Vice-President
Ricardo Viloria Sec.-Treas.
Ruben Martin Asst. Sec.-Treas.
Mike Head Director
Staff
Amanda Nobles Executive Director
Jana Russell Asst./Exec. Director
Sonya Waters Business
Development Mgr.
Stephanie Moore Office & Property
Mgr.
Austin Clark Research Specialist
About Kilgore EDC
During the past five years, KEDC staff has closed 31 projects representing a total of more than $248 million in new and retained capital investment and 3,400 jobs under contract. KEDC is an organization founded in 1990 and funded by a dedicated sales tax approved by voters. It is directed by a five-person board and managed by a staff of four. KEDC has won awards for excellence in economic development, including the Texas Community Economic Development Award in years 2001, 2007, 2015, and 2019 and the International Community Economic Development Award in 2020.

FY 2019-2020 Kilgore EDC Year-End Report
Summary of Accomplishments and Activities
At each year’s end, KEDC reflects on its Strategic Plan as a whole as well as the Mission and Vision Statements to determine how its accomplishments and activities are moving the organization forward. Below is a summary of accomplishments for fiscal year 2019-2020, which was unlike any previous year. Election years are historically slow for deal closure. Adding the global pandemic and other issues into the mix created uncertainty that slowed deal closure, but created activity as employers evaluated growth and location options.
Three items of note this fiscal year include: 1.) The Kilgore Cares Program, which directly impacted the retention of nine primary employers representing $104 million in investment and 1,059 jobs; 2.) Non-COVID related Investment and job creation numbers exceeded the last election year; and 3.) the number of leads this year exceed FYE 2019, a year in which results were award-winning.
KEDC Mission Statement To enhance a business climate that is conducive to job creation and retention,
improving the standard of living for Kilgore residents.
Job creation and retention: Through 11 new KEDC Economic Development Performance Agreements, companies projected to create 38 new jobs and retain 1,121 for a total of 1,159 jobs.
1159
KEDC Vision Statement A diverse economy that attracts and retains high impact projects and quality jobs.
Diversity: Of the 17 active agreements during 2019-2020, only four companies in six agreements were related to the energy sector, which is well below the level of 47 percent recorded in 2013.
35% Projects: Eleven companies signed economic development agreements. Nine of the agreements are retention contracts associated with Kilgore Cares with one an expansion project and one attraction.
11
Impact: Companies under new Economic Development Performance Agreements are projecting new investment of $5,150,000 with an additional $104,541,615 under contract for Kilgore Cares. New investment exceeds total investment the last election year.
$109,691,615.00 Incentives: KEDC performance-based incentives are investments in the growth of Kilgore. These investments are based on the economic impact of each project and are measured by the rate of return and payback period of the investment. Economic impact is determined by a variety of factors, including number of employees, payroll, contribution to ad valorem and sales taxes, type of industry, and length of agreement. Below is the average for the 11 agreements closed this fiscal year. Non Kilgore Cares agreements had an average ROR of 30 percent and a payback period of 3.6 years.
112% ROR 1 Year

FY 2019-2020 Kilgore EDC Year-End Report
Accomplishments
The Kilgore Economic Development Corp. board of directors invested in eleven companies through Economic Development Performance Agreements and forgivable loans. The number of companies entering an agreement exceeds both three- and five-year averages.
Those companies are retaining 1,121 jobs and projecting to create 38 new jobs. The number of new jobs exceeds the last election year. Companies are projecting to invest $5,150,000 this fiscal year, which is greater than the last election year. The percentage of KEDC incentive to company investment was less than one percent for Kilgore Cares agreements and three percent for others.
The chart below lists the compliance results of the 17 active agreements with KEDC last fiscal year.
Company NameProject
TypeEnergy
RelatedRetained
JobsNew Jobs Created
TOTAL Jobs
Retained Company Investment
New Company Investment TOTAL Investment
KEDC Incentive
Gulf Coast Chemical, LLC. R 1 4 0 4 690,350.00$ 690,350.00$ 2,800.00$ D&D Industrial Welding Supply, Inc. R 1 9 0 9 1,074,380.00$ 1,074,380.00$ 3,000.00$ Orgil l , Inc. R 314 0 314 38,000,000.00$ 38,000,000.00$ 132,500.00$ Dril ltools R 59 0 59 4,854,416.00$ 4,854,416.00$ 20,000.00$ Steelman Industries, Inc. R 30 0 30 1,088,640.00$ 1,088,640.00$ 4,500.00$ Skeeter Products R 290 0 290 9,958,405.00$ 9,958,405.00$ 37,000.00$ East Texas Salt Water Disposal R 1 43 0 43 1,220,400.00$ 1,220,400.00$ 5,800.00$ Cleveland Steel Container Corp. R 36 0 36 9,466,834.00$ 9,466,834.00$ 27,000.00$ Closure Systems International R 274 0 274 38,188,190.00$ 38,188,190.00$ 145,000.00$
SUB-TOTAL 3 1059 0 1059 104,541,615.00$ -$ 104,541,615.00$ 377,600.00$
Ana-Lab Corporation, Inc. E 62 8 70 -$ 400,000.00$ $ 400,000.00 40,000.00$ Texas Core Energy, LLC dba TOCE Interna A 1 0 30 30 -$ 4,750,000.00$ 4,750,000.00$ 110,625.00$
SUB-TOTAL 1 62 38 100 -$ 5,150,000.00$ $ 5,150,000 150,625.00$
TOTAL 4 1121 38 1159 104,541,615.00$ 5,150,000.00$ 109,691,615.00$ 528,225.00$
EDPA Year Term Agreement Compliant Non Compliant Extended Terminated Recapture Energy CompleteCleveland Steel Container Corporation 1 5 1 1Southern Plastics dba CSI #8 1 3 8 1CHEP Recycled Pallet Solutions, LLC 6 7 1 1 1Pinnacle Coatings of East Texas, LLC 1 5 1 1 1 1Merritt Preferred Components 1 3 1 1McClung Energy Services 2 5 1 1 1VW Manufacturing Services, LLC #2 1 3 2 1 1Maverick Well Service, LLC #2 1 2 2 1 1Premier Pressure Pumping, LLC 3 5 1 1 1VW Manufacturing Services, LLC #3 1 5 3 1 1Thousand Oaks dba Evolution Outdoor Design 1 10 1 1VW Manufacturing Services, LLC #1 2 3 1 1 1Southern Plastics dba CSI #7 3 3 7 1 1Freedom Communications Technologies, Inc. 5 5 1 1 1Orgill, Inc. #3 2 10 3 1SCP Distributors, LLC #1 6 5 1 1 1SCP Distributors, LLC #2 5 4 2 1 1
15 2 0 2 1 6 4Tax AbatementSkeeter Products, Inc. 4 6 1 1Orgill, Inc. 1 10 2 1

FY 2019-2020 Kilgore EDC Year-End Report
The 2017-2022 Strategic Map
The Strategic Plan for the Kilgore Economic Development has three areas of focus:
1. Business Climate – Development of real estate assets for Kilgore EDC targets. 2. New and Retained Investment and Jobs –Project development and closure. 3. Sustainability – Maintenance of resources to support economic development in Kilgore.
Business Climate
Maintain a relevant inventory of property for primary employers.
New and Retained Investment and Jobs
Generate leads from non-energy related industry sectors.
Sustainability
Protect the financial integrity of the organization.
The Kilgore EDC organizational statements are as follows:
Mission: To enhance a business climate that is conducive to primary job creation and retention, improving the standard of living for Kilgore residents.
Vision: A diverse economy that attracts and retains high impact projects and quality jobs.
Value: We deliver high impact results with outstanding customer service.
FY 2019-2020 Kilgore EDC Year-End Report
Strategic Map for Business Climate
Business Climate
Maintain a relevant inventory of property for primary employers.
FYE 2020
Objective
To be primed to attract investment, we must evaluate gaps in inventory and infrastructure and invest as finances allow, ensuring key sites and buildings are prospect ready.
Goal
Keep “Cannot Respond” rate to below 20%.
20%
Measurement
Commitments for:
1. Asset development.
2. Infrastructure development to benefit primary employers.
1. $1,039,129
2. $ 79,202
Goal: The “Cannot Respond” rate indicates if existing infrastructure and inventory are meeting the needs for new development. The rate this year was 20 percent, meeting our goal of 20 percent or less. All but three of the 13 leads in this category originated with the Governor’s Office for Economic Development. The leading reason KEDC was unable to respond was a company’s need for rail on site with six requests. With four requests was an existing building, and the average size of most buildings requested this year was just over 250,000 SF with one request for 1.5 million SF. Measurement: Projects this year included the improvement for water service in the park as well as a potential investment of $100,000 in the city’s trail system through the allocation of Type B funds. Investment in infrastructure and KEDC assets are listed below.
Asset Project Investment2002 Synergy Blvd. Building Improvement 95,505$ Synergy Park Wayfinding Signage 9,000$ 4017 Enterprise Building Construction 934,624$
Sub Asset Development 1,039,129$ Infrastructure Project InvestmentSynergy Park Elder Lake Rd. 79,202$
Sub Infrastructure Development 79,202$ Other City Projects Project InvestmentCreekside Trail 4B Type Contribution 100,000$
Sub Other City Projects 100,000$
TOTAL INVESTMENT 1,218,331$

FY 2019-2020 Kilgore EDC Year-End Report
Program of Work for Business Climate
KEDC engaged in the following activities last fiscal year to meet our business climate goals.
Stra
tegy
Activ
ityG
oal
Proj
ect
Co
mpl
ete
Rem
ain
Targ
et M
YTa
rget
YE
Infr
astr
uctu
re*S
yner
gy P
ark
Utili
ty in
stal
latio
n1
Elec
tric
ity1
YY
1Fi
ber/
Broa
dban
d1
YY
1Na
tura
l Gas
1Y
YIn
vent
ory
Syne
rgy
Park
Pha
se V
Road
Con
stru
ctio
n1
Desi
gn1
YY
Indu
stri
al P
ark
2.0
Site
Eva
luat
ion
1Ev
alua
te S
ites
1Y
YSp
ec B
uild
ing
Prog
ram
Cons
truc
tion
Docu
men
ts1
100,
000
SF
1Y
YPr
omot
ion
1W
ebsi
te1
0Y
YPr
oper
ty M
anag
emen
tIn
spec
tions
2CD
L Fac
ility
20
YY
240
05 F
M 3
492
0Y
Y2
4017
Ent
erpr
ise
4-2
YY
4Sy
nerg
y Pa
rk4
0Y
Y4
Cox
Driv
e2
2Y
N4
Kilg
ore
Indu
stri
al P
ark
40
YY
4No
rth
Kilg
ore
Indu
stri
al P
ark
40
YY
4Ea
st K
ilgor
e In
dust
rial
Par
k4
0Y
YLe
ase
Rene
wal
s1
2706
Hig
hway
135
NA s
old
140
05 F
M 3
491
0Y
Y1
CDL F
acili
ty1
0Y
Y1
Gene
ral D
ynam
ics
Prop
erty
10
YY
1Sk
ynet
1
0Y
YM
aint
enan
ceAs
Nee
ded
CDL F
acili
ty2
Mai
nten
ance
As N
eede
d40
05 F
M 3
495
Room
Ren
tals
As N
eede
dSy
nerg
y Ce
nter
12Pr
oper
ty Id
entif
icat
ion
Oth
er R
eal E
stat
e12
Avai
labl
e In
dust
rial
Spa
ce12
0Y
Y

FY 2019-2020 Kilgore EDC Year-End Report
Strategic Map for Jobs and Investment
New and Retained Investment and Jobs
Generate leads from non-energy related industry sectors. FYE 2020
Objective
To attract and retain high impact projects with quality jobs from targeted industries we must engage in both inbound and outbound marketing and BRE programs.
Goal Close projects with an average ROR of 10% or more and a payback period of 10 years or less.
112% 1 Year
Measurement
From targeted industry sectors:
3. Number of leads generated from targeted industry sectors. 4. Number of closed projects. 5. Number of jobs under contract. 6. Amount of investment under contract.
3. 58, or 91% 4. 11 5. 1,159 6. $109,691,615
Goal: It is the goal of the KEDC board of directors to close projects in a fiscally responsible manner and with the goals of a 10 percent rate of return or better and a payback period of 10 years or less. This fiscal year the rate of return on all 11 projects averaged 112 percent, while non-Kilgore Cares agreements averaged 30 percent. The payback period of all agreements averaged ½ a year, while non-Kilgore Cares agreements averaged 3.5 years.
Measurement: All closed projects start with a lead and end with projections of capital investment dollars retained or created along with retained and/or created jobs. This fiscal year KEDC produced 64 leads and closed a total of 11 projects, including two non-Kilgore Cares projects.
Kilgore Cares projects represent 1,059 employees in Kilgore as well as $104 million in personal property investment.
The two non-Kilgore Cares agreements project retention of 62 jobs, creation of 38 jobs, and new investment of $5,150,000.
An analysis of lead development sources and types as well as lead closure sources and types follow under the trend analysis section.

FY 2019-2020 Kilgore EDC Year-End Report
Program of Work Strategies for Jobs and Investment
KEDC identified 64 leads from companies through the following activities.
*Interactions with existing industry looked a little different this fiscal year and included conversations through means other than a personal site visit, including surveys and extended phone calls. A total of 35 Interactions with 29 companies helped KEDC respond to primary employer needs.
Stra
tegy
Activ
ityG
oal
Proj
ect
Com
plet
eRe
mai
nTa
rget
MY
Targ
et Y
ENo
tes
Lead
Dev
elop
men
tRe
tain
ed a
nd E
xpan
ded
Indu
stri
esBR
E Vi
sits
4529
16Y
Y1/
2 ye
ar &
CO
VID
Inte
rrup
ted*
Indu
stry
Sur
vey
30At
Ris
k Id
entif
icat
ion
030
YY
Dela
yed
at re
ques
t of e
mpl
oyer
s, in
pro
gres
sNe
w In
dust
ries
Geog
raph
ic R
ecru
itmen
t3
NETE
A2
1Y
YCO
VID
Post
pone
d1
Team
Tex
as0
1Y
YCO
VID
Post
pone
d1
TBIC
01
YY
COVI
D Po
stpo
ned
5In
tern
al1
4Y
YCO
VID
Post
pone
dTr
ade
Show
s2
Righ
t Cor
ner
11
YY
COVI
D Po
stpo
ned
2Te
am T
exas
02
YY
COVI
D Po
stpo
ned
Trad
e Sh
ow R
ecru
itmen
t4
Inte
rnal
40
YY
Lead
Gen
10
Tele
conf
eren
ces/
Mee
tings
100
YY
Lead
Gen
erat
ing
Agen
tsSi
te S
elec
tors
1SE
DC0
1Y
YDe
laye
d un
til N
ovem
ber 2
020
1Te
am T
exas
01
YY
COVI
D Po
stpo
ned
Offi
ce o
f the
Gov
erno
r1
NETE
A1
0Y
Y1
Go B
ig in
Tex
as1
0Y
YIn
dust
rial
Rea
ltors
2I-2
0 Co
rrid
or0
2Y
YCO
VID
Post
pone
dLe
ad N
urtu
ring
Onl
ine
12M
onth
ly12
0Y
YCo
ntac
t Pro
gram
s1
Annu
ally
01
YY
In P
rogr
ess
IAM
C2
Bian
nual
ly1
1Y
YCo
vid
Canc
elle
dSm
all B
usin
ess
Deve
lopm
ent
Advi
ce a
nd R
efer
rals
As N
eede
d2
0Y
YBr
andi
ngCo
llate
ral M
ater
ials
Prof
ile1
Upda
te1
0Y
YVi
deos
3*T
estim
onia
ls, V
irtu
al B
uild
ing
21
YY
Test
imon
ials
in P
rogr
ess
Phot
osAs
Nee
ded
1Co
mpr
ehen
sive
KED
C an
d Ki
lgor
ePr
omot
iona
l Ite
ms
As N
eede
d2
Valu
e Pr
opos
ition
1Ta
rget
Mar
kets
10
YY
Onl
ine
Pres
ence
Web
site
1Ne
w0
1Y
YIn
Pro
gres
sDi
rect
orie
s1
Conw
ay D
ata
10
YY
1TD
I1
0Y
YPr
oper
ties
on W
ebsi
teAs
Nee
ded
Veri
ficat
ion
36

FY 2019-2020 Kilgore EDC Year-End Report
Strategic Map for Sustainability
Sustainability
Protect the financial integrity of the organization. FYE 2020
Objective
To impact economic outcomes in Kilgore we must seek and provide opportunities to collaborate with economic development partners.
Goal Maintain Kilgore Economic Development Corp. as a relevant and financially viable organization.
Measurement
7. Meet budget. 8. Maintain positive cash flow.
7. YE revenue of $2.4 million
with a budget of $3 million. FYE 2021 budget has been set at $2.25 million.
8. Even when considering potential cash outlay, cash flow is projected to be positive over the next 10 years and maintains a healthy reserve.
Goal and Measurement: KEDC is a fiscally responsible organization and finished the fiscal year with a positive cash flow for the next 10 years.

FY 2019-2020 Kilgore EDC Year-End Report
Program of Work Strategies for Sustainability
Activities undertaken to sustain and develop the organization and foster a positive economic development environment are listed below.
*Although delayed because of COVID-19, Workforce Appreciation was conducted at the specific request of employers and included two events serving eight companies representing more than 500 employees. Last fiscal year, workforce appreciation events included five events serving three companies representing 365 employees. **KEDC staff attends educational webinars and other seminars with regional, state, national and international focus on business recruitment and retention, regulatory issues, and data evaluation. Our value proposition includes the level of expertise and customer support by staff.
Stra
tegy
Activ
ityG
oal
Proj
ect
Com
plet
eRe
mai
nTa
rget
MY
Targ
et Y
ENo
tes
Part
ner C
olla
bora
tion
Cham
ber o
f Com
mer
ceBi
zcon
nect
1
Spon
sors
hip
10
YY
E41
Part
icip
atio
n 0
1Y
YCa
ncel
led
As a
ppro
pria
teJo
int T
rain
ing
As N
eede
dSp
onso
rshi
p0
Exis
ting
Indu
stry
Spec
ial P
roje
cts
As N
eede
dAs
Nee
ded
1M
anag
emen
t Rou
ndta
ble
1An
nual
ly1
0Y
YIn
dust
ry A
ppre
ciat
ion
1Re
cept
ion
10
YY
Wor
kfor
ce A
ppre
ciat
ion
6Ic
e Cr
eam
Del
iver
y0
6y
NCO
VID
Post
pone
d, c
ompl
eted
in F
YE 2
021
Gove
rnm
enta
lCo
llabo
ratio
n6
City
60
Y1
Coun
ty1
0Y
1St
ate
10
YY
1Fe
dera
l1
0Y
YW
orkf
orce
Dev
elop
men
tHR
Lunc
heon
s4
Qua
rter
ly2
2Y
YCO
IVD
Canc
elle
dW
orkf
orce
Tra
inin
g Pr
ojec
tsAs
Nee
ded
Sem
i-Ann
ually
1Ki
lgor
e IS
DKI
SD T
each
er F
acili
ty T
ours
4An
nual
ly0
4Y
YCO
VID
Post
pone
dCa
reer
Eve
nts
1M
iddl
e Sc
hool
Car
eer F
air
01
YY
COVI
D Ca
ncel
led
Kilg
ore
Colle
geAd
viso
ry B
oard
s2
Repr
esen
tatio
n2
0Y
YW
orkK
eys
Test
ing
75St
uden
ts75
YCO
VID
Post
pone
dAs
sess
men
ts1
Indu
stry
1
YCO
IVD
Post
pone
dO
rgan
izatio
nal P
rofic
ienc
yCo
ntin
uing
edu
catio
nBR
E, E
D, G
ov.,
Prop
erty
119
2Y
YCO
VID
Canc
elle
dW
ebin
ars
As N
eede
dM
any
Cert
ifica
tions
Mai
nten
ance
IEDC
, NDC
, IAM
C3
30
YAw
ards
Econ
omic
Exc
elle
nce
1De
sign
atio
n1
0Y
YPr
ogra
m o
f Wor
k 20
211
10
YY
Com
mun
icatio
nsAd
viso
ry B
oard
Mee
tings
Adm
inis
trat
ive
22
0Y
YBo
ard
Mee
tings
Adm
inis
trat
ive
1111
0Y
YNe
ws
Anno
unce
men
ts3
12-9
YY
Activ
ities
612
-6Y
YSu
stai
nabi
lity
TEDC
Legi
slat
ive
Effo
rts
11
0Y
YBu
dget
Boar
d M
eetin
gs11
110
YY
Cash
flow
Boar
d M
eetin
gs11
110
YY

FY 2019-2020 Kilgore EDC Year-End Report
Trend Analysis – Lead Development
Lead Development Sources: KEDC monitors the number of leads generated each year as well as lead sources to determine which marketing efforts are most on target. Source of leads generated to which KEDC could respond are illustrated in the chart below. Considering BRE, direct, regional and internal leads as direct activities of KEDC, the organization generated 76% of total actionable leads through internal activities.
Lead Types: KEDC also tracks the type of leads. Without considering Kilgore Cares retention projects, results this fiscal year are fairly typical, although slightly more expansion leads were developed than average.
FY 2019-2020 Kilgore EDC Year-End Report
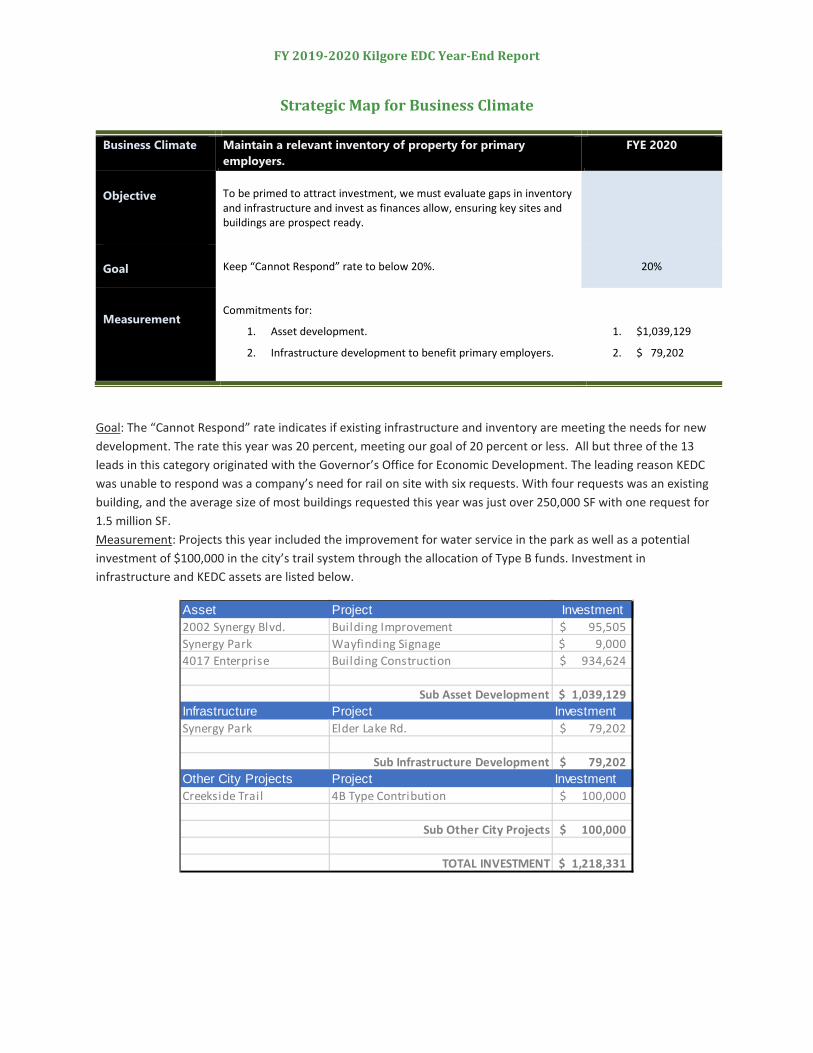
Trend Analysis – Lead Closure
Lead Closure Sources: KEDC monitors the number of leads generated each year as well as lead sources to determine which marketing efforts are most on target. Source of leads closed are illustrated in the chart below.
Lead Types: KEDC also tracks the type of leads generated as shown in the chart below.
FY 2019-2020 Kilgore EDC Year-End Report
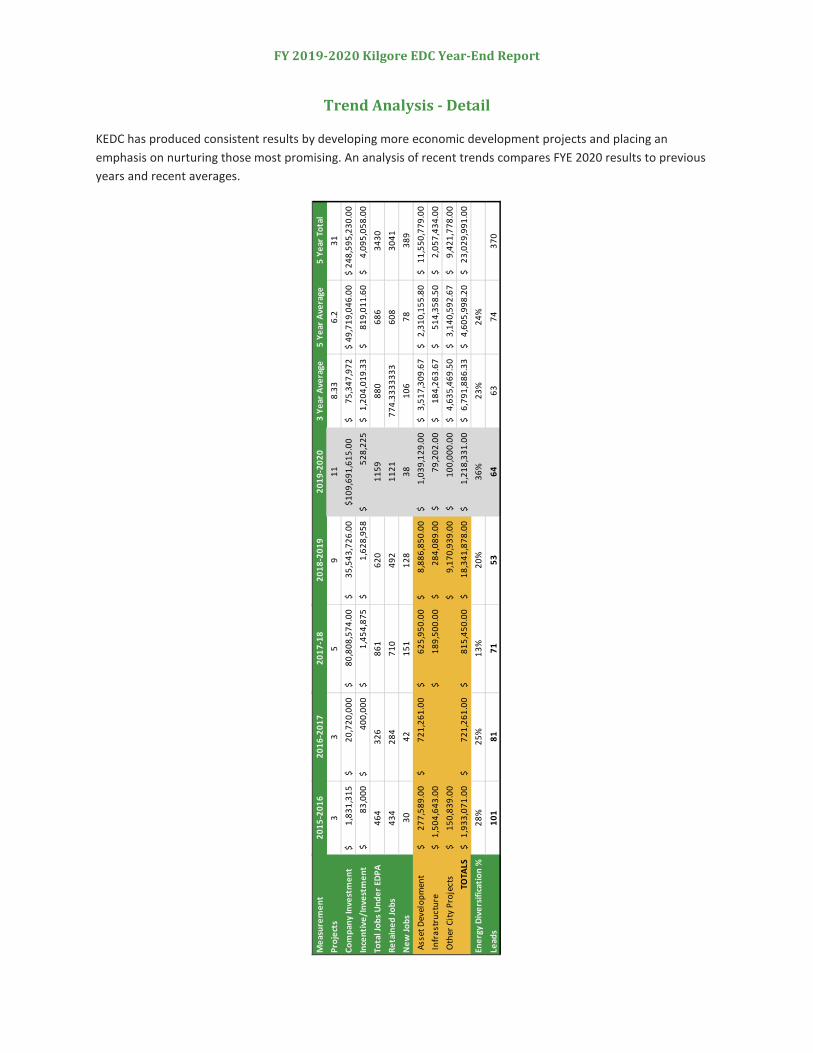
Trend Analysis - Detail
KEDC has produced consistent results by developing more economic development projects and placing an emphasis on nurturing those most promising. An analysis of recent trends compares FYE 2020 results to previous years and recent averages.
Mea
sure
men
t20
15-2
016
2016
-201
720
17-1
820
18-2
019
2019
-202
03
Year
Ave
rage
5 Ye
ar A
vera
ge5
Year
Tot
alPr
ojec
ts3
35
911
8.33
6.2
31Co
mpa
ny In
vest
men
t1,
831,
315
$
20,7
20,0
00$
80
,808
,574
.00
$
35,5
43,7
26.0
0$
$1
09,6
91,6
15.0
075
,347
,972
$
49
,719
,046
.00
$
248,
595,
230.
00$
In
cent
ive/
Inve
stm
ent
83,0
00$
40
0,00
0$
1,
454,
875
$
1,62
8,95
8$
52
8,22
5$
1,
204,
019.
33$
81
9,01
1.60
$
4,
095,
058.
00$
Tota
l Job
s Und
er E
DPA
464
326
861
620
1159
880
686
3430
Reta
ined
Jobs
43
428
471
049
211
2177
4.33
3333
360
830
41N
ew Jo
bs
3042
151
128
3810
678
389
Asse
t Dev
elop
men
t27
7,58
9.00
$
72
1,26
1.00
$
625,
950.
00$
8,
886,
850.
00$
1,03
9,12
9.00
$
3,
517,
309.
67$
2,
310,
155.
80$
11
,550
,779
.00
$
Infr
astr
uctu
re
1,50
4,64
3.00
$
189,
500.
00$
28
4,08
9.00
$
79,2
02.0
0$
18
4,26
3.67
$
51
4,35
8.50
$
2,
057,
434.
00$
Oth
er C
ity P
roje
cts
150,
839.
00$
9,17
0,93
9.00
$
10
0,00
0.00
$
4,63
5,46
9.50
$
3,14
0,59
2.67
$
9,42
1,77
8.00
$
TO
TALS
1,93
3,07
1.00
$
721,
261.
00$
81
5,45
0.00
$
18,3
41,8
78.0
0$
1,
218,
331.
00$
6,79
1,88
6.33
$
4,60
5,99
8.20
$
23,0
29,9
91.0
0$
En
ergy
Div
ersif
icatio
n %
28%
25%
13%
20%
36%
23%
24%
Lead
s10
181
7153
6463
7437
0

FY 2019-2020 Kilgore EDC Year-End Report
New Credentials
KEDC was awarded new credentials this fiscal year as a result of the organization’s accomplishments and activities.
International Economic Development Council Announced Kilgore as the recipient of the Community of the Year Award for communities with less than 25,000 population. Awards are judged by a diverse panel of economic and community developers from around the world, following a nomination process held earlier this year. IEDC received over 500 submissions from 4 countries. (IEDC is the national/international professional group for economic development.)
This new recognition adds to an already impressive list of credentials for the economic development organization of Kilgore. KEDC has won international awards for excellence in economic development from the International Economic Development Council and Business Retention and Expansion International. The Texas Economic Development Council has recognized KEDC with an Excellent rating every year since the recognition began in 2010. TEDC has awarded the Community Economic Development Award to KEDC in years 2001, 2007, 2015, and 2019.
2019 2015 2007 2001
Texas Economic Development Council The Community Economic Development Award This program recognizes exceptional contributions of TEDC member cities toward the economic vitality of their communities and the state of Texas through creativity, leadership, and partnership in the achievement of business attraction, business retention, business recruitment and community improvement.
2019 Texas Economic Development Council Best in Show Transferability Award Overall awards are presented for outstanding programs regardless of community size. The award recognizes programs or projects that show potential use by other economic development agencies or practitioners for similar opportunities or solutions in any size community. The criteria for award include that the program or project also should be readily transferable to comparable situations in other communities.
2019 thru 2010
Texas Economic Development Council Economic Excellence Recognition The Texas Economic Development Council has recognized KEDC with an Excellent rating every year since the recognition began in 2010. The award in 2019 is for work accomplished in 2018.
2016 2009
Business Retention and Expansion International Project Impact Award
2014 International Economic Development Council Video Multi Media Promotion Excellence – Bronze
2011 Southern Economic Development Council Communications Awards Website Design - Superior

FY 2019-2020 Kilgore EDC Year-End Report
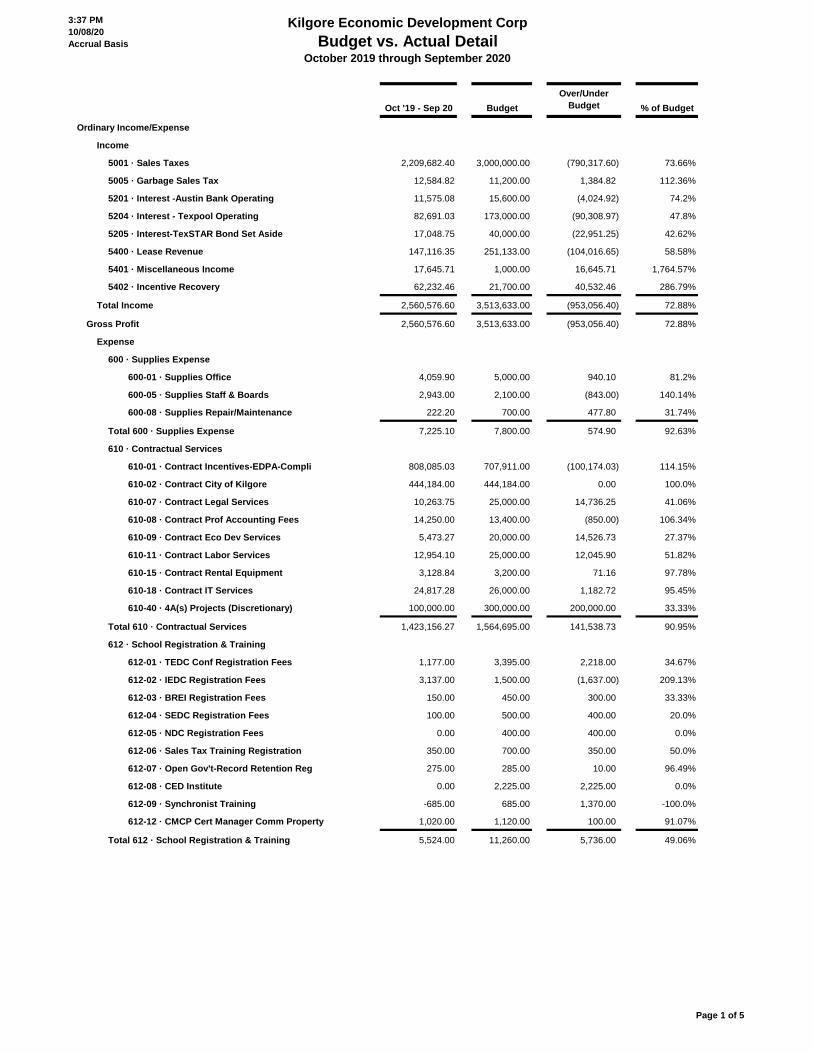
Unaudited Financials
(Profit & Loss Budget vs. Actual October 1, 2019, to September 30, 2020, follows)
3:37 PM 10/08/20 Accrual Basis
Kilgore Economic Development Corp Budget vs. Actual Detail
October 2019 through September 2020
Oct '19 - Sep 20 BudgetOver/Under
Budget % of Budget
Ordinary Income/Expense
Income
5001 · Sales Taxes 2,209,682.40 3,000,000.00 (790,317.60) 73.66%
5005 · Garbage Sales Tax 12,584.82 11,200.00 1,384.82 112.36%
5201 · Interest -Austin Bank Operating 11,575.08 15,600.00 (4,024.92) 74.2%
5204 · Interest - Texpool Operating 82,691.03 173,000.00 (90,308.97) 47.8%
5205 · Interest-TexSTAR Bond Set Aside 17,048.75 40,000.00 (22,951.25) 42.62%
5400 · Lease Revenue 147,116.35 251,133.00 (104,016.65) 58.58%
5401 · Miscellaneous Income 17,645.71 1,000.00 16,645.71 1,764.57%
5402 · Incentive Recovery 62,232.46 21,700.00 40,532.46 286.79%
Total Income 2,560,576.60 3,513,633.00 (953,056.40) 72.88%
Gross Profit 2,560,576.60 3,513,633.00 (953,056.40) 72.88%
Expense
600 · Supplies Expense
600-01 · Supplies Office 4,059.90 5,000.00 940.10 81.2%
600-05 · Supplies Staff & Boards 2,943.00 2,100.00 (843.00) 140.14%
600-08 · Supplies Repair/Maintenance 222.20 700.00 477.80 31.74%
Total 600 · Supplies Expense 7,225.10 7,800.00 574.90 92.63%
610 · Contractual Services
610-01 · Contract Incentives-EDPA-Compli 808,085.03 707,911.00 (100,174.03) 114.15%
610-02 · Contract City of Kilgore 444,184.00 444,184.00 0.00 100.0%
610-07 · Contract Legal Services 10,263.75 25,000.00 14,736.25 41.06%
610-08 · Contract Prof Accounting Fees 14,250.00 13,400.00 (850.00) 106.34%
610-09 · Contract Eco Dev Services 5,473.27 20,000.00 14,526.73 27.37%
610-11 · Contract Labor Services 12,954.10 25,000.00 12,045.90 51.82%
610-15 · Contract Rental Equipment 3,128.84 3,200.00 71.16 97.78%
610-18 · Contract IT Services 24,817.28 26,000.00 1,182.72 95.45%
610-40 · 4A(s) Projects (Discretionary) 100,000.00 300,000.00 200,000.00 33.33%
Total 610 · Contractual Services 1,423,156.27 1,564,695.00 141,538.73 90.95%
612 · School Registration & Training
612-01 · TEDC Conf Registration Fees 1,177.00 3,395.00 2,218.00 34.67%
612-02 · IEDC Registration Fees 3,137.00 1,500.00 (1,637.00) 209.13%
612-03 · BREI Registration Fees 150.00 450.00 300.00 33.33%
612-04 · SEDC Registration Fees 100.00 500.00 400.00 20.0%
612-05 · NDC Registration Fees 0.00 400.00 400.00 0.0%
612-06 · Sales Tax Training Registration 350.00 700.00 350.00 50.0%
612-07 · Open Gov't-Record Retention Reg 275.00 285.00 10.00 96.49%
612-08 · CED Institute 0.00 2,225.00 2,225.00 0.0%
612-09 · Synchronist Training -685.00 685.00 1,370.00 -100.0%
612-12 · CMCP Cert Manager Comm Property 1,020.00 1,120.00 100.00 91.07%
Total 612 · School Registration & Training 5,524.00 11,260.00 5,736.00 49.06%
Page 1 of 5

3:37 PM 10/08/20 Accrual Basis
Kilgore Economic Development Corp Budget vs. Actual Detail
October 2019 through September 2020
Oct '19 - Sep 20 BudgetOver/Under
Budget % of Budget
614 · Travel Expenses
614-01 · TEDC Travel 2,619.91 4,500.00 1,880.09 58.22%
614-02 · IEDC Travel 2,908.94 2,000.00 (908.94) 145.45%
614-03 · BREI Travel 0.00 2,000.00 2,000.00 0.0%
614-04 · SEDC Travel 0.00 1,500.00 1,500.00 0.0%
614-05 · NDC Travel 0.00 1,000.00 1,000.00 0.0%
614-06 · Sales Tax Training Travel 61.65 1,200.00 1,138.35 5.14%
614-07 · Open Gov't-Record Retention Travel 907.72 750.00 (157.72) 121.03%
614-08 · CED Travel 0.00 1,500.00 1,500.00 0.0%
614-09 · Synchronist Travel 0.00 2,000.00 2,000.00 0.0%
614-12 · BOMA (Bldg Owners Maint Assoc) 0.00 2,000.00 2,000.00 0.0%
614-15 · NETDR Meeting Travel 69.02 650.00 580.98 10.62%
614-16 · CEcD Certification Maint Travel 0.00 1,500.00 1,500.00 0.0%
614-18 · Special Project Travel 1,387.50 6,500.00 5,112.50 21.35%
614-19 · Kilgore MTGS - Other Travel 951.52 1,000.00 48.48 95.15%
614-20 · Mileage Exp for Local Travel 1,101.12 2,550.00 1,448.88 43.18%
614-25 · Mission Trip Travel 90.96 1,000.00 909.04 9.1%
Total 614 · Travel Expenses 10,098.34 31,650.00 21,551.66 31.91%
616 · Dues, Fees & Memberships
616-01 · TEDC Dues 2,550.00 2,000.00 (550.00) 127.5%
616-02 · IEDC Dues 435.00 450.00 15.00 96.67%
616-03 · BREI Dues 100.00 150.00 50.00 66.67%
616-04 · SEDC Dues 250.00 250.00 0.00 100.0%
616-06 · SHRM Dues 26.00 209.00 183.00 12.44%
616-12 · BOMA Membership 0.00 250.00 250.00 0.0%
616-15 · NETEDR Dues 200.00 200.00 0.00 100.0%
616-28 · Texas SmartBuy Membership Dues 100.00 100.00 0.00 100.0%
616-30 · Sam's Club Membership Dues 100.00 100.00 0.00 100.0%
616-32 · Chamber Commerce Membership Due 225.00 255.00 30.00 88.24%
Total 616 · Dues, Fees & Memberships 3,986.00 3,964.00 (22.00) 100.56%
620 · Marketing
621 · Marketing Initiative Memb/Subcr
621-01 · NETEA Membership 12,000.00 12,000.00 0.00 100.0%
621-03 · Texas One Membership 5,000.00 5,000.00 0.00 100.0%
621-06 · Research 360 Subscription-Sites 1,495.00 1,295.00 (200.00) 115.44%
621-08 · Impact Data Source Subscription 4,644.00 4,644.00 0.00 100.0%
621-10 · Team Texas Membership 3,000.00 3,000.00 0.00 100.0%
621-12 · Right Corner Membership 2,500.00 2,500.00 0.00 100.0%
621-15 · I-20 Corridor Membership 2,500.00 2,500.00 0.00 100.0%
621-16 · IAMC Membership 1,645.00 1,645.00 0.00 100.0%
621-18 · Annual License WebBase Proposal 1,023.59 1,188.00 164.41 86.16%
621-20 · EAIC Membership 1,035.00 1,150.00 115.00 90.0%
Total 621 · Marketing Initiative Memb/Subcr 34,842.59 34,922.00 79.41 99.77%
622 · Contractual Lead Generation
622-01 · Contract Marketing 5,000.00 20,000.00 15,000.00 25.0%
622-02 · Contract Markting Smart Calling 19,073.73 30,000.00 10,926.27 63.58%
622-03 · Research & Market Intelligence 10,930.00 15,000.00 4,070.00 72.87%
Total 622 · Contractual Lead Generation 35,003.73 65,000.00 29,996.27 53.85%
Page 2 of 5

3:37 PM 10/08/20 Accrual Basis
Kilgore Economic Development Corp Budget vs. Actual Detail
October 2019 through September 2020
Oct '19 - Sep 20 BudgetOver/Under
Budget % of Budget
623 · Social & Email Marketing
623-01 · Website Marketing 33,000.00 36,000.00 3,000.00 91.67%
623-02 · Online Marketing 4,036.58 5,000.00 963.42 80.73%
623-03 · Real Estate Advertising - Other 978.17 1,000.00 21.83 97.82%
623-20 · Web Page Updates 24,600.00 24,600.00 0.00 100.0%
623-25 · Social Media Advertising 0.00 1,000.00 1,000.00 0.0%
623-33 · Directory Listings 1,450.00 1,500.00 50.00 96.67%
Total 623 · Social & Email Marketing 64,064.75 69,100.00 5,035.25 92.71%
624 · Marketing Collateral Materials
624-01 · Photographs & Videos 13,348.43 10,000.00 (3,348.43) 133.48%
624-02 · Brochures & Presentation Materi 66.26 3,000.00 2,933.74 2.21%
624-03 · Promotional Items 2,117.22 5,000.00 2,882.78 42.34%
Total 624 · Marketing Collateral Materials 15,531.91 18,000.00 2,468.09 86.29%
625 · Recruitment Activities
625-01 · Team Texas
625-011 · Team Texas Marketing Fees 5,000.00 6,000.00 1,000.00 83.33%
625-012 · Team Texas Events 759.39 8,000.00 7,240.61 9.49%
Total 625-01 · Team Texas 5,759.39 14,000.00 8,240.61 41.14%
625-03 · Texas One Recruitment Activity
625-032 · Texas One Meetings/Events Austi 505.42 1,500.00 994.58 33.7%
Total 625-03 · Texas One Recruitment Activity 505.42 1,500.00 994.58 33.7%
625-04 · IAMC Registration & Travel
625-041 · IAMC Fall Forum 40.00 3,200.00 3,160.00 1.25%
625-042 · IAMC Spring Forum 3,882.88 3,200.00 (682.88) 121.34%
625-043 · IAMC Texas Dinner 600.00 1,100.00 500.00 54.55%
Total 625-04 · IAMC Registration & Travel 4,522.88 7,500.00 2,977.12 60.31%
625-05 · NETEA Lead Generation
625-051 · Company Visits Travel 2,192.34 7,500.00 5,307.66 29.23%
625-052 · State Agency Visits 674.02 1,500.00 825.98 44.94%
625-053 · NETEA Meetings 284.05 400.00 115.95 71.01%
Total 625-05 · NETEA Lead Generation 3,150.41 9,400.00 6,249.59 33.52%
625-06 · I-20 Corridor
625-061 · I-20 Corridor Events 0.00 900.00 900.00 0.0%
625-062 · I-20 Corridor Meetings 0.00 100.00 100.00 0.0%
Total 625-06 · I-20 Corridor 0.00 1,000.00 1,000.00 0.0%
625-07 · Right Corner
625-071 · Right Corner Events 8,013.45 7,500.00 (513.45) 106.85%
625-072 · Right Corner Meetings 0.00 100.00 100.00 0.0%
Total 625-07 · Right Corner 8,013.45 7,600.00 (413.45) 105.44%
625-08 · EAIC Events 12,630.00 15,000.00 2,370.00 84.2%
625-10 · Consultant Visits 11.98 2,500.00 2,488.02 0.48%
625-13 · SEDC Meet the Consultants 400.00 2,500.00 2,100.00 16.0%
625-15 · Discretionary Marketing Opportu 12,356.72 51,978.00 39,621.28 23.77%
Total 625 · Recruitment Activities 47,350.25 112,978.00 65,627.75 41.91%
Total 620 · Marketing 196,793.23 300,000.00 103,206.77 65.6%
Page 3 of 5

3:37 PM 10/08/20 Accrual Basis
Kilgore Economic Development Corp Budget vs. Actual Detail
October 2019 through September 2020
Oct '19 - Sep 20 BudgetOver/Under
Budget % of Budget
630 · Business Retention - Expansion
630-01 · BRE Meetings with Chamber 1,000.00 4,000.00 3,000.00 25.0%
630-02 · CEO Meetings 393.61 1,500.00 1,106.39 26.24%
630-04 · Business Appreciation Events 11,654.76 12,000.00 345.24 97.12%
630-05 · HR Meetings 3,226.39 4,500.00 1,273.61 71.7%
630-10 · SBDC Programs 0.00 7,500.00 7,500.00 0.0%
630-11 · Workforce Development 79.00 15,200.00 15,121.00 0.52%
630-13 · BRE Projects CEO Events 118.21 15,000.00 14,881.79 0.79%
630-19 · Contact Management Tool 0.00 1,250.00 1,250.00 0.0%
630-30 · BRE Surveys 0.00 500.00 500.00 0.0%
630-31 · Labor Market Data 2,575.00 8,750.00 6,175.00 29.43%
630-33 · Wage & Benefit Survey 0.00 7,500.00 7,500.00 0.0%
Total 630 · Business Retention - Expansion 19,046.97 77,700.00 58,653.03 24.51%
640 · Synergy Center Lease Expenses
640-01 · Lease Payments 45,300.00 45,300.00 0.00 100.0%
640-02 · NNN Expenses 12,573.00 12,960.00 387.00 97.01%
640-05 · Electric Utility 8,637.19 9,500.00 862.81 90.92%
640-06 · Telephone & Internet 4,924.09 5,000.00 75.91 98.48%
640-10 · Cleaning 6,011.77 7,000.00 988.23 85.88%
640-15 · Supplies for Synergy Center 799.63 900.00 100.37 88.85%
640-16 · Repair & Maintenance 7,390.73 5,780.00 (1,610.73) 127.87%
640-20 · Training Room Rentals -1,045.00 -1,500.00 (455.00) 69.67%
Total 640 · Synergy Center Lease Expenses 84,591.41 84,940.00 348.59 99.59%
650 · Buildings & Grounds Maintenance
651 · Synergy Park
651-01 · Cleaning & Maintenance Supplies 827.93 1,250.00 422.07 66.23%
651-03 · Contract Maintenance/Cleaning 16,430.00 15,600.00 (830.00) 105.32%
651-06 · Fish Texas Parks & Wildlife 2,648.80 2,650.00 1.20 99.96%
651-08 · Security Camera Maint & Repair 8,911.00 10,000.00 1,089.00 89.11%
651-10 · Gates Maintenance & Repairs 2,674.66 3,500.00 825.34 76.42%
651-20 · Water Utilities 560.56 1,200.00 639.44 46.71%
651-21 · Electric Utilities 755.87 1,000.00 244.13 75.59%
651-22 · Telephone Line Service to Gate 784.40 750.00 (34.40) 104.59%
651-26 · Security Patrol 10,789.83 12,000.00 1,210.17 89.92%
651-30 · Brush Hog Open Area Mowing 31,540.00 35,760.00 4,220.00 88.2%
651-31 · Trail Area Mowing 23,200.00 23,200.00 0.00 100.0%
651-32 · Tree Cutting & Removal 2,190.00 7,500.00 5,310.00 29.2%
651-35 · Weed and Ant Control 0.00 1,800.00 1,800.00 0.0%
651-37 · Landscape & Beds Maintenance 3,600.00 3,600.00 0.00 100.0%
651-40 · Misc Repairs & Maintenance 26,764.72 30,000.00 3,235.28 89.22%
651-50 · SPPOA Reimbursement -14,500.00 -14,250.00 250.00 101.75%
Total 651 · Synergy Park 117,177.77 135,560.00 18,382.23 86.44%
652 · KNIP - Maverick Dr @ Hwy 42
652-30 · KNIP Brush Hog Open Area Mowing 0.00 1,000.00 1,000.00 0.0%
652-40 · KNIP Misc Repairs & Maintenance 0.00 500.00 500.00 0.0%
Total 652 · KNIP - Maverick Dr @ Hwy 42 0.00 1,500.00 1,500.00 0.0%
Page 4 of 5

3:37 PM 10/08/20 Accrual Basis
Kilgore Economic Development Corp Budget vs. Actual Detail
October 2019 through September 2020
Oct '19 - Sep 20 BudgetOver/Under
Budget % of Budget
653 · KIP - Energy Drive
653-21 · KIP Electric Service 301.52 330.00 28.48 91.37%
653-30 · KIP Brush Hog Open Area Mowing 600.00 1,200.00 600.00 50.0%
653-37 · KIP Landscape & Bed Maintenance 2,280.00 2,280.00 0.00 100.0%
653-40 · KIP Misc Repairs & Maintenance 120.00 500.00 380.00 24.0%
Total 653 · KIP - Energy Drive 3,301.52 4,310.00 1,008.48 76.6%
654 · KEDC Other Property Expense
654-60 · Cox Road Property 1,050.00 1,000.00 (50.00) 105.0%
654-61 · FM 349 & 2276 CDL Testing Site 1,620.00 1,000.00 (620.00) 162.0%
654-62 · 2706 Hwy 135 N - Weatherford 0.00 500.00 500.00 0.0%
654-63 · NOV Subdivision Tract 5 362.55 300.00 (62.55) 120.85%
654-64 · 4005 FM 349 Advanced Tech Centr 435.00 1,500.00 1,065.00 29.0%
654-65 · 4017 Enterprise Wagner Bldg. 14,548.55 0.00 (14,548.55) 100.0%
654-90 · Reserve for Buildings & Grounds 0.00 50,000.00 50,000.00 0.0%
Total 654 · KEDC Other Property Expense 18,016.10 54,300.00 36,283.90 33.18%
Total 650 · Buildings & Grounds Maintenance 138,495.39 195,670.00 57,174.61 70.78%
660 · Capital Expenditures
660-01 · Capital Equipment Minor <$5,000 5,976.08 5,000.00 (976.08) 119.52%
660-02 · Capital Equipment >$5,000 0.00 10,000.00 10,000.00 0.0%
660-05 · Capital Improvements - Synergy 0.00 200,000.00 200,000.00 0.0%
660-10 · Capital Improvements Other Prop 56,634.32 200,000.00 143,365.68 28.32%
660-17 · Wagner Tuning 4017 Enterprise 628,171.87 0.00 (628,171.87) 100.0%
Total 660 · Capital Expenditures 690,782.27 415,000.00 (275,782.27) 166.45%
Total Expense 2,579,698.98 2,692,679.00 112,980.02 95.8%
Net Ordinary Income -19,122.38 820,954.00 (840,076.38) -2.33%
Other Income/Expense
Other Expense
680 · Transfers Out of Operating Fund
680-10 · Bond Set Aside 180,000.00 180,000.00 0.00 100.0%
680-20 · Transfer Out to Bond I&S Acct 638,703.00 640,954.00 (2,251.00) 99.65%
Total 680 · Transfers Out of Operating Fund 818,703.00 820,954.00 (2,251.00) 99.73%
Total Other Expense 818,703.00 820,954.00 (2,251.00) 99.73%
Net Other Income -818,703.00 -820,954.00 2,251.00 99.73%Net Income -837,825.38 0.00 (837,825.38) 100.0%
Page 5 of 5


![CHARLES KILGORE and HIRAM KILGORE [BROTHERS]€¦ · Five brothers who were great, great grandsons of Lord Douglas Kilgore came to America in 1763 from Scotland. Charles Kilgore,](https://img.pdfslide.us/doc/110x75/5fc655f49e1a8763c4599104/charles-kilgore-and-hiram-kilgore-brothers-five-brothers-who-were-great-great.jpg)