Embed Size (px)
Citation preview
Year-end Press Conference
Enrique García Executive President
Andean Development Corporation Caracas, December 14, 2004
Highlights 2004
• Economic recovery of Latin America
• Greater stability in the region
• New momentum in integration processes
• CAF’s growing role in the region:
• Conceptual and financial stimulus for a renewed development agenda
• Record figures in operations and financial results
• Confirmation of risk ratings
• international recognition
• Best issuing agency of the year (Euromoney)
• Best multilateral bank (Latin Finance)
• Best bond issue to finance development (Emerging Markets)
Regional environment
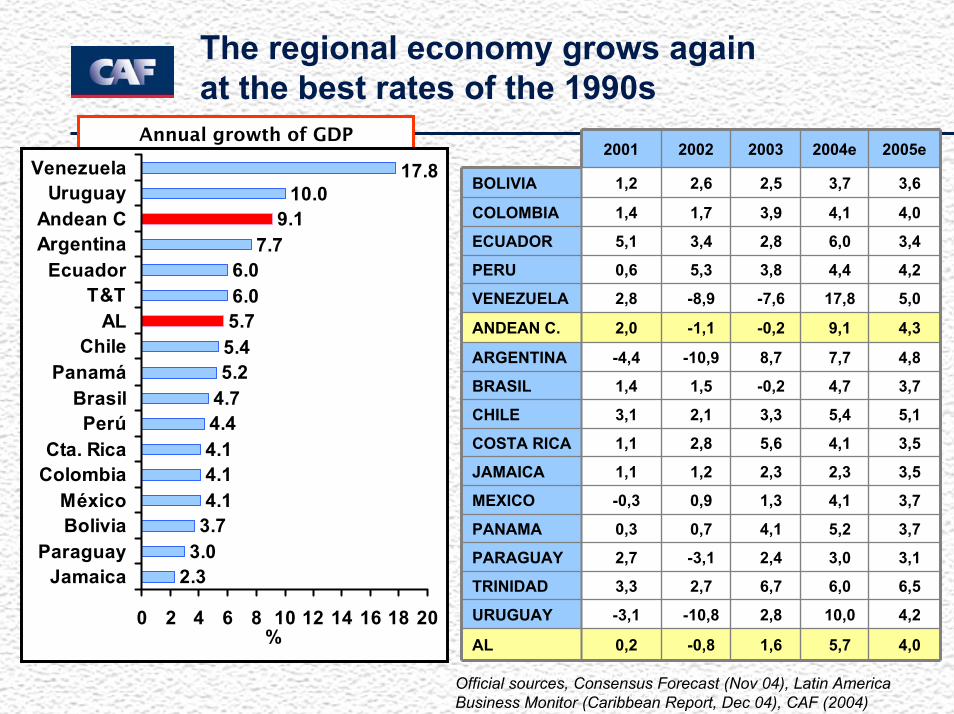
The regional economy grows againat the best rates of the 1990s
Fuentes oficiales, Consensus Forecast (Nov. 04), Latin AmericaBusiness Monitor (Caribbean Report, Dic 04), CAF (2004)
Annual growth of GDP-2004e-
Official sources, Consensus Forecast (Nov 04), Latin America Business Monitor (Caribbean Report, Dec 04), CAF (2004)
5,7
10,0
6,0
3,0
5,2
4,1
2,3
4,1
5,4
4,7
7,7
9,1
17,8
4,4
6,0
4,1
3,7
2004e
1,6
2,8
6,7
2,4
4,1
1,3
2,3
5,6
3,3
-0,2
8,7
-0,2
-7,6
3,8
2,8
3,9
2,5
2003
4,0-0,80,2AL
4,2
6,5
3,1
3,7
3,7
3,5
3,5
5,1
3,7
4,8
4,3
5,0
4,2
3,4
4,0
3,6
2005e
0,70,3PANAMA
0,9-0,3MEXICO
1,21,1JAMAICA
2,81,1COSTA RICA
2,13,1CHILE
1,51,4BRASIL
-10,8
2,7
-3,1
-10,9
-1,1
-8,9
5,3
3,4
1,7
2,6
2002
-3,1URUGUAY
2,0ANDEAN C.
2,8VENEZUELA
0,6PERU
5,1ECUADOR
1,4COLOMBIA
1,2BOLIVIA
3,3TRINIDAD
2,7PARAGUAY
-4,4ARGENTINA
2001
2.33.03.74.14.14.14.44.75.25.45.76.06.0
7.79.1
10.017.8
0 2 4 6 8 10 12 14 16 18 20
JamaicaParaguay
BoliviaMéxico
ColombiaCta. Rica
PerúBrasil
PanamáChile
ALT&T
EcuadorArgentinaAndean C
UruguayVenezuela
%
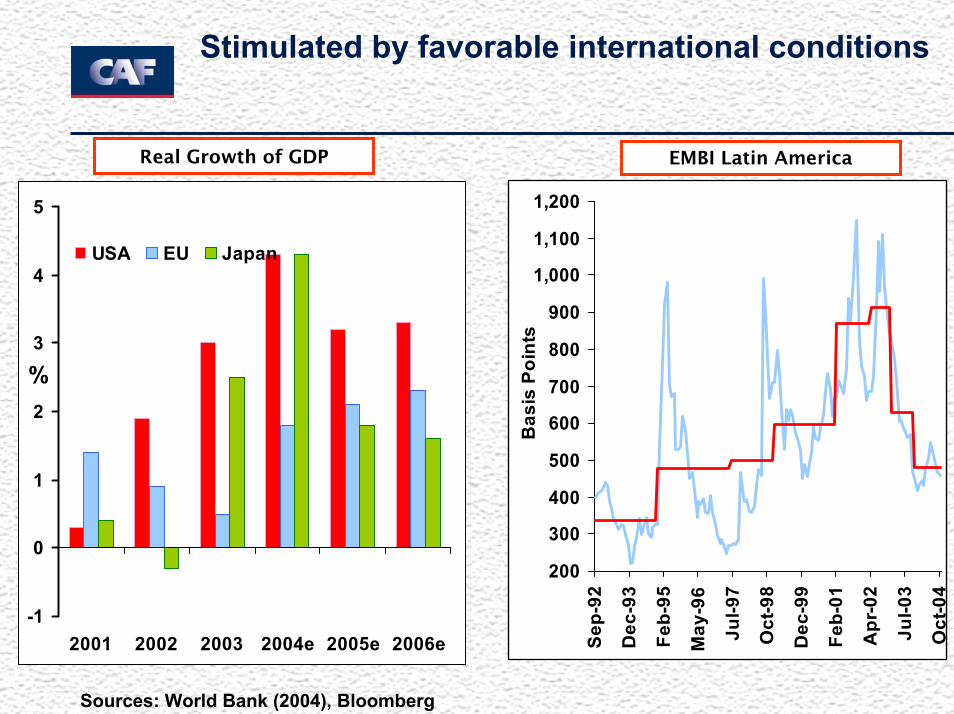
Stimulated by favorable international conditions
-1
0
1
2
3
4
5
2001 2002 2003 2004e 2005e 2006e
%
USA EU Japan
Real Growth of GDP
200
300
400
500
600
700
800
900
1,000
1,100
1,200
Sep
-92
Dec
-93
Feb-
95
May
-96
Jul-9
7
Oct
-98
Dec
-99
Feb-
01
Apr
-02
Jul-0
3
Bas
is P
oint
s
EMBI Latin America
Oct
-04
Sources: World Bank (2004), Bloomberg
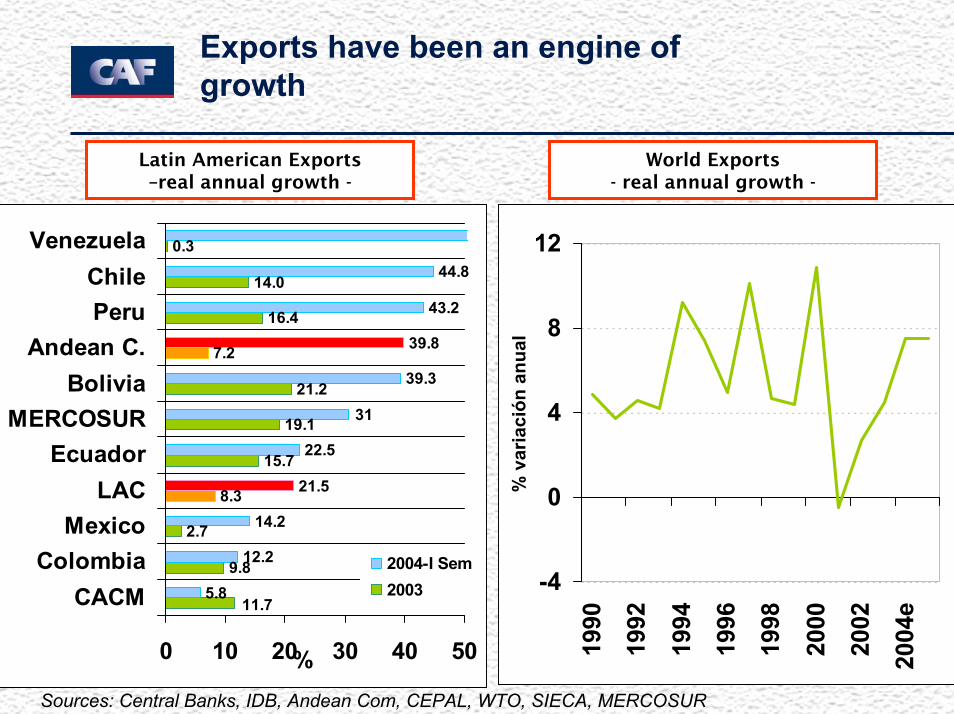
Exports have been an engine of growth
9.8
2.7
8.3
15.7
19.1
21.2
7.2
16.4
14.0
0.3
5.8
12.2
14.2
21.5
22.5
39.3
39.8
43.2
44.8
11.7
31
0 10 20 30 40 50
CACMColombia
MexicoLAC
EcuadorMERCOSUR
BoliviaAndean C.
PeruChile
Venezuela
%
2004-I Sem2003 -4
0
4
8
12
1990
1992
1994
1996
1998
2000
2002
2004
e
% v
aria
ción
anu
al
Latin American Exports –real annual growth -
World Exports- real annual growth -
Sources: Central Banks, IDB, Andean Com, CEPAL, WTO, SIECA, MERCOSUR
The improved regional outlook should not lead to complacency
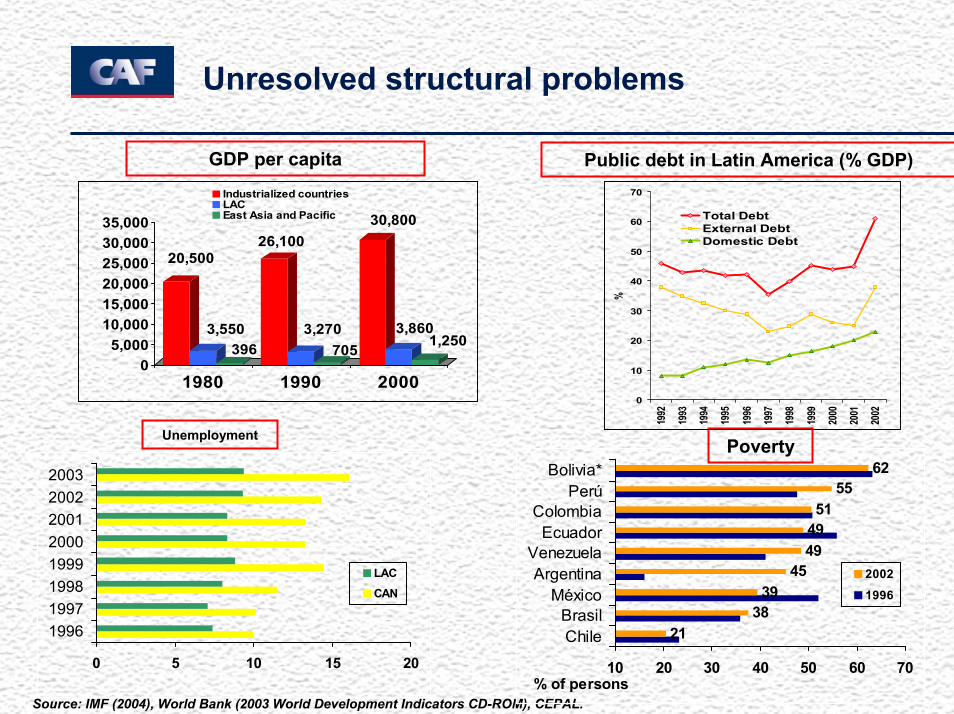
Unresolved structural problems
Source: IMF (2004), World Bank (2003 World Development Indicators CD-ROM), CEPAL.
2138
3945
494951
5562
10 20 30 40 50 60 70
ChileBrasil
MéxicoArgentina
VenezuelaEcuador
ColombiaPerú
Bolivia*
% of persons
2002
1996
Poverty
0 5 10 15 20
19961997199819992000200120022003
LAC
CAN
Unemployment
20,500
3,550396
26,100
3,270705
30,800
3,8601,250
05,000
10,00015,00020,00025,00030,00035,000
1980 1990 2000
Industrialized countriesLACEast Asia and Pacific
0
10
20
30
40
50
60
70
1992
1993
1994
1995
1996
1997
1998
1999
2000
2001
2002
%
Total DebtExternal DebtDomestic Debt
GDP per capita Public debt in Latin America (% GDP)
In this context the CAF is working for a renewed development agenda
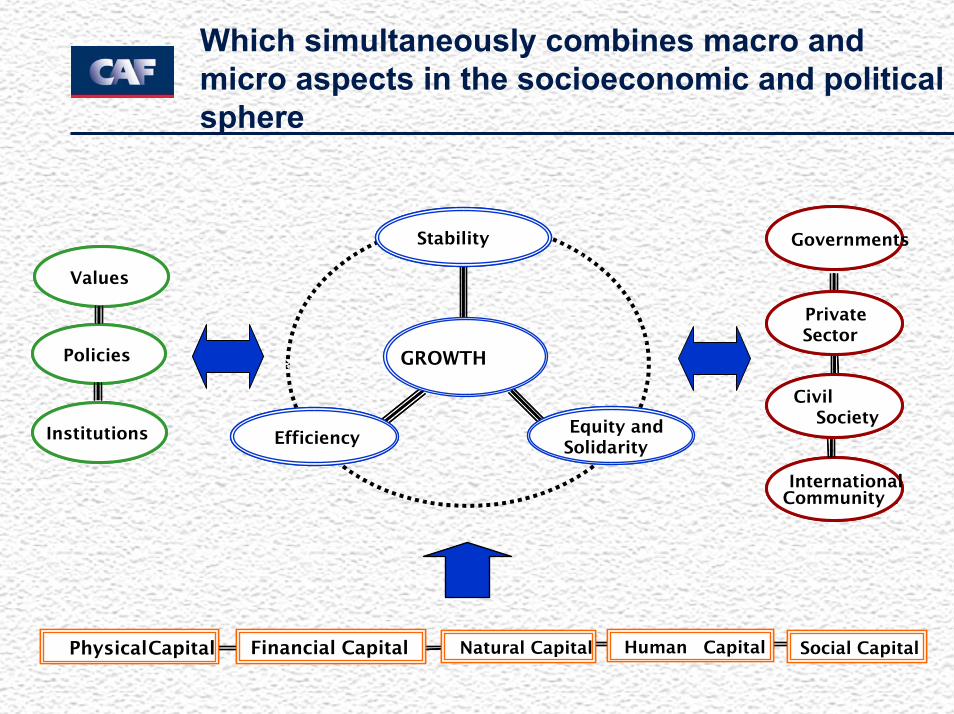
Which simultaneously combines macro and micro aspects in the socioeconomic and political sphere
Capital Físico Capital Financiero Capital Natural Capital Humano Capital SocialCapital Físico Capital FinancieroPhysicalCapital Financial Capital Capital Natural Capital Humano Capital SocialNatural Capital Human Capital Social Capital
ComunidadInternacional
Gobiernos
SociedadCivil
Sector Privado
InternationalCommunity
Governments
CivilSociety
Private Sector
Valores
Políticas
Instituciones
Values
Policies
Institutions Equidad ySolidaridad
Estabilidad
EficienciaEquity and
Solidarity
Stability
Efficiency
GROWTH
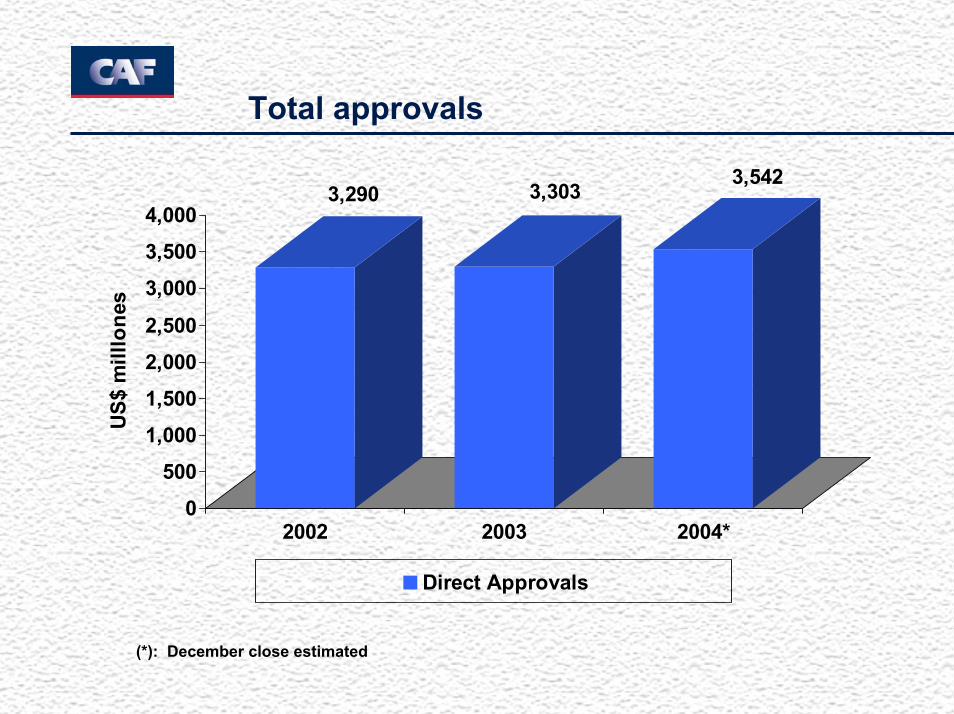
Total approvals
3,290 3,3033,542
0
500
1,000
1,500
2,000
2,500
3,000
3,500
4,000
US$
mill
lone
s
2002 2003 2004*
Direct Approvals
(*): December close estimated
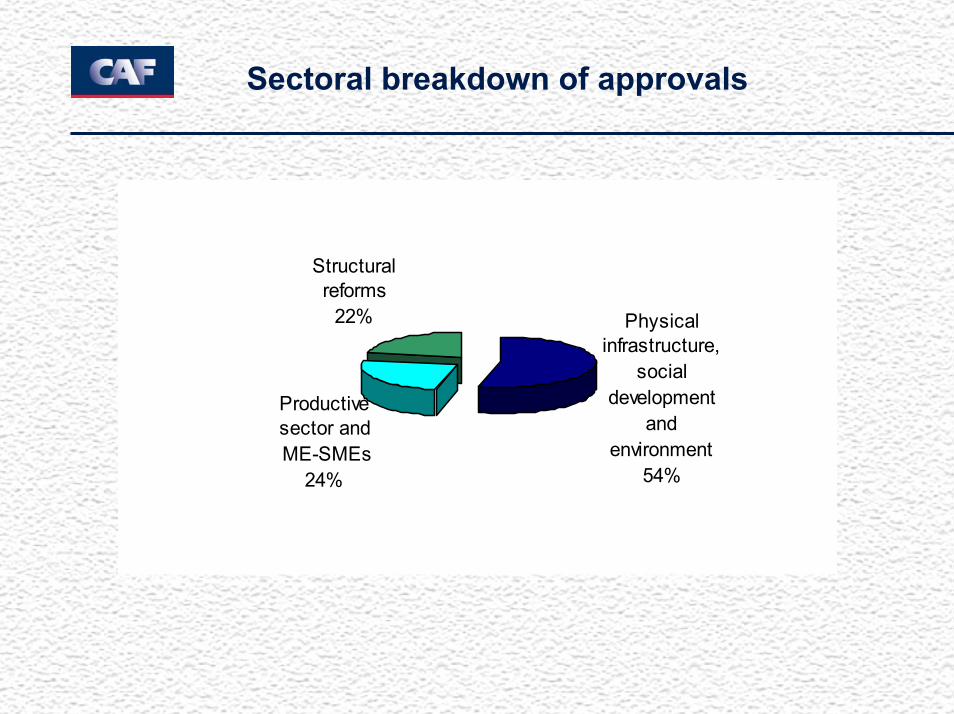
Sectoral breakdown of approvals
Physical infrastructure,
social development
and environment
54%
Productive sector and ME-SMEs
24%
Structural reforms
22%
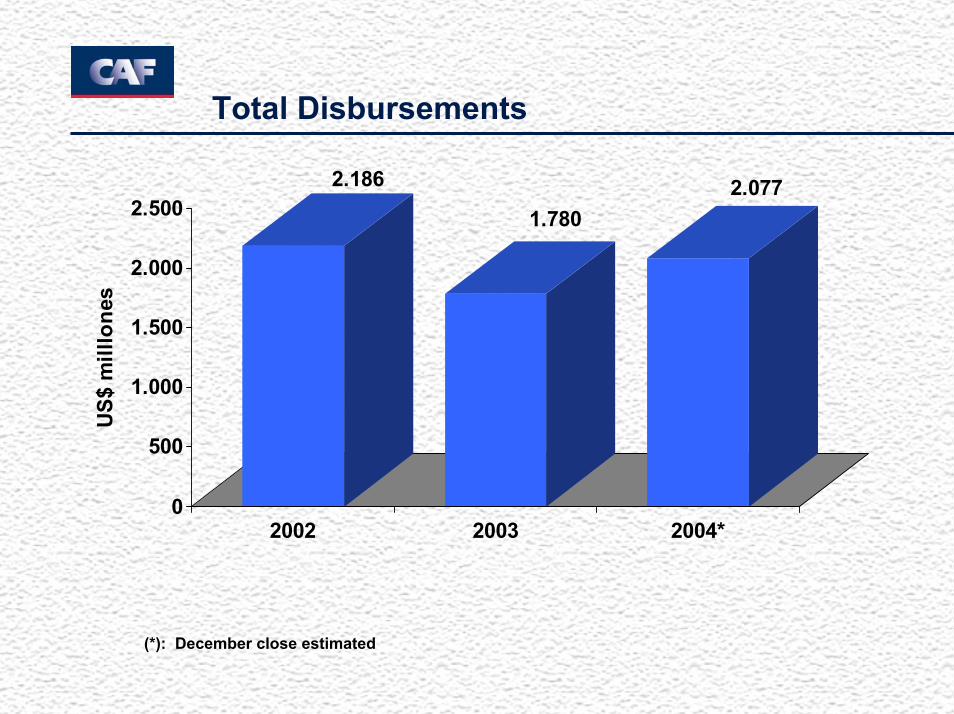
Total Disbursements
2.186
1.7802.077
0
500
1.000
1.500
2.000
2.500
US$
mill
lone
s
2002 2003 2004*
(*): December close estimated
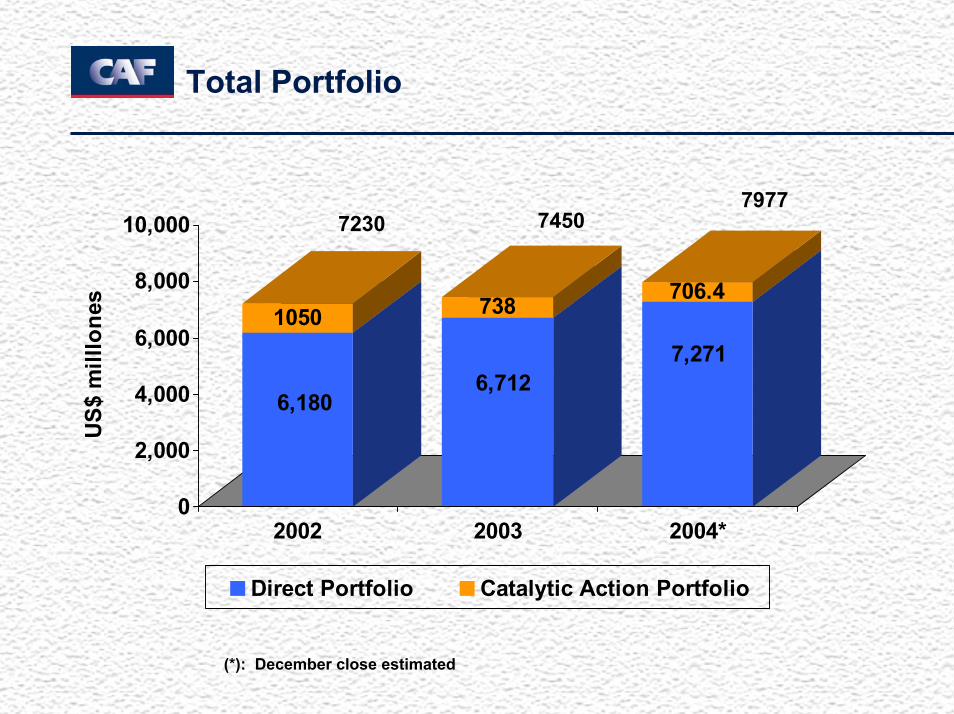
Total Portfolio
6,180
1050
6,712
738
7,271
706.4
0
2,000
4,000
6,000
8,000
10,000
US$
mill
lone
s
2002 2003 2004*
Direct Portfolio Catalytic Action Portfolio
72307977
7450
(*): December close estimated

httphttp:://www.caf.com//www.caf.com