Embed Size (px)
Citation preview

Year end 2013 results Presentation for investors and analysts
11th February 2014

Contents
1 Key highlights
2 Consolidated financial information
3 Business development
2
3 Business development
4 Appendix
5 Financial supplement
6 Schedule and contacts

The organic growth and underwriting profit have offset the impact of the appreciation of the Euro and the decrease in interest rates
Key highlights1
Revenues 25,889.3 2.3%
Premiums 21,835.5 1.2%
Managed savings(1) 33,614.1 8.3%
Non-life combined ratio 96.1% 0.7 p.p.
3Million Euros
NOTE: earnings per share calculated over 3,079,553,273 shares(1) In 2013, the mutual funds managed outside of Spain are included for the first time; excluding this effect, the growth rate would be 5.7%.
Non-life combined ratio
ROE 10.1% 1.1 p.p.
Solvency margin 2.46x
Shareholders' equity per share 2.54 =
Attributable result 790.5 18.7%
Earnings per share (Euros) 0.26 18.7%

Improvement in the underwriting and financial result in Life Assurance in a context of lower business volumes
Significant decrease in non-recurring items
1 Key highlights
Highlights of the results
Growth in Non-Life insurance, with an excellent combined ratio, reflecting a significant cost-cutting effort in Spain
4
Significant decrease in non-recurring items
The diversification of the balance sheet has mitigated the impact of the significant appreciation of the Euro, especially against the Latin American currencies and the Turkish Lira
� Additional reduction in financial debt, resulting in an equity/debt ratio of nearly 6x
� A clear financial horizon: fully undrawn €750 million revolving credit facility, maturing in June 2018

1
Evolution of the key reference currencies for MAPFRE
1/1/2012 = Base 100
Key highlights
At constant exchange rates, premiums would have grown 8.1% and results 26.3%
At constant exchange rates, premiums would have grown 8.1% and results 26.3%
The impact of currencies on results has been very significant
5
ene-12 mar-12 jun-12 sep-12 dic-12 mar-13 jun-13 sep-13 dic-13
1/1/2012 = Base 100
USD -5.9%
TRY -17.0%
BRL -25.4%
Jan-12 Mar-12 Jun-12 Sep-12 Dec-12 Mar-13 Jun-13 Sep13 Dec-13
VEF -35.8%

1 Key highlights
2012 2013 ���� %
REPORTED ATTRIBUTABLE RESULT 665.7 790.5 18.7%
Investment portfolio: net realised capital gains -92.3
Impairment of financial instruments, property and intangible assets 357.1 112.2
Non-recurring results in Argentina(1) 12.7 11.9
At constant exchange rates, the adjusted result would have remained virtually stable
At constant exchange rates, the adjusted result would have remained virtually stable
6
Million Euros
1) Includes the impact of the sale of MAPFRE ART and MAPFRE SALUD in 2012, as well as of the regulatory change introduced in 2013
Gain from non-recurring exchange rate differences -7.9
Capital gain from the creation of SOLUNION -18.0
Provisions for risks and expenses and other non-recurring items 54.6 37.9
Release of provision for financial instability -55.8
Agreement with the Brazilian Government -46.5
ADJUSTED ATTRIBUTABLE RESULT 942.0 880.1 -6.6%
ADJUSTED ATTRIBUTABLE RESULT - constant exchange rates 942.0 930.6 -1.2%

1
Interim dividend Final dividend
� In October, the Board of Directors resolved to pay an interim dividend of 5 cents per share against the 2013 results...
� The Board of Directors has agreed to propose to the AGM a final dividend against the 2013 results of 8 cents gross per share; thus the
Key highlights
An 18% increase in dividends is proposed
7
In 2013, the dividends paid in cash amounted to €370 million
In 2013, the dividends paid in cash amounted to €370 million
� ... thus the total dividend paid in the year amounts to 12 cents per share.
of 8 cents gross per share; thus the total dividend proposed against the 2013 results amounts to 13 cents per share

1
The Spanish economy shows signs of recovery...
GDP – quarterly growth (%) Employment – quarterly growth (%)
Key highlights
-0.3
-0.1
0.1
0.2
0.0
0.2 0.2
-0.1
-0.3
-0.4 -0.4
-0.5
-0.4 -0.4
-0.1
0.1
0.3
-3.2
-1.5
-0.9-0.7 -0.6
-0.4
-0.1
-0.2
-0.6
-0.1
-1.3 -1.3 -1.2-1.1 -1.1
-1.4
-1.0
-0.2
-0.3
0.3
8
New car registrations – growth (%)
-1.0-1.6
-27.4
-18.1
2.3
-18.6
-13.4
3.3
2006 2007 2008 2009 2010 2011 2012 2013
-1.7
-1.1
-0.5
-0.8
1Q09 3Q09 1Q10 3Q10 1Q11 3Q11 1Q12 3Q12 1Q13 3Q13
1Q09 3Q09 1Q10 3Q10 1Q11 3Q11 1Q12 3Q12 1Q13 3Q13
In January 2014 car registrations where up 5% y-o-y

4%
6%
8%
10%
12%
1
...paving the way for the recovery of the insurance market
Non-Life Insurance - evolution Non-Life Insurance – elasticity
The impact of the economic crisis was especially severe on Motor insurance: -20% since 2007
Key highlights
1.47x 1.24x 0.89x 0.81x 0.82x 0.72x 0.69x
-1.50x
-4.31x
1.15x1.82x
2003 2004 2005 2006 2007 2008 2009 2010 2011 2012 2013
Elasticity Non-Life Insurance vs. GDP
9
0.91x 0.78x 0.46x 0.57x 0.40x-0.56x
1.48x
7.48x3.55x 3.57x
2003 2004 2005 2006 2007 2008 2009 2010 2011 2012 2013
Elasticity Motor Insurance vs. GDP-6%
-4%
-2%
0%
2%
2003 2004 2005 2006 2007 2008 2009 2010 2011 2012 2013
GDP at market prices TOTAL Non-Life Insurance Motor Insurance
The positive correlation between the development of GDP and of Non-Life insurance gives way to cautious optimismThe positive correlation between the development of GDP and of Non-Life insurance gives way to cautious optimism
-34x
1
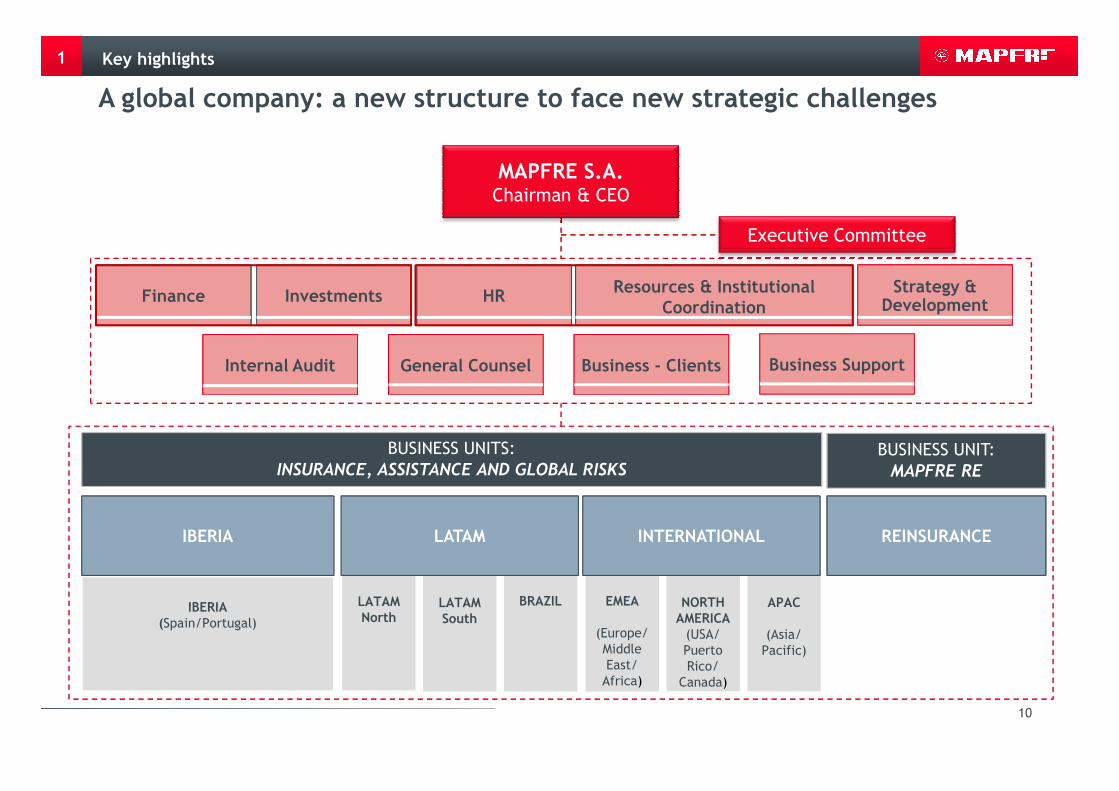
A global company: a new structure to face new strategic challenges
HR Resources & Institutional Coordination
InvestmentsFinance Strategy & Development
Internal Audit General Counsel Business - Clients Business Support
MAPFRE S.A.Chairman & CEO
Executive Committee
Key highlights
10
IBERIA(Spain/Portugal)
BUSINESS UNIT: MAPFRE RE
REINSURANCE
BRAZILLATAM South
LATAMNorth
LATAMIBERIA
APAC
(Asia/Pacific)
BUSINESS UNITS:INSURANCE, ASSISTANCE AND GLOBAL RISKS
NORTHAMERICA(USA/Puerto Rico/
Canada)
EMEA
(Europe/Middle East/ Africa)
INTERNATIONAL

1 Key highlights
Information by regional areas - 2013 figures
Regional areaConsolidated premiums
Atributable result
IBERIA 7,261.3 370.9
BRAZIL 5,195.1 152.0
LATAM SOUTH 2,989.0 122.8
NORTH AMERICA 2,014.0 107.0
A global company: a new structure to face new strategic challenges (II)
11
NORTH AMERICA 2,014.0 107.0
EMEA 1,234.1 34.0
LATAM NORTH 1,084.6 41.9
APAC 86.3 -0.9
TOTAL REGIONAL AREAS 19,864.4 827.7
MAPFRE RE 3,253.7 108.8
HOLDINGS AND ELIMINATIONS -1,282.6 -146.0
CONSOLIDATED 21,835.5 790.50

1
Seeks maximum efficiency in the management of all the resources
Increases the simplicity and transparency of the corporate structure
Enhances customer focus, based on close business relationships and a
Key highlights
A global company: a new structure to face new strategic challenges (III)
12
Enhances customer focus, based on close business relationships and a common view of the client
Facilitates decision-making and bidirectional communication
Supports the implementation and development of the corporate strategy

1
2 new corporate areas strengthen the customer focus and the quest for efficiency at a global level
Business-ClientsBusiness-Clients� Promotes the development of a common strategy for each type of client (segmentation)
� Reinforces the implementation of best practices and ideas
Key highlights
A global company: a new structure to face new strategic challenges (IV)
13
� Reinforces the implementation of best practices and ideas
Business supportBusiness support� Comprises IT, processes and operations (standardisation)� Standardises and improves the operational model at global level� Re-designs operations seeking to optimise the available resources

1
MAPFRE and BANKIA enter into a comprehensive bancassurance agreement...
MAPFRE becomes BANKIA’s exclusive bancassurance provider
MAPFRE becomes BANKIA’s exclusive bancassurance provider
The agreement covers all the insurance lines and includes a business plan, with access to a network of 1,900 branches
Key highlights
14
MAPFRE acquires BANKIA’s 51% stake in Aseval and Laietana Vida as well as 100% of Laietana Seguros Generales, for a consideration of €151.7 million
The final economic value of the agreement is linked to sales targets
MAPFRE will fully finance the operation with available cash

1
...thus clearing up the main uncertainties that weighed on the stock
Key highlights
Spanish
Shareholders’ structure
Bancassurance
15
Financing
Spanish economy
Bancassurance

1 Key highlights
2 Consolidated financial information
3 Business development
16
3 Business development
4 Appendix
5 Financial supplement
6 Schedule and contacts

Non-Life AbroadLife Abroad
2,621.3 (11.1%)
Life Spain2,508.4 (10.7%)
Consolidated financial information
The international business continues to drive the Group’s growth
2
SpainSpain 28% 28% SpainSpain 28% 28% Abroad 72%Abroad 72%
Premiums(1) Contribution to consolidated results
Spain 36Spain 36% % Spain 36Spain 36% % Abroad 64%Abroad 64%
EUR M %
Non-Life Abroad 377.5 42.2%
Non-Life Spain 229.8 25.7%
Life Spain 94.3 10.5%
17
Non-Life Spain4,199.3 (17.8%)
Non-Life Abroad10,971.3 (46.6%)
2,621.3 (11.1%)
Reinsurance3,253.7 (13.8%)
1) Aggregate premiums
€23,554.0million
Life Spain 94.3 10.5%
Life Abroad 94.3 10.5%
Reinsurance 99.6 11.1%
Result from insurance operations
895.5 100.0%
Other/Consolidation adjustments
-105.0
Attributable result 790.5
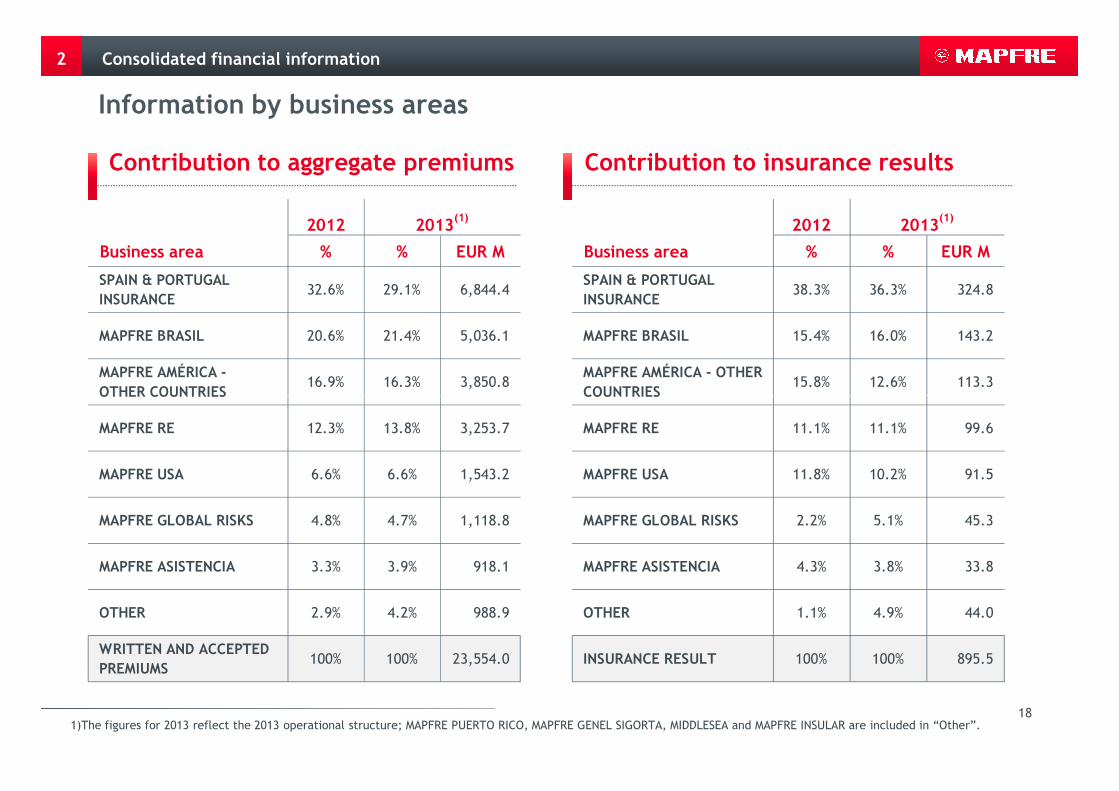
Information by business areas
2
Contribution to aggregate premiums Contribution to insurance results
Consolidated financial information
2012
Business area % % EUR M
SPAIN & PORTUGAL INSURANCE
32.6% 29.1% 6,844.4
MAPFRE BRASIL 20.6% 21.4% 5,036.1
MAPFRE AMÉRICA - OTHER COUNTRIES
16.9% 16.3% 3,850.8
2013(1) 2012
Business area % % EUR M
SPAIN & PORTUGAL INSURANCE
38.3% 36.3% 324.8
MAPFRE BRASIL 15.4% 16.0% 143.2
MAPFRE AMÉRICA - OTHER COUNTRIES
15.8% 12.6% 113.3
2013(1)
181)The figures for 2013 reflect the 2013 operational structure; MAPFRE PUERTO RICO, MAPFRE GENEL SIGORTA, MIDDLESEA and MAPFRE INSULAR are included in “Other”.
OTHER COUNTRIES
MAPFRE RE 12.3% 13.8% 3,253.7
MAPFRE USA 6.6% 6.6% 1,543.2
MAPFRE GLOBAL RISKS 4.8% 4.7% 1,118.8
MAPFRE ASISTENCIA 3.3% 3.9% 918.1
OTHER 2.9% 4.2% 988.9
WRITTEN AND ACCEPTED PREMIUMS
100% 100% 23,554.0
COUNTRIES
MAPFRE RE 11.1% 11.1% 99.6
MAPFRE USA 11.8% 10.2% 91.5
MAPFRE GLOBAL RISKS 2.2% 5.1% 45.3
MAPFRE ASISTENCIA 4.3% 3.8% 33.8
OTHER 1.1% 4.9% 44.0
INSURANCE RESULT 100% 100% 895.5

Development of Non-Life insurance results
2 Consolidated financial information
Non-Life business – Main business areas
Business area 2012 2013(2) ���� % 2012 2013(2) ���� % 2012 2013(2)
SPAIN & PORTUGAL INSURANCE 4,427.1 4,283.3 -3.2% 388.7 249.8 -35.7% 91.2% 93.7%
MAPFRE BRASIL 2,937.6 3,336.3 13.6% 105.9 99.4 -6.1% 95.4% 96.1%
Premiums Underwriting result Combined ratio(1)
19
Million Euros
1) Ratios as a % of net premiums earned2) The figures for 2013 reflect the 2013 operational structure; MAPFRE AMÉRICA does not include MAPFRE PUERTO RICO.
MAPFRE AMÉRICA - OTHER COUNTRIES 3,278.3 3,096.2 -5.6% -3.0 0.1 --- 100.1% 100.0%
MAPFRE RE 2,383.1 2,828.0 18.7% 43.9 63.7 45.1% 97.0% 96.5%
MAPFRE USA 1,513.9 1,543.2 1.9% -27.0 -6.7 -75.2% 101.9% 100.5%
MAPFRE GLOBAL RISKS 1,115.2 1,118.8 0.3% 20.3 43.4 113.8% 93.0% 85.3%
MAPFRE ASISTENCIA 763.5 918.1 20.2% 44.9 57.5 28.1% 93.1% 92.6%

Development of Non-Life insurance results
2
Non-Life Account Key points
Consolidated financial information
� The good development of premiums reflects the growth of the international business as well as of reinsurance, which offset the impact of the appreciation of the Euro and the decline in demand in Spain, which was pared back in the last quarter
� Improvement in the loss experience in the international business and in reinsurance
� Increase in the expense ratio due to the reclassification of the Burial line to the Non-Life
2012 2013 ���� %
Written and accepted
premiums15,478.5 16,277.7 5.2%
Like-for-like(1) 15,678.2 16,277.7 3.8%
Underwriting result 590.0 509.4 -13.7%
Net financial and other non-
technical income 657.1 684.3 4.1%
201) The figures for 2012 include the impact of the reclassification of business lines in Brazil, carried out in the third quarter of 20132) Ratios as a % of net premiums earned
Million Euros
reclassification of the Burial line to the Non-Life segment in Brazil and a greater weight of proportional business at MAPFRE RE
� Realisations gains and asset impairments of €92 million (losses of €99.8 million in 2012)
� Positive non-recurring exchange rate differences of €12 million
� Decrease in interest rates in Europe and the USA
� Negative mark-to-market adjustments to the trading portfolio in Brazil of €54.1 million
� Positive impact of the agreement reached with the Brazilian Government amounting to €34.6 million
technical income 657.1 684.3 4.1%
Result of Non-life business 1,247.1 1,193.7 -4.3%
Loss ratio(2) 67.4% 67.0%
Expense ratio(2) 28.0% 29.1%
Combined ratio(2) 95.4% 96.1%
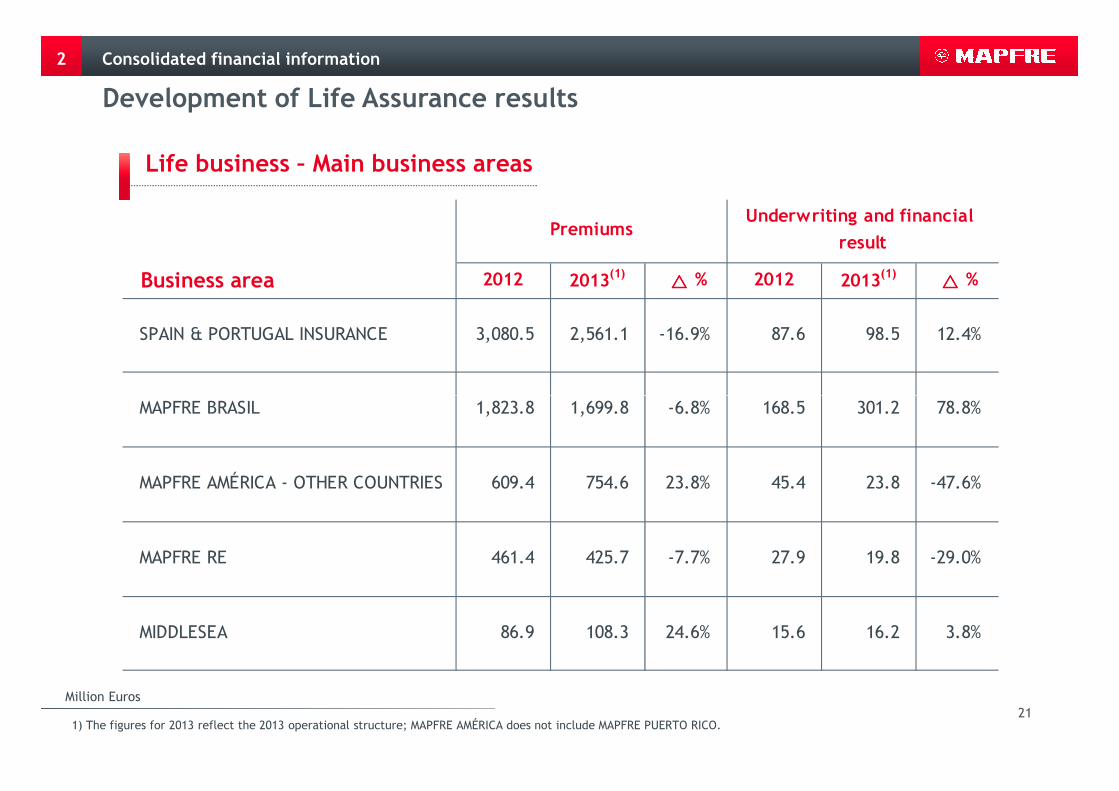
Development of Life Assurance results
2 Consolidated financial information
Life business – Main business areas
Business area 2012 2013(1) ���� % 2012 2013(1) ���� %
SPAIN & PORTUGAL INSURANCE 3,080.5 2,561.1 -16.9% 87.6 98.5 12.4%
PremiumsUnderwriting and financial
result
21Million Euros
1) The figures for 2013 reflect the 2013 operational structure; MAPFRE AMÉRICA does not include MAPFRE PUERTO RICO.
MAPFRE BRASIL 1,823.8 1,699.8 -6.8% 168.5 301.2 78.8%
MAPFRE AMÉRICA - OTHER COUNTRIES 609.4 754.6 23.8% 45.4 23.8 -47.6%
MAPFRE RE 461.4 425.7 -7.7% 27.9 19.8 -29.0%
MIDDLESEA 86.9 108.3 24.6% 15.6 16.2 3.8%
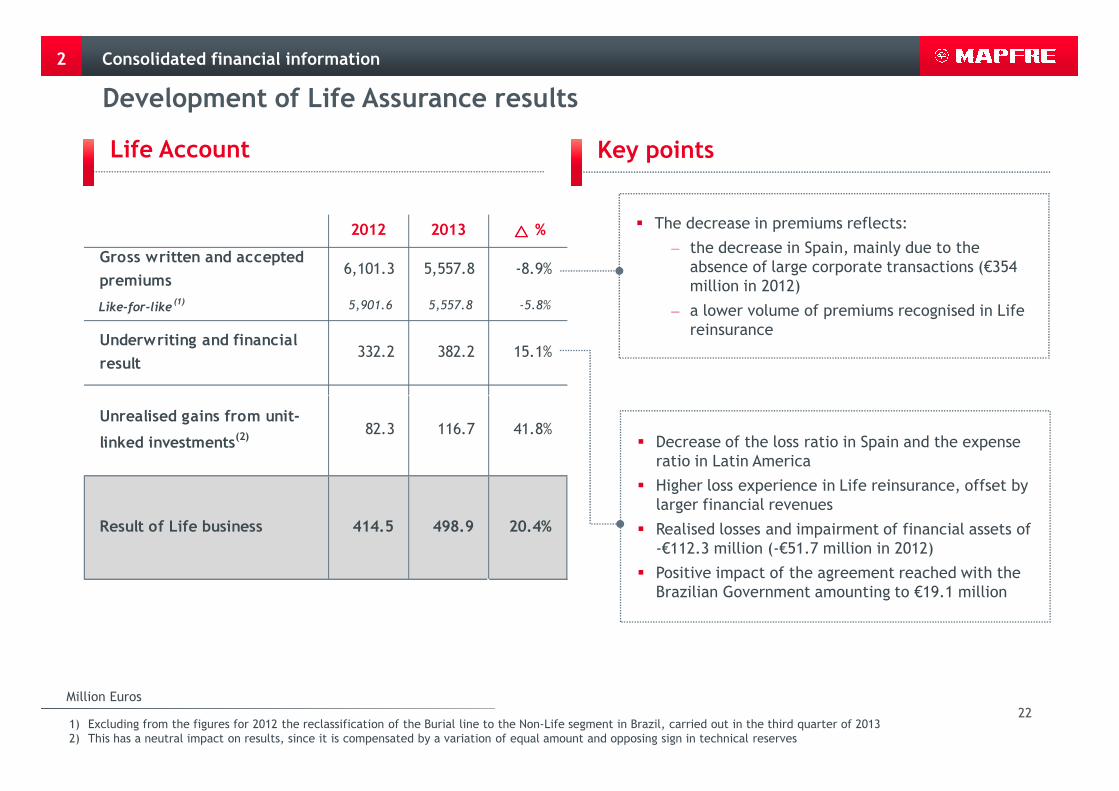
Development of Life Assurance results
2
Life Account Key points
Consolidated financial information
� The decrease in premiums reflects:
– the decrease in Spain, mainly due to the absence of large corporate transactions (€354 million in 2012)
– a lower volume of premiums recognised in Life reinsurance
2012 2013 ���� %
Gross written and accepted
premiums6,101.3 5,557.8 -8.9%
Like-for-like(1) 5,901.6 5,557.8 -5.8%
Underwriting and financial
result332.2 382.2 15.1%
221) Excluding from the figures for 2012 the reclassification of the Burial line to the Non-Life segment in Brazil, carried out in the third quarter of 20132) This has a neutral impact on results, since it is compensated by a variation of equal amount and opposing sign in technical reserves
Million Euros
� Decrease of the loss ratio in Spain and the expense ratio in Latin America
� Higher loss experience in Life reinsurance, offset by larger financial revenues
� Realised losses and impairment of financial assets of -€112.3 million (-€51.7 million in 2012)
� Positive impact of the agreement reached with the Brazilian Government amounting to €19.1 million
Unrealised gains from unit-
linked investments(2)82.3 116.7 41.8%
Result of Life business 414.5 498.9 20.4%

Development of results from Other Business Activities
2
Key pointsOther Business Activities(1)
Consolidated financial information
� Larger interest payments
� Realised capital losses of €2 million (in the previous
� Reflects:
— the growth of the services business at MAPFRE ASISTENCIA
— the consolidation of FUNESPAÑA
2012 2013 ���� %
Operating revenues 454.2 536.7 18.2%
Operating expenses -436.4 -543.1 24.5%
Net financial income & other -297.5 -79.0 -73.4%
231) “Other Business Activities” includes the Group’s non-insurance activities undertaken by the insurance subsidiaries as well as by other subsidiaries.
It also includes the activities of the holding company MAPFRE S.A.
Million Euros
� Realised capital losses of €2 million (in the previous year, impairment of the shareholding in CATTOLICA for €19.1 million and losses of €34.2 million)
� Lower appropriation of reserves for the impairment of property assets: €21.8 million (€200.8 million in 2012)
Net financial income & other -297.5 -79.0 -73.4%
Results from Other
Business Activities-279.7 -85.4 -69.5%

Consolidated result
2 Consolidated financial information
2012 2013 ���� %
Result on restatement of financial accounts -9.9 -43.3 ---
Result before tax and minority interests 1,372.0 1,563.9 14.0%
Taxes -396.5 -372.4 -6.1%
Result after tax 975.5 1,191.5 22.1%
Result after tax from discontinued operations -12.7 -1.7 -86.6%
Result for the year 962.8 1,189.8 23.6%
24Million Euros
Result attributable to minority interests -297.1 -399.3 34.4%
Result attributable to the controlling Company 665.7 790.5 18.7%

31.12.12 31.12.13
Goodwill 2,146.2 1,928.4
Other intangible assets 2,264.2 1,969.5
Other fixed assets 306.7 326.2
Cash & equivalents 1,018.0 1,162.8
Investments & real estate 38,745.7 39,212.0
Participation of reinsurance in technical
reserves3,275.8 3,046.5
Insurance & reinsurance operations 4,398.3 4,362.1
Deferred taxes 1,236.3 1,305.1
Other assets 3,592.0 3,513.2
TOTAL ASSETS 56,983.2 56,825.8
Balance sheet – key highlights
2 Consolidated financial information
� Reflects mainly the appreciation of the Euro and the impairment of intangible assets in Spain
Recovery in the financial markets
Business growth
Appreciation of the Euro
(+)(+)(-)
25
TOTAL ASSETS 56,983.2 56,825.8
Shareholders' Equity 7,810.5 7,833.5
Minority interests 2,325.8 2,060.2
Financial & subordinated debt 1,908.1 1,725.2
Technical reserves 37,976.0 38,742.6
- Life assurance reserves(1) 21,950.9 23,243.4
- Other technical reserves 16,025.1 15,499.2
Reserves for risks and expenses 1,054.0 646.8
Insurance & reinsurance operations 1,654.9 1,900.0
Deferred taxes 1,773.1 1,740.8
Other liabilities 2,480.8 2,176.7
TOTAL LIABILITIES 56,983.2 56,825.8
1) Includes unit-linked reserves
Million Euros
� Amortisation of the senior bonds issued by MAPFRE USA
� Undrawn €750 million revolving credit facility
� Reflects the positive impact of the decrease in liabilities resulting from the agreement with the Brazilian Government, as well as lower earn-outs in Spain

A prudent investment policy adapted to the insurance business
2
Breakdown by type of asset Breakdown by region(2)
Spain21,533.1 (55.8%)Other Europe
7,270.4 (18.9%)
Other Latin America 2,598.5 (6.7%)
USA2,917.1 (7.6%)
Other811.0 (2.1%)
Consolidated financial information
Government fixed income(1)
19,465.8 (48.2%)
Property
Cash1,162.8 (2.9%)
Mutual funds 848.1 (2.1%)
Equities1,317.3 (3.3%)
Other3,515.7 (8.7%)
Brazil3,451.1 (8.9%)
26
Breakdown by valuation method
1) Includes multilateral bodies2) Breakdown of assets amounting to €38,581.2 million, 95.6% of the total investment portfolio3) Primarily real estate, cash and investments backing unit-linked reserves
Fair value through equity 28,808.1 (71.3%)
Fair value through P&L 2,906.5 (7.2%)
Held to maturity 2,118.5 (5.3%)
Other(3)
6,541.7 (16.2%)
€40,374.8 million
Million Euros
Corporate fixed income
11,734.2 (29.0%)
Property2,330.9 (5.8%)

Fixed income portfolio: 77.2% of investments
2
Breakdown by issuer Sovereign
Consolidated financial information
Government & Multilateral
bodies19,465.8 (62.4%)
Spain 11,367.9 58.4%
Brazil 2,192.1 11.3%
Italy 1,371.6 7.0%
Colombia 514.0 2.6%
Malta 363.2 1.9%
Portugal 292.2 1.5%
Venezuela 278.0 1.4%
USA 242.4 1.2%
27
Financial institutions
Spain4,681.8 (54.1%)
Other countries 2,484.9 (28.7%)
Book value as at 31.12.2013: €31,200.0 millionBook value as at 31.12.2013: €31,200.0 millionMillion Euros
Germany519.0 (6.0%)
USA 642.0 (7.4%)
France323.8 (3.8%)
Other3,082.7 (9.9%)
Financial institutions
8,651.5 (27.7%)

Fixed income portfolio: 77.2% of investments
2
Breakdown by currencyBreakdown by type of guarantee
Consolidated financial information
ABS648.0 (2.1%)
Ordinary23,267.8 (74.6%)
Other currencies 2,049.7 (6.6%)
Real 2,795.7 (9.0%)
US Dollar2,815.9 (9.0%)
Euro 23,538.7 (75.4%)
Other guarantees 3,224.2 (10.3%)
Hybrid1,058.7 (3.4%)
Covered bonds3,001.3 (9.6%)
28
Breakdown by rating (S&P)
Book value as at 31.12.2013: €31,200.0 millionBook value as at 31.12.2013: €31,200.0 millionMillion Euros
BBB 18,090.7 (58.0%)
AA3,014.7 (9.7%)
AAA 4,939.3 (15.8%)
BB or lower 798.9 (2.5%)
Unrated 373.1 (1.2%)
A3,983.3 (12.8%)

Variation in equity
2
Statement of changes in equity Key points
Consolidated financial information
� Recovery in the market value of investments
� Reflects mainly the impact of the appreciation of the Euro
Shareholders' Minority TOTAL TOTAL
Equity interests 2013 2012
BALANCE AS AT PRIOR YEAR END 7,810.5 2,325.8 10,136.3 9,726.6
Additions and deductions accounted for
directly in equity
Investments available for sale 708.9 163.2 872.1 984.1
Translation adjustments -581.1 -256.4 -837.5 -389.4
29Million Euros
� Dividend approved by the Annual General Meeting
� Dividends paid by subsidiaries with minority interests
Shadow accounting -546.2 -143.8 -690.0 -472.0
Other 2.4 -0.1 2.3 -3.8
TOTAL -416.0 -237.1 -653.1 118.9
Result for the period 790.5 399.3 1,189.8 962.8
Distribution of previous year's result -215.6 -365.5 -581.1 -411.2
Interim dividend for the year -154.0 -63.0 -217.0 -187.3
Other items 18.1 0.7 18.8 -73.5
BALANCE AS AT PERIOD END 7,833.5 2,060.2 9,893.7 10,136.3

12.4 18.0 22.133.0 27.8
22.0
2008 2009 2010 2011 2012 2013
EBITDA / interest coverage excluding operating debt (x)
EBITDA / interest coverage including operating debt (x)
Financing structure
2
2013 Capital structure Interest coverage(1)
Consolidated financial information
Equity(85.2%)
Hybrid debt(5.1%)
Ordinary debt (8.6%)
Bank financing (1.1%) 15.4
22.1
30.136.5
31.1
22.7
30
EBITDA / interest coverage including operating debt (x)
26.5%
17.2% 16.9% 14.5% 14.1% 13.3%
2008 2009 2010 2011 2012 2013
Leverage including operating debt
Leverage excluding operating debt
Leverage(1)
1) The data used to calculate these ratios can be found in the Appendix
€11,618.9million
Million Euros
(5.1%)
15.6%19.8%20.5%
31.4%
15.1% 14.2%

1 Key highlights
2 Consolidated financial information
3 Business development
31
3 Business development
4 Appendix
5 Financial supplement
6 Schedule and contacts

Business development
Spain & Portugal Insurance Division
3
Key highlights
2012 2013(1) ���� %
Written and accepted
premiums7,507.6 6,844.4 -8.8%
Underwriting and financial
result424.8 433.6 2.1%
Other non-technical result 50.7 52.0 2.6%
NON-LIFE BUSINESS 2012 2013(1) ���� %
Written and accepted premiums 4,427.1 4,283.3 -3.2%
Underwriting result 388.7 249.8 -35.7%
Underwriting and financial result 337.2 335.1 -0.6%
Other non-technical result -21.8 -1.9 -91.3%
Result of Non-Life business 315.4 333.2 5.6%
Non-Life loss ratio(3) 70.0% 72.9%
Non-Life expense ratio(3) 21.2% 20.8%
32Million Euros
1) The figures for 2013 include MAPFRE PORTUGAL2) Before taxes and minority interests3) Ratios as a % of net premiums earned4) Includes Life and Accident premiums written by all the subsidiaries in the SPAIN & PORTUGAL INSURANCE Division5) Net operating expenses / Average third party funds under management.
Other non-technical result 50.7 52.0 2.6%
Other business activities 60.2 66.9 11.1%
Gross result(2) 535.7 552.5 3.1%
Net result 275.9 324.8 17.7%
Non-Life expense ratio(3) 21.2% 20.8%
Non-Life combined ratio(3) 91.2% 93.7%
LIFE AND ACCIDENT BUSINESS(4) 2012 2013(1) ���� %
Written and accepted premiums 3,080.5 2,561.1 -16.9%
Underwriting and financial result 87.6 98.5 12.4%
Other non-technical result 72.5 53.9 -25.7%
Result of Life business 160.1 152.4 -4.8%
Expense ratio(5) 1.1% 1.1%

3
� In the Non-Life business, the variation in premiums reflects the deterioration of the market conditions, characterised
by a decline in the demand for insurance products and a competitive environment, in which aggressive pricing
strategies continue to be applied
� In Life Assurance and in fund management, the positive trend in the contributions to mutual funds and the good
performance of the agents’ channel in Life-Protection insurance, which increases its market share, must be noted
Variation in revenues
The underwriting result reflects mainly:
Business development
Highlights of the results in Spain
33
� a lower volume of net premiums earned, reflecting both the decline in gross written and accepted premiums, as well
as the formalisation of a reinsurance contract between MAPFRE FAMILIAR and MAPFRE RE
� provisions for risks and expenses amounting to €35 million (€57 million in 2012)
� the occurrence of severe weather-related events, which affected the Home and Condominium lines
� a combined ratio that remains at excellent levels, despite the increase in the loss ratio, thanks to initiatives targeted
at reducing fixed costs, which fell by €48 million
Technicalresult
The underwriting result reflects mainly:

Highlights of the results in Spain (contd.)
3
Financial result
The development of the financial result reflects:
� the decrease in the volume of financial assets as a result of a lower volume of Non-Life technical reserves
� the decrease in interest rates
� net realisation gains and impairments of financial and property assets amounting to €5.8 million (-€216.3 million in
2012)
� impairment of intangible assets of €194.9 million (€137 million in 2012)
Non-
Business development
34
Non-technical result
The non-technical result includes the positive impact of the decrease in earn outs amounting to €72.3 million (€92
million in 2012)
Shareholders’ Equity
The change in shareholders’ equity includes the variation in unrealised financial gains, which in 2013 grew €285 million

3
Combined ratios(1) in SpainNon-Life Premiums in Spain
Business development
Spain & Portugal Insurance Division
MOTOR
COMMERCIAL
HOME
2012 2013
Combined ratio 94.1% 95.5%
Loss ratio 76.9% 77.9%
Expense ratio 17.2% 17.6%
Combined ratio 82.6% 88.6%
Loss ratio 58.5% 64.8%
Expense ratio 24.1% 23.8%
Combined ratio 89.3% 92.1%
MOTOR
COMMERCIAL
2,056.4
642.8
637.0
-7.6%
-10.1%
-0.2%
35Million Euros
1) Ratios as a % of net premiums earned
HEALTH
BURIAL
HOME
OTHER LINES
Loss ratio 62.6% 66.6%
Expense ratio 26.7% 25.5%
Combined ratio 99.8% 99.2%
Loss ratio 81.6% 82.8%
Expense ratio 18.2% 16.4%
Combined ratio 86.2% 90.3%
Loss ratio 54.9% 61.8%
Expense ratio 31.3% 28.5%
Combined ratio 79.6% 83.2%
Loss ratio 48.8% 57.3%
Expense ratio 30.8% 25.9%
HOME
HEALTH
BURIAL
OTHER LINES
637.0
399.8
279.7
183.6
-0.2%
-0.5%
3.4%
2.0%
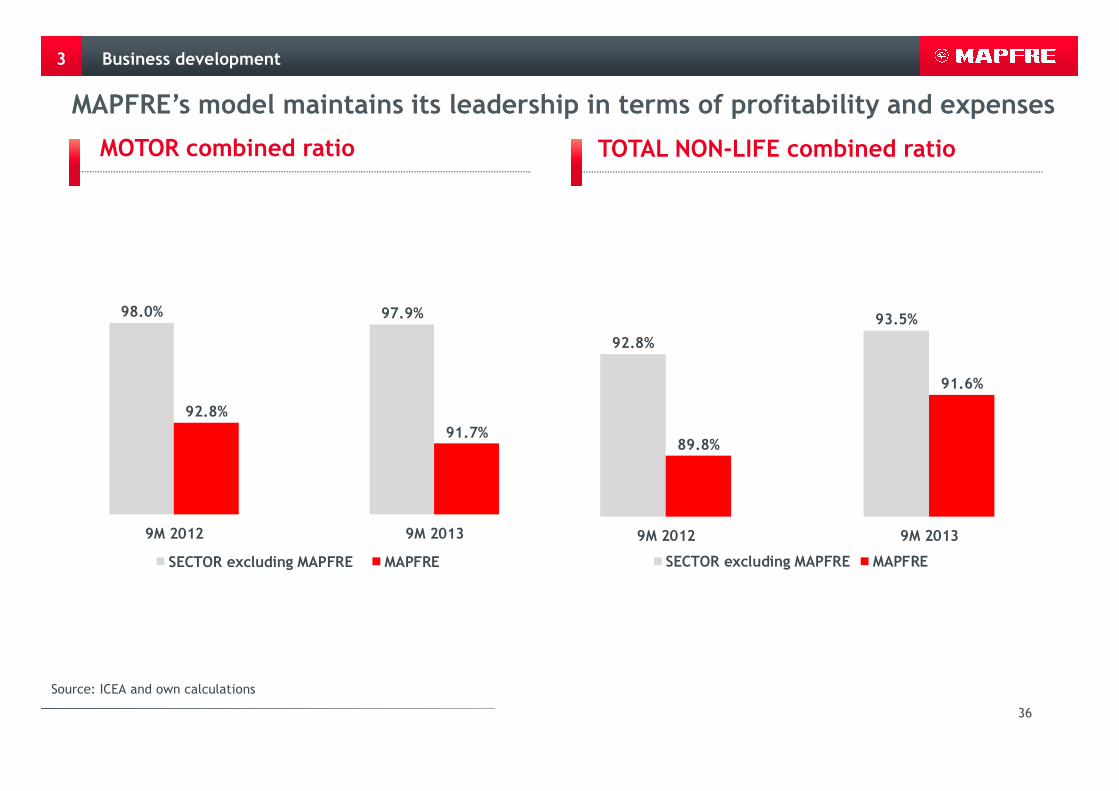
MAPFRE’s model maintains its leadership in terms of profitability and expenses
3
TOTAL NON-LIFE combined ratioMOTOR combined ratio
Business development
98.0% 97.9%
92.8%
93.5%
91.6%
36
Source: ICEA and own calculations
92.8%91.7%
9M 2012 9M 2013
SECTOR excluding MAPFRE MAPFRE
89.8%
9M 2012 9M 2013
SECTOR excluding MAPFRE MAPFRE

Spain & Portugal Insurance Division
3 Business development
Life business in Spain: activity indicators
1) Cumulative variation versus prior year end. Excludes the variation in
GROSS WRITTEN AND ACCEPTED PREMIUMS 2012 2013 ���� %
Regular premiums 464.5 430.3 -7.4%
Single premiums 2,124.2 1,618.5 -23.8%
Life premiums - Savings 2,588.7 2,048.8 -20.9%
Life premiums - Protection 394.7 376.9 -4.5%
Accident premiums(1) 94.1 82.7 -12.1%
TOTAL PREMIUMS 3,077.5 2,508.4 -18.5%
- Agents' and other channels 1,639.4 1,361.2 -17.0%
CHANGE IN FUNDS UNDER MANAGEMENT(1) 2012 2013
IFRS technical reserves(2) 823.5 869.1
Variation w/o the effect of "shadow accounting" 116.6 -42.3
Pension funds 24.6 266.4
- Net sales -237.9 -147.7
Mutual funds and managed portfolios -105.2 484.0
- Net sales -102.7 105.2
TOTAL CHANGE 742.9 1,619.5
37Million Euros
1) Cumulative variation versus prior year end. Excludes the variation in shareholders’ equity over the same period.
2) Includes the effect of “shadow accounting” which adjusts technical reserves for variations in the market value of matching assets
� the significant improvement in the winning of Savings
business through mutual funds
� a lower lapsation in technical reserves (adjusted by large
corporate operations in 2012 amounting to €354 million)
as well as in pension funds
� the increase in the market value of investments
The development of the funds under management reflects:
1) The figures for both periods include the Accidents premiums written by all the distribution channels in Spain
- Agents' and other channels 1,639.4 1,361.2 -17.0%
- Bank channel 1,438.1 1,147.2 -20.2%
MANAGED SAVINGS 2012 2013 ���� %
Regular premiums 4,672.7 4,757.7 1.8%
Single premiums 13,205.9 13,965.8 5.8%
Life Assurance - Protection 155.6 150.2 -3.5%
Total Mathematical Reserves 18,034.2 18,873.7 4.7%
Other reserves 600.2 629.8 4.9%
TECHNICAL RESERVES 18,634.4 19,503.5 4.7%
Mutual funds and managed portfolios 2,543.2 3,027.2 19.0%
Pension funds 5,105.9 5,372.3 5.2%
TOTAL MANAGED SAVINGS 26,283.5 27,903.0 6.2%

International Insurance Division
3 Business development
Key highlights
MAPFRE AMÉRICA2012 2013* ���� %
Written and accepted
premiums10,833.9 11,419.0 5.4%
Underwriting and financial
result813.2 918.2 12.9%
Other non-technical result -17.5 13.5 ---
2012 2013* ���� %
Gross written and accepted premiums 8,649.1 8,886.9 2.7%
Underwriting and financial result 668.8 730.6 9.2%
Other business activities 15.3 9.6 -37.3%
Other non-technical results -20.6 6.5 ---
Gross result(1) 653.6 703.4 7.6%
Net result 225.9 258.5 14.4%
38Million Euros
1) Before taxes and minority interests2) Ratios as a % of net premiums earned
MAPFRE INTERNACIONAL
* The figures for 2013 reflect the 2013 operational structure. In the case of MAPFRE AMÉRICA, they exclude MAPFRE PUERTO RICO. As regards MAPFRE INTERNACIONAL, they include MAPFRE PUERTO RICO but exclude MAPFRE PORTUGAL.
Other non-technical result -17.5 13.5 ---
Other business activities -8.5 6.3 ---
Gross result(1) 777.3 894.7 15.1%
Net result 319.6 394.0 23.3%
Non-Life combined ratio(2) 98.8% 98.9%
Non-life combined ratio(2) 97.7% 97.8%
2012 2013* ���� %
Gross written and accepted premiums 2,184.8 2,532.1 15.9%
Underwriting and financial result 144.4 187.6 29.9%
Result from other business activities -23.8 -3.3 ---
Other non-technical results 3.1 7.0 125.8%
Gross result(1) 123.7 191.3 54.6%
Net result 93.7 135.5 44.6%
Non-life combined ratio(2) 101.5% 101.5%

International Insurance Division: MAPFRE AMÉRICA
3
Premiums and results by countries
Business development
COUNTRY 2012 2013* ���� %
Local
Currency
� � � � % 2012 2013* ���� %
Local
Currency
� � � � %
BRAZIL 4,761.4 5,036.1 5.8% 20.4% 485.5 548.5 13.0% 28.6%
VENEZUELA 818.7 963.3 17.7% 73.7% 45.4 64.7 42.5% 110.5%
MEXICO 697.3 695.0 -0.3% -0.4% 33.3 36.4 9.3% 9.2%
COLOMBIA 588.9 713.9 21.2% 30.2% 25.0 40.4 61.6% 73.6%
RESULTS (1)PREMIUMS
39Million Euros
* The figures for 2013 reflect the 2013 operational structure. Excluding MAPFRE PUERTO RICO. 1) Before taxes and minority interests2) Includes Ecuador, Paraguay, Dominican Republic and Uruguay
ARGENTINA 336.4 322.5 -4.1% 18.6% 5.3 -24.5 --- ---
CHILE 329.5 317.2 -3.7% 1.9% 11.5 12.0 4.3% 10.4%
PERU 276.7 311.7 12.6% 20.5% 21.3 26.4 23.9% 32.7%
CENTRAL AMERICA 255.4 263.9 3.3% --- 14.2 15.0 5.6% ---
OTHER COUNTRIES(2) 249.4 263.3 5.6% --- 19.8 21.2 7.1% ---
PUERTO RICO 335.4 --- --- --- 5.8 --- --- ---
Holding and consolidation
adjustments --- --- --- --- -13.5 -36.7 171.1% ---
MAPFRE AMÉRICA 8,649.1 8,886.9 2.7% 653.6 703.4 7.6%
� «Holding and consolidation adjustments» reflects the provisions for intangible asset impairments of €17.9 million in Central America

� Increase in the Unit’s results, due to:
– the agreement reached with the Brazilian Government(1), which generates an attributable result of €46.9
million
– strong decrease in the tax rate to 18.3% (30.3% in 2012), as a result of the aforementioned agreement
� Negative effect of the depreciation(2) of all the currencies in the region, with significant impact of the Brazilian
Real and the Argentine Peso, and the devaluation of the Venezuelan Bolivar. At constant exchange rates,
premiums and results would have grown 23.1% and 27.5%, respectively
� Negative mark-to-market adjustments to the trading portfolio in Brazil of €54.1 million, as a result of higher
interest rates, partly offset by net exchange rate differences in the Unit amounting to +€30.7 million (+€4.4
million in 2012)
� Transfer of the business operations from MAPFRE PUERTO RICO to MAPFRE INTERNACIONAL; sale of the MAPFRE
ART and MAPFRE SALUD businesses (Argentina), which contributed premiums of €234.8 million in 2012
Highlights of the Unit
3 Business development
International Insurance Division: MAPFRE AMÉRICA
40
ART and MAPFRE SALUD businesses (Argentina), which contributed premiums of €234.8 million in 2012
1) Law 12.865/2013 in Brazil 2) When comparing average exchange rates for 2013 and 2012
REFIS Agreement (Brazil) – impact on MAPFRE’s accounts
Item
MAPFRE
BRASIL
MAPFRE
AMERICAMAPFRE S.A.
Technical result -33.2 -33.2 -33.2
Financial result 86.9 86.9 86.9
Gross result 53.7 53.7 53.7
Taxes 58.4 58.4 58.4
Minority interests -65.2 -65.2 -65.6
Net attributable result 46.9 46.9 46.5

3
Highlights by countries
BRAZIL � Pre-tax result of €53.7 million and tax reduction of €58.4 million (€112.1 million overall), as a result of the
agreement reached between the private sector and the Government, concerning the PIS and COFINS taxes
� Strong growth in local currency in all the lines as a result of the sales momentum and the growing
contribution of BANCO DO BRASIL’s network. However, increased competition has been observed in the
Motor line, leading to a slightly higher loss ratio in this segment.
� Reclassification of the Burial line to the Non-Life segment (previously included in Life Assurance), with
premiums of €167.1 million in 2013 (€199.6 million in 2012), which increases the combined ratio by 0.2
p.p., mainly due to a higher expense ratio
� Lower financial income, as a consequence of the negative mark-to-market adjustments to the trading
portfolio
� Amortisation of VOBA and other intangible assets amounting to €56.0 million in 2013, before taxes and
minority interests (€69.3 million in 2012)
Business development
International Insurance Division: MAPFRE AMÉRICA
41
minority interests (€69.3 million in 2012)
1) When comparing the average exchange rates for 2013 and 2012
� Strong growth in all lines, especially in Motor insurance (+92% in local currency)
� The increase in pre-tax results reflects positive exchange rate differences arising from the devaluation
of the Venezuelan Bolivar (€12 million) and realised capital gains of €13.4 million resulting from the
sale of property, which partly offset the result on inflation restatement of -€43.3 million (-€9.9 million
in 2012)
VENEZUELA
� The development of premiums reflects the intense competition for the Retail business and the
cancellation of the local bancassurance agreement with HSBC
� The results include the positive impact of the decrease in the expense ratio, offset by the effects of
severe weather-related events (hurricanes Ingrid and Manuel)
MEXICO

3
Highlights by countries � Growth in Life Assurance
� Increase in results as a consequence of: i) business growth, ii) improvement in the loss experience, and
iii) realised capital gains of €7.1 million resulting from the sale of property
COLOMBIA
� Lower business volume due to the sale of the MAPFRE ART and MAPFRE SALUD businesses and the
depreciation of the Peso
� Higher loss ratio as a result of severe weather-related events (€9.5 million) and regulatory changes that
require a greater appropriation of reserves (€17.2 million)
ARGENTINA
Business development
International Insurance Division: MAPFRE AMÉRICA
42
� CHILE: growth in the Motor and Health insurance lines, with an improved expense ratio
� PERÚ: growth in all lines, with noteworthy mention of Health insurance (+36%); improvement in the
expense ratio
OTHER COUNTRIES

3
Premiums and results by countries
Business development
International Insurance Division: MAPFRE INTERNACIONAL
COUNTRY 2012 2013* ���� %
Local
Currency
� � � � % 2012 2013* ���� %
Local
Currency
� � � � %
USA 1,513.9 1,543.2 1.9% 5.0% 99.5 122.1 22.7% 26.3%
TURKEY 387.1 536.4 38.6% 52.1% 25.4 33.8 33.1% 45.7%
PUERTO RICO --- 278.7 --- --- --- 22.0 --- ---
RESULTS (1)PREMIUMS
43Million Euros
* The figures for 2013 reflect the 2013 operational structure. Including MAPFRE PUERTO RICO and excluding MAPFRE PORTUGAL.1) Before taxes and minority interests
� The evolution of «Holding and consolidation adjustments» reflects capital gains, net of impairments, of €2.1 million. In 2012, it included an impairment of €19.1 million of the shareholding in CATTOLICA.
PORTUGAL 127.8 --- --- --- 9.8 --- --- ---
MALTA 120.7 138.3 14.6% --- 18.2 17.5 -3.6% ---
PHILIPPINES 35.3 35.5 0.6% 4.9% 3.8 0.7 -82.4% -81.6%
Holding and consolidation adjust. --- --- --- --- -33.0 -4.8 --- ---
MAPFRE INTERNACIONAL 2,184.8 2,532.1 15.9% 123.7 191.3 54.6%

� Transfer of the businesses of MAPFRE PORTUGAL to the Spain & Portugal Insurance Division and integration of the
operations of MAPFRE PUERTO RICO, which were previously included in MAPFRE AMÉRICA’s accounts
International Insurance Division: MAPFRE INTERNACIONAL
3
Highlights by countries
� Strong growth in premiums in the Motor and Health lines, which reflect the company’s product offering and
� The increase in premiums reflects:
– the growth in Home insurance in Massachusetts
– a larger business volume in other States (including California, Oregon and Washington), which already
contribute 24.6% of total issuance (22.5% in 2012)
– rate increases
� Decrease in the combined ratio, mainly due to milder weather. Weather-related losses amounted to €17.5 million, net of reinsurance (€50 million in 2012)
TURKEY
Highlights of the Unit
USA
Business development
44
� Strong growth in premiums in the Motor and Health lines, which reflect the company’s product offering and the expansion of the distribution network. Premium increases in the Commercial lines as well, due to the growing activity in this business line and the cooperation with MAPFRE GLOBAL RISKS.
� Increase in the loss experience arising from a lower growth in net premiums earned and larger average costs
� Realised capital gains of €20.6 million before taxes, as a result of the sale of the former headquarters in Istanbul
� Larger recurring financial results stemming from the rise in interest rates
� Positive trend in issuance in the Life-Savings segment. The results reflect the increase in the market value of investments and a non-recurring pick up in costs
TURKEY
MALTA
� The decrease in premiums reflects the cancellation of Medicare products (€57.8 million in 2012)� The development of results reflects: 1) extraordinary financial revenues of €21.1 million (€10.6 million after
taxes) from the Joint Underwriting Association insurance pool and 2) realisation gains of €0.3 million (€11.5 million in 2012)
PUERTORICO

3
Key highlights
Global Businesses Division
Business development
2012 2013 ���� %
Premiums & operating
income4,887.9 5,502.7 12.6%
Underwriting and financial
result192.6 276.5 43.6%
Other non-technical result 2.2 -0.4 -118.2%
���� %
MAPFRE RE 3,253.7 14.4%
MAPFRE GLOBAL RISKS 1,118.8 0.3%
MAPFRE ASISTENCIA 1,130.2 21.8%
���� %
451) Before taxes and minority interests
Million Euros
Other non-technical result 2.2 -0.4 -118.2%
Other business activities -1.7 -4.5 ---
Gross result(1) 193.1 271.6 40.7%
Net result 133.8 187.9 40.4%
Non-Life Combined Ratio 95.6% 92.4%
MAPFRE RE 157.0 30.6%
MAPFRE GLOBAL RISKS 66.9 162.4%
MAPFRE ASISTENCIA 52.6 12.2%
���� %
MAPFRE RE 108.8 24.9%
MAPFRE GLOBAL RISKS 45.3 188.5%
MAPFRE ASISTENCIA 33.8 9.0%

Key figures Key highlights
3
Global Businesses Division: MAPFRE RE
Business development
� The development of premiums reflects:– the growth of the Non-Life business with third parties
(+8.9%) and the formalisation of reinsurance operations
with Group companies
– a lower volume of premiums recognised in Life reinsurance
– the impact of the appreciation of the Euro, without
which growth would have been 21.1%
� Reflects:
2012 2013 ���� %
Gross written and accepted
premiums2,844.5 3,253.7 14.4%
- of which Non-Life premiums 2,383.1 2,828.0 18.7%
- of which Life premiums 461.4 425.7 -7.7%
Underwriting result 42.8 27.6 -35.5%
461) Before taxes and minority interests2) Ratio as a % of net premiums earned
Million Euros
� Reflects:– the underwriting of Life businesses with a higher loss
ratio and larger financial revenues, along with the
good performance of the loss experience in the Non-
Life catastrophic business
– a higher expense ratio due to the greater weight of
proportional business
� The development of the financial result (€129.4 million in
2013) reflects:– positive exchange rate differences of €18.0 million
(€0.6 million in 2012)
– realisation gains of €0.8 million (-€9.0 million in 2012)
– impairments of €30.1 million in 2012
Underwriting result 42.8 27.6 -35.5%
Gross result(1) 121.1 155.3 28.2%
Net result 87.1 108.8 24.9%
Non-life combined ratio(2) 97.0% 96.5%
ROE 9.6% 11.0%

The volume of third-party business renewals remained stable (+€4.2% at a constant exchange rate), thanks to the trust placed by clients in MAPFRE’s actual solvency, along with a successful renewal campaign
3 Business development
MAPFRE RE:
Renewal campaign in 2014
47
Contract renewal terms have been lowered, due to the large amount of capital available in the reinsurance industry. In this context, MAPFRE RE maintained its rigorous underwriting approach.

Key figures Key highlights
3
Global Businesses Division: MAPFRE GLOBAL RISKS
Business development
� Reflects:
– the creation of the credit insurance JV
SOLUNION, which is equity accounted, and
MAPFRE GLOBAL RISKS’ role as its reinsurer
– the impact of the appreciation of the Euro,
excluding which the growth rate would be 2.1%
� Favourable performance of the underlying loss
2012 2013 ���� %
Gross written and accepted
premiums1,115.2 1,118.8 0.3%
Underwriting result 20.3 43.4 113.8%
Gross result(1) 25.3 66.4 162.5%
481) Before taxes and minority interests2) Ratio as a % of net premiums earned
Million Euros
� Favourable performance of the underlying loss
experience, along with the positive impact of the
appreciation of the Euro versus all other key
currencies
� The financial result (€23.5 million) reflects:
– the gain of €25.7 million recognised upon the
creation of SOLUNION (against a net balance of
impairments and realisation results of -€14.4
million in 2012)
– net exchange rate differences of -€14.3 million
(-€1.8 million in 2012)
Net result 15.7 45.3 188.5%
Non-life combined ratio(2) 93.0% 85.3%
ROE 6.5% 16.2%

Global Businesses Division: MAPFRE ASISTENCIA
Key figures Key highlights
3 Business development
� Organic growth in Asia and Europe
� In North America, development of new distribution networks and contracts with large clients
� The financial result was affected by exchange rate differences of -€6.3 million (-€1 million in 2012)
2012 2013 ���� %
Operating income 928.2 1,130.2 21.8%
Underwriting result 44.9 57.5 28.1%
Gross result(1) 46.7 49.9 6.9%
49Million Euros
1) Before taxes and minority interests2) Includes -€1.6 million from discontinued operations3) Ratio as a % of net premiums earned
differences of -€6.3 million (-€1 million in 2012)
� Reflects mainly the positive impact of the appreciation of the Euro on technical reserves
Gross result 46.7 49.9 6.9%
Net result(2) 31.0 33.8 9.0%
Non-life combined ratio(3) 93.1% 92.6%
ROE 16.0% 15.5%

1 Key highlights
2 Consolidated financial information
3 Business development
50
3 Business development
4 Appendix
5 Financial supplement
6 Schedule and contacts

Variations in financial debt
4 Appendix
Change2011 2012 2013 y-o-y
Senior debt COMMERCE - 12/2013 153.7 151.0 0.0 -151.0
Senior debt MAPFRE S.A. - 11/2015 --- 1,001.8 1,003.3 1.5
Subordinated debt - 7/2017 607.9 597.1 596.4 -0.7
Syndicated credit facility - 6/2018 (€750 M) --- --- 0.0 ---
Operating debt at subsidiaries 168.0 158.2 125.5 -32.7
TOTAL FINANCIAL & SUBORDINATED DEBT 1,915.0 1,908.1 1,725.2 -182.9
51
Million Euros
� The variation in financial debt reflects the amortisation of the senior debt issued by MAPFRE USA
TOTAL FINANCIAL & SUBORDINATED DEBT 1,915.0 1,908.1 1,725.2 -182.9
EQUITY/DEBT 5.08x 5.31x 5.73x

EBITDA coverage
4 Appendix
2008 2009 2010 2011 2012 2013
Earnings before tax (EBT) 1,383.2 1,446.2 1,431.0 1,636.9 1,372.0 1,563.9
Variation in equalisation reserves -- -- -- -- -- --
Adjusted EBT 1,383.2 1,446.2 1,431.0 1,636.9 1,372.0 1,563.9
Interest payments 140.6 94.6 86.1 72.1 78.4 100.6
- on financial debt 109.3 75.8 64.4 66.0 70.0 97.5
- on operating debt 31.3 18.8 21.7 6.1 8.4 3.1
Income from interest rate hedging swaps(1) 11.7 1.5 -7.2 -8.6 0.0 0.0
Earnings before tax and interest payments (EBIT) 1,535.5 1,542.2 1,509.9 1,700.4 1,450.4 1,664.5
Depreciation and amortisation 360.3 184.2 234.4 396.4 731.6 550.3
52
Million Euros
1) Interest rate swap entered into on 28.1.2002 to hedge the interest payment on the €275 million senior bond issue. These bonds matured in July 2011, hence the swap has expired.
Depreciation and amortisation 360.3 184.2 234.4 396.4 731.6 550.3
Earnings before tax, interest payments, depreciation and
amortisation (EBITDA)1,895.8 1,726.4 1,744.3 2,096.8 2,182.0 2,214.8
EBITDA / Interest Coverage, net of hedging swaps (x)
- Including operating debt 12.4 18.0 22.1 33.0 27.8 22.0
- Excluding operating debt 15.4 22.1 30.1 36.5 31.1 22.7
Memo: total debt 3,044.5 2,062.6 2,122.1 1,915.0 1,908.1 1,725.2
- of which: operating debt 645.5 406.9 377.3 168.0 158.2 125.5
- of which: financial debt 2,399.0 1,655.7 1,744.9 1,747.0 1,749.9 1,599.7
EBITDA / Debt (including operating debt) 62.3% 83.7% 82.2% 109.5% 114.4% 128.4%
EBITDA / Debt (excluding operating debt) 62.7% 92.0% 85.3% 97.0% 82.4% 103.9%

Equity, debt and leverage
4 Appendix
2008 2009 2010 2011 2012 2013
Shareholders' equity 4,902.2 6,165.7 6,541.9 7,042.9 7,810.5 7,833.5
Minority interests 814.2 928.1 1,253.9 2,683.7 2,325.8 2,060.2
Total equity 5,716.4 7,093.8 7,795.8 9,726.7 10,136.3 9,893.7
Unrealised gains(1) 941.8 886.9 795.2 607.4 566.8 548.7
Total equity at market value 6,658.2 7,980.7 8,591.0 10,334.1 10,703.1 10,442.4
Total debt 3,044.5 2,062.6 2,122.1 1,915.0 1,908.1 1,725.2
- of which: operating debt 645.5 406.9 377.3 168.0 158.2 125.5
- of which: financial debt 2,399.0 1,655.7 1,744.9 1,747.0 1,749.9 1,599.7
531) Unrealised gains on property assets. Figures net of policyholders’ share.2) Total debt / (Equity at market value + Total debt).3) Total debt / Equity at market value
Million Euros
Leverage (2)
- including operating debt 31.4% 20.5% 19.8% 15.6% 15.1% 14.2%
- excluding operating debt 26.5% 17.2% 16.9% 14.5% 14.1% 13.3%
Gearing (3)
- including operating debt 45.7% 25.8% 24.7% 18.5% 17.8% 16.5%
- excluding operating debt 36.0% 20.7% 20.3% 16.9% 16.3% 15.3%

Appendix
Consolidated income statement
4
2012 2013 ���� %
NON-LIFE INSURANCE AND REINSURANCE
Gross written and accepted premiums 15,478.5 16,277.7 5.2%
Premiums earned, net of ceded and retroceded reinsurance 12,978.4 13,229.4 1.9%
Net claims incurred and variation in other technical provisions -8,748.9 -8,868.5 1.4%
Operating expenses, net of reinsurance -3,539.8 -3,790.7 7.1%
Other technical income and expenses -99.7 -60.8 -39.0%
Technical Result 590.0 509.4 -13.7%
Net fin'l. income and other non-technical income and expenses 657.1 684.3 4.1%
Result of Non-life business 1,247.1 1,193.7 -4.3%
LIFE ASSURANCE AND REINSURANCE
Gross written and accepted premiums 6,101.3 5,557.8 -8.9%
Premiums earned, net of ceded and retroceded reinsurance 5,293.6 4,772.6 -9.8%
Net claims incurred and variation in other technical provisions -4,779.0 -4,331.1 -9.4%
Operating expenses, net of reinsurance -1,151.8 -1,029.8 -10.6%
Other technical income and expenses 19.0 5.4 -71.6%
Technical Result -618.2 -582.9 -5.7%
Net fin'l. income and other non-technical income and expenses 950.4 965.1 1.5%
54Million Euros
1) Ratios as a % of net premiums earned
Net fin'l. income and other non-technical income and expenses 950.4 965.1 1.5%
Unrealised gains and losses in Unit-Linked products 82.3 116.7 41.8%
Result of Life business 414.5 498.9 20.4%
OTHER BUSINESS ACTIVITIES
Operating income 454.2 536.7 18.2%
Operating expenses -436.4 -543.1 24.5%
Other income and expenses -297.5 -79.0 -73.4%
Results from other business activities -279.7 -85.4 -69.5%
Result on restatement of financial accounts -9.9 -43.3 ---
Result before tax and minority interests 1,372.0 1,563.9 14.0%Taxes -396.5 -372.4 -6.1%
Result after tax 975.5 1,191.5 22.1%
Result after tax from discontinued operations -12.7 -1.7 -86.6%
Result for the year 962.8 1,189.8 23.6%
Result attributable to minority shareholders -297.1 -399.3 34.4%
Result attributable to the controlling Company 665.7 790.5 18.7%
Non-life loss ratio(1) 67.4% 67.0%
Non-life expense ratio(1) 28.0% 29.1%
Non-life combined ratio(1) 95.4% 96.1%

Profit breakdown by units and companies
4 Appendix
Net Minority
Result interests € Million % € Million %
SPAIN & PORTUGAL INSURANCE(1) 324.8 324.8 275.9
MAPFRE VIDA 94.3 94.3 11.9% 81.6 12.3%
MAPFRE FAMILIAR 153.8 153.8 19.5% 144.2 21.7%
MAPFRE EMPRESAS 76.0 76.0 9.6% 50.1 7.5%
MAPFRE PORTUGAL 0.7 0.7 0.1% --- ---
INTERNATIONAL INSURANCE 394.0 392.0 317.8
Contribution to consolidated result
2013 2012
55Million Euros
1) The figures for 2013 reflect the 2013 operational structure. MAPFRE PUERTO RICO is included in MAPFRE INTERNACIONAL, which no longer includes MAPFRE PORTUGAL.
MAPFRE AMÉRICA(1) 258.5 -2.0 256.5 32.4% 224.1 33.7%
MAPFRE INTERNACIONAL(1) 135.5 135.5 17.1% 93.7 14.1%
GLOBAL BUSINESSES 187.9 178.7 126.4
MAPFRE GLOBAL RISKS 45.3 45.3 5.7% 15.7 2.4%
MAPFRE RE 108.8 -9.2 99.6 12.6% 79.7 12.0%
MAPFRE ASISTENCIA 33.8 33.8 4.3% 31.0 4.7%
OTHER BUSINESS ACTIVITIES 0.0246 0.0 ene-00
Other companies and consolidation adjustments --- -105.0 -54.4
MAPFRE S.A. 790.5 100% 665.7 100%

Breakdown of recurring results by units and companies
4 Appendix
2012 2013 ���� % 2012 2013 2012 2013 ���� %
SPAIN AND PORTUGAL INSURANCE(1) 275.9 324.8 17.7% -251.9 -124.5 527.8 449.3 -14.9%
MAPFRE VIDA 81.6 94.3 15.6% -55.2 -52.7 136.8 147.0 7.5%
MAPFRE FAMILIAR 144.2 153.8 6.7% -143.4 -65.5 287.6 219.3 -23.7%
MAPFRE EMPRESAS 50.1 76.0 51.7% -53.3 -6.3 103.4 82.3 -20.4%
MAPFRE PORTUGAL --- 0.7 --- --- 0.0 --- 0.7 ---
result
Contribution to Recurring attributable
consolidated resultNon-recurring
results
56Million Euros
1) The figures for 2013 reflect the 2013 operational structure. MAPFRE PUERTO RICO is included in MAPFRE INTERNACIONAL, which no longer includes MAPFRE PORTUGAL.
MAPFRE PORTUGAL --- 0.7 --- --- 0.0 --- 0.7 ---
INTERNATIONAL INSURANCE 317.8 392.0 23.3% -6.0 51.8 323.8 340.2 5.1%
MAPFRE AMÉRICA(1) 224.1 256.5 14.5% -12.0 32.8 236.1 223.7 -5.3%
MAPFRE INTERNACIONAL(1) 93.7 135.5 44.6% 6.0 19.0 87.7 116.5 32.8%
GLOBAL BUSINESSES 126.4 178.7 41.4% -36.2 17.1 162.6 161.6 -0.6%
MAPFRE GLOBAL RISKS 15.7 45.3 188.5% -13.4 17.1 29.1 28.2 -3.1%
MAPFRE RE 79.7 99.6 25.0% -22.8 0.0 102.5 99.6 -2.8%
MAPFRE ASISTENCIA 31.0 33.8 9.0% 0.0 0.0 31.0 33.8 9.0%
OTHER BUSINESS ACTIVITIES 0.0000 0.0000 0.0% 0.0 0.0% 0.0%
Other companies and consolidation adjustments -54.4 -105.0 --- 17.8 -34.0 -72.2 -71.0 -1.7%
MAPFRE S.A. 665.7 790.5 18.7% -276.3 -89.6 942.0 880.1 -6.6%

Expense and loss ratios
4 Appendix
2012 2013 2012 2013 2012 2013
MAPFRE S.A. consolidated 28.0% 29.1% 67.4% 67.0% 95.4% 96.1%
SPAIN & PORTUGAL INSURANCE(4) 21.2% 20.8% 70.0% 72.9% 91.2% 93.7%
MAPFRE FAMILIAR 20.7% 20.2% 71.7% 74.1% 92.4% 94.3%
MAPFRE EMPRESAS 24.1% 23.8% 58.5% 64.8% 82.6% 88.6%
MAPFRE PORTUGAL --- 27.6% --- 79.8% --- 107.4%
RATIOS
Expense ratio(1) Loss ratio(2) Combined ratio(3)
57
1) (Operating expenses, net of reinsurance + profit sharing and returns – other technical income + other technical expenses) / Net premiums earned. Figures for the Non-life business.2) (Net claims incurred in the year + variation of other technical reserves) / Net premiums earned. Figures for the Non-life business.3) Combined ratio = Expense ratio + Loss ratio. Figures for the Non-life business.4) The figures for 2013 reflect the 2013 operational structure. MAPFRE PUERTO RICO is included in MAPFRE INTERNACIONAL, which no longer includes MAPFRE PORTUGAL.5) Net operating expenses / average third party funds under management.
MAPFRE PORTUGAL --- 27.6% --- 79.8% --- 107.4%
MAPFRE VIDA(5) 1.1% 1.1%
INTERNATIONAL INSURANCE 32.5% 34.1% 66.3% 64.8% 98.8% 98.9%
MAPFRE AMÉRICA(4) 34.7% 36.6% 63.0% 61.2% 97.7% 97.8%
MAPFRE INTERNACIONAL(4) 27.4% 28.5% 74.1% 73.0% 101.5% 101.5%
GLOBAL BUSINESSES 29.4% 29.7% 66.2% 62.7% 95.6% 92.4%
MAPFRE GLOBAL RISKS 29.9% 28.8% 63.1% 56.5% 93.0% 85.3%
MAPFRE RE 29.7% 31.4% 67.3% 65.1% 97.0% 96.5%
MAPFRE ASISTENCIA 28.5% 27.1% 64.6% 65.5% 93.1% 92.6%

Net financial income: selected information
4 Appendix
Breakdown of net financial and non-technical income (before taxes)
2012 2013 ���� %
Net financial income, Non-life 709.1 693.9 -2.1%
- of which realised capital gains and impairments -99.8 92.0 ---
- of which foreign exchange gains/(losses) -2.7 27.1 ---
58Million Euros
- of which impact of changes in fair or market value 4.1 -49.2 ---
Non-technical income, Non Life -52.0 -9.6 -81.6%
- of which realised capital gains and impairments --- 21.8 ---
Net financial income, Other Business Activities -293.7 -79.0 -73.1%
- of which realised capital gains and impairments -254.1 -23.8 ---

Net financial income: selected information (contd.)
4
Realisation gains, impairments and other financial results
Appendix
2012 2013 2012 2013 2012 2013 2012 2013
MAPFRE FAMILIAR 49.2 31.1 -31.9 -168.4 -96.4 -151.1 -65.3
Realisation gainsImpairments from
Bankia and Cattolica
Other financial
results(1)Impact on pre-tax
result
59Million Euros
1) Excludes the positive impact of the partial release of the provision for financial market instability2) Net of policyholders’ participation
MAPFRE FAMILIAR 49.2 31.1 -31.9 -168.4 -96.4 -151.1 -65.3
MAPFRE VIDA(2) 33.5 0.0 -40.5 -145.8 -148.8 -152.8 -148.8
MAPFRE EMPRESAS 14.1 10.6 -12.2 -51.3 -5.8 -49.4 4.8
MAPFRE AMÉRICA 21.2 7.1 0.0 47.8 21.2 54.9
MAPFRE GLOBAL RISKS 26.5 -4.6 -9.8 -1.3 -14.4 25.2
MAPFRE RE -1.7 -0.2 -25.9 -11.5 -39.1 -0.2
MAPFRE ASISTENCIA 0.0 -0.1 -0.1 0.0
MAPFRE INTERNACIONAL 18.6 46.6 -21.9 -0.3 21.1 -3.6 67.7
TOTAL 134.9 121.7 -137.1 0.0 -387.1 -183.4 -389.3 -61.7

Development of reserves
4 Appendix
2004 2005 2006 2007 2008 2009 2010 2011 2012 2013
At the end of year of occurrence 100.0 100.0 100.0 100.0 100.0 100.0 100.0 100.0 100.0 100.0
As at 31.12.2013 93.6 94.6 95.4 95.3 96.5 95.9 98.5 99.5 98.3
Run-off 6.4 5.4 4.6 4.7 3.5 4.1 1.5 0.5 1.7 ---
60
In %
Run-off 6.4 5.4 4.6 4.7 3.5 4.1 1.5 0.5 1.7 ---
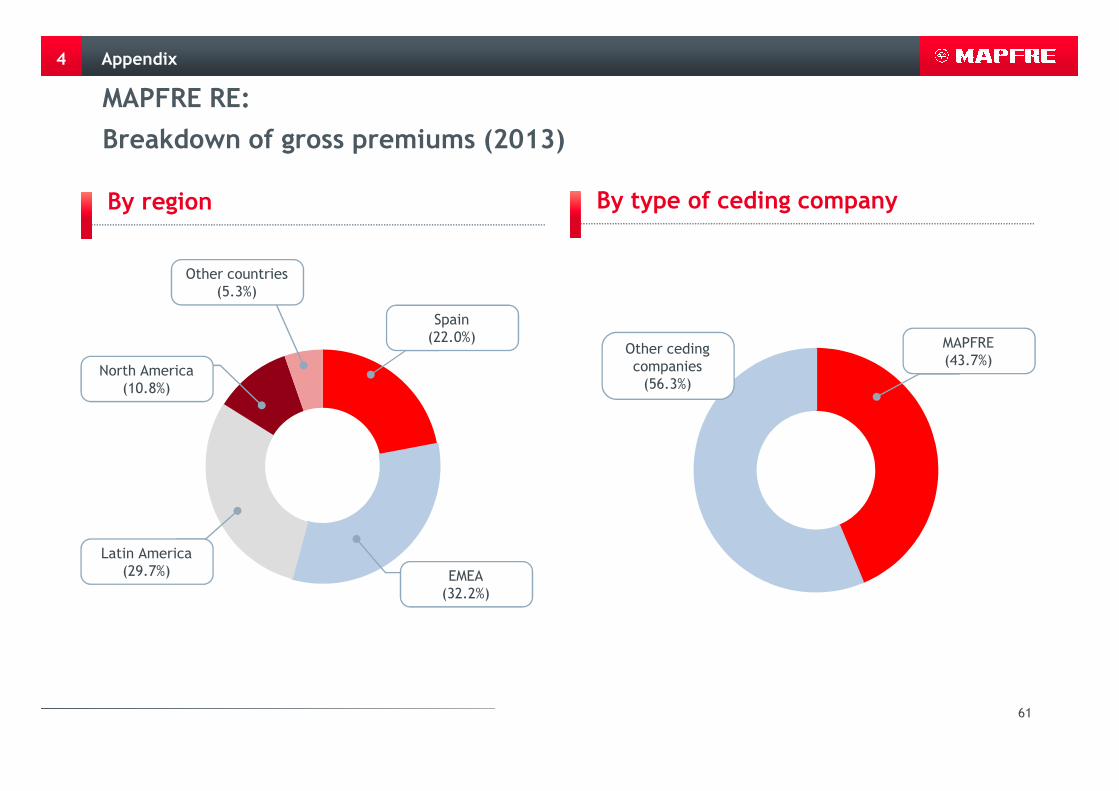
MAPFRE RE:
Breakdown of gross premiums (2013)
4
By type of ceding companyBy region
Other ceding companies (56.3%)
Other countries(5.3%)
North America(10.8%)
Spain(22.0%) MAPFRE
(43.7%)
Appendix
61
(10.8%)
Latin America(29.7%) EMEA
(32.2%)

MAPFRE RE:
Breakdown of net premiums (2013)
4
By type of ceding companyBy region
Appendix
Other countries(6.4%)
Latin America
Spain(15.6%)
Europe(43.2%)
Other ceding companies (75.3%)
MAPFRE (24.7%)
North America(6.4%)
62
By insurance lineBy type of business
Latin America(28.4%)
(43.2%)
Proportional(78.5%)
Facultative(7.5%)
Non-proportional(14.0%)
Life & Accident(27.9%)
Motor(8.4%)
Transport(6.4%)
Property(51.4%)
Other(5.9%)

MAPFRE RE: Investment portfolio
4
Breakdown by type of asset Breakdown by region
Fixed income 2,533 (75.4%)
Cash
Other479 (14.3%) (1)
Equities 171 (5.1%)
Property15 (0.4%)
Spain
USA and Canada 427 (12.7%)
Latin America 211 (6.3%)
Other countries454 (13.5%)
Other Europe1,148 (34.2%)
Supranational288 (8.6%)
Appendix
63
Breakdown by valuation method
1) Principally deposits received from ceded and retroceded reinsurance (11.9%)2) Principally deposits received from ceded and retroceded reinsurance, cash and bank deposits
Cash 162 (4.8%)
Spain832 (24.7%)
211 (6.3%)
Fair value through equity 2,665 (79.3%)
Other(2)
656 (19.5%)
€3,360million
Million Euros
Fair value through P&L39 (1.2%)

4
Breakdown by type of issuer Government
Financial institutions
Government909 (35.9%)
MAPFRE RE: Fixed income portfolio: 75.4% of investments
Appendix
Spain 336.1 37.0%
USA 86.4 9.5%
Brazil 82.9 9.1%
Netherlands 81.8 9.0%
Belgium 78.8 8.7%
Italy 71.2 7.8%
Austria 39.8 4.4%
Portugal 25.6 2.8%
France 16.5 1.8%
Germany 12.4 1.4%
Chile 11.1 1.2%
Other 66.4 7.3%
909.0 100.0%
64
Financial institutions
Supranational (EIB, WB…)285 (11.3%)
Financial institutions742 (29.3%) Spain
196 (26.4%)
Netherlands122 (16.4%)
Other countries222 (29.8%)
Germany54 (7.3%)
USA72 (9.8%)
Other597 (23.5%)
Book value as at 31.12.2013: €2,533 millionBook value as at 31.12.2013: €2,533 millionMillion Euros
France 76 (10.3%)

4
Breakdown by rating (S&P)
BB or lower64 (2.5%)
BBB
AAA540 (21.3%)
Breakdown by currency
Latin American currencies168 (6.6%)
US Dollar
Euro1,790 (70.7%)
MAPFRE RE: Fixed income portfolio: 75.4% of investments
Appendix
Other currencies 87 (3.4%)
65
BBB756 (29.9%)
AA791 (31.2%)
A382 (15.1%)
US Dollar488 (19.3%)
Book value as at 31.12.2013: €2,533 millionBook value as at 31.12.2013: €2,533 million
Million Euros

MAPFRE GLOBAL RISKS: Investment portfolio
4
Breakdown by type of asset Breakdown by region
Cash
Other26.8 (3.7%)(1)
€725.8
Appendix
Other Europe
USA & Canada 62.7 (8.6%)
Latin America 10.9 (1.5%)
Other countries 5.6 (0.8%)
Spain376.8 (52.1%)
Supranational48.1 (6.6%)Mutual funds
52.9 (7.3%)
Property38.0 (5.2%)
Equities22.2 (3.1%)
66
Other(2)
167.8 (23.1%)
Breakdown by valuation method
Fixed income482.9 (66.5%)
Cash103.0 (14.2%)
Fair value through equity
556.9 (77.8%)
Fair value through P&L
1.0 (0.1%)
€725.8million
Million Euros
Other Europe 218.3 (30.1%)
1) Principally deposits and other items2) Principally property, cash and other items

MAPFRE GLOBAL RISKS: Fixed income portfolio: 66.5% of investments
4
Government248.1 (51.4%)
Breakdown by type of issuer Government
Appendix
Spain 113.6 45.8%
Netherlands 31.6 12.7%
France 31.6 12.7%
USA 26.1 10.5%
Belgium 19.2 7.7%
Germany 17.7 7.1%
Other countries 8.4 3.4%
248.1 100.0%
67
Financial institutions
Other44.1 (9.1%)
Financial institutions142.5 (29.5%)
Spain62.5 (43.8%)
Other countries80.0 (56.2%)
Book value as at 31.12.2013: €482.9 millionBook value as at 31.12.2013: €482.9 million
Supranational 48.1 (10.0%)
Million Euros

MAPFRE GLOBAL RISKS: Fixed income portfolio: 66.5% of investments
4
AAA107.8 (22.3%)
BB or lower 1.6 (0.3%)
BBB
Breakdown by currencyBreakdown by rating (S&P)
US Dollar136.9 (28.4%)
Euro
Appendix
68
BBB 161.7 (33.5%)
A73.4 (15.2%)
AA 138.4 (28.7%)
Book value as at 31.12.2013: €482.9 millionBook value as at 31.12.2013: €482.9 million
Euro 346.1 (71.6%)
Million Euros

1 Key highlights
2 Consolidated financial information
3 Business development
69
3 Business development
4 Appendix
5 Financial supplement
6 Schedule and contacts

Financial supplement
Operating companies: Key figures
5
MAPFRE FAMILIAR
2012 2013* ���� %
Gross written and accepted premiums 3,715.1 3,693.2 -0.6%
Net premiums earned 3,826.3 3,448.8 -9.9%
Underwriting result 288.6 176.4 -38.9%
Net financial income -35.4 56.4 ---
Other business activities 4.7 5.4 14.9%
Other non-technical results -21.3 -3.2 -85.0%
Gross result(1) 236.6 235.0 -0.7%
Taxes -89.8 -76.2 -15.1%
Minorities -2.6 -4.3 65.4%
70* The figures for 2013 include MAPFRE PORTUGAL1) Before taxes and minority interests2) Ratios as a % of net premiums earned
Million Euros
Minorities -2.6 -4.3 65.4%
Discontinued operations 0.0 0.0 ---
Net result 144.2 154.5 7.1%
Investments, real estate and cash 4,039.5 4,363.8 8.0%
Technical reserves 3,287.3 3,464.0 5.4%
- of which participation in reinsurance 29.2 43.0 47.3%
Equity 1,380.3 1,594.5 15.5%
Non-life loss ratio(2)
71.7% 74.2%
Non-life expense ratio(2) 20.7% 20.3%
Non-life combined ratio(2) 92.4% 94.5%
ROE 10.5% 10.4%

5 Financial supplement
Operating companies: Key figures
MAPFRE FAMILIAR – Domestic business by insurance lines
Motor 2012 2013 ���� %
Gross written and accepted premiums 2,224.5 2,056.4 -7.6%
Net premiums earned 2,296.5 1,907.2 -17.0%
Underwriting result 135.5 85.8 -36.7%
Non-life loss ratio(1) 76.9% 77.9%
Non-life expense ratio(1) 17.2% 17.6%
Non-life combined ratio(1) 94.1% 95.5%
Home 2012 2013 ���� %
Gross written and accepted premiums 638.2 637.0 -0.2%
Net premiums earned 620.3 573.5 -7.5%
Underwriting result 66.4 45.3 -31.8%
Non-life loss ratio(1) 62.6% 66.6%
Non-life expense ratio(1) 26.7% 25.5%
Non-life combined ratio(1) 89.3% 92.1%
711) Ratios as a % of net premiums earned
Million Euros
Number of insured vehicles 5,659,947 5,416,743 -4.3%
Health 2012 2013 ���� %
Gross written and accepted premiums 402.0 399.8 -0.5%
Net premiums earned 398.1 398.3 0.1%
Underwriting result 0.8 3.2 ---
Non-life loss ratio(1) 81.6% 82.8%
Non-life expense ratio(1) 18.2% 16.4%
Non-life combined ratio(1) 99.8% 99.2%
Burial 2012 2013 ���� %
Gross written and accepted premiums 270.4 279.7 3.4%
Net premiums earned 270.0 279.1 3.4%
Underwriting result 37.3 27.1 -27.3%
Non-life loss ratio(1) 54.9% 61.8%
Non-life expense ratio(1) 31.3% 28.5%
Non-life combined ratio(1) 86.2% 90.3%

5 Financial supplement
Operating companies: Key figures
MAPFRE EMPRESASMAPFRE FAMILIAR (contd.)
Other 2012 2013 ���� %
Gross written and accepted premiums 180.0 183.6 2.0%
Net premiums earned 241.4 170.7 -29.3%
Underwriting result 48.6 28.8 -40.7%
Non-life loss ratio(2) 48.8% 57.3%
Non-life expense ratio(2) 30.8% 25.9%
Non-life combined ratio(2) 79.6% 83.2%
2012 2013 ���� %
Gross written and accepted premiums 715.0 642.8 -10.1%
Net premiums earned 560.8 554.3 -1.2%
Underwriting result 97.7 63.6 -34.9%
Net financial income -11.7 43.6 ---
Other business activities 0.2 0.3 50.0%
Other non-technical results -0.6 1.0 ---
Gross result(1)
85.6 108.5 26.8%
Taxes -35.5 -32.5 -8.5%
721) Before taxes and minority interests2) Ratios as a % of net premiums earned
Million Euros
Non-life combined ratio 79.6% 83.2%Taxes -35.5 -32.5 -8.5%
Minorities 0.0 0.0 ---
Net result 50.1 76.0 51.7%
Investments, real estate and cash 1,158.4 1,166.3 0.7%
Technical reserves 1,301.1 1,177.8 -9.5%
- of which participation in reinsurance 352.5 283.5 -19.6%
Shareholders' equity 306.2 350.7 14.5%
Non-life loss ratio(2)
58.5% 64.8%
Non-life expense ratio(2)
24.1% 23.8%
Non-life combined ratio(2)
82.6% 88.6%
ROE 17.7% 23.1%

5 Financial supplement
Operating companies: Key figuresMAPFRE VIDA
2012 2013 ���� %Technical Reserves excluding
shadow accounting 18.294,2 18.251,9 -0,2%
Shadow accounting adjustments 340,2 1.251,6 ---
Technical Reserves IFRS 18.634,4 19.503,5 4,7%
Mutual Funds and managed portfolios 2.543,2 3.027,2 19,0%
Pension Funds 5.105,9 5.372,3 5,2%
Funds under management
IFRS 26.283,5 27.903,0 6,2%
Excluding the effect of "shadow accounting" 25.943,3 26.651,4 2,7%
Gross written and accepted premiums 3.077,5 2.508,4 -18,5%
Breakdown of premiums 2012 2013 ���� %Regular Premiums 464.5 430.3 -7.4%
- Agents' and other channels 274.9 248.2 -9.7%
- Bank channel - MAPFRE-CM VIDA 26.9 24.4 -9.3%
- Bank channel - CATALUNYACAIXA 65.3 51.7 -20.8%
- Bank channel - Other(1)
97.4 106.0 8.8%
Single Premiums 2,124.2 1,618.5 -23.8%
- Agents' and other channels 1,157.5 918.7 -20.6%
- Bank channel - MAPFRE-CM VIDA 334.7 183.2 -45.3%
- Bank channel - CATALUNYACAIXA 291.3 305.2 4.8%
73Million Euros
1) Before taxes and minority interests2) Net operating expenses / average third-party funds under management
1) Includes BANKINTER VIDA, CCM VIDA Y PENSIONES and UNIÓN DUERO VIDA2) The figures for both periods include the Accidents premiums written by all the
distribution channels in Spain
Gross written and accepted premiums 3.077,5 2.508,4 -18,5%
Net premiums earned 2.956,8 2.414,6 -18,3%
Underwriting and financial result 85,6 93,6 9,3%
Other business activities 55,3 61,2 10,7%
Other non technical results 72,6 54,2 -25,3%
Gross result(1)
213,5 209,0 -2,1%
Taxes -74,4 -57,3 -23,0%
Minorities -57,5 -57,4 -0,2%
Net result 81,6 94,3 15,6%
Investments, real estate and cash 19.412,3 20.617,1 6,2%
Shareholders' equity 1.197,7 1.356,5 13,3%
Expense Ratio(2) 1,09% 1,09%
ROE 7,1% 7,4%
- Bank channel - Other(1)
340.7 211.4 -38.0%
Life premiums - Savings 2,588.7 2,048.8 -20.9%
Life Premiums - Protection 394.7 376.9 -4.5%
- Agents' and other channels 129.4 128.0 -1.1%
- Bank channel - MAPFRE-CM VIDA 102.1 95.5 -6.5%
- Bank channel - CATALUNYACAIXA 56.0 50.3 -10.2%
- Bank channel - Other(1)
107.2 103.1 -3.8%
Accident Premiums(2) 94.1 82.7 -12.1%
TOTAL PREMIUMS 3,077.5 2,508.4 -18.5%
- Agents' and other channels 1,639.4 1,361.2 -17.0%
- Bank channel 1,438.1 1,147.2 -20.2%

5 Financial supplement
Operating companies: Key figures
MAPFRE VIDA
Funds under management 2012 2013 ���� %Regular premiums insurance 4,672.7 4,757.7 1.8%
- Agents' channel and others 3,261.7 3,323.6 1.9%
- Bank channel - MAPFRE-CM VIDA 263.8 262.3 -0.6%
- Bank channel - CATALUNYACAIXA 557.5 542.0 -2.8%
- Bank channel - Other(1) 589.7 629.8 6.8%
Single premiums insurance 13,205.9 13,965.8 5.8%
- Agents' channel and others 6,522.5 7,080.1 8.5%
- Bank channel - MAPFRE-CM VIDA 4,294.0 4,454.4 3.7%
- Bank channel - CATALUNYACAIXA 1,240.0 1,243.3 0.3%
- Bank channel - Other(1) 1,149.4 1,188.0 3.4%
Life-Protection insurance 155.6 150.2 -3.5%
Change in funds under management(1) 2012 2013
IFRS technical reserves(2) 823.5 869.1
Variation w/o the effect of "shadow accounting" 116.6 -42.3
- Agents' channel and others 473.9 146.9
- Bank channel - MAPFRE-CM VIDA -113.0 -147.9
- Bank channel - CATALUNYACAIXA -264.3 -56.5
- Bank channel - Other(3)
20.0 15.2
Pension funds 24.6 266.4
Net sales -237.9 -147.7
- Agents' channel and others -56.8 -0.3
74
Million Euros
1) Includes BANKINTER VIDA, CCM VIDA Y PENSIONES, UNIÓN DUERO VIDA and DUERO PENSIONES
1) Cumulative variation versus prior year end. Excludes the variation in shareholders’ equity over the same period.
2) Includes the effect of “shadow accounting” which adjusts technical reserves for variations in the market value of matching assets
3) Includes BANKINTER VIDA, CCM VIDA Y PENSIONES, UNIÓN DUERO VIDA and DUERO PENSIONES
Life-Protection insurance 155.6 150.2 -3.5%
- Agents' channel and others 57.6 61.2 6.3%
- Bank channel - MAPFRE-CM VIDA 70.5 68.4 -3.0%
- Bank channel - CATALUNYACAIXA 17.4 10.9 -37.4%
- Bank channel - Other(1) 10.1 9.7 -4.0%
Total mathematical reserves 18,034.2 18,873.7 4.7%
Other reserves 600.2 629.8 4.9%
TOTAL TECHNICAL RESERVES 18,634.4 19,503.5 4.7%
Mutual funds and managed portfolios 2,543.2 3,027.2 19.0%
Pension funds 5,105.9 5,372.3 5.2%
> MAPFRE INVERSIÓN 1,561.5 1,683.0 7.8%
- Individual system 1,274.4 1,350.3 6.0%
- Employers' system 287.1 332.7 15.9%
> CATALUNYACAIXA 1,258.7 1,107.3 -12.0%
> Other(1) 2,285.7 2,582.0 13.0%
TOTAL MANAGED SAVINGS 26,283.5 27,903.0 6.2%
- Bank channel -181.1 -147.4
Mutual funds and managed portfolios -105.2 484.0
Net sales -102.7 105.2
TOTAL CHANGE 742.9 1,619.5

5 Financial supplement
MAPFRE PORTUGAL MAPFRE PORTUGAL– by lines
Operating companies: Key figures
2012 2013 ���� %
Gross written and accepted premiums 127.8 136.7 7.0%
Net premiums earned 117.0 120.1 2.6%
Underwriting and financial result 3.6 1.4 -61.1%
Other business activities 0.0 0.0 ---
Other non-technical results 6.2 0.2 -96.8%
Gross result(1)
9.8 1.6 -83.7%
Taxes -3.0 -0.9 -70.0%
Minorities -0.9 0.0 ---
Non-Life 2012 2013 ���� %Gross written and accepted premiums 92.7 86.4 -6.8%
Net premiums earned 83.3 70.6 -15.2%
Underwriting result -3.3 -5.2 57.6%
Non-life loss ratio(2)
78.8% 79.8%
Non-life expense ratio(2)
25.2% 27.6%
Non-life combined ratio(2)
104.0% 107.4%
Life 2012 2013 ���� %
751) Before taxes and minority interests2) Ratios as a % of net premiums earned
Million Euros
Minorities -0.9 0.0 ---
Net result 5.9 0.7 -88.1%
Investments, real estate and cash 347.7 379.7 9.2%
Technical reserves 286.3 307.7 7.5%
- of which participation in reinsurance 23.9 23.5 -1.7%
Shareholders' equity 58.2 72.0 23.7%
Non-life loss ratio(2)
78.8% 79.8%
Non-life expense ratio(2)
25.2% 27.6%
Non-life combined ratio(2)
104.0% 107.4%
ROE 14.0% 1.1%
Life 2012 2013 ���� %Gross written and accepted premiums 35.1 50.3 43.3%
Net premiums earned 33.6 49.5 47.3%
Underwriting and financial result 4.3 1.3 -69.8%
Breakdown of premiums 2013 %Motor 47.9 35.1%
Accidents 19.7 14.4%
Life-Savings 44.9 32.9%
Shop 8.2 6.0%
Home 6.1 4.5%
Other 9.9 7.2%
TOTAL 136.7 100%

5 Financial supplement
Operating companies: Key figures
MAPFRE AMÉRICA (2013 operational structure)
MAPFRE AMÉRICA – by lines(2013 operational structure)
2012* 2013* ���� %
Gross written and accepted premiums 8,313.7 8,886.9 6.9%
Net premiums earned 6,057.5 6,291.6 3.9%
Underwriting and financial result 661.7 730.6 10.4%
Other business activities 16.5 9.6 -41.8%
Other non-technical results -20.6 6.5 -131.6%
Result on restatement -9.9 -43.3 337.4%
Gross result(1)
647.8 703.4 8.6%
Non-Life 2012* 2013* ���� %
Gross written and accepted premiums 5,880.5 6,432.5 9.4%
Net premiums earned 4,165.4 4,445.4 6.7%
Underwriting result 118.3 99.5 -15.9%
Non-life loss ratio(2)
62.4% 61.2%
Non-life expense ratio(2)
34.7% 36.6%
Non-life combined ratio(2)
97.2% 97.8%
76* The results for both periods reflect the 2013 operational structure, and therefore they exclude MAPFRE PUERTO RICO. For this purpose, the figures for 2012 have been restated.1) Before taxes and minority interests2) Ratios as a % of net premiums earned
Million Euros
Gross result 647.8 703.4 8.6%
Taxes -196.4 -128.9 -34.4%
Minorities -216.9 -316.0 45.7%
Net result 221.8 258.5 16.5%
Investments, real estate and cash 6,781.2 6,382.1 -5.9%
Technical reserves 7,195.3 7,360.3 2.3%
- of which participation in reinsurance 1,504.9 1,516.5 0.8%
Non-life loss ratio(2)
62.4% 61.2%
Non-life expense ratio(2)
34.7% 36.6%
Non-life combined ratio(2)
97.2% 97.8%
Life 2012* 2013* ���� %
Gross written and accepted premiums 2,433.2 2,454.4 0.9%
Net premiums earned 1,892.1 1,846.2 -2.4%
Underwriting and financial result 213.9 325.0 51.9%

5 Financial supplement
Operating companies: Key figures
MAPFRE BRASIL MAPFRE BRASIL – by lines
2012 2013 ���� %
Gross written and accepted premiums 4,761.4 5,036.1 5.8%
Net premiums earned 3,765.0 3,817.0 1.4%
Underwriting and financial result 471.5 544.0 15.4%
Other business activities 20.4 4.5 -77.9%
Other non-technical results -0.3 0.0 ---
Gross result(1) 491.6 548.5 11.6%
Taxes -174.8 -97.8 -44.1%
Minorities -205.3 -306.3 49.2%
Net result 111.5 144.4 29.5%
Non-Life 2012 2013 ���� %Gross written and accepted premiums 2,937.6 3,336.3 13.6%
Like-for-like(4)
3,137.2 3,336.3 6.3%
Net premiums earned 2,304.9 2,547.9 10.5%
Underwriting result 105.9 99.4 -6.1%
Non-life loss ratio(3) 59.2% 56.8%
Non-life expense ratio(3) 36.2% 39.3%
Non-life combined ratio(3)
95.4% 96.1%
Life 2012 2013 ���� %
771) Before taxes and minority interests2) Excluding minority interests3) Ratios as a % of net premiums earned
Million Euros4) Adjusting the figures for 2012 for the reclassification of business segments between the two lines5) Excludes Unit-Linked products (amounting to €689.6 and €628.8 million in 2012 and 2013,
respectively)
Net result 111.5 144.4 29.5%
Investments, real estate and cash(5) 3,263.4 2,876.6 -11.9%
Technical reserves(5) 3,365.4 3,592.5 6.7%
- of which participation in reinsurance 424.9 530.9 24.9%
Shareholders' equity(2)
1,254.2 1,111.6 -11.4%
Non-life loss ratio(3)
59.2% 56.8%
Non-life expense ratio(3)
36.2% 39.3%
Non-life combined ratio(3)
95.4% 96.1%
ROE n.a. 12.2%
Life 2012 2013 ���� %Gross written and accepted premiums 1,823.8 1,699.8 -6.8%
Like-for-like(4)
1,624.1 1,699.8 4.7%
Net premiums earned 1,460.1 1,269.1 -13.1%
Underwriting and financial result 168.5 301.2 78.8%

5 Financial supplement
Operating companies: Key figures
MAPFRE INTERNACIONAL (2013 operational structure)
MAPFRE INTERNACIONAL – by lines(2013 operational structure)
2012* 2013* ���� %
Gross written and accepted premiums 2,392.4 2,532.1 5.8%
Net premiums earned 2,023.4 2,042.2 0.9%
Underwriting result -117.5 -111.6 -5.0%
Net financial income 265.4 299.2 12.7%
Other business activities -25.0 -3.3 -86.8%
Other non-technical results -3.1 7.0 ---
Gross result(1)
119.7 191.3 59.8%
Non-Life 2012* 2013* ���� %
Gross written and accepted premiums 2,301.3 2,415.5 5.0%
Net premiums earned 1,936.6 1,929.5 -0.4%
Underwriting result -39.0 -28.1 -27.9%
Non-life loss ratio(2)
73.8% 73.0%
Non-life expense ratio(2)
28.3% 28.5%
Non-life combined ratio(2)
102.0% 101.5%
78Million Euros* The results for both periods reflect the 2013 operational structure, and therefore they exclude MAPFRE PORTUGAL and include MAPFRE PUERTO RICO. For this purpose, the figures for 2012 have been restated. 1) Before taxes and minority interests2) Ratios as a % of net premiums earned
Taxes -18.0 -47.3 162.8%
Minorities -9.8 -8.5 -13.3%
Net result 91.9 135.5 47.4%
Investments, real estate and cash 4,149.8 3,799.5 -8.4%
Technical reserves 3,077.7 3,239.3 5.3%
- of which participation in reinsurance 275.5 302.5 9.8%
Non-life loss ratio(2)
73.8% 73.0%
Non-life expense ratio(2)
28.3% 28.5%
Non-life combined ratio(2)
102.0% 101.5%
Life 2012* 2013* ���� %
Gross written and accepted premiums 91.1 116.6 28.0%
Net premiums earned 86.8 112.7 29.8%
Underwriting and financial result 17.7 16.1 -9.0%

5 Financial supplement
Operating companies: Key figures
MAPFRE USA
2012 2013 ���� %
Gross written and accepted premiums 1,513.9 1,543.2 1.9%
Net premiums earned 1,391.2 1,358.6 -2.3%
Underwriting result -27.0 -6.7 -75.2%
Net financial income 128.4 130.2 1.4%
Other business activities 0.0 0.0 ---
Other non-technical results -1.9 -1.4 -26.3%
Gross result(1)
99.5 122.1 22.7%
Taxes -14.3 -30.2 111.2%
Minorities -0.5 -0.4 -20.0%
791) Before taxes and minority interests2) Ratios as a % of net premiums earned
Million Euros
Minorities -0.5 -0.4 -20.0%
Net result 84.7 91.5 8.0%
Investments, real estate and cash 1,987.6 1,671.2 -15.9%
Technical reserves 1,353.9 1,357.7 0.3%
- of which participation in reinsurance 130.5 137.5 5.4%
Shareholders' equity 1,148.4 972.0 -15.4%
Non-life loss ratio(2)
74.8% 73.2%
Non-life expense ratio(2)
27.1% 27.3%
Non-life combined ratio(2)
101.9% 100.5%
ROE 7.5% 8.6%

5
MAPFRE RE MAPFRE RE – by lines
Financial supplement
Operating companies: Key figures
2012 2013 ���� %
Gross written and accepted premiums 2,844.5 3,253.7 14.4%
Net premiums earned 1,786.2 2,181.5 22.1%
Underwriting result 42.8 27.6 -35.5%
Net financial income 77.4 129.4 67.2%
Other business activities 0.0 0.0 ---
Other non-technical results 0.9 -1.7 ---
Gross result(1)
121.1 155.3 28.2%
Taxes -34.0 -46.5 36.8%
Non-Life 2012 2013 ���� %
Gross written and accepted premiums 2,383.1 2,828.0 18.7%
Net premiums earned 1,465.0 1,834.4 25.2%
Underwriting result 43.9 63.7 45.1%
Non-life loss ratio(2)
67.3% 65.1%
Non-life expense ratio(2)
29.7% 31.4%
Non-life combined ratio(2)
97.0% 96.5%
801) Before taxes and minority interests2) Ratios as a % of net premiums earned
Million Euros
Taxes -34.0 -46.5 36.8%
Minorities 0.0 0.0 ---
Net result 87.1 108.8 24.9%
Investments, real estate and cash 3,230.8 3,360.4 4.0%
Technical reserves 3,213.2 3,063.8 -4.6%
- of which participation in reinsurance 896.6 708.3 -21.0%
Shareholders' equity 968.5 1,009.8 4.3%
Non-life loss ratio(2)
67.3% 65.1%
Non-life expense ratio(2)
29.7% 31.4%
Non-life combined ratio(2)
97.0% 96.5%
ROE 9.6% 11.0%
Life 2012 2013 ���� %
Gross written and accepted premiums 461.4 425.7 -7.7%
Net premiums earned 321.2 347.1 8.1%
Underwriting and financial result 27.9 19.8 -29.0%

5
MAPFRE ASISTENCIA
Financial supplement
Operating companies: Key figures
MAPFRE GLOBAL RISKS
2012 2013 ���� %
Gross written and accepted premiums 1,115.2 1,118.8 0.3%
- Global Risks 1,012.8 1,062.0 4.9%
- Credit and Surety business 102.4 56.8 -44.5%
Net premiums earned 292.2 294.5 0.8%
Underwriting result 20.3 43.4 113.8%
Net financial income 5.2 23.5 351.9%
Other business activities -1.6 -1.9 18.8%
Other non-technical results 1.4 1.4 ---
Gross result(1)
25.3 66.4 162.5%
2012 2013 ���� %
Operating income 928.2 1,130.2 21.8%
- Gross written and accepted premiums 763.5 918.1 20.2%
- Other income 164.7 212.1 28.8%
Net premiums earned 651.6 774.5 18.9%
Underwriting result 44.9 57.5 28.1%
Net financial income 2.0 -4.9 ---
Other business activities -0.1 -2.6 ---
Other non-technical results -0.1 -0.1 ---(1)
811) Before taxes and minority interests2) Ratios as a % of net premiums earned3) Includes -€1.6 million from Discontinued operations
Million Euros
Gross result 25.3 66.4 162.5%
Taxes -9.6 -21.1 119.8%
Minorities 0.0 0.0 ---
Net result 15.7 45.3 188.5%
Investments, real estate and cash 711.2 794.8 11.8%
Technical reserves 1,915.2 1,730.2 -9.7%
- of which participation in reinsurance 1,436.3 1,260.6 -12.2%
Shareholders' equity 258.1 304.7 18.1%
Non-life loss ratio(2)
63.1% 56.5%
Non-life expense ratio(2)
29.9% 28.8%
Non-life combined ratio(2)
93.0% 85.3%
ROE 6.5% 16.2%
Gross result(1)
46.7 49.9 6.9%
Taxes -14.7 -13.4 -8.8%
Minorities -1.0 -1.1 10.0%
Net result(3)
31.0 33.8 9.0%
Investments, real estate and cash 173.7 171.4 -1.3%
Technical reserves 460.0 455.4 -1.0%
- of which participation in reinsurance 97.2 132.5 36.3%
Shareholders' equity 211.6 224.4 6.0%
Non-life loss ratio(2)
64.6% 65.5%
Non-life expense ratio(2)
28.5% 27.1%
Non-life combined ratio(2)
93.1% 92.6%
ROE 16.0% 15.5%

1 Key highlights
2 Consolidated financial information
3 Business development
82
3 Business development
4 Appendix
5 Financial supplement
6 Schedule and contacts

6
11-Feb-14 Madrid� Release 2013 Results
� Conference Call – 2013 Results
12-Feb-14 London � Presentation to analysts – 2013 Results
Schedule and contacts
2014 Provisional Schedule
83

Investor Relations Department
6
Luigi Lubelli Deputy General Manager – Finance +34-91-581-6071
Natalia Núñez Arana Deputy Director Capital Markets &Head of Investor Relations +34-91-581-8664
Alberto Fernández-Sanguino Investor Relations +34-91-581-2255
Antonio Triguero Sánchez Investor Relations +34-91-581-5211
Marisa Godino Alvarez Assistant +34-91-581-2985
Schedule and contacts
84
Marisa Godino Alvarez Assistant +34-91-581-2985
MAPFRE S.A.Investor Relations DepartmentCarretera de Pozuelo, nº 5228222 [email protected]

Disclaimer
This document is purely informative. Its content does not constitute, nor can it be interpreted as, an offer or an invitationto sell, exchange or buy, and it is not binding on the issuer in any way. The information about the plans of the Company, itsevolution, its results and its dividends represents a simple forecast whose formulation does not represent a guarantee with respect to the future performance of the Company or the achievement of its targets or estimated results. The recipients of this information must be aware that the preparation of these forecasts is based on assumptions and estimates, which are subject to a high degree of uncertainty, and that, due to multiple factors, future results may differ materially from expected results. Among such factors, the following are worth highlighting: the development of the insurance market and the general economic situation of those countries where the Group operates; circumstances which may affect the competitiveness of insurance products and services; changes in the basis of calculation of mortality and morbidity tables which may affect the insurance activities of the Life and Health segments; frequency and severity of claims covered; effectiveness of the Groups reinsurance policies and fluctuations in the cost and availability of covers offered by third party reinsurers; changes in the legal environment; adverse legal actions; changes in monetary policy; variations in interest ratesand exchange rates; fluctuations in liquidity and the value and profitability of assets which make up the investment
85
and exchange rates; fluctuations in liquidity and the value and profitability of assets which make up the investment portfolio; restrictions in the access to third party financing.
MAPFRE S.A. does not undertake to update or revise periodically the content of this document.