Embed Size (px)
Citation preview
Year 28 Nº 111 Third quarter 2008SEGURIDADy Medio Ambiente
The Nitrogen Cycle: The NinE European Project ● Explosive atmospheres control ● Risk of violence at work: The KAURIS Method
● PSE-ARFRISOL, an energy-saving alternative ● Sustainable mobility

Criteria for fire and explosion prevention and protection on industrial sites SAFETY
Real Decreto 681/2003 of 12 June for improving the safety and health protection of workers potentially at risk from explosive atmospheres in the workplace has now come into force. This royal decree lays down the bases for explosion risk assessment on those sites that are prone to generate explosive atmospheres of this type. Nonetheless, many doubts have been thrown up when it comes to implementing this royal decree and applying the assessment criteria. This article puts forward a series of guidelines that help to establish a particular modus operandi to suit the industry or site in question. An in-depth knowledge of the process involved is a sine qua non of effective protection against ATEX risks.
By XAVIER DE GEA. Director LPG Prevención y Protección de explosiones.
On 1 July 2003 Real Decreto 681 / 2003 became enforceable and binding on all new industrial establishments with a risk of explosive atmospheres. As from 30 June 2006 it also became enforceable for all industrial establishments with a risk of explosive atmospheres. As a result of this new legislation all these establishments are now bound to draw up an explosion protection document.
Without getting too bogged down in legal niceties, which have been dealt with in many articles elsewhere, we do need first and foremost to understand the phenomenon of “combustion”.
Once we understand the general principle of fire, combustion, conflagration, explosion, etc... we then have to see whether and how far this might affect our activity; it is well worthwhile here to pause a moment and put on our safety glasses (by which we mean not donning safety goggles but seeing things from the safety viewpoint) and check whether we are actually in a risk situation.
Despite not having had any accident for years, the ingredients might still be there, biding their time. We can look for guidelines in the accidents that have occurred in our sector, as telltale signs of whether or not we are handling “hazardous” substances.
For example, an analysis of the dust explosion figures in the American grain sector over the last four decades of the twentieth century shows that this risk is not negligible: (15 explosions per year, 6 deaths per year and 25 injuries per year, plus the economic losses, which are not mentioned in this report).
Total 1958 to 1998
Ignition sources should be avoided
Year 28 Nº 111 third quarter 2008
Página 1 de 9Seguridad y Medio Ambiente - Nº 111

After several accidents the American authorities decided to regulate the sector. The OSHA Grain Handling Facilities Final Rule was duly published on December 31, 1987 with an effective date of March 30 1988, greatly helping thereafter to cut down the accident rate.
This same effect is expected from the European ATEX Directive
Number of explosions 616
Number of deaths 243
Number of injuries 1.018
Annual means.
1958 to 1987 1988 to 1998
Number of explosions 15.7 13.2
Number of deaths 7.3 2.3
Number of injuries 29.1 13.2
92/99, which has been implemented into Spanish law as Real Decreto 681/2003.
This successful example will doubtless be convincing proof that regulation works and is necessary. On this assumption we will now analyse the phenomenon of fire, since any improvement depends on a proper understanding of the risk involved.
What exactly is fire?
Fire is an oxidation reaction in which a combustible product, the fuel, is oxidised by another product called the oxidant or combustion agent. This reaction is started with the input of activation energy and the effects of this exothermic reaction are heat, radiation or flames and the emission of subproducts in the form of gasses and solid particles or smoke.
Combustion is therefore the reaction in which the fuel and combustion agent are not mixed, so the continued feeding of oxidant into the fuel will make it burn more or less constantly. This will allow constant oxidation that will last for as long as the fuel exists or until there is no more oxidant input.
For example, a burner of a stove or a household:
A fire is an uncontrolled combustion and an explosion is a very rapid fire, therefore a very quickly spreading uncontrolled combustion.
We are now going to look at the various types of explosions:
Deflagrations, subsonic combustion, i.e. one in which the pressure front generated by the oxidation travels at less than the speed of sound (340 m/s). Such an explosion is characterised by the fact that “the pressure front goes ahead of the flame front”.
Detonation is a supersonic explosion with devastating consequences due to the sheer speed and pressure built up. This type of explosion is habitual in explosives and in conducted deflagrations accelerated to detonation, as in piped gasses. Here “the pressure and flame front travel together”.
After analysing what an explosion is, our next concern is to
Flameless Venting Device
Página 2 de 9Seguridad y Medio Ambiente - Nº 111
establish the borderline between a combustion and adeflagration. To do so we first need to be clear about what a combustion consists of and the difference between this and adeflagration.
For a deflagration to take place the fuel and combustion agent must be mixed and there must be a necessary activation input to kick off the oxidation reaction. After the flash point the reaction spreads quickly to the rest of the “explosive mixture”; the immediate consequence of this propagation is the release of energy in heat form; this in turn increases the volume of heat-receiving gasses, which are then responsible for the expansion wave or blast. The first consequence of this is that the traditional extinguishing systems do not have enough time to check this rapid advance and are hence useless: so quickly does the reaction spread to neighbouring zones that there is no time for extinguishing it.
If a deflagration occurs inside a container of any sort there is then a danger of an explosion due to the increase of internal pressure. The hazardousness will depend on the volume of the container and the pressure it can withstand.
In sum, therefore, a deflagration releases heat and builds uppressure inside a container, causing irreversible damage.
A sine qua non of a deflagration, therefore, is an explosiveatmosphere or ATEX.
Where is there an ATEX?
The first thing we need to establish is whether the substances involved are flammable and, if so, where their sensitivity limits lieand how severe the explosion would be. It is essential to find out the risk involved:
In the case of a solid fuel we have to find out the followingparameters
If these substances are flammable, therefore, the next step we need to take in an industrial site is to localise the explosive atmospheres (colloquially shortened to ATEX) and prevent them from igniting or, if the ignition does in fact occur, control the generation of released energy.
An ATEX is a mixture of fuel and oxidant. The fuel may be in the form of gas, vapour, dust or fibres and the oxidant is usually the oxygen in the air.
Neither should we forget that the ATEX generation may betemporary or accidental; here is where the ATEX zoningclassification comes in; this classification needs to be thorough but without overdoing it. For example, an industrial building ten metres high should not be classified as ATEX zone 22 on the grounds that there is or might be flammable dust on the floor, for the direct consequence of this is that its lighting and electricity system would have to be category 3D, meaning that it could berepaired in the future only by an authorised installer. Such overzealous zoning would hence lead to an unnecessary and
IGNITION SENSITIVITY EXPLOSION SEVERITY
MIT-Layer
MIT-Cloud
MEC
MIE
Pmax
Kmax
LOC
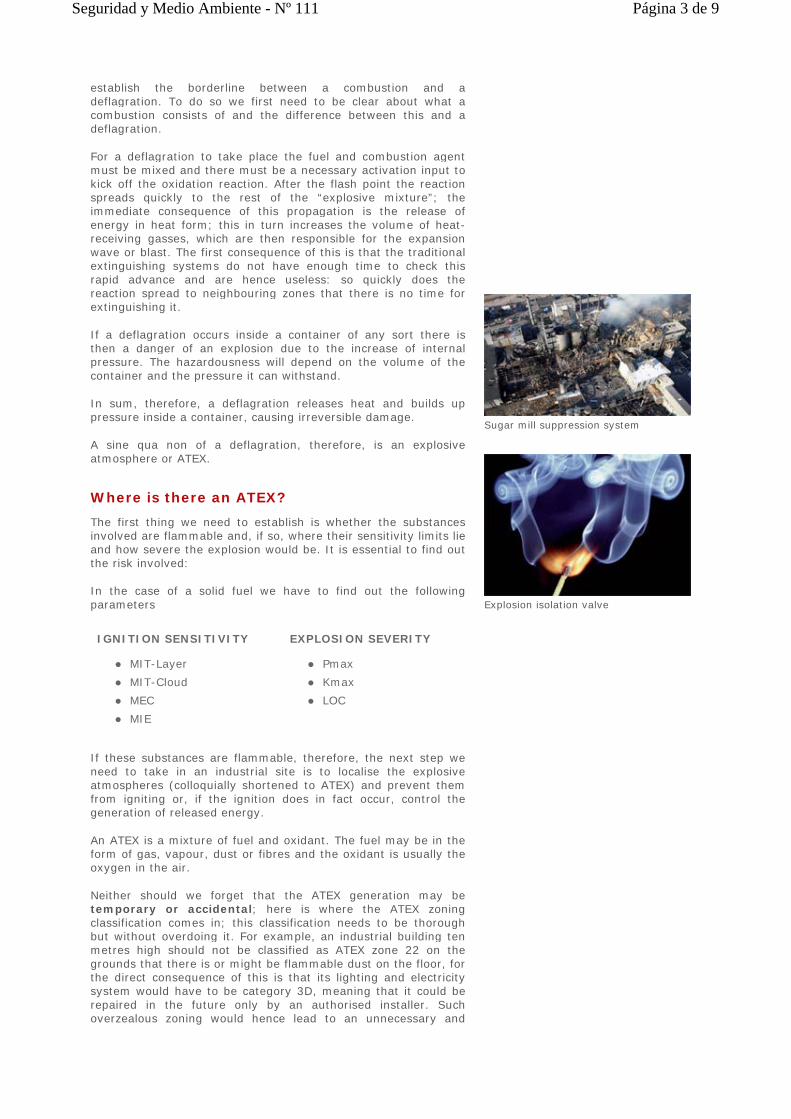
Sugar mill suppression system
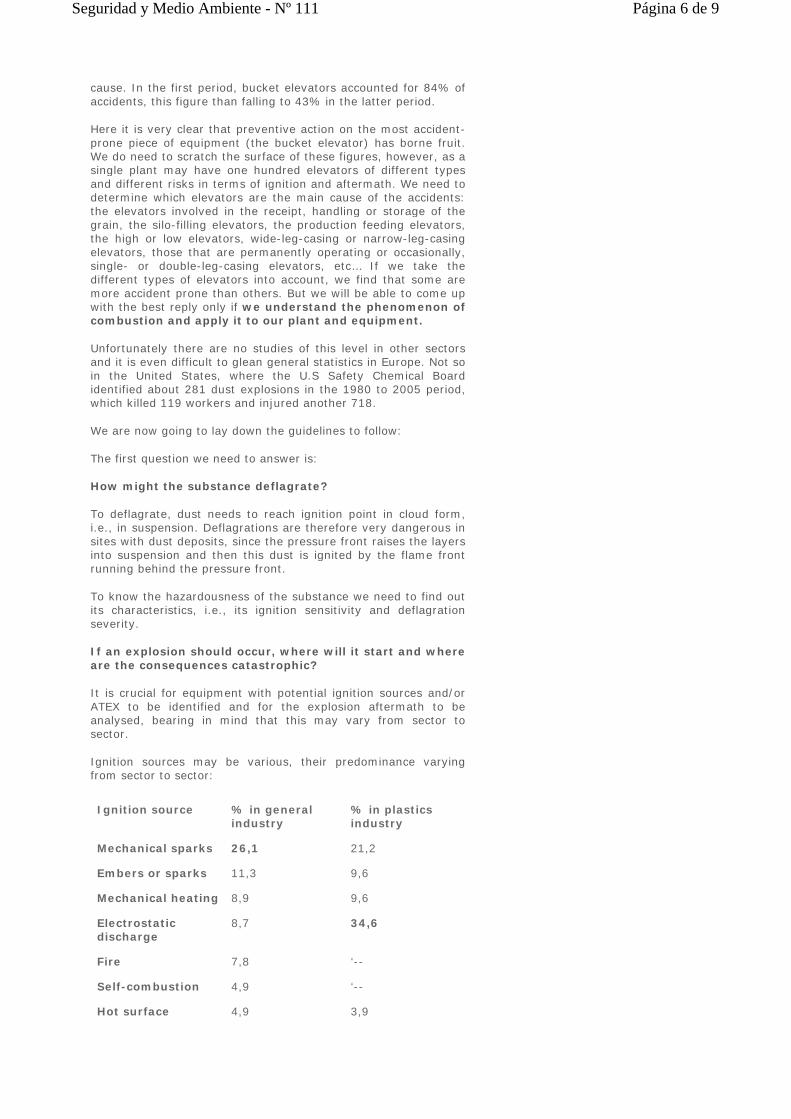
Explosion isolation valve
Página 3 de 9Seguridad y Medio Ambiente - Nº 111

avoidable surcharge for the user concerned.
After identifying the ATEX risk we need to take the ignitionprevention measures to suit this explosive atmosphere. The typical measure is to remove the ignition sources by bringing thesite’s equipment into line with the identified ATEX zone andestablishing safe working methods.
The first measure to be taken by the entrepreneur is the training and awareness raising of his/her workers, since this single measure will slash the hazardousness drastically.
If not already in place, a work permit system should be set up, with special stress on heat work (cutting and welding).
No one allows fireworks to be set off on his/her site but they doallow a blowpipe or abrasive-disc sander to be used:
The next step is to find out all the ignition source prevention techniques and ascertain which are applicable to our particular process. For example, if we wish to prevent sparks of a mechanical origin, a very efficient measure might be a turning-speed limit, or a magnet in a mill inlet might prevent the entrance of nails, etc.
Thus, to control the ignition sources we need to see where wehave permanent explosive atmospheres and establish whether they are a hazard to people if the explosion actually occurs.
To control the damaging aftermath of an explosion there are two types of techniques: passive and active.
Passive techniques consist of the control of pressure build-up by fitting relieving devices such as explosion venting panels andexplosion doors. We also need to lead the flames towards a safe area; if the equipment is indoors we also need to lead them outside or set up gas venting with flame arrestor.
Explosion venting calls for a given surface area. For calculation purposes there is the standard UNE EN 14491 for dust and UNE EN 14994 for gasses. These standards allow us to size anddetermine the safety gap. The area depends on the substance in question (its explosiveness), on the container resistance, its geometry and volume, on whether or not the venting is ducted and the length and shape of this duct. There is software for rapid and trustworthy calculation of these variables (such asLPGVENT).
The explosion venting techniques have to take into account the flame and pressure safety gaps, which depend on the volume and pressure of the container.
Active techniques involve controlling the emission of energy, i.e., halting the deflagration process. This is achieved by means of explosion suppression systems, calling for an optical or pressure detection system and suppression containers, which very quickly release an extinguishing agent in the environment, checking the advance of the explosion.
In industrial processes it is very important to isolate theexplosion to head off the dreaded secondary explosions, which could cause more site damage. This isolation could be chemical or mechanical, one or the other being used to suit the characteristics of each site.
It is hence very important to prevent explosions and protect people and plant from their effects. Nonetheless, no protection system is complete unless we bear in mind the fact that an explosion might spark off a fire in a given area or, conversely,
Página 4 de 9Seguridad y Medio Ambiente - Nº 111

that a fire in an ATEX zone might produce an explosion.
After we have established the presence of an ATEX, ascertained the likelihood of its formation and found out the existing prevention and protection techniques, the main question beggedis then the following.
When should I protect myself and when not?
The answer is “it depends”. But on what? On the likelihood of the coexistence of effective ignition sources and an ATEX.
There are two concepts here:
COEXISTENCE: For example, if we have to weld a petrol tank the first thing we have to do is remove the ATEX from the tank, so that, after being cleaned and inerted, it can be safely welded. There will then be no coexistence of ignition source and ATEX.
EFFECTIVE Ignition Source: If a solid has a very high minimum ignition energy (MIE) of over 1 Joule, we can rule out the possibility of ignition by an electrostatic discharge. Conversely, the vapours of a flammable liquid have an ignition energy of less than one milijoule and static electricity therefore becomes an effective ignition source.
The great doubt is whether we can be sure about the coexistence of an ignition source and an ATEX:
Here is where we have to take a decision. In some cases it is crystal clear and in other cases fuzzier. Here is where thecompany’s experience comes into its own, i.e., the incidents suffered in the plant and/or in the sector.
For example, returning to the study of dust explosions in the US grain industry we find two critical points: the mills and the bucket elevators. The elevators have been analysed because of the veryserious consequences of any explosion, since any explosion in an elevator would probably spread to a silo and then to the wholefactory.
An analysis of the above figures shows that there has been areduction of cases since US legislation on the matter came into force. A comparison of the periods 1978-1982 and 1993-1997 shows that explosions fell by 71%, injuries by 91% and deaths by 95%, the bucket elevator being by far the biggest explosion
Of the total of explosions produced
STATISTIC 1978-1982
1983-1987
1988-1992
1993-1997
Explosions 25 18 11 14
Injuries 50 19 7 11
Deaths 20 3 2 1
The cause is the bucket elevator
STATISTIC 1978-1982
1983-1987
1988-1992
1993-1997
Explosions 21 12 8 6
Injuries 47 10 7 4
Deaths 19 2 2 1
Página 5 de 9Seguridad y Medio Ambiente - Nº 111
cause. In the first period, bucket elevators accounted for 84% of accidents, this figure than falling to 43% in the latter period.
Here it is very clear that preventive action on the most accident-prone piece of equipment (the bucket elevator) has borne fruit. We do need to scratch the surface of these figures, however, as a single plant may have one hundred elevators of different types and different risks in terms of ignition and aftermath. We need todetermine which elevators are the main cause of the accidents: the elevators involved in the receipt, handling or storage of the grain, the silo-filling elevators, the production feeding elevators,the high or low elevators, wide-leg-casing or narrow-leg-casing elevators, those that are permanently operating or occasionally, single- or double-leg-casing elevators, etc… If we take thedifferent types of elevators into account, we find that some are more accident prone than others. But we will be able to come up with the best reply only if we understand the phenomenon of combustion and apply it to our plant and equipment.
Unfortunately there are no studies of this level in other sectors and it is even difficult to glean general statistics in Europe. Not so in the United States, where the U.S Safety Chemical Board identified about 281 dust explosions in the 1980 to 2005 period, which killed 119 workers and injured another 718.
We are now going to lay down the guidelines to follow:
The first question we need to answer is:
How might the substance deflagrate?
To deflagrate, dust needs to reach ignition point in cloud form, i.e., in suspension. Deflagrations are therefore very dangerous in sites with dust deposits, since the pressure front raises the layers into suspension and then this dust is ignited by the flame front running behind the pressure front.
To know the hazardousness of the substance we need to find out its characteristics, i.e., its ignition sensitivity and deflagration severity.
If an explosion should occur, where will it start and where are the consequences catastrophic?
It is crucial for equipment with potential ignition sources and/orATEX to be identified and for the explosion aftermath to be analysed, bearing in mind that this may vary from sector to sector.
Ignition sources may be various, their predominance varying from sector to sector:
Ignition source % in general industry
% in plastics industry
Mechanical sparks 26,1 21,2
Embers or sparks 11,3 9,6
Mechanical heating 8,9 9,6
Electrostatic discharge
8,7 34,6
Fire 7,8 ‘--
Self-combustion 4,9 ‘--
Hot surface 4,9 3,9
Página 6 de 9Seguridad y Medio Ambiente - Nº 111
Welding and heat work
4,9 ‘--
Electrical equipment
2,8 ‘--
Unknown 16,0 11,5
Others 3,5 9,6
Source (4), The equipment to be protected would vary from sector to sector
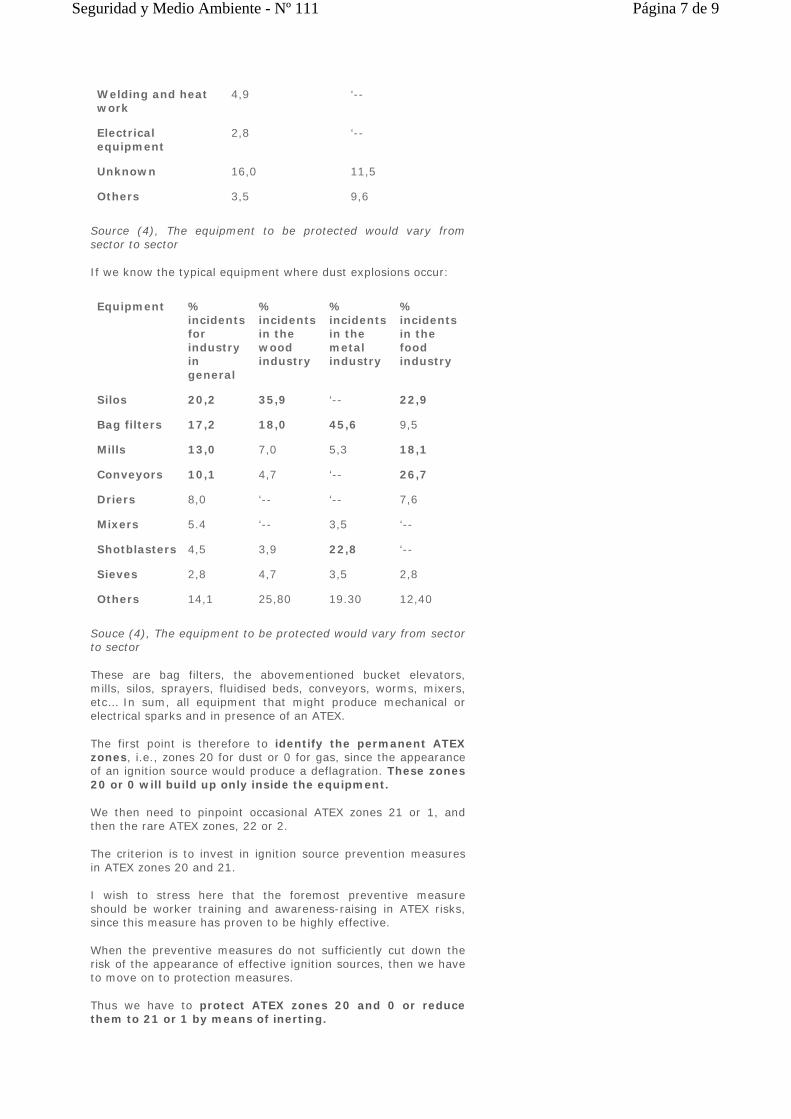
If we know the typical equipment where dust explosions occur:
Equipment % incidents for industry in general
% incidents in the wood industry
% incidents in the metal industry
% incidents in the food industry
Silos 20,2 35,9 ‘-- 22,9
Bag filters 17,2 18,0 45,6 9,5
Mills 13,0 7,0 5,3 18,1
Conveyors 10,1 4,7 ‘-- 26,7
Driers 8,0 ‘-- ‘-- 7,6
Mixers 5.4 ‘-- 3,5 ‘--
Shotblasters 4,5 3,9 22,8 ‘--
Sieves 2,8 4,7 3,5 2,8
Others 14,1 25,80 19.30 12,40
Souce (4), The equipment to be protected would vary from sector to sector
These are bag filters, the abovementioned bucket elevators, mills, silos, sprayers, fluidised beds, conveyors, worms, mixers, etc… In sum, all equipment that might produce mechanical or electrical sparks and in presence of an ATEX.
The first point is therefore to identify the permanent ATEX zones, i.e., zones 20 for dust or 0 for gas, since the appearance of an ignition source would produce a deflagration. These zones 20 or 0 will build up only inside the equipment.
We then need to pinpoint occasional ATEX zones 21 or 1, and then the rare ATEX zones, 22 or 2.
The criterion is to invest in ignition source prevention measures in ATEX zones 20 and 21.
I wish to stress here that the foremost preventive measure should be worker training and awareness-raising in ATEX risks, since this measure has proven to be highly effective.
When the preventive measures do not sufficiently cut down the risk of the appearance of effective ignition sources, then we have to move on to protection measures.
Thus we have to protect ATEX zones 20 and 0 or reduce them to 21 or 1 by means of inerting.
Página 7 de 9Seguridad y Medio Ambiente - Nº 111

In a nutshell:
The following examples will help to illustrate all the above:
1. Let us take the example of a grain processing plant (for example a flour mill): this will have several elevators, many mills,several sieves, many silos, several filters. Where do we start? At the very beginning, with the wheat:
Where does it come from? Do I have it under control? If it comes directly from the wheatfield with iron grit and foreign bodies, then the wheat-reception hopper elevator will have to be isolated against explosions, since we can never be sure that the wheat might not one day come intermingled with “something else”.
Does the wheat come after a cleaning and dust removal process? In this case there is unlikely to be any dust in the elevator; its interior is therefore zone 21, so preventive measures should provide sufficient safety levels.
We now move onto the mills. These mill the clean wheat but, even so, there is still a separation of metal objects and foreign bodies. This should be sufficient, providing that these preventive measures are properly maintained, since the inside of a mill isusually ATEX zone 21 because it is “very full” and there is not enough room for the dust to be placed in suspension.
As for filters, the wheat-reception hopper filler might capture anember, for example a cigarette end; since there is no control over this aspect, this filter should be protected and isolated from explosions. Other hazardous filters are those that capture dust from several points, for example from various machines, since the likelihood of an ignition source rises exponentially. These should ideally be isolated and protected.
Likewise, if the filters are used for cleaning purposes, they also run the risk of picking up foreign bodies, including the forbiddencigarette ends. The protection should also be fitted outside and far from points of use since there are usually very small suction lines (DN 80 – 50) and they work under a strong vacuum. If theyare fitted far from their use points the explosion is very unlikely to be propagated to the personnel using the machine.
Silos pose a big problem if they are old, since we do not knowtheir resistance, a crucial factor in sizing the venting panels. We therefore need to work towards the prevention of ignition sources; all work should be carried out only with special workpermits, in particular if welding work is involved. Likewise we need to isolate a potential explosion of the filling mechanism, typically an elevator, which should be isolated against explosions.
As we see, the criteria are based on knowledge of how the plant and equipment works, without forgetting worker training.
2. Another very different example is coal milling. Coal, being an ore, does not come in a pure state and the accompanying grit may well spark off an explosion in the milling process. Given that the presence of this grit is inevitable, we are bound to inert the process on a continual basis. How should this be done? Ideally byusing the burner’s own combustion gases. Inerting means
ZONE Measures to be taken
0 or 20 Prevention and Protection
1 or 21 Prevention
2 or 22 Prevention and training
Página 8 de 9Seguridad y Medio Ambiente - Nº 111

reducing the oxygen percentage from the figure of 21% in the air to the 12% that serves as the limiting oxygen concentration(LOC).
In this milling process the sparks of a mechanical origin are notthe only ignition source. Another would be the self-combustion of the finely milled coal, which tends to oxidise, resulting in an “oxygen poor” environment and generating carbon monoxide (CO). Should this process-generated CO exceed the limit of 1500 ppm., we should activate emergency inerting with CO2. Another indicator of this self-combustion process is temperature increase;if this rises above 80ºC we would again activate CO2 to pre-empt the fire and/or explosion risk.
Even so the mills and bag filters of the process are protected by means of venting doors. In the event of any explosion these would relieve the initial pressure and close again, since in this case the solid is highly combustible and it is crucial to prevent outside air from entering.
In sum, we should:
Ascertain the explosiveness of the substance or substances. If there are several, we will take the most hazardous as reference.
Identify risk-prone equipment, prioritising prevention and protection in light of the probability of failure and coexistence with an ATEX.
Evaluate economically the cost of the measures taken (investment set against the safety improvement).
In view of all the above, DEFINE THE PRIORITIES.
Following these 4 steps will enable us to set up an explosion prevention and protection criterion on our site.
BIBLIOGRAPHY
1. Dust Explosions in the industrial process, Dr. Rolf K. Eckhoff.
2. Seguridad Industrial en Atmósferas explosivas, Dr. Javier García Torrent.
3. The RASE Project Dr. Richard L. Rogers.
4. Dust Explosion Prevention and protection, Geoff Lunn.
5. Prevención y Protección de explosiones de polvo en instalaciones industriales, Xavier de Gea.
6. Executive summary, Regulatory review of OSHA’S grain Handling Facilities Standard - [29 CFR 1910.272]
7. ¿Prevención o protección de explosiones de polvo? Algunos criterios. M. Coupin and Dr. B. Broeckmann
Página 9 de 9Seguridad y Medio Ambiente - Nº 111

KAURIS method for assessment and management of risk of violence at work SAFETY
In the 1990s, violence was recognized as an emerging problem in working life. In addition to Finland, attention was paid to violence at work also in the other member states of the European Union, in the U.S.A. and in many other countries. Violence threatens the health and well-being of the victim. It may result in psychological harm, injury and even death. In addition to suffering in individuals, occupational violence causes also economic losses. In Finland, research projects were launched in order to produce information on the problem and to provide tools for prevention. A KAURIS method for assessment and management of risk of violence at work was developed in connection with a research project carried out in 1997-2000 and a guidebook was published for workplaces.
By KAIJA L. SAARELA. Professor and Head of the Center for Safety Management and Engineering, Department of Industrial Management, Tampere University of Technology, Finland
According to interview surveys, about 5% of Finnish workers experience annually either physical violence or a threat of violence at work or on the way to or from work. This is about the same level as the average for the EU member states. Customers were most often a source of workplace violence (Fourth European..2007, Perkiö-Mäkelä et al. 2006, Piispa & Saarela 2000). The annual number of occupational accidents related to violence registered in the Finnish databases is about 1500. Annually, about two of the cases lead to death. Occupations with higher-than-average risk for violence at work include: health care, social service, police officers, guards, hotel and catering employees, employees in the retail trade, teachers, public transport drivers, taxi drivers, etc. Different kinds of violent situations occur at workplaces. In health care and social service conflicts can be developed with customers for various reasons, resulting in e.g. physical attack, kicking, biting, hostile behaviour or verbal threat. In the retail trade, the most hazardous situations are usually associated with robberies (Hintikka & Saarela 2005, Piispa & Saarela 2000).
In Finland, a new Occupational Safety and Health Act came into force at the beginning of the year 2003. The new Act goes actually further than the Framework Directive (89/391/EEC), especially by specifying action employers should take regarding psychosocial risks. Research on violence at work provided background information for the legislation work. The threat of violence was included in the new Act. According to section 27 (Occupational safety..2002):
“The work and working conditions in jobs entailing an evident threat of violence shall be so arranged that the threat of violence and incidents of violence are prevented as far as possible.
KAURIS method
Year 28 Nº 111 third quarter 2008
Página 1 de 4Seguridad y Medio Ambiente - Nº 111

Accordingly, appropriate safety arrangements and equipment needed for preventing or restricting violence and an opportunity to summon help shall be provided at the workplace.”
“The employer shall draw up procedural instructions for such jobs and workplaces as referred to in subsection 1. In the instructions,controlling threatening situations must be considered in advance and practices for controlling or restricting the effects of violentincidents on the employees´ safety must be presented. When necessary, the functioning of the safety arrangements and equipment must be checked.”
The aim of the present article is to provide information on the KAURIS method and to describe experiences with its implementation.
KAURIS method
The KAURIS method was developed under the guidance of theauthor in connection with a research project carried out at the Finnish Institute of Occupational Health. The Finnish Work Environment Fund supported the project. The KAURIS method isbased on a model for the assessment and management of the risk of violence at work developed in the project. The KAURIS guidebook was published in 2001 to help workplaces in theassessment and management of workplace violence. During the development process, the KAURIS material was tested in practice, and it was also reviewed by the collaboration partnersrepresenting the authorities, employers’ and employees’ organizations and other groups.
A participative approach is utilized in the implementation of the KAURIS method. A team (consisting of foreman and workers) isformed for each workplace. In addition, other personnel are involved in the improvement process. The first task of the team is to make a risk assessment by utilizing a questionnaire and a check-list provided for the purpose. The questionnaire is delivered either to the whole personnel or only to e.g. those persons working in a customer service (Isotalus & Saarela 2001, Saarela 2001).
The team makes a summary of the present situation at the workplace on the basis of the questionnaire survey, theassessment of the preparedness of the workplace made by utilizing the checklist, and other relevant material. The teamcontinues by planning measures for improving safety by utilizing the information sheets included in the KAURIS method describing technical measures, organizational measures, procedures,guidelines and training, reporting and analysis of the incidents and post-incident support for the victims. The training of thepersonnel is recommended always to be included as one measure in the improvement process. The team takes care that the measures are also implemented in practice. The effectiveness of the health and safety management system of the workplace inpreventing violent situations has to be monitored and improvements made if needed (Isotalus & Saarela 2001, Saarela 2001).
Experiences with implementation of the method
Soon after the KAURIS guidebook was published, a Finnish trading chain company contacted the researchers and expressed its interest in the implementation of the method. A pilot study funded by the company and the Finnish Work Environment Fundwas launched in 2001 and completed in 2002. Altogether twelvestores were selected for the study. The stores were divided into two groups. Group one consisted of six stores which were paid
KAURIS method
KAURIS method
Página 2 de 4Seguridad y Medio Ambiente - Nº 111
three visits from the researchers and the safety officer from the main office of the company during the improvement process, while the other six stores belonging to group two were working more independently. The team was formed in each store and all twelve teams received the KAURIS guidebook to be utilized in the improvement process.
At the end of the study, information was gathered from the stores by the researchers. Each store was asked e.g. to send a list of the measures they had implemented in practice in connection with the improvement process. In addition, a questionnaire was delivered to the personnel of the stores. According to the results, on average six measures were either implemented or in process in the stores belonging to group one, while the corresponding number in the stores of group two was five. The results of the questionnaire survey revealed positive development in both groups. 92% of the respondents from group one reported that actions had been taken in their workplace to reduce violence risk. A majority (81%) of respondents from group two also reported safety actions at their workplace. The majority (over 90%) of the respondents in both groups thought that safety had improved in their store. In addition to safety and security, also the workflow was reported to have become smoother. After the study, a decision was made in the company to start to use the KAURIS method in all of their over 300 stores.
Discussion and conclusions
The study indicated that it is possible to carry out the improvement process at a workplace by utilizing the KAURIS method. The method can be implemented by the personnel of the workplace itself. However, better results may be achieved with outside support. The measures implemented in the stores of group one receiving outside help were more versatile and the teams could complete all the phases of the improvement process, while the process was interrupted in one of the stores of group two. The fact that the KAURIS method was implemented also in the other stores of the company after the pilot study indicated that the method had been found useful. The KAURIS method provides a practical tool for responsible management. Since its development, the KAURIS method has been utilized widely by Finnish workplaces, consultants and other safety experts.
On the basis of the KAURIS method, a modification has been made for taxidrivers in a collaboration project with the Finnish Taxi Owners Federation. As a result of the project, a guidebook was published for taxidrivers in 2002. Because all the copies of the first edition had been delivered to taxidrivers, a new updated version was produced and published in 2007. At the moment, an updating process is going on related also to the KAURIS guidebook, because there are no more copies left in the bookstores. Some modifications will also be made in order to improve the applicability of the KAURIS method for different sectors. At the moment, the method is best applicable in the retail industry. The updated version will be published in the near future.
REFERENCES
1. Fourth European Working Conditions Survey 2007. European Foundation for the Improvement of Living and Working Conditions. Office for Official Publications of the European Communities, Luxembourg. Retrieved June 25, 2008 from http://www.eurofound.europa.eu/pubdocs/2006/98/en/2/ef0698en.pdf
2. Hintikka N & Saarela KL 2005. Väkivaltatyötapaturmat vuonna 2003 (Occupational accidents related to violence at
Página 3 de 4Seguridad y Medio Ambiente - Nº 111
work in 2003), Tampere, Tampereen teknillinen yliopisto, turvallisuustekniikka. Raportti 92 (in Finnish),. http://turva.me.tut.fi/julkaisut/Laitossarja
3. Isotalus N & Saarela KL 2001. KAURIS menetelmä työväkivaltariskien kartoitukseen ja hallintaan (KAURIS method for assessment and management of risk of violence at work). Työterveyslaitos & Työturvallisuuskeskus, Helsinki, 44 p + Appendices. (in Finnish)
4. Occupational Safety and Health Act, No. 738/ 2002 (unofficial translation). Retrieved March 25, 2004 from http://www.finlex.fi/pdf/saadkaan/E0020738.PDF
5. Perkiö-Mäkelä M, Hirvonen M, Elo A-L, Ervasti J, Huuhtanen, P, Kandolin I, Kauppinen K, Kauppinen T, Ketola R, Lindström K, Manninen P, Mikkola J, Reijula K, Riala R, Salminen S, Toivanen M & Viluksela M 2006. Työ ja terveys –haastattelututkimus 2006 (Work and health interview survey 2006). Taulukkoraportti, Helsinki, Työterveyslaitos (in Finnish).
6. Piispa M & Saarela KL 2000. Työväkivalta (Violence at work). Kirjassa: Paananen S (toim.) Työn vaarat 1999. Koetut työperäiset sairaudet, työtapaturmat ja työväkivaltatapaukset. Tilastokeskus, Työmarkkinat 2000:15, Helsinki, 33-45 (in Finnish)
7. Saarela KL 2001. A model for assessment and management of risk of violence at work. Proceedings of the European Conference on Workplace Violence in Europe. Eurogip, Paris, 41-44.
Página 4 de 4Seguridad y Medio Ambiente - Nº 111

Nitrogen in Europe: activities addressing the European Nitrogen Cycle ENVIRONMENT
‘Nitrogen’ is an important crosscutting theme over most of the important societal sectors and their direct and indirect influence on environmental problems for Europe: climate change, biodiversity, ecosystem health, human health, ground water pollution, etc. Different efforts have started over the last years addressing nitrogen in an integrated way. Examples of these efforts are: NinE (Nitrogen in Europe), COST Action 729, NitroEurope-IP and the recently established Task Force on Reactive Nitrogen (TFRN). Through these programs scientists and policy makers are challenged to get together and discuss the current state of the complex nitrogen problem and its future solution.
By A. BLEEKER1*, S. REIS2, C. BRITTON2, J.W. ERISMAN1 & M.A. SUTTON2. (1) Energy Research Centre of the Netherland - Unit Biomass, Coal and Environmental Research, Petten, The Netherlands (2) Centre for Ecology and Hydrology, Penicuik, United Kingdom * corresponding author: P.O. Box 1, 1755 ZG Petten, The Netherlands tel: +31 224 564130, email: [email protected]
European ecosystems are under threat from many pressures, including changes in landuse, atmospheric composition and climate. These anthropogenic disturbances lead to major changes in water and nutrient cycles. Globally, one of the most perturbed nutrient cycles is the atmospheric nitrogen cycle: it has been estimated that the present nitrogen cycle is perturbed to more than 80%, whereas the carbon cycle is by comparison perturbed by less than 10%. Intensified agriculture and combustion of fossil fuels increase the amounts of reactive nitrogen, and these compounds will, when released to the environment, have a cascade of effects to human health and ecosystems. Agricultural activities release ammonia (NH3), nitrous oxide (N2O) and nitric
oxide (NO) to the atmosphere, while nitrate (NO3-) and
ammonium (NH4+) are released to aquatic systems. Fossil fuel
combustion from stationary and mobile sources is well known to emit nitrogen monoxide (NO) and nitrogen dioxide (NO2) (collectively termed NOx). Equipment installed in order to reduce emissions of nitrogen oxides e.g. catalytic converters in cars cause emissions of small but significant amounts of NH3 and N2O.
The main drivers of change in the European nitrogen budget are the anthropogenic fixation of nitrogen by agriculture, leading to releases of NH3, N2O, NO and NO3
-, the import of nutrients from other parts in the world through concentrates, food, and high temperature combustion processes, which oxidize a fraction of the atmospheric N2 to NOx. The presence of excess N in these reactive forms leads to an extremely wide range of environmental
Nitrogen in Europe: activities addressing the European Nitrogen Cycle
NO and NO2 react with volatile organic compounds (VOCs) to produce enhanced ground level ozone (O3) concentrations
The nitrogen cascade may be illustrated by the fate of nitrogen excreted by
Year 28 Nº 111 third quarter 2008
Página 1 de 8Seguridad y Medio Ambiente - Nº 111
problems:
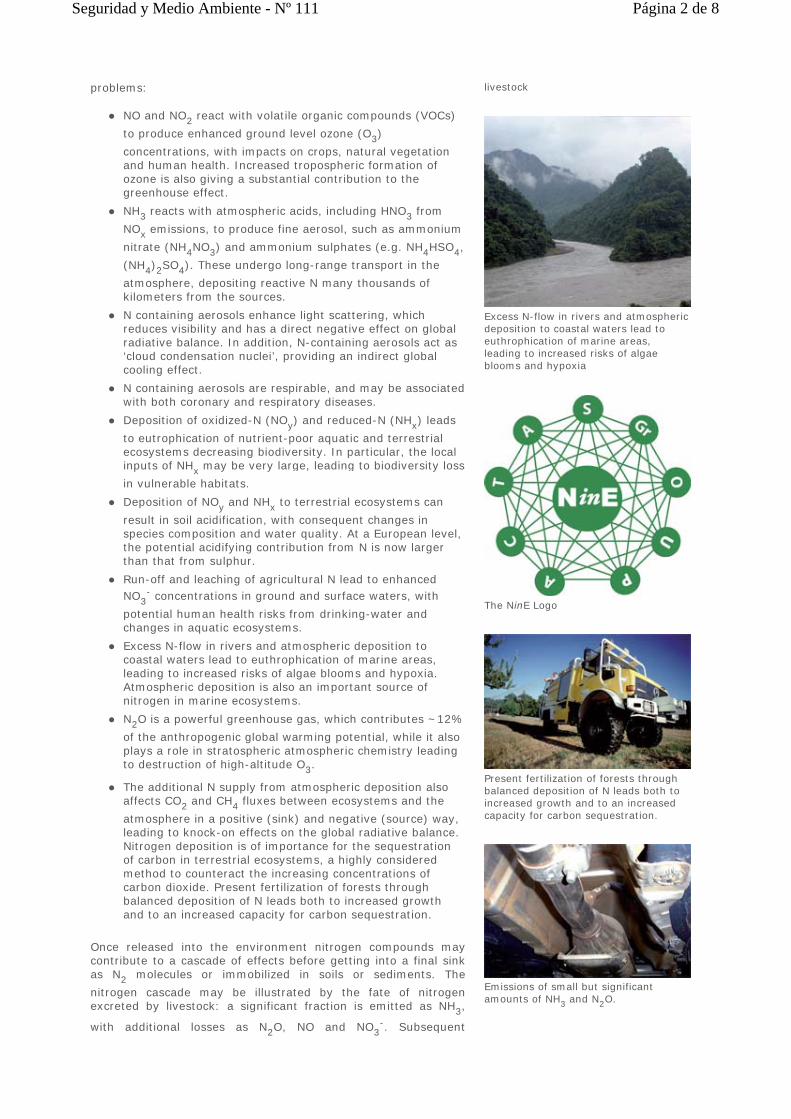
NO and NO2 react with volatile organic compounds (VOCs) to produce enhanced ground level ozone (O3) concentrations, with impacts on crops, natural vegetation and human health. Increased tropospheric formation of ozone is also giving a substantial contribution to the greenhouse effect.
NH3 reacts with atmospheric acids, including HNO3 from NOx emissions, to produce fine aerosol, such as ammonium nitrate (NH4NO3) and ammonium sulphates (e.g. NH4HSO4, (NH4)2SO4). These undergo long-range transport in the atmosphere, depositing reactive N many thousands of kilometers from the sources.
N containing aerosols enhance light scattering, which reduces visibility and has a direct negative effect on global radiative balance. In addition, N-containing aerosols act as ‘cloud condensation nuclei’, providing an indirect global cooling effect.
N containing aerosols are respirable, and may be associated with both coronary and respiratory diseases.
Deposition of oxidized-N (NOy) and reduced-N (NHx) leads to eutrophication of nutrient-poor aquatic and terrestrial ecosystems decreasing biodiversity. In particular, the local inputs of NHx may be very large, leading to biodiversity loss in vulnerable habitats.
Deposition of NOy and NHx to terrestrial ecosystems can result in soil acidification, with consequent changes in species composition and water quality. At a European level, the potential acidifying contribution from N is now larger than that from sulphur.
Run-off and leaching of agricultural N lead to enhanced NO3
- concentrations in ground and surface waters, with potential human health risks from drinking-water and changes in aquatic ecosystems.
Excess N-flow in rivers and atmospheric deposition to coastal waters lead to euthrophication of marine areas, leading to increased risks of algae blooms and hypoxia. Atmospheric deposition is also an important source of nitrogen in marine ecosystems.
N2O is a powerful greenhouse gas, which contributes ~12% of the anthropogenic global warming potential, while it also plays a role in stratospheric atmospheric chemistry leading to destruction of high-altitude O3.
The additional N supply from atmospheric deposition also affects CO2 and CH4 fluxes between ecosystems and the atmosphere in a positive (sink) and negative (source) way, leading to knock-on effects on the global radiative balance. Nitrogen deposition is of importance for the sequestration of carbon in terrestrial ecosystems, a highly considered method to counteract the increasing concentrations of carbon dioxide. Present fertilization of forests through balanced deposition of N leads both to increased growth and to an increased capacity for carbon sequestration.
Once released into the environment nitrogen compounds maycontribute to a cascade of effects before getting into a final sinkas N2 molecules or immobilized in soils or sediments. The nitrogen cascade may be illustrated by the fate of nitrogenexcreted by livestock: a significant fraction is emitted as NH3,
with additional losses as N2O, NO and NO3-. Subsequent
livestock
Excess N-flow in rivers and atmospheric deposition to coastal waters lead to euthrophication of marine areas, leading to increased risks of algae blooms and hypoxia
The NinE Logo
Present fertilization of forests through balanced deposition of N leads both to increased growth and to an increased capacity for carbon sequestration.
Emissions of small but significant amounts of NH3 and N2O.
Página 2 de 8Seguridad y Medio Ambiente - Nº 111
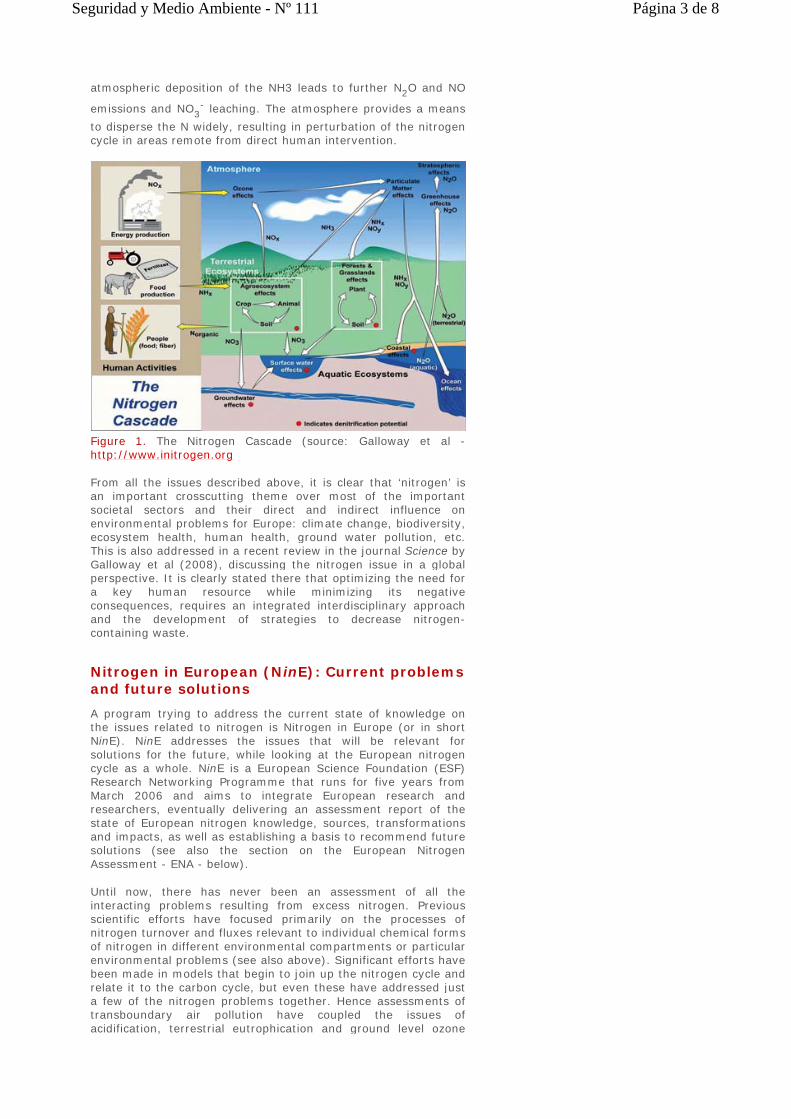
atmospheric deposition of the NH3 leads to further N2O and NO
emissions and NO3- leaching. The atmosphere provides a means
to disperse the N widely, resulting in perturbation of the nitrogen cycle in areas remote from direct human intervention.
Figure 1. The Nitrogen Cascade (source: Galloway et al -http://www.initrogen.org
From all the issues described above, it is clear that ‘nitrogen’ is an important crosscutting theme over most of the important societal sectors and their direct and indirect influence onenvironmental problems for Europe: climate change, biodiversity, ecosystem health, human health, ground water pollution, etc. This is also addressed in a recent review in the journal Science by Galloway et al (2008), discussing the nitrogen issue in a global perspective. It is clearly stated there that optimizing the need for a key human resource while minimizing its negative consequences, requires an integrated interdisciplinary approach and the development of strategies to decrease nitrogen-containing waste.
Nitrogen in European (NinE): Current problems and future solutions
A program trying to address the current state of knowledge on the issues related to nitrogen is Nitrogen in Europe (or in short NinE). NinE addresses the issues that will be relevant for solutions for the future, while looking at the European nitrogen cycle as a whole. NinE is a European Science Foundation (ESF) Research Networking Programme that runs for five years from March 2006 and aims to integrate European research and researchers, eventually delivering an assessment report of the state of European nitrogen knowledge, sources, transformations and impacts, as well as establishing a basis to recommend future solutions (see also the section on the European NitrogenAssessment - ENA - below).
Until now, there has never been an assessment of all the interacting problems resulting from excess nitrogen. Previousscientific efforts have focused primarily on the processes of nitrogen turnover and fluxes relevant to individual chemical formsof nitrogen in different environmental compartments or particularenvironmental problems (see also above). Significant efforts have been made in models that begin to join up the nitrogen cycle and relate it to the carbon cycle, but even these have addressed just a few of the nitrogen problems together. Hence assessments of transboundary air pollution have coupled the issues of acidification, terrestrial eutrophication and ground level ozone
Página 3 de 8Seguridad y Medio Ambiente - Nº 111
from nitrogen oxides and ammonia (e.g. UN-ECE Convention on Long Range Transport of Air Pollution). Current work is nowintegrating these issues with atmospheric particles and greenhouse gases, but we are still far from a fully integrated assessment for nitrogen. NinE will encourage these linkages to bemade, extending the analysis for the first time to cover all nine nitrogen problems. The NinE programme is building the European scientific network necessary to quantify these interactions and underpin the development of future solutions.
The NinE Objectives In short NinE has the following objectives (more detailed information is available via www.nine-esf.org):
To develop the underpinning science that links different forms of nitrogen. Hence detailed studies on a single nitrogen pollutant are not the first priority. Instead, the priority is for studies examining the interchange and relationships between different nitrogen pollutants as nitrogen cascades through the environment.
To develop the science linking nitrogen interactions between environmental compartments. Coupled to the above is the need for studies that link nitrogen emissions, transformations and impacts between soils, plants, air and water, and between different contexts, urban-rural, aquatic-marine, biosphere-troposhere-stratosphere etc.
To establish approaches at a range of scales, from physiological scale, patch scale, landscapes (e.g. 25 km2), regional watersheds (e.g. 10000 km2) to regions of Europe and the whole continent. Each of the scales is relevant, but the larger scales that allow explicit assessment of the nitrogen cascade are particularly relevant (landscapes to continental).
To refine methodologies for relating information between different spatial and temporal scales. It is a major scientific challenge to carry information developed at finer scales to larger scale models, while also posing a challenge for the different science communities to interact successfully.
To apply the analyses of NinE in selected case studies across Europe. These may include contrasting case-study landscapes, major watersheds and larger contrasting regions of Europe, including the comparison between source and sink areas for nitrogen.
To establish a meta-database of nitrogen research activities and assessments that integrate different nitrogen forms, interactions and scales. Such a meta-database would take the widest possible scope, including process analyses and case studies, providing access to both datasets and reports.
To prepare a major assessment report of covering the state of knowledge on interlinked problems of Nitrogen in Europe. The assessment report would be informed by the results of the scientific activity of NinE and draw extensively on the NinE meta-database.
The NinE Logo The NinE logo reflects the challenge to interlink 9 majorenvironmental problems. The 9 problems being addressed are:
Aquatic Eutrophication
Coastal & Marine Eutrophication
Terrestrial Eutrophication & Biodiversity
Acidification of soils & waters
Stratospheric chemistry & ozone
Página 4 de 8Seguridad y Medio Ambiente - Nº 111
Greenhouse gas & global warming
Ozone - vegetation & health
Urban air quality & health
Particles - health, visibility & global dimming
The logo places NinE at the centre of the transdisciplinary network, and also provides a mnemonic for the 9 problems: "ACT AS GROUP". This emphasizes the need to join our efforts in delivering a fully integrated assessment of European nitrogen problems and their future solutions.
European Nitrogen Assessment (ENA) As the major outcome of NinE, the European Nitrogen Assessment (ENA in short) will address current nitrogen issues, the cascade effects and the interactions and feedbacks. The ENA provides valuable insight for governments and other stakeholders in the balance between the benefits of fixed nitrogen to society, against the different adverse effects of excess nitrogen in the environment. Much is already known about nitrogen and its transformations in the environment. However, the complexity and extent of the interactions mean that current scientific understanding and policy making has become separated into several parallel streams.
By focusing on these separate streams, there is the danger that developing adaptation and mitigation strategies will be far from optimal. The potential for trade-offs – or pollution swapping – between the mitigation of different nitrogen forms is well established. But, a more comprehensive understanding of the nitrogen cycle is needed to maximize synergies in future strategies. A key challenge from European nitrogen activities is to synthesise science in a form that is useful to governments and society. An assessment is needed that asks the question:
How can our scientific understanding of multiple nitrogen effects help Europe develop a more integrated approach to managing nitrogen in the environment?
There is a low public understanding of the importance of excess nitrogen as a threat affecting many environmental issues. The complexity of multi-pollutant– multi-effect interactions is a major hurdle to improving public awareness. How can the scientific community better communicate the “nitrogen challenge” facing society? NinE develops the necessary synthesis between nitrogen issues, with the central task of preparing the ENA. The ENA represents a three year effort over 2008 to 2010 bringing together scientists, policy makers and other stakeholders with interests across the full range of nitrogen issues.
The ENA represents a process of scientific and policy synthesis that will provide a major review of the role of excess nitrogen on environmental problems. Based on analysis of the problems and interactions, the review will explore the potential to establish integrated solutions and better communicate the implications to society. The ENA report will have 5 major Sections, with 23 chapters. Each chapter will be written by leading international experts, comprising of Lead and Contributing Authors. Under the editorship of the Coordination Team, each chapter will be submitted to international peer review. The early chapters of the ENA report will be developed first, gradually building the understanding of integration, which will feed into development of the later chapters. The ENA process will contribute to bringing the different research and policy communities together, so that later chapters can be more synthetic across scales and issues.
The general approach is using workshops funded through NinE to develop groups of chapters. Leading international experts are invited by the Coordination Team to prepare background
Página 5 de 8Seguridad y Medio Ambiente - Nº 111
documents, which will be presented to these workshops. The workshops will be openly advertised through the ENA web portal (hosted by the NinE project - http://www.nine-esf.org). Similarly, the workshop reports will be disseminated through the ENA web portal, being open for interested parties to send comments to Lead Authors and/or the Coordination Team.
Other European initiatives
Besides NinE other nitrogen activities in Europe are running, addressing the nitrogen cycle in a more or less integrated way. The most important activities are the Task Force on Reactive Nitrogen, NitroEurope and COST Action 729. The following paragraphs will address these activities in more detail.
NitroEurope The NitroEurope EU-Integrated Project (or NEU for short) was developed specifically for addressing the prime issues of European N budgets in relation to C cycling and greenhouse gas exchange, while at the same time being aware of the interactions with other environmental issues (Sutton et al., 2007). NEU started in February 2006, runs for 5 years and coordinates the activities of 65 European partner institutes. A key point of integration is the recognition that climate change policy requires integrated assessment of Net Greenhouse gas Exchange (NGE) rather than just CO2. This is vital for future strategy development, since approaches that maximise CO2 uptake may not optimize NGE. Apart from the obvious links between N and C cycles, there is a requirement to assess overall ecosystem N budgets, since other Nr losses, e.g. NH3 emissions and leaching
of nitrate (NO3-), are considered as indirect sources of N2O
emissions under the IPCC methodology. NEU thus recognizes the need to integrate the analysis Nr and GHG at linked field-, farm- and landscape-scales, including consideration of the spatial interactions with NH3 emissions and NO3- leaching. Furthermore, Nr gases can form aerosols which affect the radiation balance of the earth. The contribution of aerosol biosphere-atmosphere exchange to N deposition and aerosol production/loss within canopies is needed to calculate Nr budgets and NGE. Similarly, interactions with ecosystem functioning and biodiversity must be considered in order to understand the observed responses of NGE to global change drivers.
NitroEurope IP addresses the major question:
What is the effect of reactive nitrogen supply on the direction and magnitude of net greenhouse gas budgets for Europe?
Key component questions related to this include:
What are the quantitative components of ecosystem N budgets and how do these respond to global change?
How much does the form of Nr (oxidized vs. reduced, wet vs. dry, agric. vs. atmos.) affect ecosystem response, N and C budgets and NGE?
What is the effect of changes in atmospheric N deposition and agricultural N inputs over recent decades on the net CO2 uptake by European ecosystems? Can we simulate the effects of land-management change on NGE at plot, landscape, regional and European scales?
Will independent measurement and modelling verify the GHG emissions officially submitted to the UNFCCC?
How can the accuracy of these inventories be improved?
To what extent would a more-integrated management of the N-cycle and its interactions with the C-cycle have
Página 6 de 8Seguridad y Medio Ambiente - Nº 111
potential to reduce GHG and Nr emissions simultaneously?
COST Action 729 The COST Action 729 ("Assessing and Managing Nitrogen Fluxes in the Atmosphere-Biosphere System in Europe") started in 2005 and aims at combining the knowledge from various research areas (e.g. NitroEurope and NinE) throughout Europe in order to provide a scientific base for an integrated approach to nitrogen management with a focus on the atmosphere-biosphere interactions. The main objective of the Action is to advance the knowledge in relation to the main economic sectors, interactions with the natural environment and current policies, in order to establish a sound scientific basis for strategies to reduce the environmental impacts of nitrogen.
Even though there is increasing knowledge on the causal chain and interactions with other cycles, the tools to assess the whole picture taking all the interactions into account is still lacking. Integrated Assessment Models (IAM) are currently addressing only part of the problems and interactions. Much more development of IAMs is necessary to be able to do a complete assessment and full policy support. This Action, therefore conducts scientific and technical investigations that will allow the computerized calculation by (upgraded) IAMs capable of assessing and managing nitrogen fluxes in the atmosphere-biosphere system in Europe on the relevant scales, including both terrestrial and marine contexts, under conditions of changing emissions, policy and climate/meteorology.
The Action ,focuses on
reviewing and synthesis that is needed to develop the IAM modelling approaches.
evaluation of existing model components according to recent scientific results.
comparing different model systems with regard to developing consensus to better tools.
developing better understanding the scientific flux interactions to allow scenario development, and interpretation of resulting scenarios to further inform the science – policy dialogue.
Task Force on Reactive Nitrogen Coming out of activities of e.g. NinE, NEU and COST Action 729 the Executive Body for the Convention on Long-range Transboundary Air Pollution (UNECE CLTAP) decided in 2007 to establish a Task Force on Reactive Nitrogen (TFRN).
In its Decision, the Executive Body defined the long-term goal of the TFRN as “developing technical and scientific information, and options which can be used for strategy development across the UNECE to encourage coordination of air pollution policies on nitrogen in the context of the nitrogen cycle and which may be used by other bodies outside the Convention in consideration of other control measures”;
The main functions of the Task Force are:
To plan and conduct the technical work necessary to develop a better understanding of the integrated, multi-pollutant nature of reactive nitrogen, particularly in relation to air pollution in context of the nitrogen cycle;
To plan and conduct the technical work necessary to assess emissions, transport, budgets, fluxes and effects of nitrogen;
To consider how the work of the Task Force would
Página 7 de 8Seguridad y Medio Ambiente - Nº 111

complement the work of other bodies of the Convention, in particular the Task Force on Integrated Assessment Modelling, the Task Force on Emission Inventories and Projections and the Task Force on Modelling and Mapping, as well as that of other international bodies.
Conclusions
From the paragraphs above, it is clear that 'nitrogen' is addressed in different scientific and policy arenas with an attempt to make linkages between possible nitrogen issues (in terms of sources,receptors, effects, policies). Although there is still a long way to go to understand 'nitrogen' to its full extend, the first activities in the context of NinE, NEU, COST Action 729 and TFRN are very promising. Bringing together scientist and policy makers from different fields and have them discuss a common problem is challenging, but rewarding at the same time - especially when a mutual understanding of the different problems arises from these discussions.
References
1. Galloway, J.N., Townsend, A.R., Erisman, J.W., Bekunda, M., Cai, Z., Freney, J.R., Martinelli, L.A., Seitzinger, S.P., Sutton, M.A. (2008) Transformation of the Nitrogen Cycle: Recent Trends, Questions, and Potential Solutions. Science 320, pp. 889-892.
2. Sutton M.A., E. Nemitz, J.W. Erisman, C. Beier, K. Butterbach Bahl, P. Cellier, W. de Vries, F. Cotrufo, U. Skiba, C. Di Marco, S. Jones, P. Laville, J.F. Soussana, B. Loubet, M. Twigg, D. Famulari, J. Whitehead, M.W. Gallagher, A. Neftel, C.R. Flechard, B. Herrmann, P.L. Calanca, J.K. Schjoerring, U. Daemmgen, L. Horvath, Y.S. Tang, B.A. Emmett, A. Tietema, J. Peñuelas, M. Kesik, N. Brueggemann, K. Pilegaard, T. Vesala, C.L. Campbell, J.E. Olesen, U. Dragosits, M.R. Theobald, P. Levy, D.C.Mobbs, R. Milne, N. Viovy, N. Vuichard, J.U. Smith, P. Smith, P. Bergamaschi, D. Fowler and Reis S. (2007) Challenges in quantifying biosphere-atmosphere exchange of nitrogen species. Environmental Pollution 150, 125-139.
Página 8 de 8Seguridad y Medio Ambiente - Nº 111
PSE-ARFRISOL, an energy-saving alternative in office buildings ENVIRONMENT
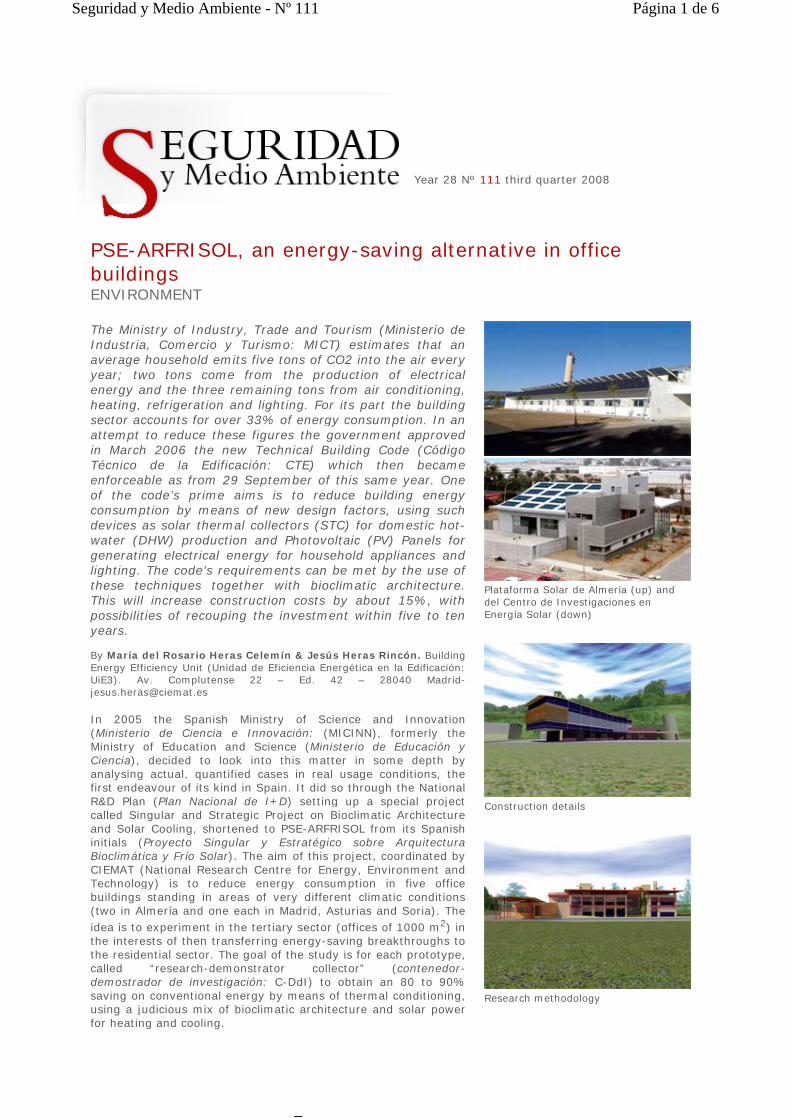
The Ministry of Industry, Trade and Tourism (Ministerio de Industria, Comercio y Turismo: MICT) estimates that an average household emits five tons of CO2 into the air every year; two tons come from the production of electrical energy and the three remaining tons from air conditioning, heating, refrigeration and lighting. For its part the building sector accounts for over 33% of energy consumption. In an attempt to reduce these figures the government approved in March 2006 the new Technical Building Code (Código Técnico de la Edificación: CTE) which then became enforceable as from 29 September of this same year. One of the code’s prime aims is to reduce building energy consumption by means of new design factors, using such devices as solar thermal collectors (STC) for domestic hot-water (DHW) production and Photovoltaic (PV) Panels for generating electrical energy for household appliances and lighting. The code’s requirements can be met by the use of these techniques together with bioclimatic architecture. This will increase construction costs by about 15%, with possibilities of recouping the investment within five to ten years.
By María del Rosario Heras Celemín & Jesús Heras Rincón. Building Energy Efficiency Unit (Unidad de Eficiencia Energética en la Edificación: UiE3). Av. Complutense 22 – Ed. 42 – 28040 Madrid- [email protected]
In 2005 the Spanish Ministry of Science and Innovation (Ministerio de Ciencia e Innovación: (MICINN), formerly the Ministry of Education and Science (Ministerio de Educación y Ciencia), decided to look into this matter in some depth by analysing actual, quantified cases in real usage conditions, the first endeavour of its kind in Spain. It did so through the National R&D Plan (Plan Nacional de I+D) setting up a special project called Singular and Strategic Project on Bioclimatic Architecture and Solar Cooling, shortened to PSE-ARFRISOL from its Spanish initials (Proyecto Singular y Estratégico sobre Arquitectura Bioclimática y Frío Solar). The aim of this project, coordinated by CIEMAT (National Research Centre for Energy, Environment and Technology) is to reduce energy consumption in five office buildings standing in areas of very different climatic conditions (two in Almería and one each in Madrid, Asturias and Soria). The idea is to experiment in the tertiary sector (offices of 1000 m2) in the interests of then transferring energy-saving breakthroughs to the residential sector. The goal of the study is for each prototype, called “research-demonstrator collector” (contenedor-demostrador de investigación: C-DdI) to obtain an 80 to 90% saving on conventional energy by means of thermal conditioning, using a judicious mix of bioclimatic architecture and solar power for heating and cooling.
Plataforma Solar de Almería (up) and del Centro de Investigaciones en Energía Solar (down)
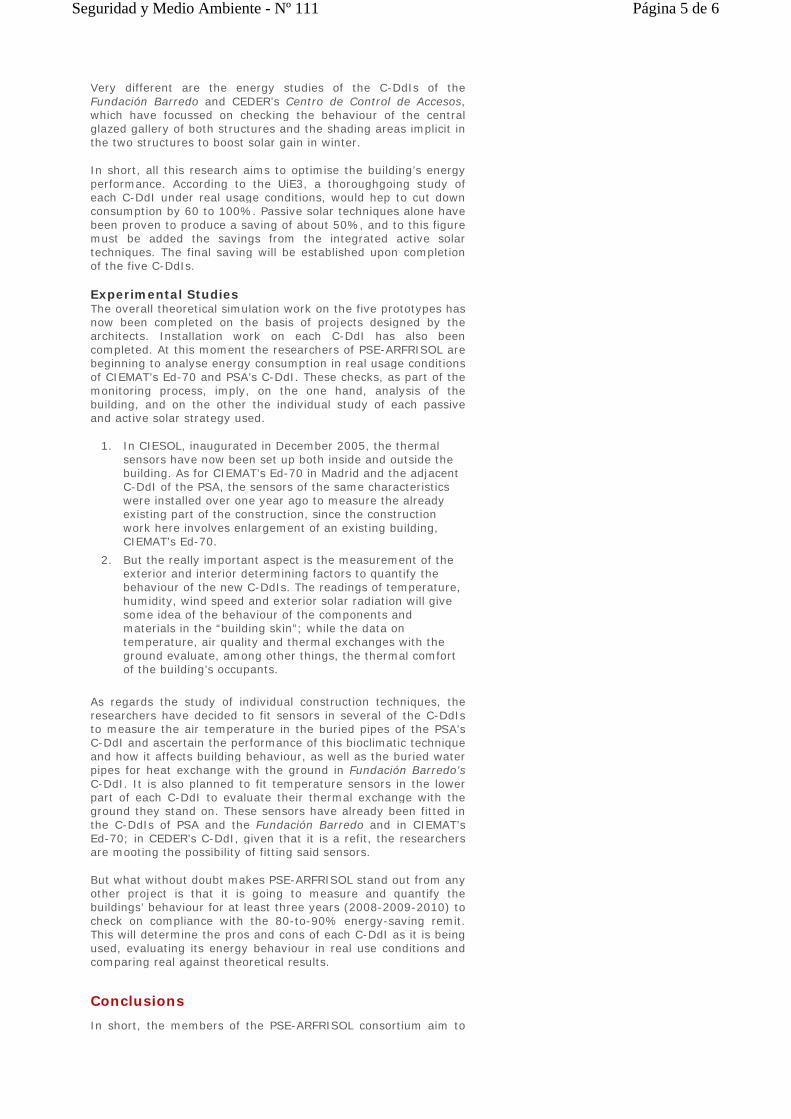
Construction details
Research methodology
Year 28 Nº 111 third quarter 2008
Página 1 de 6Seguridad y Medio Ambiente - Nº 111
_

The working scheme of PSE-ARFRISOL is broken down into nine subprojects (SP). The first focuses on previous studies or simulation and is followed by five subprojects dealing with construction work on the five C-DdIs (SP2 - SP6); another on energy assessment (SP 7), and another on the R&D development of the systems (SP 8); finally comes a subproject (SP9) to bring the whole project to wider notice and “change the mindset” of the citizens in terms of energy saving in buildings. The construction phases involve the participation of DRAGADOS, OHL, FCC Construcciones, ACCIONA and DRACE. The technological part is carried out by ATERSA, GAMESA SOLAR, UNISOLAR, ISOFOTÓN and CLIMATEWELL. Project coordination and a large part of the research work is the responsibility of CIEMAT’s Building Energy Efficiency Unit (Unidad de Eficiencia Energética en la Edificación: UiE3); scientific collaboration comes from the universities of Almería (UAL) and Oviedo (UNI OVI) and the Fundación Barredo as owner of the SP5 C-DdI. The Spanish Royal Physics Society (Real Sociedad Española de Física: RSEF) is helping to bring the project to wider notice (SP 9), together with CIEMAT, which is drawing up Teaching Units for bringing this subject to primary, secondary, baccalaureate and technology schools. The students are then assessed in diverse educative centres chosen by sampling the regions where the project is being carried out. In line with this endeavour CIEMAT’s Unidad de Eficiencia Energética en la Edificación (UiE3) is issuing documents on energy saving, showing the evaluation results of the various buildings since 1986 and the advantages of this type of buildings for raising society’s awareness and “changing the mindset” on energy consumption in the building sector. These results are being published in trade magazines, newspapers and other mass media (Radio, Television and Internet).
Construction details
In the architectural design of the five C-DdIs, consideration has been given to the various materials used in the construction, adapting them to the ruling climatic conditions and the architectural design projects of each prototype, as carried out by the five teams of architects intervening in PSE-ARFRISOL.
The first prototype, the Solar Power Research Centre (Centro de Investigaciones en Energía Solar: CIESOL), inaugurated in 2005, has been designed for the offices of the personnel of Almería University (UAL) and CIEMAT. Designed by the Almería architect Javier Torres Orozco, it was inaugurated in December 2005. Researchers from both centres are participating in the collection of data on air quality and energy behaviour. The CIESOL has been built from such materials as stone, brick and sheet steel; it has ventilated facades, thick north-facing walls and thin south-facing walls. This construction is fitted with solar thermal collectors and absorption heat pumps for transforming heat into cold; these two systems meet heating and cooling needs by means of non pollutive power sources.
Barely 40 kilometres way, also in the region of Almería, stands the C-DdI of the Almería Solar Platform (Plataforma Solar de Almería: PSA), inaugurated in December 2007 and designed by the architect Juan José Rodríguez García. The main building materials used are brick, Macael marble, reinforced concrete and cement, together with projected polyurethane enclosures. Floor tiles are compact sandstone. As a result the whole building has an eminently bioclimatic appearance. Since September 2006, the construction-work start-date, the UiE3 has been working constantly with the participating companies to improve the design of the flooring structure, the honeycombed slabs, to optimise the entrance of solar radiation in the offices and integration with the shade awnings. Important work has also been carried out on the setting up of the radiant floor for heating purposes, the buried pipes to convey temperate air to the air-conditioning plant and
Página 2 de 6Seguridad y Medio Ambiente - Nº 111

the perfect integration of the photovoltaic panels in the building’s initial structure. This project incorporates advanced bioclimatic techniques in terms of active solar equipment such as thermal solar collectors, absorption heat pumps and photovoltaic panels and also passive design elements such as solar chimneys, double shading array on the roof and cross ventilation.
A very different case is the enlargement of CIEMAT’s current Building 70 in Madrid, which has a ceramic ventilated façade and double array for supporting the thermal solar collectors and also shading the building’s main roof. This C-DdI is now finished and has been occupied since March 2008. Its official inauguration is scheduled for after the summer of 2008. The design, by the CIEMAT architect, Juan Carlos Gutiérrez García, gives precedence to ceramic materials on walls. Photovoltaic panels have been built into the windows and the side part of the main front. Thermal solar collectors supply the necessary thermal energy for heating backup and for working the absorption heat pumps that provide the “solar cooling” effect already described in the C-DdI of CIESOL.
The penultimate C-DdI is the Fundación Barredo building, standing in the Asturian locality of San Pedro de Anés, designed by the architects Emilio Miguel Mitre and Carlos Expósito Mora. Its structure (construction work began in April 2007) includes ventilated facades, glazed galleries and thermal inertia walls. Its construction material is Covadonga stone, wood and rock wool insulation, and it is designed to look like an old Asturian “horreo” or grain store. Its fittings and facilities include heat absorption machines to cope with the hottest days of summer and a low consumption biomass boiler to cope with the coldest days of winter. This C-DdI will therefore be totally renewable.
The last PSE-ARFRISOL C-DdI is the Control and Access Centre (Centro de Control y Accesos) of the Renewable Energy Development Centre (Centro de Desarrollo de Energías Renovables: CEDER) in Cubo de la Solana (Soria). This is the only C-DdI that already existed because it is in fact a refit; construction work began in September 2007 and is scheduled to end in December 2008; according to the design project, drawn up by Emilio Miguel Mitre and Carlos Expósito Mora, it has a double skin façade to shelter the inside of the building from the high temperatures of summer and the harsh winters of the area. Rock wool is used as a non-pollutive insulation material and also for covering the GRC panels. Furthermore, like the rest of the C-DdIs, it will be equipped with heat absorption machines for cooling the building by means of the “solar cooling” effect. Like the Fundación Barredo C-DdI, it will also be fitted with a low consumption biomass boiler for coping with the harsh winters of the region, instead of another conventional form of backup energy.
Research methodology, a step forwards on the strength of the CTE
That said, we now need to go even further than compliance with the CTE. As we pointed out at the start of this article, the new legislation on the use of solar power for the thermal conditioning of buildings refers only to the production of domestic hot water (DHW) and we now need to use it also for heating and cooling purposes to do full justice to the CTE’s real spirit.
The end in view now is to harness the climate, orientation and design of each particular construction to reduce energy consumption, doing so by using thermal solar collectors and absorption machines to make further progress in the study of “solar cooling”, i.e., harnessing the thermal application of solar energy, with the further backup of photovoltaic modules. Both
Página 3 de 6Seguridad y Medio Ambiente - Nº 111

the active and passive systems will be integrated into the all-embracing C-DdI project.
The researchers of PSE-ARFRISOL, in their quest for a detailedknowledge of constructions of this type, use theoretical models(simulation) and experimental models (monitoring) for gauging, assessing and quantifying each energy input or loss.
Simulation involves using mathematical models that includedescriptions of the heat- and mass-exchange processes inherent in any building (conduction, convection, radiation, infiltrations, etc). On the basis of data on climate, architectural design, passive strategies and internal energy loads (lighting, occupation, electrical appliances and air conditioning equipment, etc.), simulation enables us to predict a building’s energy behaviour (interior temperatures, heating demands, relative humidity, etc.). The only trouble is that each of these factors needs to be checked several times to gain a theoretical knowledge of a building’s future behaviour, and this could be a long-winded and laborious process.
Given the mathematical complexity of these tasks, various specialist software systems have been developed and are nowbeing used for analysing building energy use: ESP-R, DOE-2, SERI-RES, TRNSYS, ENERGYPLUS, ... etc, depending on theneeds of each case. This software, however, calls for the development of mathematical algorithms and thoroughgoingresearch into the different design strategies, which are more complex and complete than the LIDER and CALENER modelsrecommended by the CTE.
The monitoring process involves weighing up energy use on the basis of values recorded in real experience. These records includeoutside meteorological variables (solar radiation, ambient temperature, humidity, wind speed and direction) and also interior variables to ascertain energy behaviour and the thermal comfort obtained (temperature and humidity). This process begins immediately after constructing the building to measure real use conditions. In PSE-ARFRISOL this process is scheduled tolast from 2008, the year in which construction work is expectedto end, and 2010.
Energy evaluations of each C-DdI
Theoretical Studies The fruit of this theoretical research is the different energy proposals being made by the researchers of PSE-ARFRISOL and then implemented by each one of the abovementioned architectsin each C-DdI. For example, the C-DdI of the PSA placed greatemphasis on the construction of a double array containing notonly radiating panels for nighttime convective-radiative cooling but also solar collectors for heating and solar cooling (heat absorption machine) by a radiating floor; furthermore, this C-DdI has solar chimneys combined with moistening filters. These factors mean that these buildings can outperform conventionalbuildings in terms of energy saving.
The CIESOL, for its part, has studied air currents inside thebuilding, as well as temperature, wind and humidity. The result is a detailed study of cross ventilation in the C-DdI to avoid patchiness in the indoor temperature. This will help to maintain aconstant interior temperature in the building, regardless of theMediterranean climate of Almería.
In the next C-DdI, CIEMAT’s Ed-70, researchers have proposed a shading area on the building’s southern facade. This structure implements photovoltaic (PV) panels on the first and second floors to regulate the high summer temperatures in Madrid.
Página 4 de 6Seguridad y Medio Ambiente - Nº 111
Very different are the energy studies of the C-DdIs of theFundación Barredo and CEDER’s Centro de Control de Accesos,which have focussed on checking the behaviour of the central glazed gallery of both structures and the shading areas implicit inthe two structures to boost solar gain in winter.
In short, all this research aims to optimise the building’s energy performance. According to the UiE3, a thoroughgoing study ofeach C-DdI under real usage conditions, would hep to cut down consumption by 60 to 100%. Passive solar techniques alone have been proven to produce a saving of about 50%, and to this figure must be added the savings from the integrated active solar techniques. The final saving will be established upon completion of the five C-DdIs.
Experimental Studies The overall theoretical simulation work on the five prototypes has now been completed on the basis of projects designed by the architects. Installation work on each C-DdI has also been completed. At this moment the researchers of PSE-ARFRISOL are beginning to analyse energy consumption in real usage conditions of CIEMAT’s Ed-70 and PSA’s C-DdI. These checks, as part of themonitoring process, imply, on the one hand, analysis of the building, and on the other the individual study of each passiveand active solar strategy used.
1. In CIESOL, inaugurated in December 2005, the thermal sensors have now been set up both inside and outside the building. As for CIEMAT’s Ed-70 in Madrid and the adjacent C-DdI of the PSA, the sensors of the same characteristics were installed over one year ago to measure the already existing part of the construction, since the construction work here involves enlargement of an existing building, CIEMAT’s Ed-70.
2. But the really important aspect is the measurement of the exterior and interior determining factors to quantify the behaviour of the new C-DdIs. The readings of temperature, humidity, wind speed and exterior solar radiation will give some idea of the behaviour of the components and materials in the “building skin”; while the data on temperature, air quality and thermal exchanges with the ground evaluate, among other things, the thermal comfort of the building’s occupants.
As regards the study of individual construction techniques, theresearchers have decided to fit sensors in several of the C-DdIs to measure the air temperature in the buried pipes of the PSA’sC-DdI and ascertain the performance of this bioclimatic technique and how it affects building behaviour, as well as the buried water pipes for heat exchange with the ground in Fundación Barredo’sC-DdI. It is also planned to fit temperature sensors in the lowerpart of each C-DdI to evaluate their thermal exchange with the ground they stand on. These sensors have already been fitted in the C-DdIs of PSA and the Fundación Barredo and in CIEMAT’s Ed-70; in CEDER’s C-DdI, given that it is a refit, the researchers are mooting the possibility of fitting said sensors.
But what without doubt makes PSE-ARFRISOL stand out from any other project is that it is going to measure and quantify the buildings’ behaviour for at least three years (2008-2009-2010) tocheck on compliance with the 80-to-90% energy-saving remit. This will determine the pros and cons of each C-DdI as it is being used, evaluating its energy behaviour in real use conditions and comparing real against theoretical results.
Conclusions
In short, the members of the PSE-ARFRISOL consortium aim to
Página 5 de 6Seguridad y Medio Ambiente - Nº 111

fulfil five different objectives involving the following:
Five singular office buildings (research collectors-demonstrators) in terms of design, facilities and energy results quantified in real use conditions.
Energy-efficient office buildings with energy saving of between 80% and 90%, measured, analysed and quantified, as compared with current buildings.
Solar facilities and equipment: collectors, photovoltaic modules and absorption heat pumps, studied and optimised for rational energy use and marketing.
Educational modules drawn up by appropriate teaching experts and put through their paces by “sampling” in chosen educational centres.
Documents drawn up to “change the mindset” of different sectors of society with the aim of convincing end users to use heating and cooling systems, among other functions, to save energy both in summer and winter in any type of buildings, not only offices.
Acknowledgements
We would like to thank the members of the PSE-ARFRISOL consortium for their collaboration. PSE-ARFRISOL, Reference PS-120000-2005-1, is a singular scientific-technological project of a strategic character accepted by the National R&D Plan 2004-2007, co-financed by ERDF and subsidised initially by the Ministerio de Educación y Ciencia (MEC) and now by the Ministerio de Ciencia e Investigación (MICINN).
Bibliography
1. Revista Tecnoambiente. Issue 161 (2006) “PSE-ARFRISOL, un paso adelante en el ahorro de energía en edificación” Author: Heras Rincón, Jesús
2. Revista Nuevas Tecnologías. Issue 4 (2006) “PSE-ARFRISOL sinónimo de eficiencia energética en la edificación”. Author: Heras Rincón, Jesús
3. ECOCONSTRUCCIÓN. Issue 4 (2007) “PSE-ARFRISOL en Pleno desarrollo” Author: Heras Rincón, Jesús
4. El INSTALADOR. Issue June 2007 “PSE-ARFRISOL busca reducir el consumo energético en edificios de oficinas” Author: Heras Rincón, Jesús
Página 6 de 6Seguridad y Medio Ambiente - Nº 111
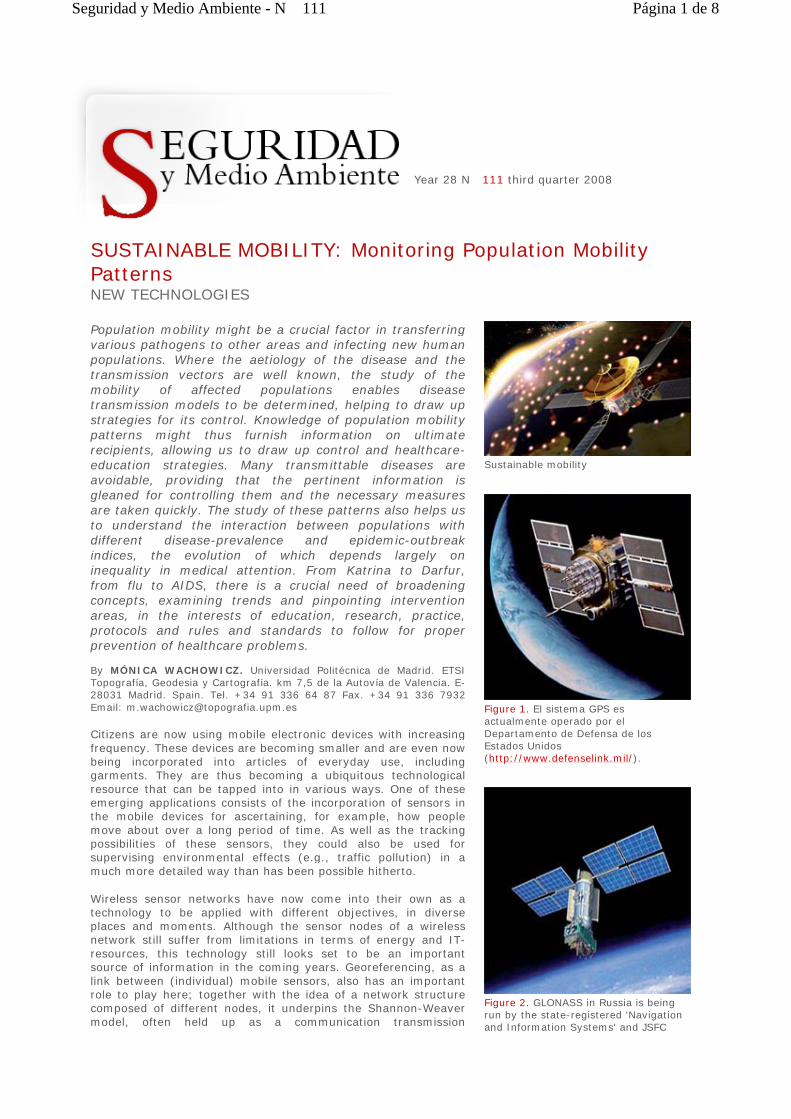
SUSTAINABLE MOBILITY: Monitoring Population Mobility Patterns NEW TECHNOLOGIES
Population mobility might be a crucial factor in transferring various pathogens to other areas and infecting new human populations. Where the aetiology of the disease and the transmission vectors are well known, the study of the mobility of affected populations enables disease transmission models to be determined, helping to draw up strategies for its control. Knowledge of population mobility patterns might thus furnish information on ultimate recipients, allowing us to draw up control and healthcare-education strategies. Many transmittable diseases are avoidable, providing that the pertinent information is gleaned for controlling them and the necessary measures are taken quickly. The study of these patterns also helps us to understand the interaction between populations with different disease-prevalence and epidemic-outbreak indices, the evolution of which depends largely on inequality in medical attention. From Katrina to Darfur, from flu to AIDS, there is a crucial need of broadening concepts, examining trends and pinpointing intervention areas, in the interests of education, research, practice, protocols and rules and standards to follow for proper prevention of healthcare problems.
By MÓNICA WACHOWICZ. Universidad Politécnica de Madrid. ETSI Topografía, Geodesia y Cartografía. km 7,5 de la Autovía de Valencia. E-28031 Madrid. Spain. Tel. +34 91 336 64 87 Fax. +34 91 336 7932 Email: [email protected]
Citizens are now using mobile electronic devices with increasing frequency. These devices are becoming smaller and are even now being incorporated into articles of everyday use, including garments. They are thus becoming a ubiquitous technological resource that can be tapped into in various ways. One of these emerging applications consists of the incorporation of sensors in the mobile devices for ascertaining, for example, how people move about over a long period of time. As well as the tracking possibilities of these sensors, they could also be used for supervising environmental effects (e.g., traffic pollution) in a much more detailed way than has been possible hitherto.
Wireless sensor networks have now come into their own as a technology to be applied with different objectives, in diverse places and moments. Although the sensor nodes of a wireless network still suffer from limitations in terms of energy and IT-resources, this technology still looks set to be an important source of information in the coming years. Georeferencing, as a link between (individual) mobile sensors, also has an important role to play here; together with the idea of a network structure composed of different nodes, it underpins the Shannon-Weaver model, often held up as a communication transmission
Sustainable mobility
Figure 1. El sistema GPS es actualmente operado por el Departamento de Defensa de los Estados Unidos (http://www.defenselink.mil/).
Figure 2. GLONASS in Russia is being run by the state-registered 'Navigation and Information Systems' and JSFC
Year 28 N� 111 third quarter 2008
Página 1 de 8Seguridad y Medio Ambiente - N� 111

benchmark. This model works from the sound assumption that more information means less uncertainty. This definition is bound up with the common idea of information acquisition, where the link between probability (entropy) and information is crucial for efficient coding and decoding within the communication transmission model.
Inertial aerospace systems like the Global Navigation Satellite System (GLONASS), the Global Positioning System (GPS) and Galileo (in the pipeline) are playing an increasingly important role, enabling us as they do to locate an object by means of a series of tracking devices that move on the surface of the earth.
The best-known tracking devices are the personal recording devices, which record the positions in which the device has been. They can then be plugged into a computer and their information uploaded to record the route the device has traced. GPS tracking in real time is also possible through a digital cellular network or by satellite. Examples of such devices might be a watch, a small GPS tracking device, a medical supervision unit or a mobile phone.
It is also possible to permanently track any vehicle by fitting it with a GPS receiver and transmitter module for sending data. A current example is the SPOT satellite messenger, consisting of a device that receives the GPS tracking data and sends them back to the satellite. The SPOT device has an alert “911” button, which, if pressed, notifies the International Emergency Response Center GEOS every five minutes until switched off. GEOS in turn contacts the local emergency provider, such as the Coastguard Service or a police department, giving the exact location of the device.
In this context, the Mercator Research Group (Grupo de Investigación Mercator) of the Universidad Politécnica de Madrid, run by professors Mónica Wachowicz and Miguel Ángel Bernabé, of the Higher Technical School of Topography, Geodesy and Cartography Engineers (Escuela Técnica Superior de Ingenieros en Topografía, Geodesia y Cartografía), are participating in the development of theories, techniques and automated systems for creating a Mobility Information Infrastructure ("Infraestructura de Conocimientos sobre Movilidad"), which supplies tools for the management and analysis of population mobility and fielding enquiries thereon. This infrastructure, the overall aim of which is to establish behaviour patterns of the people in the surrounding environment, consists of a repository for storing positioning data from thousands of tracking devices. Researchers can then access this pool of information for analysis purposes.
The goal of this data storage is the implementation of a multidimensional positioning data model adapted to online analytical processing (OLAP), facilitating the classical operations of information-analysis and -retrieval in the space-time dimensions. Examples of these operations are the retrieval of specific data on the basis of drill-down information or, conversely, the generation of roll-up information from specific data. Information of great interest on population mobility can thus be gleaned by means of statistical operations, such as the number of journeys of a given set of people, the average distance covered by them or the average, minimum and maximum speeds of these journeys.
The techniques used for analysing the data stored in the repository include the development of space-time models and geovisualization. These techniques are capable of analysing huge amounts of data, generating useful and timely information on population mobility.
Sistema (http://www.sistema.com/).
Space-Time Models
Example of personal tracking device
Geovisualization
Página 2 de 8Seguridad y Medio Ambiente - N� 111

Space-Time Models
Space-time models are necessary for creating a working framework for the information generated by the wireless sensor networks. These models guarantee universality, which depends on user appreciation, and the meaning, which takes in not onlythe wireless sensor networks but also knowledge of the specific problem domain.
For decades now the development of space-time models has been based on the use of the simplicity paradigm. Despite recognition of its complexity, the real world seemed to bestraightforward enough for producing models to simplify it,recording its essence through one-off observations. These would then be used for building up conditional scenarios of the type ‘what would happen if …?’ as help in understanding and structuring the debate [1], [2]. In fact this paradigm gradually died out due to the growing awareness of the ambiguity of cumulative scientific experiments in the development of space-time models for seeking precise responses to social, environmental and economic problems. Batty and Torrens have concluded that “…from predictions of the stock market and thegeneral performance of the economy to more local issues such as demographic change and traffic movements in cities seem beyond our understanding, not least our control, in thatextraneous events now seem to dominate their behaviour. Although this may always have been the case, the models that were fashioned a generation or more ago now seem wholly inadequate” [3].
Our research is thus based on the premise that space and time models are necessary, since they are needed for all sensory observations and are of universal application; and also that they are infinite, because space and time are not, nor can ever be, objects in themselves, since they have no borders or limits. The differences in the way in which the environment is observed or measured with wireless sensors will generate continuous images of the environment on a continuous timeline; these images will vary from individual to individual and depend on the particular purpose in view. The multidimensionality of space-time is a much more complex research matter than had previously been thought.
Our space-time model is based on the notion of multidimensionality, using three progressive space-time dimensions corresponding to three levels of space-time knowledge: the sensory, symbolic and cognitive levels. At the first level (sensorial) the understanding of the environment is inseparable from what is seen (or what is detected by thesensors), and it can be understood by focussing on specific sensory data that then become the key for modelling a differentevent (e.g. a traffic accident, a storm or urban sprawl). At the second level (symbolic) the environment is understood by dint of the interpretation of symbolic representations that do notnecessarily have a direct connection with the sensory perception, as would be the case with the wireless multisensors. Finally the third level (cognitive), a purely conceptual level, deals withhuman spatial cognition and the knowledge capacity in an explicitly space-time context. The challenge faced by ourresearch is to learn how the next generation of space-time models will be linked with these three levels of space-time knowledge or how the three levels will link up with each other.
Our space-time model has been built up by using the Web Ontology Language (OWL, for short), a spinoff from the Semantic Web that has now been endorsed by the World Wide Web Consortium [4]. One interesting feature of OWL is that it is based on a family of languages called Description Logic (DL) which furnish an inference system based on well formed semantics [5].The basic DL components are, on the one hand, the TBox or
Figure 3. Space-time cube showing pedestrian speed patterns. (Image produced by Daniel Orellana, UPM)
Figure 4. Location of sites with the highest density of pedestrians in movement during one day. (Image produced by Daniel Orellana, UPM)
Página 3 de 8Seguridad y Medio Ambiente - N� 111

terminological component, made up by concepts and functions (properties); and on the other by the ABox or assertion component, made up by particular instances of the TBox classes. The concepts are used to describe the common properties of a class of individuals and the functions are the binary relationships between these concepts. The assertions indicate an individual’s membership of a given class. Moreover, a series of language constructions, such as intersection, union and quantification, can be used to define new concepts and functions. The main reasoning tasks of the model are, firstly, classification, satisfiability and subsumption (hierarchy-based calculation of a concept), and secondly the monitoring of examples (checking that a particular instance is an example of a concept).
OWL currently has three sublanguages (also called "species"), with an increasing order of expressiveness: OWL Lite, a syntactically simpler version that can define simple hierarchies and delimitations; OWL DL permits the maximum expressiveness corresponding to description logic; and lastly, OWL Full, which permits maximum expressiveness and the syntactic liberty of RDF but without guaranteeing computational processing of all concepts. Our space-time model harnesses OWL DL for formalizing movement semantics and for automated reasoning tasks.
Geovisualization
Geovisualization is an offspring from diverse areas such as cartography, geographical information systems, image analysis and space data analysis, and bears a strong relationship to scientific information visualization and exploratory data analysis in statistics. Geovisualization also plays a key mediation role between user and computer, facilitating the data exploration task and fine-tuning their interaction. Visual approaches to data exploration frequently use sophisticated graphic techniques to unearth data structures. A typical methodology would consist of four main states: exploration, confirmation, synthesis and presentation. In this case the objective of the visual data display is to stimulate recognition of archetypes and generation of hypotheses, rather than simply displaying a result. The visual displays can help to construct knowledge, whether in provisional form (suggesting something for consideration), in analogical form (explaining something for comparison purposes) or in procedural form (defining a necessary action or set of actions for doing something).
Most of the methods can be broken down into three categories, corresponding to the theories of mental categorization, knowledge schemes and cartographic semiology. These are: identification of objects, comparison of objects and interpretation of objects. In this model the objects may be individual or object archetypes. In this case there might be variation in their size and distinction and also in how far they represent the state of things; i.e., they are static in a timeframe of particular interest. They may also exist due to an action or process (for example, local minimum values in a two-dimensional grid of sea-level pressure for cyclone detection purposes).
The identification of objects places stress on what is observed (at an abstract level) rather than what the data represent. A thoroughgoing examination is made of the distribution of data in all their dimensions in an attempt to distinguish different objects, regularities, anomalies, points of interest, etc. Geographical visualization methods are particularly useful for observing identities and abstract patterns, including concentration, sequencing, varied glyphs, changes from one space to another, time and space animations, space-time cubes and small-multiples.
Figure 5. Different flows showing the movement patterns of two groups of pedestrians. (Images produced by Estefanía Muñoz Moraga, UPM)
Figure 6. Computed region where there is a break in pedestrian movement during one day. Each CP (Check Point) shows the halts in the movement patterns.(Image produced by Søren Jepsen, UPM).
There are also LBS applications for transport, trade and process management.
Página 4 de 8Seguridad y Medio Ambiente - N� 111
Object comparison considers multiple objects or archetypes. Its aim is “… to increase the chances of an analyst’s seeing not only the object but also the relations between them” [6], relations being possible in one or more important dimensions. Localizationis the most obvious dimension, so the tools for observing spacephenomena are particularly important and the comparison could be based on the form, the degree of archetype grouping, timing correspondence or any other attribute. Geovisualization methods that facilitate object comparison include scatter plots, parallel coordinate plots, small multiples, multi-layer maps and varied colour schemes.
Finally the main goal of object interpretation is to facilitateabstract data representations, metadata, previous analyst knowledge and other sources of knowledge external to the set of data under study (e.g. digital libraries). Through these connections the behaviour of objects and the relation between them may be found to correspond in turn with the behaviour of relations between phenomena of the real world. The geovisualization methods facilitating the interpretation of space-time objects include all the abovementioned methods incombination with information visualization methods such as knowledge construction displays, verbal information, etc. Examples of the latter include cone trees [7], radar charts [8]and information spatialization [9].
The aim of our research is to develop an iterative process in which the high-level questions (conceptual) lead to specific (system) queries whose answers can be examined by the users, seeking interesting human mobility patterns. These answers may then in turn suggest new questions. This type of exploration implies the challenge of supplying the analyst with rapid,incremental and reversible operations that provoke a continuous visual reaction. A graphic user interface is also needed to reorganise the data as the process unfolds, to juxtapose objects on diverse criteria and display the relations between the properties of different objects, bearing in mind that an object may be physical (e.g. the flow of traffic) or abstract (e.g.accessibility to a certain spot) or may even be an event (e.g. pollution occurring over a particular sphere of space and time). Inpursuit of this objective, we resort to a process management combining diverse methods and their associated tools for facilitating the scientific comprehension of large sets of data,using a singular exploratory environment.
Results
Several experiments were conducted, collecting data on the movement of thousands of people in various cities of Europe. This enabled us to develop a methodology based on the synergy between diverse disciplines like transport, IT, town planning, geomatics and cartography.
On the basis of a set of apparently random movement vectors,we have risen to the challenge of building up models, images and animations to help understand the flow of movement related to daily activities, such as shopping, going to work or strolling through a park.
Breaks in the movement (e.g. halts at traffic lights or road accidents) are another factor of interest: pinpointing, deducing and predicting halt concentrations sites, i.e., places where the movement tends to come to a halt, could help to take decisionsin the ongoing quest for more sustainable urban mobility.
Privacy Aspects
The protection of privacy is of paramount importance here, since
Página 5 de 8Seguridad y Medio Ambiente - N� 111

the data sources generally contain sensitive personal information as the basis for inferring behaviour patterns and citizen habits. The positioning data also contain sensitive information on people mobility and should hence be subjected to data protection rules. European and national privacy legislation lays it down that any use of personal data has to be authorised by the individuals concerned (also called “data subjects”) by means of explicit, informed consent. It also states that it is possible to use this data without restrictions if it has previously been rendered “anonymous”. The first situation pertains to the positioning of volunteers, i.e., people who have consciously participated in an experiment. The second situation involves the development of anonymity preservation algorithms to ensure privacy of the individuals.
The results of this investigation show that it is possible nowadays to collect, store and analyse huge amounts of data on routes and model the human flow in cities. Projects like this one are guiding us towards a better understanding of people movement, enabling us to lay down the bases of more sustainable mobility and a healthier environment in the cities of the new century.
The Key Findings
A mobile device linking the real and virtual worlds could change your perception of your environment. (The Economist, May 2003).
Three key findings could be highlighted from our research of recent years:
1. The monitoring will consist of event-driven data collection models incorporating real time observations from wireless sensor networks collected at user request. Most of the monitoring processes will eschew the post-processing phase, currently a very time-consuming phase due to the fact that the raw data (e.g., orbiting satellites and in-situ observations) are collected in such a large volume and wide diversity that they would vary from one place or moment to another. There is therefore a need for event-driven data collection models to be able to incorporate information on the behaviour of people in movement and build up space-time maps of an environmental phenomenon.
2. Object tracking and surveillance of the behaviour of people, property and data will create new cultural, social and virtual scenarios that would call for the development of a continuous representation of geographical space projected on a space-time model, including events, activities and processes capable of taking contextual information in any place. It is nonetheless important to point out that any representation in continuous space inevitably poses the problem of realism. The GIS paradigm of representing an environment as different layers will no longer be applicable.
3. The privacy impact and implications, in the sense of avoiding the discovery of sensitive data explicitly (e.g. revealing the identity of the individual) and implicitly (furnishing non-sensitive data from which sensitive information could be inferred). There is a general consensus on the need of ensuring social acceptance on the strength of collective trust in solutions, services and applications on offers of transport, sustainability, space development and environmental awareness.
Fields of Application
Several types of mobile applications have been developed to meet many of society’s needs in relation to economic
Página 6 de 8Seguridad y Medio Ambiente - N� 111

development, social and cultural experience, such as the applications created from location based services (LBSs). Existing LBSs can, for example, provide tourists with applications for finding out their location, finding addresses and routes, retrieving information on the environment they currently find themselves in or leaving comments in an interactive map [10]. A travel diary could also be compiled on the basis of the location of a tourist in a given time. Some systems are also capable of telling users about interesting spots to visit or displaying enriched information in an environment of enhanced reality. There are also LBSapplications for transport, trade and process management.
The research results may be applied in studies of the environment to understand the movement patterns of dynamic entities, ranging from hurricanes and tornadoes [11] to animals [12] and planes [13]. Specialised sensors could be designed to provide information on the movement of an entity and theenvironment it is located in, including information on light levels, pollution, proximity, noise, etc., enabling a dynamic perspectiveto be built up of the environment and the interactions between itscomponents.
Other fields of application include surveillance through the use ofsensors fitted with diverse resources (e.g. photography, video, GPS trackers, etc.) for security operations. MITRE Corporation recently described a project in which it developed a strategy forvehicle identification and monitoring by security officers, with the aim of pinpointing what it calls "precursors" of dangerous situations in the air.
Agradecimientos
My thanks go to Fernando Mendoza for translating this paper into Spanish.
This research work has been funded by European FP6 through the GeoPKDD project (http://www.geopkdd.eu/).
Glossary
GEOS: International Emergency Response Center
GLONASS: Global Navigation Satellite System
GPS: Global Positioning System
JSFC Sistema: Joint Stock Financial Coorporation Sistema
OLAP: On-line Analytical Processing
OWL: Web Ontology Language
RDF: Resource Description Framework: a family of W3C specifications, originally designed as a metadata data model, which has come to be used as a general method of modelinginformation through a variety of syntax formats
SPOT: Satellite Personal Tracker
DL: Descriptive Logics
W3C: World Wide Web Consortium
Bibliography
1. Churchman, C.W. The Systems Approach, Dell Publishing
Página 7 de 8Seguridad y Medio Ambiente - N� 111

Company, New York, 1968.
2. Johnson, S. Emergence: The Connected Lives of Ants, Brains, Cities, and Software, Scribner, New York, 2001.
3. Batty, M. and Torrens, P.M. Modelling and prediction in a complex world, Futures, 2005, (37), pp. 745-766.W3C Consortium. The web ontology language. http://www.w3.org/TR/owlfeatures/, 2008.
4. F. Baader, D. Calvanese, D. L. McGuinness, D. Nardi, and P. F. Patel-Schneider. The Description Logic Handbook: Theory, Implementation, Applications. Cambridge University Press, Cambridge, UK, 2003.
5. MacEachren, A. M. How Maps Work. Guilford Press, NY, 1995. p. 401
6. Robertson, P. K. A methodology for choosing data representations. IEEE Computer Graphics and Applications, 1991, (11):13, pp. 56-62.
7. Hearnshaw, H. M. and Unwin, D. J. Visualization in Geographical Information Systems. Wiley, Chichester, England, 1994
8. Skupin, A., and B. P. Buttenfield. Spatial Metaphors for Visualizing Very Large Data Archives. Paper read at GIS/LIS '96 Annual Conference and Exposition, November 19-21, 1996 at Denver, CO.
9. Abowd, G.D. Atkeson, C.G., Hong, J., Long, S., Kooper, R. and Pinkerton, M. Cyberguide: A mobile context-aware tour guide. Wireless Networks, 3(5):421-433, October 1997.
10. Hunter, A., El-Sheimy, N., and Stengouse, G. “Close and Grizzly GPS/Camera Collar Captures Bear Doings”, GPS World, February Issue, 2005, pp 24 – 31.
11. Brunk, B., and Davis, B. SDAT enterprise: Application of geospatial network services for collaborative airspace analysis. Proceedings of the CADD/GIS Symposium, San Antonio, 2002.
Página 8 de 8Seguridad y Medio Ambiente - N� 111

www.fundacionmapfre.com