Embed Size (px)
Citation preview
Yarn Pull-Out as a Mechanism for Dissipation of Ballistic
Impact Energy in Kevlar KM-2 Fabric, Part I: Quasi-Static Characterization of Yarn Pull-Out
by Keith M. Kirkwood, John E. Kirkwood, Young Sil Lee,
Ronald G. Egres, Jr., Eric D. Wetzel, and Norman J. Wagner
ARL-CR-537 May 2004
prepared by
Department of Chemical Engineering Center for Composite Materials
University of Delaware Newark, DE
under contract
DAAD19-01-2-0001
Approved for public release; distribution is unlimited.
NOTICES
Disclaimers The findings in this report are not to be construed as an official Department of the Army position unless so designated by other authorized documents. Citation of manufacturer’s or trade names does not constitute an official endorsement or approval of the use thereof. Destroy this report when it is no longer needed. Do not return it to the originator.
Army Research Laboratory Aberdeen Proving Ground, MD 21005-5069
ARL-CR-537 May 2004
Yarn Pull-Out as a Mechanism for Dissipation of Ballistic Impact Energy in Kevlar KM-2 Fabric, Part I: Quasi-Static
Characterization of Yarn Pull-Out
Keith M. Kirkwood, John E. Kirkwood, Young Sil Lee, Ronald G. Egres, Jr., and Norman J. Wagner Department of Chemical Engineering Center for
Composite Materials, University of Delaware
Eric D. Wetzel Weapons and Materials Research Directorate, ARL
prepared by
Department of Chemical Engineering Center for Composite Materials
University of Delaware Newark, DE
under contract
DAAD19-01-2-0001
Approved for public release; distribution is unlimited.
ii
REPORT DOCUMENTATION PAGE Form Approved OMB No. 0704-0188
Public reporting burden for this collection of information is estimated to average 1 hr per response, including the time for reviewing instructions, searching existing data sources, gathering and maintaining the data needed, and completing and reviewing the collection information. Send comments regarding this burden estimate or any other aspect of this collection of information, including suggestions for reducing the burden, to Department of Defense, Washington Headquarters Services, Directorate for Information Operations and Reports (0704-0188), 1215 Jefferson Davis Highway, Suite 1204, Arlington, VA 22202-4302. Respondents should be aware that notwithstanding any other provision of law, no person shall be subject to any penalty for failing to comply with a collection of information if it does not display a currently valid OMB control number. PLEASE DO NOT RETURN YOUR FORM TO THE ABOVE ADDRESS. 1. REPORT DATE (DD-MM-YYYY)
May 2004 2. REPORT TYPE
Final 3. DATES COVERED (From - To)
January 2003–December 2003 5a. CONTRACT NUMBER
DAAD19-01-2-0001 5b. GRANT NUMBER
4. TITLE AND SUBTITLE
Yarn Pull-Out as a Mechanism for Dissipation of Ballistic Impact Energy in Kevlar KM-2 Fabric, Part I: Quasi-Static Characterization of Yarn Pull-Out
5c. PROGRAM ELEMENT NUMBER
5d. PROJECT NUMBER
5e. TASK NUMBER
6. AUTHOR(S)
Keith M. Kirkwood,* John E. Kirkwood,* Young Sil Lee,* Ronald G. Egres, Jr.,* Eric D. Wetzel, and Norman J. Wagner*
5f. WORK UNIT NUMBER
7. PERFORMING ORGANIZATION NAME(S) AND ADDRESS(ES)
U.S. Army Research Laboratory ATTN: AMSRD-ARL-WM-MA Aberdeen Proving Ground, MD 21005-5069
8. PERFORMING ORGANIZATION REPORT NUMBER
ARL-CR-537
10. SPONSOR/MONITOR'S ACRONYM(S)
9. SPONSORING/MONITORING AGENCY NAME(S) AND ADDRESS(ES)
*Department of Chemical Engineering Center for Composite Materials University of Delaware Newark, DE 19716
11. SPONSOR/MONITOR'S REPORT NUMBER(S)
12. DISTRIBUTION/AVAILABILITY STATEMENT
Approved for public release; distribution is unlimited.
13. SUPPLEMENTARY NOTES
14. ABSTRACT
Yarn pull-out can be an important energy absorption mechanism during the ballistic impact of woven Kevlar fabric. This study reports the effects of fabric length, number of yarns pulled, arrangement of yarns, and transverse tension on the force-displacement curves for yarn pull-out tests on Kevlar KM-2 fabric under laboratory conditions. A semi-empirical model is presented for predicting the yarn pull-out force and energy as a function of pull-out distance, including both yarn uncrimping and subsequent yarn translation. This model is found to replicate the experimental data to a high degree of accuracy, and should prove useful for understanding ballistic experiments and improving computational modeling of fabrics.
15. SUBJECT TERMS
Kevlar, fabric, yarn pull-out, yarn uncrimping, yarn translation, ballistic impact, energy absorption, armor
16. SECURITY CLASSIFICATION OF: 19a. NAME OF RESPONSIBLE PERSON Eric D. Wetzel
a. REPORT UNCLASSIFIED
b. ABSTRACT UNCLASSIFIED
c. THIS PAGE UNCLASSIFIED
17. LIMITATION OF ABSTRACT
UL
18. NUMBER OF PAGES
32
19b. TELEPHONE NUMBER (Include area code) 410-278-0851
Standard Form 298 (Rev. 8/98) Prescribed by ANSI Std. Z39.18
iii
Contents
List of Figures iv
List of Tables v
Acknowledgments vi
1. Introduction 1
2. Experimental 2
2.1 Kevlar Fabric...................................................................................................................2
2.2 Yarn Pull-Out ..................................................................................................................2 3. Results 4
3.1 Qualitative Description of Yarn Pull-Out .......................................................................4
3.2 Single Yarn Pull-Out .......................................................................................................6
3.3 Multiple Yarn Pull-Out .................................................................................................10
3.4 Effect of Pull-Out Pattern..............................................................................................10
3.5 Yarn Translation............................................................................................................12 4. Model Formulation 13
4.1 Uncrimping of a Single Yarn ........................................................................................13
4.2 Uncrimping of Multiple Yarns ......................................................................................15
4.3 Yarn Translation............................................................................................................15
4.4 Energy of Yarn Pull-Out ...............................................................................................15
4.5 Model Evaluation ..........................................................................................................16 5. Discussion 18
5.1 Effect of Sample Length and Width..............................................................................18
5.2 Effect of Tension ...........................................................................................................18
5.3 Effect of Number of Yarns Pulled and Pull-Out Pattern...............................................18 6. Conclusions 19
7. References 20
List of Abbreviations and Symbols 22
Distribution List 23
iv
List of Figures
Figure 1. Schematic of experimental setup for yarn pull-out tests. ................................................3 Figure 2. Photograph of experimental setup for yarn pull-out tests. ..............................................3 Figure 3. Schematic of fabric behavior during yarn pull-out..........................................................5 Figure 4. Representative yarn pull-out force-displacement curve (L = 10.16 cm, T = 100 N,
and N = 1) and definition of peak load point, yarn uncrimping, and yarn translation...............5 Figure 5. Photograph of Kevlar fabric showing visual appearance of virgin, loaded, and
pulled yarns................................................................................................................................6 Figure 6. Peak load as a function of preload tension. .....................................................................7 Figure 7. Peak load as a function of sample length. Data points indicate measured values;
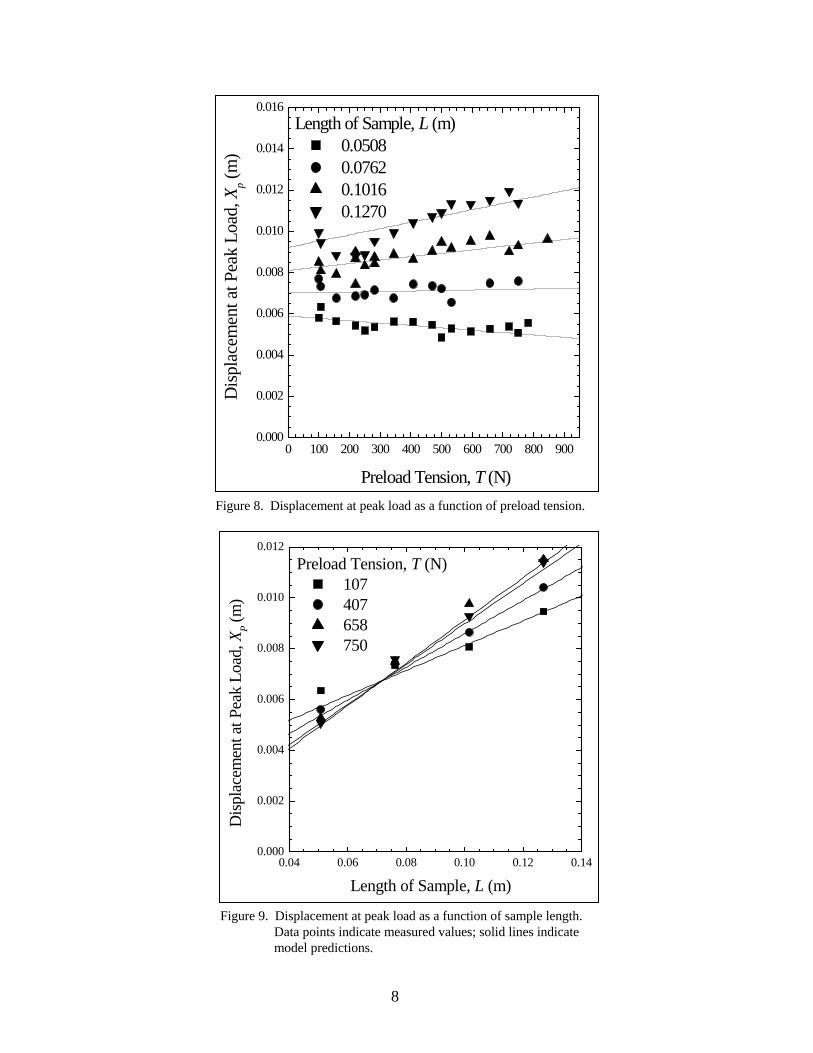
solid lines indicate model predictions........................................................................................7 Figure 8. Displacement at peak load as a function of preload tension. ..........................................8 Figure 9. Displacement at peak load as a function of sample length. Data points indicate
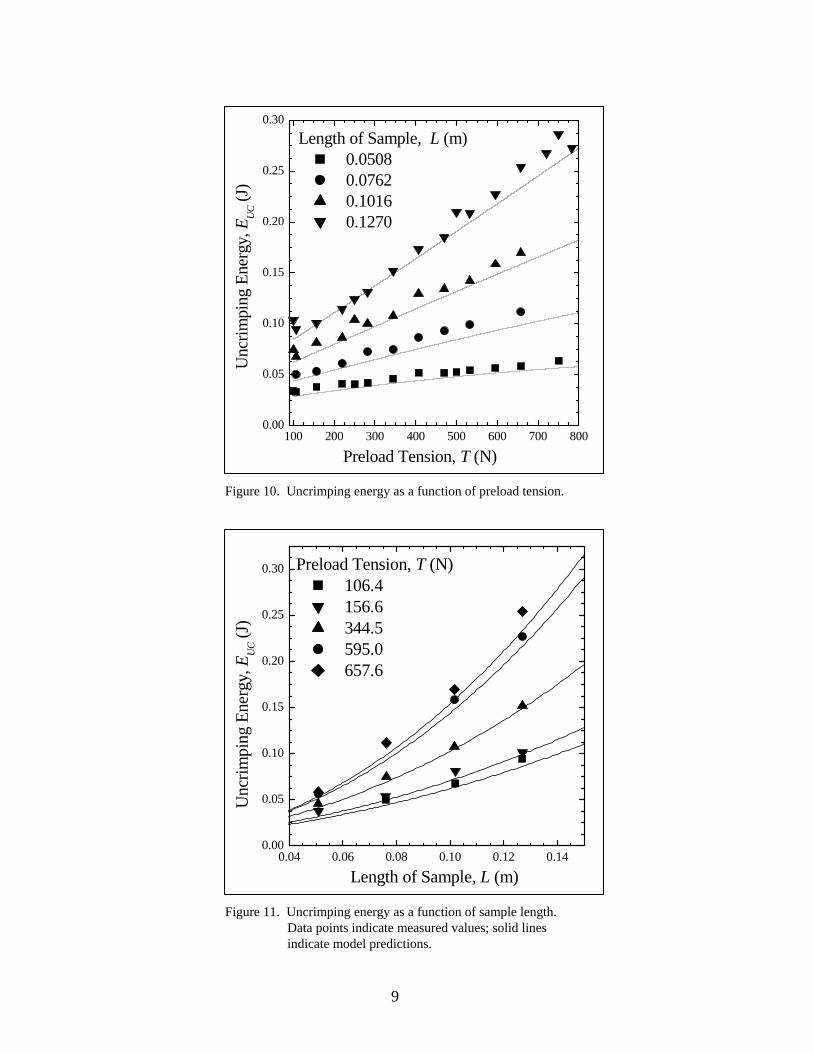
measured values; solid lines indicate model predictions. ..........................................................8 Figure 10. Uncrimping energy as a function of preload tension.....................................................9 Figure 11. Uncrimping energy as a function of sample length. Data points indicate
measured values; solid lines indicate model predictions. ..........................................................9 Figure 12. Normalized peak load and displacement at peak load as a function of number of
yarns pulled. Normalization is performed by dividing the measured peak load and displacement values for N yarns by the model predictions of peak load and displacement, respectively, for a single yarn pull. Data points indicate measured values; solid lines indicate model predictions. ......................................................................................................10
Figure 13. Normalized uncrimping energy as a function of number of yarns pulled. Normalization is performed by dividing the measured pull-out energy for N yarns by the model predictions of pull-out energy for a single yarn pull. Data points indicate measured values; solid lines indicate model predictions. ........................................................11
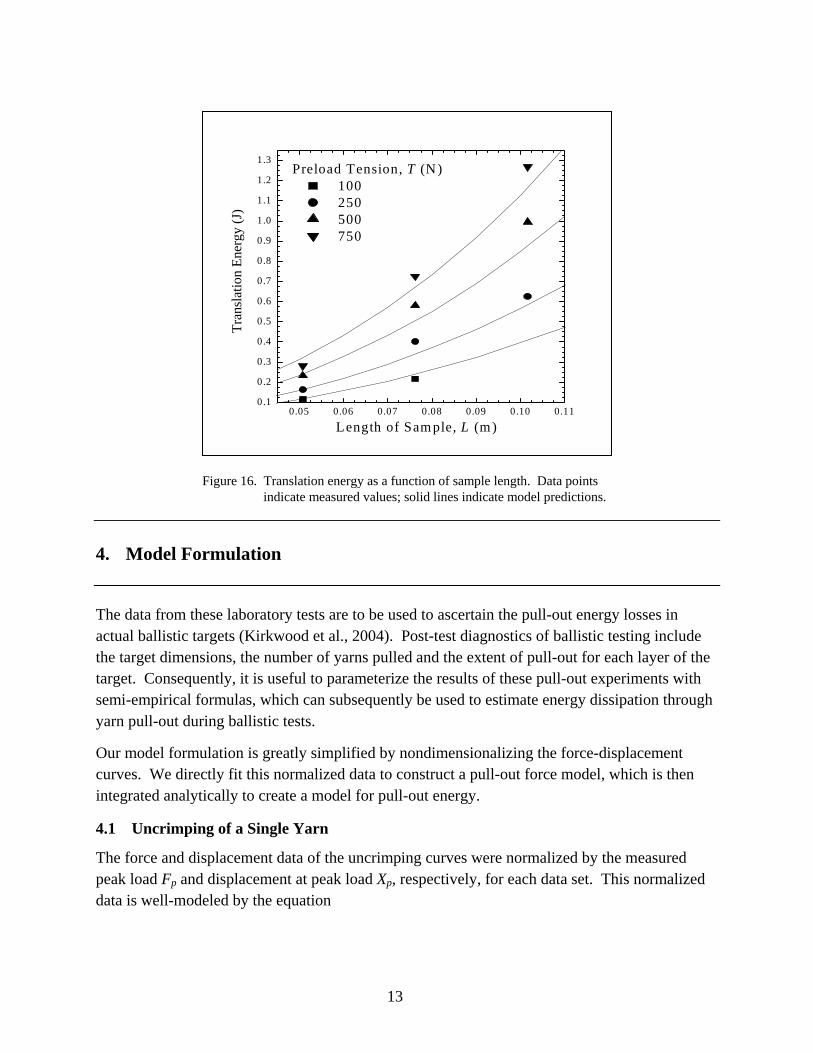
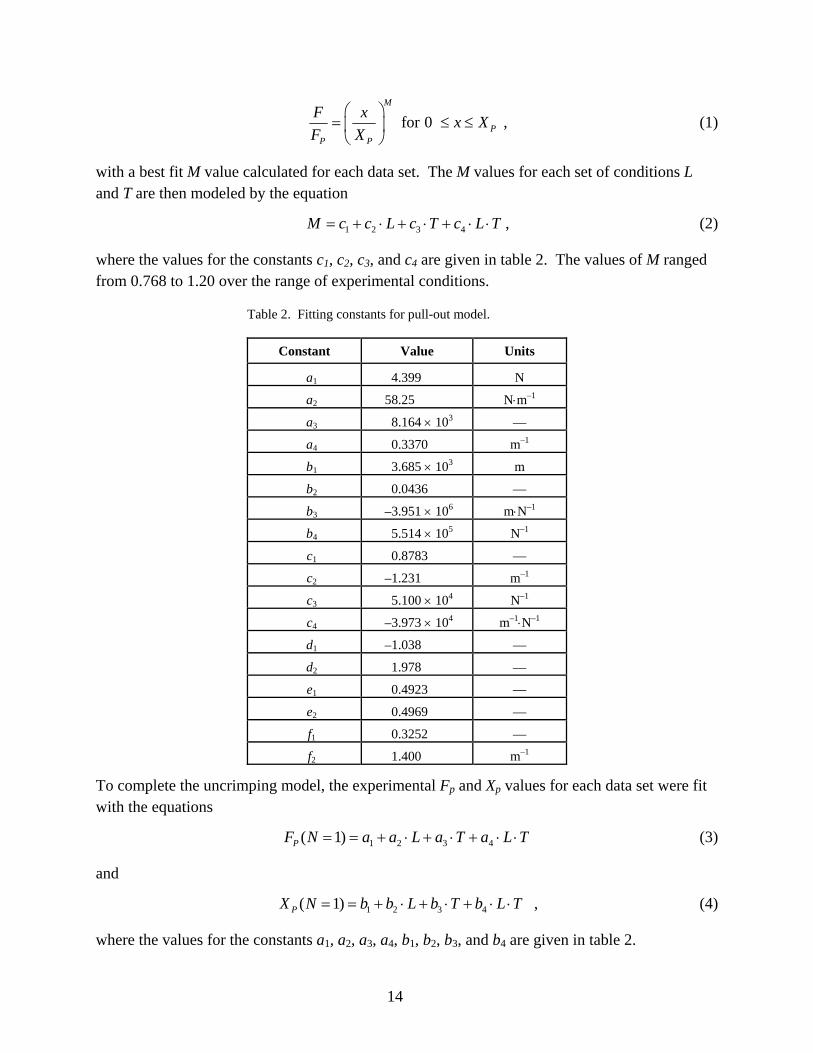
Figure 14. Schematic of a “101” pull pattern. ..............................................................................11 Figure 15. Translation energy as a function of preload tension....................................................12 Figure 16. Translation energy as a function of sample length. Data points indicate measured
values, solid lines indicate model predictions..........................................................................13 Figure 17. Comparison of measured and predicted force-displacement and energy-
displacement curves for L = 10.16 cm, N = 1, and T = 250 N. The goodness of fit for the force-displacement curve is R2 = 0.973. ..................................................................................16
Figure 18. Comparison of measured and predicted pull-out curves, transformed according to equations 11 and 12, for the full range of experimental conditions tested. .............................17

v
List of Tables
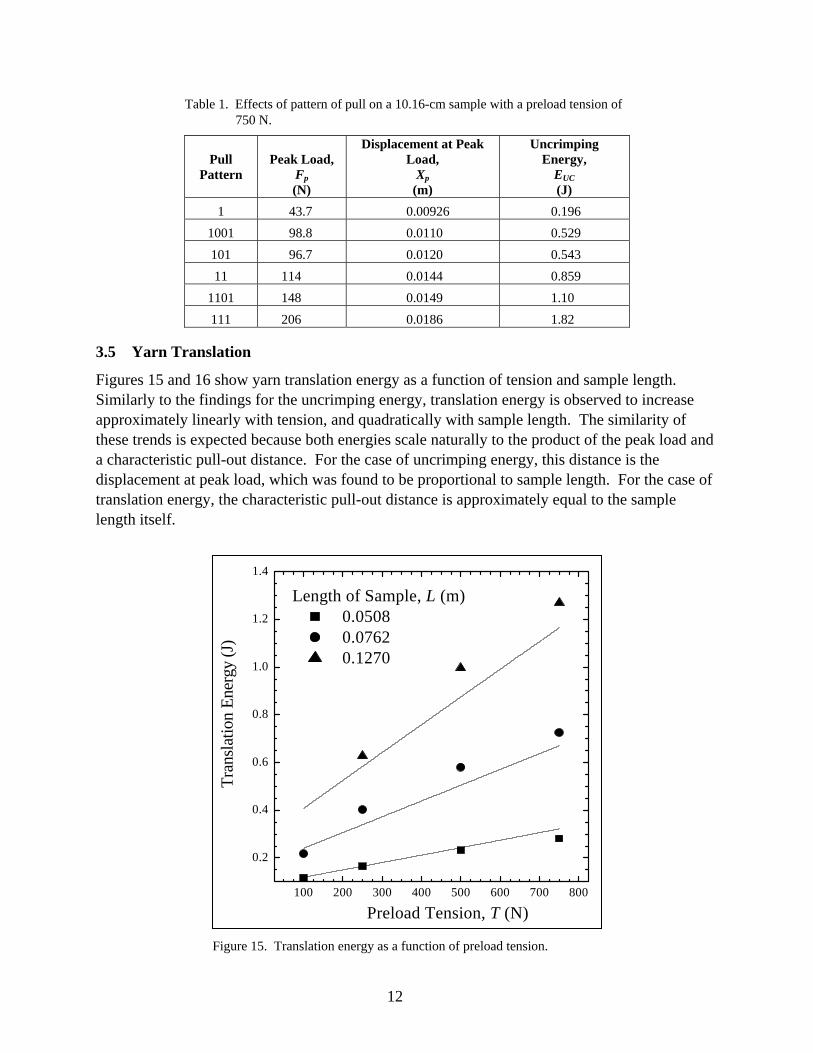
Table 1. Effects of pattern of pull on a 10.16-cm sample with a preload tension of 750 N. ........12 Table 2. Fitting constants for pull-out model................................................................................14
vi
Acknowledgments
This work has been supported through the U.S. Army Research Laboratory Composite Materials Research Program (Grant No. 33-21-3144-71) and through the Center for Composite Materials at the University of Delaware. The authors would like to thank Hexcel Schwebel for donating the Kevlar fabric used in the experiments.
1
1. Introduction
Flexible woven fabrics are used for ballistic protection in body armor. These fabrics defeat the projectile through a combination of mechanisms, including yarn uncrimping, yarn stretching, yarn breakage, and yarn pull-out from the fabric (Carr, 1999; Jacob and Van Dingenen, 2001). The mechanisms that dominate a particular ballistic event depend on a number of factors, including the fabric material and architecture (i.e., weave style, density, and yarn count), as well as the projectile size, shape, and velocity (Cheeseman and Bogetti, 2003; Park and Jang, 2000; Roylance et al., 1973). However, the precise relationship between these mechanisms and the ballistic performance of fabrics is not fully understood.
Yarn pull-out from woven Kevlar∗ fabrics is of particular interest. Kevlar fabric is the most widely used body armor material. Our own studies (Lee et al., 2003) and those of others (Briscoe and Motamedi, 1992; Dischler et al., 1998) have shown that modifications to the frictional properties of the fabric can greatly alter, and often enhance, the ballistic performance of the fabric. Therefore, studying the mechanism of yarn pull-out is an important first step toward understanding the role of yarn pull-out friction in fabrics, and eventually engineering frictional properties to enhance their ballistic performance.
In this report, force-vs.-displacement curves are measured on yarns as they are pulled out of a rectangular piece of Kevlar KM-2 fabric preloaded in tension in the direction transverse to that of the yarn being pulled (Shockey et al., 2001). The yarn pull-out experiments are performed at strain rates much lower than those experienced during a ballistic event. However, by conducting yarn pull-out experiments at low velocities, we are able to perform a more comprehensive and systematic study of the pull-out process than would be feasible through ballistic experimentation. In a subsequent report (Kirkwood et al., 2004) we will show that these quasi-static pull-out results can be correlated quantitatively with yarn pull-out during ballistic impact of fabrics.
Early yarn pull-out experiments include those of Sebastian et al. (1986, 1987) and Motamedi et al. (1989), who studied yarn pull-out from plain-woven cotton fabrics. For these low-modulus fabrics, the yarn pull-out response is largely governed by elastic deformations in the pulled yarn and cross-yarns. Martinez et al. (1993) studied the force required to completely pull-out a single yarn from Kevlar fabrics held in place by static weights loaded over the full area of the fabric. They found that pull-out force increased as fabric yarn count increased. Bazhenov (1997) performed yarn pull-out tests with Armos† aramid fabrics of various yarn counts and deniers. The experiments utilized a fabric holding fixture that clamped the bottom edge of the fabric, while leaving the transverse edges of the fabric unconstrained. Bazhenov found that the
∗Kevlar is a registered trademark of DuPont. †Armos is a registered trademark of Kamenskvolokno JSC.
2
maximum pull-out force increased linearly with increasing sample length. The uncrimping portion of the curve was also observed to be linear with yarn displacement. Shockey et al. (2001) devised an improved pull-out test by clamping the fabric along its transverse edges. This design greatly simplifies testing, as a series of pull-out experiments can be performed without repositioning the grips at the edges of the fabric. Additionally, this arrangement allows for a variable transverse tension to be applied to the fabric, which may more realistically simulate the pull-out process during a ballistic event. Experiments were performed on a wide range of fabric architectures and fiber types, including Kevlar K29, Spectra,* and Zylon.† The study found that the pull-out forces strongly depend on the transverse preload and yarn count.
In this study, a systematic investigation of yarn pull-out is performed on 180 g/m2 (600-denier) Kevlar KM-2 fabric, using a device similar to that employed by Shockey et al. (2001). The effects of fabric size, transverse tension, and multiple yarn pull-outs are investigated. By focusing on one particular fabric type, we are able to generate a more comprehensive set of pull-out data than that reported by Shockey et al. (2001). Additionally, an empirical model has been generated which, over the range of conditions investigated, replicates the pull-out data to a high degree of accuracy. This model is used in a subsequent paper (Kirkwood et al., 2004) to correlate ballistic results with pull-out damage in Kevlar fabric.
2. Experimental
2.1 Kevlar Fabric
The Kevlar fabric used is plain-woven Hexcel Aramid Style 706 (Kevlar KM-2, 600 denier), a high-performance fabric intended for ballistic protection applications. This fabric has 13.386 yarns per cm (warp and weft) and an areal density of 180 g/m2.
2.2 Yarn Pull-Out
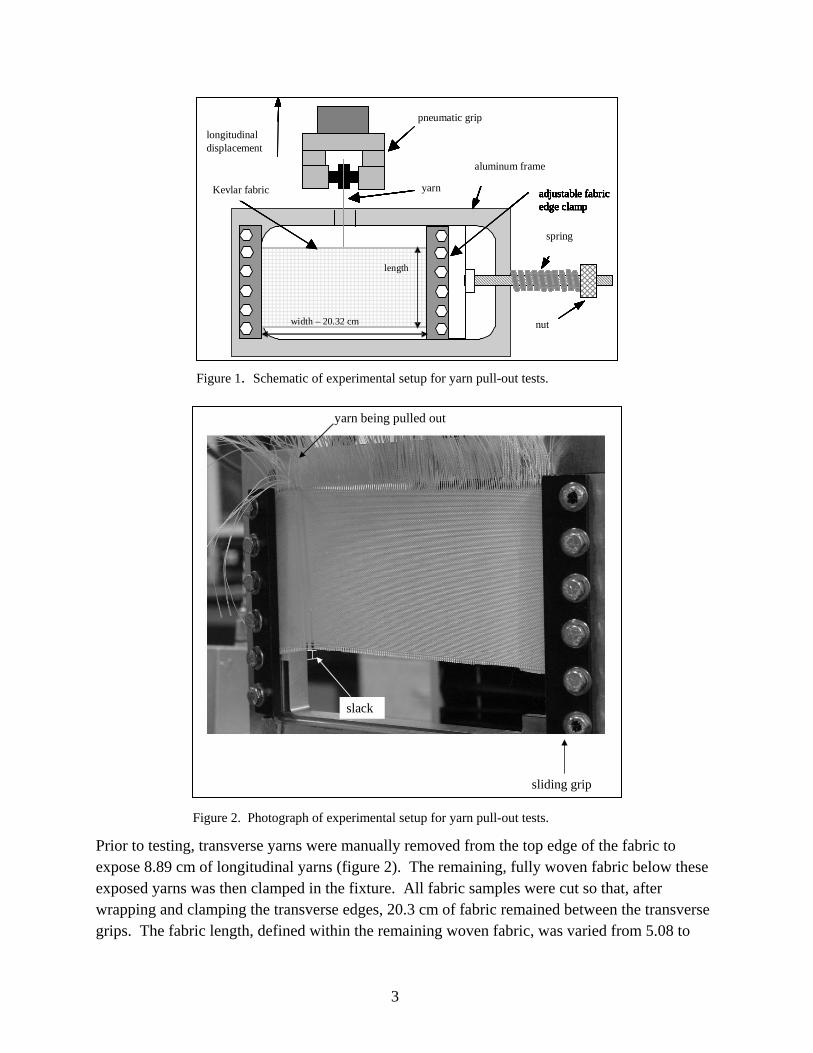
An Instron model 4206 universal testing machine with a 1-kN load cell was used for all yarn pull-out experiments. A crosshead speed of 50 mm/min was used for all tests; variations in crosshead speeds between 0.5 and 508 mm/min did not show quantitative differences. An edge-clamped fabric holding fixture (figures 1 and 2, adapted from Shockey et al. [2001]) serves as the bottom grip, and a pneumatic grip at 90 psi is used to clamp the individual yarn undergoing pull-out. Transverse tension is applied to the fabric through a spring-mounted sliding edge clamp, with the precise tension value set by compressing the spring to a set distance through a fine thread nut. Note that in all testing reported here, the reported tension is the entire transverse load on the fabric, and not a per-yarn tension. The clamping of the fabric edges is accomplished through a combination of wrapping and pinching, as described in detail by Shockey et al. (2001). The top and bottom edges of the fabric are unconstrained during testing.
*Spectra is a registered trademark of Honeywell. †Zylon is a registered trademark of Toybo.
3
Figure 1. Schematic of experimental setup for yarn pull-out tests.
Figure 2. Photograph of experimental setup for yarn pull-out tests.
Prior to testing, transverse yarns were manually removed from the top edge of the fabric to expose 8.89 cm of longitudinal yarns (figure 2). The remaining, fully woven fabric below these exposed yarns was then clamped in the fixture. All fabric samples were cut so that, after wrapping and clamping the transverse edges, 20.3 cm of fabric remained between the transverse grips. The fabric length, defined within the remaining woven fabric, was varied from 5.08 to
yarn being pulled out
sliding grip
slack
nut
yarn
pneumatic griplongitudinal displacement
spring
Kevlar fabric
Aluminum frame
adjustable fabric edge clamp
nut
yarn
nut
yarn
pneumatic griplongitudinal displacement
spring
Kevlar fabric
Aluminum frame
adjustable fabric edge clamp
nut
yarn
pneumatic griplongitudinal displacement
spring
Kevlar fabric
Aluminum frame
adjustable fabric edge clamp
width – 20.32 cm
length
nut
yarn
pneumatic griplongitudinal displacement
spring
Kevlar fabric
Aluminum frame
adjustable fabric edge clamp
width – 20.32 cm
length
nut
yarn
pneumatic griplongitudinal displacement
spring
Kevlar fabric
Aluminum frame
adjustable fabric edge clamp
nut
yarn
pneumatic griplongitudinal displacement
spring
Kevlar fabric
aluminum frame
adjustable fabric edge clamp
width –
pneumatic griplongitudinal displacement
spring
Kevlar fabric
aluminum frame
adjustable fabric edge clamp
width – 20.32 cm
length
4
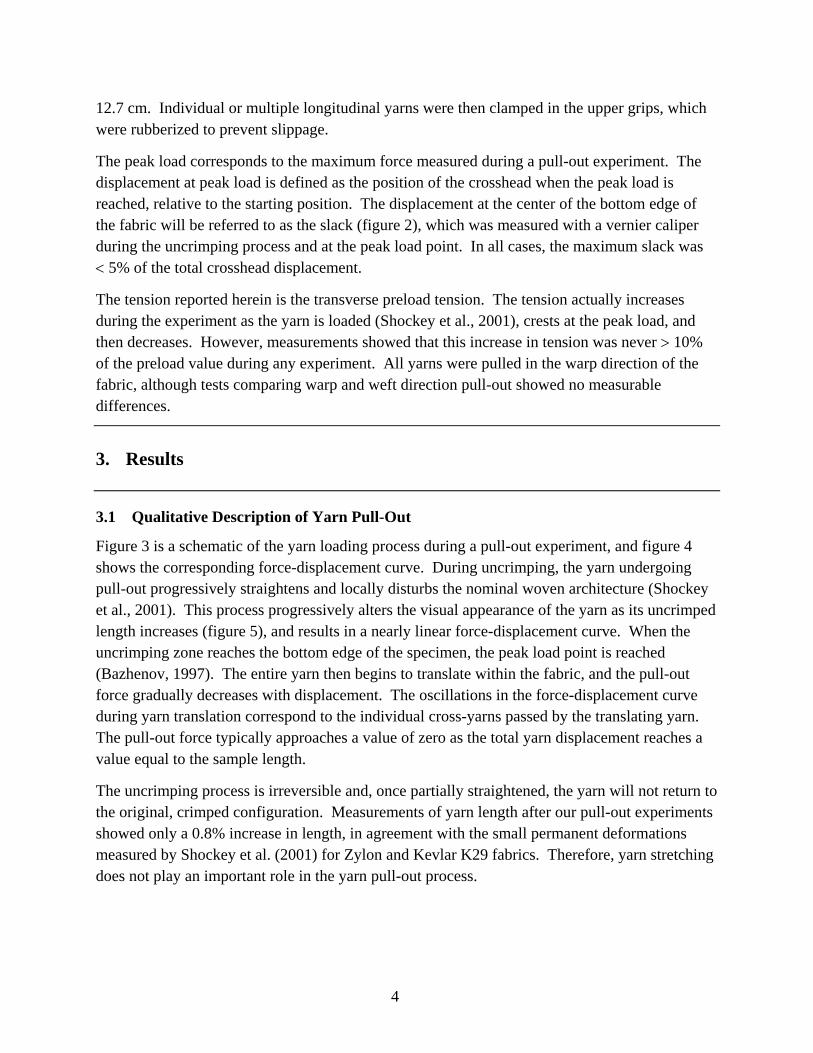
12.7 cm. Individual or multiple longitudinal yarns were then clamped in the upper grips, which were rubberized to prevent slippage.
The peak load corresponds to the maximum force measured during a pull-out experiment. The displacement at peak load is defined as the position of the crosshead when the peak load is reached, relative to the starting position. The displacement at the center of the bottom edge of the fabric will be referred to as the slack (figure 2), which was measured with a vernier caliper during the uncrimping process and at the peak load point. In all cases, the maximum slack was < 5% of the total crosshead displacement.
The tension reported herein is the transverse preload tension. The tension actually increases during the experiment as the yarn is loaded (Shockey et al., 2001), crests at the peak load, and then decreases. However, measurements showed that this increase in tension was never > 10% of the preload value during any experiment. All yarns were pulled in the warp direction of the fabric, although tests comparing warp and weft direction pull-out showed no measurable differences.
3. Results
3.1 Qualitative Description of Yarn Pull-Out
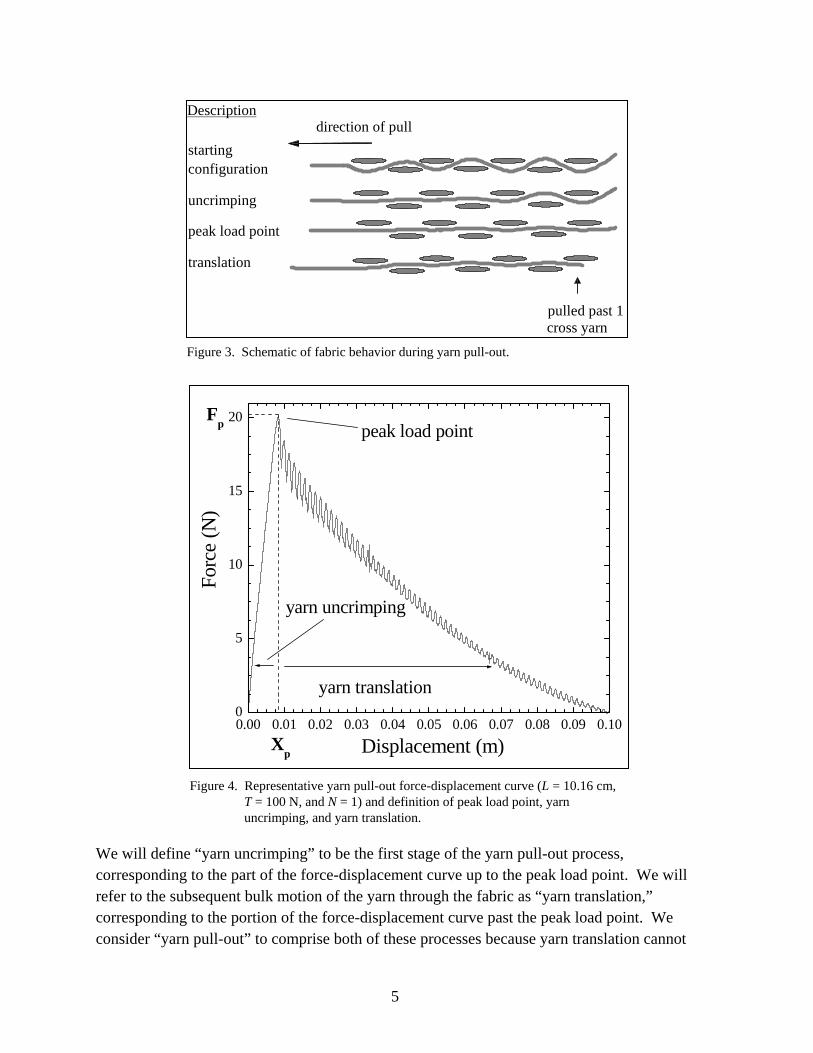
Figure 3 is a schematic of the yarn loading process during a pull-out experiment, and figure 4 shows the corresponding force-displacement curve. During uncrimping, the yarn undergoing pull-out progressively straightens and locally disturbs the nominal woven architecture (Shockey et al., 2001). This process progressively alters the visual appearance of the yarn as its uncrimped length increases (figure 5), and results in a nearly linear force-displacement curve. When the uncrimping zone reaches the bottom edge of the specimen, the peak load point is reached (Bazhenov, 1997). The entire yarn then begins to translate within the fabric, and the pull-out force gradually decreases with displacement. The oscillations in the force-displacement curve during yarn translation correspond to the individual cross-yarns passed by the translating yarn. The pull-out force typically approaches a value of zero as the total yarn displacement reaches a value equal to the sample length.
The uncrimping process is irreversible and, once partially straightened, the yarn will not return to the original, crimped configuration. Measurements of yarn length after our pull-out experiments showed only a 0.8% increase in length, in agreement with the small permanent deformations measured by Shockey et al. (2001) for Zylon and Kevlar K29 fabrics. Therefore, yarn stretching does not play an important role in the yarn pull-out process.
5
Figure 3. Schematic of fabric behavior during yarn pull-out.
Figure 4. Representative yarn pull-out force-displacement curve (L = 10.16 cm, T = 100 N, and N = 1) and definition of peak load point, yarn uncrimping, and yarn translation.
We will define “yarn uncrimping” to be the first stage of the yarn pull-out process, corresponding to the part of the force-displacement curve up to the peak load point. We will refer to the subsequent bulk motion of the yarn through the fabric as “yarn translation,” corresponding to the portion of the force-displacement curve past the peak load point. We consider “yarn pull-out” to comprise both of these processes because yarn translation cannot
direction of pull
pulled past 1 cross yarn
Description
starting configuration
uncrimping
peak load point
translation
0.00 0.01 0.02 0.03 0.04 0.05 0.06 0.07 0.08 0.09 0.100
5
10
15
20
yarn translation
yarn uncrimping
Forc
e (N
)
Displacement (m)
Fp
Xp
peak load point
6
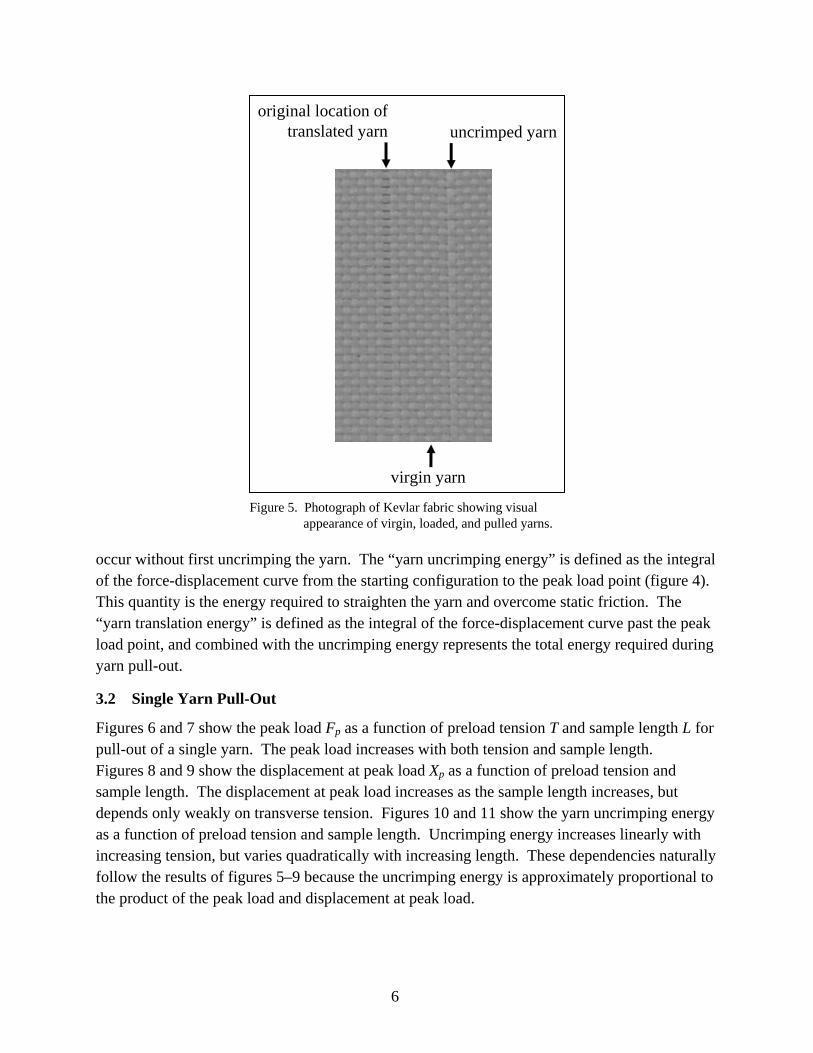
Figure 5. Photograph of Kevlar fabric showing visual appearance of virgin, loaded, and pulled yarns.
occur without first uncrimping the yarn. The “yarn uncrimping energy” is defined as the integral of the force-displacement curve from the starting configuration to the peak load point (figure 4). This quantity is the energy required to straighten the yarn and overcome static friction. The “yarn translation energy” is defined as the integral of the force-displacement curve past the peak load point, and combined with the uncrimping energy represents the total energy required during yarn pull-out.
3.2 Single Yarn Pull-Out
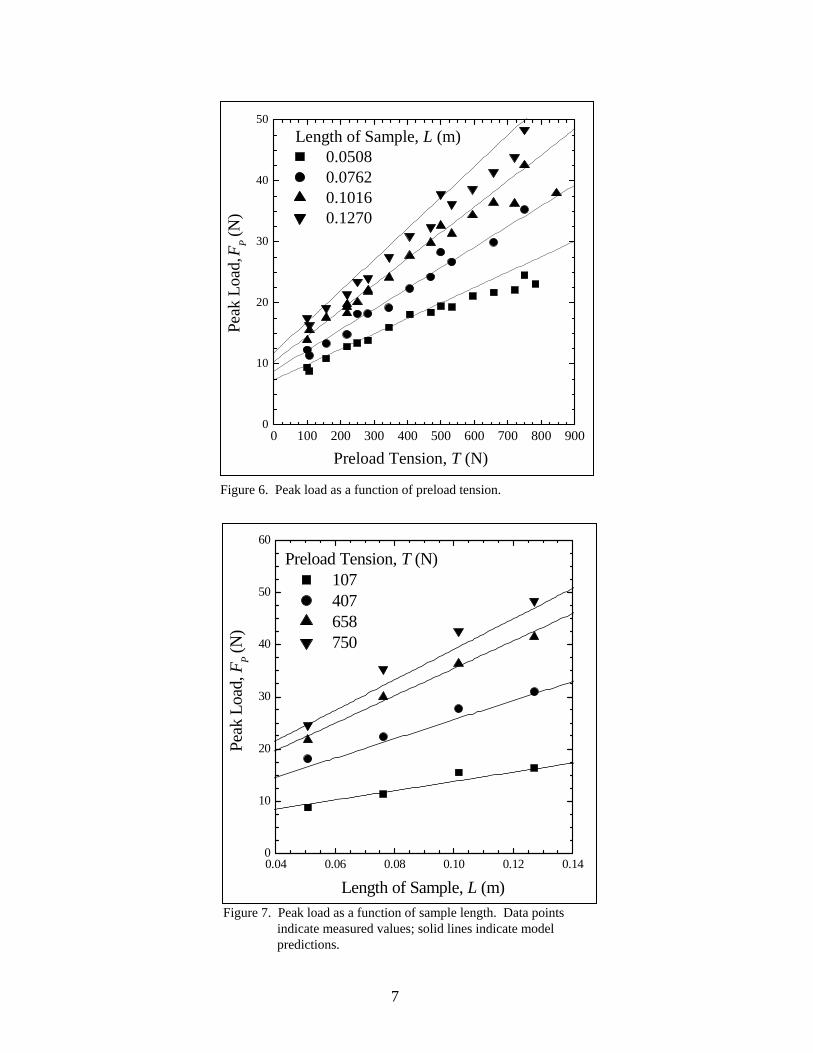
Figures 6 and 7 show the peak load Fp as a function of preload tension T and sample length L for pull-out of a single yarn. The peak load increases with both tension and sample length. Figures 8 and 9 show the displacement at peak load Xp as a function of preload tension and sample length. The displacement at peak load increases as the sample length increases, but depends only weakly on transverse tension. Figures 10 and 11 show the yarn uncrimping energy as a function of preload tension and sample length. Uncrimping energy increases linearly with increasing tension, but varies quadratically with increasing length. These dependencies naturally follow the results of figures 5–9 because the uncrimping energy is approximately proportional to the product of the peak load and displacement at peak load.
original location of translated yarn
virgin yarn
uncrimped yarn
7
Figure 6. Peak load as a function of preload tension.
Figure 7. Peak load as a function of sample length. Data points indicate measured values; solid lines indicate model predictions.
0 100 200 300 400 500 600 700 800 9000
10
20
30
40
50 Length of Sample, L (m)
0.0508 0.0762 0.1016 0.1270
Peak
Loa
d, F
P (N)
Preload Tension, T (N)
0.04 0.06 0.08 0.10 0.12 0.140
10
20
30
40
50
60
Preload Tension, T (N) 107 407 658 750
Peak
Loa
d, F
P (N)
Length of Sample, L (m)
8
Figure 8. Displacement at peak load as a function of preload tension.
Figure 9. Displacement at peak load as a function of sample length. Data points indicate measured values; solid lines indicate model predictions.
0 100 200 300 400 500 600 700 800 9000.000
0.002
0.004
0.006
0.008
0.010
0.012
0.014
0.016Length of Sample, L (m)
0.0508 0.0762 0.1016 0.1270
Disp
lace
men
t at P
eak
Load
, Xp (
m)
Preload Tension, T (N)
0.04 0.06 0.08 0.10 0.12 0.140.000
0.002
0.004
0.006
0.008
0.010
0.012Preload Tension, T (N)
107 407 658 750
Disp
lace
men
t at P
eak
Load
, XP (m
)
Length of Sample, L (m)
9
Figure 10. Uncrimping energy as a function of preload tension.
Figure 11. Uncrimping energy as a function of sample length. Data points indicate measured values; solid lines indicate model predictions.
100 200 300 400 500 600 700 8000.00
0.05
0.10
0.15
0.20
0.25
0.30
Preload Tension, T (N)
Unc
rimpi
ng E
nerg
y, E
UC (J
)
Length of Sample, L (m) 0.0508 0.0762 0.1016 0.1270
0.04 0.06 0.08 0.10 0.12 0.140.00
0.05
0.10
0.15
0.20
0.25
0.30 Preload Tension, T (N) 106.4 156.6 344.5 595.0 657.6
Unc
rimpi
ng E
nerg
y, E
UC (J
)
Length of Sample, L (m)
10
3.3 Multiple Yarn Pull-Out
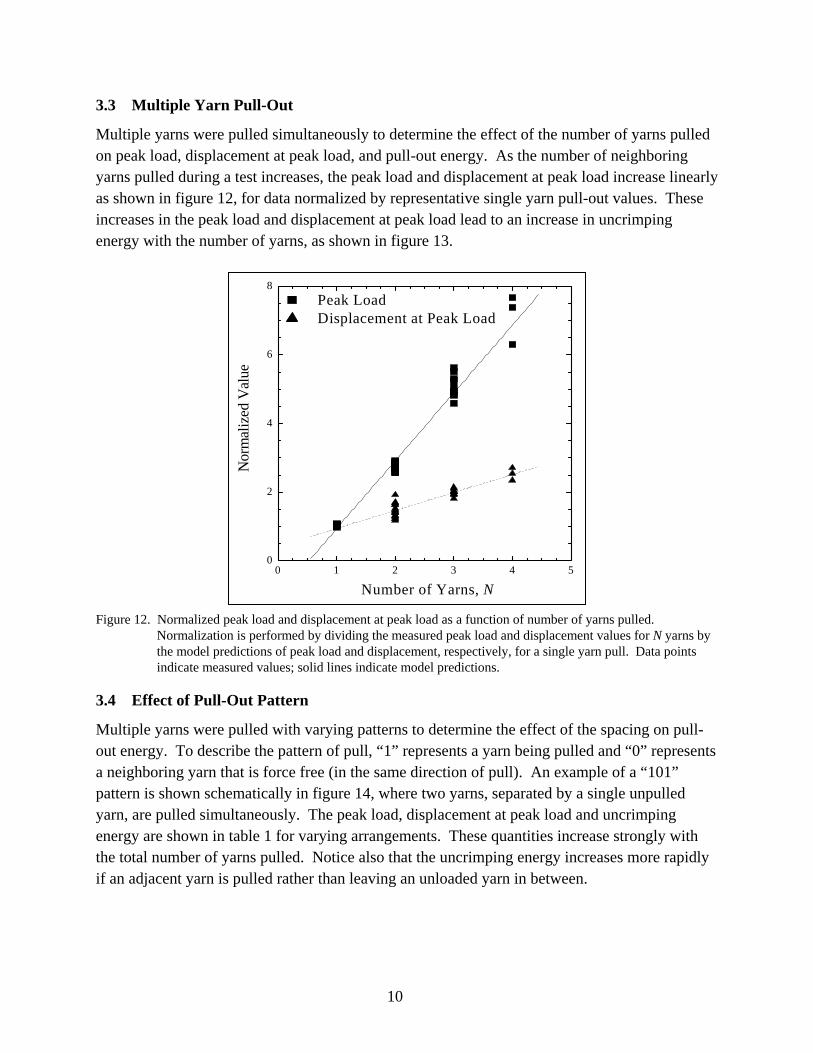
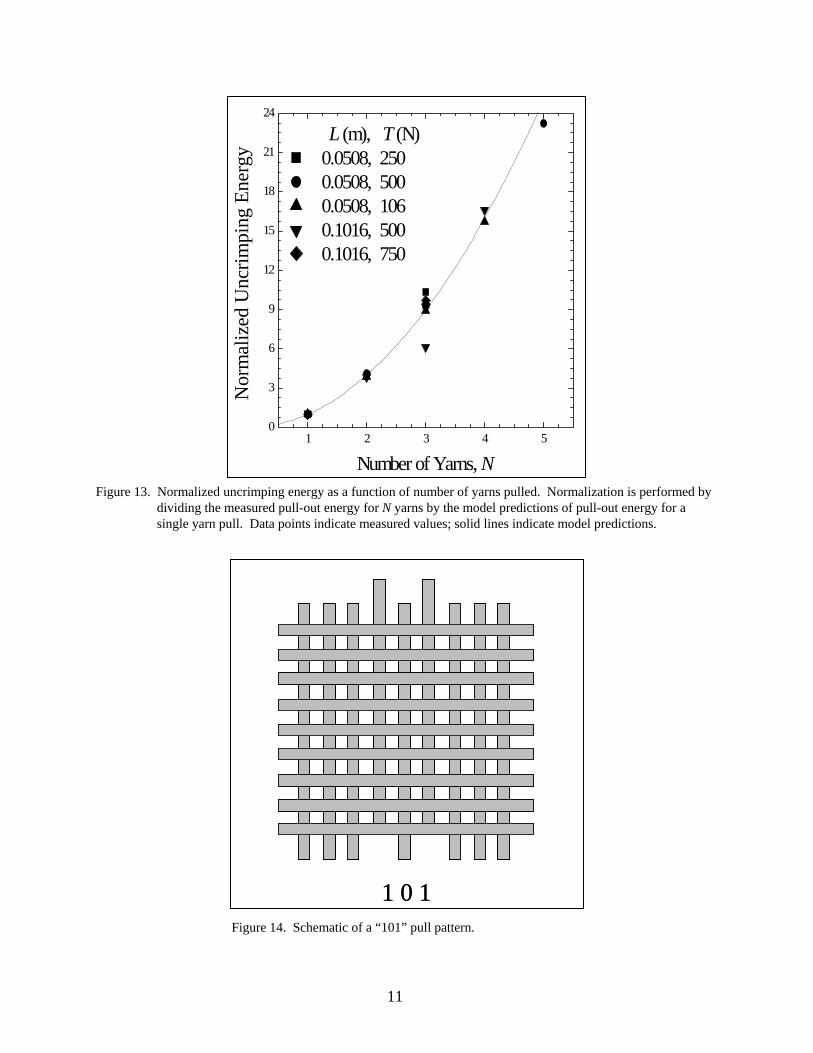
Multiple yarns were pulled simultaneously to determine the effect of the number of yarns pulled on peak load, displacement at peak load, and pull-out energy. As the number of neighboring yarns pulled during a test increases, the peak load and displacement at peak load increase linearly as shown in figure 12, for data normalized by representative single yarn pull-out values. These increases in the peak load and displacement at peak load lead to an increase in uncrimping energy with the number of yarns, as shown in figure 13.
Figure 12. Normalized peak load and displacement at peak load as a function of number of yarns pulled. Normalization is performed by dividing the measured peak load and displacement values for N yarns by the model predictions of peak load and displacement, respectively, for a single yarn pull. Data points indicate measured values; solid lines indicate model predictions.
3.4 Effect of Pull-Out Pattern
Multiple yarns were pulled with varying patterns to determine the effect of the spacing on pull-out energy. To describe the pattern of pull, “1” represents a yarn being pulled and “0” represents a neighboring yarn that is force free (in the same direction of pull). An example of a “101” pattern is shown schematically in figure 14, where two yarns, separated by a single unpulled yarn, are pulled simultaneously. The peak load, displacement at peak load and uncrimping energy are shown in table 1 for varying arrangements. These quantities increase strongly with the total number of yarns pulled. Notice also that the uncrimping energy increases more rapidly if an adjacent yarn is pulled rather than leaving an unloaded yarn in between.
0 1 2 3 4 50
2
4
6
8 Peak Load Displacement at Peak Load
Nor
mal
ized
Val
ue
Number of Yarns, N
11
Figure 13. Normalized uncrimping energy as a function of number of yarns pulled. Normalization is performed by dividing the measured pull-out energy for N yarns by the model predictions of pull-out energy for a single yarn pull. Data points indicate measured values; solid lines indicate model predictions.
Figure 14. Schematic of a “101” pull pattern.
1 2 3 4 50
3
6
9
12
15
18
21
24
L (m), T (N) 0.0508, 250 0.0508, 500 0.0508, 106 0.1016, 500 0.1016, 750
Nor
mal
ized
Unc
rimpi
ng E
nerg
y
Number of Yarns, N
1 0 11 0 1
12
Table 1. Effects of pattern of pull on a 10.16-cm sample with a preload tension of 750 N.
Pull Pattern
Peak Load,
Fp (N)
Displacement at Peak Load,
Xp (m)
Uncrimping Energy,
EUC (J)
1 43.7 0.00926 0.196 1001 98.8 0.0110 0.529 101 96.7 0.0120 0.543 11 114 0.0144 0.859
1101 148 0.0149 1.10 111 206 0.0186 1.82
3.5 Yarn Translation
Figures 15 and 16 show yarn translation energy as a function of tension and sample length. Similarly to the findings for the uncrimping energy, translation energy is observed to increase approximately linearly with tension, and quadratically with sample length. The similarity of these trends is expected because both energies scale naturally to the product of the peak load and a characteristic pull-out distance. For the case of uncrimping energy, this distance is the displacement at peak load, which was found to be proportional to sample length. For the case of translation energy, the characteristic pull-out distance is approximately equal to the sample length itself.
Figure 15. Translation energy as a function of preload tension.
100 200 300 400 500 600 700 800
0.2
0.4
0.6
0.8
1.0
1.2
1.4
Length of Sample, L (m) 0.0508 0.0762 0.1270
Preload Tension, T (N)
Tran
slatio
n En
ergy
(J)
13
Figure 16. Translation energy as a function of sample length. Data points indicate measured values; solid lines indicate model predictions.
4. Model Formulation
The data from these laboratory tests are to be used to ascertain the pull-out energy losses in actual ballistic targets (Kirkwood et al., 2004). Post-test diagnostics of ballistic testing include the target dimensions, the number of yarns pulled and the extent of pull-out for each layer of the target. Consequently, it is useful to parameterize the results of these pull-out experiments with semi-empirical formulas, which can subsequently be used to estimate energy dissipation through yarn pull-out during ballistic tests.
Our model formulation is greatly simplified by nondimensionalizing the force-displacement curves. We directly fit this normalized data to construct a pull-out force model, which is then integrated analytically to create a model for pull-out energy.
4.1 Uncrimping of a Single Yarn
The force and displacement data of the uncrimping curves were normalized by the measured peak load Fp and displacement at peak load Xp, respectively, for each data set. This normalized data is well-modeled by the equation
0.05 0.06 0.07 0.08 0.09 0.10 0.110.1
0.2
0.3
0.4
0.5
0.6
0.7
0.8
0.9
1.0
1.1
1.2
1.3
Length of Sample, L (m)
Preload Tension, T (N ) 100 250 500 750
Tran
slat
ion
Ener
gy (J
)
14
for 0 M
PP P
F x x XF X
⎛ ⎞= ≤ ≤⎜ ⎟⎝ ⎠
, (1)
with a best fit M value calculated for each data set. The M values for each set of conditions L and T are then modeled by the equation
1 2 3 4M c c L c T c L T= + ⋅ + ⋅ + ⋅ ⋅ , (2)
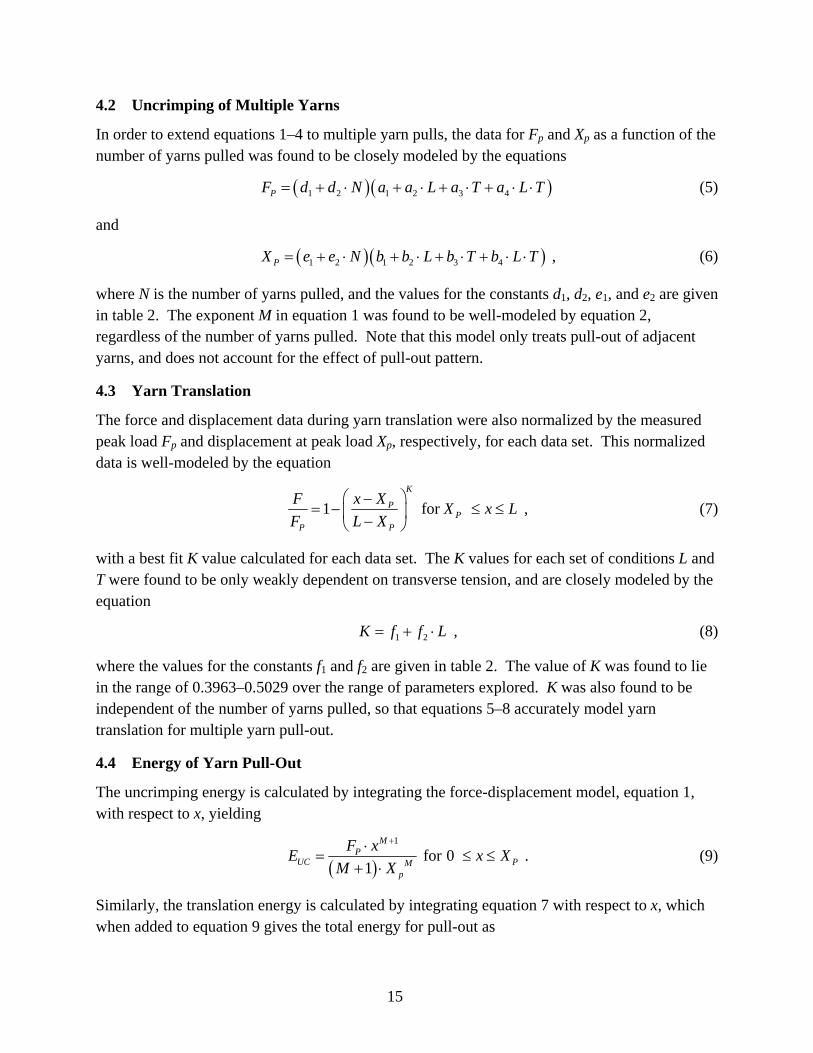
where the values for the constants c1, c2, c3, and c4 are given in table 2. The values of M ranged from 0.768 to 1.20 over the range of experimental conditions.
Table 2. Fitting constants for pull-out model.
Constant Value Units
a1 4.399 N
a2 58.25 N⋅m–1
a3 8.164 × 10³ —
a4 0.3370 m–1
b1 3.685 × 10³ m
b2 0.0436 —
b3 –3.951 × 10⁶ m⋅N–1
b4 5.514 × 10⁵ N–1
c1 0.8783 —
c2 –1.231 m–1
c3 5.100 × 10⁴ N–1
c4 –3.973 × 10⁴ m–1⋅N–1
d1 –1.038 —
d2 1.978 —
e1 0.4923 —
e2 0.4969 —
f1 0.3252 —
f2 1.400 m–1
To complete the uncrimping model, the experimental Fp and Xp values for each data set were fit with the equations
1 2 3 4( 1)PF N a a L a T a L T= = + ⋅ + ⋅ + ⋅ ⋅ (3)
and
1 2 3 4( 1)PX N b b L b T b L T= = + ⋅ + ⋅ + ⋅ ⋅ , (4)
where the values for the constants a1, a2, a3, a4, b1, b2, b3, and b4 are given in table 2.
15
4.2 Uncrimping of Multiple Yarns
In order to extend equations 1–4 to multiple yarn pulls, the data for Fp and Xp as a function of the number of yarns pulled was found to be closely modeled by the equations
( )( )1 2 1 2 3 4PF d d N a a L a T a L T= + ⋅ + ⋅ + ⋅ + ⋅ ⋅ (5)
and
( )( )1 2 1 2 3 4PX e e N b b L b T b L T= + ⋅ + ⋅ + ⋅ + ⋅ ⋅ , (6)
where N is the number of yarns pulled, and the values for the constants d1, d2, e1, and e2 are given in table 2. The exponent M in equation 1 was found to be well-modeled by equation 2, regardless of the number of yarns pulled. Note that this model only treats pull-out of adjacent yarns, and does not account for the effect of pull-out pattern.
4.3 Yarn Translation
The force and displacement data during yarn translation were also normalized by the measured peak load Fp and displacement at peak load Xp, respectively, for each data set. This normalized data is well-modeled by the equation
1 for K
PP
P P
x XF X x LF L X
⎛ ⎞−= − ≤ ≤⎜ ⎟−⎝ ⎠
, (7)
with a best fit K value calculated for each data set. The K values for each set of conditions L and T were found to be only weakly dependent on transverse tension, and are closely modeled by the equation
1 2K f f L= + ⋅ , (8)
where the values for the constants f1 and f2 are given in table 2. The value of K was found to lie in the range of 0.3963–0.5029 over the range of parameters explored. K was also found to be independent of the number of yarns pulled, so that equations 5–8 accurately model yarn translation for multiple yarn pull-out.
4.4 Energy of Yarn Pull-Out
The uncrimping energy is calculated by integrating the force-displacement model, equation 1, with respect to x, yielding
( )
1
for 0 1
MP
UC PMp
F xE x XM X
+⋅= ≤ ≤
+ ⋅ . (9)
Similarly, the translation energy is calculated by integrating equation 7 with respect to x, which when added to equation 9 gives the total energy for pull-out as
16
( ) ( )( ) ( )
1
+ for 11
K
P p P PPO P p PK
p
F x X F XE F x X X x LMK L X
+⋅ − ⋅
= ⋅ − − ≤ ≤++ ⋅ −
. (10)
Equations 9 and 10, combined with equations 2, 5, 6, and 8 and the constants given in table 2, provide a semi-empirical model that enables estimation of the energy dissipated in plain woven, 180 g/m2, 600-denier Kevlar KM-2 fabric during yarn pull-out. The range of validity of the model is limited by the range of laboratory test conditions (e.g., fabric type and size, tensions, and rate of pull).
4.5 Model Evaluation
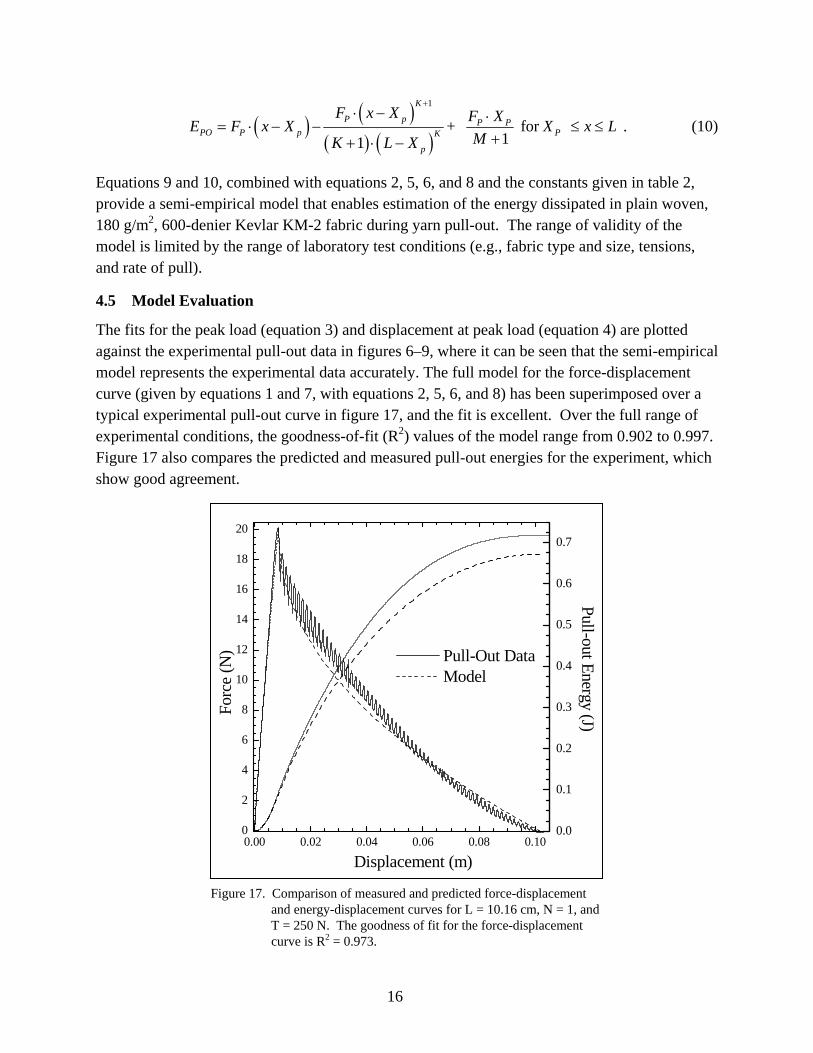
The fits for the peak load (equation 3) and displacement at peak load (equation 4) are plotted against the experimental pull-out data in figures 6–9, where it can be seen that the semi-empirical model represents the experimental data accurately. The full model for the force-displacement curve (given by equations 1 and 7, with equations 2, 5, 6, and 8) has been superimposed over a typical experimental pull-out curve in figure 17, and the fit is excellent. Over the full range of experimental conditions, the goodness-of-fit (R2) values of the model range from 0.902 to 0.997. Figure 17 also compares the predicted and measured pull-out energies for the experiment, which show good agreement.
Figure 17. Comparison of measured and predicted force-displacement and energy-displacement curves for L = 10.16 cm, N = 1, and T = 250 N. The goodness of fit for the force-displacement curve is R2 = 0.973.
0.00 0.02 0.04 0.06 0.08 0.100
2
4
6
8
10
12
14
16
18
20
Pull-Out Data Model
Forc
e (N
)
Displacement (m)
0.0
0.1
0.2
0.3
0.4
0.5
0.6
0.7
Pull-out Energy (J)
17
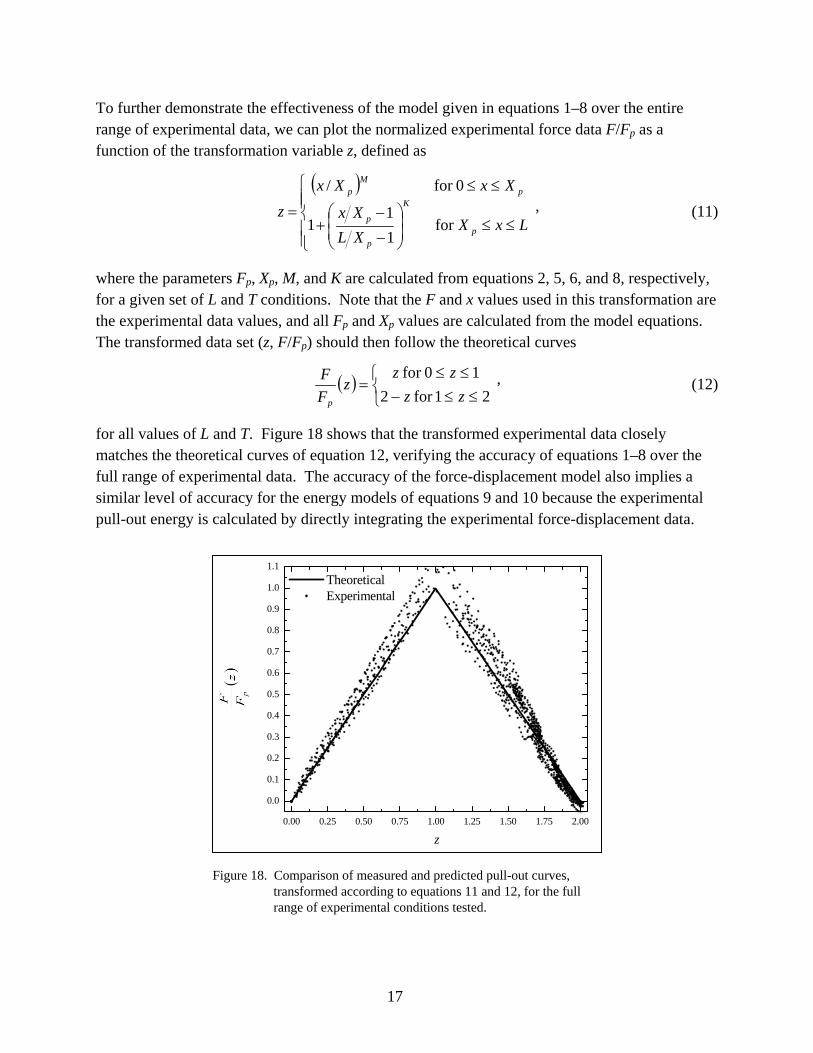
To further demonstrate the effectiveness of the model given in equations 1–8 over the entire range of experimental data, we can plot the normalized experimental force data F/Fp as a function of the transformation variable z, defined as
( )
⎪⎪⎩
⎪⎪⎨
⎧
≤≤⎟⎟⎠
⎞⎜⎜⎝
⎛
−
−+
≤≤
=LxX
XLXx
XxXxz
p
K
p
p
pM
p
for 11
1
0for / , (11)
where the parameters Fp, Xp, M, and K are calculated from equations 2, 5, 6, and 8, respectively, for a given set of L and T conditions. Note that the F and x values used in this transformation are the experimental data values, and all Fp and Xp values are calculated from the model equations. The transformed data set (z, F/Fp) should then follow the theoretical curves
( )⎩⎨⎧
≤≤−≤≤
=21for 2
10for zz
zzz
FF
p
, (12)
for all values of L and T. Figure 18 shows that the transformed experimental data closely matches the theoretical curves of equation 12, verifying the accuracy of equations 1–8 over the full range of experimental data. The accuracy of the force-displacement model also implies a similar level of accuracy for the energy models of equations 9 and 10 because the experimental pull-out energy is calculated by directly integrating the experimental force-displacement data.
Figure 18. Comparison of measured and predicted pull-out curves, transformed according to equations 11 and 12, for the full range of experimental conditions tested.
0.00 0.25 0.50 0.75 1.00 1.25 1.50 1.75 2.00
0.0
0.1
0.2
0.3
0.4
0.5
0.6
0.7
0.8
0.9
1.0
1.1
z
Theoretical Experimental
18
5. Discussion
5.1 Effect of Sample Length and Width
For a single yarn pull, the peak load increases with sample length (figures 6 and 7). One possible explanation is that increasing sample length also increases the area of inter-yarn contact, which would proportionally increase the frictional resistance to yarn pull-out. Alternatively, the number of inter-yarn contact points also increases with increasing sample length, which leads to an increase in path tortuousity. The displacement at peak load also increases with sample length because longer samples will necessarily have longer yarns and therefore longer pull-out zones.
Although the pull-out energy depends strongly on sample length, the width of the fabric was determined to have no effect on the energy required for pull-out. The same pull-out energy values are also observed for yarns pulled at any point along the width of the fabric. Consequently, we conclude that the geometry of the pull-out zone is only affected by the adjacent yarns and not by the width of the fabric.
5.2 Effect of Tension
Increasing the transverse fabric tension is observed to proportionally increase the yarn pull-out energy. One likely explanation for this behavior is that increasing the tension on the transverse yarns also increases the normal forces between yarns, which increases the frictional resistance to yarn pull-out. Alternatively, increasing transverse yarn tension could inhibit the straightening of the yarn undergoing pull-out, further resulting in a more tortuous path during yarn translation.
Displacement at peak load is only a weak function of transverse tension, since the length scale of the pull-out curve is primarily determined by the length of the fabric specimen.
5.3 Effect of Number of Yarns Pulled and Pull-Out Pattern
For multiple yarns, the uncrimping energy increases as a power law of the number of yarns (figure 13). Presumably this result is a consequence of the plain weave fabric architecture, in which cross-yarns alternate above and below adjacent yarns. A loaded yarn increases the crimping on surrounding yarns through the cross-yarns (Shockey et al., 2001), which may enhance both frictional effects and path tortuousity during multiple yarn pull-out. These effects are likely responsible for the increase in peak load with number of yarns pulled. However, it is surprising to note that the displacement at peak load also increases strongly with the number of yarns pulled. We suspect that the cooperative uncrimping effect of neighboring yarns in some way enhances the ability of the pulled yarn to more fully straighten as it is uncrimped, which would increase the displacement at peak load. However, further investigation, possibly using sophisticated microscopy, would be necessary to confirm these theorized variations in local
19
fabric architecture. It is also interesting to note that the power law indices for the pull-out models were independent of the number of yarns pulled.
When multiple yarns are pulled with one or more yarn spaces in between, the pull-out energy is always lower than that for pulling an equal number of adjacent yarns. For two-yarn pulls, the drop-off in pull-out energy from zero- to one-yarn spacing is much more dramatic than for one to two yarn spacings. In fact, the difference in pull-out energies for one- and two-yarn spacings is likely within experimental uncertainty. However, pulling two yarns simultaneously always requires more pull-out energy than the pull-out energy required to perform two sequential single-yarn pulls. Similar trends were observed for three yarns pulled simultaneously.
These results suggest, not surprisingly, that yarn-yarn interactions are highest for adjacent yarns. The comparison of simultaneous and single-yarn pulls show that yarn-yarn interactions are significant even when the simultaneous yarns are separated by two yarn spacings.
6. Conclusions
The energy to pull a yarn from a woven fabric is dependent upon the length of the sample, the transverse fabric tension, the number of yarns pulled at once, the pattern of pull, and the distance that the yarn is pulled. A semi-empirical model can be used to accurately model both the force-displacement, as well as the energy-displacement, pull-out behavior over the full range of experimental conditions (i.e., a sample length of 5.08–12.70 cm, up to four yarns pulled, and up to 1000 N of transverse tension), during both yarn uncrimping and subsequent yarn translation. The contributions of frictional resistance and pull-out path tortuousity during multiple yarn pull-outs are complex and require further investigation through additional experiments and computational simulation. The particular quantitative model presented in this report should prove useful for estimating the energy absorbed through yarn pull-out during ballistic impact of plain woven, 180 g/m2, 600-denier Kevlar KM-2 fabrics. However, the general approach for measurement and modeling of yarn pull-out should prove applicable to a wide range of fiber types and fabric architectures. The reported data should also prove useful for the formulation of a more fundamental model of yarn pull-out behavior, perhaps following the general approach of Kawataba et al. (1973).
20
7. References
Bazhenov, S. Dissipation of Energy by Bulletproof Aramid Fabric. J. Mater. Sci. 1997, 32, 4167–4173.
Briscoe, B. J.; Motamedi, F. The Ballistic Impact Characteristics of Aramid Fabrics: The Influence of Interface Friction. Wear 1992, 158, 229–247.
Carr, D. J. Failure Mechanisms of Yarns Subjected to Ballistic Impact. J. Mat. Sci. Lett. 1999, 18, 585–588.
Cheeseman, B. A.; Bogetti, T. A. Ballistic Impact Into Fabric and Compliant Composite Laminates. Comp. Struct. 2003, 61, 161–173.
Dischler, L.; Moyer, T. T.; Henson, J. B. Dilatant Powder Coated Fabric and Containment Articles Formed There, U.S. Patent 5,776,839, 1998.
Jacob, M. J; Van Dingenen, J. L. J. Ballistic Protection Mechanisms in Personal Armour. J. Mat. Sci. 2001, 36, 3137–3142.
Kawataba, S.; Niwa, M.; Kawai, H. The Finite-Deformation Theory of Plain-Weave Fabrics. J. Textile Institute 1973, 64, 21–85.
Kirkwood, J. E.; Kirkwood, K. M.; Lee, Y. S.; Egres, R. G.; Wetzel, E. D.; Wagner, N. J. Yarn Pull-Out as a Mechanism for Dissipation of Ballistic Impact Energy in Kevlar KM-2, Part II: Prediction of Ballistic Performance. Textile Res. J., accepted for publication, 2004.
Lee, Y. S.; Wetzel, E. D.; Wagner, N. J. The Ballistic Impact Characteristics of Kevlar Woven Fabrics Impregnated With a Colloidal Shear Thickening Fluid. J. Mat. Sci. 2003, 38, 2825–2833.
Martinez, M. A.; Navarro, C.; Cortes, R.; Rodriguez, J.; Sanchez-Galvez, V. Friction and Wear Behaviour of Kevlar Fabrics. J. Mater. Sci. 1993, 28, 1305–1311.
Motamedi, F.; Bailey, A. I.; Briscoe, B. J.; Tabor, J. Theory and Practice of Localized Fabric Deformations. Textile Res. J. 1989, 59, 160–172.
Park, R.; Jang, J. Effect of Laminate Geometry on Impact Performance of Aramid Fiber/Polyethylene Fiber Hybrid Composites. J. Appl. Poly. Sci. 2000, 75, 952–959.
Roylance, D.; Wilde, A.; Tocci, G. Ballistic Impact of Textile Structures. Textile Res. J. 1973, 43, 34–41.
21
Sebastian, S. A. R. D.; Bailey, A. I.; Briscoe, B. J.; Tabor, D. Effect of a Softening Agent on Yarn Pull-Out Force of a Plain Weave Fabric. Textile Res. J. 1986, 56, 604–611.
Sebastian, S. A. R. D.; Bailey, A. I.; Briscoe, B. J.; Tabor, D. Extensions, Displacements, and Forces Associated With Pulling a Single Yarn From a Fabric. J. Phys. D: Appl. Phys. 1987, 20, 130–139 .
Shockey, D. A.; Erlich, D. C.; Simons, J. W. Improved Barriers to Turbine Engine Fragments: Interim Report III; DOT/FAA/AR-99/8, III; Office of Aviation Research, Federal Aviation Administration: Washington, DC, 2001.
22
List of Abbreviations and Symbols
EUC Uncrimping energy (J)
EPO Total pull-out energy (J)
F Force measured during yarn pull-out (N)
Fp Peak load (N)
K Power law index for model of yarn translation
L Vertical length of sample (m)
M Power law index for model of yarn uncrimping
N Number of yarns pulled
T Preload tension applied to fabric (N)
x Displacement of crosshead (m)
Xp Displacement at peak load (m)
NO. OF NO. OF COPIES ORGANIZATION COPIES ORGANIZATION
23
1 DEFENSE TECHNICAL (PDF INFORMATION CTR Only) DTIC OCA 8725 JOHN J KINGMAN RD STE 0944 FT BELVOIR VA 22060-6218 1 COMMANDING GENERAL US ARMY MATERIEL CMD AMCRDA TF 5001 EISENHOWER AVE ALEXANDRIA VA 22333-0001 1 INST FOR ADVNCD TCHNLGY THE UNIV OF TEXAS AT AUSTIN 3925 W BRAKER LN STE 400 AUSTIN TX 78759-5316 1 US MILITARY ACADEMY MATH SCI CTR EXCELLENCE MADN MATH THAYER HALL WEST POINT NY 10996-1786 1 DIRECTOR US ARMY RESEARCH LAB AMSRD ARL CS IS R 2800 POWDER MILL RD ADELPHI MD 20783-1197 3 DIRECTOR US ARMY RESEARCH LAB AMSRD ARL CI OK TL 2800 POWDER MILL RD ADELPHI MD 20783-1197 3 DIRECTOR US ARMY RESEARCH LAB AMSRD ARL CS IS T 2800 POWDER MILL RD ADELPHI MD 20783-1197
ABERDEEN PROVING GROUND 1 DIR USARL AMSRD ARL CI OK TP (BLDG 4600)
NO. OF COPIES ORGANIZATION
24
5 UNIV OF DELAWARE DEPT OF CHEM ENGRNG CTR FOR COMPOSITE MATERIAL K KIRKWOOD J KIRKWOOD Y LEE R EGRES JR N WAGNER NEWARK DE 19796
ABERDEEN PROVING GROUND 1 DIR USARL AMSRD ARL WM MA E WETZEL