Embed Size (px)
Citation preview
Yap, Jeffrey Peng Poh (2006) Is there a pot of gold at the end of the rainboow for Asian low cost airlines. [Dissertation (University of Nottingham only)] (Unpublished)
Access from the University of Nottingham repository: http://eprints.nottingham.ac.uk/20701/1/06MBAJY2699.pdf
Copyright and reuse:
The Nottingham ePrints service makes this work by students of the University of Nottingham available to university members under the following conditions.
This article is made available under the University of Nottingham End User licence and may be reused according to the conditions of the licence. For more details see: http://eprints.nottingham.ac.uk/end_user_agreement.pdf
For more information, please contact [email protected]
- 1 -
IS THERE A POT OF GOLD AT THE END OF THE
RAINBOW FOR ASIAN LOW COST AIRLINES
JEFFREY YAP PENG POH
2006
A Dissertation presented in part consideration for the degree of
Master of Business Administration
- 2 -
Summary
This market study will seek to understand the impact of the Low Cost Carriers (LCC)
model in Asia. There are generally two LCC business models, Value-Based or Deep
Discount model. Between the two basic low cost business models is a third variant – the
Long-Haul Discount model. Asia Pacific, a far-flung region and accounts for 56% of the
world population and favorable macro environments coupled with a large growing
affluent population will fuel new demand for discretionary travel. Asian LCC with the
right business model and strategies will definitely ride on this huge potential and emulate
the success demonstrate in North American and Europe. The current LCC market share is
estimated to be about 5% in Asia Pacific and could increase to about 11% in 2010, and
could reach higher rates if external macro environment remains favorable. Although the
pace of bilateral liberalization is spreading at a much slower pace than in other markets
around the world, the emergence of low cost carriers in Asia Pacific is accelerating this
trend. This market trend will greatly benefit the aerospace industry suppliers, aircraft
lessors and OEM such as Hamilton Sundstrand (HS). HS engineering expertise and
capabilities in integrating their whole supply chain to bring added value to their
customers has put them in a strong position and a source of their competitive advantage.
It is recommended that Hamilton Sundstrand should pursue a differentiation strategy for
its unique selling proposition of OEM quality at a guarantee cost and exploit the Internet
to reach its customer via e-commerce. Additionally, HS need to have a culture of
continuous improvement and consolidate core work to the lower cost HS plants, and
outsource non-core products and services to other companies. This will enhance HS
ability to better compete in the global marketplace.
- 3 -
CONTENTS
SUMMARY ....................................................................................................................................................... 2
ACKNOWLEDGEMENTS............................................................................................................................. 8
INTRODUCTION ............................................................................................................................................ 9
PURPOSE OF STUDY ........................................................................................................................................ 9
STRUCTURE OF THE THESIS .......................................................................................................................... 10
METHODOLOGY ............................................................................................................................................ 11
CONCLUSION................................................................................................................................................. 12
LOW COST CARRIER BUSINESS MODELS.......................................................................................... 13
INTRODUCTION ............................................................................................................................................. 13
HISTORY ....................................................................................................................................................... 15
DEFINITION OF LOW COST CARRIER ............................................................................................................ 16
VALUE VERSUS DEEP DISCOUNT BUSINESS MODELS .................................................................................. 19
Value-Based Airlines: easyJet in Europe ............................................................................................... 22
Deep Discount Airlines: Ryanair in Europe .......................................................................................... 23
LCC COMPETITIVE ADVANTAGE ................................................................................................................. 25
‘Inbound Logistics’ ................................................................................................................................. 27
Operations............................................................................................................................................... 27
“Outbound Logistics”............................................................................................................................. 28
Marketing & Sales .................................................................................................................................. 29
Service ..................................................................................................................................................... 30
Human Resource Management & Development .................................................................................... 30
Firm Infrastructure ................................................................................................................................. 31
FOOD CHAIN RIDING ON LCC GROWTH ...................................................................................................... 33
Aircraft Manufacturers ........................................................................................................................... 33
Aircraft Maintenance .............................................................................................................................. 34
Airports.................................................................................................................................................... 35
- 4 -
POTENTIAL LOSERS ...................................................................................................................................... 35
GOLD AT THE END OF THE RAINBOW ........................................................................................................... 36
CONCLUSIONS............................................................................................................................................... 37
MARKET POTENTIAL FOR ASIAN LCC............................................................................................... 39
INTRODUCTION ............................................................................................................................................. 39
HUGE POPULATION SIZE AND MASSIVE LAND AREA .................................................................................. 41
STABLE AND HIGH-SPEED ECONOMIC GROWTH.......................................................................................... 42
LOW MARKET PENETRATION BY LCCS IN ASIA .......................................................................................... 44
PROGRESSIVE LIBERALIZATION IN ASIA PACIFIC......................................................................................... 45
RAPID GROWTH FOR LOW COST AIRLINES................................................................................................... 46
PROJECTED MARKET POTENTIAL FOR LCCS ............................................................................................... 49
CONCLUSION................................................................................................................................................. 51
ASIA PACIFIC AIRLINES FLEET ANALYSIS....................................................................................... 53
INTRODUCTION ............................................................................................................................................. 53
MORE GOOD NEWS AT AIR SHOW................................................................................................................ 54
AIRCRAFT LESSORS RIDING ON LCC BOOM ................................................................................................ 55
SHIFT IN LOW COST AIRLINES AIRCRAFT CHOICES ..................................................................................... 56
NARROW-BODY AIRCRAFT ENGINE CHOICES.............................................................................................. 59
CONCLUSION................................................................................................................................................. 61
REVIEW OF ASIAN AVIATION REGULATORY FRAMEWORK .................................................... 62
INTRODUCTION ............................................................................................................................................. 62
AUSTRALIA VS. JAPAN LIBERALIZATION EXPERIENCE ................................................................................ 63
ASEAN AIR TRANSPORT MARKET.............................................................................................................. 65
SOUTH ASIA TRANSPORT MARKET .............................................................................................................. 72
CHINA’S PROGRESSIVE MARKET DEREGULATION ....................................................................................... 72
NORTH ASIA MARKET – DIFFICULT FOR LCCS ........................................................................................... 73
CONCLUSION................................................................................................................................................. 75
KEYS SECTORS RIDING ON LCC GROWTH....................................................................................... 77
- 5 -
INTRODUCTION ............................................................................................................................................. 77
AIRCRAFT FLEET: UPSTREAM FOOD CHAIN................................................................................................. 77
I. Aircraft Manufacturers........................................................................................................................ 77
II. Aircraft Engine and Component Manufacturers ............................................................................... 80
III. In-Flight Entertainment .................................................................................................................... 81
AIRCRAFT FLEET: DOWNSTREAM FOOD CHAIN........................................................................................... 82
I. Aircraft and Component MRO ............................................................................................................ 82
II. Aircraft Leasing Companies .............................................................................................................. 83
III. Regional Airports.............................................................................................................................. 84
PASSENGER FLOW FOOD CHAIN................................................................................................................... 85
I. On-Line Travel Agencies..................................................................................................................... 86
II. Hotel and Car Rental Companies ...................................................................................................... 86
III. Property Market................................................................................................................................ 87
Conclusion............................................................................................................................................... 87
HAMILTON SUNDSTRAND AFTERMARKET SERVICES................................................................. 89
INTRODUCTION ............................................................................................................................................. 89
OVERVIEW OF HAMILTON SUNDSTRAND ..................................................................................................... 89
Flight & Undersea Systems .................................................................................................................... 90
Electric Systems ...................................................................................................................................... 92
Engine Systems........................................................................................................................................ 93
Air Management & Power Systems ........................................................................................................ 94
Customer Service .................................................................................................................................... 94
PORTER FIVE FORCES OF ANALYSIS ON MRO INDUSTRY............................................................................ 94
AVIATION MRO INDUSTRY TREND.............................................................................................................. 97
Outsourcing Trend for MRO Services .................................................................................................... 97
Airline Affiliated MRO Turn into A Profit Center.................................................................................. 98
Early Retirement of Older Aircraft......................................................................................................... 98
Growth of Package MRO Service Program ........................................................................................... 99
Evolving B2B Aviation e-Marketplace .................................................................................................100
- 6 -
Growth of Non-OEM PMA Parts .........................................................................................................101
KEY GOVERNMENTAL INDUSTRY INFLUENCES..........................................................................................102
THREAT OF NEW ENTRANTS.......................................................................................................................103
BARGAINING POWER OF BUYERS ...............................................................................................................105
BARGAINING POWER OF SUPPLIERS ...........................................................................................................106
THREAT OF SUBSTITUTES ...........................................................................................................................107
ASIA PACIFIC MRO INDUSTRY RIVALRY...................................................................................................108
SWOT ANALYSIS ON HAMILTON SUNDSTRAND........................................................................................110
STRENGTH...................................................................................................................................................110
ORGANIZATIONAL CAPABILITIES OR CORE COMPETENCE.........................................................................117
Inbound Logistics ..................................................................................................................................118
Operations.............................................................................................................................................118
“Outbound Logistics”...........................................................................................................................119
Marketing & Sales ................................................................................................................................119
Service ...................................................................................................................................................120
Human Resource Management & Development ..................................................................................120
Firm Infrastructure ...............................................................................................................................121
Purchasing ............................................................................................................................................122
WEAKNESS..................................................................................................................................................122
OPPORTUNITY.............................................................................................................................................123
THREAT.......................................................................................................................................................124
CONCLUSIONS AND RECOMMENDATIONS ..................................................................................................125
Conclusions from the findings ..............................................................................................................125
Recommendations for Hamilton Sundstrand........................................................................................127
THEMES FOR FURTHER STUDIES.................................................................................................................133
REFERENCES..............................................................................................................................................134
APPENDICES...............................................................................................................................................138
ASIA PACIFIC LCC AIRCRAFT FLEET PLAN: 2004 - 2009 ..........................................................................139
ASIA PACIFIC LCC FLEET – JULY 2006......................................................................................................140
- 7 -
ASIA PACIFIC LCC FLEET – UP TO 2015.....................................................................................................141
OUTLINE OF MAJOR CARRIERS IN JAPAN ...................................................................................................142
ASEAN MEMBER COUNTRIES BASIC INFORMATION ................................................................................143
ASEAN FRAMEWORK AGREEMENT FOR THE INTEGRATION OF PRIORITY SECTORS ................................144
AIR FREEDOM RIGHTS ................................................................................................................................145
DETAILS OF CHINA AVIATION MARKET LIBERALIZATION ........................................................................146
FOOD CHAIN ANALYSIS OF LOW COST CARRIERS .....................................................................................147
HAMILTON SUNDSTRAND ASIA PACIFIC MRO FACILITIES........................................................................148
- 8 -
Acknowledgements
I would like to thank Professor John Richards for his guidance and help in completing
this dissertation. He graciously accepted the assignment to supervise this project despite
the short notice and for that I am very grateful. His thoughtful comments and his
commitment to this project helped to make this dissertation a success.
- 9 -
Introduction
Purpose of Study
Many new entrepreneurs are starting low cost carriers (LCC) in Asia to chase for the pot
of gold at the end of the rainbow. Sir Richard Branson, the flamboyant British
entrepreneur was the first kid off the block in Asia. With A$10 million investment, he
started Virgin Blue venture in Australia in the third quarter of 2000 with a fleet of B737-
400. Followed closely behind was Tony Fernandez, who took control of Air Asia in
Malaysia, through Tune Air in December 2001. The capital investment in Air Asia is
about US$21 million. Virgin Blue and Air Asia shares were listed in late 2003 and 2004
respectively. With market capitalization of US$1.4 billion for Virgin Blue and US$1.0
billion for Air Asia, the two initial investors in the companies derived huge returns on
their investments.
Since then, chasing the next pot of gold at the end of the rainbow is the dream for many
new entrepreneurs in many parts of Asia. To name a few are Raymond Lee of Hong Kong
starting the Oasis Hong Kong Airlines; Kingfisher Airlines in India, which is under the
leadership of a successful Indian billionaire, Vijay Mallya (which also owns the popular
Indian beer of the same name); Adam Air, which is founded in 2002 by Mr. Agung
Laksono, a well-known Indonesian businessman and politician, and Mrs. Sandra Ang.
However, at the other end of the spectrum is the rumour of consolidation and merger in
the LCC market due to the persistence high oil prices, and slow deregulation of the Asia
aviation market. In Singapore, the consolidation has begun to take place with the merger
of JetStar Asia and Valuair. Therefore the risks of failures for LCC are very high.
This market study will seek to understand the impact of the LCC model in Asia and
provide answers to the following questions. Is the LCC model feasible in Asia? What
business model can the Asian LCC adopt to mitigate the risks and continue to thrive in a
highly competitive and regulated Asia market? With the Asian LCC adding more than
200 aircrafts in the next few years, is there a risk of overcrowding in the markets? Will
- 10 -
the process be similar to the deregulation experience of the US and European aviation
markets. Which key industries will ride on the LCC growth?
This paper will also seek to understand LCC cost structure and how they would spend
their money on Maintenance, Repair and Overhaul (MRO) services. Will they build in-
house MRO capabilities or outsource to other? Additionally, how can OEM such as
Hamilton Sundstrand repackage the aftermarket services to cater to this new business
model?
Structure of the Thesis
On the second chapter, a brief outline of the history of low cost carrier (LCC) in various
parts of the world and the meaning of a LCC will be made clear. The fundamental
concepts of LCC and the various LCC business models will also be presented follow with
a detailed analysis of JetBlue competitive advantage using Porter’s value chain
framework. This is to understand why JetBlue can still be profitable despite pursuing both
low cost and differentiating strategies at the same, contrary to Porter’s view that
organization should avoid being ‘stuck in the middle’. Will the LCC model be feasible in
Asia since it has been successfully applied in other parts of the world?
There are many books and articles that have been written on LCC model and about the
most successful LCC airline in the world, i.e. Southwest Airlines. However, what is LCC
market potential in Asia? The third chapter will scan the macro environment to
understand the factors that will provide the engine of growth for the LCC in Asia.
In the fourth chapter, an analysis using aircraft fleet data from ACAS database will seek
to understand the type of equipment deployed by LCC and determine the future trend.
- 11 -
This will help to understand the potential beneficiaries of LCC growth, which will be
discuss in details in the sixth chapter.
The key to LCC survival in Asia will largely depend on how the deregulation progress in
this region. The fifth chapter examines if the aviation deregulation process that happen in
US and the European market will be duplicated in Asia.
The last chapter conclude how the LCC growth will impact the MRO industry and OEM
(Original Equipment Supplier) such as Hamilton Sundstrand. Using Porter’s five forces
framework, we seek to understand the MRO market structure and then proceed to
evaluate Hamilton Sundstrand strength and weakness in relation to the external
environment using the SWOT framework. We then present the findings for this study and
the recommendations for Hamilton Sundstrand to strengthen its competitive advantage.
We also propose business strategies that Hamilton Sundstrand can pursue to win in the
MRO market.
Methodology
The methodology that will be adopted to achieve the objectives of this study will include
preliminary research, data requirements and collection approach. The preliminary
research has been conducted on the topic before the commencement of the study. The
research included the insight into successful LCC model such as Southwest Airlines &
Ryanair. Existing literature on LCC Model was also explored through the study of books,
articles and journals.
- 12 -
In selecting a data collection approach, it is necessary to give careful consideration to the
study’s data requirements. Due to the existence of many aviation databases, the option of
relying on secondary data sources was viewed as adequate. This include but not limited to
information from Airline Association, Boeing, Airbus, OEM that the writer work for,
such as Hamilton Sundstrand and data archive from ACAS, which is available through
subscription. Local Air Authority which keeps detailed database on airline operating
characteristics provides another reliable source of information.
Conclusion
With the structure and methodology for this study explained in this chapter. This will
provide an understanding to the underlying process towards the completion of this
dissertation. With a better understanding of the analytical framework utilize in this study,
it will improve the credibility of the conclusion and the recommendation.
- 13 -
LOW COST CARRIER BUSINESS MODELS
Introduction
Is the low cost carrier model feasible in Asia? Hamel (2000) argues that the age of
continuity is over and we have now entered the age of revolution where the value of
incumbency is being eroded and those companies that embrace discontinuous change will
be the winners. The revolutionaries will win through innovatory business concepts
embodied in new business models. This paper will seek to analyze the viability of this
new breed of air carrier, the low cost carrier, and the new business model’s impact on the
Asian airline market. It will also look for the key sectors that will benefit from low cost
airline growth in Asia. Although, harsh market conditions and financial turmoil surrounds
the global airline industry today, many ambitious entrepreneurs are aspiring to set up low
cost carrier (LCC) models in Asia to chase for the pot of gold at the end of the rainbow.
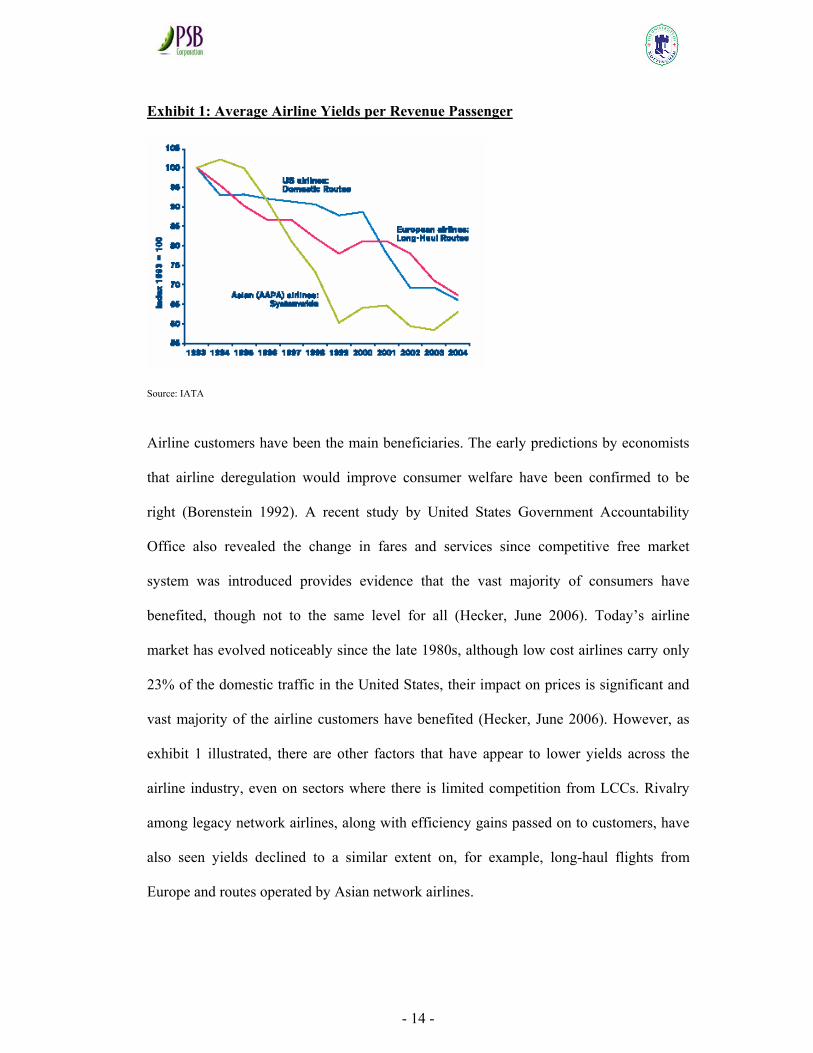
The worldwide airline markets continue to evolve with air fares declining globally and
almost 30 percent in the leading market of United States since 1993 (see Exhibit 1) and
the airline industry size has grown rapidly since 1980.
- 14 -
Exhibit 1: Average Airline Yields per Revenue Passenger
Source: IATA
Airline customers have been the main beneficiaries. The early predictions by economists
that airline deregulation would improve consumer welfare have been confirmed to be
right (Borenstein 1992). A recent study by United States Government Accountability
Office also revealed the change in fares and services since competitive free market
system was introduced provides evidence that the vast majority of consumers have
benefited, though not to the same level for all (Hecker, June 2006). Today’s airline
market has evolved noticeably since the late 1980s, although low cost airlines carry only
23% of the domestic traffic in the United States, their impact on prices is significant and
vast majority of the airline customers have benefited (Hecker, June 2006). However, as
exhibit 1 illustrated, there are other factors that have appear to lower yields across the
airline industry, even on sectors where there is limited competition from LCCs. Rivalry
among legacy network airlines, along with efficiency gains passed on to customers, have
also seen yields declined to a similar extent on, for example, long-haul flights from
Europe and routes operated by Asian network airlines.
- 15 -
History
The first successful low cost carrier was Pacific Southwest Airlines in the United States,
which pioneered the concept when their first flight took place on May 6, 1949. Often, this
credit has been erroneously given to Southwest Airlines which began service in 1971 and
has been profitable every year since 1973. With the advent of deregulation in the aviation
industry, the model has spread to Europe as well, the most notable successes being
Ireland's Ryanair, which began low-fares operations in 1991, and easyJet, formed in 1995.
As of 2000, low cost carriers are now edging into Asia Pacific, led by operators such as
Malaysia's AirAsia, and Australia's Virgin Blue.
In 2000, Impulse and Virgin Blue commenced low cost operations bringing fierce
competition to Australian cities. Richard Branson begins Virgin Blue with an initial
investment capital of A$10 million and eventually lists it in late 2003 with a market
capitalization of US$1.4 Billion. Impulse operation was short-lived, while Virgin Blue
progress to become Australia second largest airline after the demise of Ansett Australia.
The dominant carrier in Australia, Qantas has also launched two low cost carriers. JetStar
competes with Virgin Blue in the Australian domestic market, while Australian Airlines
operates internationally to Asian destinations. Since June 2006, Australian Airlines has
also ceased operations, with Qantas preferring to retain the JetStar brand due to the low
profit generated by Australian Airlines.
In December 2001, Tony Fernandez, a major investor in Tune Air, took control of
Malaysia AirAsia after buying the heavily indebted airline from a government-owned
conglomerate DRB-Hicom. His initial investment was about RM81 million (US$21
- 16 -
million). AirAsia shares were finally listed in November 2004 with a market
capitalization of US$1.0 billion, bringing huge returns to the initial investor. It now
operates from Kuala Lumpur, Johor Bahru, Bangkok and Jakarta and has two
subsidiaries, Indonesia AirAsia and Thai AirAsia. On March 2006, AirAsia strengthen
further its market position when the government of Malaysia announced that AirAsia will
take over from Malaysia Airlines and service 96 local destinations in Malaysia, in
addition to 19 trunk domestic destinations.
Singapore's first low cost carrier, Valuair started operation on May 5, 2004. In response to
the competition, the island flag carrier Singapore Airlines promptly starts its own new
low cost carrier, Tiger Airways, to protect its own turf. Not to be left behind, Singapore
Changi Airport's second most dominant carrier, Qantas Airways also launched its own
LCC, JetStar Asia Airways. JetStar Asia commences operations on December 2004.
Consolidation was inevitable in the small Singapore market and Valuair finally succumb
to competitive pressure and merged with JetStar Asia in July 2005. Since July 2006,
JetStar Asia, Valuair and JetStar International has merged and reposition into one single
brand "JETSTAR" and market itself as the long-haul LCC that has international
operations to destinations in South East Asia, Japan and the Pacific.
Definition of Low Cost Carrier
There is no standard business model or definition for an LCC. The term itself covers a
wide range of airlines with considerable amount of differences in the type of routes and
the level of passenger service offered. Southwest in United States is a good example of a
pure no-frills airline, targeting customers through low prices. By contrast, JetBlue
- 17 -
markets itself as the “best service at low prices”, provides some passenger services such
as in-flight TVs and flies into major airports. However, both airlines are viewed as LCCs.
This paper defines Low cost carrier (LCC) or low cost airline (also known as a no-frills
or discount carrier / airline) as an airline that generally provides low fares and does away
with many long established passenger services. The model started out in the United States
before proliferating to Europe in the early 1990s and subsequently to the rest of the world.
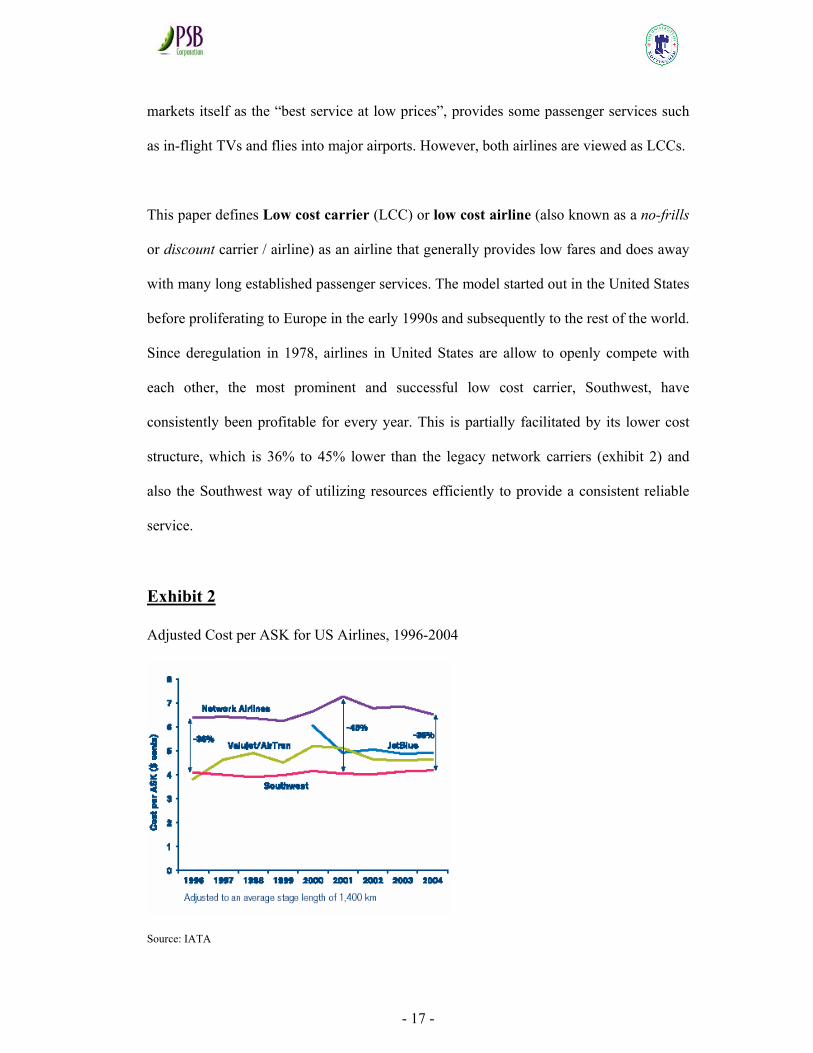
Since deregulation in 1978, airlines in United States are allow to openly compete with
each other, the most prominent and successful low cost carrier, Southwest, have
consistently been profitable for every year. This is partially facilitated by its lower cost
structure, which is 36% to 45% lower than the legacy network carriers (exhibit 2) and
also the Southwest way of utilizing resources efficiently to provide a consistent reliable
service.
Exhibit 2
Adjusted Cost per ASK for US Airlines, 1996-2004
Source: IATA
- 18 -
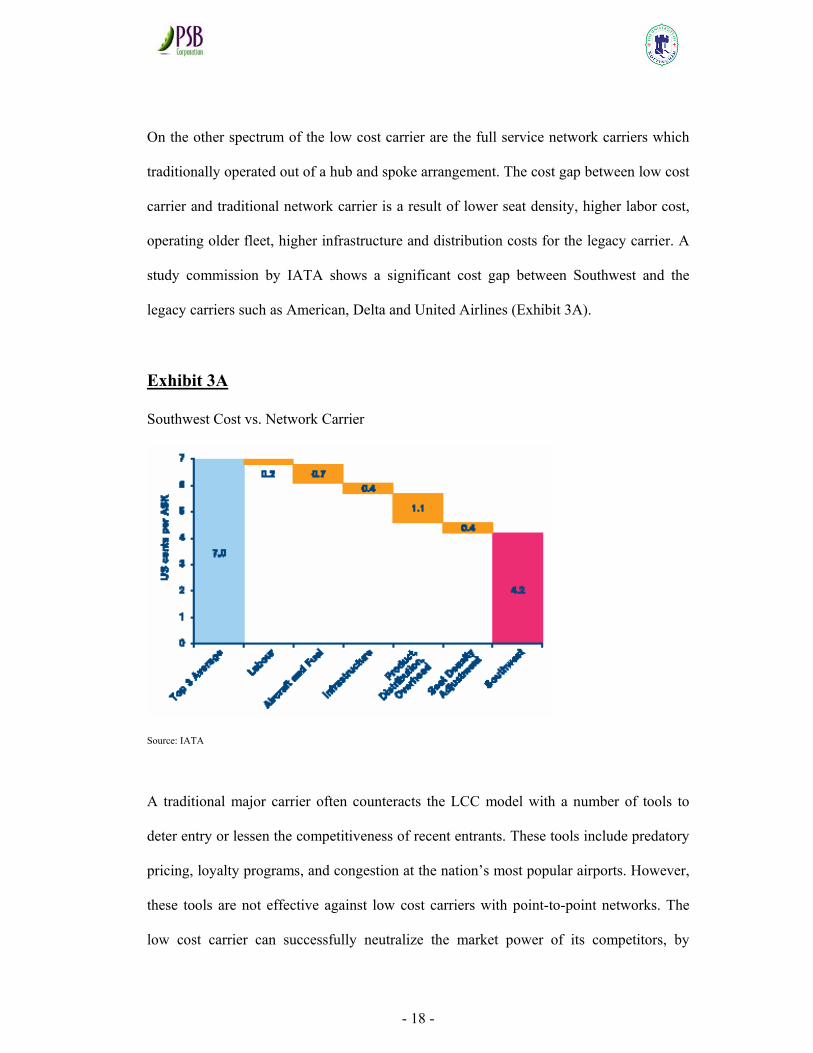
On the other spectrum of the low cost carrier are the full service network carriers which
traditionally operated out of a hub and spoke arrangement. The cost gap between low cost
carrier and traditional network carrier is a result of lower seat density, higher labor cost,
operating older fleet, higher infrastructure and distribution costs for the legacy carrier. A
study commission by IATA shows a significant cost gap between Southwest and the
legacy carriers such as American, Delta and United Airlines (Exhibit 3A).
Exhibit 3A
Southwest Cost vs. Network Carrier
Source: IATA
A traditional major carrier often counteracts the LCC model with a number of tools to
deter entry or lessen the competitiveness of recent entrants. These tools include predatory
pricing, loyalty programs, and congestion at the nation’s most popular airports. However,
these tools are not effective against low cost carriers with point-to-point networks. The
low cost carrier can successfully neutralize the market power of its competitors, by
- 19 -
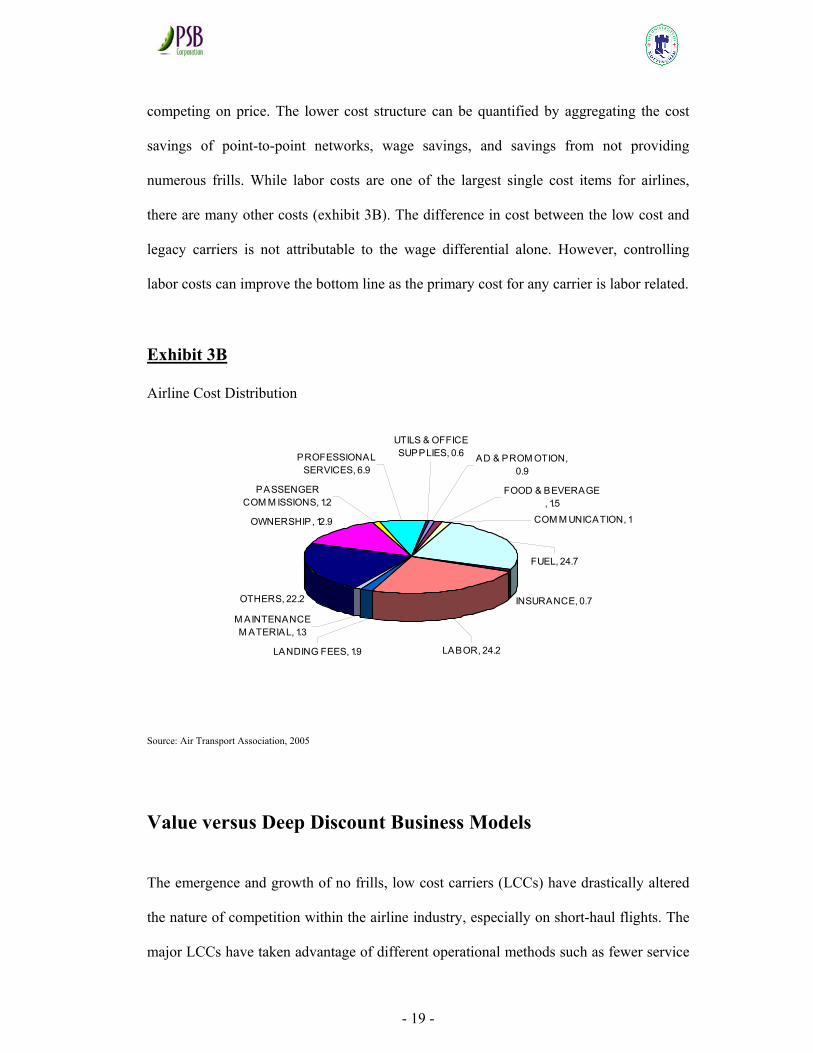
competing on price. The lower cost structure can be quantified by aggregating the cost
savings of point-to-point networks, wage savings, and savings from not providing
numerous frills. While labor costs are one of the largest single cost items for airlines,
there are many other costs (exhibit 3B). The difference in cost between the low cost and
legacy carriers is not attributable to the wage differential alone. However, controlling
labor costs can improve the bottom line as the primary cost for any carrier is labor related.
Exhibit 3B
Airline Cost Distribution
INSURANCE, 0.7OTHERS, 22.2
OWNERSHIP, 12.9
FUEL, 24.7
COM M UNICATION, 1
AD & PROM OTION, 0.9
UTILS & OFFICE SUPPLIES, 0.6
FOOD & BEVERAGE , 1.5
PROFESSIONAL SERVICES, 6.9
PASSENGER COM M ISSIONS, 1.2
LABOR, 24.2LANDING FEES, 1.9
M AINTENANCE M ATERIAL, 1.3
Source: Air Transport Association, 2005
Value versus Deep Discount Business Models
The emergence and growth of no frills, low cost carriers (LCCs) have drastically altered
the nature of competition within the airline industry, especially on short-haul flights. The
major LCCs have taken advantage of different operational methods such as fewer service
- 20 -
offerings with charges for in-flight catering, distribution efficiencies through internet-only
bookings and point-to-point routes from secondary airports etc to bring down their cost
base and to drive down the average fares paid by customers. However, not all LCCs are
turning in a profit, with only a small number of market-leading LCCs such as Southwest,
AirAsia, Ryanair and GOL, producing a consistent level of returns above their cost of
capital. Typical low cost carrier business model practices include:
• A simple fare structure (typically ticket price rise as the plane capacity fills up, which
rewards early reservations, known as "yield management") with a focus on price
competition.
• Typically a single passenger class (typically economy class only) with strong focus on
price sensitive traffic, mostly leisure passengers and no (or limited) customer loyalty
programs.
• Employed a common fleet, usually the Airbus A320 families or Boeing 737 families
to cut down on training and servicing costs.
• Unassigned seating arrangements to influence passengers to board early and speedily.
• Flying to cheaper, less congested secondary airports to evade air traffic delays and
take advantage of lower landing fees. In certain region, the local authorities may even
reward the LCC in the form of subsidies to bring in traffic to revive the local
economy. A win-win situation for both parties. LCC strategic choice to minimize its
competitive interactions with legacy full service airlines adds validity to the previous
arguments by Borenstein (1989) that legacy airlines have considerable dominance
over the market and have the resources to preserve their dominance over lucrative
routes with their hub and spoke strategy.
- 21 -
• In-flight passenger services are do away with (or limited), and replaced by optional
paid-for in-flight food and drink.
• Simplified routes structure, primarily point-to-point transit instead of transfers at hubs
to allow highest utilization of planes.
• Quick turnaround times of aircraft and serving short-haul routes (again enhancing
aircraft utilization).
• Emphasis on direct sales of tickets over the Internet (avoiding fees and commissions
paid to travel agents and corporate booking systems).
• A simple management and overhead structure with a lean strategic decision-making
process.
• Employees have flexible job boundaries, for instance flight attendants also cleaning
the aircraft or working as gate agents (limiting personnel costs).
From the analysis of the spectrum of LCC models in the market, it can be deduce that not
all LCC models are similar. The term low cost is a misnomer, because there are various
degrees of operating cost structures, as well as the services provided by the range of low
cost airlines in the market. From a range of Asia Pacific LCC models such as AirAsia,
JetStar, Tiger Airways and Virgin Blue. The key distinguishing factor between the two
basic LCC business models is cost. AirAsia and Tiger Airways attempt to be the lowest-
cost operators in Asia Pacific, while JetStar and Virgin Blue plan for cost structures that
are lower than those of the network carriers to take advantage of high-yield traffic.
- 22 -
Value-Based Airlines: easyJet in Europe
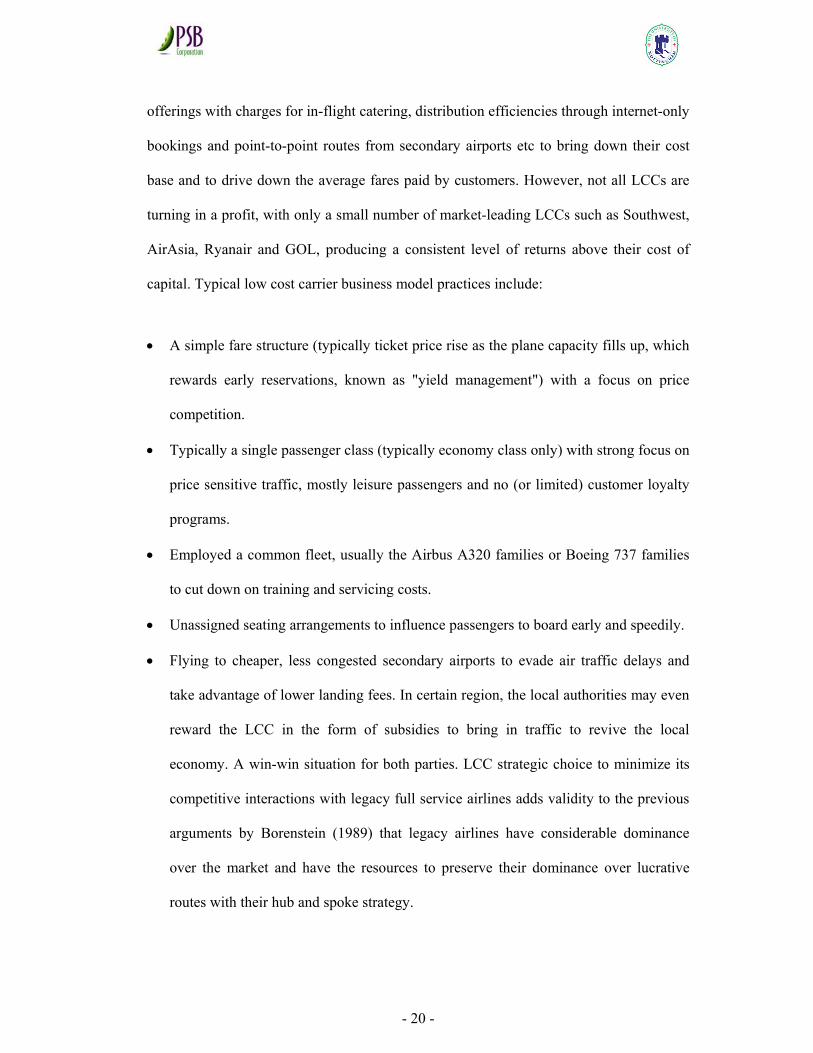
The easyJet business model focuses on maximizing yields while trying to maintain
operating costs at about 30% or more lower than the traditional full-service network
airlines. As indicated in diagram 1, the model focuses on building a high frequency point-
to-point network in the higher disposable-income continental European markets to benefit
from the higher yield leisure and business traffic.
Diagram 1: Value-based Airline Business Model
Source: easyJet
The fares are dynamic and designed to extract maximum yield from the airline’s network.
There is no fixed ceiling fare and the airlines can charge as much as the market is willing
to pay. The fares start as low as £7 and can increase tenfold just before the flight takes
off. Perhaps the most important feature of easyJet’s business model is that the airline
strives to be the lowest cost airline operator between two airports, and this does not have
to be the lowest cost airline operator in the industry. This explains why easyJet operates
in both primary and secondary airports in Europe.
•Dense point-to-point network•Strong, Highly visible brand•Dynamic fares•100% direct sales•Highly utilised standardised fleet•Scaleable
The Model
High volume growth
Yields are managed to achieve high load factors
Unit costs declining
Innovation
•High returns
•Excellent growth prospects
•Track record of delivery
- 23 -
In Asia, the best examples of the value-based airlines are JetStar and Virgin Blue where
both airlines have focused on supplying to the customer a value product of free in-flight
meals and airport lounges at competitive prices to the full-service carriers. However, in
contrast to the easyJet business model, there is a cap on the maximum fare for Asian
value-based airlines, which is set at about 20-25% below the normal fare by the legacy
full-service airlines. The easyJet business model could be changing since the acquisition
of a 10% equity stake by Icelandair in October 2004, and the new management team is
looking for fresh ideas to improve operating margins.
Deep Discount Airlines: Ryanair in Europe
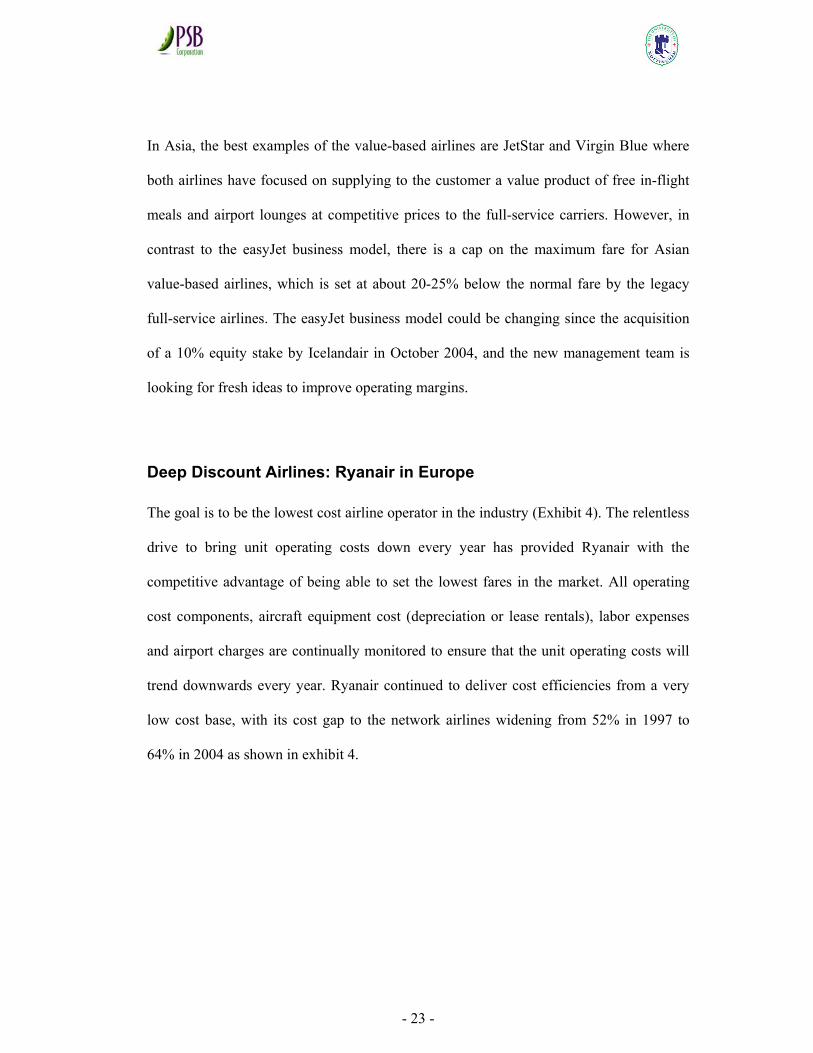
The goal is to be the lowest cost airline operator in the industry (Exhibit 4). The relentless
drive to bring unit operating costs down every year has provided Ryanair with the
competitive advantage of being able to set the lowest fares in the market. All operating
cost components, aircraft equipment cost (depreciation or lease rentals), labor expenses
and airport charges are continually monitored to ensure that the unit operating costs will
trend downwards every year. Ryanair continued to deliver cost efficiencies from a very
low cost base, with its cost gap to the network airlines widening from 52% in 1997 to
64% in 2004 as shown in exhibit 4.
- 24 -
Exhibit 4
Ryanair Cost per Available Seat Kilometer
Source: IATA
In Asia, Tiger Airways and AirAsia are the best examples of deep discount airlines, with
both airlines being known as the lowest airline cost operators in the industry. AirAsia
currently has the lowest unit cost of 2.11 US cents per available seat kilometer among all
the Asia Pacific airlines, despite the sharp rise in jet fuel prices in 2004/05. The main
difference between the two basic LCC business models is profitability. In Asia, both
AirAsia and Tiger Airways, which emulate Ryanair’s business model, have set the goal of
having the lowest-cost advantage in the Asia Pacific aviation market, and both airlines
aim to consistently keep fares at competitive rates (Table 1).
- 25 -
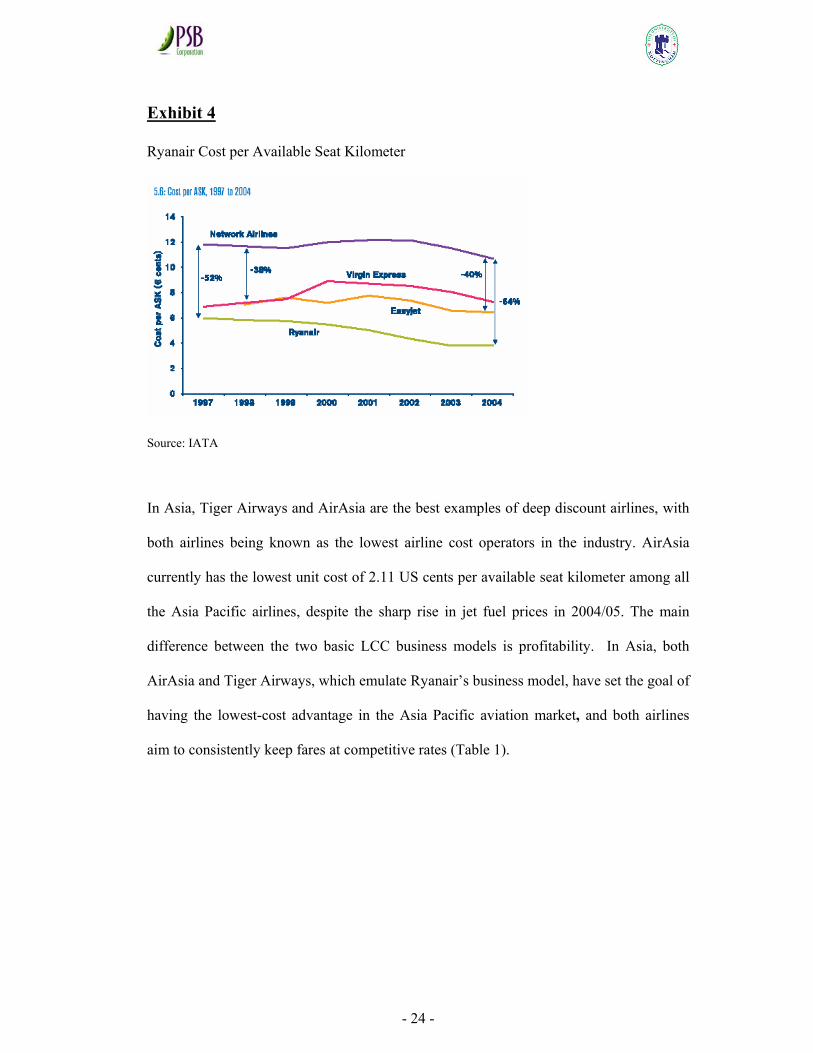
Table 1: Comparison of Asia Pacific Low Cost Airline
Differences in Low cost Airline Model AirAsia JetStar Tiger Valuair Virgin Blue
Lowest fares in market X x Lowest costs in market X X Lowest breakeven in market X X Standardized fleet X x X X Low cost, uncongested airports X x High frequency X x X Strong balance sheet X X High ancillary sales X Consistently profitable X X
Source: Company data, Hamilton Sundstrand
Between the two basic low cost business models is a third variant – the long-haul
discount model. The best example is JetBlue, which flies five to six hours from coast to
coast in the US market, in contrast to Southwest, which focuses primarily on short-haul
routes (JetBlue, 2002). Since its IPO on the NASDAQ stock exchange in 2002, JetBlue
has become one of the most popular airline stocks in history and currently has a multi-
billion market capitalization The revamp JetStar is the best examples of the long-haul
discount airline model in the Asia Pacific market with flights from Singapore to Perth.
LCC Competitive Advantage
The market position taken by the different LCCs is differentiating them from the
incumbent. All their operational strategies are gear towards being the low cost competitor
and then pass on some of the consumer surplus to the customers. However, from the
review of the LCC business models, it can be seen that the LCCs are very different from
each other because of the different target customer and therefore different cost structure.
From an academic perspective, it is interesting to note that organization (such as JetBlue),
- 26 -
which systematically combine relative cost position and relative differentiation can result
in competitive positions and can be successful too.
According to Porter’s view, the firm that is stuck in the middle if more than one generic
strategy were pursued is almost guaranteed low profitability. Porter’s logic was that a
strategy aimed at achieving cost leadership precludes the capital investment or operating
costs necessary for differentiation. How did JetBlue achieve this competitive advantage?
We will examine JetBlue new business concepts based on Porter’s value chain. Michael
Porter advocates the use of the value chain as the primary tool for diagnosing a firm’s
competitive advantages. Porter’s value chain (Lewis et al. 1999) identifies five primary
activities as follows:
• Inbound logistics
• Operations
• Outbound logistics
• Marketing and sales
• Service
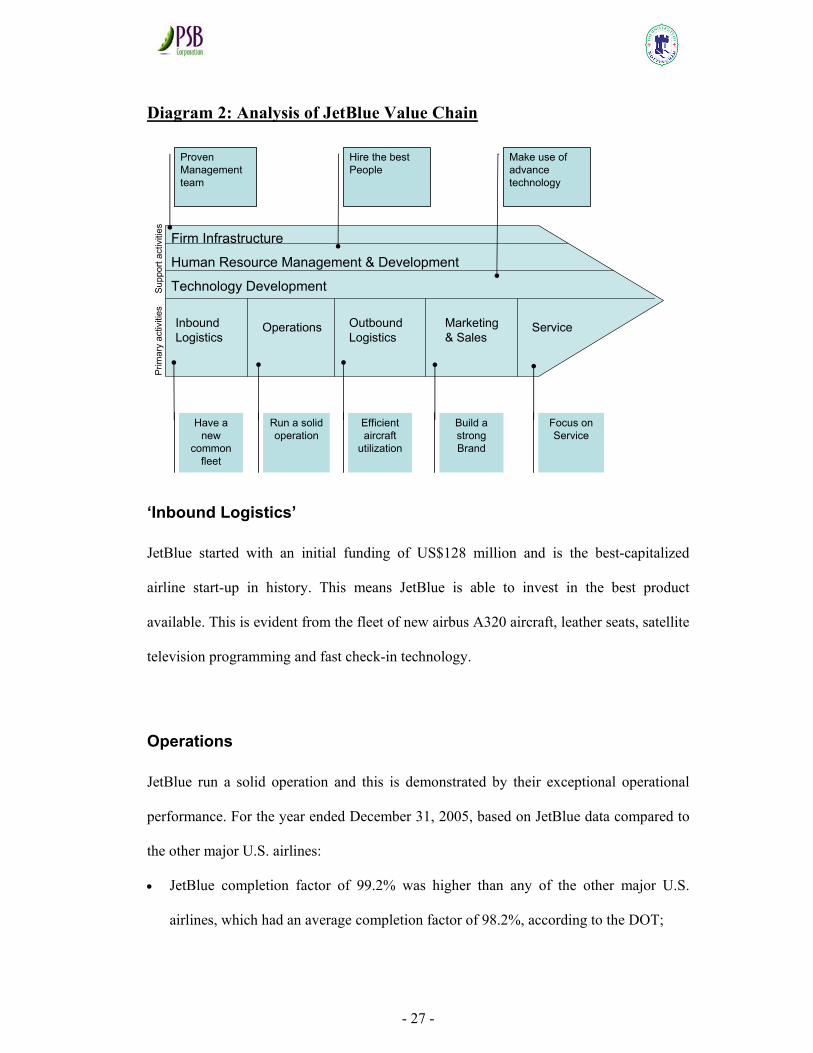
JetBlue competitive advantage can be illustrated by means of the Porter’s value chain
framework as shown on diagram 2 in the following page.
- 27 -
Diagram 2: Analysis of JetBlue Value Chain
‘Inbound Logistics’
JetBlue started with an initial funding of US$128 million and is the best-capitalized
airline start-up in history. This means JetBlue is able to invest in the best product
available. This is evident from the fleet of new airbus A320 aircraft, leather seats, satellite
television programming and fast check-in technology.
Operations
JetBlue run a solid operation and this is demonstrated by their exceptional operational
performance. For the year ended December 31, 2005, based on JetBlue data compared to
the other major U.S. airlines:
• JetBlue completion factor of 99.2% was higher than any of the other major U.S.
airlines, which had an average completion factor of 98.2%, according to the DOT;
Firm Infrastructure
Human Resource Management & Development
Technology Development
Inbound Logistics
Operations OutboundLogistics
Marketing& Sales
Service
Proven Management team
Build a strong Brand
Efficient aircraft
utilization
Focus on Service
Run a solid operation
Have a new
common fleet
Hire the best People
Make use of advance technology
Supp
ort a
ctiv
ities
Prim
ary
activ
ities
- 28 -
• JetBlue incidence of delayed, mishandled or lost bags of 4.06 per 1,000 customers
was the lowest as compared to the other major U.S. airlines, which had an average of
6.24 delayed, mishandled or lost bags per 1,000 customers, according to the DOT;
and
• JetBlue rate of customer complaints to the DOT per 100,000 passengers of 0.29 was
the third lowest as compared to the other major U.S. airlines, which had an average of
0.95 complaints, according to the DOT.
“Outbound Logistics”
JetBlue is relentless in keeping their operating costs low. The key to JetBlue’s low unit
costs is the high productivity of their assets and crewmembers. Some of the contributing
factors are:
• JetBlue utilize their aircraft efficiently, with average daily utilization of 13.5 hours.
By using their aircraft efficiently, they are able to spread their fixed costs over a
greater number of flights. This is achieved through the improved reliability of a new
fleet of aircraft which also require less maintenance than older aircraft. Quick
turnaround of the aircraft at airport gate also increases the number of daily flights per
aircraft.
• JetBlue operate only two types of aircraft with a single class of service. Operating a
limited number of aircraft types leads to increase cost savings as maintenance issues
are simplified, spare parts inventory requirements are reduced, scheduling is more
efficient and training costs are lower. A single class of service simplifies their
operations, enhances productivity, increases our capacity and offers an operating cost
- 29 -
advantage. The recent addition of EMBRAER 190 aircraft into JetBlue is an
extension of JetBlue business strategy. Despite losing some of the cost efficiencies
associated with operating only one aircraft type, the additional market opportunities
provided by this new aircraft will outweigh these additional costs.
• JetBlue takes great care to hire and train crewmembers that are enthusiastic and
committed to serving their customers and motivate them by using appropriate
incentives. Crewmember productivity is created by greater fleet commonality, fewer
unproductive labor work rules, use of part-time crewmembers and the effective use of
advanced technology. For example, most of JetBlue reservation sales agents work
from their homes, providing them better scheduling flexibility and allowing
crewmembers to customize their desired schedules.
• JetBlue achieves lower distribution costs by employing ticketless travel. Ticketless
travel saves paper costs, postage, crewmember time and back-office processing
expense. In addition, direct bookings by the customers save computer reservation
systems fees. For the year ended December 31, 2005, 77.5% of the sales were booked
on their website, and 22.5% were booked through the agents.
Marketing & Sales
Jet Blue builds a strong brand by giving consumers “the things they want, and nothing
they don't”. JetBlue distinguish from their competitors as a safe, reliable, low fare airline
that is focused on customer service and provides an enjoyable flying experience. To
further enhance their brand loyalty, JetBlue implemented loyalty program in mid 2002
which is a rarity in LCC business model. By the end of 2005, over three million
customers had joined this program, and that number has been growing steadily since
- 30 -
inception. In 2005, JetBlue were voted the best domestic airline in the Conde Nast
Traveler's Readers' Choice Awards for the fourth consecutive year and, for the third year
in a row, were voted the best domestic airline in the Conde Nast Traveler Business
Traveler Awards. In 2006, they earned the "Passenger Service Award'' from Air Transport
World.
Service
JetBlue focus on service is evidenced by their devotion and attention to hire
crewmembers that will treat customers in a friendly and respectful manner. The
importance of providing caring customer service is also emphasized in training. In
addition, JetBlue policies and procedures are designed to be customer-friendly. For
example:
• Pre-assigned seating arrangement;
• All travel is ticketless;
• Policy of not overbooking flights;
• Fares are low and based on one-way travel;
• No Saturday night stay is required; and
• Low change fees.
Human Resource Management & Development
JetBlue conduct careful and rigorous screening of potential employee using tools such as
behavioral interviews and peer assessments. JetBlue assist their employees by offering
them flexible work hours, initial paid training, free uniforms and benefits. JetBlue also
provide extensive training for their pilots, flight attendants, technicians, airport agents,
- 31 -
dispatchers and reservation agents which emphasize the importance of safety. An
important part of their business plan is to reward employee by allowing them to share in
JetBlue success and align personal successes with those of JetBlue. JetBlue compensation
packages include competitive salaries, wages and benefits, profit sharing and an
employee stock purchase plan. In addition, a significant number of their employees
participate in the stock option plan. Regular human resource policies reviews are
conducted to ensure that JetBlue remain competitive and are able to hire and retain the
best people.
Technology Development
As a new airline, JetBlue have made use of advanced technology in many ways. For
instance, they are the first US airline to introduce the ‘paperless cockpit’. Pilots use
mobile laptop in the cockpit to calculate the weight and balance and takeoff performance
of the aircraft prior to departure. These laptops also allow the pilots to access manuals in
an electronic format during the flight. In addition, all of JetBlue travel is ticketless, saving
on distribution cost. In response to the September 11, 2001 terrorist attacks, JetBlue
commenced installation of four cabin security cameras on each of aircraft. JetBlue also
introduced innovative customer self-service kiosks for check-in.
Firm Infrastructure
JetBlue have a proven management team which has significant airline industry
experience, including experience at successful low cost airlines, such as Southwest
Airlines. JetBlue Chief Executive Officer, David Neeleman, was also instrumental in
developing the Open Skies reservation system.
- 32 -
From above analysis of JetBlue annual reports from 2002 to 2005 (jetblue.com) using
Porter’s value chain framework, we could identify the sources of JetBlue’s competitive
strength. This competitive strength permits JetBlue to achieve profitability within their
first year of operation and reported an operating margin of 16.5% in 2002, the highest of
any domestic U.S. airline. JetBlue differentiated product, which include new planes, more
comfortable leather seats, free direct satellite television programming for every passenger,
lower fares and friendly service raised the competitive bar against other airlines which
were crippled by the tragic September 11 terrorist event that brought a sudden downturn
in demand for air travel. Many Airlines are reaching the point where it will be impossible
to raise prices, grow the top line, or even significantly reduce costs. There are no
strategies for creating wealth in the long term. The challenge is how to use innovation to
reinvent the core of your business in a world where strategies die faster than they used to
and where any business that's not constantly renewing itself is simply becoming
irrelevant. One misconception about innovation is that it is only about the top line.
However, Kirkpatrick and Hamel (2004) argue that a lot of the most profound business
model innovation over the last few years, has been focused on radical cost-structure
changes, citing JetBlue as the example. JetBlue’s successful implementation of their
business strategies allow it to remains profitable and competitive, contrary to Porter’s
view.
- 33 -
Food Chain Riding on LCC Growth
The low cost airline growth is going to drive up demand in other key sectors such as
aircraft manufacturers, aircraft engine manufacturers, aircraft leasing companies, aircraft
maintenance companies and airports.
Aircraft Manufacturers
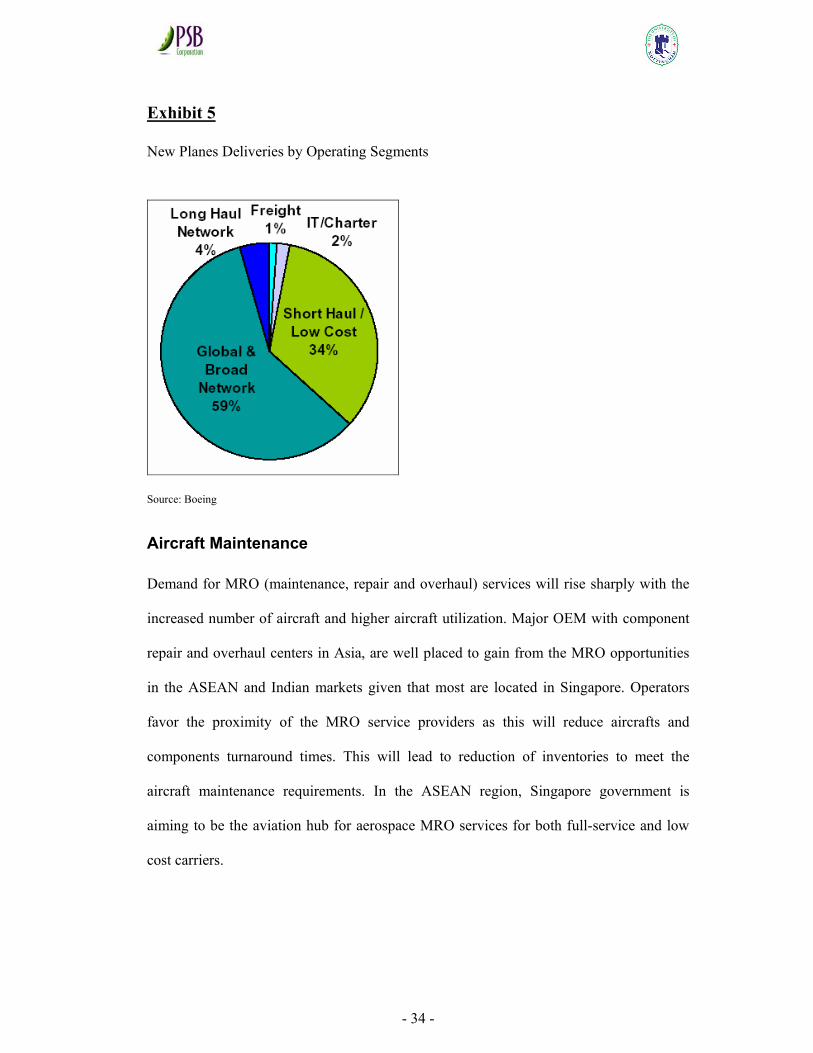
Boeing latest estimates shows the global airline industry will need another 27,000 new
airplanes in the next twenty years by year 2025 and 34% of these deliveries will be to the
low cost or short haul carriers. The need by new LCC entrant to expand the existing fleet
quickly to meet growing demand, plus the need by incumbent LCC to replace older
aircrafts with newer, more fuel market demand for narrow-body aircraft. While Airbus
has been steadily gaining market share with the A320 families of aircraft in Asia over
Boeing’s B737 aircraft, both Airbus and Boeing as the two major global manufacturers of
narrow-body aircraft, should benefit from the strong LCC growth in Asia. Airbus latest
Global Market Forecast has a more conservative outlook, predicting a demand for only
17,300 new passenger and freighter efficient aircraft, will creates a rising aircraft but also
predicted a 34% deliveries will be to the low cost or short haul operators.
- 34 -
Exhibit 5
New Planes Deliveries by Operating Segments
Source: Boeing
Aircraft Maintenance
Demand for MRO (maintenance, repair and overhaul) services will rise sharply with the
increased number of aircraft and higher aircraft utilization. Major OEM with component
repair and overhaul centers in Asia, are well placed to gain from the MRO opportunities
in the ASEAN and Indian markets given that most are located in Singapore. Operators
favor the proximity of the MRO service providers as this will reduce aircrafts and
components turnaround times. This will lead to reduction of inventories to meet the
aircraft maintenance requirements. In the ASEAN region, Singapore government is
aiming to be the aviation hub for aerospace MRO services for both full-service and low
cost carriers.
- 35 -
Airports
A study by Morgan Stanley forecast LCCs to grow the number of aircraft and passengers
carried at a CAGR of 20%-plus for the next five years. The strong aircraft and passenger
volume growth will be positive for the aeronautical and commercial revenues and
earnings of airports. In particular, Singapore Changi Airport and Airports of Thailand, as
they emerge as key LCC hubs, as potential beneficiaries of the LCC growth in the
ASEAN market.
Potential Losers
The appearance of the LCCs has significantly increased competition within the airline
industry and forced legacy full-service network airlines to reassess and improve their own
operations. However, while the larger LCCs have been very successful in creating a niche
for themselves, the low profitability or losses of many smaller LCCs suggests that an
effective airline strategy, rather than just the LCC model by itself, is the key to success.
The legacy airlines that are most at risk from the sustainable low-fare environment
created by low cost airlines are:
• Airlines that are in poor financial health, with high unit operating costs and are unable
to lower their operating costs, or raise labor productivity.
• Airlines that generate low percentage of revenue from long-haul sector flights and
compete directly with LCCs for short-sector routes.
• Airlines that do not have cargo and other operating revenues to compensate for the
low fares from short-sector flights. There could be a consolidation in the Asia airline
- 36 -
industry, if oil prices remain high at more than US$50/bbl for the next two to three
years, and/or there is an external macro shock to the airline industry, particularly for
the weaker and less established LCC brands. The brutal competitive environment will
make certain that only the airlines with the best business models will outlast the
competitors and win market share in long term.
Gold at the End of the Rainbow
In Asia, many new entrepreneurs are starting low cost carriers to chase for the pot of gold
at the end of the rainbow. Sir Richard Branson, the flamboyant British entrepreneur was
the first kid off the block in Asia. With A$10 million investment, he started Virgin Blue
venture in Australia in the third quarter of 2000 with a fleet of B737-400. Followed
closely behind was Tony Fernandez, who took control of AirAsia in Malaysia, through
Tune Air in December 2001. The capital investment in AirAsia is about US$21 million.
Virgin Blue and AirAsia shares were listed in late 2003 and 2004 respectively. With
market capitalization of US$1.4 billion for Virgin Blue and US$1.0 billion for AirAsia,
the two initial investors in the companies derived huge returns on their investments. Since
then, there are Tiger Air, Valuair and JetStar Asia (Valuair has since merged with JetStar
Asia in July 2005), which operate out of Singapore. In other part of Asia, many LCC are
beginning to emerge, such as Lion Air, Adam Air, Thai AirAsia, Oasis Airways, Go Air,
Kingfisher Airlines etc and many more.
- 37 -
Conclusions
The two LCC business models of value based and deep discount differ primarily in the
cost structure. The key question is whether consumer factor in value for money when they
travel or they opt for the cheapest fare. In line with European and US markets, the latter is
favored, especially for leisure travel market. The Asian travelers would also be no
different and would lean towards the same mindset of choosing the cheapest fares.
Therefore, cost efficiency becomes an important element to enable an airline to compete
and survive. However, this does not mean that every airline should seek to be the lowest
cost operator. Instead, it is essential that the costs appropriate for the standard of service
provided to the customer are achieved in the most efficient manner. Just as Ryanair &
easyJet experiences have demonstrated in Europe.
In ASEAN, the market is already crowded with 11 players, and additional LCCs could
enter the market despite the overcrowded field. With the overall global airline industry
forecasting to lose at least US$1.7 billion in 2006 and operating margins remaining well
below its cost of capital of 7-8% (IATA, 2006). Will the entrepreneurs dream remains just
a dream? From the US & European experiences, strong price competition has meant that
only a handful LCCs have been profitable, while several other LCCs have seen low
profitability or even turn in losses. The LCC business model by itself is not a guarantor of
success. It is the individual airline’s strategy that is the key, regardless of the region that
the LCC operate in. New or small LCC airlines in Asia must learn to adapt to the tough
operating environments, just as JetBlue profound business model innovation has allowed
JetBlue to adapt to the external environment and be profitable from the first year of
operations. It is crucial that the LCC’s own strategy and value proposition fit the target

- 38 -
customers in order to compete successfully and be profitable. The next chapter will
examine closely the Asian market environment and verify if there is a potential market for
LCC operators.
- 39 -
MARKET POTENTIAL FOR ASIAN LCC
Introduction
Air travel makes it possible for people to travel. The reasons people travel range from the
needs to visit friends and relatives, enjoying a relaxing break away from home, to do
business in distant cities, or the transportation of goods by air to bring to us the things that
we need and want from around the globe. With global economic growth and the trend
towards reducing regulation of air travel markets, demand for air transport will rise.
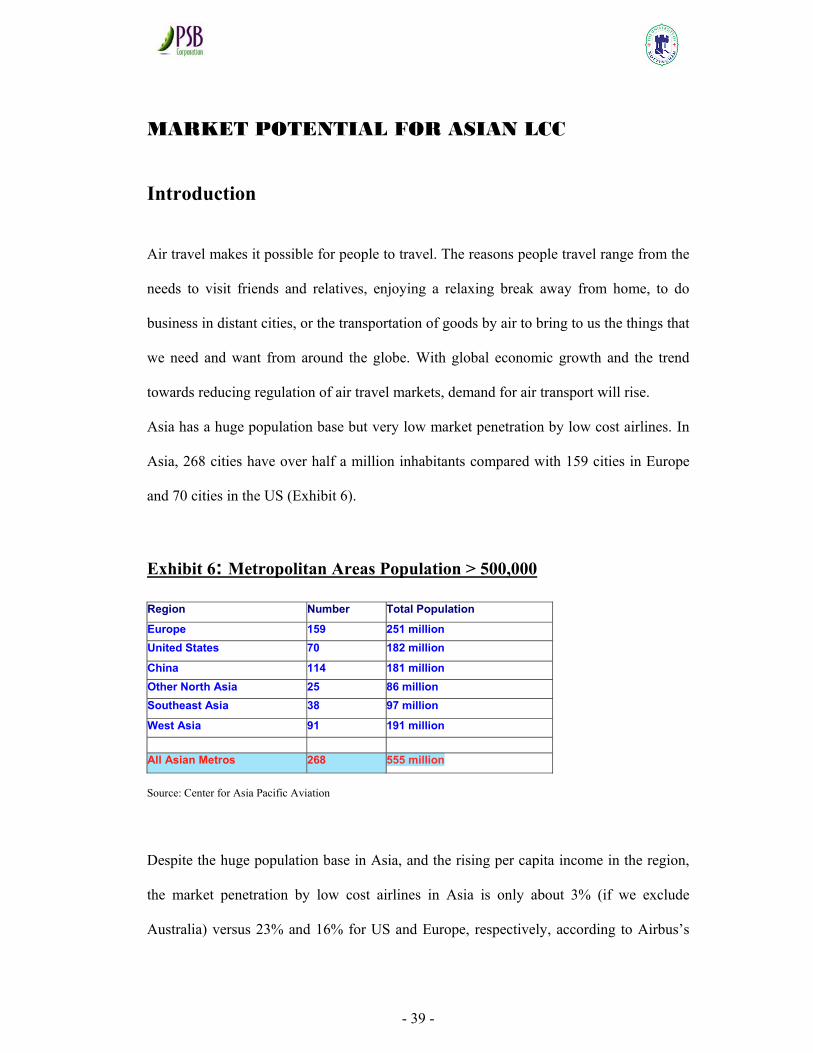
Asia has a huge population base but very low market penetration by low cost airlines. In
Asia, 268 cities have over half a million inhabitants compared with 159 cities in Europe
and 70 cities in the US (Exhibit 6).
Exhibit 6: Metropolitan Areas Population > 500,000
Region Number Total Population
Europe 159 251 million United States 70 182 million
China 114 181 million Other North Asia 25 86 million Southeast Asia 38 97 million
West Asia 91 191 million
All Asian Metros 268 555 million Source: Center for Asia Pacific Aviation
Despite the huge population base in Asia, and the rising per capita income in the region,
the market penetration by low cost airlines in Asia is only about 3% (if we exclude
Australia) versus 23% and 16% for US and Europe, respectively, according to Airbus’s
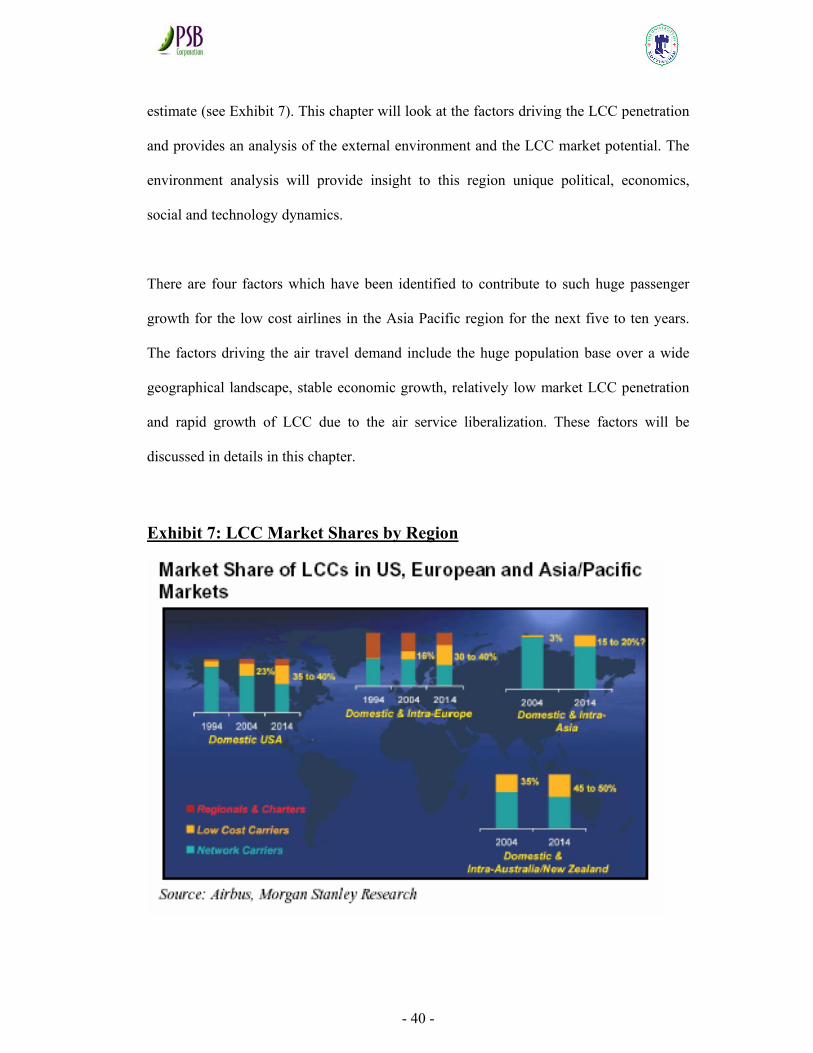
- 40 -
estimate (see Exhibit 7). This chapter will look at the factors driving the LCC penetration
and provides an analysis of the external environment and the LCC market potential. The
environment analysis will provide insight to this region unique political, economics,
social and technology dynamics.
There are four factors which have been identified to contribute to such huge passenger
growth for the low cost airlines in the Asia Pacific region for the next five to ten years.
The factors driving the air travel demand include the huge population base over a wide
geographical landscape, stable economic growth, relatively low market LCC penetration
and rapid growth of LCC due to the air service liberalization. These factors will be
discussed in details in this chapter.
Exhibit 7: LCC Market Shares by Region
- 41 -
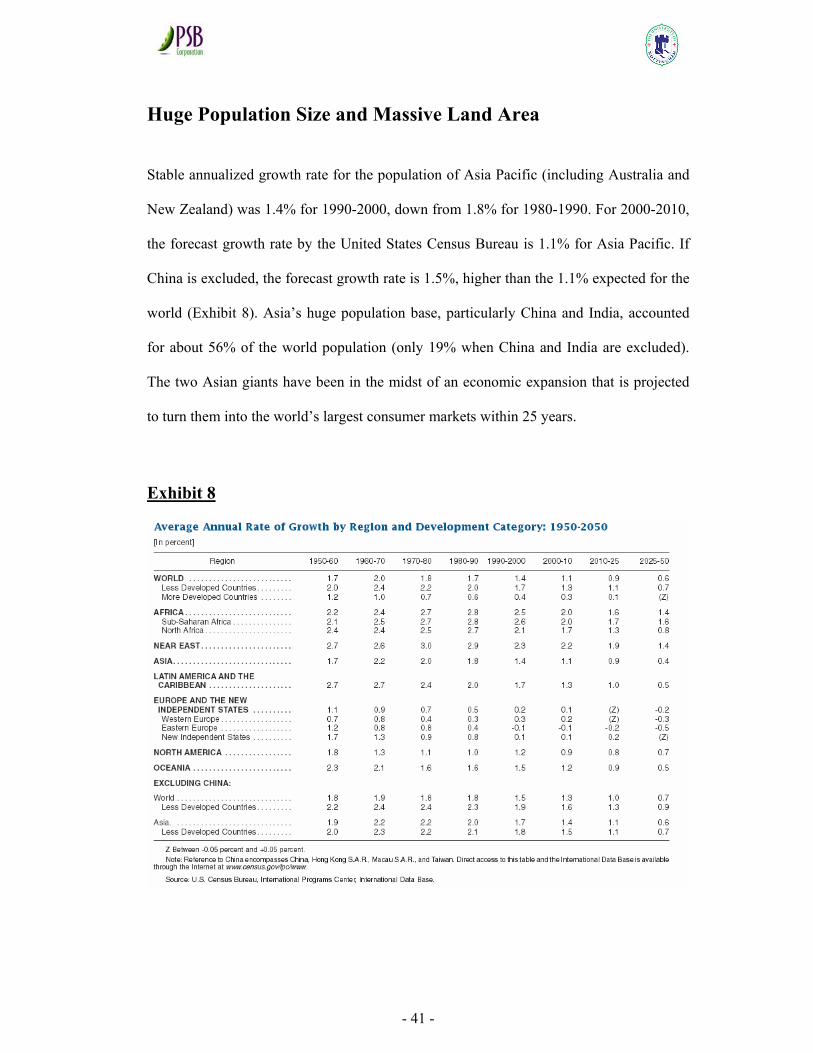
Huge Population Size and Massive Land Area
Stable annualized growth rate for the population of Asia Pacific (including Australia and
New Zealand) was 1.4% for 1990-2000, down from 1.8% for 1980-1990. For 2000-2010,
the forecast growth rate by the United States Census Bureau is 1.1% for Asia Pacific. If
China is excluded, the forecast growth rate is 1.5%, higher than the 1.1% expected for the
world (Exhibit 8). Asia’s huge population base, particularly China and India, accounted
for about 56% of the world population (only 19% when China and India are excluded).
The two Asian giants have been in the midst of an economic expansion that is projected
to turn them into the world’s largest consumer markets within 25 years.
Exhibit 8
- 42 -
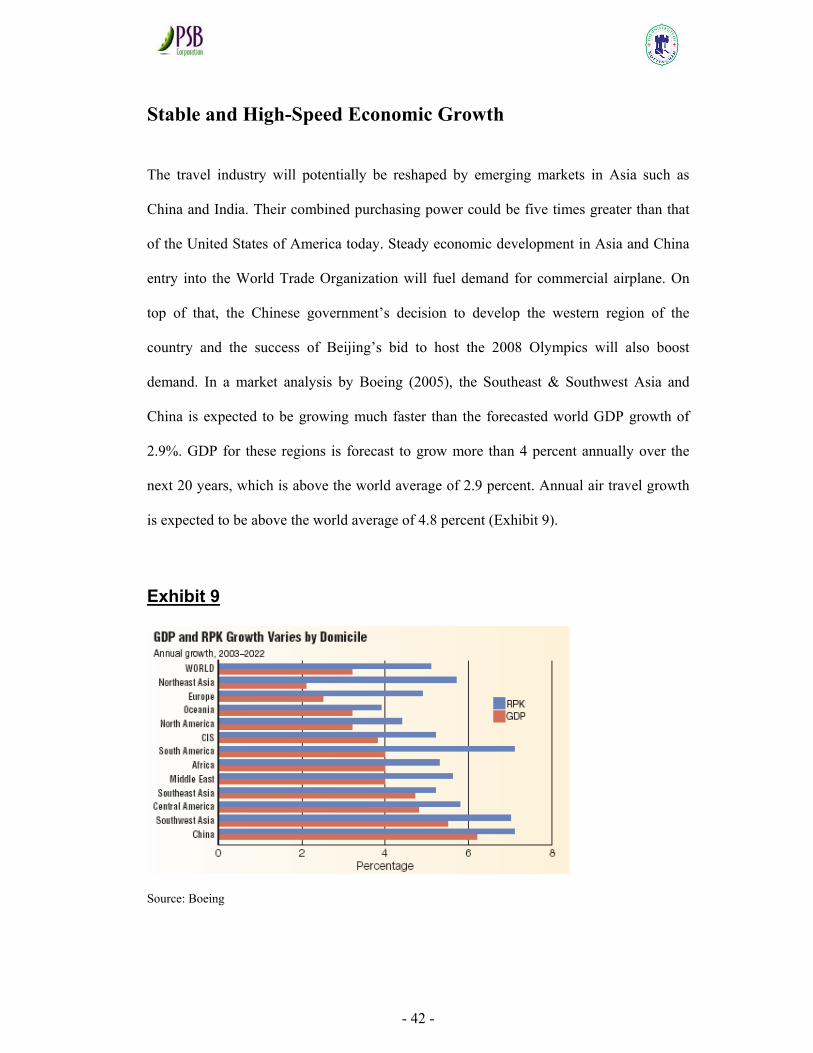
Stable and High-Speed Economic Growth
The travel industry will potentially be reshaped by emerging markets in Asia such as
China and India. Their combined purchasing power could be five times greater than that
of the United States of America today. Steady economic development in Asia and China
entry into the World Trade Organization will fuel demand for commercial airplane. On
top of that, the Chinese government’s decision to develop the western region of the
country and the success of Beijing’s bid to host the 2008 Olympics will also boost
demand. In a market analysis by Boeing (2005), the Southeast & Southwest Asia and
China is expected to be growing much faster than the forecasted world GDP growth of
2.9%. GDP for these regions is forecast to grow more than 4 percent annually over the
next 20 years, which is above the world average of 2.9 percent. Annual air travel growth
is expected to be above the world average of 4.8 percent (Exhibit 9).
Exhibit 9
Source: Boeing
- 43 -
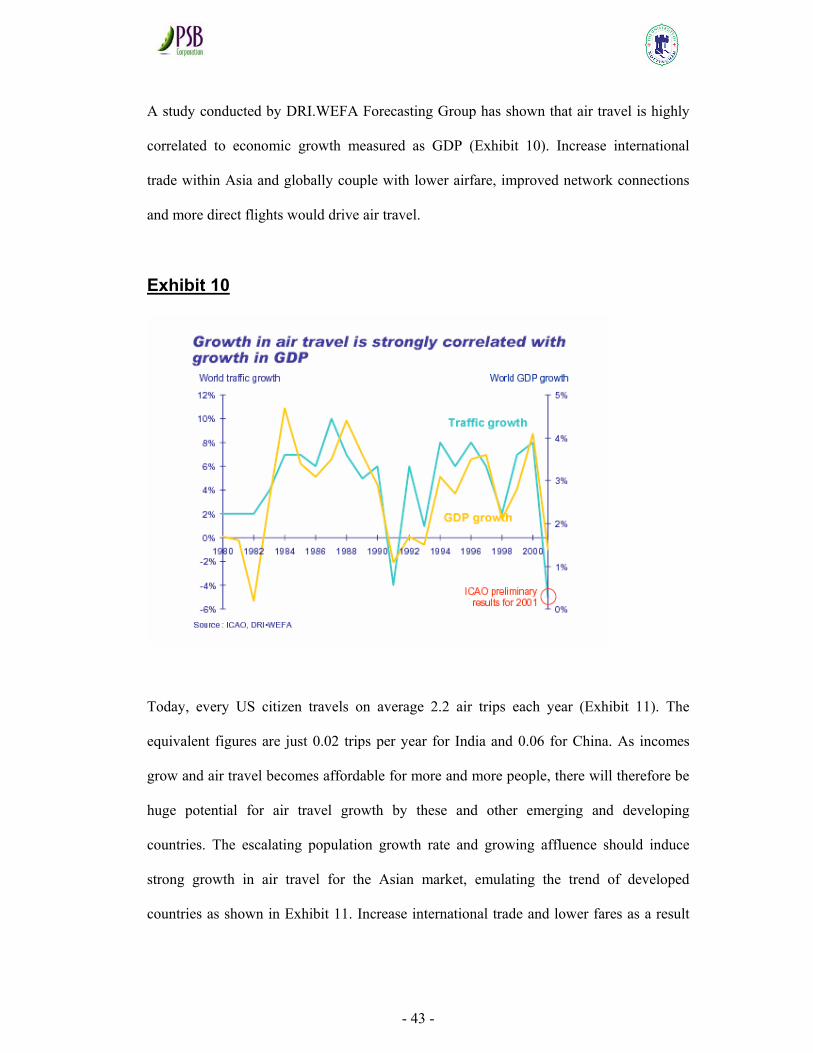
A study conducted by DRI.WEFA Forecasting Group has shown that air travel is highly
correlated to economic growth measured as GDP (Exhibit 10). Increase international
trade within Asia and globally couple with lower airfare, improved network connections
and more direct flights would drive air travel.
Exhibit 10
Today, every US citizen travels on average 2.2 air trips each year (Exhibit 11). The
equivalent figures are just 0.02 trips per year for India and 0.06 for China. As incomes
grow and air travel becomes affordable for more and more people, there will therefore be
huge potential for air travel growth by these and other emerging and developing
countries. The escalating population growth rate and growing affluence should induce
strong growth in air travel for the Asian market, emulating the trend of developed
countries as shown in Exhibit 11. Increase international trade and lower fares as a result
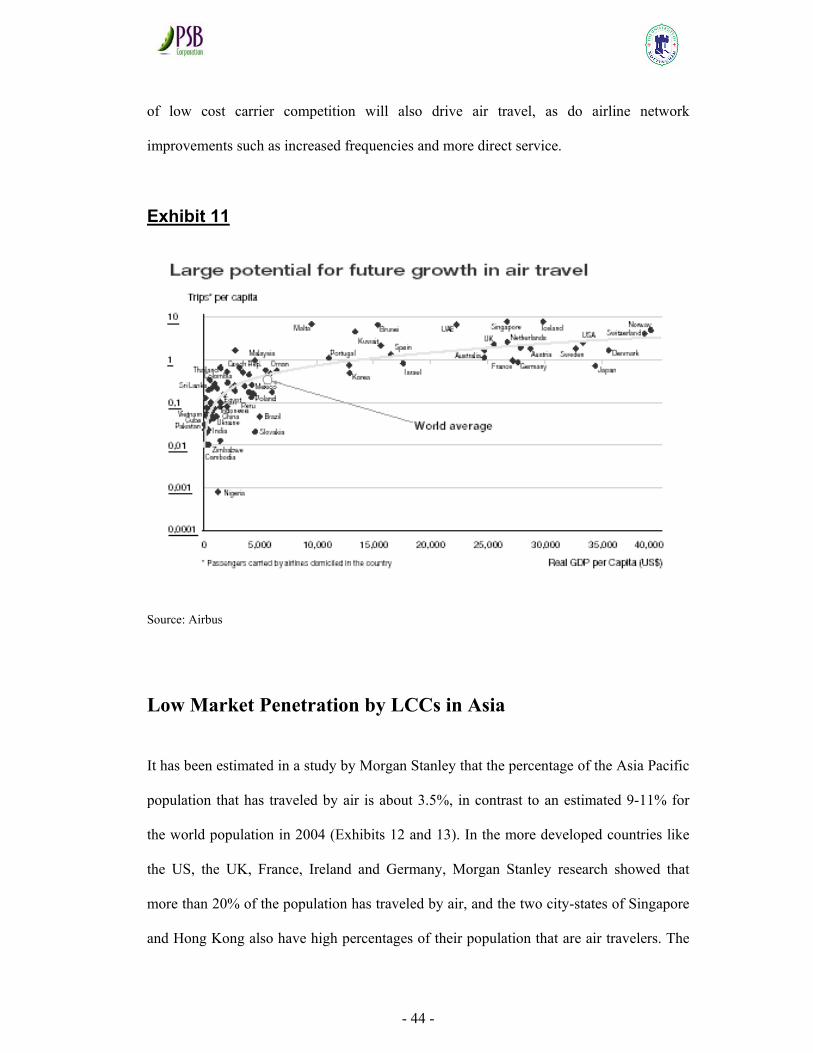
- 44 -
of low cost carrier competition will also drive air travel, as do airline network
improvements such as increased frequencies and more direct service.
Exhibit 11
Source: Airbus
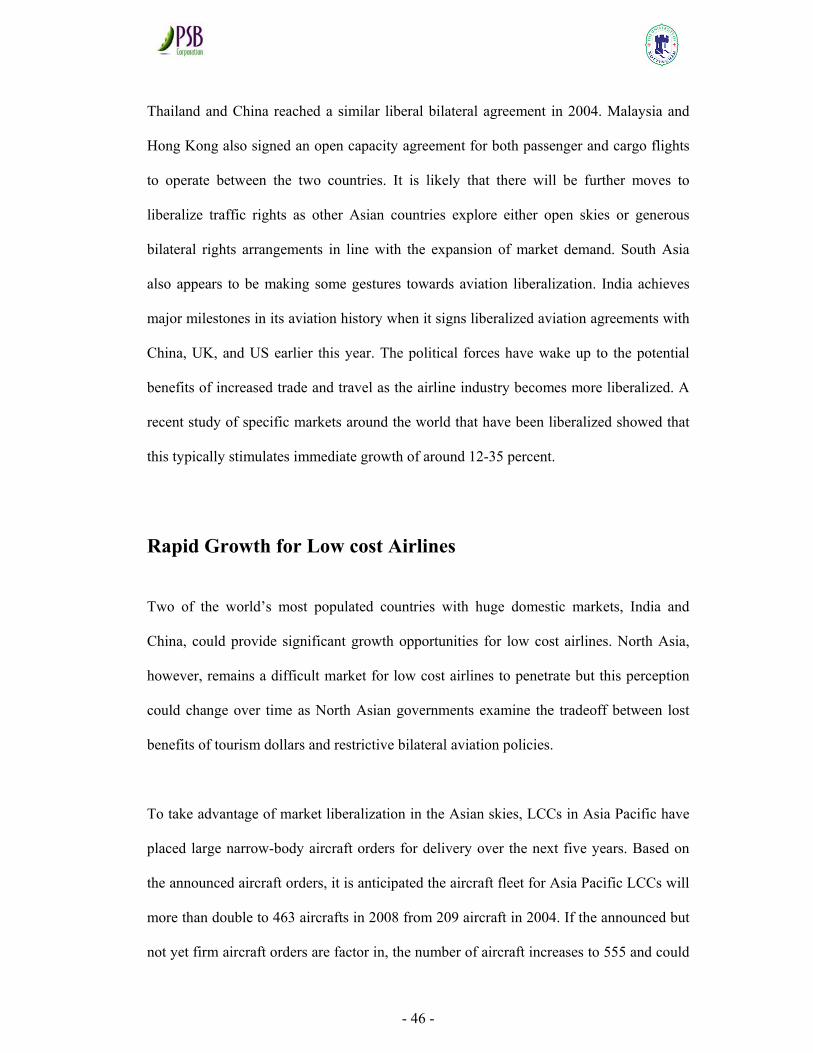
Low Market Penetration by LCCs in Asia
It has been estimated in a study by Morgan Stanley that the percentage of the Asia Pacific
population that has traveled by air is about 3.5%, in contrast to an estimated 9-11% for
the world population in 2004 (Exhibits 12 and 13). In the more developed countries like
the US, the UK, France, Ireland and Germany, Morgan Stanley research showed that
more than 20% of the population has traveled by air, and the two city-states of Singapore
and Hong Kong also have high percentages of their population that are air travelers. The
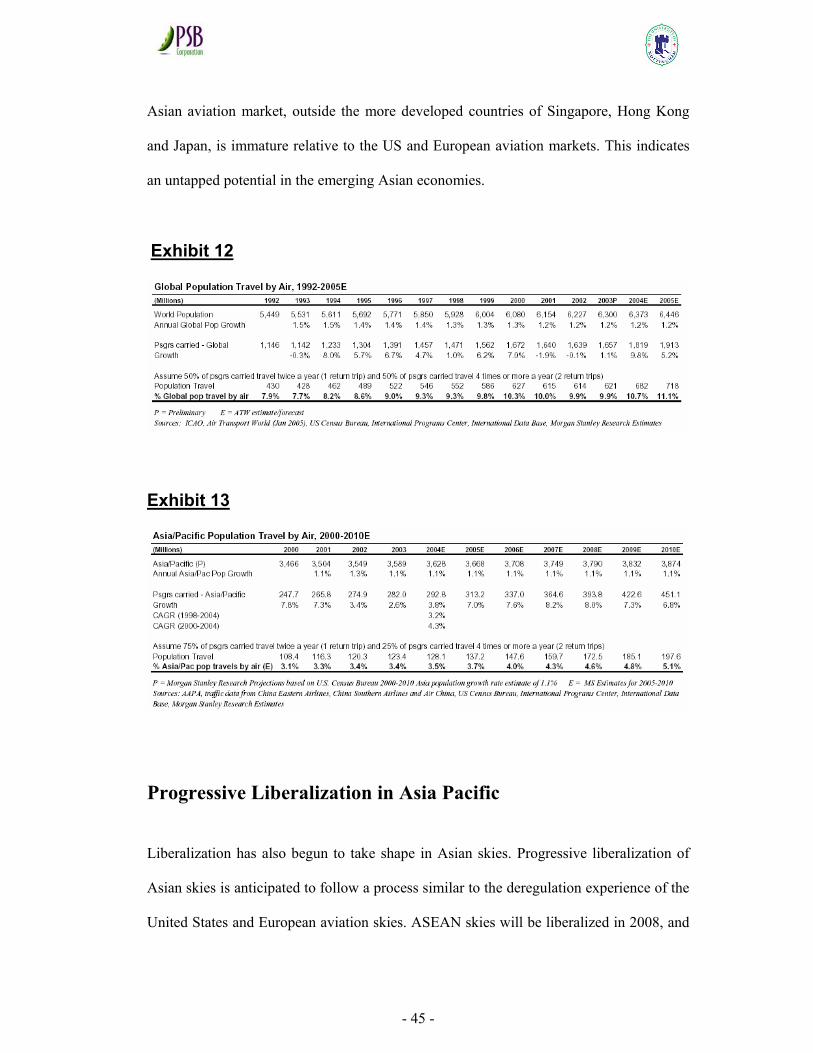
- 45 -
Asian aviation market, outside the more developed countries of Singapore, Hong Kong
and Japan, is immature relative to the US and European aviation markets. This indicates
an untapped potential in the emerging Asian economies.
Exhibit 12
Exhibit 13
Progressive Liberalization in Asia Pacific
Liberalization has also begun to take shape in Asian skies. Progressive liberalization of
Asian skies is anticipated to follow a process similar to the deregulation experience of the
United States and European aviation skies. ASEAN skies will be liberalized in 2008, and
- 46 -
Thailand and China reached a similar liberal bilateral agreement in 2004. Malaysia and
Hong Kong also signed an open capacity agreement for both passenger and cargo flights
to operate between the two countries. It is likely that there will be further moves to
liberalize traffic rights as other Asian countries explore either open skies or generous
bilateral rights arrangements in line with the expansion of market demand. South Asia
also appears to be making some gestures towards aviation liberalization. India achieves
major milestones in its aviation history when it signs liberalized aviation agreements with
China, UK, and US earlier this year. The political forces have wake up to the potential
benefits of increased trade and travel as the airline industry becomes more liberalized. A
recent study of specific markets around the world that have been liberalized showed that
this typically stimulates immediate growth of around 12-35 percent.
Rapid Growth for Low cost Airlines
Two of the world’s most populated countries with huge domestic markets, India and
China, could provide significant growth opportunities for low cost airlines. North Asia,
however, remains a difficult market for low cost airlines to penetrate but this perception
could change over time as North Asian governments examine the tradeoff between lost
benefits of tourism dollars and restrictive bilateral aviation policies.
To take advantage of market liberalization in the Asian skies, LCCs in Asia Pacific have
placed large narrow-body aircraft orders for delivery over the next five years. Based on
the announced aircraft orders, it is anticipated the aircraft fleet for Asia Pacific LCCs will
more than double to 463 aircrafts in 2008 from 209 aircraft in 2004. If the announced but
not yet firm aircraft orders are factor in, the number of aircraft increases to 555 and could
- 47 -
be higher over the next 12 months as more LCCs enter the market. For India, it is
determine that there will be 224 aircraft in 2008 with the announced start up of at least 6
new airlines, compared with only 12 aircraft in 2004. This is with the assumption that all
aircraft orders by Indian LCCs are taken up.
As Asian skies are liberalized, we project passenger growth for the Asia Pacific market
could increase at a rate of 7.5% a year for the next five years, assuming there are no
external macro shocks to the airline industry. It is anticipated that low cost airlines will
drive the growth with new first time travelers, and a study by Morgan Stanley’s
simulation model projects a CAGR of 20% for the next five years. The huge increase in
narrow-body aircraft ordered supports the 20% growth forecast in passengers carried but
the impact of lower fares and yield, especially on the short-sector flights, will be negative
for full-service carriers.
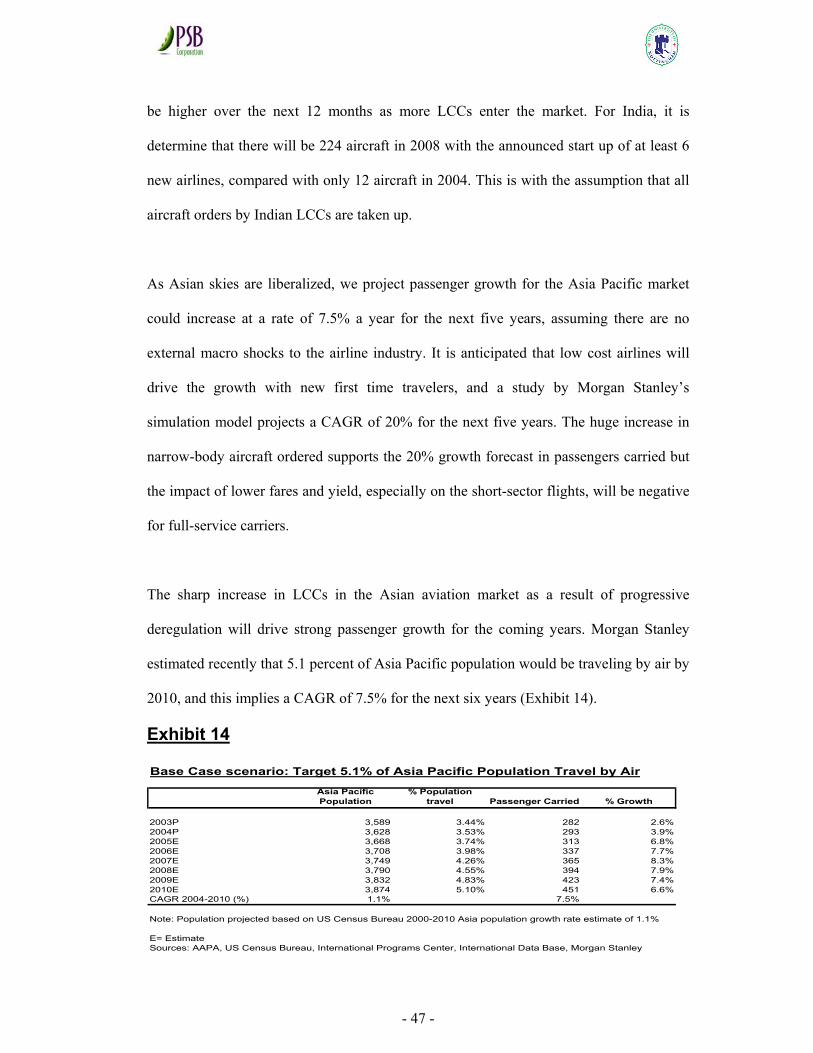
The sharp increase in LCCs in the Asian aviation market as a result of progressive
deregulation will drive strong passenger growth for the coming years. Morgan Stanley
estimated recently that 5.1 percent of Asia Pacific population would be traveling by air by
2010, and this implies a CAGR of 7.5% for the next six years (Exhibit 14).
Exhibit 14
Base Case scenario: Target 5.1% of Asia Pacific Population Travel by Air
Asia Pacific Population
% Population travel Passenger Carried % Growth
2003P 3,589 3.44% 282 2.6%2004P 3,628 3.53% 293 3.9%2005E 3,668 3.74% 313 6.8%2006E 3,708 3.98% 337 7.7%2007E 3,749 4.26% 365 8.3%2008E 3,790 4.55% 394 7.9%2009E 3,832 4.83% 423 7.4%2010E 3,874 5.10% 451 6.6%CAGR 2004-2010 (%) 1.1% 7.5%
Note: Population projected based on US Census Bureau 2000-2010 Asia population growth rate estimate of 1.1%
E= EstimateSources: AAPA, US Census Bureau, International Programs Center, International Data Base, Morgan Stanley
- 48 -
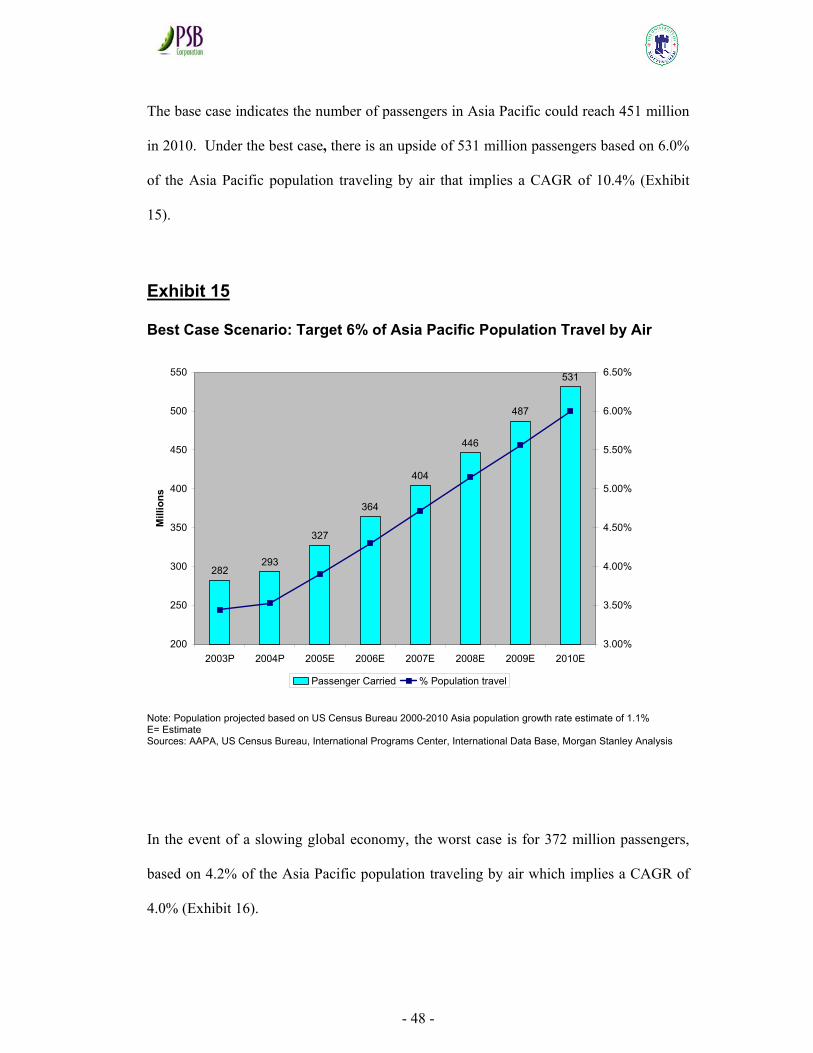
The base case indicates the number of passengers in Asia Pacific could reach 451 million
in 2010. Under the best case, there is an upside of 531 million passengers based on 6.0%
of the Asia Pacific population traveling by air that implies a CAGR of 10.4% (Exhibit
15).
Exhibit 15
Best Case Scenario: Target 6% of Asia Pacific Population Travel by Air
282293
327
364
404
446
487
531
200
250
300
350
400
450
500
550
2003P 2004P 2005E 2006E 2007E 2008E 2009E 2010E
Mill
ions
3.00%
3.50%
4.00%
4.50%
5.00%
5.50%
6.00%
6.50%
Passenger Carried % Population travel
Note: Population projected based on US Census Bureau 2000-2010 Asia population growth rate estimate of 1.1% E= Estimate Sources: AAPA, US Census Bureau, International Programs Center, International Data Base, Morgan Stanley Analysis
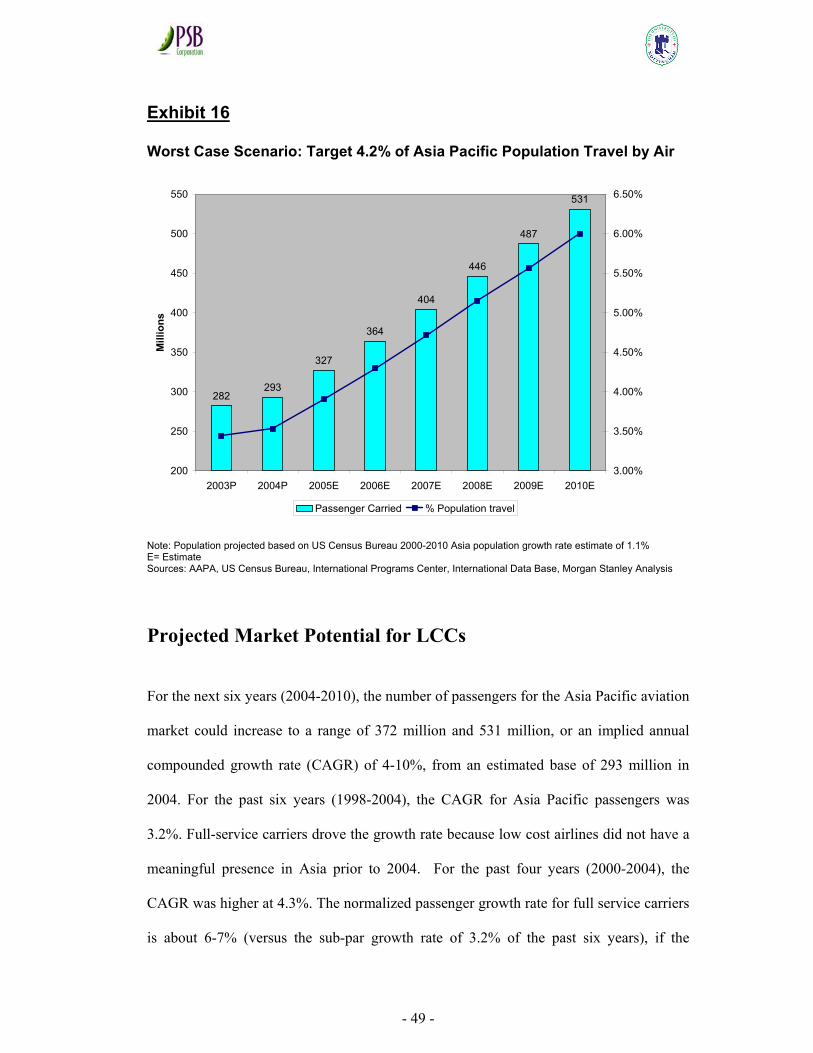
In the event of a slowing global economy, the worst case is for 372 million passengers,
based on 4.2% of the Asia Pacific population traveling by air which implies a CAGR of
4.0% (Exhibit 16).
- 49 -
Exhibit 16
Worst Case Scenario: Target 4.2% of Asia Pacific Population Travel by Air
282293
327
364
404
446
487
531
200
250
300
350
400
450
500
550
2003P 2004P 2005E 2006E 2007E 2008E 2009E 2010E
Mill
ions
3.00%
3.50%
4.00%
4.50%
5.00%
5.50%
6.00%
6.50%
Passenger Carried % Population travel
Note: Population projected based on US Census Bureau 2000-2010 Asia population growth rate estimate of 1.1% E= Estimate Sources: AAPA, US Census Bureau, International Programs Center, International Data Base, Morgan Stanley Analysis
Projected Market Potential for LCCs
For the next six years (2004-2010), the number of passengers for the Asia Pacific aviation
market could increase to a range of 372 million and 531 million, or an implied annual
compounded growth rate (CAGR) of 4-10%, from an estimated base of 293 million in
2004. For the past six years (1998-2004), the CAGR for Asia Pacific passengers was
3.2%. Full-service carriers drove the growth rate because low cost airlines did not have a
meaningful presence in Asia prior to 2004. For the past four years (2000-2004), the
CAGR was higher at 4.3%. The normalized passenger growth rate for full service carriers
is about 6-7% (versus the sub-par growth rate of 3.2% of the past six years), if the
- 50 -
external macro shock events of the Asian economic crisis (1997/98), 9/11 terrorist attacks
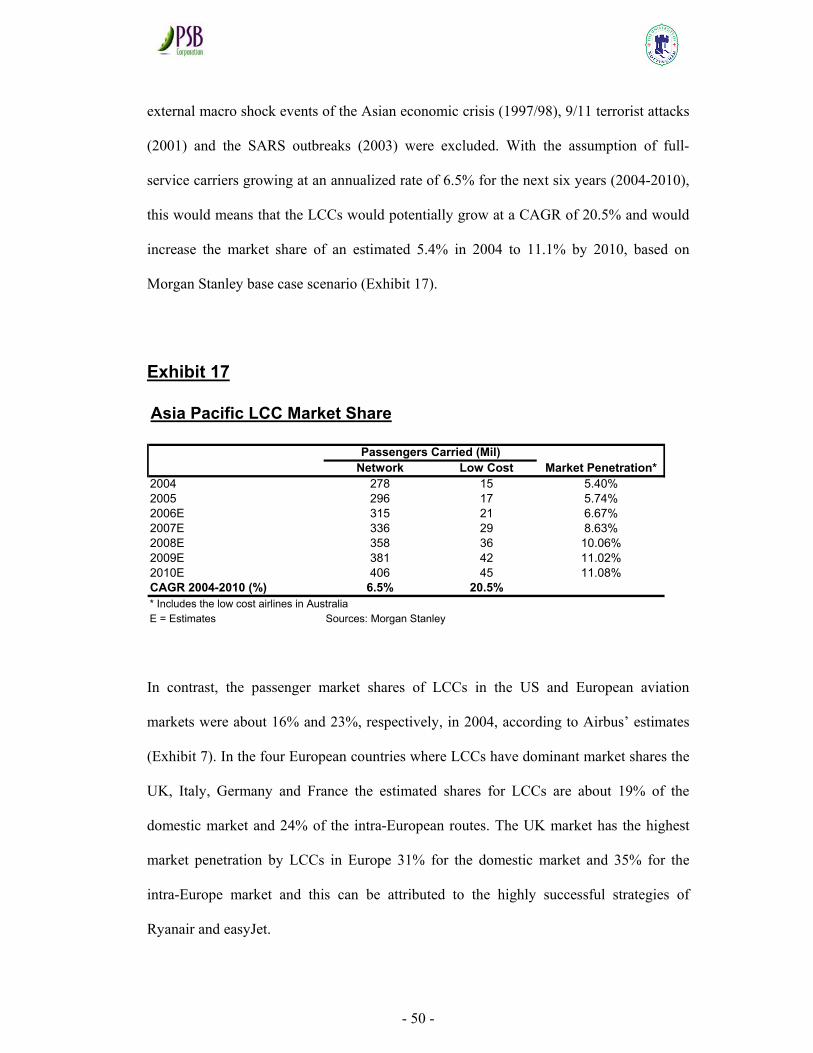
(2001) and the SARS outbreaks (2003) were excluded. With the assumption of full-
service carriers growing at an annualized rate of 6.5% for the next six years (2004-2010),
this would means that the LCCs would potentially grow at a CAGR of 20.5% and would
increase the market share of an estimated 5.4% in 2004 to 11.1% by 2010, based on
Morgan Stanley base case scenario (Exhibit 17).
Exhibit 17
Asia Pacific LCC Market Share
Network Low Cost Market Penetration*2004 278 15 5.40%2005 296 17 5.74%2006E 315 21 6.67%2007E 336 29 8.63%2008E 358 36 10.06%2009E 381 42 11.02%2010E 406 45 11.08%CAGR 2004-2010 (%) 6.5% 20.5%* Includes the low cost airlines in AustraliaE = Estimates Sources: Morgan Stanley
Passengers Carried (Mil)
In contrast, the passenger market shares of LCCs in the US and European aviation
markets were about 16% and 23%, respectively, in 2004, according to Airbus’ estimates
(Exhibit 7). In the four European countries where LCCs have dominant market shares the
UK, Italy, Germany and France the estimated shares for LCCs are about 19% of the
domestic market and 24% of the intra-European routes. The UK market has the highest
market penetration by LCCs in Europe 31% for the domestic market and 35% for the
intra-Europe market and this can be attributed to the highly successful strategies of
Ryanair and easyJet.
- 51 -
Conclusion
Asia Pacific, a far-flung region that stretches from Northeast Asia to New Zealand and
across to India, which accounts for 56% of the world population and favorable macro
environments coupled with a large growing affluent population will fuel new demand for
discretionary travel. Asian LCC with the right business model and strategies will
definitely ride on this huge potential for discretionary air travel and emulate the success
exhibit in North American and Europe. Although the pace of bilateral liberalization is
spreading at a much slower pace than in other markets around the world, the emergence
of low cost carriers in Asia Pacific is accelerating this trend.
Within Asia, China and India could provide a bright prospect for budding LCC
entrepreneurs. Many aspiring entrepreneurs have place big orders for airplanes to start
LCC operation there. In 2004, it is estimated that the passenger market share for low cost
airlines in the Asian aviation market was about 2-3%. If Australia is included, the market
share is estimated to be about 5%. The low-cost airlines could increase their share of the
Asia Pacific aviation market, which includes Japan and Australia to about 11% in 2010,
and could reach higher rates if external macro environment remains favorable. This is
very conservative outlook compares with current rates of 23% for Europe and 16% for the
US market in 2004. The combination of progressive liberalization, vast growing affluent
population, improve airplane capabilities will shape the airline strategies going forward.
The next chapter will examine the type of airplane used by LCC and what the future look
likes for the two dominant aircrafts manufacturers who have employed a combination of
product and marketing strategies to race against each other to become the supplier of

- 52 -
choice for this market segment. It will also review the future aircraft deliveries to various
LCC operators.
- 53 -
Asia Pacific Airlines Fleet Analysis
Introduction
This chapter will examine the aircraft deliveries to various LCC operators and the aircraft
market trend. This will help to understand the potential beneficiaries of LCC growth in
later chapter. In 2004, the Asia Pacific traditional full-service airline industry, excluding
airlines in China, operated a fleet of 1,177 aircraft. The growth in aircraft numbers for
Asian airlines has been in the low single digit since the Asian economic crisis in 1997.
This is due in parts to Airlines accelerating the retirement of older inefficient aircraft to
cut capacity in the aftermath of September 11th terrorist attacks in 2001 and SARS
outbreak in 2003. Overall in the past ten years from 1994-2004, the average annual
compounded growth rate (CAGR) was 2.1% for the Asia Pacific passenger plane fleet
(Exhibit 18).
Exhibit 18
Asia Pacific Passenger Plane Fleet – 1994-2004
1994 1995 1996 1997 1998 1999 2000 2001 2002 2003 2004CAGR 94-04
Aircraft 964 1,014 1,100 1,153 1,181 1,198 1,133 1,180 1,128 1,145 1,177 2.1%
% Change 5.2% 8.5% 4.8% 2.4% 1.4% -5.4% 4.1% -4.4% 1.5% 2.8%
Seat Capacity (E) 257,311 280,478 303,811 320,762 323,799 322,465 321,980 333,934 322,775 327,607 331,949 2.6%
% Change 9.0% 8.3% 5.6% 0.9% -0.4% -0.2% 3.7% -3.3% 1.5% 1.3% Source: AAPA E=Estimate
In terms of aircraft seats capacity added over the past ten years, it is estimate the CAGR
was about 2.6%, and higher than the aircraft growth rate of 2.0%, due to the strong
growth in the number of wide body airplanes in the region. More interestingly, over the
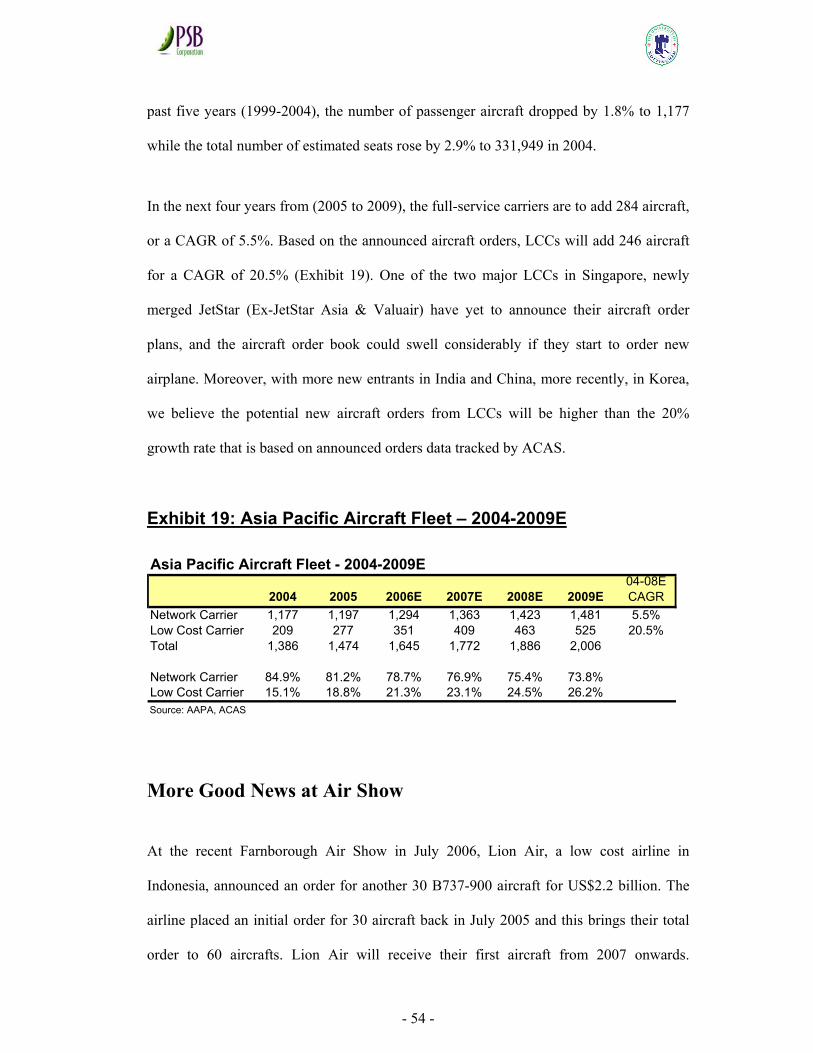
- 54 -
past five years (1999-2004), the number of passenger aircraft dropped by 1.8% to 1,177
while the total number of estimated seats rose by 2.9% to 331,949 in 2004.
In the next four years from (2005 to 2009), the full-service carriers are to add 284 aircraft,
or a CAGR of 5.5%. Based on the announced aircraft orders, LCCs will add 246 aircraft
for a CAGR of 20.5% (Exhibit 19). One of the two major LCCs in Singapore, newly
merged JetStar (Ex-JetStar Asia & Valuair) have yet to announce their aircraft order
plans, and the aircraft order book could swell considerably if they start to order new
airplane. Moreover, with more new entrants in India and China, more recently, in Korea,
we believe the potential new aircraft orders from LCCs will be higher than the 20%
growth rate that is based on announced orders data tracked by ACAS.
Exhibit 19: Asia Pacific Aircraft Fleet – 2004-2009E
Asia Pacific Aircraft Fleet - 2004-2009E
2004 2005 2006E 2007E 2008E 2009E04-08E CAGR
Network Carrier 1,177 1,197 1,294 1,363 1,423 1,481 5.5%Low Cost Carrier 209 277 351 409 463 525 20.5%Total 1,386 1,474 1,645 1,772 1,886 2,006
Network Carrier 84.9% 81.2% 78.7% 76.9% 75.4% 73.8%Low Cost Carrier 15.1% 18.8% 21.3% 23.1% 24.5% 26.2%Source: AAPA, ACAS
More Good News at Air Show
At the recent Farnborough Air Show in July 2006, Lion Air, a low cost airline in
Indonesia, announced an order for another 30 B737-900 aircraft for US$2.2 billion. The
airline placed an initial order for 30 aircraft back in July 2005 and this brings their total
order to 60 aircrafts. Lion Air will receive their first aircraft from 2007 onwards.
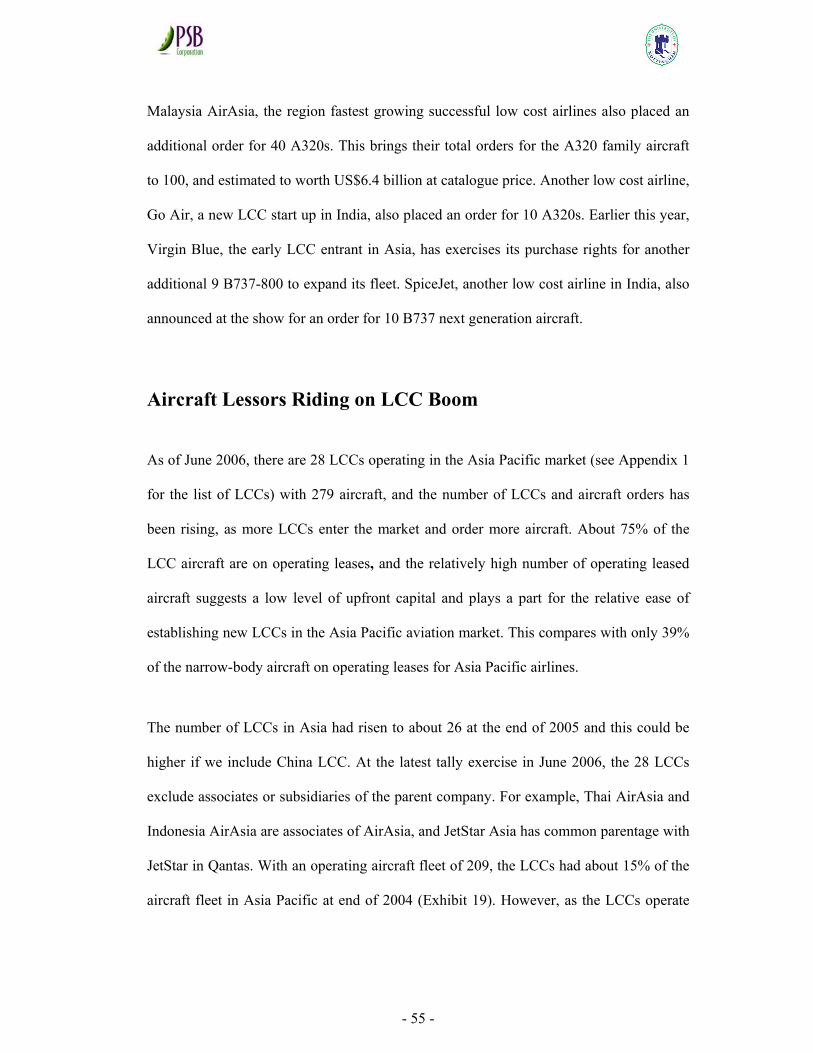
- 55 -
Malaysia AirAsia, the region fastest growing successful low cost airlines also placed an
additional order for 40 A320s. This brings their total orders for the A320 family aircraft
to 100, and estimated to worth US$6.4 billion at catalogue price. Another low cost airline,
Go Air, a new LCC start up in India, also placed an order for 10 A320s. Earlier this year,
Virgin Blue, the early LCC entrant in Asia, has exercises its purchase rights for another
additional 9 B737-800 to expand its fleet. SpiceJet, another low cost airline in India, also
announced at the show for an order for 10 B737 next generation aircraft.
Aircraft Lessors Riding on LCC Boom
As of June 2006, there are 28 LCCs operating in the Asia Pacific market (see Appendix 1
for the list of LCCs) with 279 aircraft, and the number of LCCs and aircraft orders has
been rising, as more LCCs enter the market and order more aircraft. About 75% of the
LCC aircraft are on operating leases, and the relatively high number of operating leased
aircraft suggests a low level of upfront capital and plays a part for the relative ease of
establishing new LCCs in the Asia Pacific aviation market. This compares with only 39%
of the narrow-body aircraft on operating leases for Asia Pacific airlines.
The number of LCCs in Asia had risen to about 26 at the end of 2005 and this could be
higher if we include China LCC. At the latest tally exercise in June 2006, the 28 LCCs
exclude associates or subsidiaries of the parent company. For example, Thai AirAsia and
Indonesia AirAsia are associates of AirAsia, and JetStar Asia has common parentage with
JetStar in Qantas. With an operating aircraft fleet of 209, the LCCs had about 15% of the
aircraft fleet in Asia Pacific at end of 2004 (Exhibit 19). However, as the LCCs operate
- 56 -
with smaller narrow-body aircraft, it is estimate the market share for LCCs, based on
available seats, is only about 8%.
Up till the end of Farnborough Air Show 2006, the announced aircraft fleet by both full-
service and low cost carriers is estimate that the LCCs will have about 26% of the aircraft
fleet by 2009 (Exhibit 19). If major LCCs in Singapore such as JetStar and other regional
LCC start-ups begin to order new aircraft, it is not hard to imagine that the aircraft fleet
operated by the LCCs could expand to a market share in excess of 26% on the Asia
Pacific aircraft fleet in 2009. At the Paris Air Show in 2005, the Indian airline carriers
placed orders for 213 aircraft valued at US$23.9 billion from Airbus, Boeing and
Empresa Brasileira de Aeronautica, making the country the biggest buyer of planes in the
region. Kingfisher Airlines and other low cost airlines in India made up 28% of the
aircraft orders and commitments for Airbus and Boeing planes.
Shift in Low Cost Airlines Aircraft Choices
The top six LCCs in Asia Pacific, AirAsia, Virgin Blue, Air Deccan, IndiGo, Cebu
Pacific and the restructure JetStar are expected to have 294 aircraft (or 69% of the LCC
aircraft fleet in 2009 and beyond, up from 118 aircraft or 56% of the aircraft fleet in 2004
(Exhibit 20). Two of the top six LCCs, Cebu Pacific and Air Deccan currently use a
majority of smaller DC9 and ATR42/72 aircraft, respectively, in contrast to the standard
and more efficient B737 or A320 aircraft operated by the LCCs in US and European
markets. However, this trend of using smaller aircraft in Asia will gradually change as the
airport infrastructure are upgraded and both Cebu Pacific and Air Deccan take delivery of
14 A319/A320 aircraft and 51 A320 aircraft, respectively, by 2009.
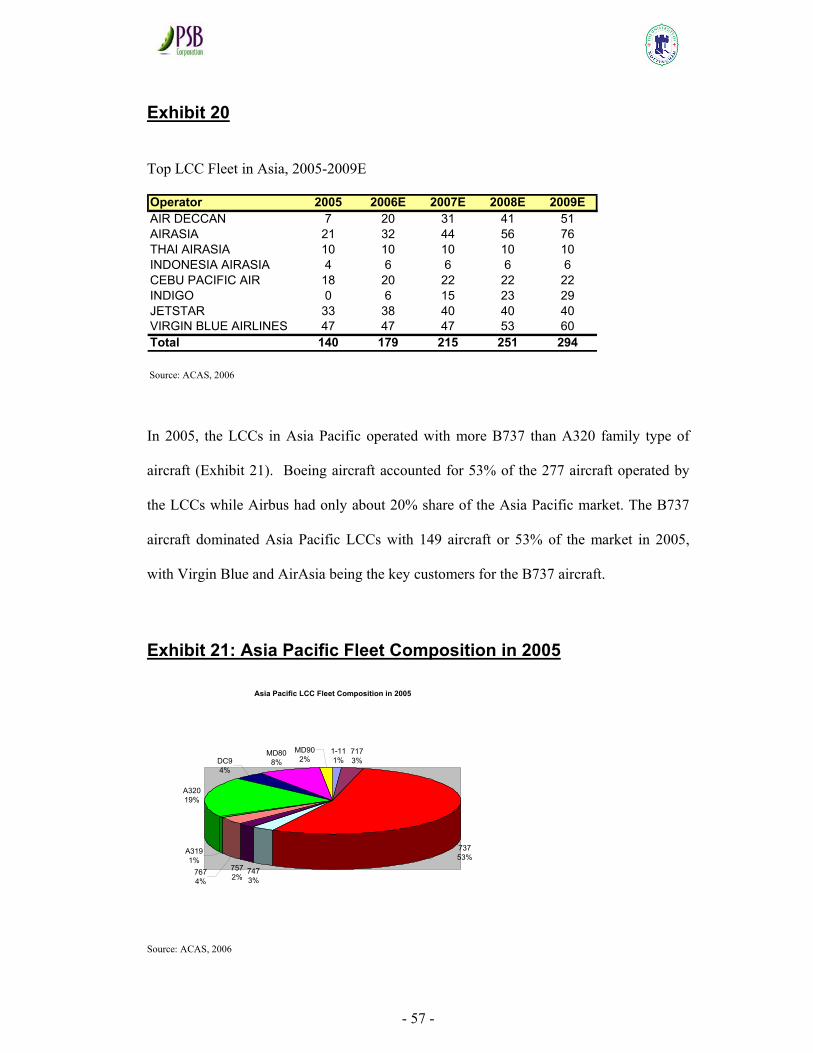
- 57 -
Exhibit 20
Top LCC Fleet in Asia, 2005-2009E
Operator 2005 2006E 2007E 2008E 2009EAIR DECCAN 7 20 31 41 51AIRASIA 21 32 44 56 76THAI AIRASIA 10 10 10 10 10INDONESIA AIRASIA 4 6 6 6 6CEBU PACIFIC AIR 18 20 22 22 22INDIGO 0 6 15 23 29JETSTAR 33 38 40 40 40VIRGIN BLUE AIRLINES 47 47 47 53 60Total 140 179 215 251 294
Source: ACAS, 2006
In 2005, the LCCs in Asia Pacific operated with more B737 than A320 family type of
aircraft (Exhibit 21). Boeing aircraft accounted for 53% of the 277 aircraft operated by
the LCCs while Airbus had only about 20% share of the Asia Pacific market. The B737
aircraft dominated Asia Pacific LCCs with 149 aircraft or 53% of the market in 2005,
with Virgin Blue and AirAsia being the key customers for the B737 aircraft.
Exhibit 21: Asia Pacific Fleet Composition in 2005
Asia Pacific LCC Fleet Composition in 2005
MD902%
1-111%
7173%
73753%
7473%
7572%767
4%
A3191%
A32019%
DC94%
MD808%
Source: ACAS, 2006
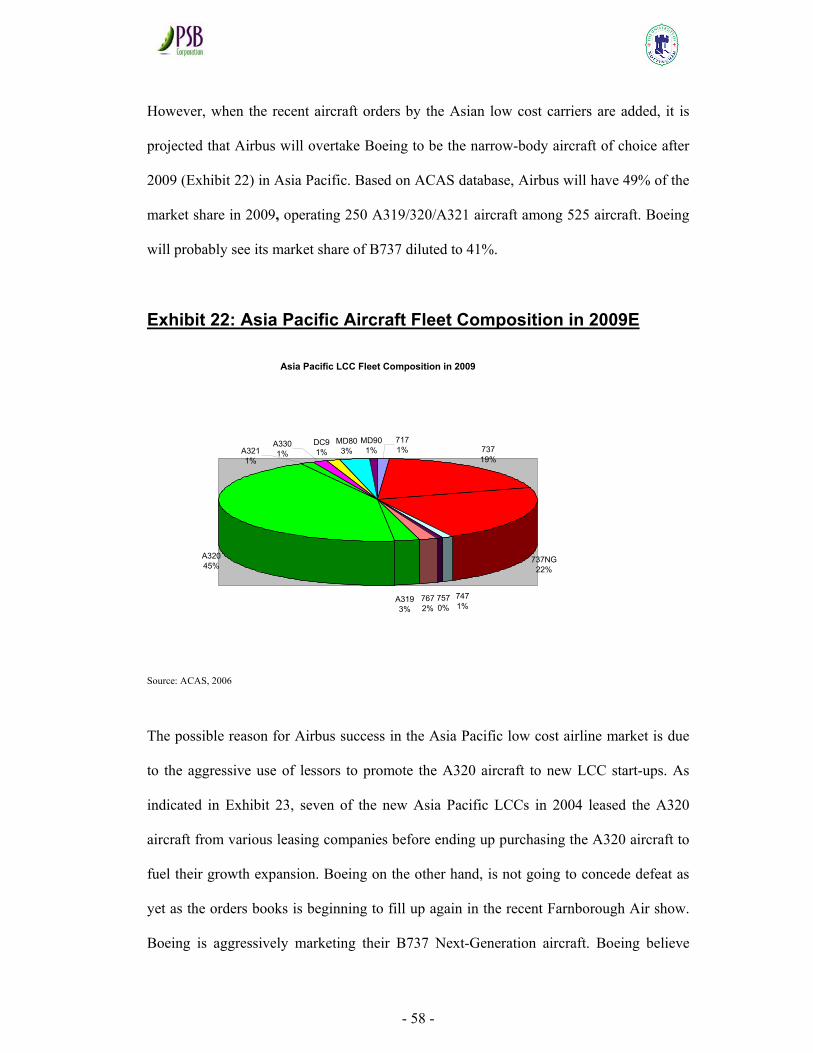
- 58 -
However, when the recent aircraft orders by the Asian low cost carriers are added, it is
projected that Airbus will overtake Boeing to be the narrow-body aircraft of choice after
2009 (Exhibit 22) in Asia Pacific. Based on ACAS database, Airbus will have 49% of the
market share in 2009, operating 250 A319/320/A321 aircraft among 525 aircraft. Boeing
will probably see its market share of B737 diluted to 41%.
Exhibit 22: Asia Pacific Aircraft Fleet Composition in 2009E
Asia Pacific LCC Fleet Composition in 2009
A32045%
A3211%
A3301%
DC91%
MD803%
MD901%
7171%
7672%
A3193%
7570%
7471%
737NG22%
73719%
Source: ACAS, 2006
The possible reason for Airbus success in the Asia Pacific low cost airline market is due
to the aggressive use of lessors to promote the A320 aircraft to new LCC start-ups. As
indicated in Exhibit 23, seven of the new Asia Pacific LCCs in 2004 leased the A320
aircraft from various leasing companies before ending up purchasing the A320 aircraft to
fuel their growth expansion. Boeing on the other hand, is not going to concede defeat as
yet as the orders books is beginning to fill up again in the recent Farnborough Air show.
Boeing is aggressively marketing their B737 Next-Generation aircraft. Boeing believe
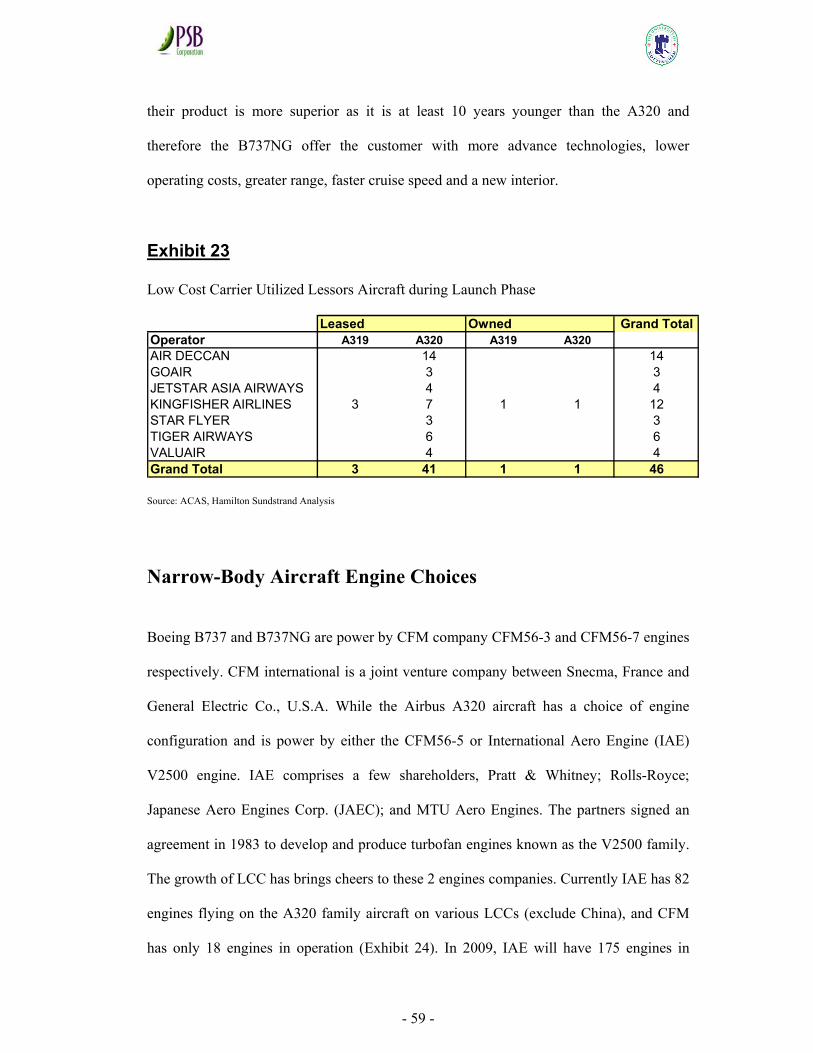
- 59 -
their product is more superior as it is at least 10 years younger than the A320 and
therefore the B737NG offer the customer with more advance technologies, lower
operating costs, greater range, faster cruise speed and a new interior.
Exhibit 23
Low Cost Carrier Utilized Lessors Aircraft during Launch Phase
Leased Owned Grand TotalOperator A319 A320 A319 A320AIR DECCAN 14 14GOAIR 3 3JETSTAR ASIA AIRWAYS 4 4KINGFISHER AIRLINES 3 7 1 1 12STAR FLYER 3 3TIGER AIRWAYS 6 6VALUAIR 4 4Grand Total 3 41 1 1 46
Source: ACAS, Hamilton Sundstrand Analysis
Narrow-Body Aircraft Engine Choices
Boeing B737 and B737NG are power by CFM company CFM56-3 and CFM56-7 engines
respectively. CFM international is a joint venture company between Snecma, France and
General Electric Co., U.S.A. While the Airbus A320 aircraft has a choice of engine
configuration and is power by either the CFM56-5 or International Aero Engine (IAE)
V2500 engine. IAE comprises a few shareholders, Pratt & Whitney; Rolls-Royce;
Japanese Aero Engines Corp. (JAEC); and MTU Aero Engines. The partners signed an
agreement in 1983 to develop and produce turbofan engines known as the V2500 family.
The growth of LCC has brings cheers to these 2 engines companies. Currently IAE has 82
engines flying on the A320 family aircraft on various LCCs (exclude China), and CFM
has only 18 engines in operation (Exhibit 24). In 2009, IAE will have 175 engines in
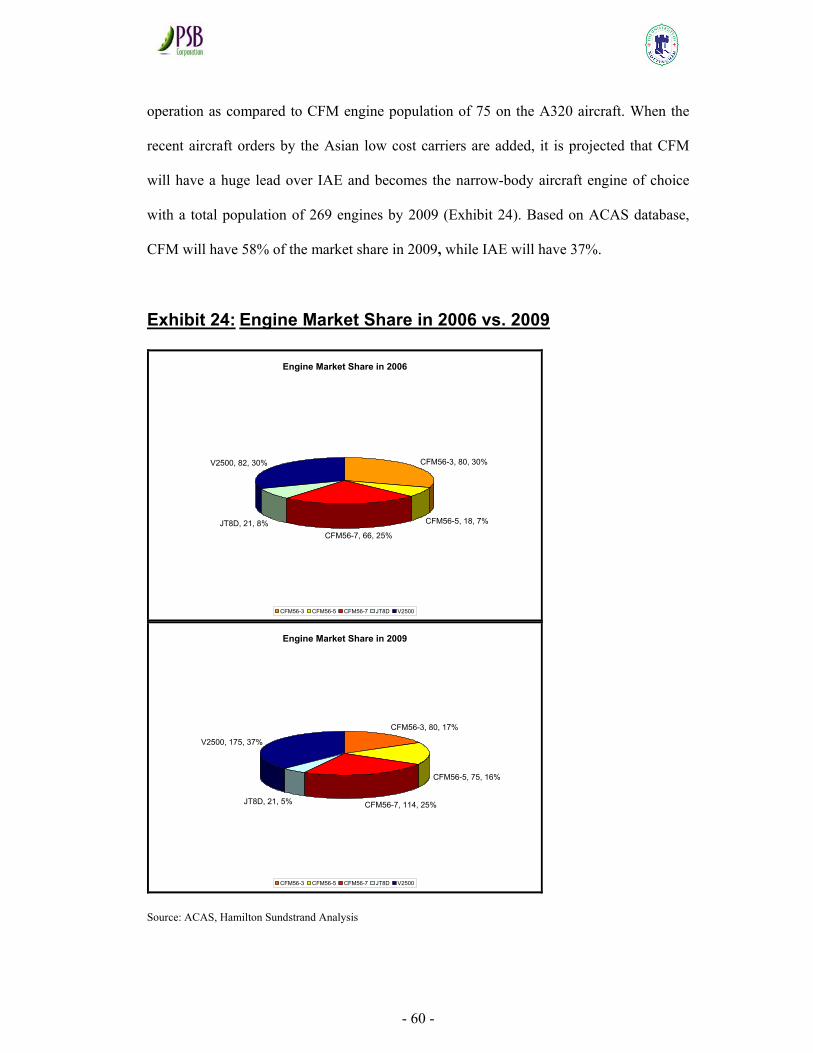
- 60 -
operation as compared to CFM engine population of 75 on the A320 aircraft. When the
recent aircraft orders by the Asian low cost carriers are added, it is projected that CFM
will have a huge lead over IAE and becomes the narrow-body aircraft engine of choice
with a total population of 269 engines by 2009 (Exhibit 24). Based on ACAS database,
CFM will have 58% of the market share in 2009, while IAE will have 37%.
Exhibit 24: Engine Market Share in 2006 vs. 2009
Engine Market Share in 2006
CFM56-3, 80, 30%
CFM56-5, 18, 7%
CFM56-7, 66, 25%JT8D, 21, 8%
V2500, 82, 30%
CFM56-3 CFM56-5 CFM56-7 JT8D V2500
Engine Market Share in 2009
CFM56-3, 80, 17%
CFM56-5, 75, 16%
CFM56-7, 114, 25%JT8D, 21, 5%
V2500, 175, 37%
CFM56-3 CFM56-5 CFM56-7 JT8D V2500 Source: ACAS, Hamilton Sundstrand Analysis
- 61 -
Conclusion
Low cost carriers accounts for about 8% of the available seats in the Asia Pacific aviation
market and about 15% of the aircraft market share. However, LCCs are to put aircraft into
service at about four times the rate of the full service network airlines over the next four
years (2005-2009) and are expected to account for about 26% of the aircraft fleet by
2009. This market trend will greatly benefit the aerospace industry suppliers and aircraft
lessors. Aircraft manufacturer such as Airbus and Boeing, with well position product lines
will continue to grab the lion share of the aircraft orders. Downstream suppliers to the
aircraft manufacturer such as manufacturers for aircraft engines and aircraft systems will
benefit as well. For the narrow-body aircraft engine manufacturer, it is projected that both
International Aero Engine and CFM International will benefit greatly from the LCC boom
with market share of 37% and 58% respectively. As more and more LCCs enter the
profitable Asia Pacific market or expand their fleet to build economy of scale, there could
be great prospect for the aerospace vendors to see a much higher number of aircraft
deliveries, exceeding the annualized growth rate of 20%.
- 62 -
Review of Asian Aviation Regulatory Framework
Introduction
Today commercial aviation market is still governed largely by outdated regulatory
framework laid down in the post World War II era. Despite today’s trend toward
globalization and economic integration, one of the most globalize, technologically driven
industries remains laden by regulations that suppress competition. This did not allow
value surpluses created to be passed on to airlines, communities, and passengers. The
bilateral air service agreements that continue to regulate much of international
commercial aviation define how the airlines will link their two home territories. These
barriers often restrict market growth, force consumer to pay a premium for air services,
and create a series of vested interests.
With great foresight and leadership, United States domestic airline industry was the first
to undergo dramatic changes through the enactment of the Airline Deregulation Act in
1978. This led to a large increase in the entry of new airlines, a remarkable change in
existing airlines' route and fare structures, and a notable increase in the use of air travel
services. Two important amendments were made which transformed the US Airline
industry. First, airlines have the liberty of entry and exit on domestic routes. Second,
airlines were given total autonomy to set fares. After having operated in a tightly
regulated industry structure, the airline suddenly had to adapt quickly to an intensely
competitive market. The Airlines’ lower cost structures, more creative management, and
more efficient aircraft fleets allowed these airlines to ride successfully over the storm in
the early years. European enjoyed similar benefits when their airline industry marched
- 63 -
towards deregulation in the 1990s. However, long protected national flag airlines were
not so fortunate and some even succumbed to the competitive pressure. Asian
governments in the region recognize the benefits of liberalized air services.
Unfortunately, the varying degrees of economic development in different countries also
place various pressures on governments, limiting their ability to liberalize their air
transport markets effectively.
Australia vs. Japan Liberalization Experience
Australia and New Zealand concluded a Single Aviation Market (SAM) agreement,
effective as of November 1, 1996. The goal of SAM was to bring the two countries closer
together within the elements of the Australia-New Zealand Closer Economic Relations
Free Trade Agreement or ANZCERTA. While the SAM agreement opened up many new
opportunities within the Trans-Tasman market, it did not deal with beyond markets to
third countries. Those markets were still under the original 1961 Australia – New Zealand
Air Services Agreement and the subsequent 1992 Memorandum of Understanding. Two
different definitions of air carriers were created from the agreement: the “Domestic” and
the “SAM” airline. The Domestic airline designation allowed carriers to fly domestic
services in each others domestic market and the SAM designation harmonized ownership,
control, technical and safety certifications from each countries regulatory agencies. The
slow but progressive liberalization in Asia has been instrumental in attracting new low
cost airlines into the Asia Pacific aviation market. Since the establishment of SAM in
1996, the liberalization of the Asia Pacific market has been slow but gradual, with Japan
opening up the domestic market in 1996 and the premature deregulation of some ASEAN
markets in 2004.
- 64 -
The formation of the single Australia/New Zealand aviation market led to some
consolidation and resulted in the acquisition of Ansett Australia by Air New Zealand in
2000. The Air New Zealand/Ansett combination, supported by a 25% strategic equity
investment in Air New Zealand by Singapore Airlines (SIA), was a serious threat to
Qantas. However, due to the complicated regulations and political inertia, the SIA group
was not allowed to increase its stake in the enlarged Air New Zealand group to a more
significant controlling position. This probably led to the eventual demise of Ansett
Australia in September 2001 and created a vacuum in the Australian market. After the
collapse of Ansett Australia, it created an opportunity for Virgin Blue to progress and
becomes the second dominant carrier in the domestic Australian market.
The new airline, Virgin Blue, has a lower comparative operating cost advantage over
Ansett and Qantas and quickly gain market share. Prior to the entry of Virgin Blue, the
Australian domestic market was operated as a duopoly by Qantas and Ansett Australia.
The high operating cost structure of Ansett, high aircraft leased operating charges and
expensive unionized labor costs, made it very difficult for Ansett to remain profitable
when the low cost model hit the Australian marketplace with vengeance in 2000. The
entry of low cost competitors such as Virgin Blue and Impulse and the aggressive fare
discounting in the domestic market in early 2001 made it enormously difficult for Ansett
Australia to stay afloat. Coupled with the dramatic September 11th event that caused
Ansett and many other airlines to bleed their cash flow at a profusely fast rate due to the
sudden downturn in international travel, the airline has no choice but to declare bankrupt.
In Japan, the deregulation in 1986 did not create any real impact until the introduction of
discount carriers in the domestic market in 1997. Deregulation did not create competition
within the Japanese aviation market, but it merely reallocate both domestic and
- 65 -
international market shares among JAL, ANA and, to some extent, Japan Air System
(JAS). The three operators behave rationally and expand their capacity in a systematic
fashion to attain a reasonable traffic growth and profit levels. The domestic market did
not get a shakeup till late 1996, when the Ministry of Transportation approved the
opening of new start up airlines in the domestic market. In late 1997, two new carriers,
Skymark Airlines and Hokkaido International Airlines (also known as Air Do), began
offering low fares on domestic routes.
Liberalization in the domestic Japanese aviation market has not accomplished the desired
effect as compared to the Australian aviation market. The two major surviving low cost
airlines, Skymark and AirDo, and the third LCC Skynet Asia, which enter the market in
late 2002, have not been successful in penetrating the domestic market. Their combined
market share is a measly 3.3% as of fiscal year 2003 (Appendix 4) and the main reasons
are the limiting slots in the Japanese airports and the prevailing control of the incumbent
network airlines at the airport gates. The merger of JAL and JAS also consolidated the
incumbent airlines position in the domestic market with both ANA and JAL now
controlling more than 96.7% of the domestic market.
ASEAN Air Transport Market
The Association of Southeast Asian Nations or ASEAN was established on 8 August
1967 in Bangkok by the five original Member Countries, namely, Indonesia, Malaysia,
Philippines, Singapore, and Thailand. Today ASEAN has grown to a 10 nations grouping
with the addition of Brunei, Cambodia, Vietnam, Myanmar and Laos (exhibit 25).
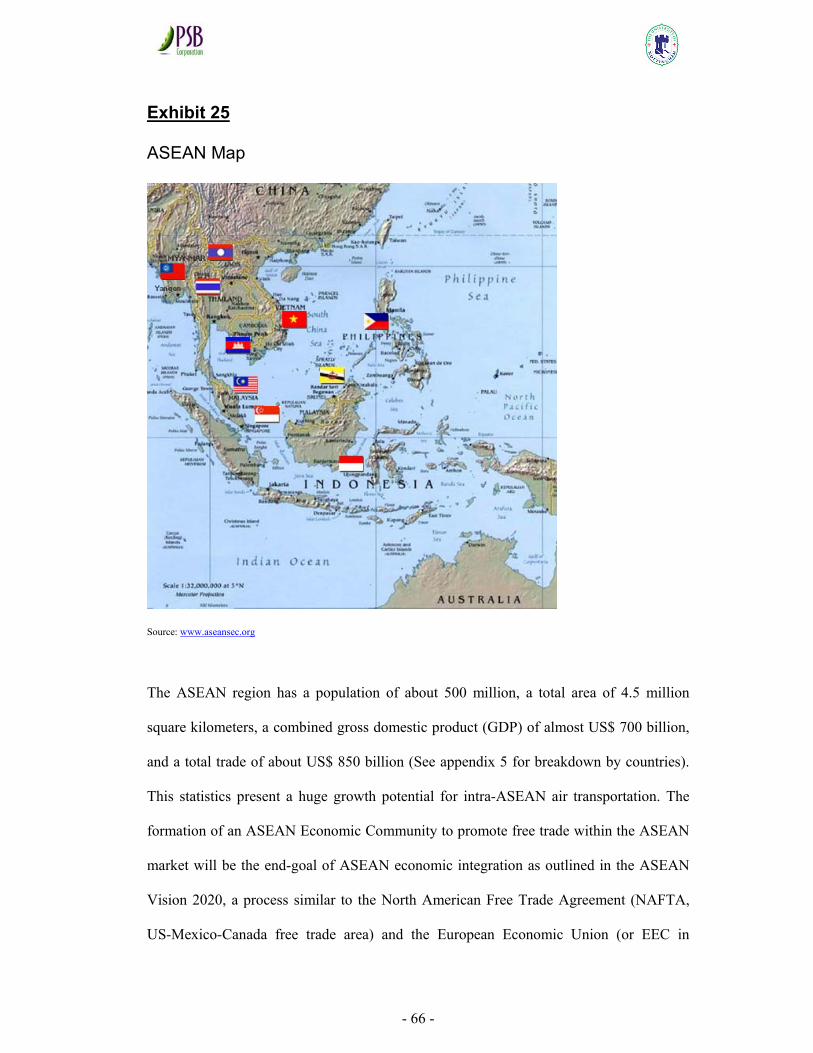
- 66 -
Exhibit 25
ASEAN Map
Source: www.aseansec.org
The ASEAN region has a population of about 500 million, a total area of 4.5 million
square kilometers, a combined gross domestic product (GDP) of almost US$ 700 billion,
and a total trade of about US$ 850 billion (See appendix 5 for breakdown by countries).
This statistics present a huge growth potential for intra-ASEAN air transportation. The
formation of an ASEAN Economic Community to promote free trade within the ASEAN
market will be the end-goal of ASEAN economic integration as outlined in the ASEAN
Vision 2020, a process similar to the North American Free Trade Agreement (NAFTA,
US-Mexico-Canada free trade area) and the European Economic Union (or EEC in
- 67 -
Europe). Its goal is to create a stable, prosperous and highly competitive ASEAN
economic region in year 2020.
ASEAN attaches great importance to enhancing infrastructure and communications
connectivity in the realization of the ASEAN Economic Community (AEC). The AEC’s
11 priority sectors in regional integration include air travel and tourism. In November
2004, the 10 ASEAN member countries signed a road map for the integration and
liberalization of air transport in Southeast Asia under the ASEAN Framework Agreement
for the Integration of Priority Schedules (ASEAN 2004). The deregulation of air services
is part of the ASEAN Transport Action Plan to improve the region’s air transport
infrastructure and logistics network. Article 10 of the Framework Agreement provides for
expediting the development of integrated transport logistics services within ASEAN,
particularly for cargo transportation. The more relevant Article 11 provides for the
facilitation of travel in ASEAN. To hasten the travel process, member countries shall
harmonize the procedures for the issuance of visas to international travelers in ASEAN in
late 2004, and have provided visa exemptions for intra-ASEAN travel by ASEAN
nationals in 2005.
To achieve an integrated economic community within ASEAN, the following steps have
been developed:
•setting clear targets and schedules for services liberalization for each sector and each
round to achieve the free flow of trade in services with the end date earlier than 2020,
•accelerate services liberalization earlier than the end date by countries which are ready,
through the application of the ASEAN-X formula;
•accelerate regional integration in the 11 priority sectors which ASEAN enjoys
competitive advantage;
- 68 -
•accelerate liberalization in these priority sectors by 2010 and promote joint ventures and
cooperation, including third country markets; and
•facilitate the movement of business people and tourists. Air travel is one of the 11
priority sectors that the 10 ASEAN member governments have agreed to liberalize at a
faster pace in a bid to create an ASEAN Economic Community by 2020. ASEAN
members recently endorsed a road map for the integration of the air travel sector, which
targets full liberalization of cargo services and unlimited direct operations to ASEAN
capitals by December 2008.
The ASEAN Transport Ministers fully recognize the benefits of liberalized air services
and supported the view that this is the key for ASEAN to integrate with the global
economy, improve competitiveness and enhance the inflow of foreign direct investment.
Moreover, the Ministers will work towards developing a regional action plan for staged
and progressive implementation of open-sky arrangements in ASEAN-member countries.
One of the key action points highlighted in the ASEAN Transport Action Plan for 2005-
2010 is “promoting open sky arrangements by building upon the Roadmap for Integration
of ASEAN (RIA) for ASEAN Competitive Air Services Policy, including exploiting the
potential of full air freight services liberalization, through plurilateral or multilateral
basis, to support increased intra-ASEAN travel, trade and investment (Article 14d).” The
key initiatives will be for ASEAN-member countries to open up their skies for both cargo
and passenger services from 2006 (see Appendix 5 for the Roadmap for Integration of Air
Travel Sector).
- 69 -
For passenger services, the liberalization of the ASEAN aviation market will begin with
opening fifth freedom or beyond right traffic for all designated points within the ASEAN
sub-regions. Simply put, there will be no restriction on the number of flights for an
ASEAN airline to pick and drop passengers from the designated points in the ASEAN
sub-regions by 2006. Fifth freedom traffic is not ideal for LCCs but favors the network
carriers. The liberalization of the ASEAN skies also allows unlimited third and fourth
freedom traffic (home country to another country and vice versa) for at least two
designated points in each country between the ASEAN sub-regions at the end of 2006.
To illustrate, any airlines based in Singapore or in Thailand can operate the Singapore-
Phuket route, and the number of flight frequencies will depend on the airport slot
availability than on the restrictive bilateral rights. Point-to-point operations (or third and
fourth freedoms) are ideal for LCC. A detailed definition of freedom traffic for airlines,
have been attached in Appendix 7.
In 2008, the unlimited point-to-point operation will extend to the capital city in each
ASEAN member country. An interesting development would be the Kuala Lumpur-
Singapore route, currently one of the most profitable in Asia for both Malaysia Airlines
(MAS) and Singapore Airlines (SIA). The liberalization of third and fourth freedom
traffic could entice the entry of low-cost airlines into this sector and drive down the yield
for this route. In 2010, further liberalization of the ASEAN skies will lead to unlimited
fifth freedom traffic for the capital city in each ASEAN member country.
Many multilateral agreements have been made between member countries in preparation
for air transport liberalization. Cambodia, Laos, Myanmar and Viet Nam signed an
agreement on air transport in Hanoi in late 2003. Brunei Darussalam, Singapore and
- 70 -
Thailand have also reached an agreement on full liberalization of air transportation in late
2004, ahead of the other members of ASEAN. The agreement allows airlines based in the
three countries to operate any number of passenger flights between the three countries.
The competition has led to a sudden increase of inexpensive flights between Thailand and
Singapore. The “2-plus X” approach, as outlined in the ASEAN Transport Action Plan,
enables two or more ASEAN member countries to proceed ahead if they are prepared to
do so earlier than the other member countries. The three-way pact between Singapore,
Thailand and Brunei demonstrate this approach and will allow the liberalization target to
be achieved four year ahead of the other member countries.
Air cargo operators have been constraint by the current approach of regulating flights in
terms of aircraft capacity, frequency and routing. This does not provide the operational
flexibility that they seek. In view of this, four ASEAN members, which include Thailand,
Brunei, Singapore and Cambodia, signed a multilateral air cargo open-skies agreement
that will allow the four countries to operate unlimited all-cargo services among the
countries, to any third country. Member countries will achieve full liberalization of
airfreight services by 2008.
Malaysia-Singapore skies are also heading for open sky before 2008. Malaysia and
Singapore have both welcomed the imminent opening up of two-way air routes, seeing
mutual benefits in such a development (CNA, 2006). The Kuala Lumpur-Singapore city
pair route is one of the most protected and lucrative routes in Asia. It has one of the
highest passenger yields (estimated at US$0.20/RPK) in Asia. The existing air fare costs
over US$240 for a round trip. Two national flag carriers, MAS and SIA, dominate the
Kuala Lumpur-Singapore route with 84% of the 184 weekly flights. In contrast, the
- 71 -
Singapore-Bangkok sector has 380 weekly flights and fares (starting as low as US$100
for a round trip) between the two cities have decrease dramatically since the entry of low
cost airlines such as Tiger Airways, Thai AirAsia and JetStar. Low cost airlines from both
sides, Malaysia's AirAsia and Singapore's Tiger Airways, have both indicated interest in
flying the busy Kuala Lumpur-Singapore air route and could erode the high yield for this
route. To protect themselves ahead of the open skies in 2008, three Airlines, SIA, MAS
and SilkAir have signed a code sharing agreement for expanded access between
Singapore and four Malaysian states.
An exception to the liberalization is the Philippines. The country requires more time to
comply with the air transport integration and liberalization program among ASEAN
members. The Philippines has applied for the ASEAN-X protocol, which allows ASEAN
member flexibility in complying with the terms of the air transport program. The airlines
based in the Philippines have called on the government to delay opening its skies to
foreign carriers before they become competitive.
Overall, the ASEAN countries are largely liberalizing the international bilateral
agreements that would allow the regulation of the number and type of aircraft, number of
seats provided and the fare pricing levels. Recent liberalization trends also cover Thailand
and China, which have adopted an “open-skies” agreement, allowing unrestricted
operations between the two countries, while Singapore, Thailand and Brunei are
negotiating a multi-lateral “open-skies” agreement for passenger flights.
- 72 -
South Asia Transport Market
Liberalization in South Asia is also emerging. India appears to be making some progress
on this issue, customarily a laggard behind their more dynamic counterparts elsewhere in
Asia. Earlier this year, India accomplished major milestones in its aviation history when it
signed liberalized aviation agreements with China, UK, and US. Reflecting the new mood
of optimism, significant orders for new aircraft deliveries were placed with the two major
airplane makers by new entrant airlines. Gradual capacity growth has been observed
between India and key ASEAN cities due to the constraint in airport capacity and other
bottlenecks. Foreign airlines still do not have free market access in India, while bilateral
liberalization appears to be highly selective.
China’s Progressive Market Deregulation
Deregulation of China aviation market has gathered pace since late 2003. In 2004, we saw
China ease bilateral restrictions considerably with major Asian countries, including
Singapore, Malaysia, Thailand, South Korea, Australia and Japan, as well as with the US
and Hong Kong (See appendix 8). These liberalized air service agreements include
expansion of passenger and cargo frequencies, provision for multiple carrier designation,
and improved access to Chinese destinations for participating airlines. The enlarged
capacity is strongly sought after by the aviation market players. This could potentially
drive the fares lower and result in a decrease in yield for the airlines. However, higher
traffic to and from major Chinese airport hubs will more than compensate for the lower
yield.
- 73 -
Asia is lifting travel restrictions for its populace progressively, particularly for China
which relaxes the restrictions for its citizens to travel by raising the number of exit visas
issued for independent and group travel. On May 2, China’s Taiwan Affair Office of the
State Council granted approval for Chinese tourists to visit Taiwan, starting with a daily
quota of 1,000 persons per day (or 365,000/year) and increasing to 3,000 persons per day
(or 1 million/year) in a few years. The liberalization of China’s aviation market will be a
significant boost to Asia Pacific airlines and a potential goldmine for the low cost airlines.
As reported by Xin (2006), China will open more overseas and domestic air routes to
meet traffic demands in the run-up to, and during the 2008 Olympic Games. Currently,
there are 186 flights from Beijing Capital International Airport to Japan and 154 flights to
South Korea each week, and the number for these two countries and other Asian nations
is expected to soar by 2008.
North Asia Market – Difficult for LCCs
In Asia Pacific, Japan was among the first countries to promote low cost airlines.
However, the market penetration for the three LCCs is only 3.3% after more than five
years of operation. Skymark Airlines, which was established in 1996 and is currently
Japan's largest discount carrier by market share reported its first annual net profit only in
the year ended 31 October 2004. Hokkaido International Airlines (Air Do), based in
Sapporo, is undergoing a corporate rehabilitation process and entered into a
comprehensive alliance with All Nippon Airways to help the carrier restructure. The third
low cost operator, Skynet Asia commenced domestic services in Japan in August 2002,
but has encountered financial difficulties and is currently restructuring with support from
the state-backed Industrial Revitalization Corp. In South Korea, two LCCs (Jeju Air and
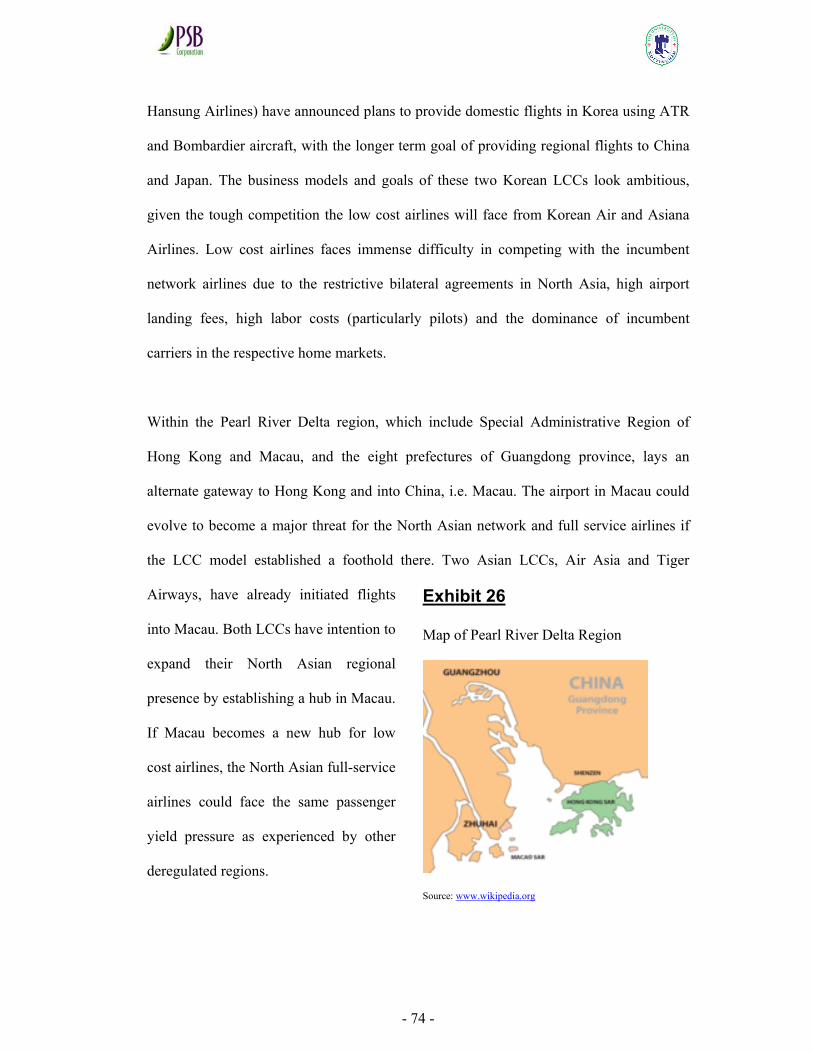
- 74 -
Hansung Airlines) have announced plans to provide domestic flights in Korea using ATR
and Bombardier aircraft, with the longer term goal of providing regional flights to China
and Japan. The business models and goals of these two Korean LCCs look ambitious,
given the tough competition the low cost airlines will face from Korean Air and Asiana
Airlines. Low cost airlines faces immense difficulty in competing with the incumbent
network airlines due to the restrictive bilateral agreements in North Asia, high airport
landing fees, high labor costs (particularly pilots) and the dominance of incumbent
carriers in the respective home markets.
Within the Pearl River Delta region, which include Special Administrative Region of
Hong Kong and Macau, and the eight prefectures of Guangdong province, lays an
alternate gateway to Hong Kong and into China, i.e. Macau. The airport in Macau could
evolve to become a major threat for the North Asian network and full service airlines if
the LCC model established a foothold there. Two Asian LCCs, Air Asia and Tiger
Airways, have already initiated flights
into Macau. Both LCCs have intention to
expand their North Asian regional
presence by establishing a hub in Macau.
If Macau becomes a new hub for low
cost airlines, the North Asian full-service
airlines could face the same passenger
yield pressure as experienced by other
deregulated regions.
Exhibit 26
Map of Pearl River Delta Region
Source: www.wikipedia.org
- 75 -
On June 20, 2005, Singapore reached a deal with Hong Kong to allow unlimited
passenger flights between the two cities. The deal falls short of an open skies agreement,
which would allow airlines to pick up passengers in Hong Kong and fly them to other
destinations. The five carriers, which include SIA, Cathay Pacific Airways, JetStar
(include Valuair), China Airlines and United Airlines currently operate 238 weekly
passenger flights between the two cities. The new aviation deal will be a significant boost
for low cost airlines to expand flights between Singapore and Hong Kong.
Conclusion
The creation of a common Australia/New Zealand aviation market in 1996 was the first
step towards creating a liberalized aviation market in Asia. InterVISTAS-ga2 Consulting
study found that each nation gained more than 20,600 full-time positions from the
liberalization and the ensuing traffic increase. The GDP of each country grew by US$726
million. By 2005, Australia-New Zealand traffic has increase by 56 percent as compared
to the period prior to any liberalization. The relaxed market controls facilitates the growth
of the total passenger traffic by more than 1.7 million a year, and the increase in
passenger volume would require the airlines to operate another 27 additional flights per
day.
The Japan market followed the liberalization path in 1996 but the outcome is less certain.
Unless a genuinely liberalized aviation industry exists within Japan domestic market. It
would be a challenge for all operators to compete in an environment where consumers,
rather than politicians or bankruptcy court judges, decide the winners and losers.
- 76 -
The two most populous countries, China and India, are both opening up their aviation
market gradually and selectively. They have tended to favor their major trading partners.
As they gain more confidence in the international aviation market, and their economies
continue to surge forward with strong growth, India and China is expected change their
mindsets and shift towards a new aviation policy with emphasis on improved market
access.
The ASEAN skies with a significant market size of 500 millions people will start to be
liberalized in 2006, with full liberalization expected in 2008, ahead of the development of
a common ASEAN Economic Community in 2020. Pockets of liberalization have already
begun in more mature economies like Thailand, Singapore and Brunei. Early indications
show a trend towards lower fare and an increase in consumer surplus. Open skies in
Australia and Singapore with the US could also drive the pace of liberalization of Asian
airspace. A more progressive liberalized aviation environment will have a positive impact
on low cost airlines based in Asia Pacific, allowing them to expand aggressively.
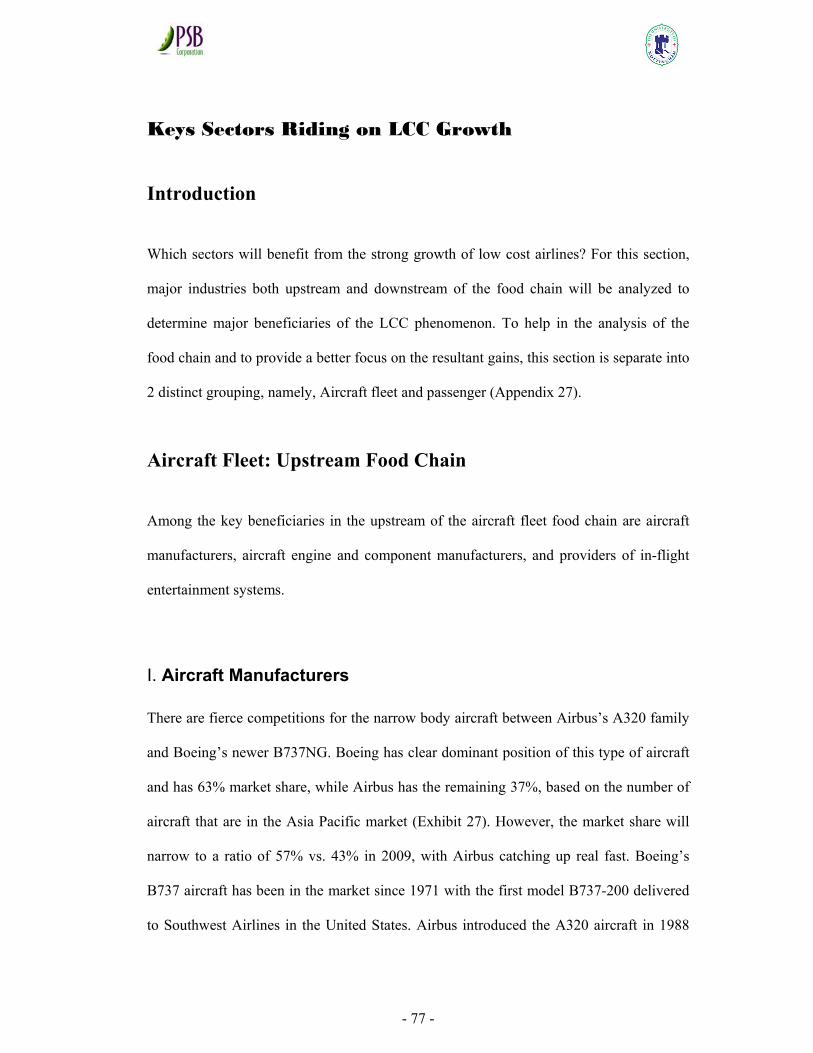
- 77 -
Keys Sectors Riding on LCC Growth
Introduction
Which sectors will benefit from the strong growth of low cost airlines? For this section,
major industries both upstream and downstream of the food chain will be analyzed to
determine major beneficiaries of the LCC phenomenon. To help in the analysis of the
food chain and to provide a better focus on the resultant gains, this section is separate into
2 distinct grouping, namely, Aircraft fleet and passenger (Appendix 27).
Aircraft Fleet: Upstream Food Chain
Among the key beneficiaries in the upstream of the aircraft fleet food chain are aircraft
manufacturers, aircraft engine and component manufacturers, and providers of in-flight
entertainment systems.
I. Aircraft Manufacturers
There are fierce competitions for the narrow body aircraft between Airbus’s A320 family
and Boeing’s newer B737NG. Boeing has clear dominant position of this type of aircraft
and has 63% market share, while Airbus has the remaining 37%, based on the number of
aircraft that are in the Asia Pacific market (Exhibit 27). However, the market share will
narrow to a ratio of 57% vs. 43% in 2009, with Airbus catching up real fast. Boeing’s
B737 aircraft has been in the market since 1971 with the first model B737-200 delivered
to Southwest Airlines in the United States. Airbus introduced the A320 aircraft in 1988
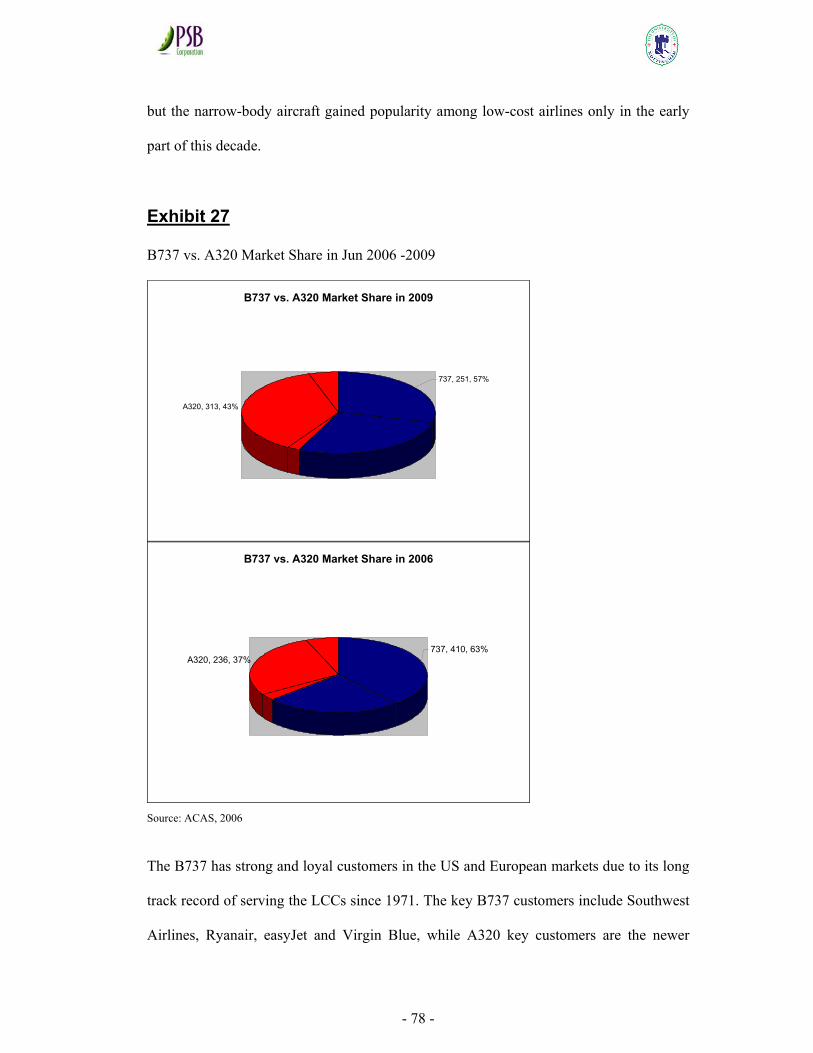
- 78 -
but the narrow-body aircraft gained popularity among low-cost airlines only in the early
part of this decade.
Exhibit 27
B737 vs. A320 Market Share in Jun 2006 -2009
B737 vs. A320 Market Share in 2009
737, 251, 57%
A320, 313, 43%
B737 vs. A320 Market Share in 2006
A320, 236, 37%737, 410, 63%
Source: ACAS, 2006
The B737 has strong and loyal customers in the US and European markets due to its long
track record of serving the LCCs since 1971. The key B737 customers include Southwest
Airlines, Ryanair, easyJet and Virgin Blue, while A320 key customers are the newer
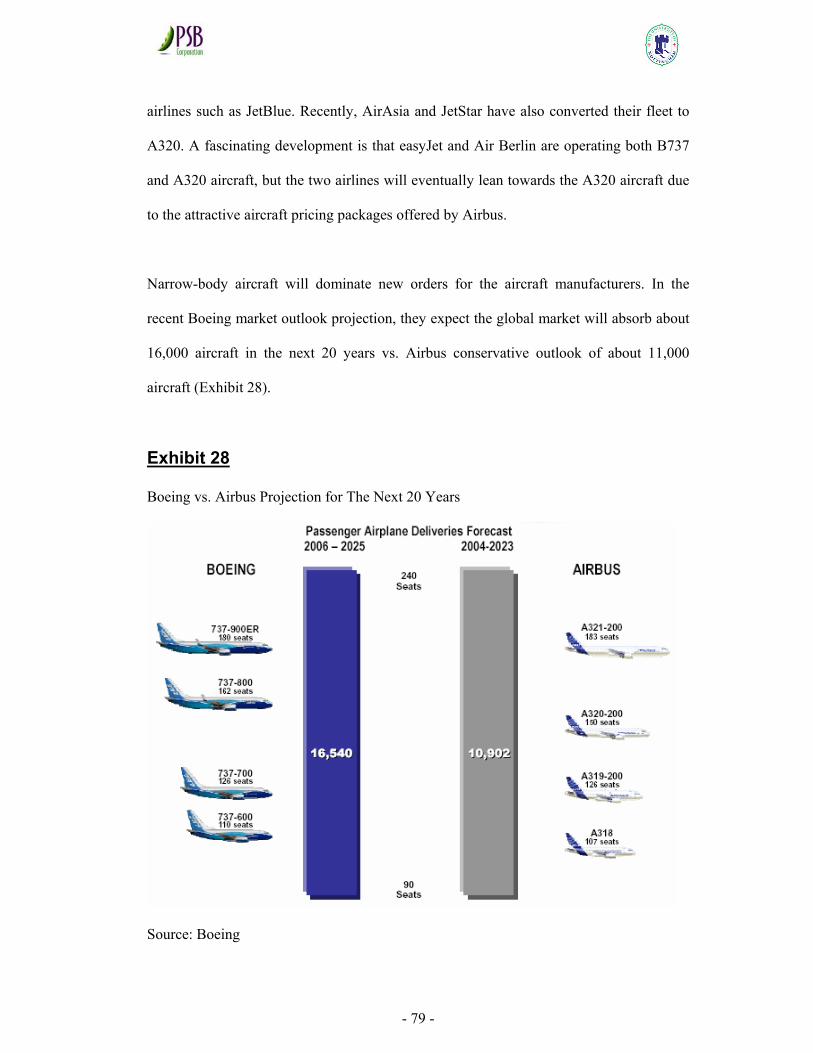
- 79 -
airlines such as JetBlue. Recently, AirAsia and JetStar have also converted their fleet to
A320. A fascinating development is that easyJet and Air Berlin are operating both B737
and A320 aircraft, but the two airlines will eventually lean towards the A320 aircraft due
to the attractive aircraft pricing packages offered by Airbus.
Narrow-body aircraft will dominate new orders for the aircraft manufacturers. In the
recent Boeing market outlook projection, they expect the global market will absorb about
16,000 aircraft in the next 20 years vs. Airbus conservative outlook of about 11,000
aircraft (Exhibit 28).
Exhibit 28
Boeing vs. Airbus Projection for The Next 20 Years
Source: Boeing
- 80 -
Based on orders placed by LCCs and network airlines in recent years, LCCs will
significantly increase their market shares for aircraft in operation, especially in Asia
Pacific. The Asia Pacific LCCs will have about 26% of the aircraft fleet in Asia Pacific
by 2009 (Exhibit 29).
Exhibit 29
Projected LCC vs. Network Carriers Aircraft Fleet Market Share in 2009
Source: ACAS 2006
II. Aircraft Engine and Component Manufacturers
CFM56 (CFM International), V2500 (IAE), JT8D (Pratt & Whitney) and BR700 (Rolls-
Royce) are the engines of choice for the current LCCs fleet. The older Pratt & Whitney
JT8D engine is slowly disappearing from the market as the B737-200 is being replaced by
more fuel efficient narrow body aircraft. BR700 future is bleak with Boeing deciding to
discontinue production of the B717 aircraft in May 2006. V2500 are widely used for the
A320 aircraft and the key company to benefit from this trend would be United
Technologies, of which Pratt and Whitney is a division and in turn has shares in IAE. The
Asia Pacific Aircraft Fleet Market Share in 2009E
LCC, 525, 26%
Network Carrier, 1484, 74%
- 81 -
CFM56 engine is also gaining widespread acceptance with A320 aircraft and being the
sole engine source on B737-300 model onwards. CFM International is a joint venture by
Snecma and General Electric.
On the aircraft and engine lie many systems such as air management system, electrical
power systems, hydraulic and flight control systems, engine accessories such fuel control
and many more. The component manufacturer or system integrator provides these
components and systems to the aircraft and engine manufacturers for integration into the
final product. Original equipment manufacturers (OEM) include companies such as
Hamilton Sundstrand, Honeywell, Goodrich, Rockwell Collins, and Smiths Aerospace to
name a few. Hamilton Sundstrand, a United Technologies Corporation subsidiary and
other OEMs will benefit greatly from the strong demand for A320 and B737NG aircraft.
III. In-Flight Entertainment
In-flight entertainment (IFE) is viewed as a potential ancillary revenue stream for
advertising, pay-per-view, interactive gambling, duty free shopping and sale of food and
beverage outlets. The products include overhead monitors or retractable LCDs, in-seat
multi-channel video and DVD players. IFE is a standard product for full service carriers
on long haul flights. However, it is a fairly new concept for LCCs, with JetBlue being the
pioneer in introducing the free satellite television. This is primarily due to the carrier
operating long haul flights in the US. Other LCCs like Kingfisher from India is also
investing in IFE to differentiate their LCC brands in their respective geographic markets.
As IFE is a relatively new concept for LCCs, it is too early to gauge if the LCCs will
adopt expensive IFE system for short sector flights.
- 82 -
Aircraft Fleet: Downstream Food Chain
In the downstream of the aircraft fleet food chain, the key beneficiaries would be
companies specializing in aircraft and components maintenance, aircraft leasing, and
airports.
I. Aircraft and Component MRO
The big increase in narrow-body aircraft orders for the next five years will lead to an
increase in demand for aircraft maintenance, repair and overhaul (MRO) services for
narrow-body aircraft, engines and aircraft components. The major MRO companies to
benefit are likely to be those located where LCCs are expanding aggressively in the
region, e.g., in the ASEAN, Australian and Indian markets. ST Aerospace currently
provides MRO service contracts for Valuair (S$10-15 million), Air Asia (US$63 million)
and JetStar (US$47 million), while Tiger Airways, an associate of SIA, utilizes the MRO
services of SIA’s subsidiary, SIA Engineering (SIAEC). SIAEC also provides MRO
services to other LCCs such as Cebu Pacific Air in the Philippines, and Go Air in India.
ST Aerospace and SIAEC, is the leading MRO around the world and provides services to
both full-service and low-cost airlines.
ST Aerospace is actively pursuing the narrow-body aircraft market with the opening of a
S$12 million new hangar in Seletar Airport (Singapore), which has been able to
accommodate two narrow-body aircraft from March 2005. As more LCCs fly into Hong
Kong and Macau and establish operating hubs in North Asia, HAECO (Hong Kong
Aircraft Engineering Company) and GAMECO (Guangzhou Aircraft Maintenance
- 83 -
Company) are likely to see increased demand for their MRO services. At the same time,
Boeing has also committed US$100 million to build a regional MRO facility in Nagpur,
India to fulfill their pledge to Air India. Last year, Air India and its low cost subsidiary,
Air India Express committed to Boeing to purchase 68 B737NG, B777 & B787 airplane,
a record order of US$11.4 billion for Indian commercial transportation.
Several OEM have also set up aerospace component repair facilities in the Asia Pacific
region to cater to the growing demands for such services. In Singapore, the Loyang
industrial park is renowned for its aerospace focus and has many companies including
OEM setting up aviation related MRO services there. Singapore is currently Asia's largest
and most comprehensive aerospace maintenance, repair and overhaul (MRO) hub with
25% Asia market share.
II. Aircraft Leasing Companies
Among the leading aircraft leasing companies that have exposure in narrow-body aircraft
are Boullioun Aviation Services, Singapore Aircraft Leasing Enterprise (SALE), Aviation
Capital Group, Bavaria International Aircraft Leasing and Volvo Aviation. Most of the
aircraft leasing companies serve both the full-service and low-cost airlines. Most of the
Asia Pacific aircraft operated by the LCC were leased and about 75% were on operating
leases in 2006 (Exhibit 30). More importantly, as highlighted in the Asia Pacific Fleet
Analysis chapter, LCCs operate a significant number of aircraft on operating leases,
particularly when operations are in initial start-up phases.
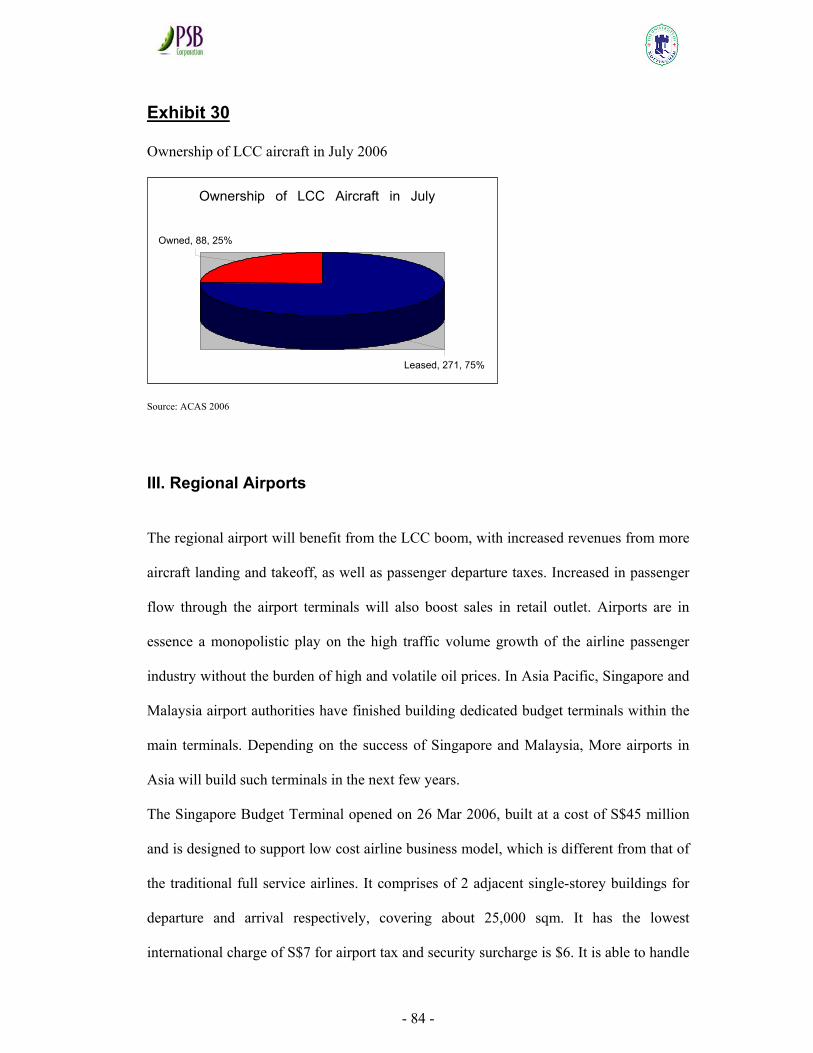
- 84 -
Exhibit 30
Ownership of LCC aircraft in July 2006
Source: ACAS 2006
III. Regional Airports
The regional airport will benefit from the LCC boom, with increased revenues from more
aircraft landing and takeoff, as well as passenger departure taxes. Increased in passenger
flow through the airport terminals will also boost sales in retail outlet. Airports are in
essence a monopolistic play on the high traffic volume growth of the airline passenger
industry without the burden of high and volatile oil prices. In Asia Pacific, Singapore and
Malaysia airport authorities have finished building dedicated budget terminals within the
main terminals. Depending on the success of Singapore and Malaysia, More airports in
Asia will build such terminals in the next few years.
The Singapore Budget Terminal opened on 26 Mar 2006, built at a cost of S$45 million
and is designed to support low cost airline business model, which is different from that of
the traditional full service airlines. It comprises of 2 adjacent single-storey buildings for
departure and arrival respectively, covering about 25,000 sqm. It has the lowest
international charge of S$7 for airport tax and security surcharge is $6. It is able to handle
Ownership of LCC Aircraft in July
Leased, 271, 75%
Owned, 88, 25%
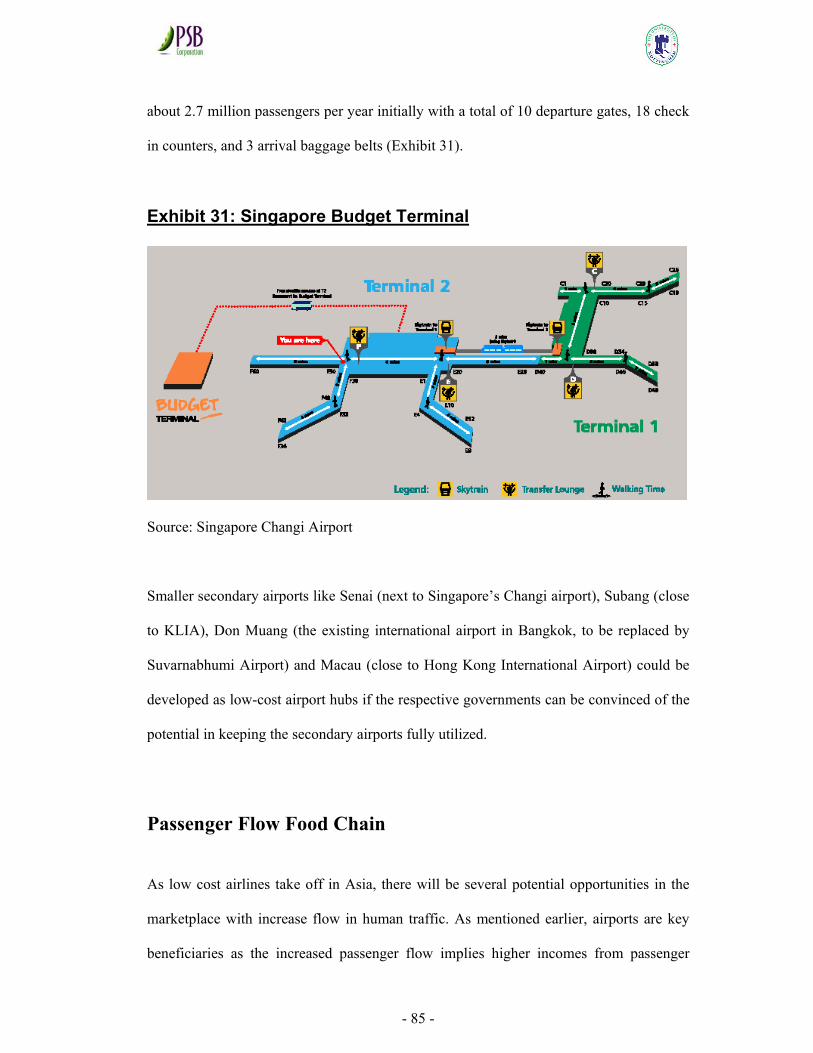
- 85 -
about 2.7 million passengers per year initially with a total of 10 departure gates, 18 check
in counters, and 3 arrival baggage belts (Exhibit 31).
Exhibit 31: Singapore Budget Terminal
Source: Singapore Changi Airport
Smaller secondary airports like Senai (next to Singapore’s Changi airport), Subang (close
to KLIA), Don Muang (the existing international airport in Bangkok, to be replaced by
Suvarnabhumi Airport) and Macau (close to Hong Kong International Airport) could be
developed as low-cost airport hubs if the respective governments can be convinced of the
potential in keeping the secondary airports fully utilized.
Passenger Flow Food Chain
As low cost airlines take off in Asia, there will be several potential opportunities in the
marketplace with increase flow in human traffic. As mentioned earlier, airports are key
beneficiaries as the increased passenger flow implies higher incomes from passenger
- 86 -
airport tax, as well as higher commercial revenues from renting out space for airport duty-
free shops and restaurants. The other sectors that could benefit from a greater human
traffic flow are hotels, car rental companies, internet travel websites and the property
market.
I. On-Line Travel Agencies
Independent on-line travel agencies such as Flight Center (FCL), the leading travel
retailer in Australia would benefit. On-line travel agencies provide the following benefits
to various stakeholders:
• Professional approach - a shift from contracting to supplier relationship management
• Creation of value propositions for a one-stop virtual travel shop.
• Introduction of competitive tendering
• Active channeling
While independent on-line travel agencies will compete with LCCs for secondary
revenues, the experience in the Australian travel market indicates that Flight Center has
seen continual record profits and has expanded to more than 1,100 retail shops and
corporate travel offices in eight countries, despite competition from the internal websites
of Virgin Blue, JetStar and Qantas in Australia.
II. Hotel and Car Rental Companies
Low-cost airline prefer direct transaction with their customer through their own websites.
This is to eliminate commissions and to gain additional commission revenue when the
consumer makes reservation for hotel rooms and car through the airline website. Budget
hotels, and, to a lesser degree, budget car rentals, could also benefit from a sharp increase
in their respective operations. Leisure and budget-conscious travelers need affordable
- 87 -
accommodations and transportation, and franchise operators of budget hotels in Asia
Pacific should see increased operations due to greater demand for discretionary travel.
III. Property Market
Another quarter to ride on the LCC boom is the property market around the regions. With
more convenient air services to remote regions would rekindle investment in
infrastructure such as road and vacation homes. This could drive up property values in the
regional market. LCCs are currently focusing in Thailand (Phuket, Bangkok and Chiang
Mai), Indonesia (Padang and Bali), East Malaysia (Kota Kinabalu and Kuching),
Australia (Perth) and Macau. As the travel market matures for these resort destinations,
property prices around these areas could appreciate if vacation homes start to spring up in
these markets.
Conclusion
From the above food chain analysis, the key industries that would benefit from Asia
Pacific low cost airlines growth are the aircraft manufacturers (e.g., Boeing and Airbus),
aircraft engine manufacturers (e.g., International Aero Engines, Snecma and General
Electric), original equipment manufacturers (e.g. Hamilton Sundstrand, Honeywell,
Goodrich, Smiths, Rockwell Collins etc), in-flight entertainment service providers (e.g.
Panasonic and Thales) and aircraft maintenance providers (e.g., SIAEC and ST
Engineering). Airports (e.g., Singapore Changi Airport and Airports of Thailand) should
also gain form the resultant increase in passenger traffic volume.
- 88 -
There will also be accompanying growth in non-aviation sectors. Other industries that
could benefit are aircraft leasing companies, budget hotels and car rentals, on-line
reservation travel agencies, and property developers. Increase air services will promote
trade and tourism, and will link more people around the Asia Pacific region and drives
growth and development, while improving the social welfare of the population.
- 89 -
Hamilton Sundstrand Aftermarket Services
Introduction
This chapter aims to identify the market opportunities that Hamilton Sundstrand can
target for with the low cost carrier emerging in the Asia Pacific airline industry. Therefore
a clear understanding of the external environment is crucial. The ultimate aim is to
develop a match between the organisation's capabilities and the environment in which the
organisation operates. However, the dynamic nature of the environment is one of the
main sources of uncertainty. First, we will provide an overview of Hamilton Sundstrand
Aerospace Division range of products and services. Then follow on with an analysis of
the MRO industry using the modified Porter’s five forces. We will also utilize the SWOT
analysis to understand the company strength, weakness and what opportunities and threat
lies ahead of Hamilton Sundstrand. Finally, we will recommend strategies that the
company can adopt to remain competitive and continue to win market shares and be a
success story in the MRO industry.
Overview of Hamilton Sundstrand
Hamilton Sundstrand's Aerospace is based in Windsor Locks, Connecticut, USA.
Hamilton Sundstrand is The Aerospace Power Company, recognized worldwide as a pre-
eminent value-added systems supplier to the aerospace industry. They specialize in
electric, hydraulic, pneumatic and mechanical power - and the conversion of power from
one form to another, its management and distribution. The following diagram illustrates
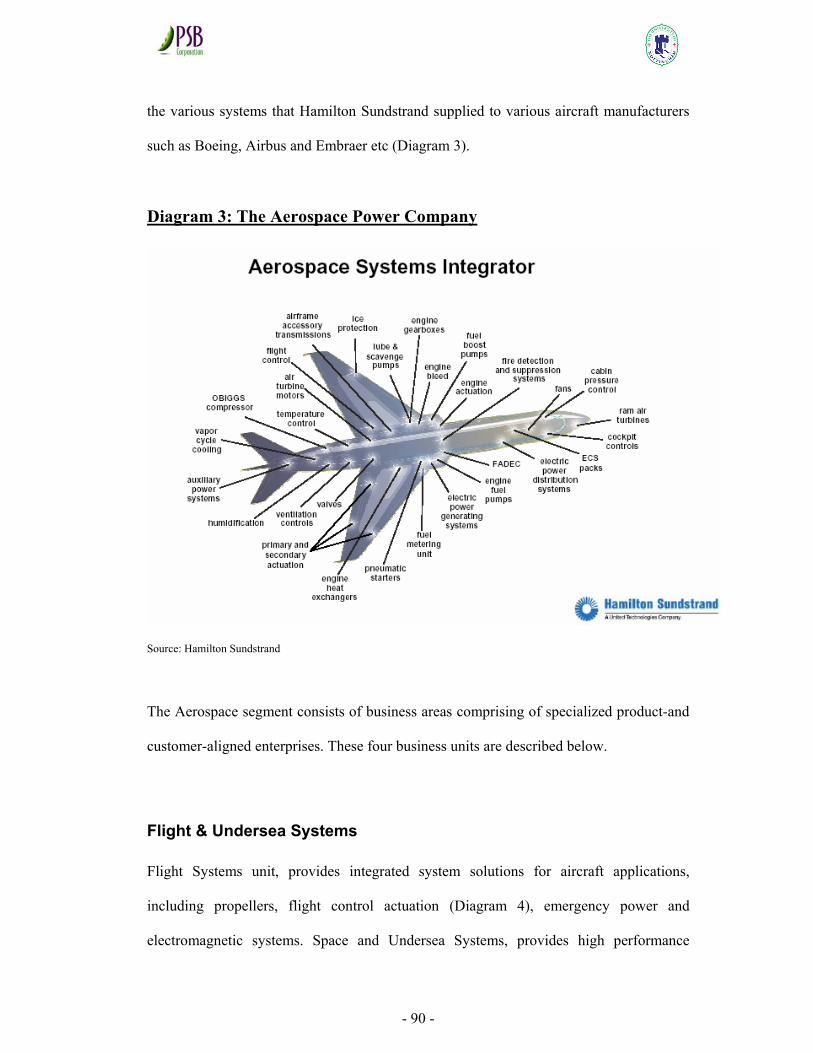
- 90 -
the various systems that Hamilton Sundstrand supplied to various aircraft manufacturers
such as Boeing, Airbus and Embraer etc (Diagram 3).
Diagram 3: The Aerospace Power Company
Source: Hamilton Sundstrand
The Aerospace segment consists of business areas comprising of specialized product-and
customer-aligned enterprises. These four business units are described below.
Flight & Undersea Systems
Flight Systems unit, provides integrated system solutions for aircraft applications,
including propellers, flight control actuation (Diagram 4), emergency power and
electromagnetic systems. Space and Undersea Systems, provides high performance
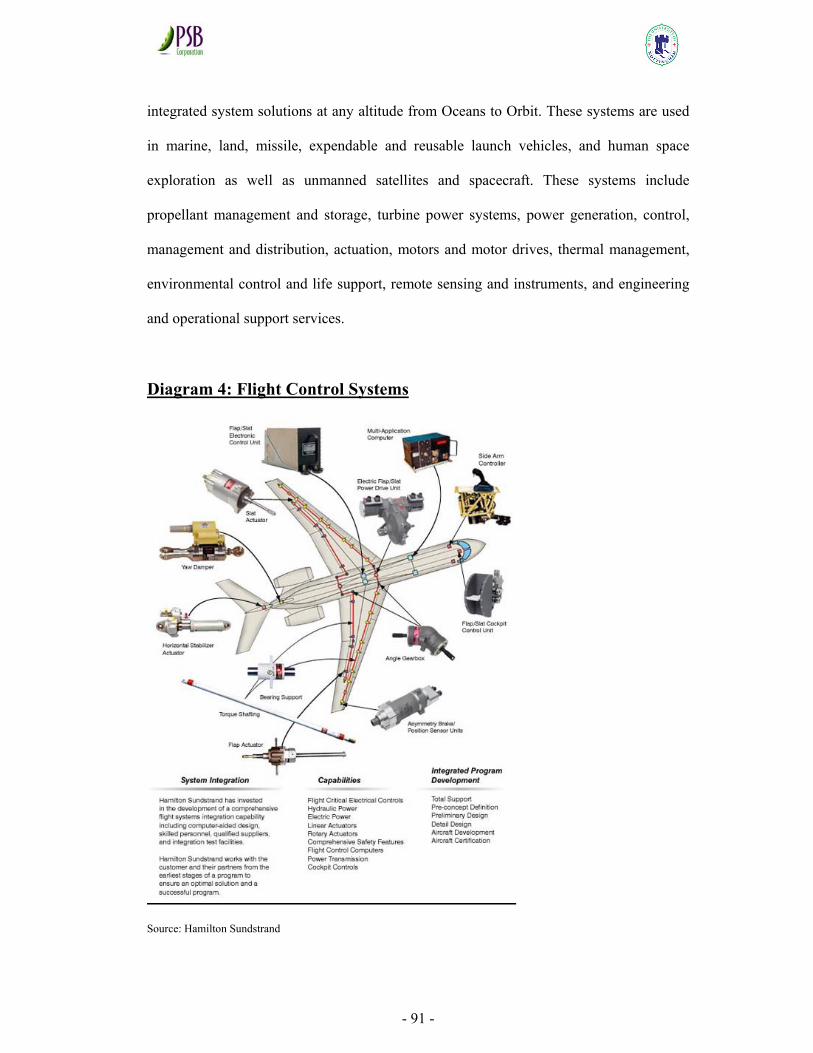
- 91 -
integrated system solutions at any altitude from Oceans to Orbit. These systems are used
in marine, land, missile, expendable and reusable launch vehicles, and human space
exploration as well as unmanned satellites and spacecraft. These systems include
propellant management and storage, turbine power systems, power generation, control,
management and distribution, actuation, motors and motor drives, thermal management,
environmental control and life support, remote sensing and instruments, and engineering
and operational support services.
Diagram 4: Flight Control Systems
Source: Hamilton Sundstrand
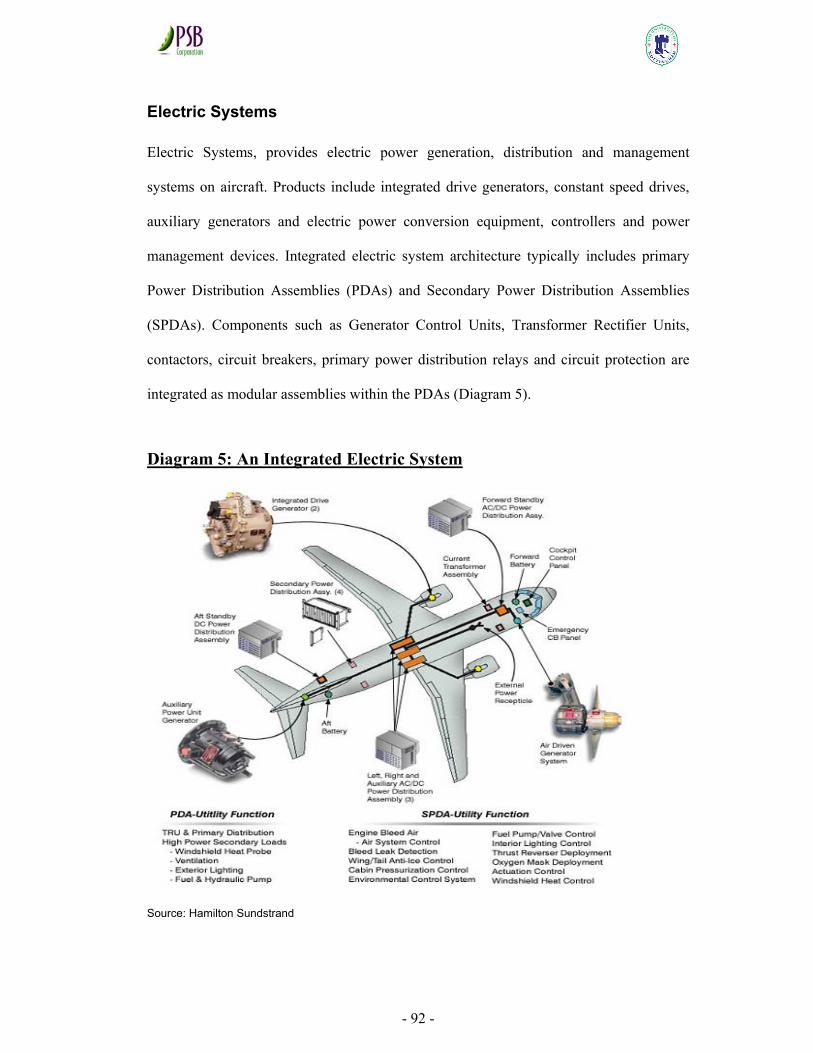
- 92 -
Electric Systems
Electric Systems, provides electric power generation, distribution and management
systems on aircraft. Products include integrated drive generators, constant speed drives,
auxiliary generators and electric power conversion equipment, controllers and power
management devices. Integrated electric system architecture typically includes primary
Power Distribution Assemblies (PDAs) and Secondary Power Distribution Assemblies
(SPDAs). Components such as Generator Control Units, Transformer Rectifier Units,
contactors, circuit breakers, primary power distribution relays and circuit protection are
integrated as modular assemblies within the PDAs (Diagram 5).
Diagram 5: An Integrated Electric System
Source: Hamilton Sundstrand
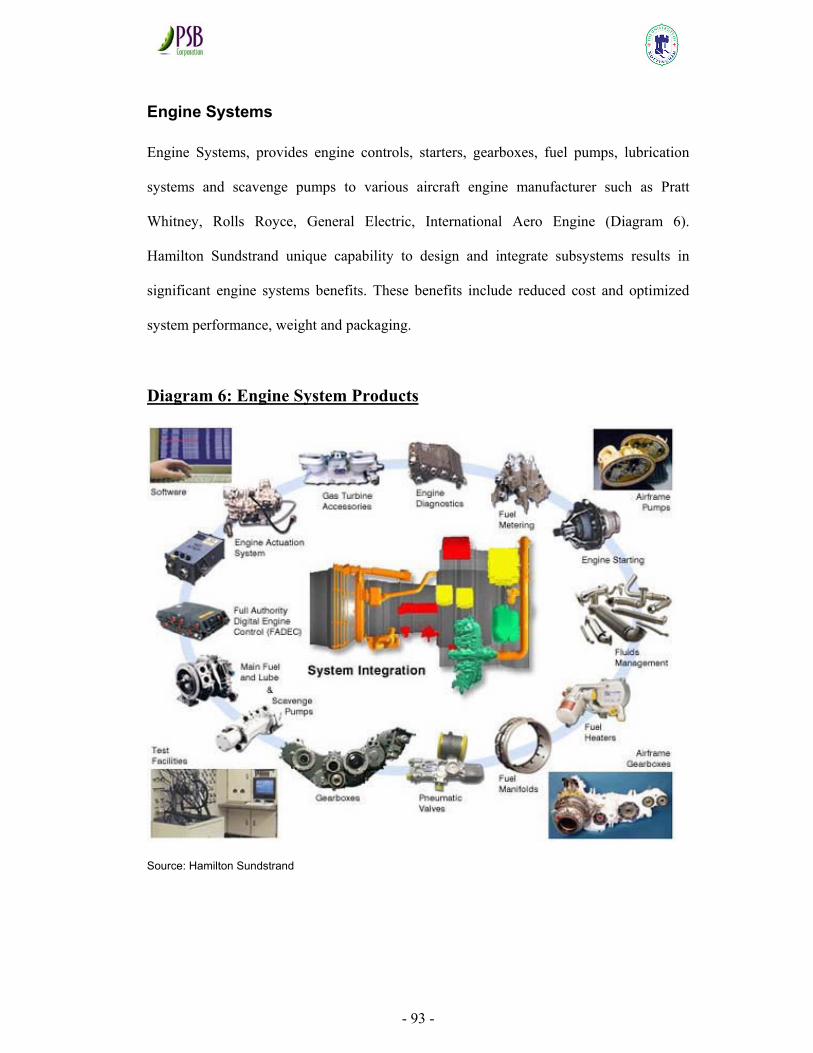
- 93 -
Engine Systems
Engine Systems, provides engine controls, starters, gearboxes, fuel pumps, lubrication
systems and scavenge pumps to various aircraft engine manufacturer such as Pratt
Whitney, Rolls Royce, General Electric, International Aero Engine (Diagram 6).
Hamilton Sundstrand unique capability to design and integrate subsystems results in
significant engine systems benefits. These benefits include reduced cost and optimized
system performance, weight and packaging.
Diagram 6: Engine System Products
Source: Hamilton Sundstrand
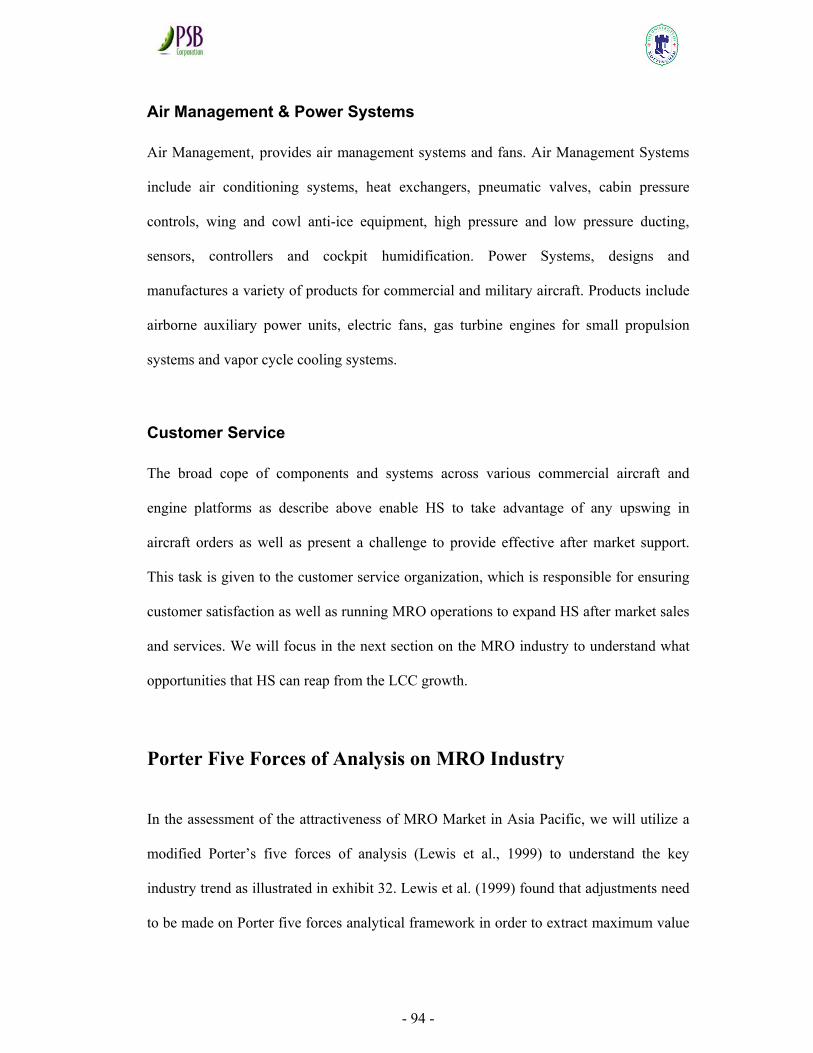
- 94 -
Air Management & Power Systems
Air Management, provides air management systems and fans. Air Management Systems
include air conditioning systems, heat exchangers, pneumatic valves, cabin pressure
controls, wing and cowl anti-ice equipment, high pressure and low pressure ducting,
sensors, controllers and cockpit humidification. Power Systems, designs and
manufactures a variety of products for commercial and military aircraft. Products include
airborne auxiliary power units, electric fans, gas turbine engines for small propulsion
systems and vapor cycle cooling systems.
Customer Service
The broad cope of components and systems across various commercial aircraft and
engine platforms as describe above enable HS to take advantage of any upswing in
aircraft orders as well as present a challenge to provide effective after market support.
This task is given to the customer service organization, which is responsible for ensuring
customer satisfaction as well as running MRO operations to expand HS after market sales
and services. We will focus in the next section on the MRO industry to understand what
opportunities that HS can reap from the LCC growth.
Porter Five Forces of Analysis on MRO Industry
In the assessment of the attractiveness of MRO Market in Asia Pacific, we will utilize a
modified Porter’s five forces of analysis (Lewis et al., 1999) to understand the key
industry trend as illustrated in exhibit 32. Lewis et al. (1999) found that adjustments need
to be made on Porter five forces analytical framework in order to extract maximum value
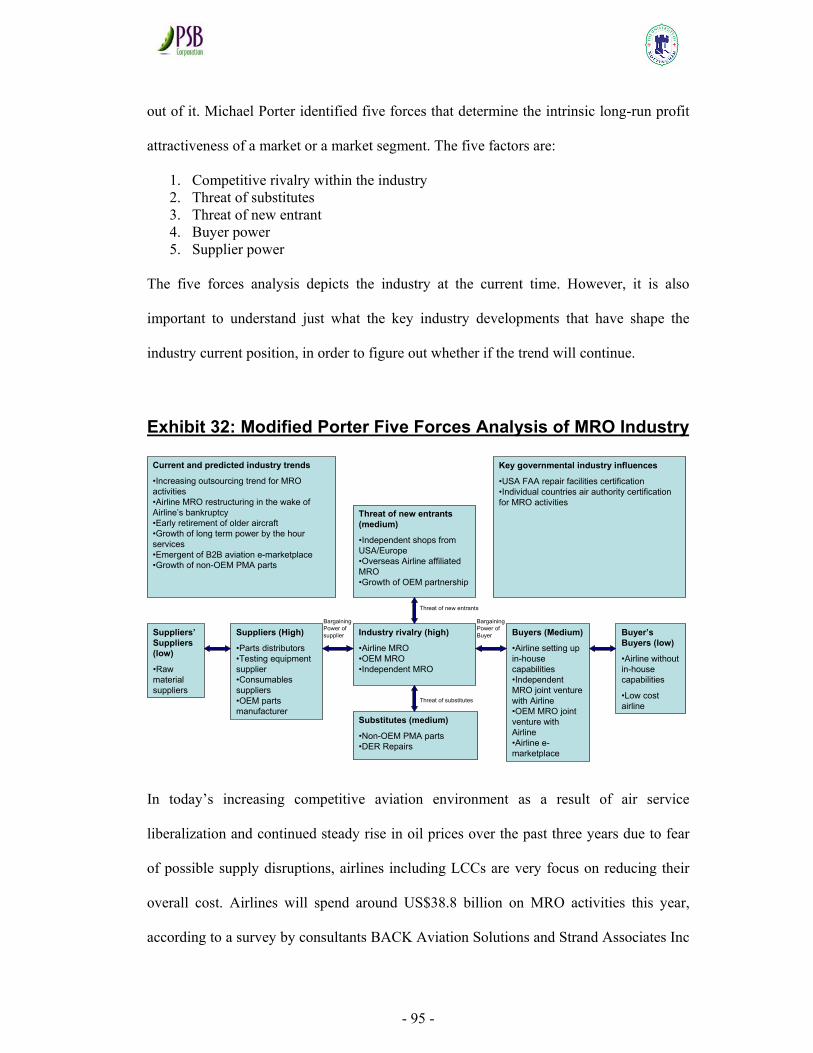
- 95 -
out of it. Michael Porter identified five forces that determine the intrinsic long-run profit
attractiveness of a market or a market segment. The five factors are:
1. Competitive rivalry within the industry 2. Threat of substitutes 3. Threat of new entrant 4. Buyer power 5. Supplier power
The five forces analysis depicts the industry at the current time. However, it is also
important to understand just what the key industry developments that have shape the
industry current position, in order to figure out whether if the trend will continue.
Exhibit 32: Modified Porter Five Forces Analysis of MRO Industry
In today’s increasing competitive aviation environment as a result of air service
liberalization and continued steady rise in oil prices over the past three years due to fear
of possible supply disruptions, airlines including LCCs are very focus on reducing their
overall cost. Airlines will spend around US$38.8 billion on MRO activities this year,
according to a survey by consultants BACK Aviation Solutions and Strand Associates Inc
Current and predicted industry trends
•Increasing outsourcing trend for MRO activities•Airline MRO restructuring in the wake of Airline’s bankruptcy•Early retirement of older aircraft•Growth of long term power by the hour services•Emergent of B2B aviation e-marketplace•Growth of non-OEM PMA parts
Suppliers’Suppliers (low)
•Raw material suppliers
Suppliers (High)
•Parts distributors•Testing equipment supplier•Consumables suppliers•OEM parts manufacturer
Industry rivalry (high)
•Airline MRO•OEM MRO•Independent MRO
Substitutes (medium)
•Non-OEM PMA parts•DER Repairs
Threat of new entrants (medium)
•Independent shops from USA/Europe•Overseas Airline affiliated MRO•Growth of OEM partnership
Buyers (Medium)
•Airline setting up in-house capabilities•Independent MRO joint venture with Airline•OEM MRO joint venture with Airline•Airline e-marketplace
Buyer’s Buyers (low)
•Airline without in-house capabilities
•Low cost airline
Key governmental industry influences
•USA FAA repair facilities certification•Individual countries air authority certification for MRO activities
Bargaining Power of Buyer
Bargaining Power of supplier
Threat of substitutes
Threat of new entrants
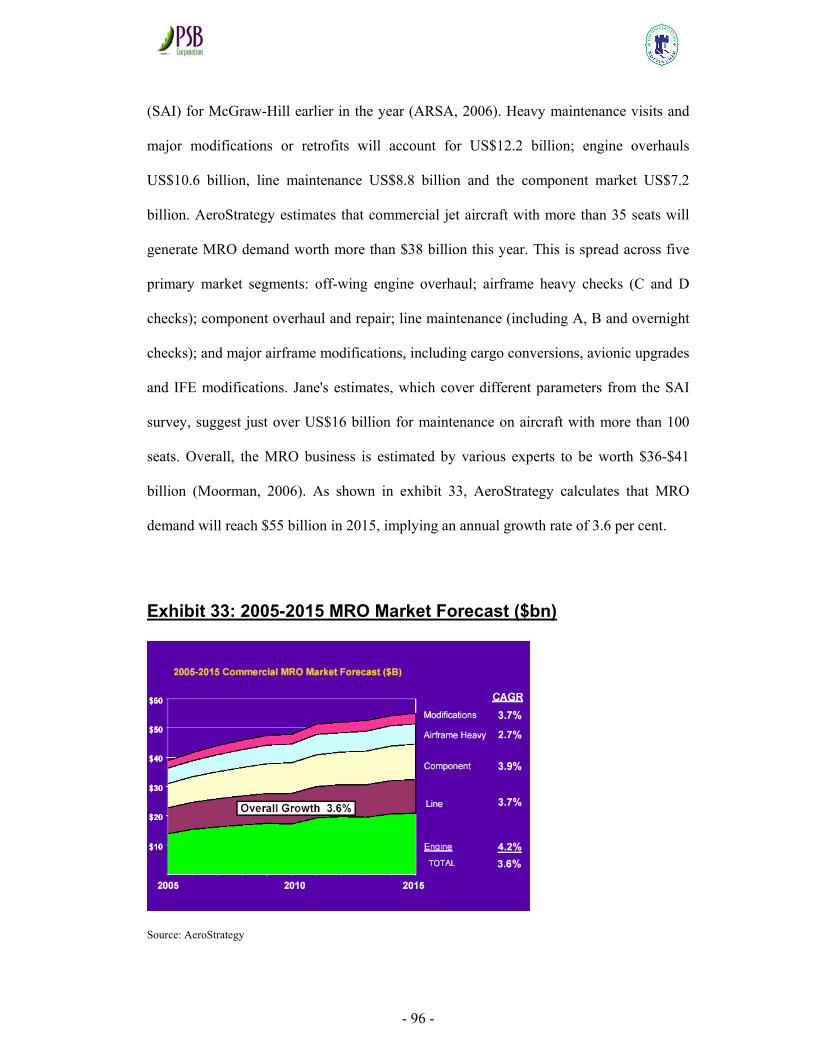
- 96 -
(SAI) for McGraw-Hill earlier in the year (ARSA, 2006). Heavy maintenance visits and
major modifications or retrofits will account for US$12.2 billion; engine overhauls
US$10.6 billion, line maintenance US$8.8 billion and the component market US$7.2
billion. AeroStrategy estimates that commercial jet aircraft with more than 35 seats will
generate MRO demand worth more than $38 billion this year. This is spread across five
primary market segments: off-wing engine overhaul; airframe heavy checks (C and D
checks); component overhaul and repair; line maintenance (including A, B and overnight
checks); and major airframe modifications, including cargo conversions, avionic upgrades
and IFE modifications. Jane's estimates, which cover different parameters from the SAI
survey, suggest just over US$16 billion for maintenance on aircraft with more than 100
seats. Overall, the MRO business is estimated by various experts to be worth $36-$41
billion (Moorman, 2006). As shown in exhibit 33, AeroStrategy calculates that MRO
demand will reach $55 billion in 2015, implying an annual growth rate of 3.6 per cent.
Exhibit 33: 2005-2015 MRO Market Forecast ($bn)
Source: AeroStrategy
- 97 -
Competitors in the MRO aftermarket include full service nose-to-tail MRO provider from
the airlines’ maintenance subsidiaries, Original Equipment Manufacturer (OEM) own
repair facilities and third parties independent MRO or component repair facilities.
Outsourcing of MRO work, which was an initiative of the low cost carriers to benefit
from economies of scales, is to the extent of around 51% at present. This is one among
many trends shaping the sustainability of the MRO market. For the foreseeable future,
network and low cost airlines will both demand lower cost but high quality MRO
services, as well as faster turnaround time.
Aviation MRO Industry Trend
Outsourcing Trend for MRO Services
Maintenance is traditionally one of the main barriers to entry for any new carrier. Setting
up an in-house maintenance department requires a high level of capital investment in
facilities and components that a low cost new carrier simply can’t afford if it is to be
competitive. Start-ups and low cost carriers pursuing a high growth strategy are typically
short on capital and driven by variable costs. Low cost Airlines only alternative is to
outsource as much of the maintenance function as practical. Outsourcing to an
organization with the in-depth MRO knowledge minimizes LCCs’ need for capital
investment and allows them to benefit from economies of scale realized by a large, high
volume MRO service provider. In a recent article publish in Aviation Week, Lott (2006)
reported that US low cost carriers have outsourced 51% of their maintenance spending,
while traditional network airlines have increase their maintenance outsourcing to 41%
- 98 -
from 25% in 2000. This trend towards outsourcing will create considerable opportunities
in the MRO Market.
Airline Affiliated MRO Turn into A Profit Center
The current uncertainties and financial turmoil within the airline industry provided a
catalyst for radical changes in airline maintenance, repair and overhaul operations.
Traditional network carriers seek to turn cost centers to profit centers, reduce variable
costs and transfer inventory costs to original equipment manufacturers (OEMs).
Conventionally, the legacy network carrier maintenance model operated with about 75%
in-house maintenance capabilities and overhauls virtually everything from airframe to
oven. This requires a large infrastructure and resulted in a high burden cost. Despite the
shift towards more reliance on third parties MRO service providers, the burden remains.
To reduce this burden, Airline MRO shop is actively seeking third party works to
augment the base load from the airline that own them. At the same time, they are
refocusing on specialty repairs instead overhauling everything and relying on continuous
improvement program to become leaner and more competitive.
Early Retirement of Older Aircraft
Since September 11th event in US, older aircraft have been retired from fleets more
quickly than originally planned. This prompted airlines to turn increasingly to OEM
suppliers for their long term business, as the cost of retooling for new aircraft types
becomes prohibitively expensive and the OEMs themselves seek more long term support
contracts. Some of the network airlines have even seek to dispose of their engineering
services division to reduce current operational expenditure or turn cost centers to profit
- 99 -
centers. This has meant more business for independent and OEM MRO suppliers, but at
lower margins. For example, Southwest and GE Engine Services signed an eight-year,
$1.5 billion OnPoint Solutions service agreement covering the carrier's nearly 600
CFM56-7Bs. In June 2005, it is reported by Moorman (2006) that JetBlue signed a 10-
year contract with MTU Aero Engines, a member of the IAE consortium, to provide
exclusive maintenance services for the airline's IAE V2500 engines. The contract covers
as many as 360 engines on the airline's fleet of A320s. Both Southwest and JetBlue
expect the deals to help in overall maintenance cost reduction.
Growth of Package MRO Service Program
Independent MRO service providers have also began to respond to the market forces, by
marketing new, more flexible MRO packages for the airlines. Airlines that lack a pre-
existing maintenance infrastructure or are reluctant to expand in-house maintenance
resources are turning to independent MRO service provider to solve both the operational
and financial challenges of maintenance. In Europe, LCC such as easyJet has utilized
independent MRO provider, FLS Aerospace to be the prime maintenance organization. In
Asia Pacific, as mentioned in earlier chapter on Food Chain Analysis, ST Aerospace
currently provides MRO service contracts for LCC such as Air Asia and JetStar, while
Cebu Pacific, Tiger Airways and Go Air contracted their MRO services to SIA
Engineering Company. Many LCCs have outsourced aircraft maintenance to free up
airline management to concentrate exclusively on earning revenue. However, this growth
in OEM and independent MRO support services will inevitably cause tensions in the
market as OEMs & Independent MRO find themselves competing for third party business
against the maintenance divisions of their own customers. Rather than compete, OEMs
- 100 -
and their customer airlines could also be drawn closer together; KLM has set up a
partnership with General Electric that could save the airline up to US$35 million in lower
inventory costs alone and in July this year, Revima APU, a Hamilton Sundstrand joint
venture has also signed an exclusive agreement with Lufthansa Technik for the
maintenance of Auxiliary Power Units (APUs). Under this agreement, Revima APU will
perform repair services on all APUs installed on Lufthansa Technik’s customers’ MD11
airplanes. This created long term strategic partnership and win-win solution for both
parties and their customers.
Evolving B2B Aviation e-Marketplace
In recent years, IT providers have become far more aggressive at getting business by
unveiling flexible solutions to help plan, manage and track maintenance as well as to keep
up with the latest regulatory changes. IT has become the necessary link between airlines
and their designated MRO organizations, whether in-house or outsourced. Not only are
airlines interested in MROs with IT systems that can track day-to-day maintenance, but
carriers also want to make sure that MROs' IT systems are capable of integrating with
theirs. Taking the lead, 13 airlines created a neutral aviation e-marketplace called the
Aeroxchange, to maximize efficiency across the complex aviation supply chain by
exploiting the power of the internet. Aeroxchange improve visibility to all source of
supply and resulted in better pricing for the airlines (Exhibit 34). Additional saving are
possible through the elimination of cumbersome integration of supplier and buyer IT
systems and online procurement. The potential benefits of more efficient buying and
selling of parts, information and services are clear. What is uncertain though is how
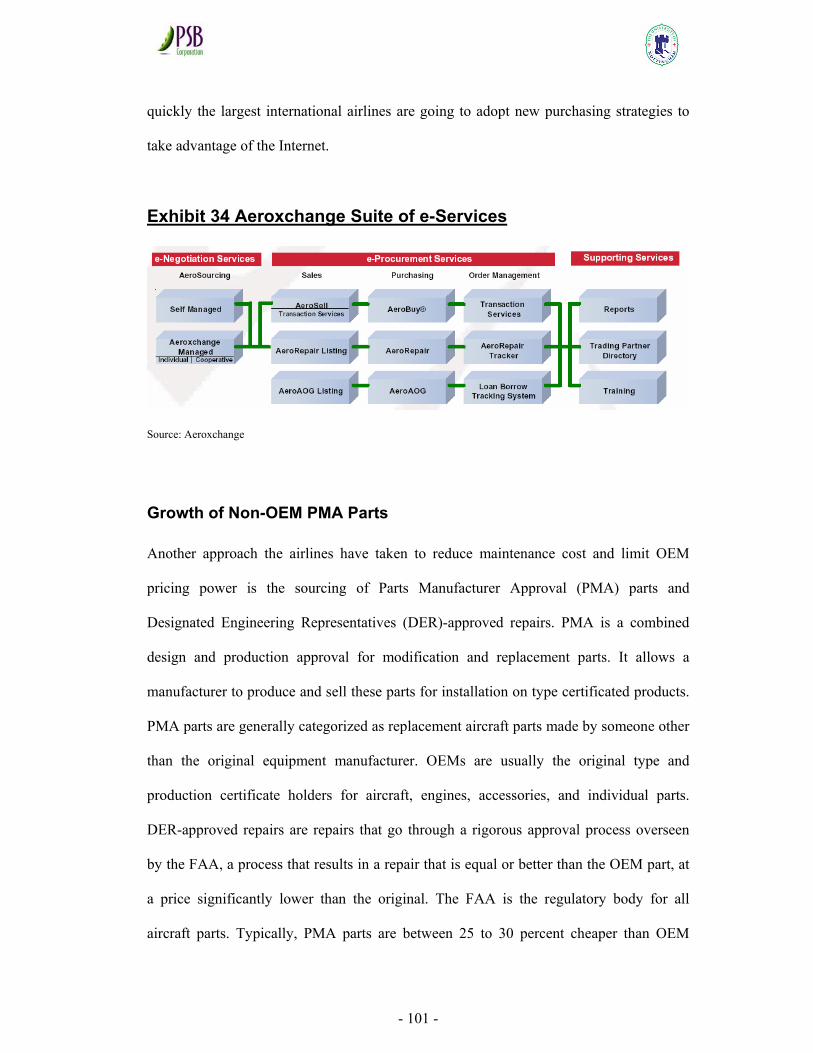
- 101 -
quickly the largest international airlines are going to adopt new purchasing strategies to
take advantage of the Internet.
Exhibit 34 Aeroxchange Suite of e-Services
Source: Aeroxchange
Growth of Non-OEM PMA Parts
Another approach the airlines have taken to reduce maintenance cost and limit OEM
pricing power is the sourcing of Parts Manufacturer Approval (PMA) parts and
Designated Engineering Representatives (DER)-approved repairs. PMA is a combined
design and production approval for modification and replacement parts. It allows a
manufacturer to produce and sell these parts for installation on type certificated products.
PMA parts are generally categorized as replacement aircraft parts made by someone other
than the original equipment manufacturer. OEMs are usually the original type and
production certificate holders for aircraft, engines, accessories, and individual parts.
DER-approved repairs are repairs that go through a rigorous approval process overseen
by the FAA, a process that results in a repair that is equal or better than the OEM part, at
a price significantly lower than the original. The FAA is the regulatory body for all
aircraft parts. Typically, PMA parts are between 25 to 30 percent cheaper than OEM
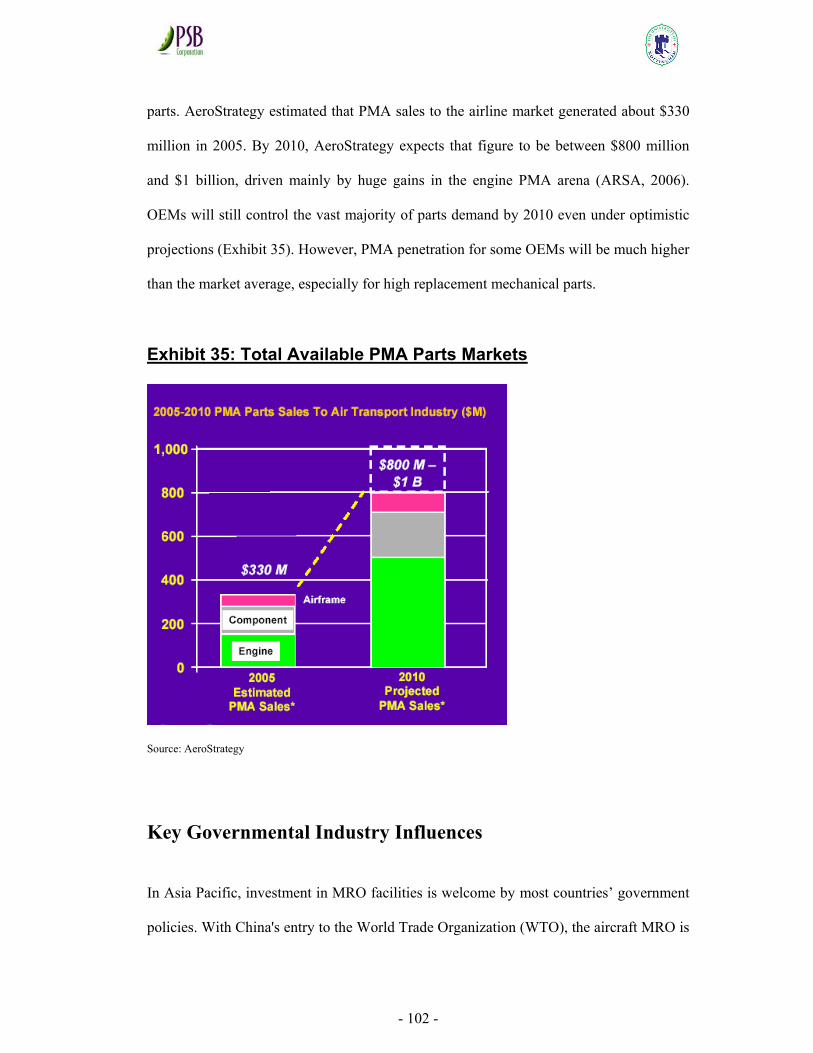
- 102 -
parts. AeroStrategy estimated that PMA sales to the airline market generated about $330
million in 2005. By 2010, AeroStrategy expects that figure to be between $800 million
and $1 billion, driven mainly by huge gains in the engine PMA arena (ARSA, 2006).
OEMs will still control the vast majority of parts demand by 2010 even under optimistic
projections (Exhibit 35). However, PMA penetration for some OEMs will be much higher
than the market average, especially for high replacement mechanical parts.
Exhibit 35: Total Available PMA Parts Markets
Source: AeroStrategy
Key Governmental Industry Influences
In Asia Pacific, investment in MRO facilities is welcome by most countries’ government
policies. With China's entry to the World Trade Organization (WTO), the aircraft MRO is
- 103 -
the main service sector that will be opened widest to foreign companies. Foreign firms are
allowed to establish companies in China, either in the form of joint venture or
independent companies, to operate MRO business for Chinese or international air
carriers. Singapore is also promoting itself as the aviation hub and many OEMs are
attracted to start operation in Singapore due to its favorable business environment, high
pool of skilled professional and good infrastructure.
MRO activities are regulated by major civil aviation authorities such as Federal Aviation
Administration (FAA), European Aviation Safety Agency (EASA), and the local civil
aviation authority where the facility is situated. In order to start operation, the MRO
organization has to be certified by the local civil aviation authority and major civil
authorities such as FAA or EASA as a minimum. Rarely does the FAA/EASA revoke any
MRO organization license but the license is only renewable after an audit of the facility
operation on a frequency as determine by the relevant civil aviation authority. The norm
is at least once a year.
Threat of New Entrants
The barrier of entry and the profit of the industry determine the key of whether a potential
entrant will come into an industry. If the barrier is high or the profit after the entrance is
small, then the possibility of the potential entrant’s entry is low, and the challenges for the
existing market players within the industry is insignificant. The aviation MRO is an
industry of high entry barrier and lucrative profit and very few private individual
entrepreneurs would consider starting a MRO venture unless they have technical know-
- 104 -
how and huge capital support. The potential entrants of Asia Pacific MRO service include
third party foreign MRO companies and the MRO facilities set up by OEM. Both of them
having the technical knowledge, capital and management, and they will have a big impact
on Airline owned MRO facilities in the Asia Pacific region. OEM has proprietary
technical information of their products and has the practice of limiting the access only to
airlines or the aircraft manufacturer only. This has restricted the number of companies
that can enter into the MRO market.
As reported by Jackman (2001), most major OEMs are pursuing the partnership strategy.
This strategy is driven by the airlines that are demanding better equipment reliability,
more predictable costs and service programs geared towards more operational support
than simply overhaul and maintenance. Airlines want to do business with smaller number
of vendors and are ever more on the lookout for one-stop shopping. To deliver this type
of support package requires a broad capabilities and worldwide locations that are
complicated for any single company to possess and still be flexible enough to develop
customized support solutions for different airlines. This type of service often is
deliverable only through partnerships and joint ventures. Multi-company networks
involving companies from a variety of market segments can develop a complete support
packages for their customers that include engineering services, technical data and
manuals, inventory management and logistics, and major modifications and retrofits, as
well as airframe and component repair services. In pursuit of this trend, Airbus is taking
steps to create a worldwide MRO network to strengthen its direct ties with third party
providers. The Airbus MRO network has 13 members worldwide and has Hong Kong
Aircraft Engineering Company (HAECO), SIA Engineering Company and ST Aerospace
in Asia Pacific (Airbus Press Center, 2006). Major engines OEMs such as GE, Rolls-
- 105 -
Royce and Pratt & Whitney also have joint venture overhaul facilities around the world to
support their engines and those of their competitors. Honeywell and Hamilton
Sundstrand, both major suppliers of aircraft systems and components is also aggressive
aftermarket player. Hamilton Sundstrand has 2 repair facilities in Asia Pacific that are
joint ventures with the airlines to support their products and those of their competitors.
Bargaining Power of Buyers
Airlines are facing fierce competition and falling yields as mentioned in the introduction
of Low Cost Carrier Business Models section, and are embracing MRO service programs
that have the features of predictable maintenance costs and cater towards operational
support. They want to deal with fewer vendors and are increasingly seeking for one-stop
MRO service providers. The growing sophistication and reliability of present aircraft
plays a pivotal role here. Latest planes design entail less maintenance, which set hurdles
for a carrier to achieve the critical mass of maintenance work needed to justify the capital
outlay of doing it in-house. But at the same time, the more and more sophisticated
hardware found on newer aircraft requires increasingly complex and expensive test
equipment, couple with the greater system reliability of new components means there are
fewer test requirements. This make it even harder to justify the operating cost of a new
test rig, and training technician to operate it, if it's going to be used less often than older
test rigs. Outsourcing becomes a viable alternative and there is increasing trend of
outsourcing as mentioned in the Aviation MRO Industry Trend section.
Repair and overhaul (MRO) market is dominated by the accelerating development of
comprehensive and complicated global aftermarket service networks comprising of
- 106 -
airlines, original equipment manufacturers (OEMs) and third-party independent repair
facilities. In Asia Pacific, the OEM is dominating the market through either their joint
ventures with the airlines or partnership with third party service providers in the region.
Foreign MRO outside the Asia Pacific region such as Lufthansa Technik (LHT), the
MRO arm of Lufthansa German Airlines and other airline affiliated MRO operations,
such as SR Technics, United Services and Delta, are at least in part banking on their
operational experience to attract customers in Asia. Together with in-region airline
affiliated MRO such as HAECO and SIA Engineering Company, and third party MRO
such as ST Aerospace, the increasing competition has create a bargaining power for the
airline operators.
Bargaining Power of Suppliers
Traditionally, OEM exerts considerable power in the MRO supply chains. This can be
observed from the ability of the OEM to continuously escalate their catalogue part prices.
When third parties MRO procured parts to repair OEM aircraft components, they are
always subjected to the full catalogue lead time and this lead to great inefficiency in the
supply chains. However, regulations start to change in 1996, with FAA changing the
format of its airworthiness bilateral with foreign civil aviation authorities to one that was
more flexible and addressed Parts Manufacturer Approval (PMA) parts specifically
(Broderick, 2005). Then, in 1997, Lufthansa Technik helped put PMA on the radar screen
in Europe by investing in Heico subsidiary Heico Aerospace. Heico is a key PMA parts
manufacturer and supplier, and Lufthansa Technik (LHT) is the MRO arm of Lufthansa
Airlines (Exhibit 36).
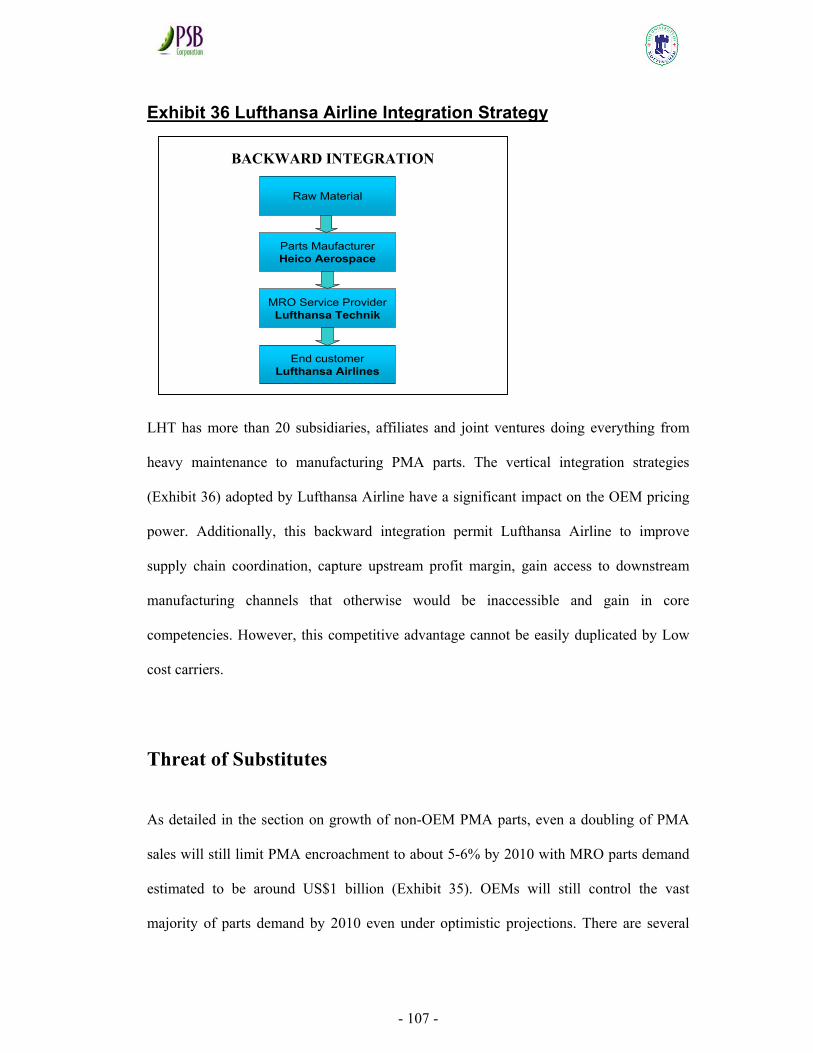
- 107 -
Exhibit 36 Lufthansa Airline Integration Strategy
LHT has more than 20 subsidiaries, affiliates and joint ventures doing everything from
heavy maintenance to manufacturing PMA parts. The vertical integration strategies
(Exhibit 36) adopted by Lufthansa Airline have a significant impact on the OEM pricing
power. Additionally, this backward integration permit Lufthansa Airline to improve
supply chain coordination, capture upstream profit margin, gain access to downstream
manufacturing channels that otherwise would be inaccessible and gain in core
competencies. However, this competitive advantage cannot be easily duplicated by Low
cost carriers.
Threat of Substitutes
As detailed in the section on growth of non-OEM PMA parts, even a doubling of PMA
sales will still limit PMA encroachment to about 5-6% by 2010 with MRO parts demand
estimated to be around US$1 billion (Exhibit 35). OEMs will still control the vast
majority of parts demand by 2010 even under optimistic projections. There are several
BACKWARD INTEGRATION
Raw Material
Parts MaufacturerHeico Aerospace
End customerLufthansa Airlines
MRO Service ProviderLufthansa Technik
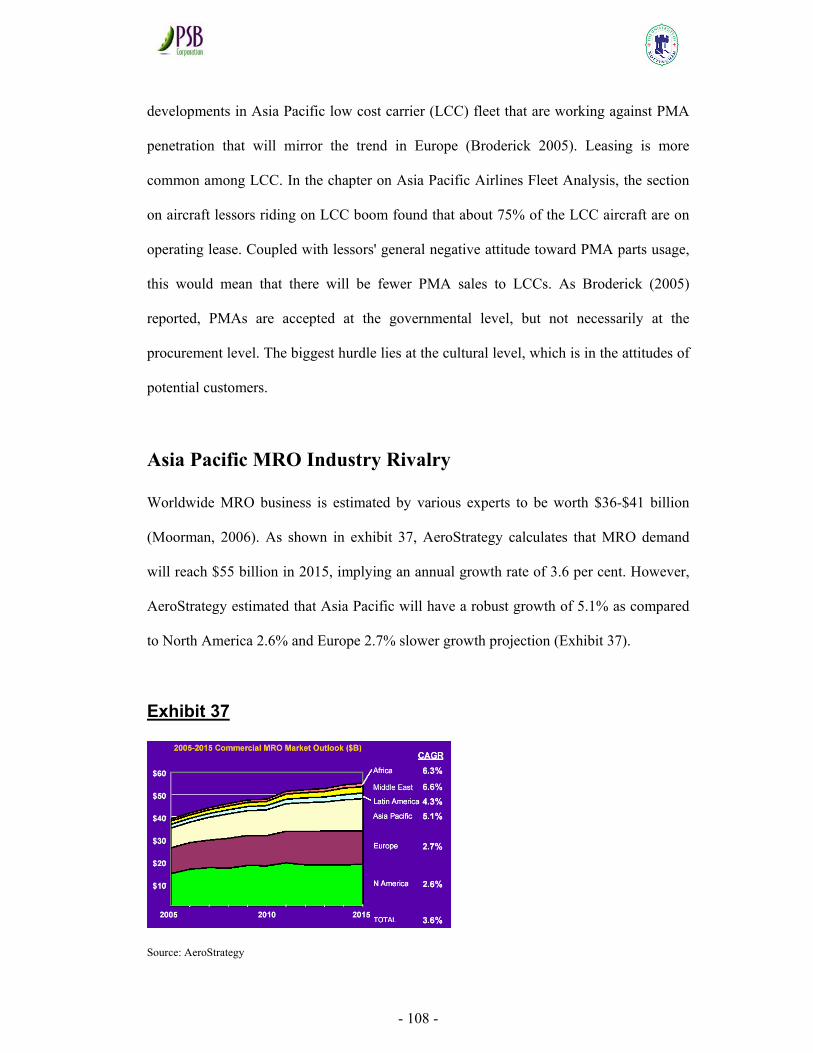
- 108 -
developments in Asia Pacific low cost carrier (LCC) fleet that are working against PMA
penetration that will mirror the trend in Europe (Broderick 2005). Leasing is more
common among LCC. In the chapter on Asia Pacific Airlines Fleet Analysis, the section
on aircraft lessors riding on LCC boom found that about 75% of the LCC aircraft are on
operating lease. Coupled with lessors' general negative attitude toward PMA parts usage,
this would mean that there will be fewer PMA sales to LCCs. As Broderick (2005)
reported, PMAs are accepted at the governmental level, but not necessarily at the
procurement level. The biggest hurdle lies at the cultural level, which is in the attitudes of
potential customers.
Asia Pacific MRO Industry Rivalry
Worldwide MRO business is estimated by various experts to be worth $36-$41 billion
(Moorman, 2006). As shown in exhibit 37, AeroStrategy calculates that MRO demand
will reach $55 billion in 2015, implying an annual growth rate of 3.6 per cent. However,
AeroStrategy estimated that Asia Pacific will have a robust growth of 5.1% as compared
to North America 2.6% and Europe 2.7% slower growth projection (Exhibit 37).
Exhibit 37
Source: AeroStrategy
- 109 -
As Lewis et al (1999) suggested, a fast growing industry will have a relatively lower
industry rivalry because there is room for most or all organizations to prosper. However,
the slower growth rate in North America & Europe will push more experienced foreign
MROs to seek the greener pasture in Asia Pacific. As noted in earlier section, LHT has a
comprehensive global MRO network and is more likely to set their eyes on Asia to
continue their market expansion for MRO services and PMA parts. Currently, the Asia
Pacific LCCs MRO market has been shared between SIA Engineering Company and ST
Aerospace. With more foreign MROs competing with the regional MRO organizations
for the same slice of the market. The decreased concentration of market players will
further increase the industry rivalry within the Asia Pacific region, a point raised by
Lewis et al (2006).
Lewis et al (1999) suggested that industry rivalry will also increase if the switching cost
is low, which will be easy for buyers to switch from one competitor’s product to another.
This would be more applicable to the LCCs whose maintenance is mainly outsourced as
discussed in earlier section on Outsourcing Trend for MRO Services. LCCs continuous
drive towards a lower cost base will weaken their loyalty to any MRO service provider.
Therefore it is important for MRO to increase the exit barrier in their service package or
entice the LCCs to commit to a long term service agreements.
Having reviewed the MRO industry dynamics using the modified Porter’s five forces, we
will continue with a SWOT analysis to review Hamilton Sundstrand resources to meet the
competition in the next section.
- 110 -
SWOT Analysis on Hamilton Sundstrand
In this section, we will shift the focus from the firm’s industry environment as examine
above using the modified Porter’s five forces framework to the characteristics of the firm
itself. The following section will scrutinize Hamilton Sundstrand’s potential for
establishing competitive advantage by assessing Hamilton Sundstrand resources and
capabilities, which the organization owns or has access to. The case for making the
resources and capabilities of the firm the foundation for its long-term strategy rests upon
two premises. The first concerns the role of resources in defining the identity of the firm.
That is determining what the firm can do and deciding in which industries and through
what types of competitive strategy the firm can best exploit these capabilities. The second
reason for focusing on resources as the foundation for a firm’s strategy is that profits are
ultimately a return to the resources owned and controlled by the firm (Grant, 1998). The
Resource-Based View (RBV) highlights the need for a fit between the external market
context in which a firm operates and its internal capabilities. Let’s start by examining
Hamilton Sundstrand strength and weakness.
Strength
To examine how the company can create competitive advantage, the framework proposed
by Grant (2002) as shown in exhibit 38 will be used to evaluate how groups of resources
work together to create the capabilities that led to the firm competitive advantage.
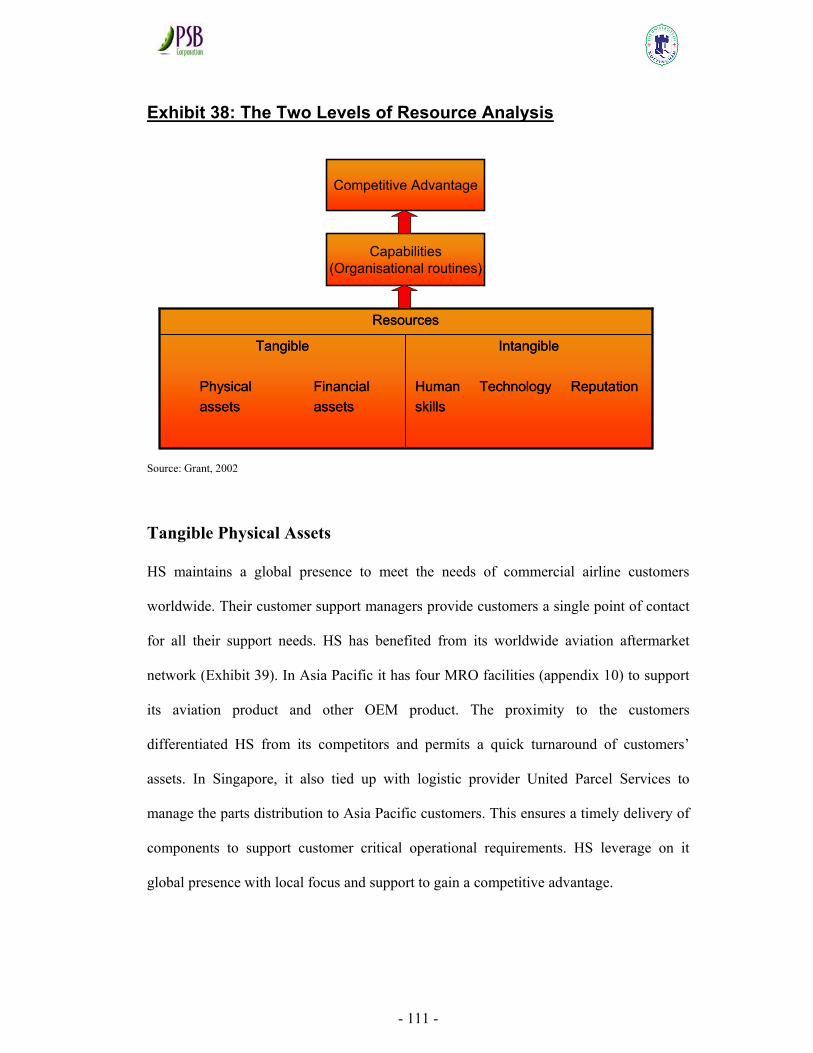
- 111 -
Exhibit 38: The Two Levels of Resource Analysis
Source: Grant, 2002
Tangible Physical Assets
HS maintains a global presence to meet the needs of commercial airline customers
worldwide. Their customer support managers provide customers a single point of contact
for all their support needs. HS has benefited from its worldwide aviation aftermarket
network (Exhibit 39). In Asia Pacific it has four MRO facilities (appendix 10) to support
its aviation product and other OEM product. The proximity to the customers
differentiated HS from its competitors and permits a quick turnaround of customers’
assets. In Singapore, it also tied up with logistic provider United Parcel Services to
manage the parts distribution to Asia Pacific customers. This ensures a timely delivery of
components to support customer critical operational requirements. HS leverage on it
global presence with local focus and support to gain a competitive advantage.
Competitive Advantage
Capabilities(Organisational routines)
Intangible
Human Technology Reputationskills
Tangible
Physical Financialassets assets
Resources
Intangible
Human Technology Reputationskills
Tangible
Physical Financialassets assets
Resources
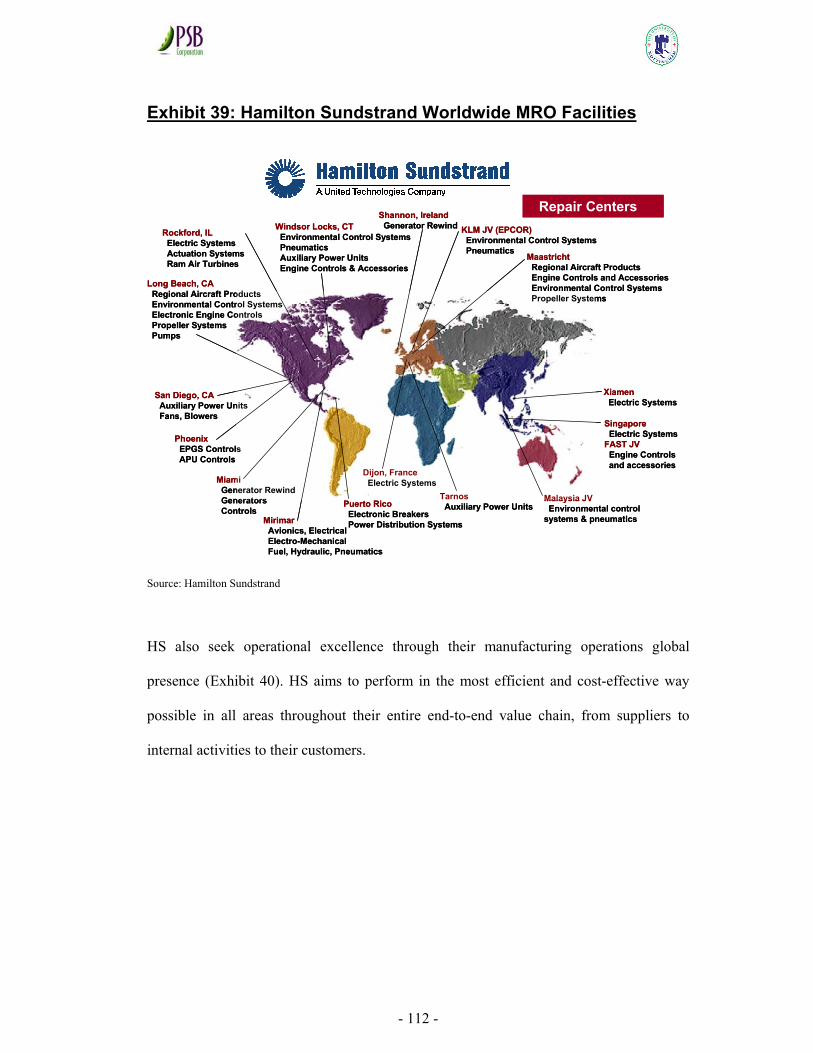
- 112 -
Exhibit 39: Hamilton Sundstrand Worldwide MRO Facilities
Source: Hamilton Sundstrand
HS also seek operational excellence through their manufacturing operations global
presence (Exhibit 40). HS aims to perform in the most efficient and cost-effective way
possible in all areas throughout their entire end-to-end value chain, from suppliers to
internal activities to their customers.
Windsor Locks, CTEnvironmental Control SystemsPneumaticsAuxiliary Power UnitsEngine Controls & Accessories
XiamenElectric Systems
SingaporeElectric Systems
FAST JVEngine Controlsand accessories
San Diego, CAAuxiliary Power UnitsFans, Blowers
Rockford, ILElectric SystemsActuation SystemsRam Air Turbines
Long Beach, CARegional Aircraft ProductsEnvironmental Control SystemsElectronic Engine ControlsPropeller SystemsPumps
Repair Centers
Malaysia JVEnvironmental control
systems & pneumatics
MaastrichtRegional Aircraft ProductsEngine Controls and AccessoriesEnvironmental Control SystemsPropeller Systems
KLM JV (EPCOR)Environmental Control SystemsPneumatics
PhoenixEPGS ControlsAPU Controls
MiamiGenerator RewindGeneratorsControls
MirimarAvionics, ElectricalElectro-MechanicalFuel, Hydraulic, Pneumatics
Puerto RicoElectronic BreakersPower Distribution Systems
Dijon, FranceElectric Systems
TarnosAuxiliary Power Units
Shannon, IrelandGenerator RewindWindsor Locks, CT
Environmental Control SystemsPneumaticsAuxiliary Power UnitsEngine Controls & Accessories
XiamenElectric Systems
SingaporeElectric Systems
FAST JVEngine Controlsand accessories
San Diego, CAAuxiliary Power UnitsFans, Blowers
Rockford, ILElectric SystemsActuation SystemsRam Air Turbines
Long Beach, CARegional Aircraft ProductsEnvironmental Control SystemsElectronic Engine ControlsPropeller SystemsPumps
Repair CentersRepair Centers
Malaysia JVEnvironmental control
systems & pneumatics
MaastrichtRegional Aircraft ProductsEngine Controls and AccessoriesEnvironmental Control SystemsPropeller Systems
KLM JV (EPCOR)Environmental Control SystemsPneumatics
PhoenixEPGS ControlsAPU Controls
MiamiGenerator RewindGeneratorsControls
MirimarAvionics, ElectricalElectro-MechanicalFuel, Hydraulic, Pneumatics
Puerto RicoElectronic BreakersPower Distribution Systems
Dijon, FranceElectric Systems
TarnosAuxiliary Power Units
Shannon, IrelandGenerator Rewind
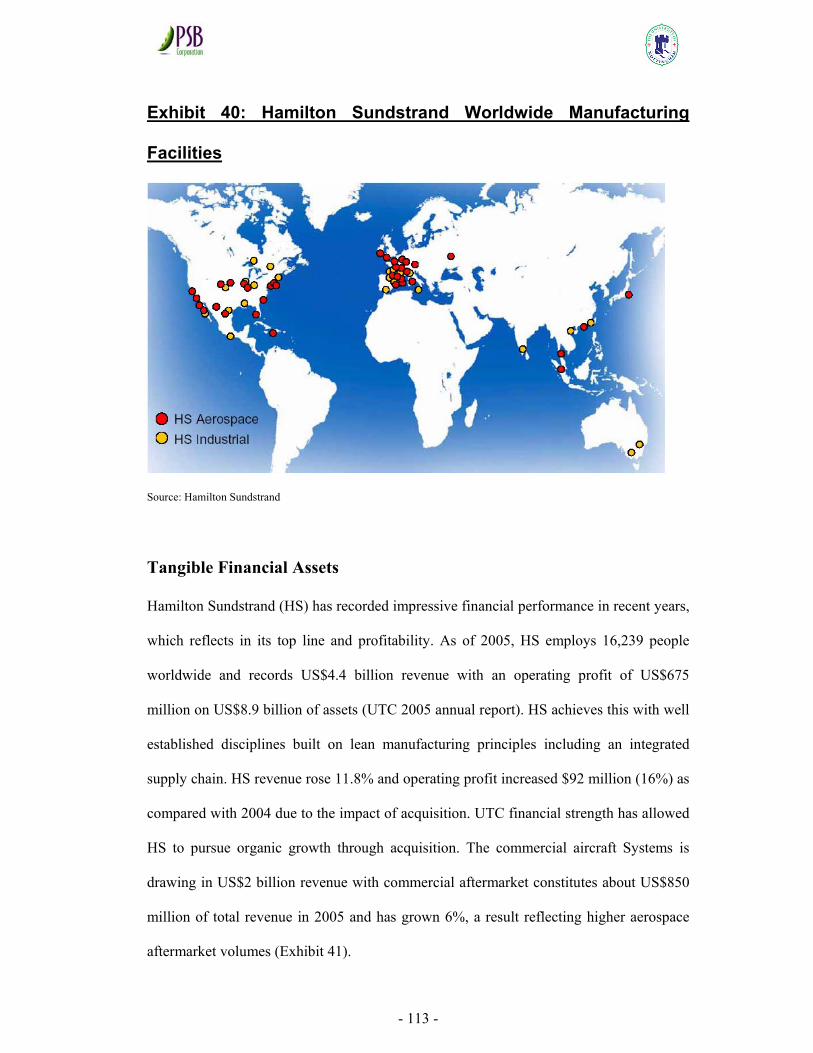
- 113 -
Exhibit 40: Hamilton Sundstrand Worldwide Manufacturing
Facilities
Source: Hamilton Sundstrand
Tangible Financial Assets
Hamilton Sundstrand (HS) has recorded impressive financial performance in recent years,
which reflects in its top line and profitability. As of 2005, HS employs 16,239 people
worldwide and records US$4.4 billion revenue with an operating profit of US$675
million on US$8.9 billion of assets (UTC 2005 annual report). HS achieves this with well
established disciplines built on lean manufacturing principles including an integrated
supply chain. HS revenue rose 11.8% and operating profit increased $92 million (16%) as
compared with 2004 due to the impact of acquisition. UTC financial strength has allowed
HS to pursue organic growth through acquisition. The commercial aircraft Systems is
drawing in US$2 billion revenue with commercial aftermarket constitutes about US$850
million of total revenue in 2005 and has grown 6%, a result reflecting higher aerospace
aftermarket volumes (Exhibit 41).
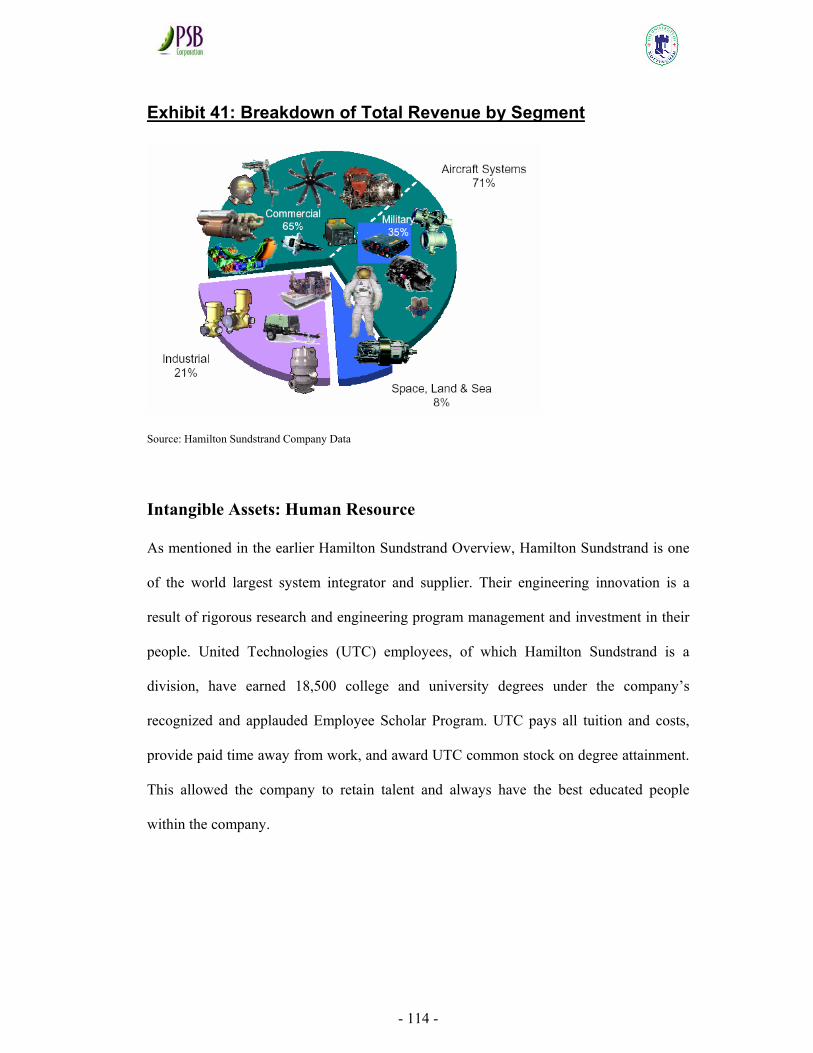
- 114 -
Exhibit 41: Breakdown of Total Revenue by Segment
Source: Hamilton Sundstrand Company Data
Intangible Assets: Human Resource
As mentioned in the earlier Hamilton Sundstrand Overview, Hamilton Sundstrand is one
of the world largest system integrator and supplier. Their engineering innovation is a
result of rigorous research and engineering program management and investment in their
people. United Technologies (UTC) employees, of which Hamilton Sundstrand is a
division, have earned 18,500 college and university degrees under the company’s
recognized and applauded Employee Scholar Program. UTC pays all tuition and costs,
provide paid time away from work, and award UTC common stock on degree attainment.
This allowed the company to retain talent and always have the best educated people
within the company.
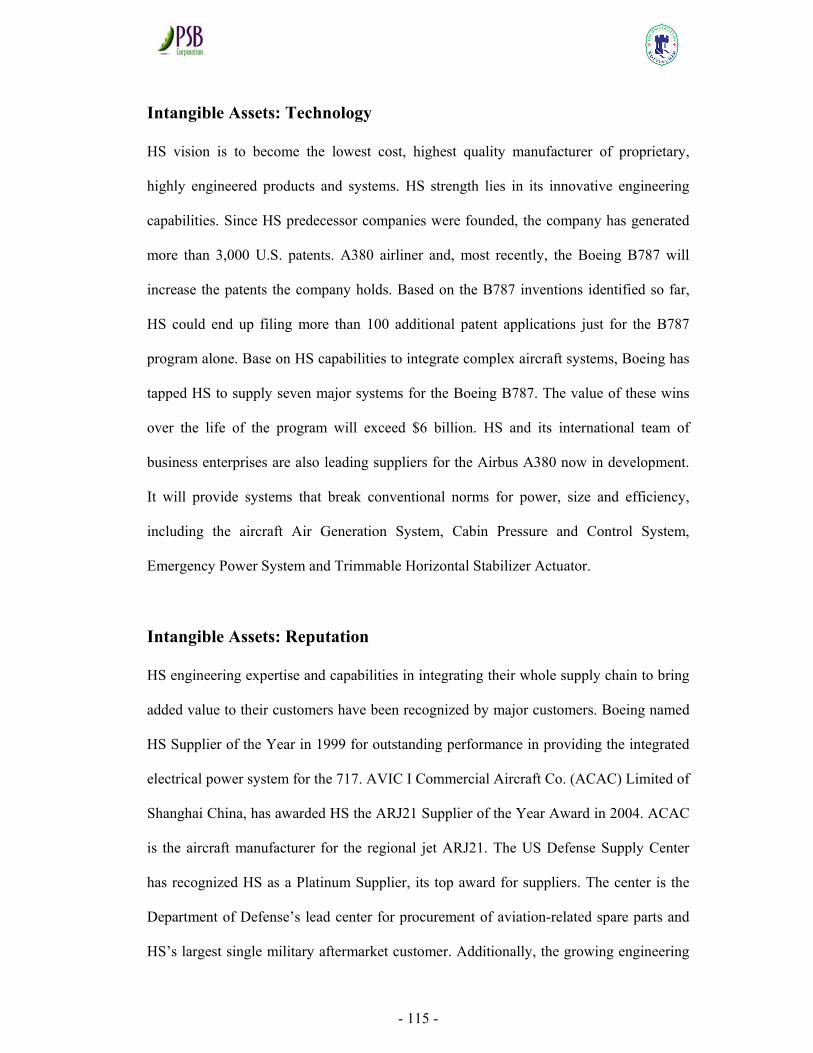
- 115 -
Intangible Assets: Technology
HS vision is to become the lowest cost, highest quality manufacturer of proprietary,
highly engineered products and systems. HS strength lies in its innovative engineering
capabilities. Since HS predecessor companies were founded, the company has generated
more than 3,000 U.S. patents. A380 airliner and, most recently, the Boeing B787 will
increase the patents the company holds. Based on the B787 inventions identified so far,
HS could end up filing more than 100 additional patent applications just for the B787
program alone. Base on HS capabilities to integrate complex aircraft systems, Boeing has
tapped HS to supply seven major systems for the Boeing B787. The value of these wins
over the life of the program will exceed $6 billion. HS and its international team of
business enterprises are also leading suppliers for the Airbus A380 now in development.
It will provide systems that break conventional norms for power, size and efficiency,
including the aircraft Air Generation System, Cabin Pressure and Control System,
Emergency Power System and Trimmable Horizontal Stabilizer Actuator.
Intangible Assets: Reputation
HS engineering expertise and capabilities in integrating their whole supply chain to bring
added value to their customers have been recognized by major customers. Boeing named
HS Supplier of the Year in 1999 for outstanding performance in providing the integrated
electrical power system for the 717. AVIC I Commercial Aircraft Co. (ACAC) Limited of
Shanghai China, has awarded HS the ARJ21 Supplier of the Year Award in 2004. ACAC
is the aircraft manufacturer for the regional jet ARJ21. The US Defense Supply Center
has recognized HS as a Platinum Supplier, its top award for suppliers. The center is the
Department of Defense’s lead center for procurement of aviation-related spare parts and
HS’s largest single military aftermarket customer. Additionally, the growing engineering
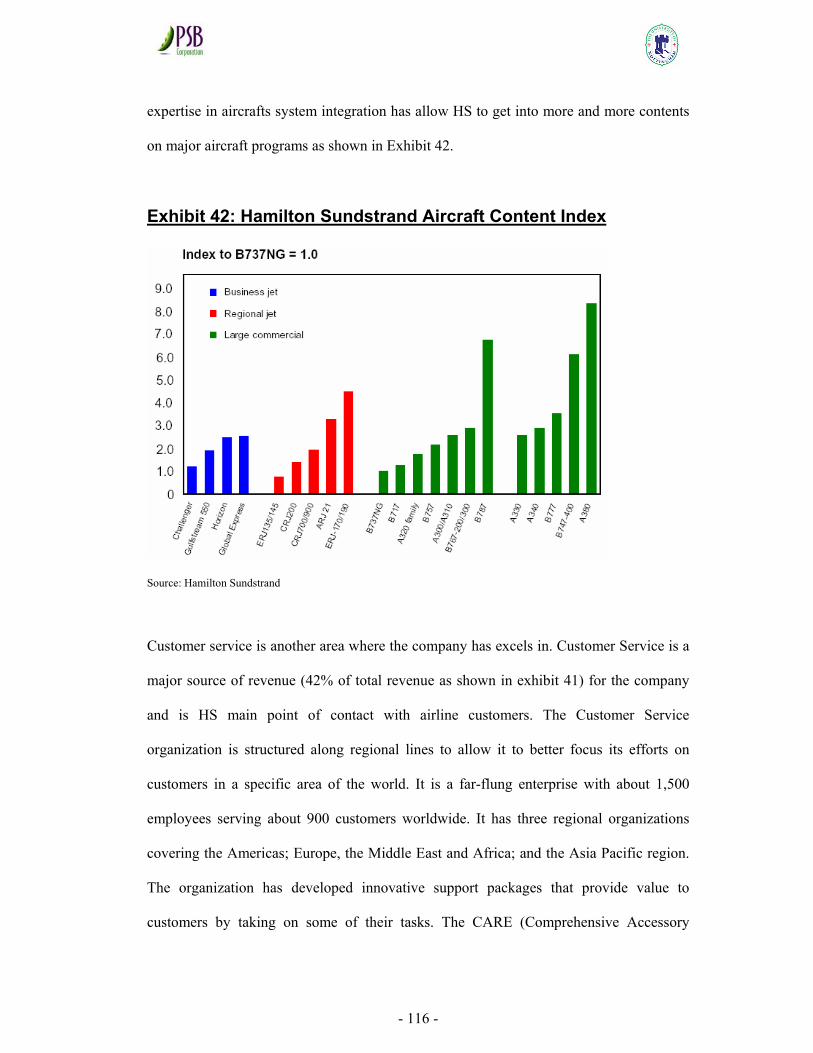
- 116 -
expertise in aircrafts system integration has allow HS to get into more and more contents
on major aircraft programs as shown in Exhibit 42.
Exhibit 42: Hamilton Sundstrand Aircraft Content Index
Source: Hamilton Sundstrand
Customer service is another area where the company has excels in. Customer Service is a
major source of revenue (42% of total revenue as shown in exhibit 41) for the company
and is HS main point of contact with airline customers. The Customer Service
organization is structured along regional lines to allow it to better focus its efforts on
customers in a specific area of the world. It is a far-flung enterprise with about 1,500
employees serving about 900 customers worldwide. It has three regional organizations
covering the Americas; Europe, the Middle East and Africa; and the Asia Pacific region.
The organization has developed innovative support packages that provide value to
customers by taking on some of their tasks. The CARE (Comprehensive Accessory
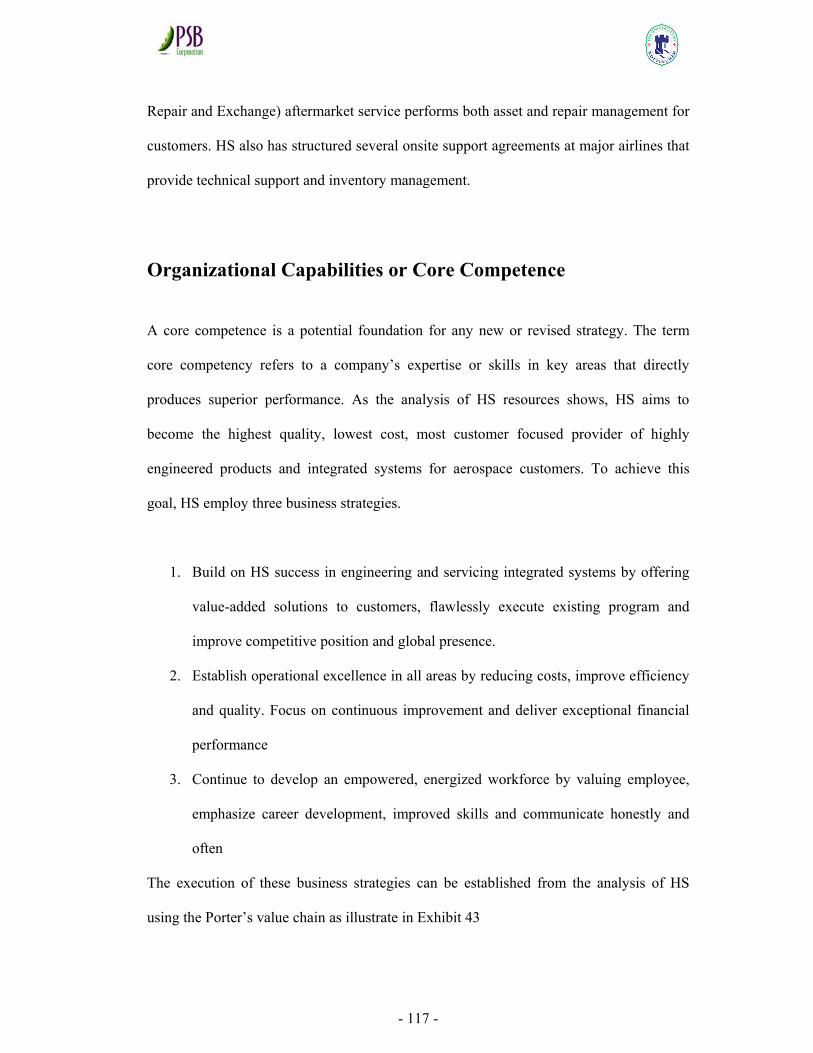
- 117 -
Repair and Exchange) aftermarket service performs both asset and repair management for
customers. HS also has structured several onsite support agreements at major airlines that
provide technical support and inventory management.
Organizational Capabilities or Core Competence
A core competence is a potential foundation for any new or revised strategy. The term
core competency refers to a company’s expertise or skills in key areas that directly
produces superior performance. As the analysis of HS resources shows, HS aims to
become the highest quality, lowest cost, most customer focused provider of highly
engineered products and integrated systems for aerospace customers. To achieve this
goal, HS employ three business strategies.
1. Build on HS success in engineering and servicing integrated systems by offering
value-added solutions to customers, flawlessly execute existing program and
improve competitive position and global presence.
2. Establish operational excellence in all areas by reducing costs, improve efficiency
and quality. Focus on continuous improvement and deliver exceptional financial
performance
3. Continue to develop an empowered, energized workforce by valuing employee,
emphasize career development, improved skills and communicate honestly and
often
The execution of these business strategies can be established from the analysis of HS
using the Porter’s value chain as illustrate in Exhibit 43
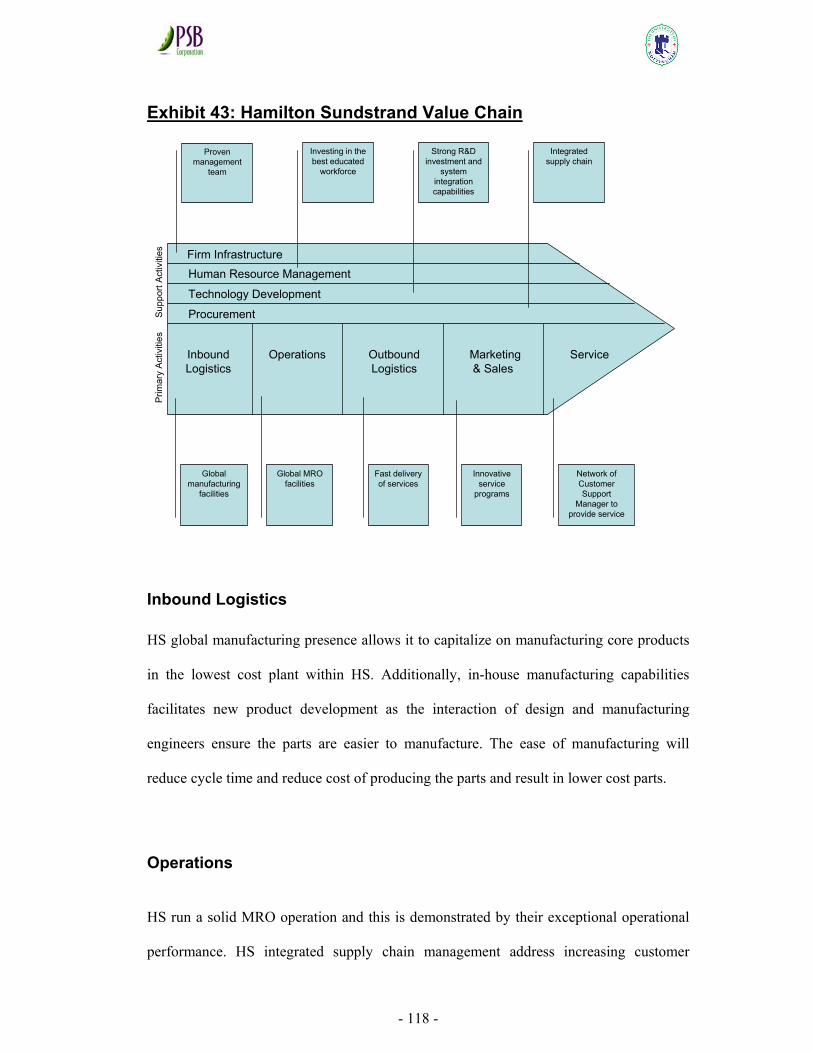
- 118 -
Exhibit 43: Hamilton Sundstrand Value Chain
Inbound Logistics
HS global manufacturing presence allows it to capitalize on manufacturing core products
in the lowest cost plant within HS. Additionally, in-house manufacturing capabilities
facilitates new product development as the interaction of design and manufacturing
engineers ensure the parts are easier to manufacture. The ease of manufacturing will
reduce cycle time and reduce cost of producing the parts and result in lower cost parts.
Operations
HS run a solid MRO operation and this is demonstrated by their exceptional operational
performance. HS integrated supply chain management address increasing customer
Firm InfrastructureHuman Resource Management
Inbound Logistics
Technology Development
Procurement
Outbound Logistics
Marketing& Sales
ServiceOperations
Global manufacturing
facilities
Prim
ary
Act
iviti
esS
uppo
rt A
ctiv
ities
Global MRO facilities
Fast delivery of services
Innovative service
programs
Network of Customer Support
Manager to provide service
Proven management
team
Investing in the best educated
workforce
Strong R&D investment and
system integration capabilities
Integrated supply chain

- 119 -
demands for quality, delivery, and speed. Supply chains can exist in both manufacturing
and service organizations, and they are principally concerned with the flow of products
and information between supply chain member organizations. This includes activities
such as procurement of materials, transformation of materials into finished product, and
distribution of that product to end customers. Today’s information-driven, integrated
supply chains are enabling HS to reduce inventory and costs, add product value, extend
resources, accelerate time to market, and retain customers.
“Outbound Logistics”
The average turnaround time for component repair is within the industry best of 15 days.
The global manufacturing operations and MRO presence allows it to be close to the
customers and permits a quick turnaround of customers’ assets. The facilities proximity
offer great inventory saving to the airlines. The longer it takes to return a serviceable
component to the airline after repair would means provisioning a higher level of
inventory for airline operation. A typical industry inventory provisioning calculation
found that a 30 days vs. a 15 days turnaround time would generate saving of 47%. A 45
days vs. a 15 days turnaround time would save the airline a hefty 91% on inventory.
Marketing & Sales
HS has a strong marketing team and has been recognized within the aviation industry to
be innovative in their approach to design MRO packages to meet the customer demands.
Exhibit 44 highlight an award given by Aviation week’s to Hamilton Sundstrand for their
innovative MRO packages.
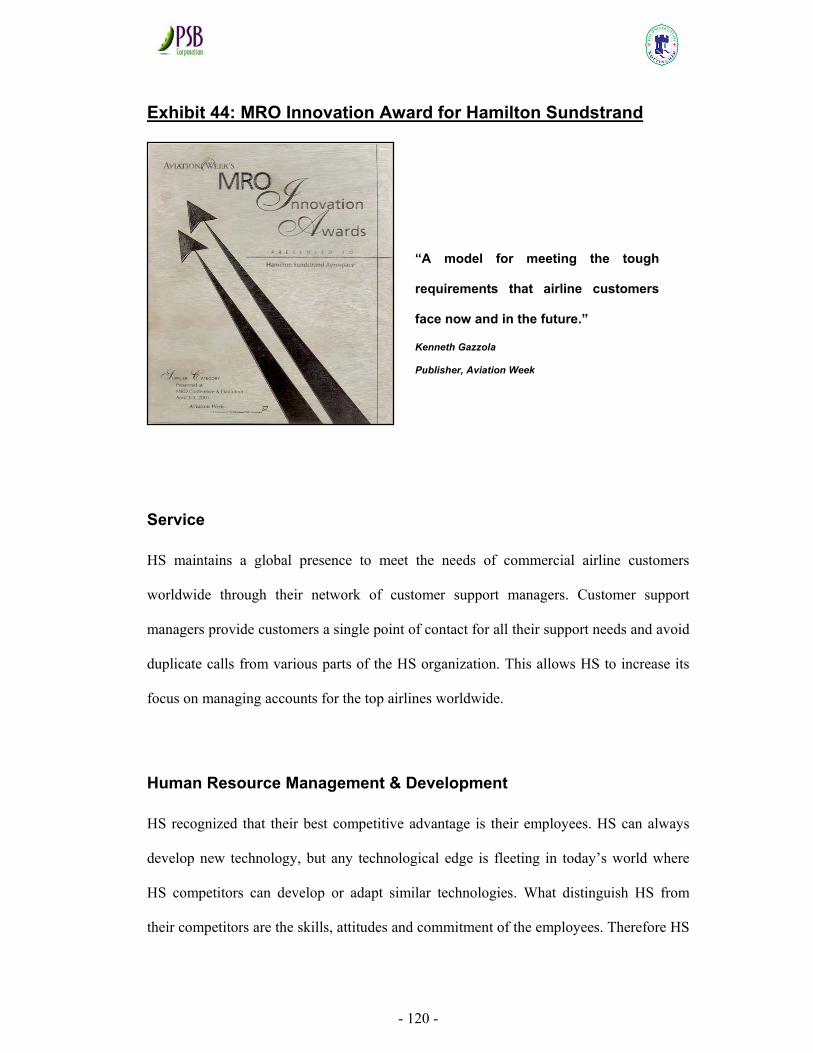
- 120 -
Exhibit 44: MRO Innovation Award for Hamilton Sundstrand
Service
HS maintains a global presence to meet the needs of commercial airline customers
worldwide through their network of customer support managers. Customer support
managers provide customers a single point of contact for all their support needs and avoid
duplicate calls from various parts of the HS organization. This allows HS to increase its
focus on managing accounts for the top airlines worldwide.
Human Resource Management & Development
HS recognized that their best competitive advantage is their employees. HS can always
develop new technology, but any technological edge is fleeting in today’s world where
HS competitors can develop or adapt similar technologies. What distinguish HS from
their competitors are the skills, attitudes and commitment of the employees. Therefore HS
“A model for meeting the tough
requirements that airline customers
face now and in the future.”
Kenneth Gazzola
Publisher, Aviation Week
- 121 -
invest continually in their employee education so that a culture of continuous learning is
embedded in HS employee to enable them to adapt quickly to new ways of doing
business. Employees are given the necessary information and tools to understand and
meet HS customers’ needs and desires, so that they can develop and provide value-added
solutions for HS customers.
Technology Development
The people, the products and the processes of various businesses are helping HS venture
into new dimensions of systems integration. These businesses are combining expertise,
building new skill sets and integrating system packages to a degree traditionally
performed by the aircraft manufacturers themselves. By doing this, HS revolutionize the
level of value that they bring to their customers such as the aircraft and engine
manufacturer. Base on HS capabilities to integrate complex aircraft systems, Boeing has
tapped HS to supply seven major systems for the Boeing B787. HS and its international
team of business enterprises are also leading suppliers for the Airbus A380 now in
development.
Firm Infrastructure
HS have a proven management team which has significant aerospace industry
experiences. The present President Dave Hess joined Hamilton Sundstrand in 1979 and
has held various senior executive positions at Hamilton Sundstrand since 1995. Various
business units’ leaderships have an average tenure in the company of at least 25 years
either within the company or within the parent company, United Technologies
Corporation.
- 122 -
Purchasing
Today, the typical HS plant sources MRO supplies from as many as 500 traditional
distributors. This has the potential to generate excess or duplicate inventories throughout
the supply chain and thousands of purchase orders and invoices. It also increases the
likelihood of ill-managed storerooms, and the chance of stock oversight. Additionally, a
substantial portion of a plant's MRO supplies are often "non-stock" purchases, resulting in
high cost and time-consuming efforts by plant personnel to source the item and validate
that it meets proper specification. Such procurement inefficiencies cause plant
productivity and working capital to suffer. HS Supply Chain Management is a proven
business strategy that has gained wide acceptance in recent years due to increasing
customer demands for quality, delivery, and speed. Increased speeds of communicating
coupled with cost reduction and more interdependent supplier, provider, and customer
relationships have accelerated the integration of supply chains on a company wide basis.
Weakness
Hamilton Sundstrand is not without its challenges. The global presence in both
manufacturing and MRO facilities may result in over capacity in sudden industry
downturn. Duplication of capabilities could also result in dis-economy of scale for
production and create inefficiency. A lean customer service organization that have such a
dispersed work force and diverse cultural background around the world would presents
challenges on the communications front.
- 123 -
To improve HS ability to better compete in the global marketplace, HS need to initiate
actions to review and eliminate excess capacity, consolidate core work to the lower cost
HS plants, and outsource non-core products and services from other companies able to
supply them at the lowest cost with the quality HS require. HS should also focus on
continuous improvement programs to maintain its operation excellence. HS have a good
future but only if it transforms its operations to be more efficient, more cost-effective and
faster in responding to the customers’ needs. Airline industry is going through major
changes with LCC competition and high oil prices, and HS has to be flexible to quickly
respond to those changes so that HS can continue to provide value to the customers.
Opportunity
Emerging Asian markets
Emerging Asian markets including the Indian and Chinese aviation markets are amongst
the fastest growing markets in the world for new aircrafts. Strong economic growth,
favorable and diverse demographics along with the proliferation of low cost carrier in the
Asian regions makes them highly attractive markets for HS as these factors drive growth
in revenue passenger miles (RPM). In fact, the Chinese and the Indian markets have been
identified as one the most promising air travel market in the chapter on Market Potential
for Asian LCC, which will lead to higher sales for new aircrafts and MRO services.
Growth of Low Cost Carriers
In the chapters on the Asia Pacific Airlines Fleet Analysis, the network airlines is
projected to grow at 5.5% with the LCC projecting to grow four times faster at 20.5%.
- 124 -
With the LCC shifting to narrow-body aircraft type such as the B737 and A320, this
would benefit HS on both commercial aircraft production as well as aftermarket service
and spares revenue levels. Additionally, the A320 market share is estimated to grow from
today’s 20% to 49% in 2009. This would spell higher revenue growth for HS as it has
almost twice the system content on the A320 vs. the B737 as shown in exhibit 42. Further
increases in passenger revenue per miles and continued positive global economic
conditions are expected to result in increased commercial aerospace volume in 2006.
Threat
Airline Poor Financial Health
The commercial airline industry continues to experience poor financial performance,
which was exacerbated in 2005 by escalating fuel prices. As such, airlines and aircraft
manufacturers will continue to pursue lower-cost packages from their suppliers such as
HS. For the foreseeable future, airlines will demand lower-cost but high-quality MRO
services as well as faster turnaround time. A change in corporate culture and maintenance
processes should be a mandatory first step for any MRO organization that wants to
remain competitive in an ever-evolving business.
Intense Competition
As mentioned in the earlier review of the MRO industry, the slower growth rate in mature
market such as North America & Europe will drive more experienced foreign MROs to
seek greener pasture in Asia Pacific. With more foreign MROs competing with the
- 125 -
regional MRO organizations for the same slice of the market. The decreased
concentration of MRO market players will further increase the industry rivalry within the
Asia Pacific region. HS regional MRO facilities will face intense competition from these
foreign MRO providers. Some of the firms such as Lufthansa Technik and SR Technics
become a threat by their sheer size and their ability to provide a host of other services.
Conclusions and Recommendations
Conclusions from the findings
From the analysis of the modified Porter’s five forces framework, we have observed the
MRO Industry is extremely competitive. The "service" is almost a commodity and there
are very strong competitors in the arena. Given the harsh business conditions that the low
cost carriers are facing, they are price takers. The lower yield face by all airlines as shown
in exhibit 1 and persistence high oil prices means the only way to increase the profits is
slashing down their cost. The MRO expenses (averaging 13% of overall airline cost)
compose a high percentage of the airline costs as shown in Exhibit 3B, therefore
achieving lower maintenance costs is a competitive advantage for the airline sector.
The analysis also throws some light on what LCC wants in their MRO service provider.
Safety is key consideration as they need to satisfy the regulatory requirement before they
are given the air operation certificate by the civil aviation authority. MRO service
provider whose IT systems provide flexible solutions to help plan, manage and track
maintenance as well as to keep up with the latest regulatory changes is welcome by LCC.
Not only are airlines interested in MROs with IT systems that can track day-to-day
- 126 -
maintenance, but airlines also want to make sure that MROs' IT systems are capable of
integrating with theirs. LCC is very focus on reducing their cost but not at the expense of
aircraft reliability. LCC simplified routes structure, primarily point-to-point transit instead
of transfers at hubs to allow highest utilization of planes imply that MRO service that
guarantee aircraft availability by maintaining the aircraft systems to the highest quality
and reliability is seek by the LCC. Another facet of LCCs continuous drive towards a
lower cost base is their weaken loyalty to any MRO service provider. Therefore it is
important for MRO to increase the exit barrier in their service package or entice the LCCs
to commit to a long term service agreements.
What are the key success factors for Hamilton Sundstrand to compete in this
environment? From the framework proposed by Grant (2002) as shown in exhibit 38, HS
engineering expertise and capabilities in integrating their whole supply chain to bring
added value to their customers has put them in a strong position and a source of their
competitive advantage. Additionally, the growing engineering expertise in aircrafts
system integration has allow HS to get into more and more contents on major aircraft
programs as shown in Exhibit 42. The A320 market share is estimated to grow from
today’s 20% to 49% in 2009. The significant content HS has on the narrow body aircraft
such as the A320 will allow it to continue to grow their after market business volume.
The key is to lock in these customers for the long term to raise the market entry barrier for
other potential competitors. With their global presence and closer proximity to the
customers and technical know-how, this will be critical differentiating factors that HS has
over the competition.
- 127 -
Recommendations for Hamilton Sundstrand
From strategic assessment of the company resources, it has provided answers to two key
questions. What opportunities exist for economizing on the use of finance, inventories
and fixed assets? What are the possibilities for employing existing assets more profitably?
This will be answer in following section.
Exploit the Internet
As we progress into the future, the ways in which we conduct our daily tasks will
continue to grow and improve, all thanks to science and technology. The improvements
of tomorrow will be miles ahead of those made yesterday. One area where we can see this
constant betterment is on the Internet. The capabilities of the Internet have expanded
immensely, making e-commerce an increasingly valuable tool. In the world of MRO, e-
commerce coupled with integrated supply has the ability to redefine the MRO supply
chain. Today, the typical HS plant sources MRO supplies from as many as 500 traditional
distributors. This has the potential to generate excess or duplicate inventories throughout
the supply chain and thousands of purchase orders and invoices. It also increases the
likelihood of ill-managed storerooms, and the chance of stock oversight. Additionally, a
substantial portion of a plant's MRO supplies are often "non-stock" purchases, resulting in
high cost and time-consuming efforts by plant personnel to source the item and validate
that it meets proper specification. Such procurement inefficiencies cause plant
productivity and working capital to suffer. When combined, integrated supply and e-
commerce have the capabilities to reverse these weaknesses. HS should enhance this area
to better manage its asset and provide visibility to the both suppliers and customers that
- 128 -
uses HS repair services and purchase parts to support their airline operations. This should
not limit to just manufacturing activities but the whole supply chain.
Continuous Improvement
To improve HS ability to better compete in the global marketplace, HS need to initiate
actions to review and eliminate excess manufacturing capacity, consolidate core work to
the lower cost HS plants, and outsource non-core products and services from other
companies able to supply them at the lowest cost with the quality HS require. Since
substitute competition can come from many directions such as alternative resources,
technological innovations, new business models etc. It is difficult to counter such threat.
The key is to persuade potential competitors that substitution is unlikely to be profitable.
According to Grant (2002), this can be achieved through committing the company to
continuous improvement. Therefore, HS should focus on continuous improvement
programs to maintain its operation excellence. HS have a good future but only if it
transforms its operations to be more efficient, more cost-effective and faster in
responding to the customers’ needs.
Long Term Programs
Every industry needs to reinvent from the customer backwards as Kirkpatrick and Hamel
(2004) argued. HS need to bring more innovation to the demand chain as they brought to
the supply chain. How do LCC learn about this product or service? How do LCC pay for
it? Acquire it? Use it? Experience it? And how do LCC build a relationship over time
with the vendor? To lock in customer for the long term need an overall marketing strategy
to bring exceptional value to the customer. This can be achieves through the many
innovative programs that HS is currently marketing. CARE, which stands for
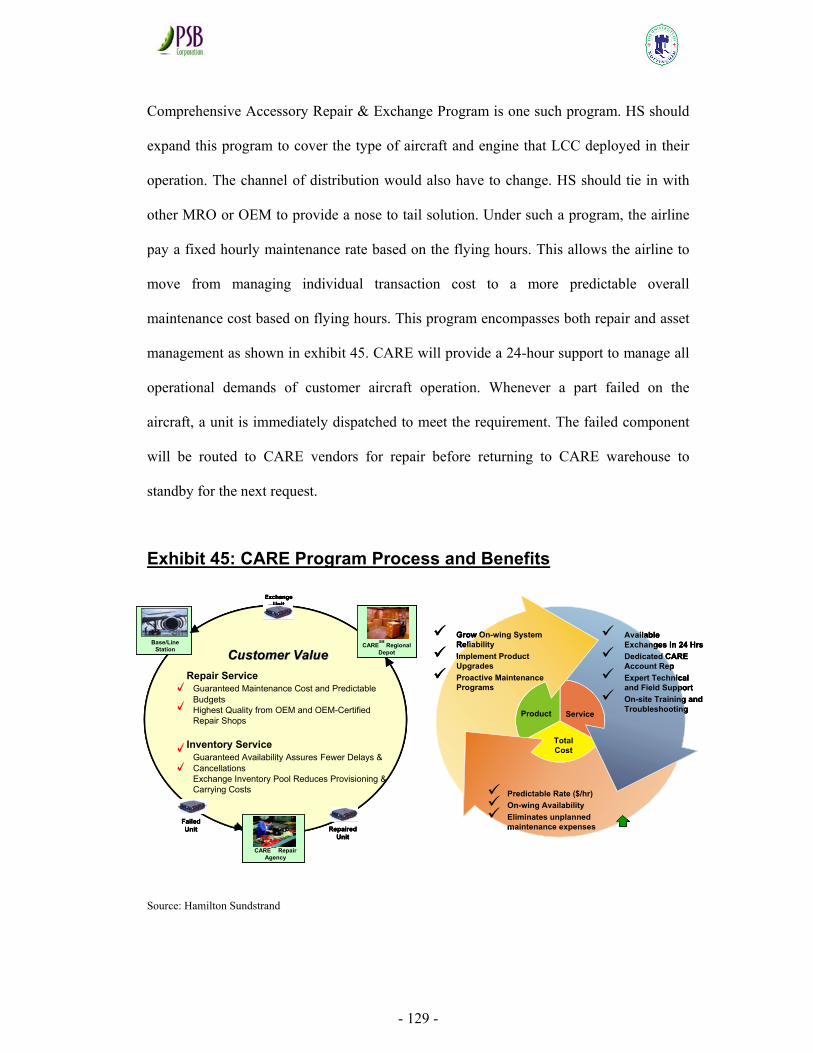
- 129 -
Comprehensive Accessory Repair & Exchange Program is one such program. HS should
expand this program to cover the type of aircraft and engine that LCC deployed in their
operation. The channel of distribution would also have to change. HS should tie in with
other MRO or OEM to provide a nose to tail solution. Under such a program, the airline
pay a fixed hourly maintenance rate based on the flying hours. This allows the airline to
move from managing individual transaction cost to a more predictable overall
maintenance cost based on flying hours. This program encompasses both repair and asset
management as shown in exhibit 45. CARE will provide a 24-hour support to manage all
operational demands of customer aircraft operation. Whenever a part failed on the
aircraft, a unit is immediately dispatched to meet the requirement. The failed component
will be routed to CARE vendors for repair before returning to CARE warehouse to
standby for the next request.
Exhibit 45: CARE Program Process and Benefits
Source: Hamilton Sundstrand
FailedUnit Repaired
Unit
ExchangeUnit
Base/LineStation CARE
SMRegional
Depot
CARESM
RepairAgency
Customer ValueCustomer ValueRepair Service
Guaranteed Maintenance Cost and Predictable BudgetsHighest Quality from OEM and OEM-Certified Repair Shops
Inventory ServiceGuaranteed Availability Assures Fewer Delays & CancellationsExchange Inventory Pool Reduces Provisioning & Carrying Costs Predictable Rate ($/hr)
On-wing AvailabilityEliminates unplanned maintenance expenses
Grow On-wing System ReliabilityImplement Product UpgradesProactive Maintenance Programs
Product Service
Total Cost
Available Exchanges in 24 HrsDedicated CARE Account RepExpert Technical and Field SupportOn-site Training and Troubleshooting
FailedUnit Repaired
Unit
ExchangeUnit
Base/LineStation CARE
SMRegional
Depot
CARESM
RepairAgency
Customer ValueCustomer ValueRepair Service
Guaranteed Maintenance Cost and Predictable BudgetsHighest Quality from OEM and OEM-Certified Repair Shops
Inventory ServiceGuaranteed Availability Assures Fewer Delays & CancellationsExchange Inventory Pool Reduces Provisioning & Carrying Costs
FailedUnit Repaired
Unit
ExchangeUnit
ExchangeUnit
Base/LineStation
Base/LineStation CARE
SMRegional
DepotCARE
SMRegional
Depot
CARESM
RepairAgency
CARESM
RepairAgency
Customer ValueCustomer ValueRepair Service
Guaranteed Maintenance Cost and Predictable BudgetsHighest Quality from OEM and OEM-Certified Repair Shops
Inventory ServiceGuaranteed Availability Assures Fewer Delays & CancellationsExchange Inventory Pool Reduces Provisioning & Carrying Costs Predictable Rate ($/hr)
On-wing AvailabilityEliminates unplanned maintenance expenses
Grow On-wing System ReliabilityImplement Product UpgradesProactive Maintenance Programs
Product Service
Total Cost
Available Exchanges in 24 HrsDedicated CARE Account RepExpert Technical and Field SupportOn-site Training and Troubleshooting
Predictable Rate ($/hr)On-wing AvailabilityEliminates unplanned maintenance expenses
Grow On-wing System ReliabilityImplement Product UpgradesProactive Maintenance Programs
Product Service
Total Cost
Available Exchanges in 24 HrsDedicated CARE Account RepExpert Technical and Field SupportOn-site Training and Troubleshooting
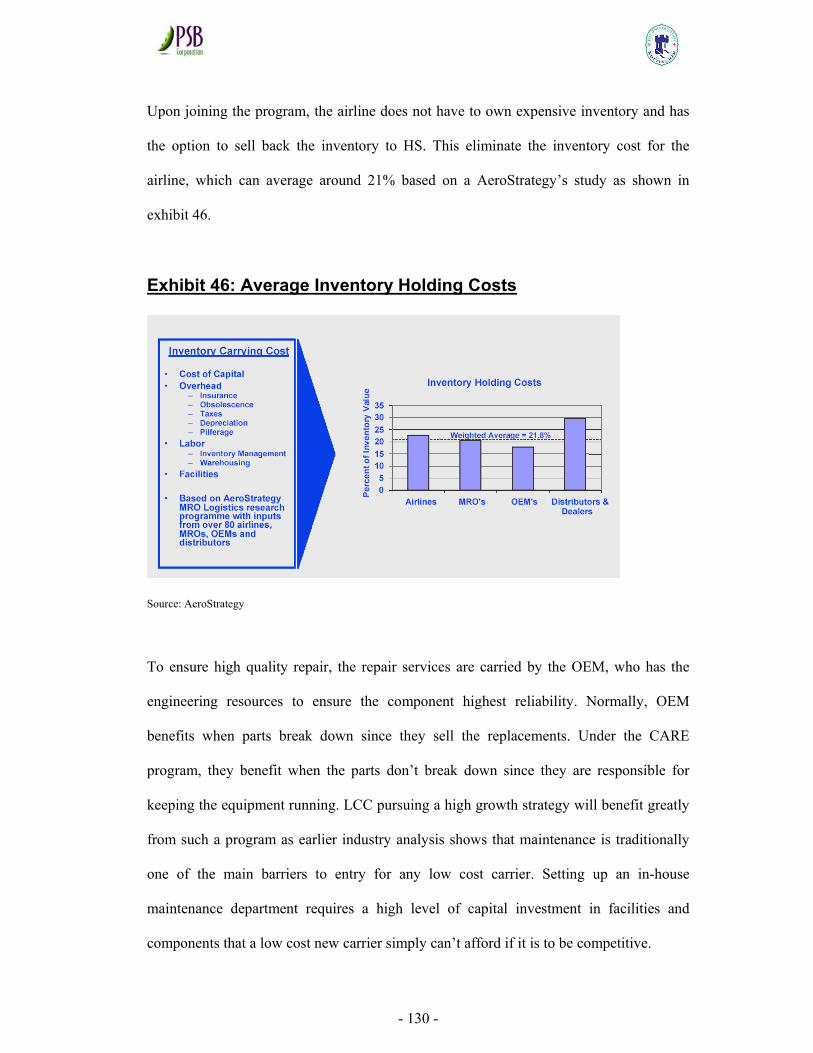
- 130 -
Upon joining the program, the airline does not have to own expensive inventory and has
the option to sell back the inventory to HS. This eliminate the inventory cost for the
airline, which can average around 21% based on a AeroStrategy’s study as shown in
exhibit 46.
Exhibit 46: Average Inventory Holding Costs
Source: AeroStrategy
To ensure high quality repair, the repair services are carried by the OEM, who has the
engineering resources to ensure the component highest reliability. Normally, OEM
benefits when parts break down since they sell the replacements. Under the CARE
program, they benefit when the parts don’t break down since they are responsible for
keeping the equipment running. LCC pursuing a high growth strategy will benefit greatly
from such a program as earlier industry analysis shows that maintenance is traditionally
one of the main barriers to entry for any low cost carrier. Setting up an in-house
maintenance department requires a high level of capital investment in facilities and
components that a low cost new carrier simply can’t afford if it is to be competitive.
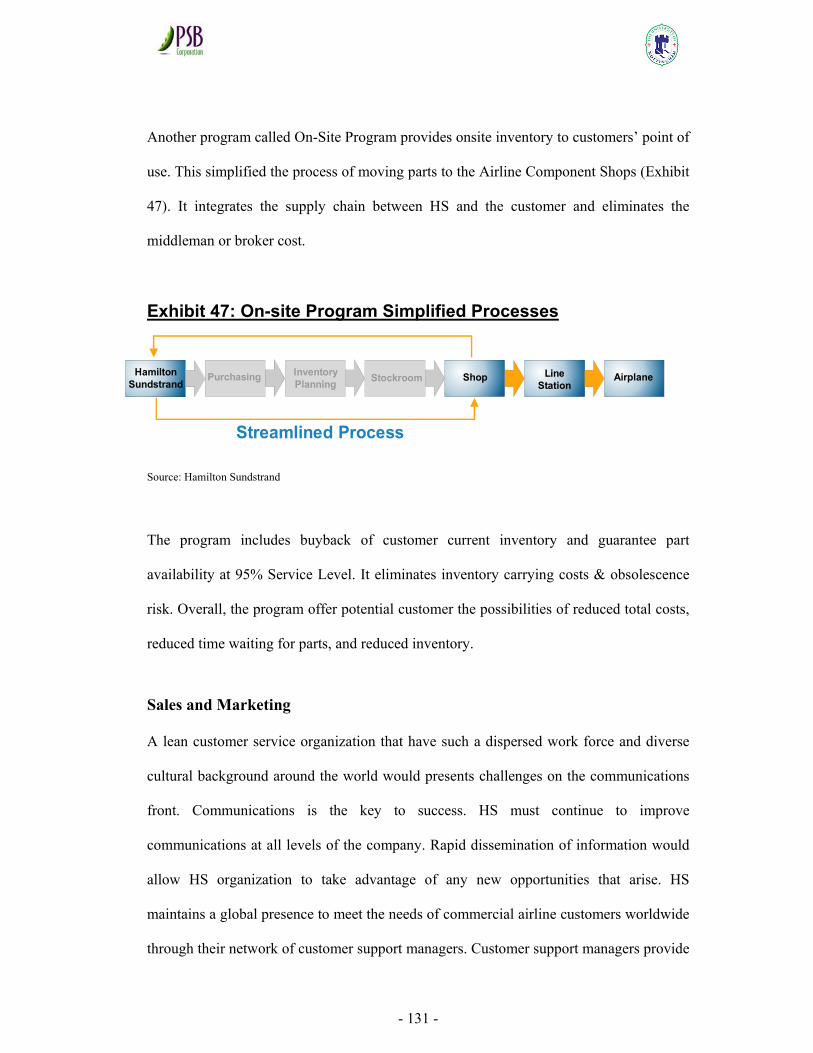
- 131 -
Another program called On-Site Program provides onsite inventory to customers’ point of
use. This simplified the process of moving parts to the Airline Component Shops (Exhibit
47). It integrates the supply chain between HS and the customer and eliminates the
middleman or broker cost.
Exhibit 47: On-site Program Simplified Processes
Source: Hamilton Sundstrand
The program includes buyback of customer current inventory and guarantee part
availability at 95% Service Level. It eliminates inventory carrying costs & obsolescence
risk. Overall, the program offer potential customer the possibilities of reduced total costs,
reduced time waiting for parts, and reduced inventory.
Sales and Marketing
A lean customer service organization that have such a dispersed work force and diverse
cultural background around the world would presents challenges on the communications
front. Communications is the key to success. HS must continue to improve
communications at all levels of the company. Rapid dissemination of information would
allow HS organization to take advantage of any new opportunities that arise. HS
maintains a global presence to meet the needs of commercial airline customers worldwide
through their network of customer support managers. Customer support managers provide
Hamilton Sundstrand
Purchasing Inventory Planning Stockroom Shop Line
StationAirplane
Streamlined Process
- 132 -
customers a single point of contact for all their support needs and avoid duplicate calls
from various parts of the HS organization. This allows HS to increase its focus on
managing accounts for the top airlines worldwide and increase its sensitivity to the
market. HS need to continue to provide their employees with the information and tools to
understand and meet their customers’ needs and desires, today and in the future.
Pursuing a Differentiation Strategy
Hamilton Sundstrand should pursue a differentiation strategy for its unique selling
proposition of OEM quality at a guarantee cost. The tangible differentiation is concerned
with observable characteristic of the service such as proximity of MRO operation to
customer base of operation, and local focus with one interface between HS and the
customer via the customer support manager. HS technical know-how to repair its product
line and engineering expertise to continuously improve the reliability of the parts at no
cost to customer is another tangible differentiation. Since customer pay a fixed rate per
flying hour on the CARE program, the OEM now has more motivations to improve the
product reliability as its revenue becomes fixed. Any product reliability issues will
ultimately impact the service provider bottom line. Differentiation is also concerned with
the provision of uniqueness. As Grant (2002) mentioned, a firm’s opportunities for
creating uniqueness in its offering to customers are not located within a particular
function or activity but can arise in virtually everything it does. Michael Porter identifies
a number of drivers of uniqueness over which the firm exercises control. These are:
• Product features and product performance (HS technical expertise and OEM
services).
• Complementary services (HS fast delivery and product improvement)
• Intensity of marketing activities (e.g. thru HS customer support focus approach)
- 133 -
• Technologies embodied in design and manufacture which only the OEM or HS has
prior information.
• The quality of the purchase input.
• Procedures influencing the conduct of each activities (e.g. quality control, onsite
support etc)
• Skill and experience of employees.
• Location (proximity to customer operation)
• The degree of vertical integration (HS integrated supply chain).
Themes for Further Studies
This market study is limited to the study of low cost carrier, the impact of this business
model to the Asia Pacific airline industry and the MRO industry. Additionally, we
examine OEM such as Hamilton Sundstrand and determine how it can take advantage of
the LCC explosive growth in the changing competitive landscape. In future studies, there
is potential to explore further from the perspective of the incumbent network airlines how
they would respond to the LCC challenge. Another area of study is for Hamilton
Sundstrand to determine what MRO services would incumbent expect from the OEM.
Would they follow the Lufthansa German Airlines strategy of backward integration or
goes down another strategic path? Finally, the other area that could be studied is how
Hamilton Sundstrand can change its organization structure in order to be better organized
for continued success of its after market support to meet the changing needs of its
customers.
- 134 -
References
1. Aeronautical Repair Station Association (ARSA) 2006, ‘Maintenance Market
Projections Bullish’, the hotline, Virginia, May, [Online]. Available at URL:
http://www.arsa.org/node/292 [Accessed 27 Jun 2006].
2. Air Transport Association 2005, US airline cost index, major & national passenger
carriers- fourth quarter 2005, [Online]. Available at URL:
http://www.airlines.org/econ/d.aspx?nid=1042 [Accessed 27 April 2006].
3. Airbus 2006, ‘Airbus MRO Network welcomes Hong Kong Aircraft Engineering
Company Ltd (HAECO) as latest member’, Airbus Press Centre, 23 February,
[Online]. Available at URL:
http://www.airbus.com/en/presscentre/pressreleases/pressreleases_items/06_02_23_
mro_hong_kong.html [Accessed on 20 March 2006].
4. ASEAN 2004, ASEAN Framework Agreement for the Integration of Priority Sectors
Vientiane, 29th November 2004, [Online]. Available at URL:
http://www.aseansec.org/16659.htm [Accessed on 5 July 2006].
5. ASEAN 2004, ASEAN Transport Action Plan 2005-2010, [Online]. Available at
URL: http://www.aseansec.org/16596.htm [Accessed on 5 July 2006].
6. Borenstein, Severin and Rose, Nancy L. 1994, “Competition and Price Dispersion in
the U.S. Airline Industry”, Journal of Political Economy, vol. 102, no. 4 (August):
653-683.
7. Borenstein, Severin. 1989, “Hubs and High Fares: Dominance and Market Power in
the U.S. Airline Industry”, The RAND Journal of Economics, vol. 20, issue 3: 415-
436.
8. Borenstein, Severin. 1990, “Airline Mergers, Airport Dominance, and Market
- 135 -
Power”, American Economic Review, vol. 80, no. 2 (May): 400-404.
9. Borenstein, Severin. 1992, “The Evolution of U.S. Airline Competition”, Journal of
Economic Perspectives, vol. 6, no. 2: 45-73.
10. Broderick, S. 2005, ‘Few Regulatory Burdens for PMAs’, Overhaul & Maintenance,
October, [Online]. Available at URL:
http://www.aviationnow.com/avnow/news/channel_om_story.jsp?id=news/om1005p
ma.xml [Accessed on 22 March, 2006]
11. Grant, R.M. 2002, Contemporary strategy analysis: concepts, techniques,
applications, 4th ed., Blackwell Publishers, Oxford.
12. Hamel, g. 2000, Leading the revolution, Harvard Business School Press, Boston.
13. Hecker, JayEtta Z 2006, “Airline Deregulation: Reregulating the Airline Industry
Would Likely Reverse Consumer Benefits and Not Save Airline Pensions: GAO-06-
630”, GAO Reports, p1-49p.
14. InterVISTAS-ga2 Consulting 2006, The economic impact of air service
liberalization, Washington, Jun [Online]. Available at URL:
http://www.intervistas.com/ivcga2.asp [Accessed 25 June 2006].
15. Jackman, F. 2001, ‘Aftermarket Networks Shaping MRO Industry’, Overhaul &
Maintenance, New York, Vol. 154, no. 3, pp. 67-70.
16. Jackman, F. 2004, ‘Finally! MRO market value on the upswing’, Overhaul &
Maintenance, April [Online]. Available at URL:
http://www.aviationnow.com/avnow/news/channel_om_story.jsp?view=story&id=n
ews/omfor404.xml [Accessed 5 July, 2005]
17. JetBlue Airways 2005, Investor Relationship, [Online]. Available at URL: d
[Accessed 26 January 26 2003].
- 136 -
18. Kirkpatrick, D. and Hamel, G. 2004, Innovation do’s & don’t, Fortune, February,
Vol. 150 Issue 5, p239-240.
19. Lewis, G., Morkel, A., Hubbard, G., Davenport, S., Stockport, G. 1999, Australian
and New Zealand strategic management concepts, context and cases, 2nd edn,
Prentice Hall, Sydney, pp. 16-34, 104`-116, 161-173.
20. Lott, S. 2006, ‘Aircraft age is key to lowering maintenance costs’, Aviation Week &
Space Technology, vol. 165, no. 9, pp. 39.
21. Moorman, R.W. 2006, ‘Engine MRO suppliers use Lean and Six Sigma to deliver
engines back to airlines faster and for less money’, Air Transport World, January,
pp. 64.
22. Smyth, M., Pearce, B. 2006, ‘Airline cost performance’, IATA Economic Briefing,
no. 5, pp. 30-41.
23. Southwest Airlines 2001, 2001 Annual Report, [Online]. Available at URL:
http://www.southwest.com/investor_relations/annual_reports.html [Accessed 26
January 26 2006].
24. Southwest Airlines, We Weren’t Just Airborne Yesterday, [Online]. Available at
URL http://www.iflyswa.com/about_swa/airborne.html [Accessed 27 April 27
2006].
25. US Census Bureau 2004, Global Population Profile: 2002, US Census Bureau
Population Division, Washington, March [Online]. Available at URL:
http://www.census.gov/ipc/www/wp02.html [Accessed 28 February 2006].
26. UTC 2005, UTC 2005 annual report, United Technologies Corporation, [Online]
Available at URL: http://www.utc.com/annual_reports/2005/ [Accessed 27 March
2006]
27. Whinston, Michael D. and Collins, Scott C. 1992, “Entry and Competitive Structure
- 137 -
in Deregulated Airline Markets: An Event Study Analysis of People Express”, The
RAND Journal of Economics, vol. 23, no. 4: 445-462.
28. Wikipedia encyclopedia, Low-cost carrier, [Online]. Available at URL:
http://en.wikipedia.org/wiki/Low-cost_carrier [Accessed 25 January 2006].
29. Xin, Dingding 2006, “Congestion in the skies to be eased”, China Daily, 22 August
[Online]. Available at URL: http://www.chinadaily.com.cn/bizchina/2006-
08/22/content_670456.htm [Accessed on 23 August, 2005].
30. Yahoo Singapore News, “Singapore and Malaysia welcome opening up of two-way
air routes”, Channel NewsAsia, 4 September [Online]. Available at URL:
http://sg.news.yahoo.com/060904/5/singapore228500.html [Accessed 4 September,
2006].

- 138 -
Appendices
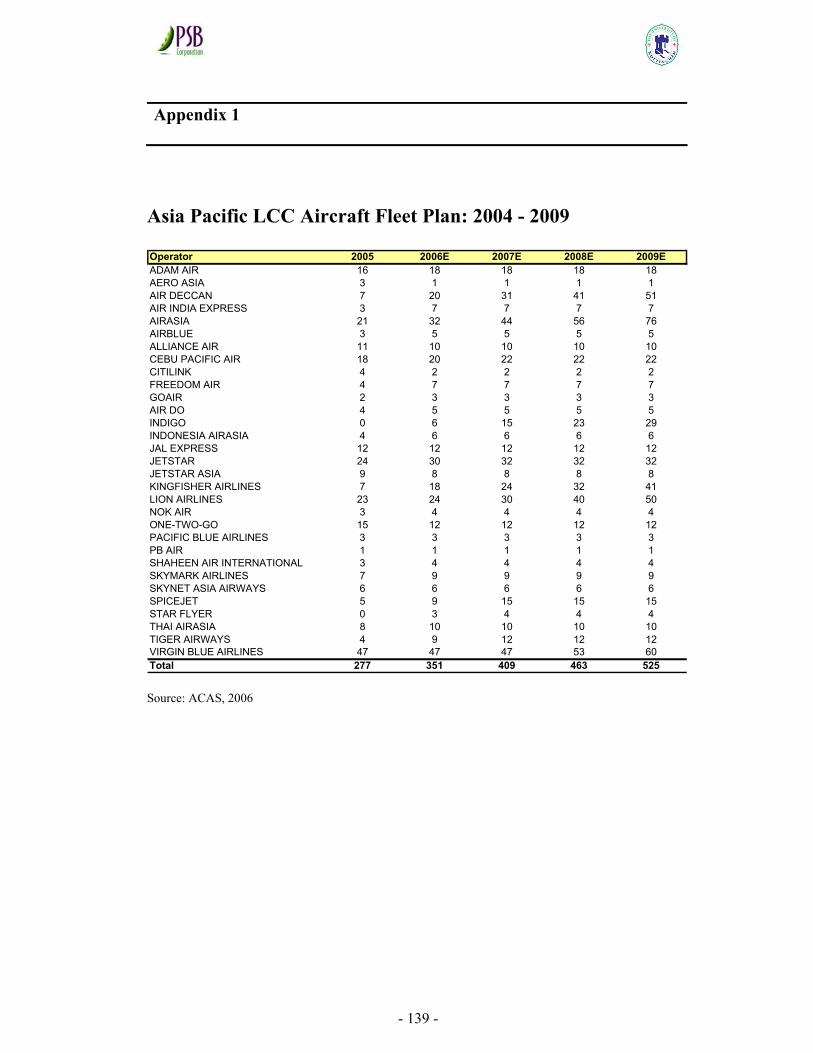
- 139 -
Appendix 1
Asia Pacific LCC Aircraft Fleet Plan: 2004 - 2009
Operator 2005 2006E 2007E 2008E 2009EADAM AIR 16 18 18 18 18AERO ASIA 3 1 1 1 1AIR DECCAN 7 20 31 41 51AIR INDIA EXPRESS 3 7 7 7 7AIRASIA 21 32 44 56 76AIRBLUE 3 5 5 5 5ALLIANCE AIR 11 10 10 10 10CEBU PACIFIC AIR 18 20 22 22 22CITILINK 4 2 2 2 2FREEDOM AIR 4 7 7 7 7GOAIR 2 3 3 3 3AIR DO 4 5 5 5 5INDIGO 0 6 15 23 29INDONESIA AIRASIA 4 6 6 6 6JAL EXPRESS 12 12 12 12 12JETSTAR 24 30 32 32 32JETSTAR ASIA 9 8 8 8 8KINGFISHER AIRLINES 7 18 24 32 41LION AIRLINES 23 24 30 40 50NOK AIR 3 4 4 4 4ONE-TWO-GO 15 12 12 12 12PACIFIC BLUE AIRLINES 3 3 3 3 3PB AIR 1 1 1 1 1SHAHEEN AIR INTERNATIONAL 3 4 4 4 4SKYMARK AIRLINES 7 9 9 9 9SKYNET ASIA AIRWAYS 6 6 6 6 6SPICEJET 5 9 15 15 15STAR FLYER 0 3 4 4 4THAI AIRASIA 8 10 10 10 10TIGER AIRWAYS 4 9 12 12 12VIRGIN BLUE AIRLINES 47 47 47 53 60Total 277 351 409 463 525
Source: ACAS, 2006
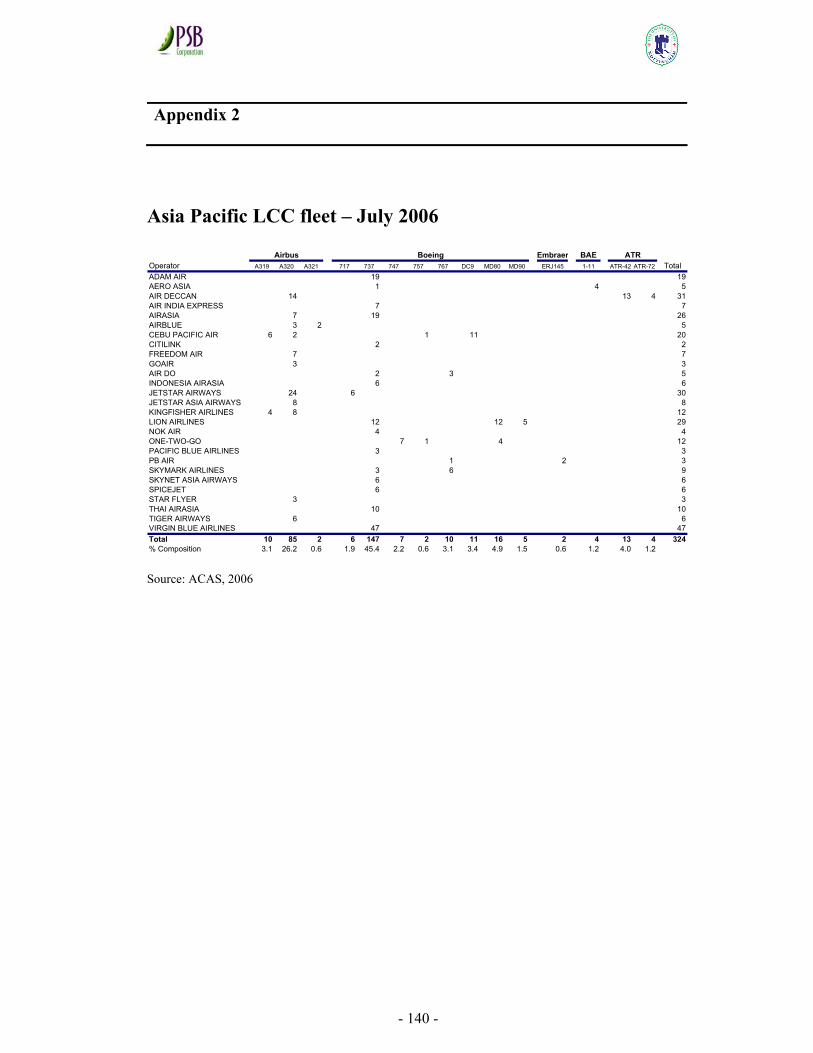
- 140 -
Appendix 2
Asia Pacific LCC fleet – July 2006
Embraer BAEOperator A319 A320 A321 717 737 747 757 767 DC9 MD80 MD90 ERJ145 1-11 ATR-42 ATR-72 TotalADAM AIR 19 19AERO ASIA 1 4 5AIR DECCAN 14 13 4 31AIR INDIA EXPRESS 7 7AIRASIA 7 19 26AIRBLUE 3 2 5CEBU PACIFIC AIR 6 2 1 11 20CITILINK 2 2FREEDOM AIR 7 7GOAIR 3 3AIR DO 2 3 5INDONESIA AIRASIA 6 6JETSTAR AIRWAYS 24 6 30JETSTAR ASIA AIRWAYS 8 8KINGFISHER AIRLINES 4 8 12LION AIRLINES 12 12 5 29NOK AIR 4 4ONE-TWO-GO 7 1 4 12PACIFIC BLUE AIRLINES 3 3PB AIR 1 2 3SKYMARK AIRLINES 3 6 9SKYNET ASIA AIRWAYS 6 6SPICEJET 6 6STAR FLYER 3 3THAI AIRASIA 10 10TIGER AIRWAYS 6 6VIRGIN BLUE AIRLINES 47 47Total 10 85 2 6 147 7 2 10 11 16 5 2 4 13 4 324% Composition 3.1 26.2 0.6 1.9 45.4 2.2 0.6 3.1 3.4 4.9 1.5 0.6 1.2 4.0 1.2
Airbus Boeing ATR
Source: ACAS, 2006
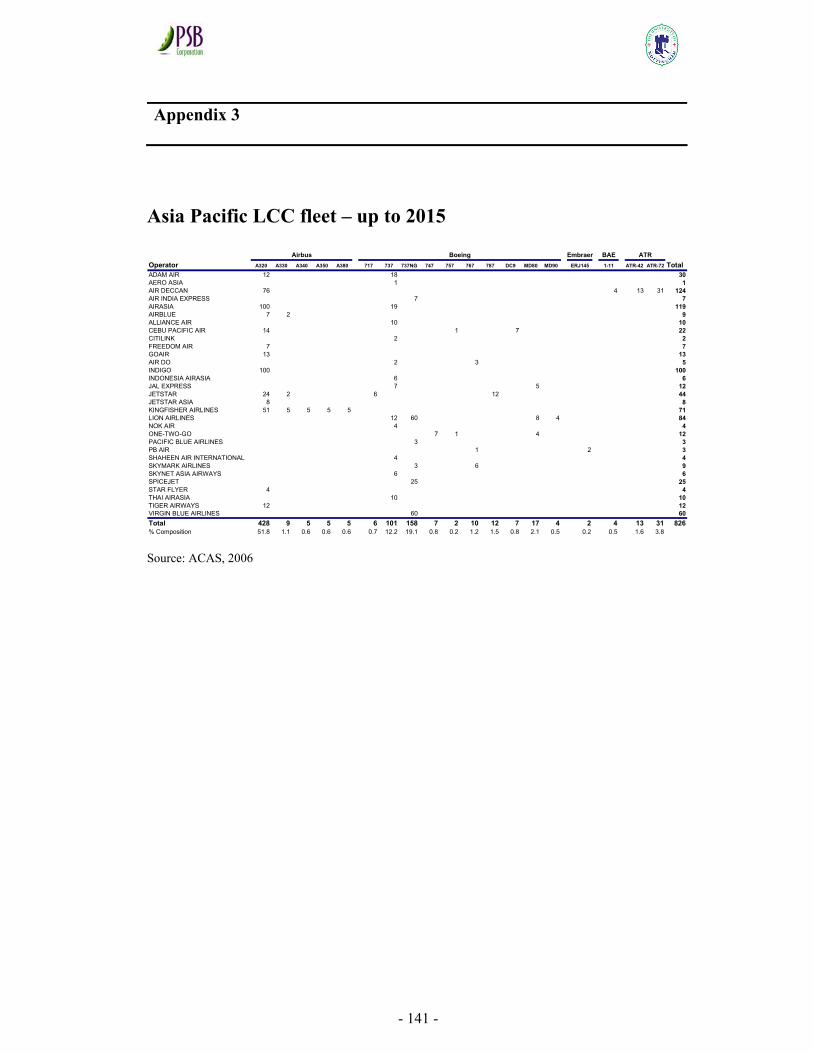
- 141 -
Appendix 3
Asia Pacific LCC fleet – up to 2015
Embraer BAEOperator A320 A330 A340 A350 A380 717 737 737NG 747 757 767 787 DC9 MD80 MD90 ERJ145 1-11 ATR-42 ATR-72 TotalADAM AIR 12 18 30AERO ASIA 1 1AIR DECCAN 76 4 13 31 124AIR INDIA EXPRESS 7 7AIRASIA 100 19 119AIRBLUE 7 2 9ALLIANCE AIR 10 10CEBU PACIFIC AIR 14 1 7 22CITILINK 2 2FREEDOM AIR 7 7GOAIR 13 13AIR DO 2 3 5INDIGO 100 100INDONESIA AIRASIA 6 6JAL EXPRESS 7 5 12JETSTAR 24 2 6 12 44JETSTAR ASIA 8 8KINGFISHER AIRLINES 51 5 5 5 5 71LION AIRLINES 12 60 8 4 84NOK AIR 4 4ONE-TWO-GO 7 1 4 12PACIFIC BLUE AIRLINES 3 3PB AIR 1 2 3SHAHEEN AIR INTERNATIONAL 4 4SKYMARK AIRLINES 3 6 9SKYNET ASIA AIRWAYS 6 6SPICEJET 25 25STAR FLYER 4 4THAI AIRASIA 10 10TIGER AIRWAYS 12 12VIRGIN BLUE AIRLINES 60 60Total 428 9 5 5 5 6 101 158 7 2 10 12 7 17 4 2 4 13 31 826% Composition 51.8 1.1 0.6 0.6 0.6 0.7 12.2 19.1 0.8 0.2 1.2 1.5 0.8 2.1 0.5 0.2 0.5 1.6 3.8
ATRBoeingAirbus
Source: ACAS, 2006
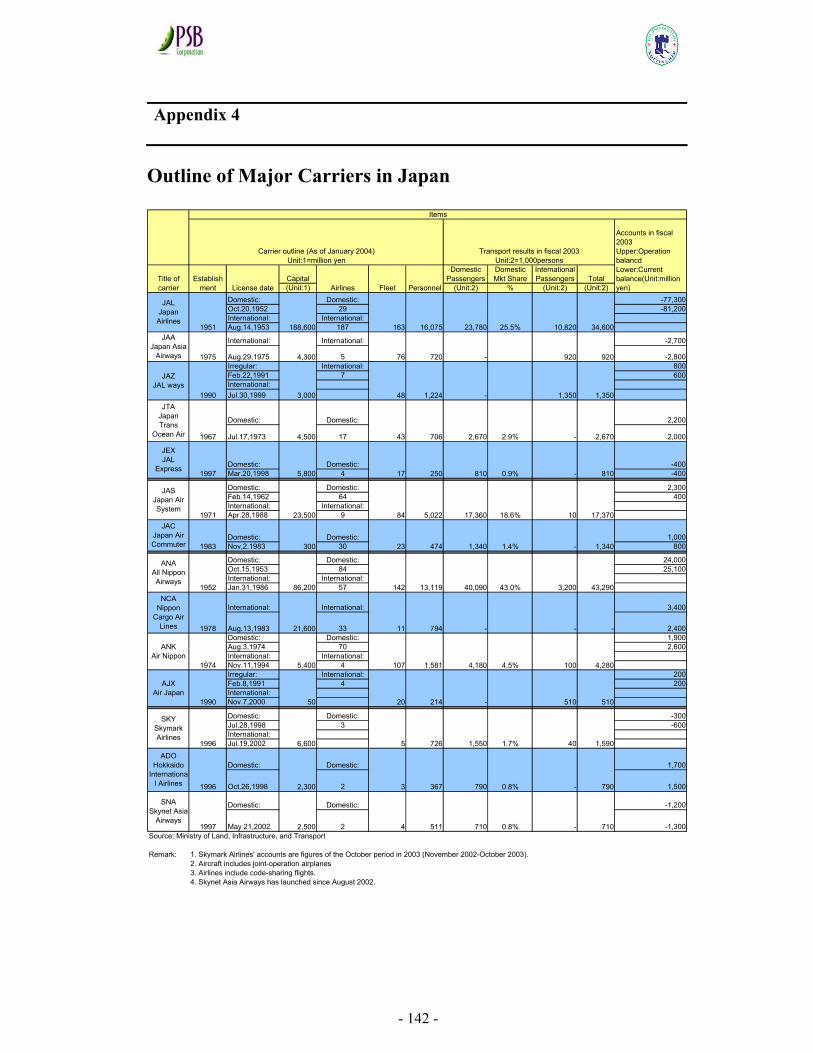
- 142 -
Appendix 4
Outline of Major Carriers in Japan
CapitalDomestic
PassengersDomestic Mkt Share
Intemational Passengers Total
(Unit:1) (Unit:2) % (Unit:2) (Unit:2)Domestic: Domestic: -77,300Oct.20,1952 29 -81,200International: International:Aug.14,1953 187
International: International: -2,700
Aug.29,1975 5 -2,800Irregular: International: 800Feb.22,1991 7 600International:Jul.30,1999
Domestic: Domestic: 2,200
Jul.17,1973 17 2,000
Domestic: Domestic: -400Mar.20,1998 4 -400
Domestic: Domestic: 2,300Feb.14,1962 64 400International: International:Apr.28,1988 9
Domestic: Domestic: 1,000Nov,2.1983 30 800
Domestic: Domestic: 24,000Oct.15,1953 84 25,100International: International:Jan.31,1986 57
International: International: 3,400
Aug.13,1983 33 2,400Domestic: Domestic: 1,900Aug.3,1974 70 2,600International: International:Nov.11,1994 4Irregular: International: 200Feb.8,1991 4 200International:Nov.7,2000
Domestic: Domestic: -300Jul.28,1998 3 -600International:Jul.19,2002
Domestic: Domestic: 1,700
Oct.26,1998 2 1,500
Domestic: Domestic: -1,200
May 21,2002 2 -1,300Source: Ministry of Land, Infrastructure, and Transport
1. Skymark Airlines' accounts are figures of the October period in 2003 (November 2002-October 2003).2. Aircraft includes joint-operation airplanes3. Airlines include code-sharing flights.4. Skynet Asia Airways has launched since August 2002.
0.8%
0.8%
4.5%
1.7%
25.5%
SNASkynet Asia
Airways
Carrier outline (As of January 2004)Unit:1=million yen
Transport results in fiscal 2003Unit:2=1,000persons
2.9%
0.9%
18.6%
1.4%
43.0%
ANKAir Nippon
AJX Air Japan
SKYSkymark Airlines
ADOHokkaido
International Airlines
Remark:
JALJapan Airlines
JAAJapan Asia
Airways
JAZJAL ways
JTAJapan Trans
Ocean Air
JEXJAL
Express
JASJapan Air System
JACJapan Air Commuter
ANAAll Nippon Airways
NCANippon
Cargo Air Lines
790 - 790
1997 2,500 4 511 710 - 710
1996 2,300 3 367
- 510 510
1996 6,600 5 726 1,550 40 1,590
1990 50 20 214
- - -
1974 5,400 107 1,581 4,180 100 4,280
1978 21,600 11 794
1,340 - 1,340
1952 86,200 142 13,119 40,090 3,200 43,290
1983 300 23 474
810 - 810
1971 23,500 84 5,022 17,360 10 17,370
1997 5,800 17 250
- 1,350 1,350
1967 4,500 43 706 2,670 - 2,670
1990 3,000 48 1,224
23,780 10,820 34,600
1975 4,300 76 720 - 920 920
1951 188,600 163 16,075
Items
Title of carrier
Establishment License date Airlines Fleet Personnel
Accounts in fiscal 2003Upper:Operation balancdLower:Current balance(Unit:million yen)
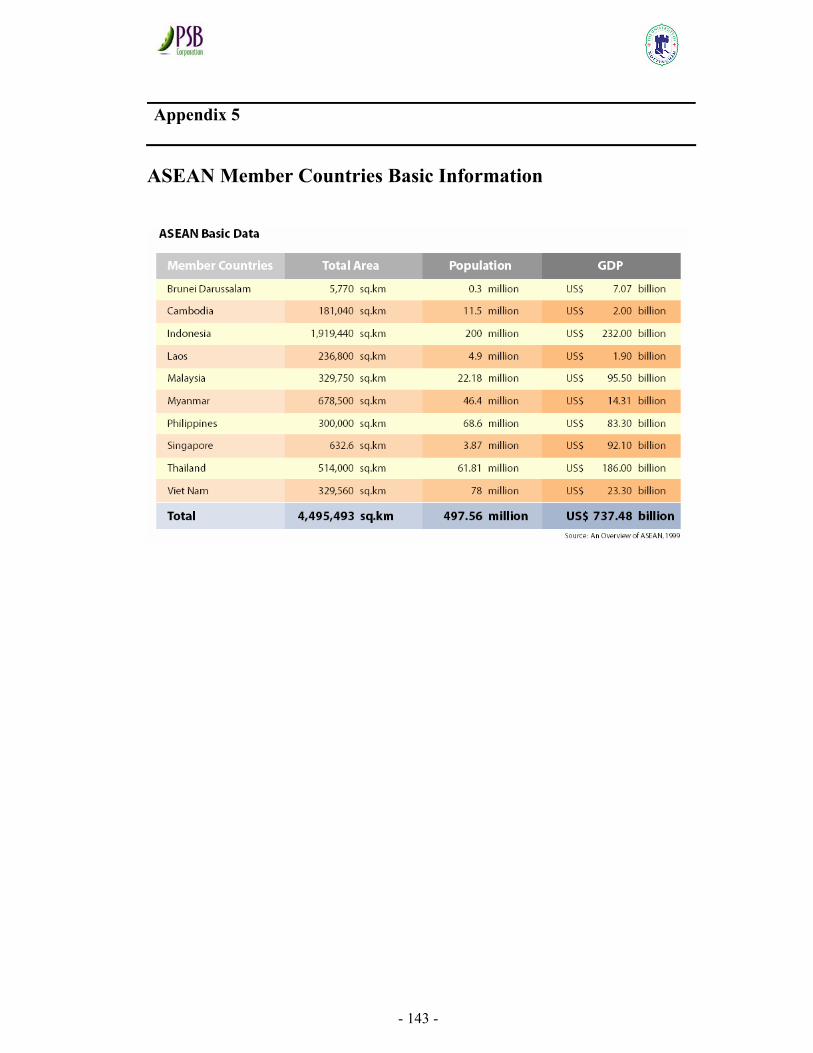
- 143 -
Appendix 5
ASEAN Member Countries Basic Information
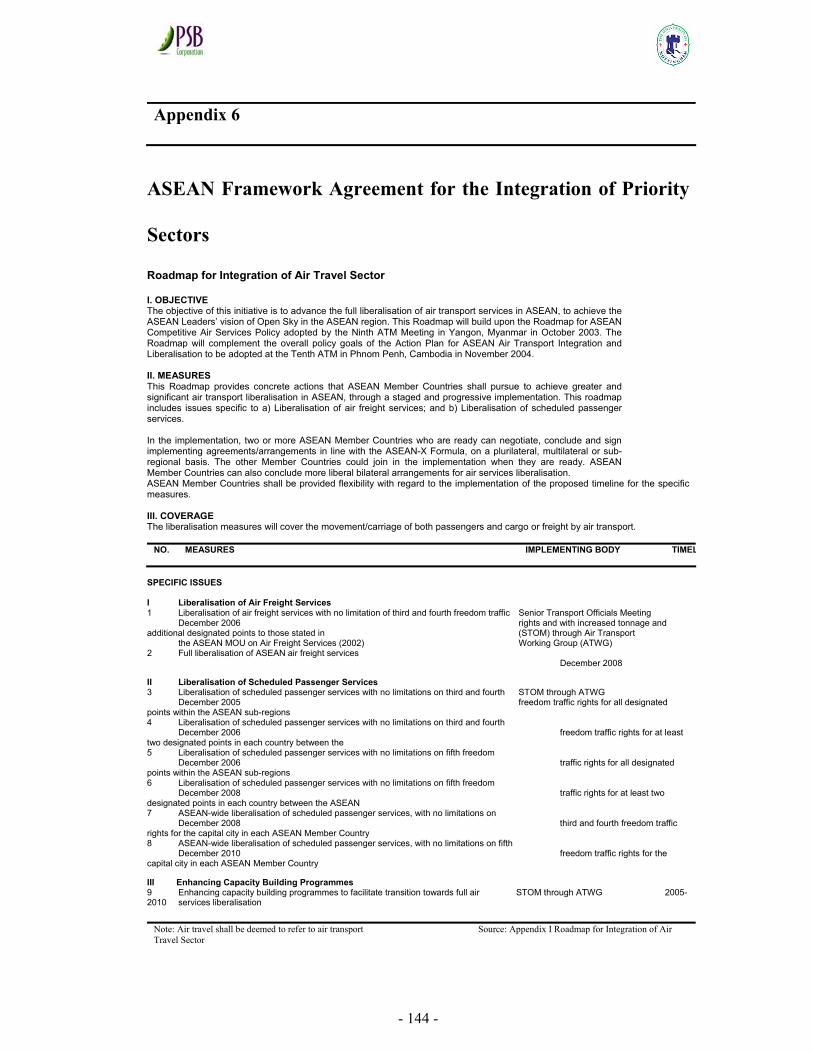
- 144 -
Appendix 6
ASEAN Framework Agreement for the Integration of Priority
Sectors
Roadmap for Integration of Air Travel Sector I. OBJECTIVE The objective of this initiative is to advance the full liberalisation of air transport services in ASEAN, to achieve the ASEAN Leaders’ vision of Open Sky in the ASEAN region. This Roadmap will build upon the Roadmap for ASEAN Competitive Air Services Policy adopted by the Ninth ATM Meeting in Yangon, Myanmar in October 2003. The Roadmap will complement the overall policy goals of the Action Plan for ASEAN Air Transport Integration and Liberalisation to be adopted at the Tenth ATM in Phnom Penh, Cambodia in November 2004. II. MEASURES This Roadmap provides concrete actions that ASEAN Member Countries shall pursue to achieve greater and significant air transport liberalisation in ASEAN, through a staged and progressive implementation. This roadmap includes issues specific to a) Liberalisation of air freight services; and b) Liberalisation of scheduled passenger services. In the implementation, two or more ASEAN Member Countries who are ready can negotiate, conclude and sign implementing agreements/arrangements in line with the ASEAN-X Formula, on a plurilateral, multilateral or sub-regional basis. The other Member Countries could join in the implementation when they are ready. ASEAN Member Countries can also conclude more liberal bilateral arrangements for air services liberalisation. ASEAN Member Countries shall be provided flexibility with regard to the implementation of the proposed timeline for the specific measures. III. COVERAGE The liberalisation measures will cover the movement/carriage of both passengers and cargo or freight by air transport.
NO. MEASURES IMPLEMENTING BODY TIMEL
SPECIFIC ISSUES I Liberalisation of Air Freight Services 1 Liberalisation of air freight services with no limitation of third and fourth freedom traffic Senior Transport Officials Meeting December 2006 rights and with increased tonnage and additional designated points to those stated in (STOM) through Air Transport the ASEAN MOU on Air Freight Services (2002) Working Group (ATWG) 2 Full liberalisation of ASEAN air freight services
December 2008
II Liberalisation of Scheduled Passenger Services 3 Liberalisation of scheduled passenger services with no limitations on third and fourth STOM through ATWG December 2005 freedom traffic rights for all designated points within the ASEAN sub-regions 4 Liberalisation of scheduled passenger services with no limitations on third and fourth December 2006 freedom traffic rights for at least two designated points in each country between the 5 Liberalisation of scheduled passenger services with no limitations on fifth freedom December 2006 traffic rights for all designated points within the ASEAN sub-regions 6 Liberalisation of scheduled passenger services with no limitations on fifth freedom December 2008 traffic rights for at least two designated points in each country between the ASEAN 7 ASEAN-wide liberalisation of scheduled passenger services, with no limitations on December 2008 third and fourth freedom traffic rights for the capital city in each ASEAN Member Country 8 ASEAN-wide liberalisation of scheduled passenger services, with no limitations on fifth December 2010 freedom traffic rights for the capital city in each ASEAN Member Country
III Enhancing Capacity Building Programmes 9 Enhancing capacity building programmes to facilitate transition towards full air STOM through ATWG 2005-2010 services liberalisation
Note: Air travel shall be deemed to refer to air transport Source: Appendix I Roadmap for Integration of Air Travel Sector
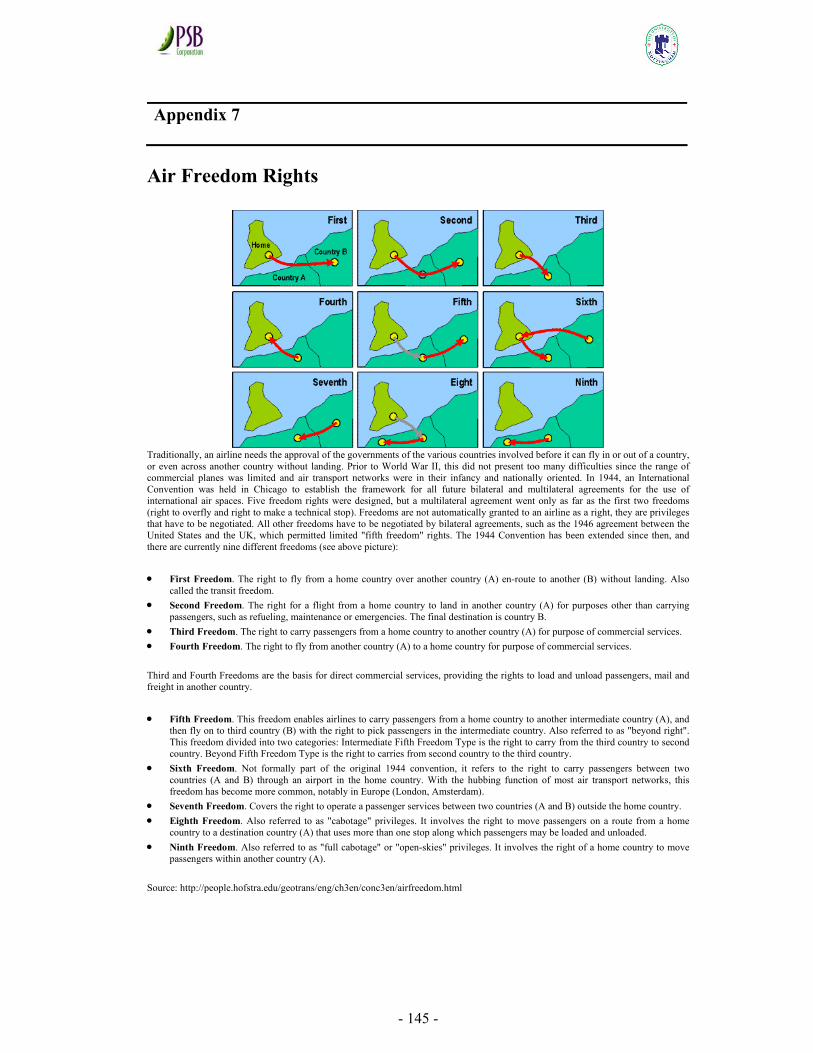
- 145 -
Appendix 7
Air Freedom Rights
Traditionally, an airline needs the approval of the governments of the various countries involved before it can fly in or out of a country, or even across another country without landing. Prior to World War II, this did not present too many difficulties since the range of commercial planes was limited and air transport networks were in their infancy and nationally oriented. In 1944, an International Convention was held in Chicago to establish the framework for all future bilateral and multilateral agreements for the use of international air spaces. Five freedom rights were designed, but a multilateral agreement went only as far as the first two freedoms (right to overfly and right to make a technical stop). Freedoms are not automatically granted to an airline as a right, they are privileges that have to be negotiated. All other freedoms have to be negotiated by bilateral agreements, such as the 1946 agreement between the United States and the UK, which permitted limited "fifth freedom" rights. The 1944 Convention has been extended since then, and there are currently nine different freedoms (see above picture):
• First Freedom. The right to fly from a home country over another country (A) en-route to another (B) without landing. Also called the transit freedom.
• Second Freedom. The right for a flight from a home country to land in another country (A) for purposes other than carrying passengers, such as refueling, maintenance or emergencies. The final destination is country B.
• Third Freedom. The right to carry passengers from a home country to another country (A) for purpose of commercial services. • Fourth Freedom. The right to fly from another country (A) to a home country for purpose of commercial services.
Third and Fourth Freedoms are the basis for direct commercial services, providing the rights to load and unload passengers, mail and freight in another country.
• Fifth Freedom. This freedom enables airlines to carry passengers from a home country to another intermediate country (A), and then fly on to third country (B) with the right to pick passengers in the intermediate country. Also referred to as "beyond right". This freedom divided into two categories: Intermediate Fifth Freedom Type is the right to carry from the third country to second country. Beyond Fifth Freedom Type is the right to carries from second country to the third country.
• Sixth Freedom. Not formally part of the original 1944 convention, it refers to the right to carry passengers between two countries (A and B) through an airport in the home country. With the hubbing function of most air transport networks, this freedom has become more common, notably in Europe (London, Amsterdam).
• Seventh Freedom. Covers the right to operate a passenger services between two countries (A and B) outside the home country. • Eighth Freedom. Also referred to as "cabotage" privileges. It involves the right to move passengers on a route from a home
country to a destination country (A) that uses more than one stop along which passengers may be loaded and unloaded. • Ninth Freedom. Also referred to as "full cabotage" or "open-skies" privileges. It involves the right of a home country to move
passengers within another country (A).
Source: http://people.hofstra.edu/geotrans/eng/ch3en/conc3en/airfreedom.html
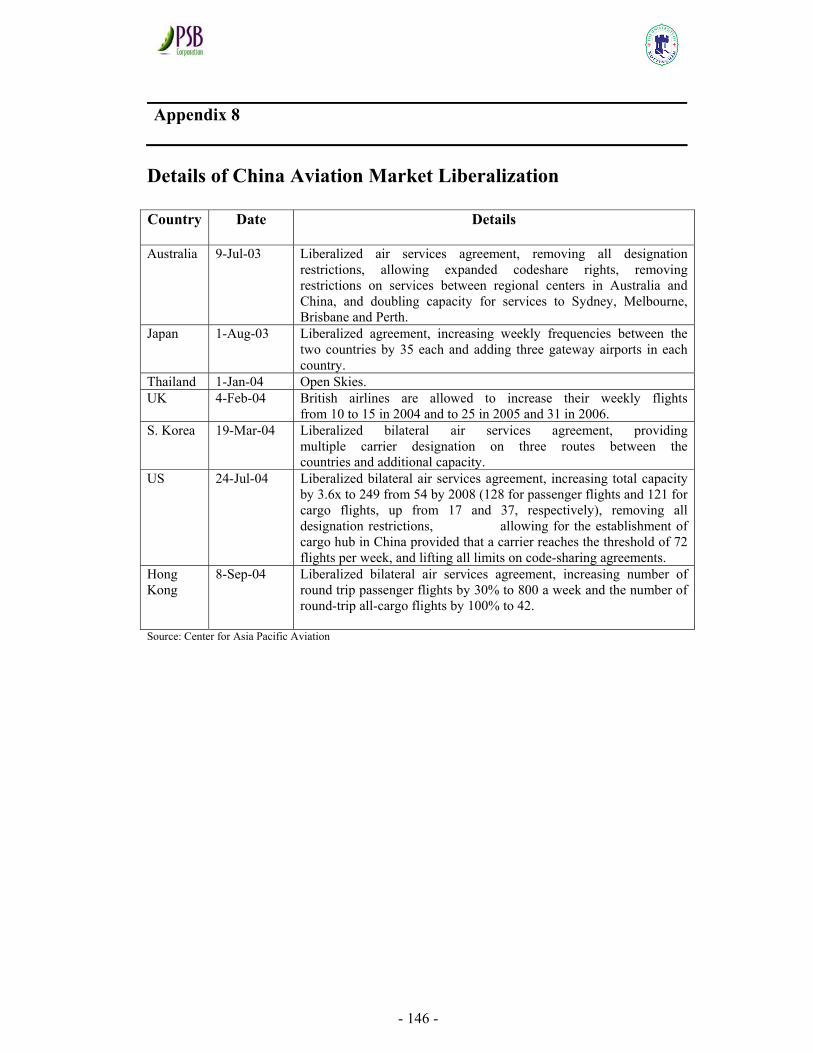
- 146 -
Appendix 8
Details of China Aviation Market Liberalization
Country Date Details
Australia 9-Jul-03 Liberalized air services agreement, removing all designation restrictions, allowing expanded codeshare rights, removing restrictions on services between regional centers in Australia and China, and doubling capacity for services to Sydney, Melbourne, Brisbane and Perth.
Japan 1-Aug-03 Liberalized agreement, increasing weekly frequencies between the two countries by 35 each and adding three gateway airports in each country.
Thailand 1-Jan-04 Open Skies. UK 4-Feb-04 British airlines are allowed to increase their weekly flights
from 10 to 15 in 2004 and to 25 in 2005 and 31 in 2006. S. Korea 19-Mar-04 Liberalized bilateral air services agreement, providing
multiple carrier designation on three routes between the countries and additional capacity.
US 24-Jul-04 Liberalized bilateral air services agreement, increasing total capacity by 3.6x to 249 from 54 by 2008 (128 for passenger flights and 121 for cargo flights, up from 17 and 37, respectively), removing all designation restrictions, allowing for the establishment of cargo hub in China provided that a carrier reaches the threshold of 72 flights per week, and lifting all limits on code-sharing agreements.
Hong Kong
8-Sep-04 Liberalized bilateral air services agreement, increasing number of round trip passenger flights by 30% to 800 a week and the number of round-trip all-cargo flights by 100% to 42.
Source: Center for Asia Pacific Aviation
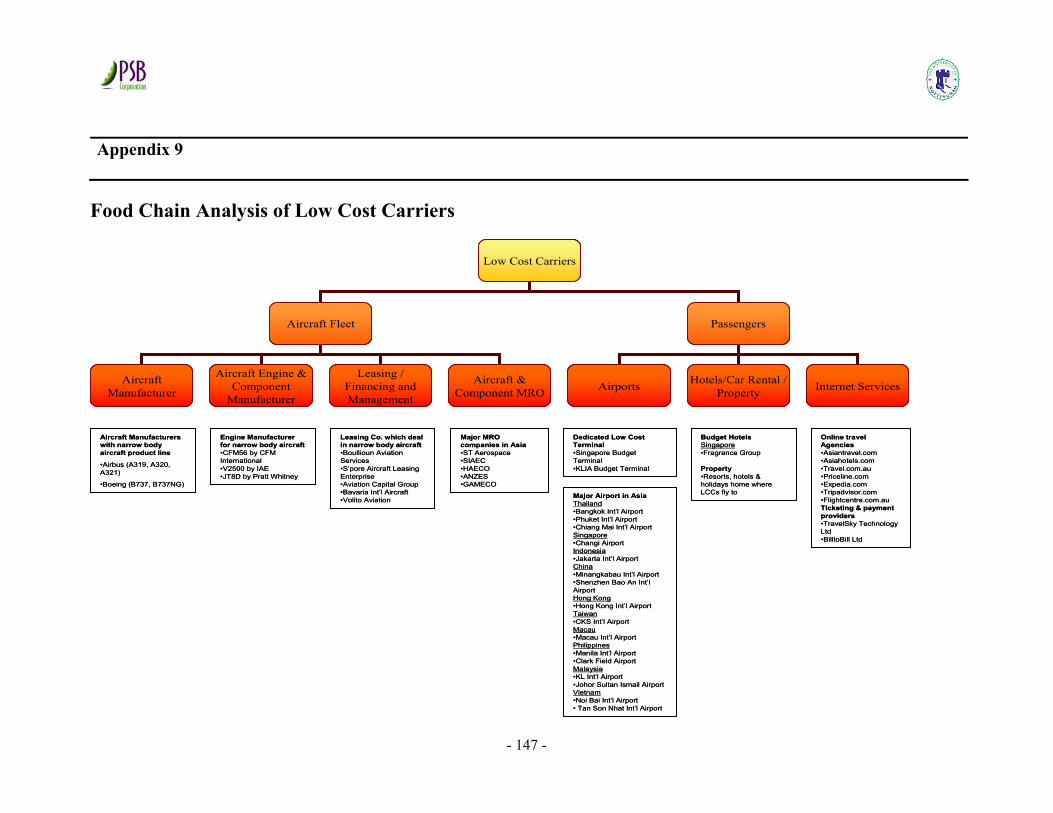
- 147 -
Appendix 9
Food Chain Analysis of Low Cost Carriers
Low Cost Carriers
Aircraft Fleet Passengers
Airports Hotels/Car Rental / Property Internet ServicesAircraft
Manufacturer
Aircraft Engine & Component
Manufacturer
Leasing / Financing and Management
Aircraft & Component MRO
Aircraft Manufacturers with narrow body aircraft product line
•Airbus (A319, A320, A321)
•Boeing (B737, B737NG)
Engine Manufacturer for narrow body aircraft•CFM56 by CFM International•V2500 by IAE•JT8D by Pratt Whitney
Leasing Co. which deal in narrow body aircraft•Boullioun Aviation Services•S’pore Aircraft Leasing Enterprise•Aviation Capital Group•Bavaria Int’l Aircraft•Volito Aviation
Major MRO companies in Asia•ST Aerospace•SIAEC•HAECO•ANZES•GAMECO
Dedicated Low Cost Terminal•Singapore Budget Terminal•KLIA Budget Terminal
Major Airport in AsiaThailand•Bangkok Int’l Airport•Phuket Int’l Airport•Chiang Mai Int’l AirportSingapore•Changi AirportIndonesia•Jakarta Int’l AirportChina•Minangkabau Int’l Airport•Shenzhen Bao An Int’l Airport Hong Kong•Hong Kong Int’l AirportTaiwan•CKS Int’l AirportMacau•Macau Int’l AirportPhilippines•Manila Int’l Airport•Clark Field AirportMalaysia•KL Int’l Airport•Johor Sultan Ismail AirportVietnam•Noi Bai Int’l Airport • Tan Son Nhat Int’l Airport
Budget HotelsSingapore•Fragrance Group
Property•Resorts, hotels & holidays home where LCCs fly to
Online travel Agencies•Asiantravel.com•Asiahotels.com•Travel.com.au•Priceline.com•Expedia.com•Tripadvisor.com•Flightcentre.com.auTicketing & payment providers•TravelSky Technology Ltd•BilltoBill Ltd
Low Cost Carriers
Aircraft Fleet Passengers
Airports Hotels/Car Rental / Property Internet ServicesAircraft
Manufacturer
Aircraft Engine & Component
Manufacturer
Leasing / Financing and Management
Aircraft & Component MRO
Low Cost Carriers
Aircraft Fleet Passengers
Airports Hotels/Car Rental / Property Internet ServicesAircraft
Manufacturer
Aircraft Engine & Component
Manufacturer
Leasing / Financing and Management
Aircraft & Component MRO
Aircraft Manufacturers with narrow body aircraft product line
•Airbus (A319, A320, A321)
•Boeing (B737, B737NG)
Engine Manufacturer for narrow body aircraft•CFM56 by CFM International•V2500 by IAE•JT8D by Pratt Whitney
Leasing Co. which deal in narrow body aircraft•Boullioun Aviation Services•S’pore Aircraft Leasing Enterprise•Aviation Capital Group•Bavaria Int’l Aircraft•Volito Aviation
Major MRO companies in Asia•ST Aerospace•SIAEC•HAECO•ANZES•GAMECO
Dedicated Low Cost Terminal•Singapore Budget Terminal•KLIA Budget Terminal
Major Airport in AsiaThailand•Bangkok Int’l Airport•Phuket Int’l Airport•Chiang Mai Int’l AirportSingapore•Changi AirportIndonesia•Jakarta Int’l AirportChina•Minangkabau Int’l Airport•Shenzhen Bao An Int’l Airport Hong Kong•Hong Kong Int’l AirportTaiwan•CKS Int’l AirportMacau•Macau Int’l AirportPhilippines•Manila Int’l Airport•Clark Field AirportMalaysia•KL Int’l Airport•Johor Sultan Ismail AirportVietnam•Noi Bai Int’l Airport • Tan Son Nhat Int’l Airport
Budget HotelsSingapore•Fragrance Group
Property•Resorts, hotels & holidays home where LCCs fly to
Online travel Agencies•Asiantravel.com•Asiahotels.com•Travel.com.au•Priceline.com•Expedia.com•Tripadvisor.com•Flightcentre.com.auTicketing & payment providers•TravelSky Technology Ltd•BilltoBill Ltd
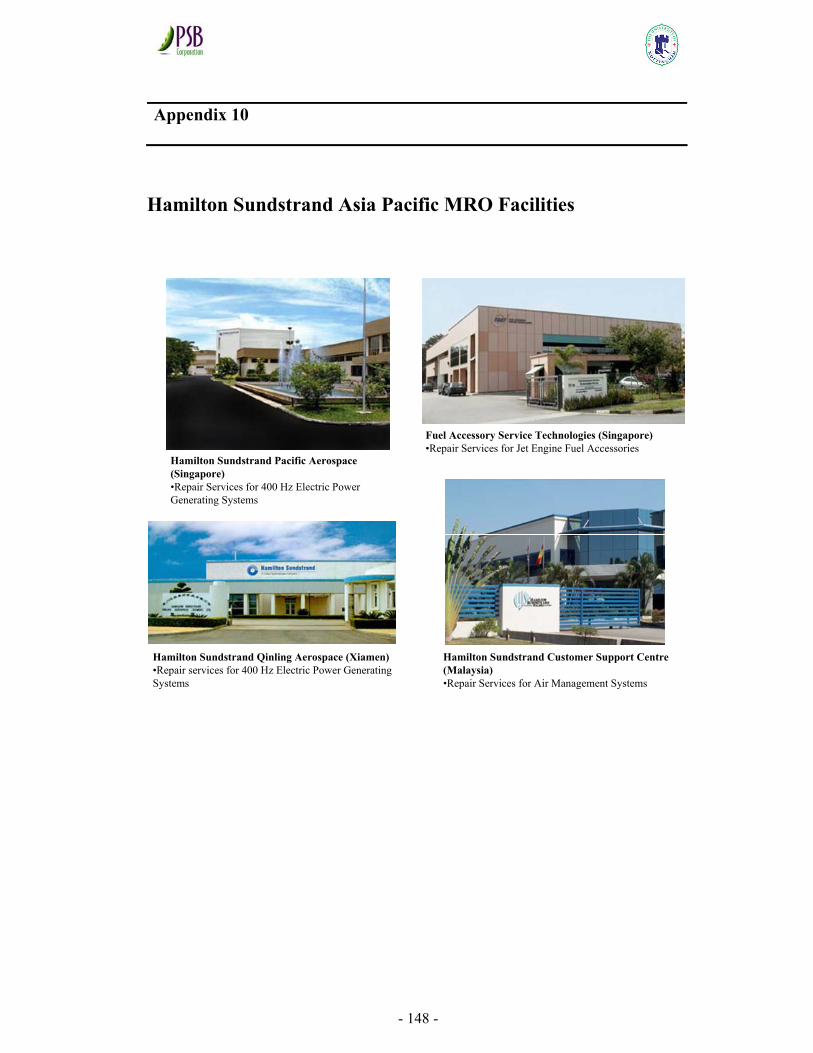
- 148 -
Appendix 10
Hamilton Sundstrand Asia Pacific MRO Facilities
Hamilton Sundstrand Qinling Aerospace (Xiamen)•Repair services for 400 Hz Electric Power Generating Systems
Hamilton Sundstrand Customer Support Centre(Malaysia)•Repair Services for Air Management Systems
Hamilton Sundstrand Pacific Aerospace (Singapore)•Repair Services for 400 Hz Electric Power Generating Systems
Fuel Accessory Service Technologies (Singapore)•Repair Services for Jet Engine Fuel Accessories