Embed Size (px)
Citation preview

JetBlue Airways
Investor Day
December 5, 2006
This slide presentation and accompanying webcast reflect JetBlue Airways Corporation’s investor presentation as of December 5, 2006 and its projected future financial forecasts, and contain forward-looking information within the meaning of Section 27A of the Securities Act of 1933, as amended, and Section 21E of the Securities and Exchange Act of 1934, as amended. Forward-looking statements give our current expectations or forecasts of future events. You can identify these statements by the fact that they do not relate strictly to historic or current facts. They use words such as “will,'' “anticipate,'' "estimate,'' "expect,'' "project,'' "intend,'' "plan,'' "believe,'' "target,'' "forecast'' and other words and terms of similar meaning in connection with any discussion of future operating or financial performance. In particular, they may include statements relating to future actions, future performance or results of current and anticipated products and services, capital expenditures, expenses, the outcome of contingencies, such as legal proceedings, and financial results.The forward-looking information included in the investor presentation is subject to a number of risks and uncertainties. Our actual results could differ materially from the information included in the investor presentation, depending in particular upon the risks and uncertainties described in our filings with the Securities and Exchange Commission (SEC), as amended. Existing and prospective investors are cautioned not to place undue reliance on this forward-looking information, which speak only as of the date hereof. We undertake no obligation to update or revise the information in the investor presentation, whether as a result of new information, future events or circumstances, or otherwise
Safe Harbor disclosure
David Neeleman, CEO
Welcome & Overview
1
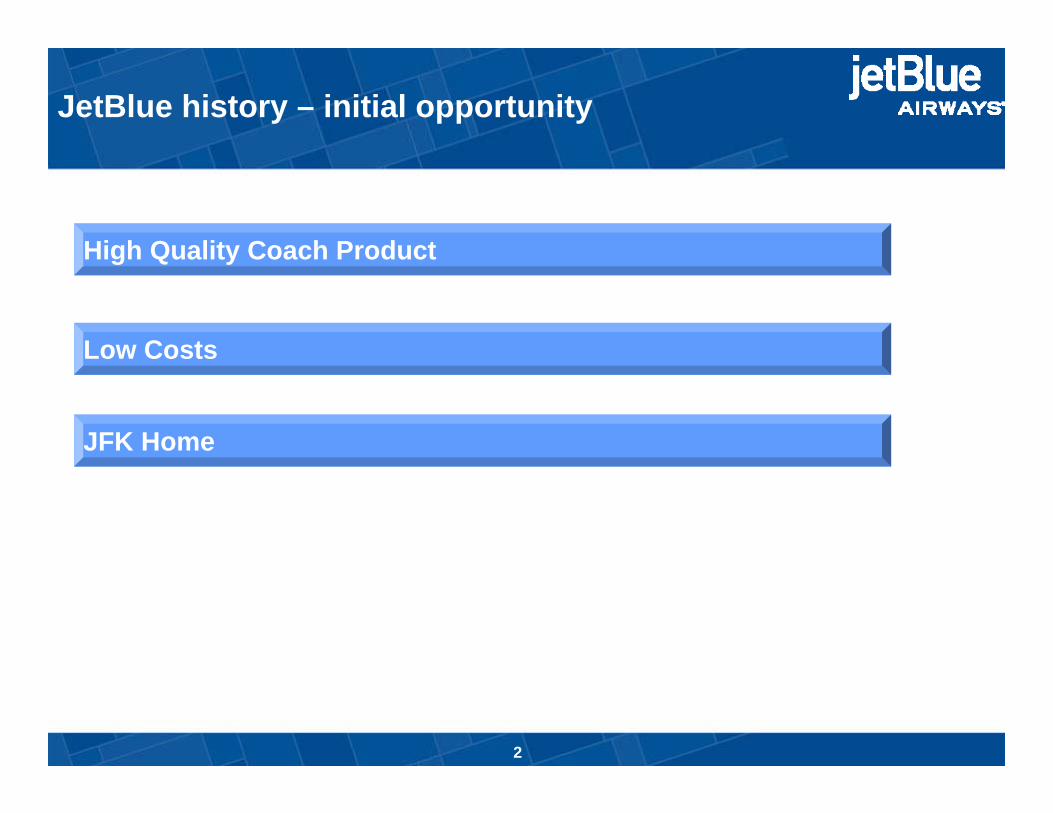
JetBlue history – initial opportunity
High Quality Coach Product
Low Costs
JFK Home
2
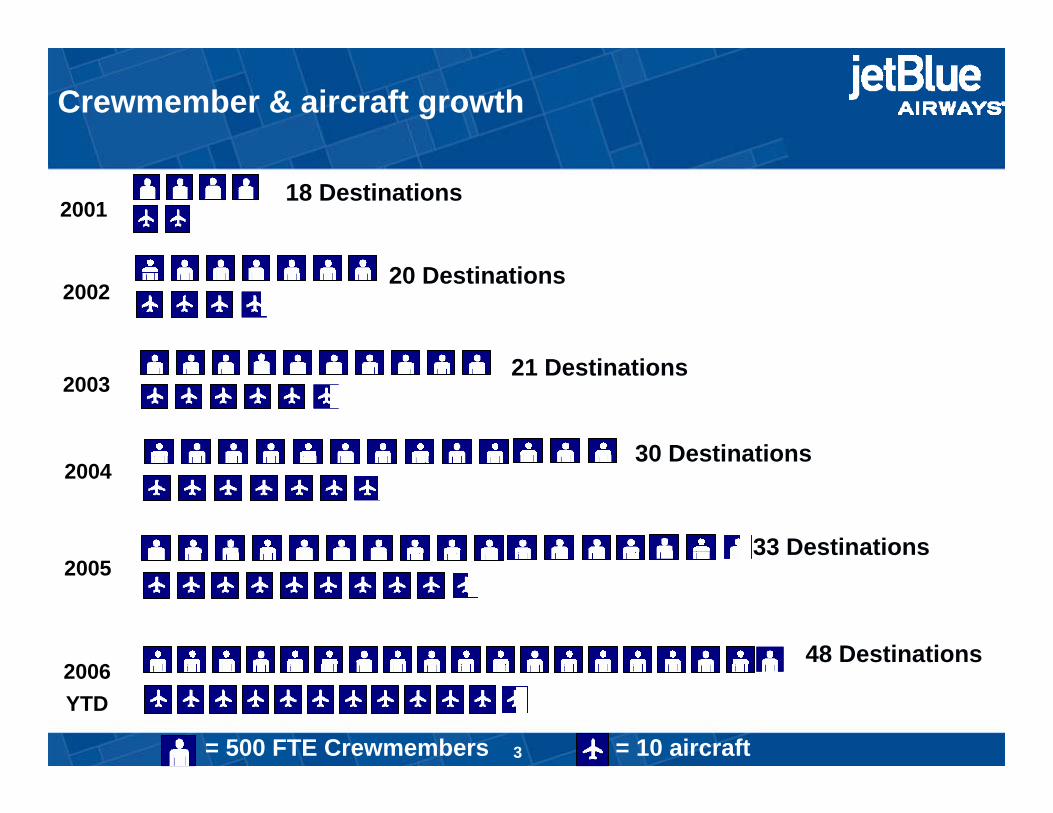
2001
2002
2003
2004
2005
2006YTD
= 500 FTE Crewmembers = 10 aircraft
Crewmember & aircraft growth
18 Destinations
20 Destinations
21 Destinations
30 Destinations
33 Destinations
48 Destinations
3
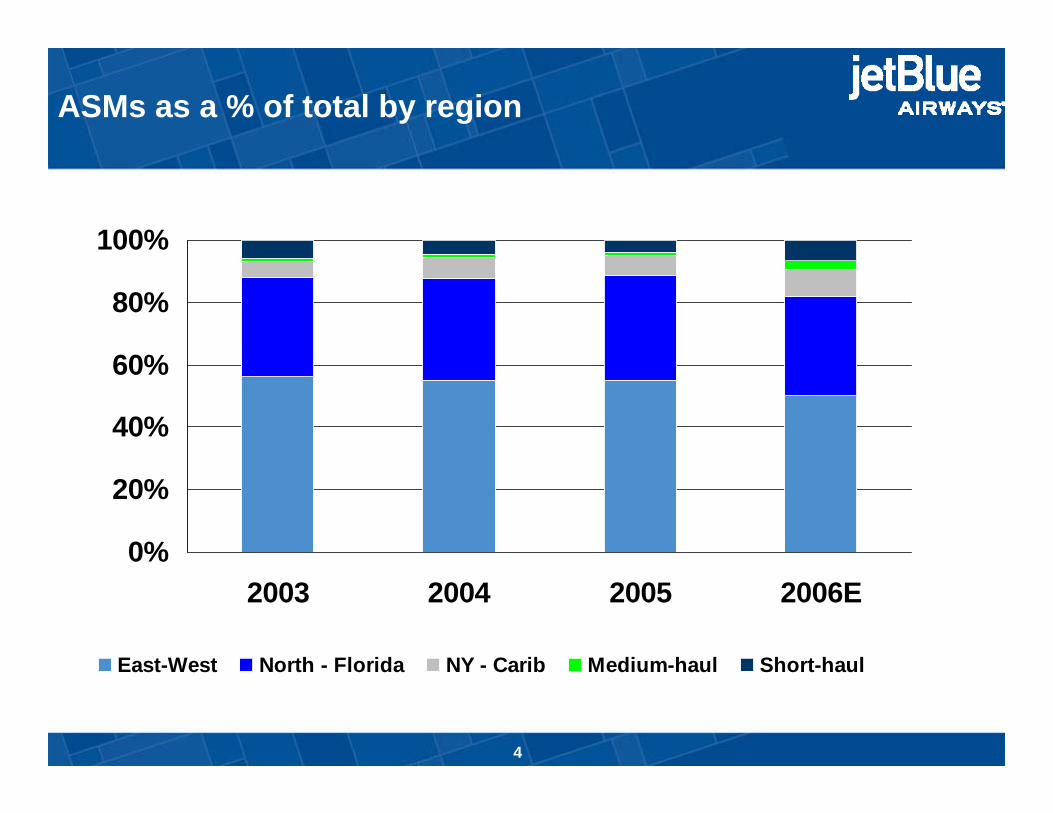
ASMs as a % of total by region
0%
20%
40%
60%
80%
100%
2003 2004 2005 2006E
East-West North - Florida NY - Carib Medium-haul Short-haul
4
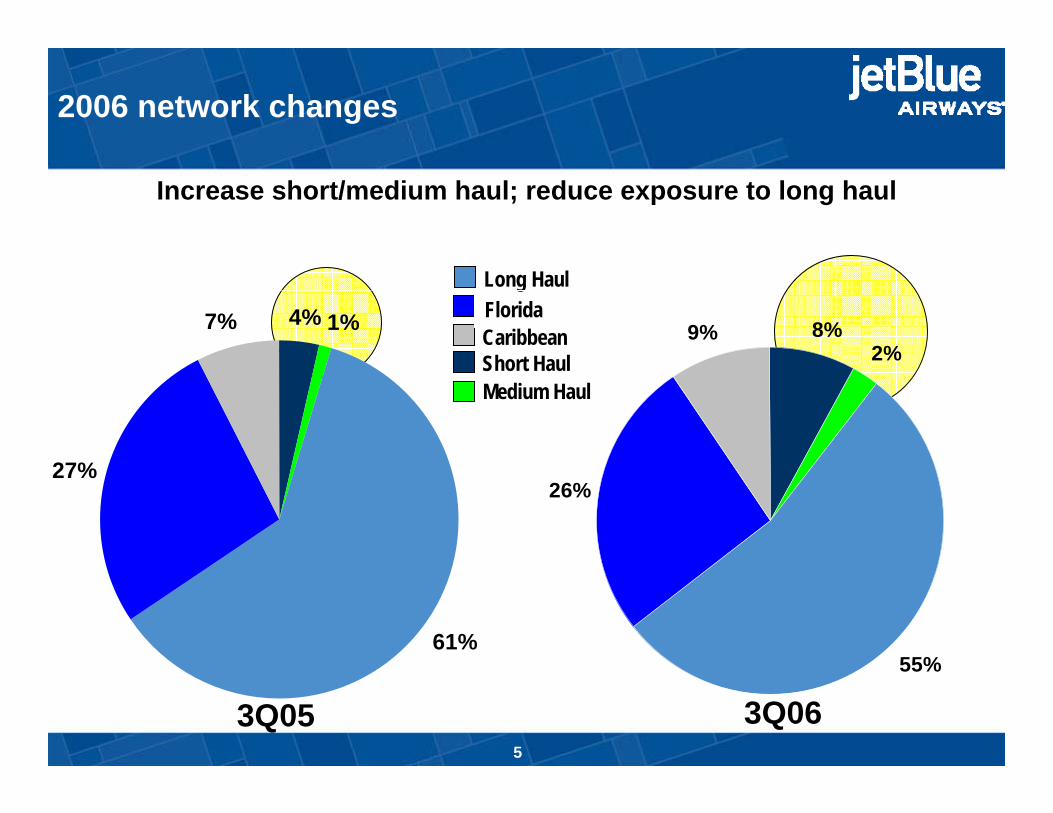
4% 1%
61%
27%
7%
Long HaulFloridaCaribbeanShort HaulMedium Haul
8%2%
55%
26%
9%
Increase short/medium haul; reduce exposure to long haul
2006 network changes
3Q05 3Q065
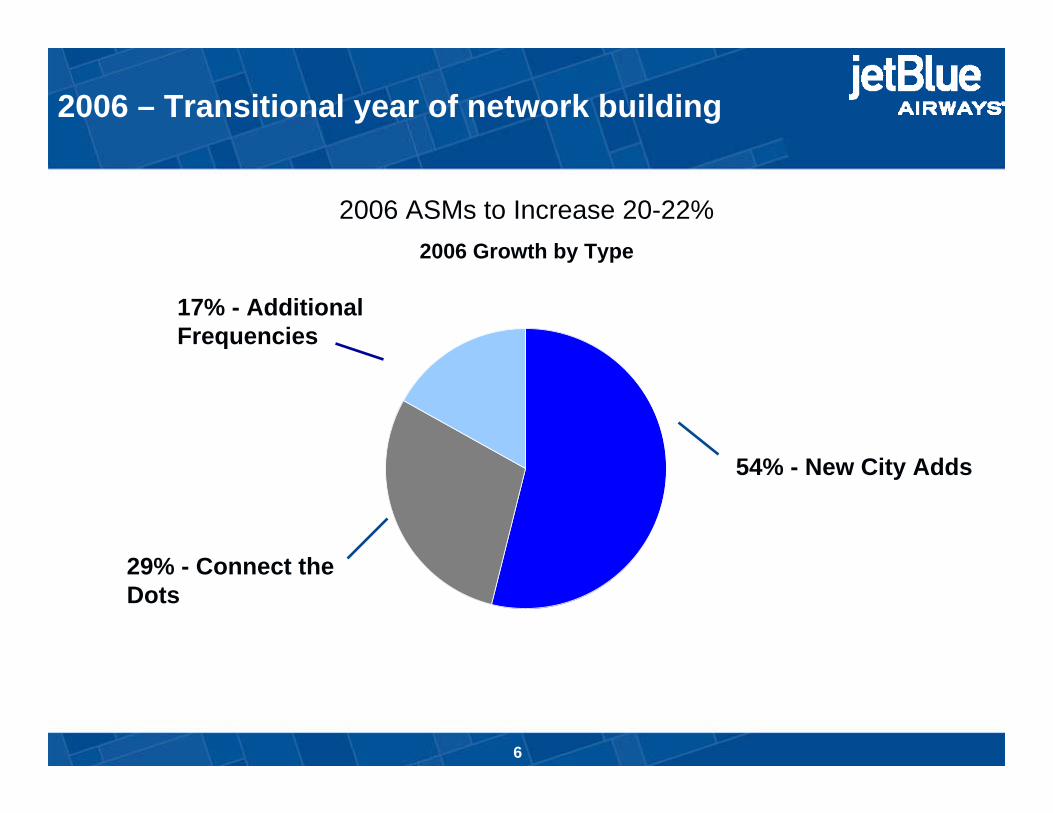
17% - Additional Frequencies
29% - Connect the Dots
54% - New City Adds
2006 ASMs to Increase 20-22%2006 Growth by Type
2006 – Transitional year of network building
6
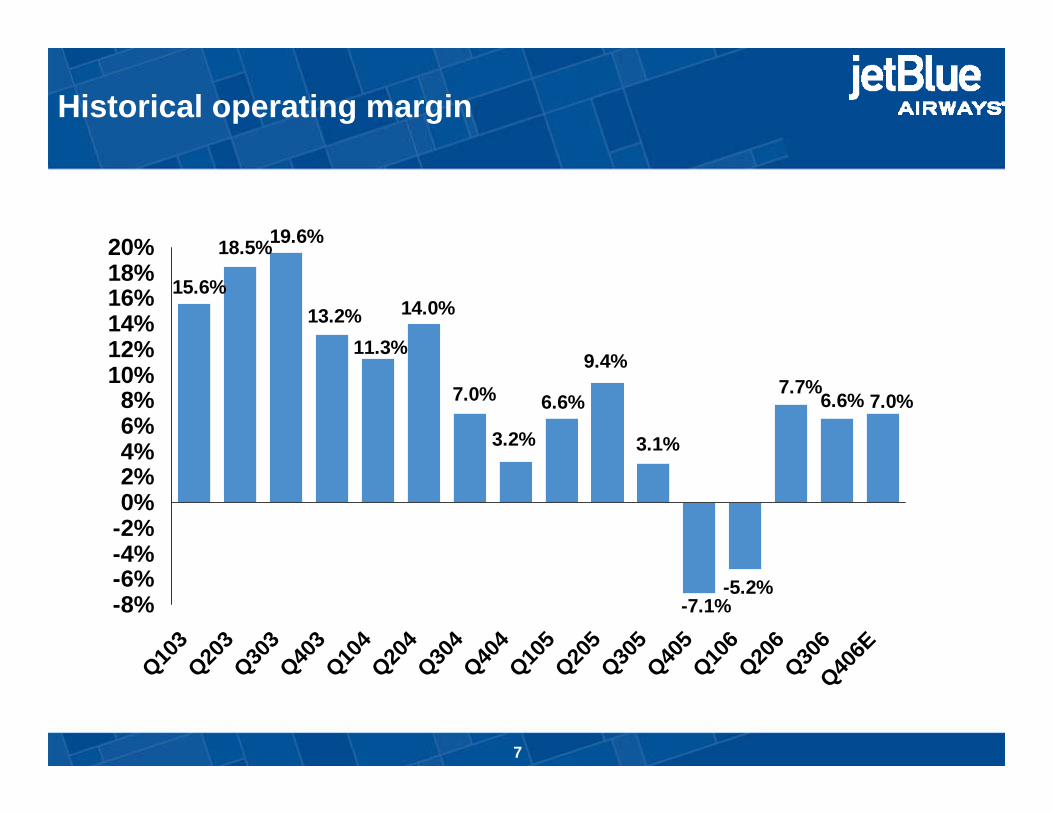
Historical operating margin
7.0%6.6%7.7%
-5.2%-7.1%
3.1%
9.4%
6.6%
3.2%
7.0%
14.0%
11.3%13.2%
19.6%18.5%
15.6%
-8%-6%-4%-2%0%2%4%6%8%
10%12%14%16%18%20%
Q103
Q203
Q303
Q403
Q104
Q204
Q304
Q404
Q105
Q205
Q305
Q405
Q106
Q206
Q306
Q406E
7
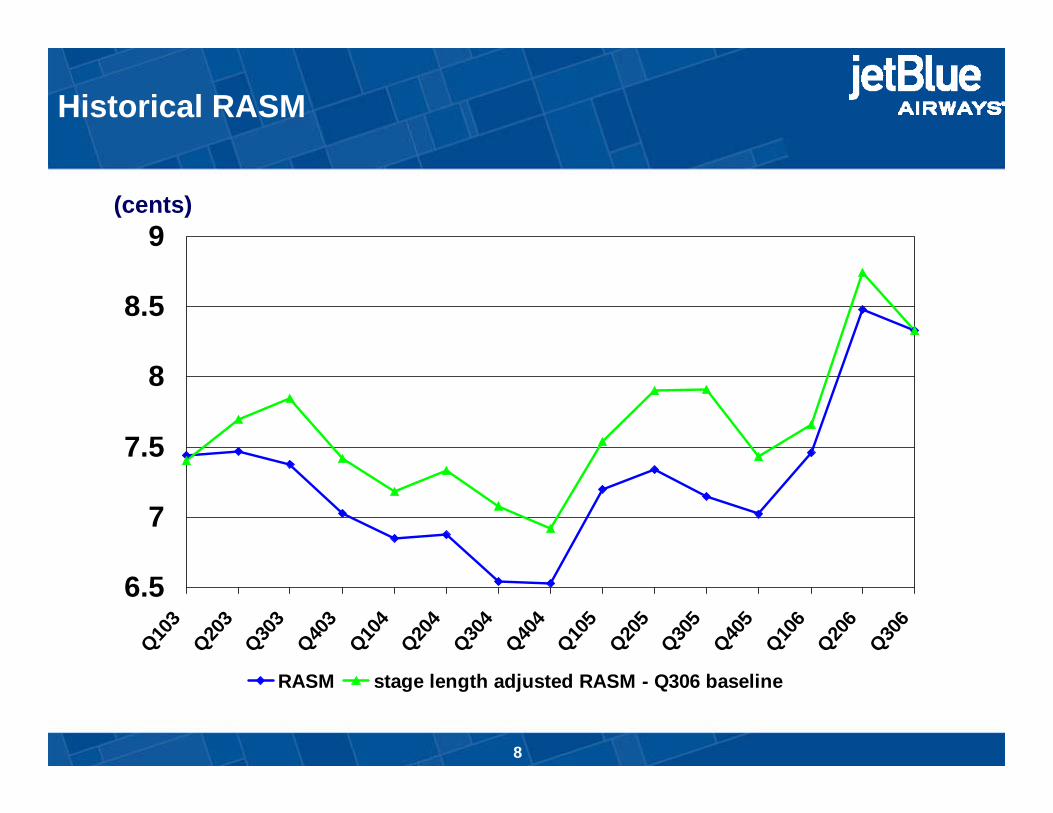
6.5
7
7.5
8
8.5
9
Q103
Q203
Q303
Q403
Q104
Q204
Q304
Q404
Q105
Q205
Q305
Q405
Q106
Q206
Q306
RASM stage length adjusted RASM - Q306 baseline
(cents)
Historical RASM
8
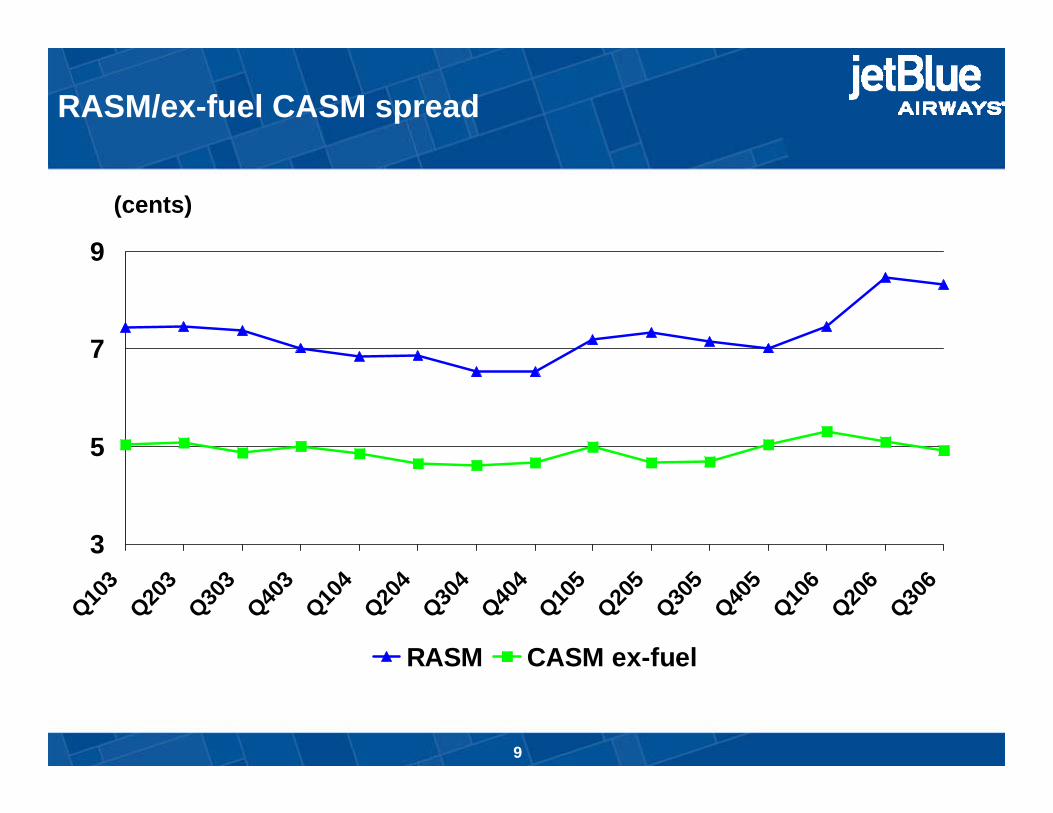
3
5
7
9
Q103
Q203
Q303
Q403
Q104
Q204
Q304
Q404
Q105
Q205
Q305
Q405
Q106
Q206
Q306
RASM CASM ex-fuel
RASM/ex-fuel CASM spread
(cents)
9
Executive Summary
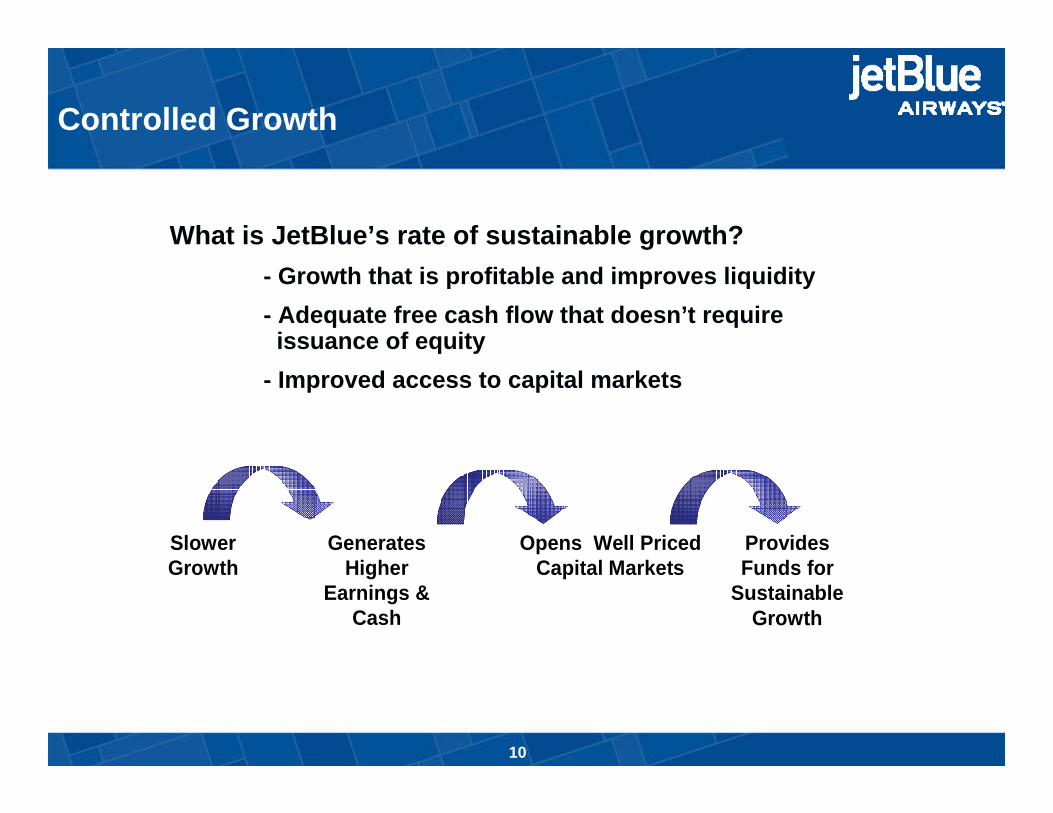
What is JetBlue’s rate of sustainable growth?- Growth that is profitable and improves liquidity- Adequate free cash flow that doesn’t require issuance of equity
- Improved access to capital markets
Generates Higher
Earnings & Cash
Slower Growth
Opens Well Priced Capital Markets
Provides Funds for
Sustainable Growth
Controlled Growth
10
85
7
96
23
108
44
108
33
120
62
120
43
136
80
136
53
154
98
154
63
172
101
172
73
0
50
100
150
200
250
300
2005
2006
2007
2007
revis
ed
2008
2008
revis
ed
2009
2009
revis
ed
2010
2010
revis
ed
2011
2001
1 rev
ised
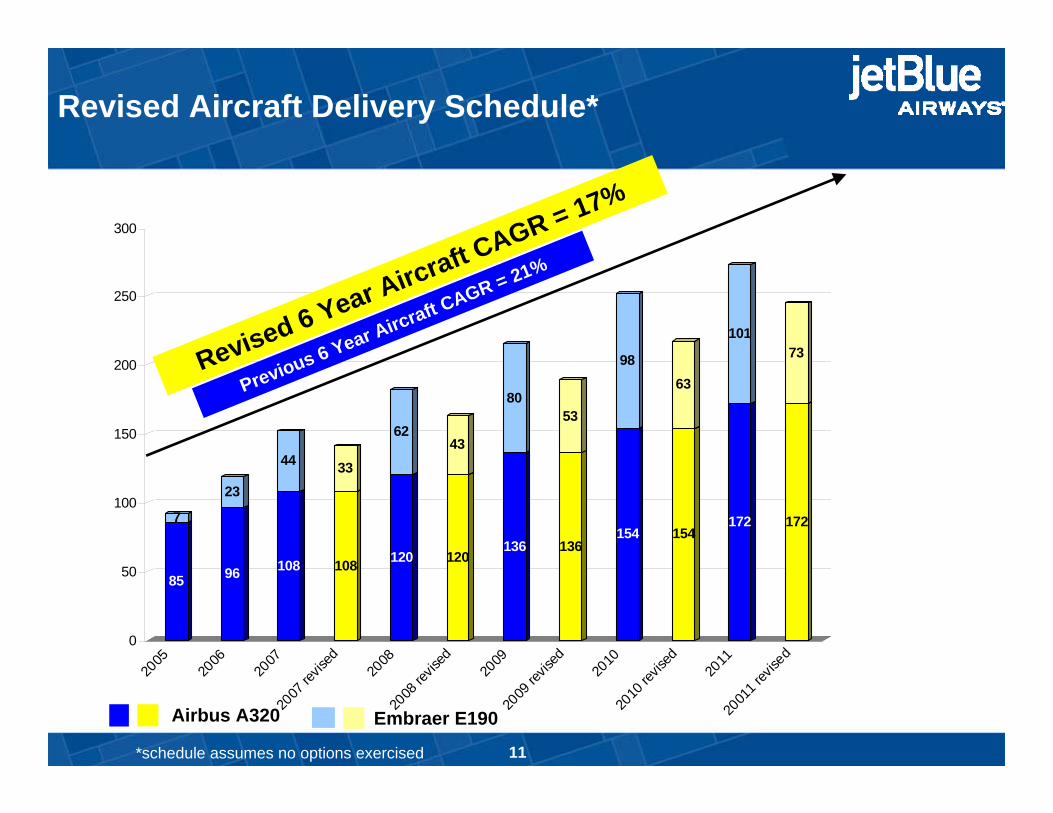
Revised 6 Year Aircraft CAGR = 17%
Previous 6 Year Aircraft CAGR = 21%
Revised Aircraft Delivery Schedule*
Embraer E190Airbus A320
*schedule assumes no options exercised 11
Trey Urbahn
Chief Revenue Officer
12
Arial 14 bold –dark blue font
Leveraging JetBlue’s revenue potential:
• - Being a low cost carrier isn’t what it used to be….
• - Legacy airlines have dramatically narrowed their CASM disadvantage with low cost carriers: − - Restructuring and Bankruptcy
− - Equalizing impact of rising fuel cost
− - Structural and permanent, rather than a cyclical change
• - Need to create and maintain sustainable profitability advantage by leveraging revenue as well as lower costs
13
Arial 14 bold –dark blue font
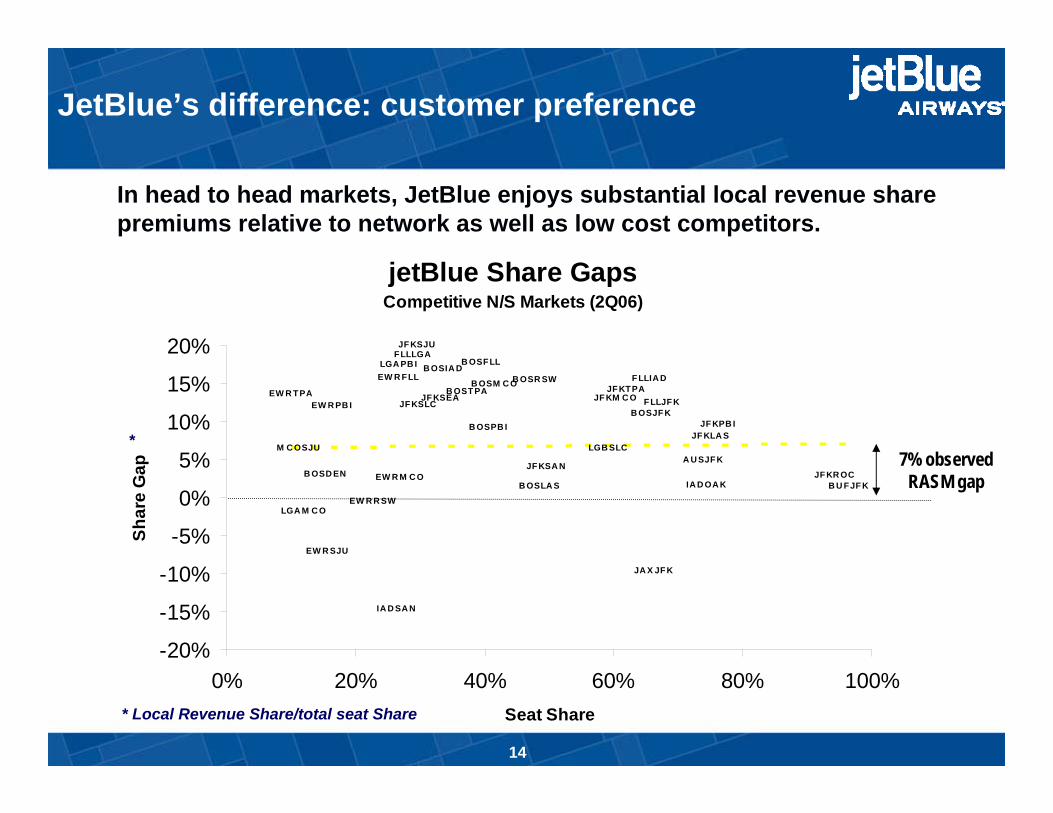
JetBlue’s difference: customer preference
• In head to head markets, JetBlue enjoys substantial local revenue share premiums relative to network as well as low cost competitors.
•
•
jetBlue Share GapsCompetitive N/S Markets (2Q06)
JA X JF K
EW R TPA
B OSD EN
IA D SA N
JFKSLC
EW R R SW
B OSLA S
EW R PB I
LGB SLC
B OSPB I
B OSR SW F LLIA DB OST PA
IA D OA K
A U SJFK
EW R FLL
EW R M C O JF KR OC
JF KLA S
B OSIA D
JF KTPA
JF KPB I
B U FJF K
F LLJF KJF KM C O
EW R SJU
JF KSEA
LGA PB I
JF KSA N
B OSFLL
B OSM C O
JF KSJU
B OSJF K
M C OSJU
LGA M C O
FLLLGA
-20%
-15%
-10%
-5%
0%
5%
10%
15%
20%
0% 20% 40% 60% 80% 100%Seat Share
Shar
e G
ap 7% observed RASM gap
• * Local Revenue Share/total seat Share
• *
•
14
Arial 14 bold –dark blue font
Revenue growth strategies:
• JetBlue has substantial opportunity to drive revenue improvement:
• - Route structure:− - Network connectivity
− - Largest low cost carrier in the world’s largest market
− - Growing presence in focus cities: (BOS,IAD,FLL,LGB)
• - Revenue Management− - Shift from load factor to a RASM focus
− - Better demand segmentation
− - Optimize connect traffic opportunities
• - Marketing− - New distribution channels
− - Interline opportunities at JFK
− - Monetize a loyal customer base
15
Marty St. George
VP Route Planning
16
Planning philosophy
- Sustainable business models require at least one of two structural advantages:
- Network advantage- Cost advantage
- JetBlue is well positioned on both fronts:- Largest low-fare carrier in the largest air travel market in the world- Low cost structure
- Moreover, we enjoy this competitive positioning while delivering outstanding customer service
17
Planning’s 2007 roadmap
- Continue to grow JFK, both through new destinations (both A320 and Embraer 190) and by increasing connectivity
- Add selected frequency and destinations in our focus cities (Boston, Ft. Lauderdale, Long Beach, Washington D.C./Dulles)
- Achieve first two goals while reducing controllable costs per ASM
18
Network update
19
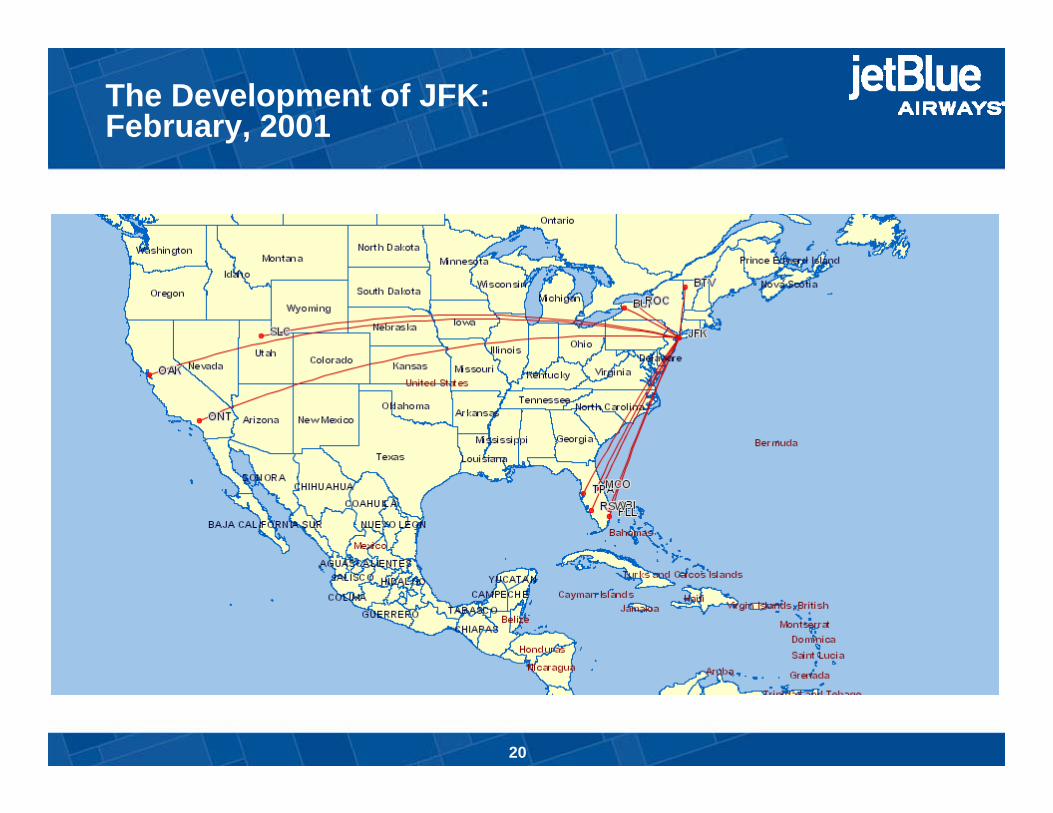
The Development of JFK:February, 2001
20
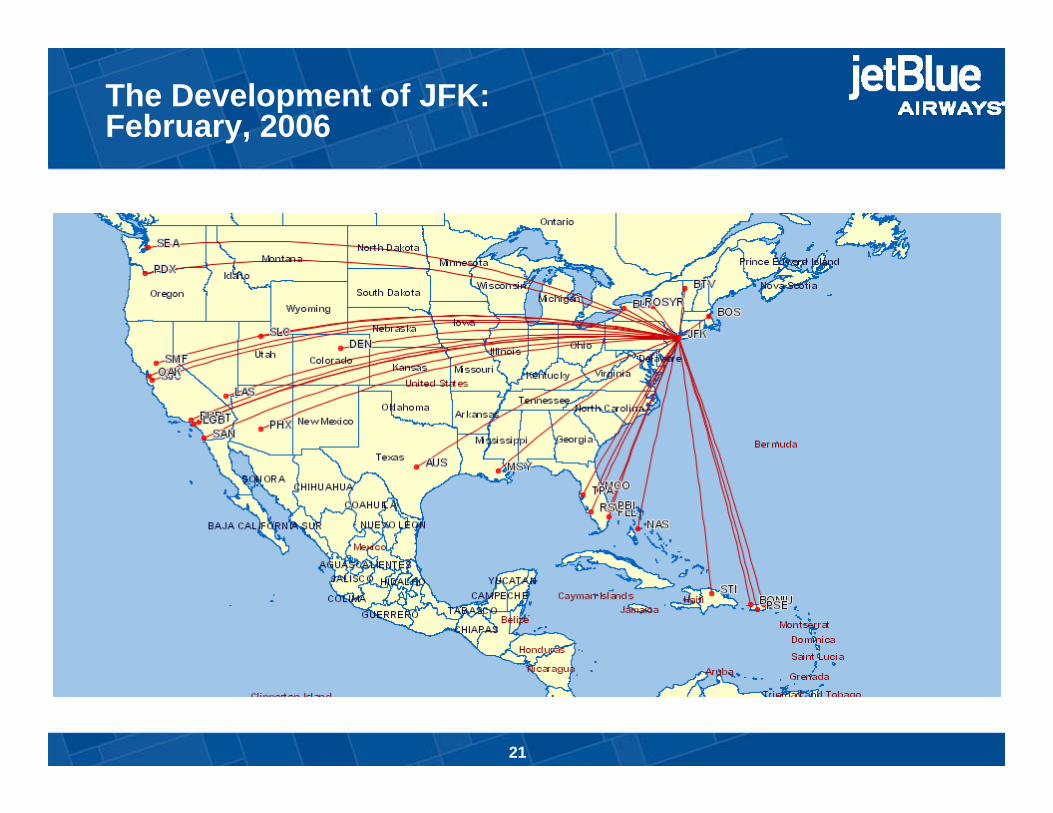
The Development of JFK:February, 2006
21
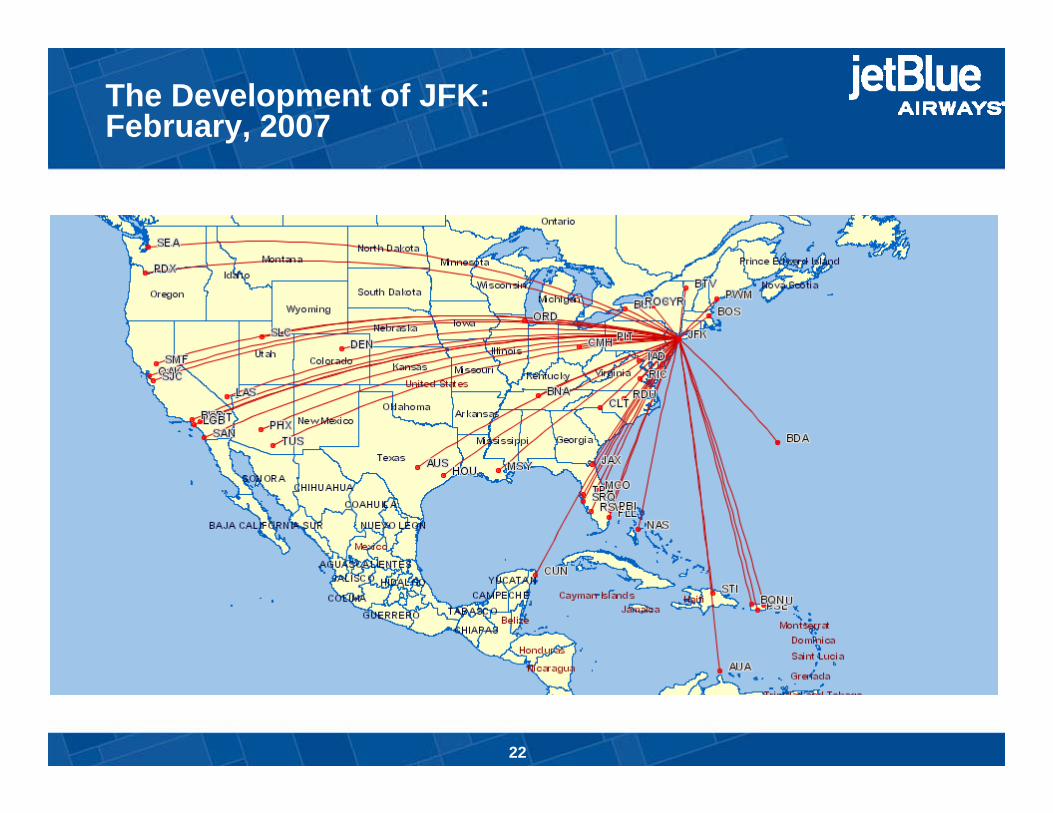
The Development of JFK: February, 2007
22
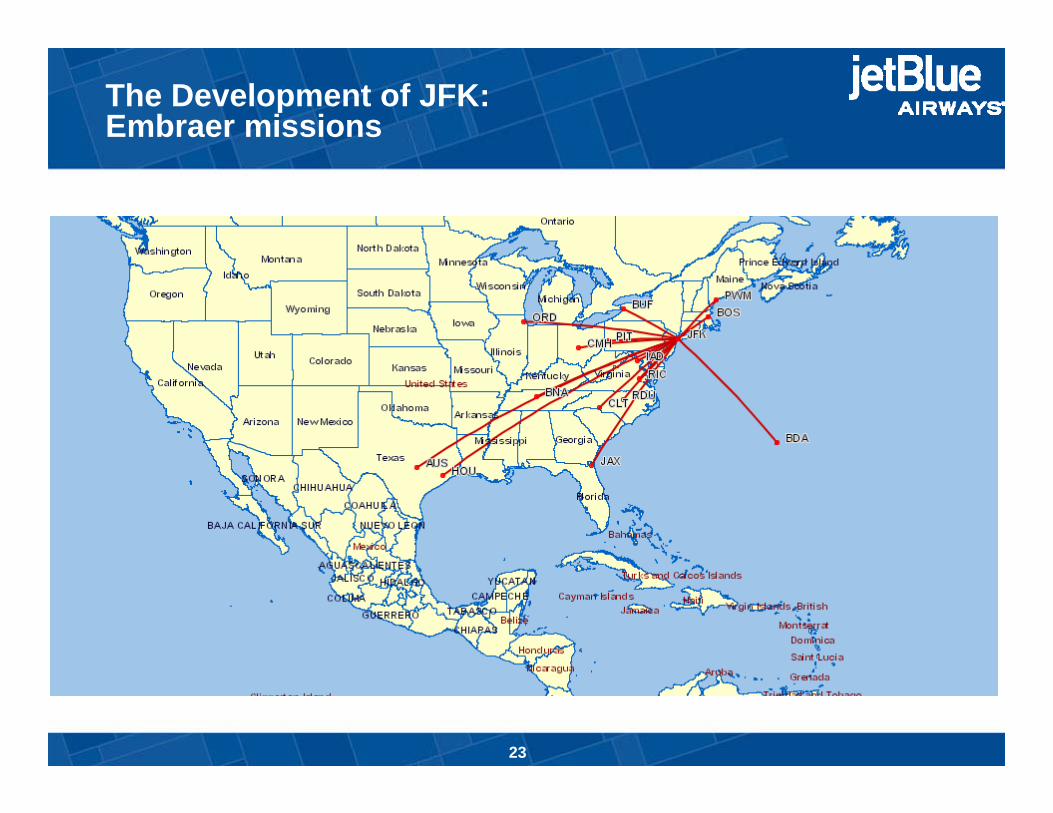
The Development of JFK: Embraer missions
23
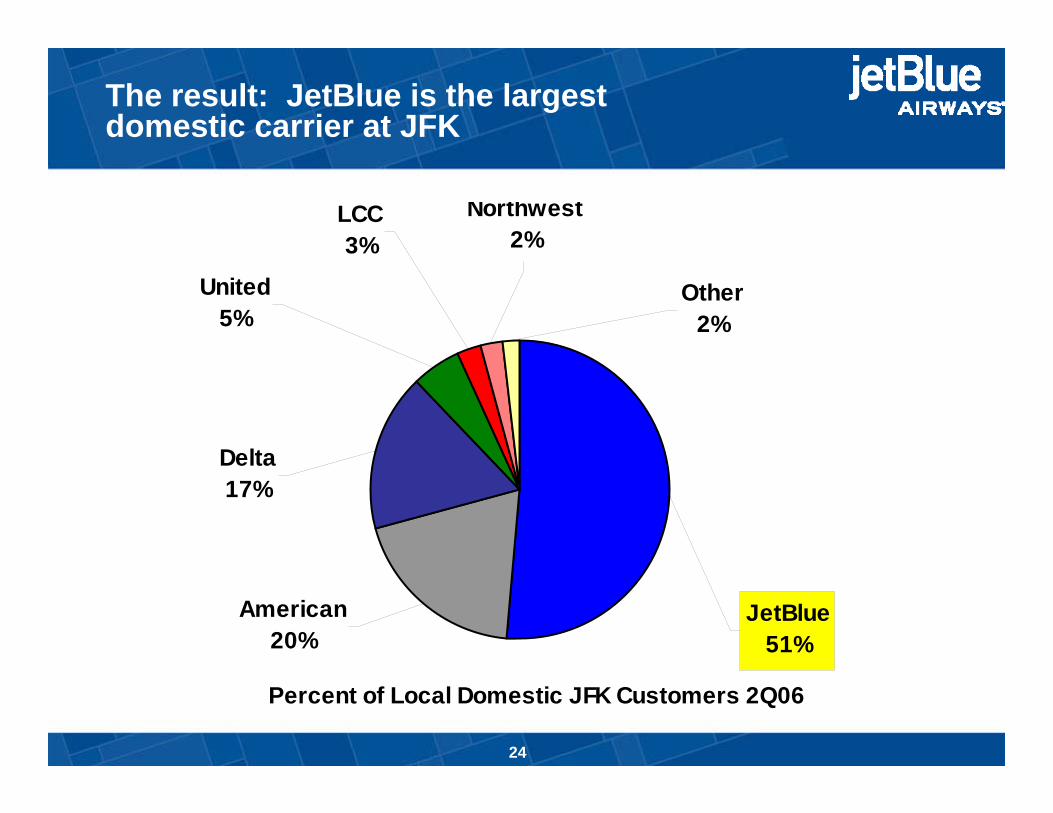
The result: JetBlue is the largest domestic carrier at JFK
Percent of Local Domestic JFK Customers 2Q06
Other2%
Delta17%
LCC3%
United5%
Northwest2%
JetBlue51%
American20%
24
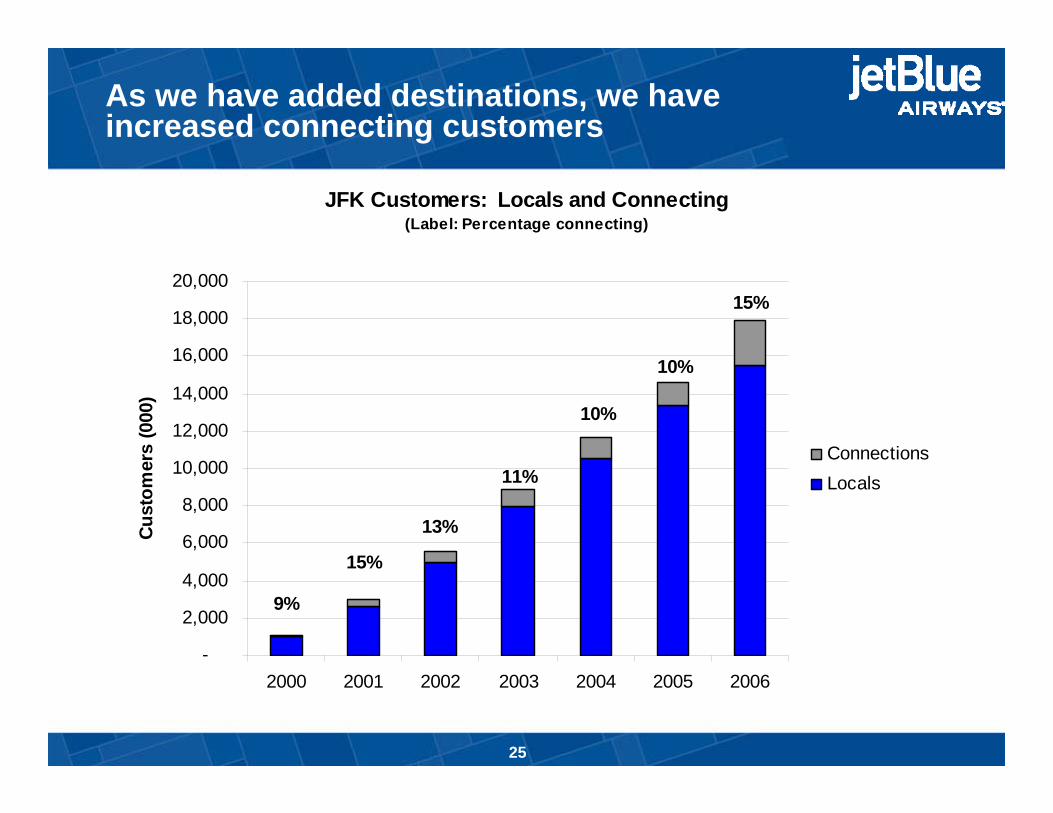
As we have added destinations, we have increased connecting customers
JFK Customers: Locals and Connecting(Label: Percentage connecting)
15%
10%
10%
11%
13%
15%
9%
-
2,000
4,000
6,000
8,000
10,000
12,000
14,000
16,000
18,000
20,000
2000 2001 2002 2003 2004 2005 2006
Cust
omer
s (0
00)
ConnectionsLocals
25
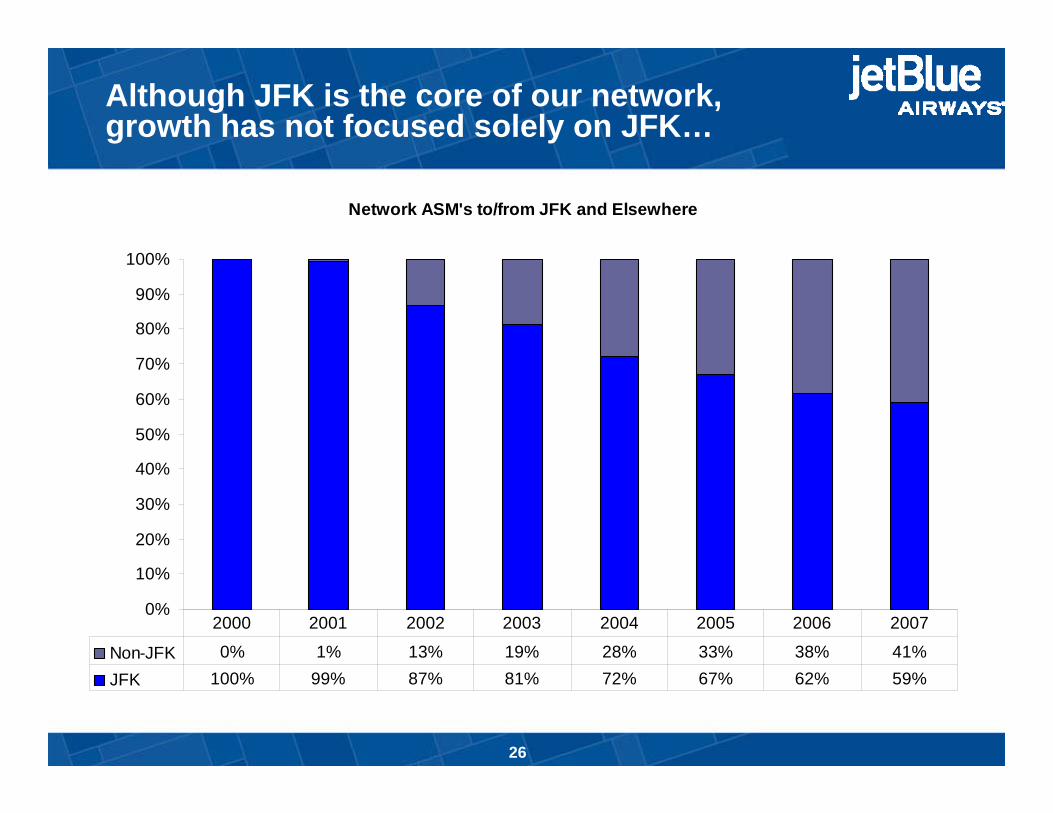
Although JFK is the core of our network, growth has not focused solely on JFK…
Network ASM's to/from JFK and Elsewhere
0%
10%
20%
30%
40%
50%
60%
70%
80%
90%
100%
Non-JFK 0% 1% 13% 19% 28% 33% 38% 41%JFK 100% 99% 87% 81% 72% 67% 62% 59%
2000 2001 2002 2003 2004 2005 2006 2007
26
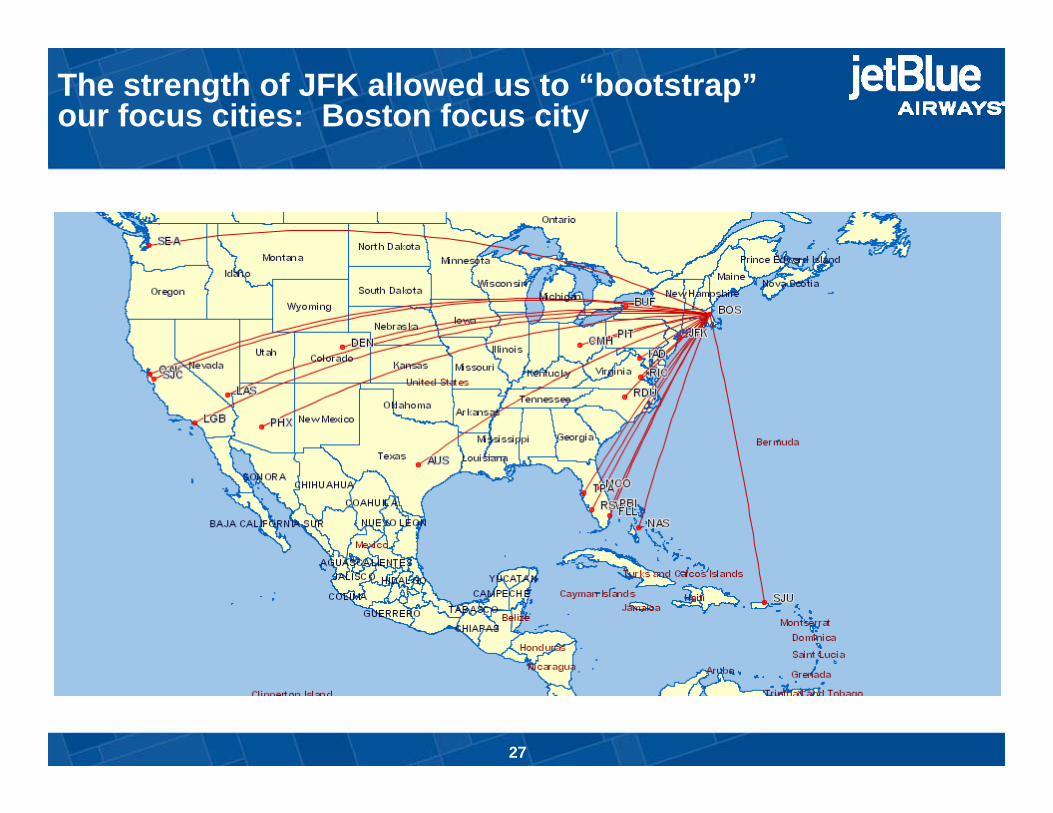
The strength of JFK allowed us to “bootstrap”our focus cities: Boston focus city
27
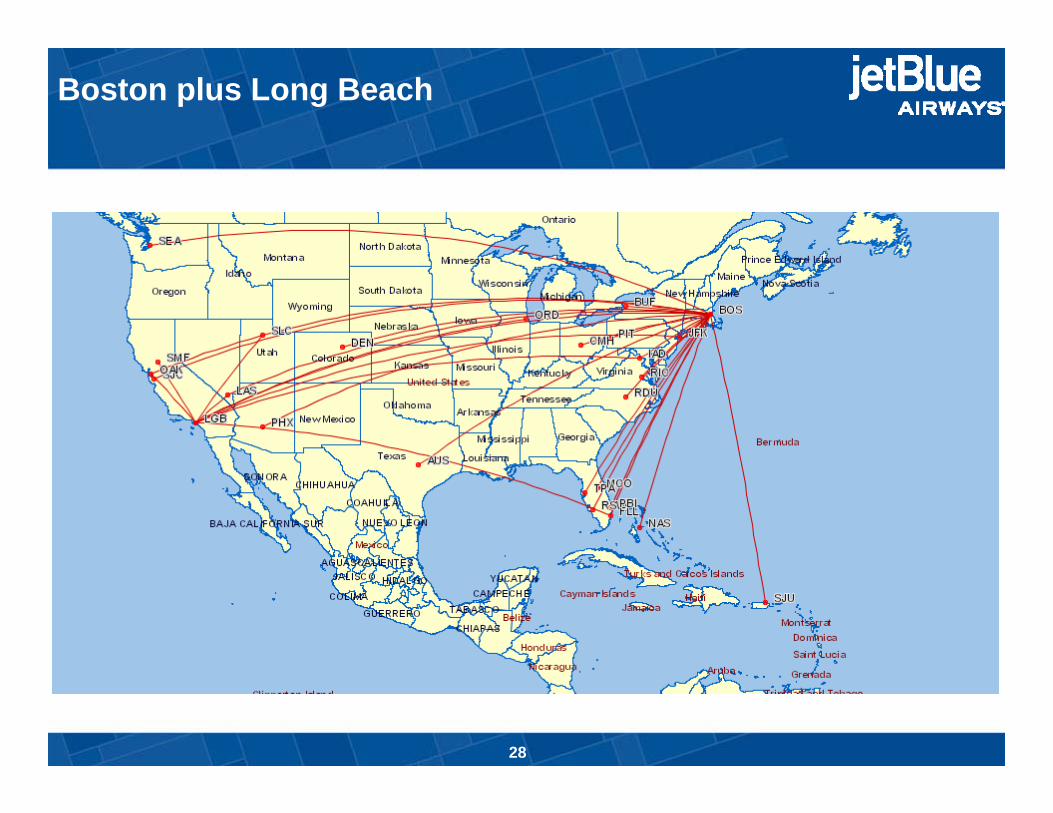
Boston plus Long Beach
28
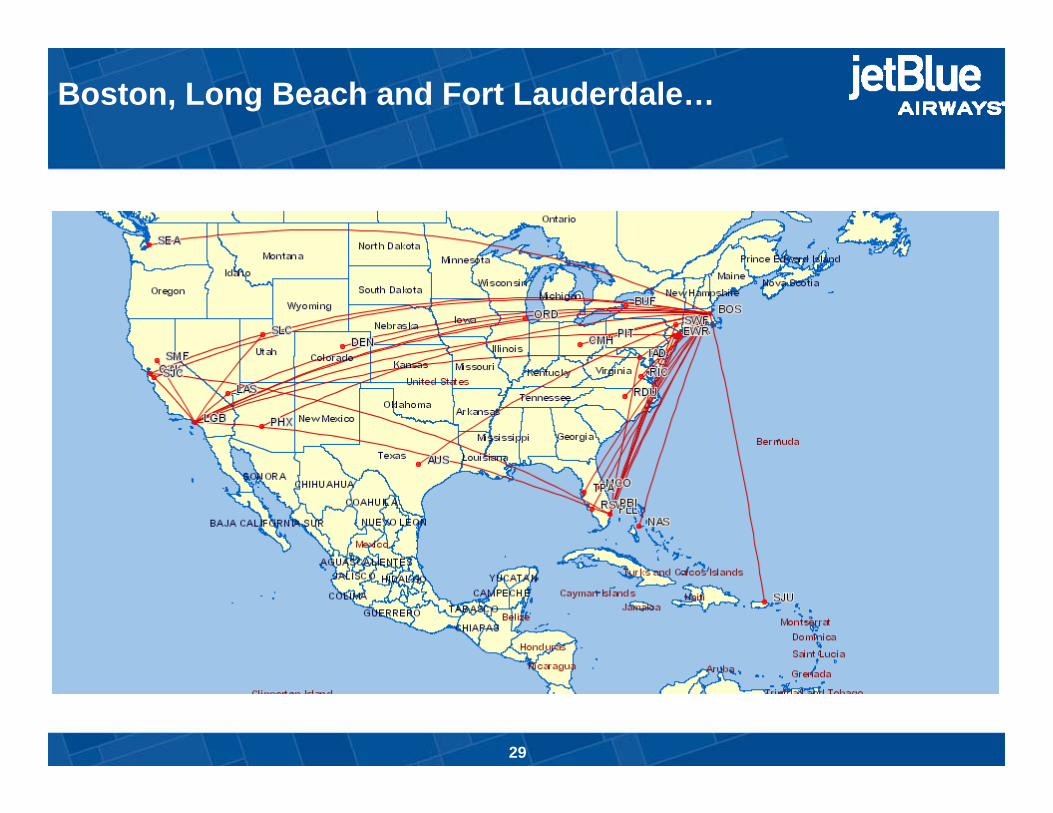
Boston, Long Beach and Fort Lauderdale…
29
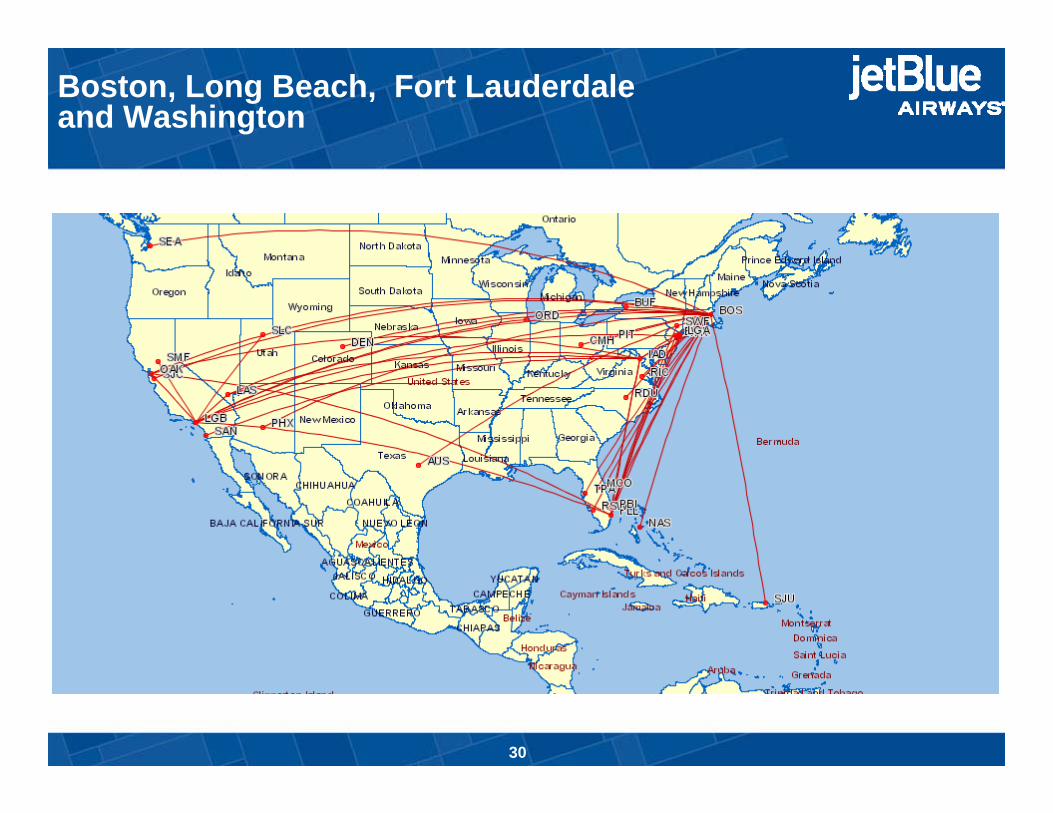
Boston, Long Beach, Fort Lauderdaleand Washington
30
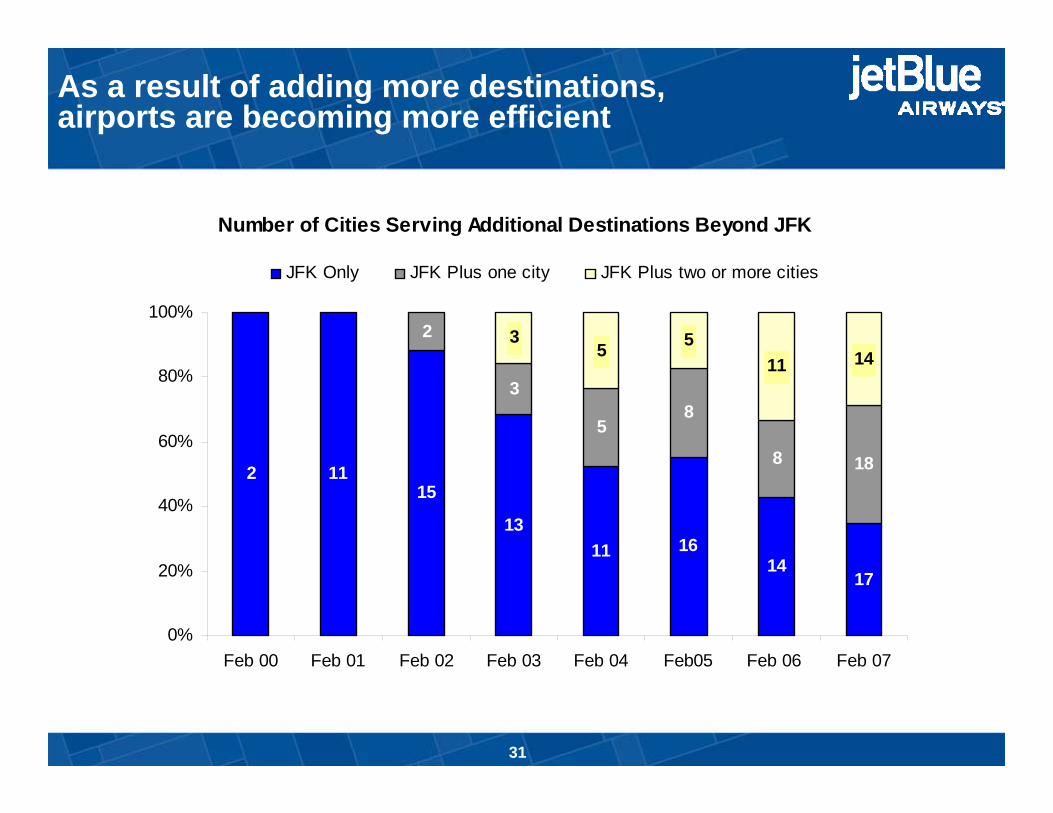
As a result of adding more destinations, airports are becoming more efficient
Number of Cities Serving Additional Destinations Beyond JFK
2 1115
1311 16
1417
2
3
58
8 18
35 5
11 14
0%
20%
40%
60%
80%
100%
Feb 00 Feb 01 Feb 02 Feb 03 Feb 04 Feb05 Feb 06 Feb 07
JFK Only JFK Plus one city JFK Plus two or more cities
31
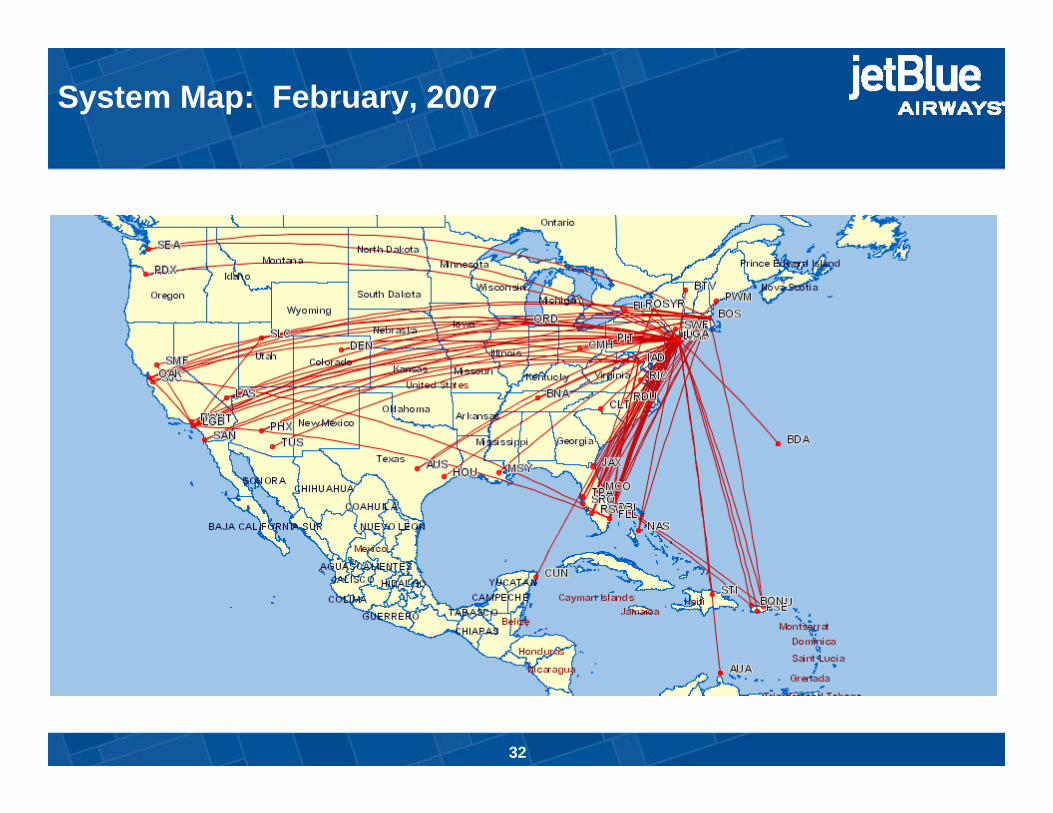
System Map: February, 2007
32
2007 goals: planning
- Execute to the core plan− Continue to add new destinations to JFK, building presence and connectivity− Grow frequency and destinations from existing focus cities− Maintain focus on operational efficiency
- Build on our strength as unsustainable capacity is cancelled
- Stay nimble
33
Roadmap to success
- JetBlue has all the elements of a winning strategic position:− Low cost structure− Largest low-cost carrier in the biggest air travel market in the world− Beloved by customers, and able to achieve revenue premiums
34
Rick Zeni
VP Revenue Management
35
• - Revenue Management Philosophy• - Fare Structure• - New Market Pricing• - Fare Increases• - Data and Analytics
Revenue management at JetBlue
36
68
-1
20 20
2523 24 24 25 25
5 6
-5
17
9
16
1315
19
24 23
-2 -2
-4
-2
-9-8 -8
-7
-4
0-1
-15
-10
-5
0
5
10
15
20
25
30
Janua
ry
Febru
ary
March
April
May
June
July
August
Septem
ber
October
Novem
ber
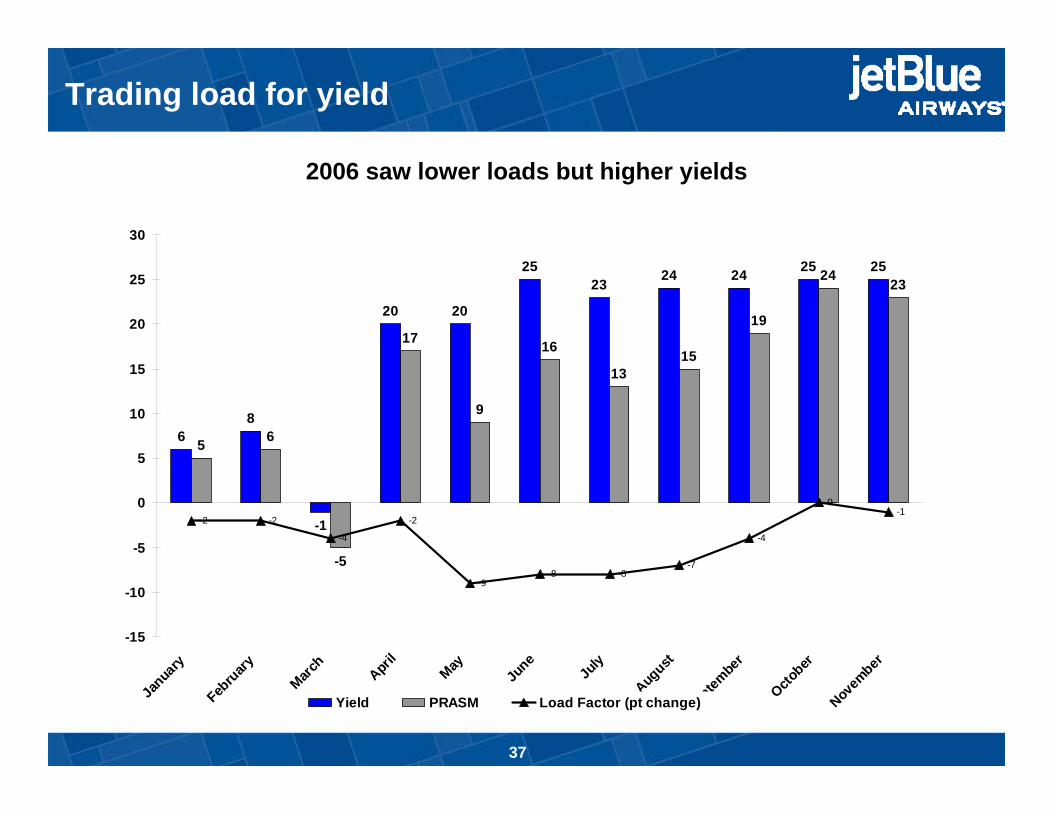
Yield PRASM Load Factor (pt change)
2006 saw lower loads but higher yields
Trading load for yield
37
Arial 14 bold –dark blue font
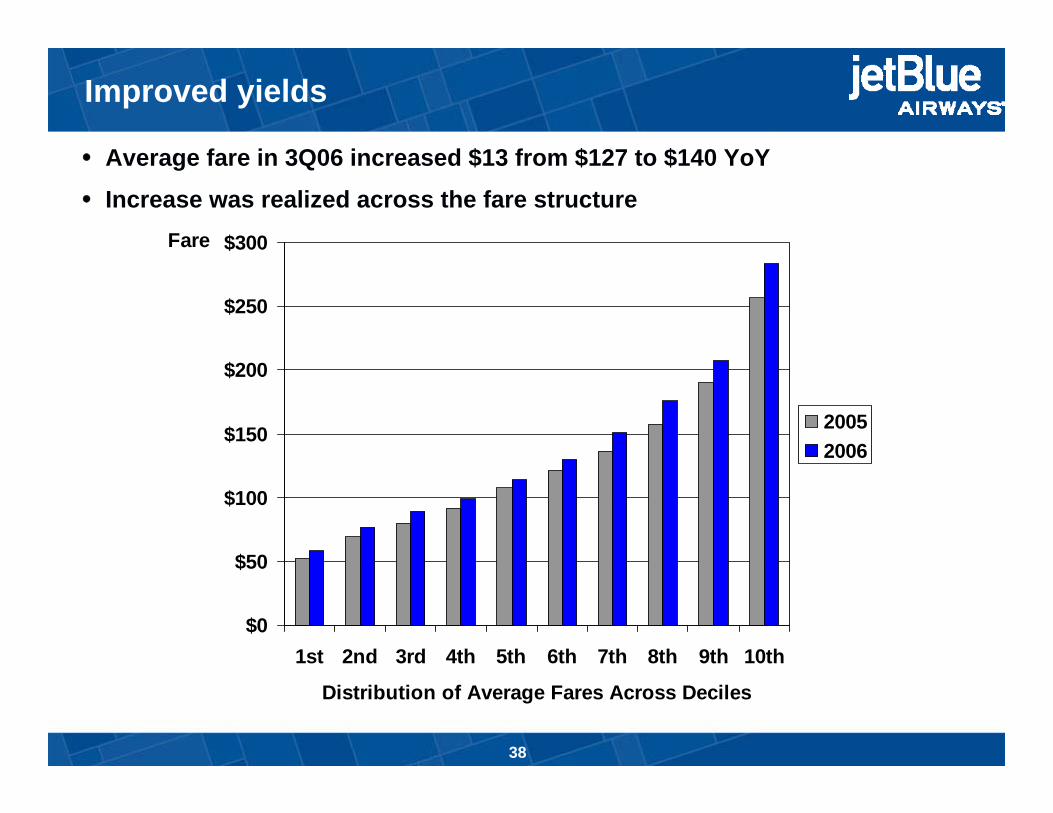
Improved yields
Average fare in 3Q06 increased $13 from $127 to $140 YoY
Increase was realized across the fare structure
$0
$50
$100
$150
$200
$250
$300
1st 2nd 3rd 4th 5th 6th 7th 8th 9th 10th
Distribution of Average Fares Across Deciles
Fare
20052006
38
Arial 14 bold –dark blue font
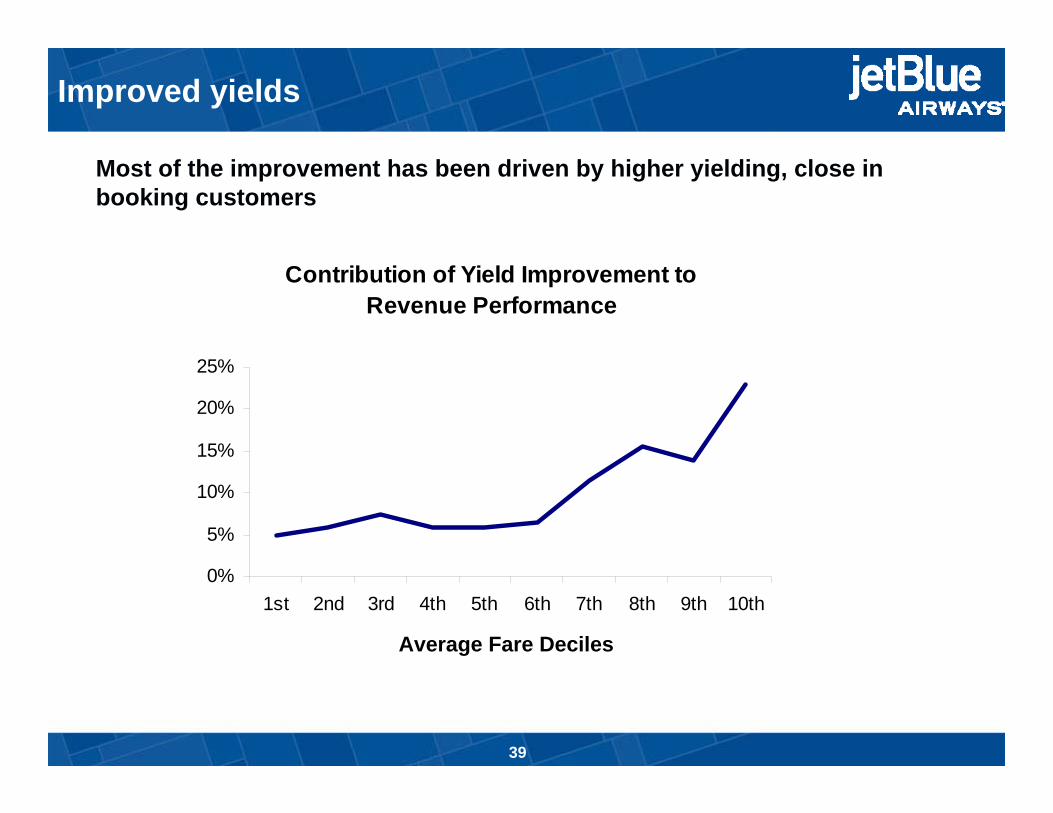
Improved yields
• Most of the improvement has been driven by higher yielding, close in booking customers
Contribution of Yield Improvement to Revenue Performance
0%
5%
10%
15%
20%
25%
1st 2nd 3rd 4th 5th 6th 7th 8th 9th 10th
Average Fare Deciles
39
Arial 14 bold –dark blue font
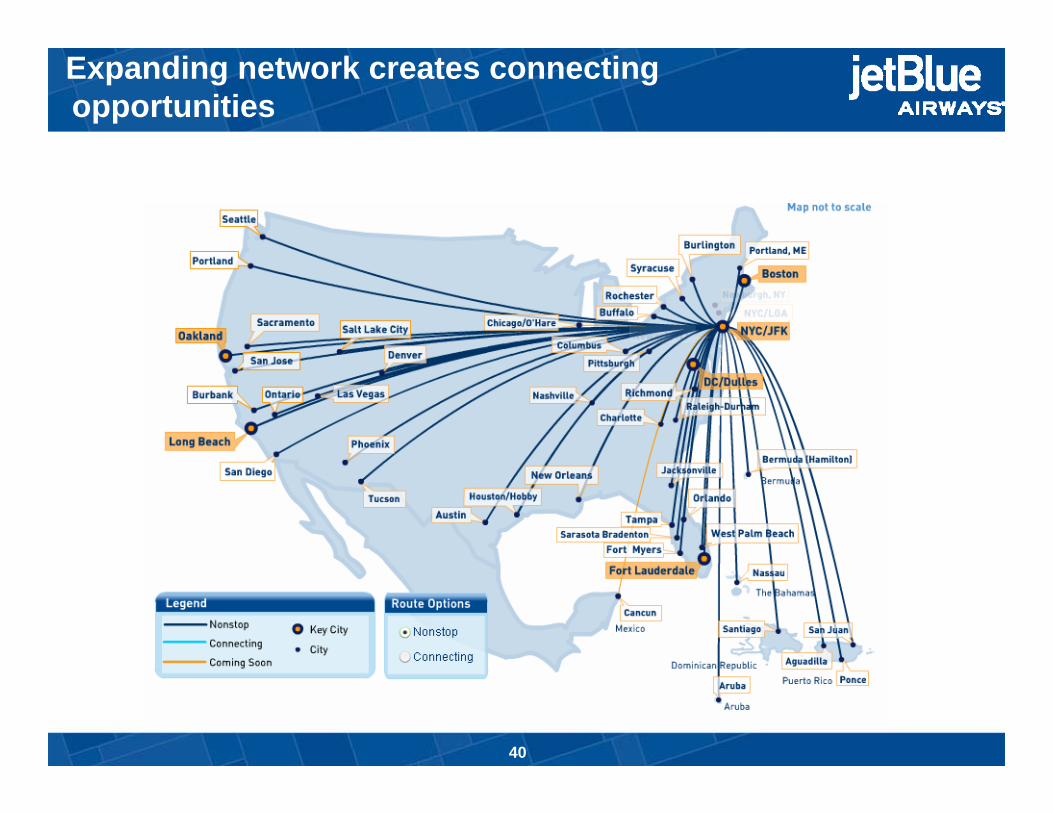
Expanding network creates connecting opportunities
40
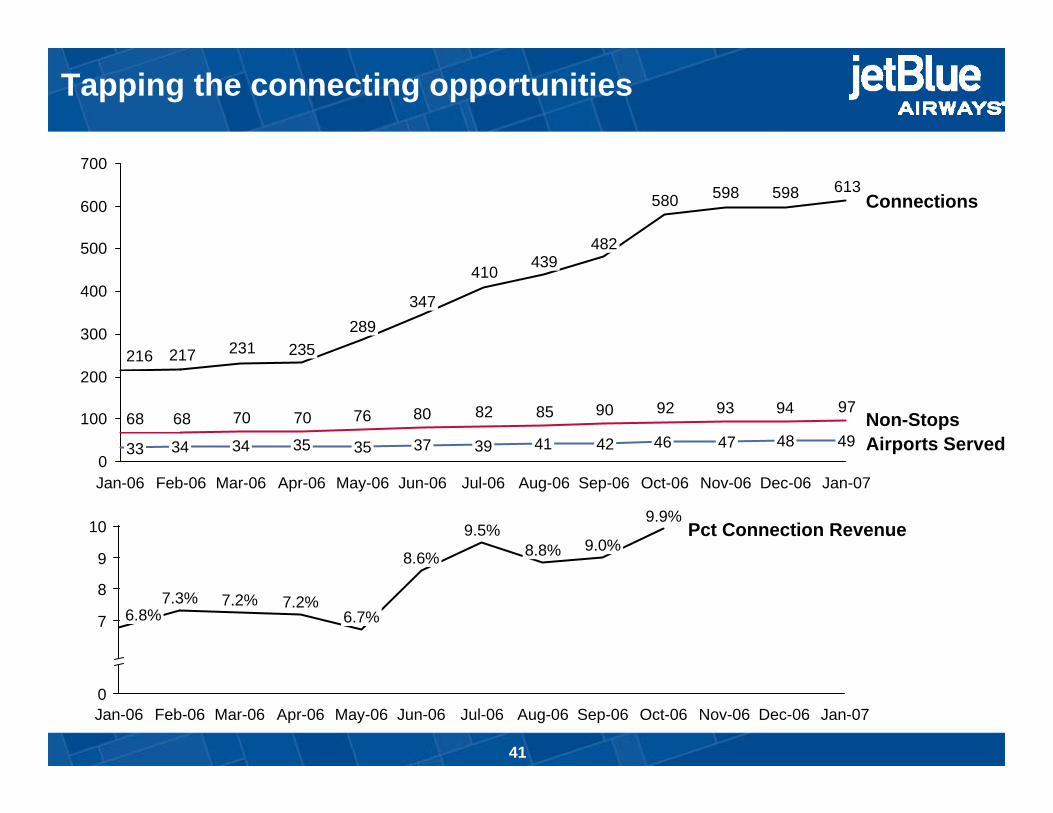
Arial 14 bold –dark blue font
613598598580
410
231217216
97949392908582807670706868
0
100
200
300
400
500
600
700
Jan-06
34
Feb-06
34
Mar-06
35
235
Apr-06
35
289
May-06
37
347
Jun-06
39
Jul-06
33
439
Aug-06
42
482
Sep-06
46
Oct-06
47
Nov-06
48
Dec-06
49
Jan-07
Airports Served
Connections
Non-Stops41
Jul-06
8.8%
Aug-06
9.0%
Sep-06
9.9%
Oct-06 Nov-06 Dec-06 Jan-070
10
7
8
9
6.8%
Jan-06
7.3%
Feb-06
7.2%
Mar-06
7.2%
Apr-06
6.7%
May-06
8.6%
Jun-06
9.5% Pct Connection Revenue
Tapping the connecting opportunities
41
Tim Claydon
SVP, Sales & Marketing
42
Marketing – 2007 priorities
- Ensure protection of the Brand- Making sure the product is as relevant and fresh as it was 7 years ago
- Extend the Brand message- Profitable partnerships, American Express, DirecTV, XM Radio,
Dunkin’ Donuts- Increase Ancillary Revenue
- TrueBlue/American Express/Other- Hotel/Car/Cruises
- Optimize Distribution- jetblue.com- Other Channels – GDS, Corporate Market
43
Marketing - distribution
- GDS- Now in all four major GDS’s: Sabre, Galileo, Worldspan, Amadeus
- >$100m in incremental revenue for 2007- Seeing significant premiums to average of $35 one-way- Midweek booking strength- Closer in bookings- Hitting the corporate customer
- OTA’s- Continue to have productive discussions with OTA’s- Similar profile to JetBlue.com customer
- CompanyBlue- 2006 revenue has doubled and is targeted to double again in 2007.- 740 active accounts- Little attrition due to GDS involvement - With profile similar to that of GDS bookings
44
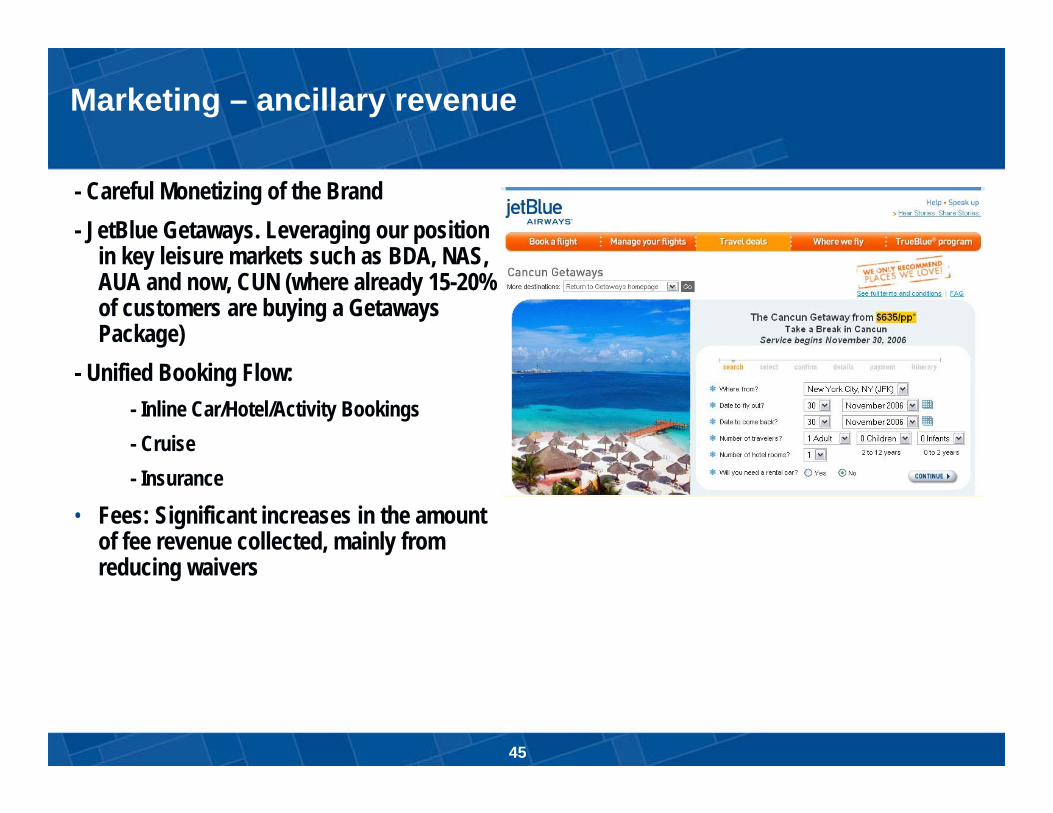
Marketing – ancillary revenue
- Careful Monetizing of the Brand- JetBlue Getaways. Leveraging our position
in key leisure markets such as BDA, NAS, AUA and now, CUN (where already 15-20% of customers are buying a Getaways Package)
- Unified Booking Flow:- Inline Car/Hotel/Activity Bookings- Cruise- Insurance
• Fees: Significant increases in the amount of fee revenue collected, mainly from reducing waivers
45
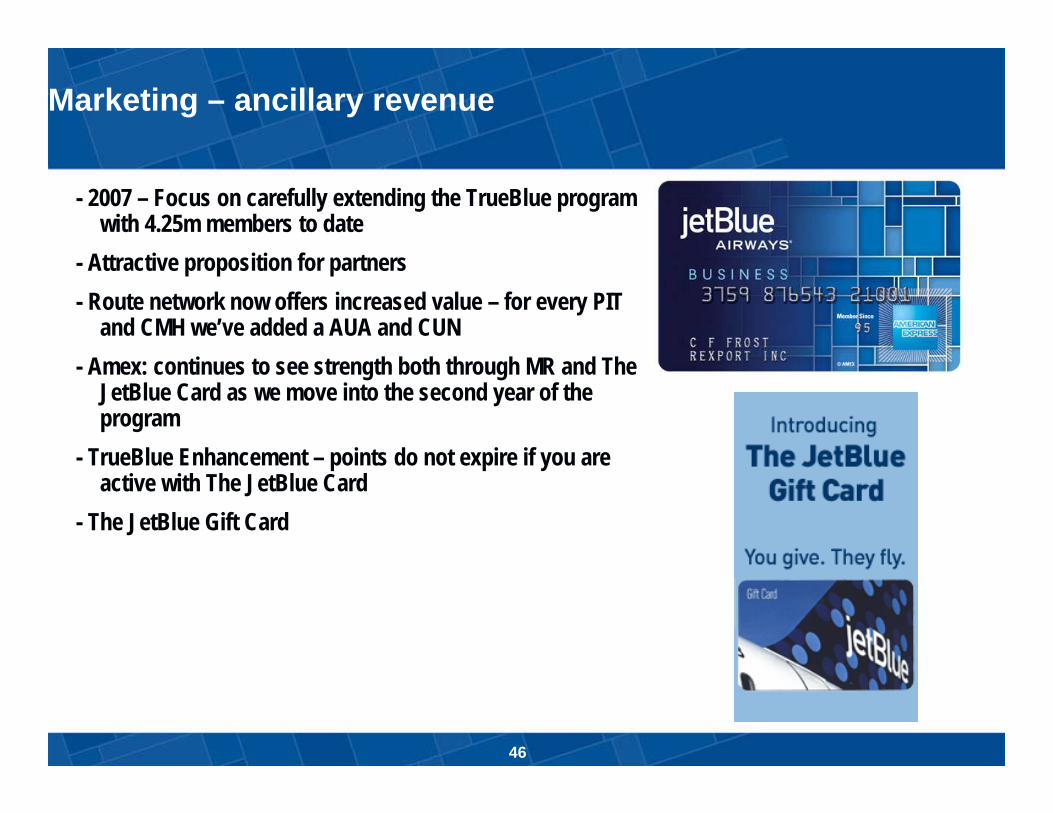
Marketing – ancillary revenue
- 2007 – Focus on carefully extending the TrueBlue program with 4.25m members to date
- Attractive proposition for partners- Route network now offers increased value – for every PIT
and CMH we’ve added a AUA and CUN- Amex: continues to see strength both through MR and The
JetBlue Card as we move into the second year of the program
- TrueBlue Enhancement – points do not expire if you are active with The JetBlue Card
- The JetBlue Gift Card
46
Marketing –other partnerships
- Partnerships with progressive Brands, joint promotion and exposure opportunities- Significant PR value
47
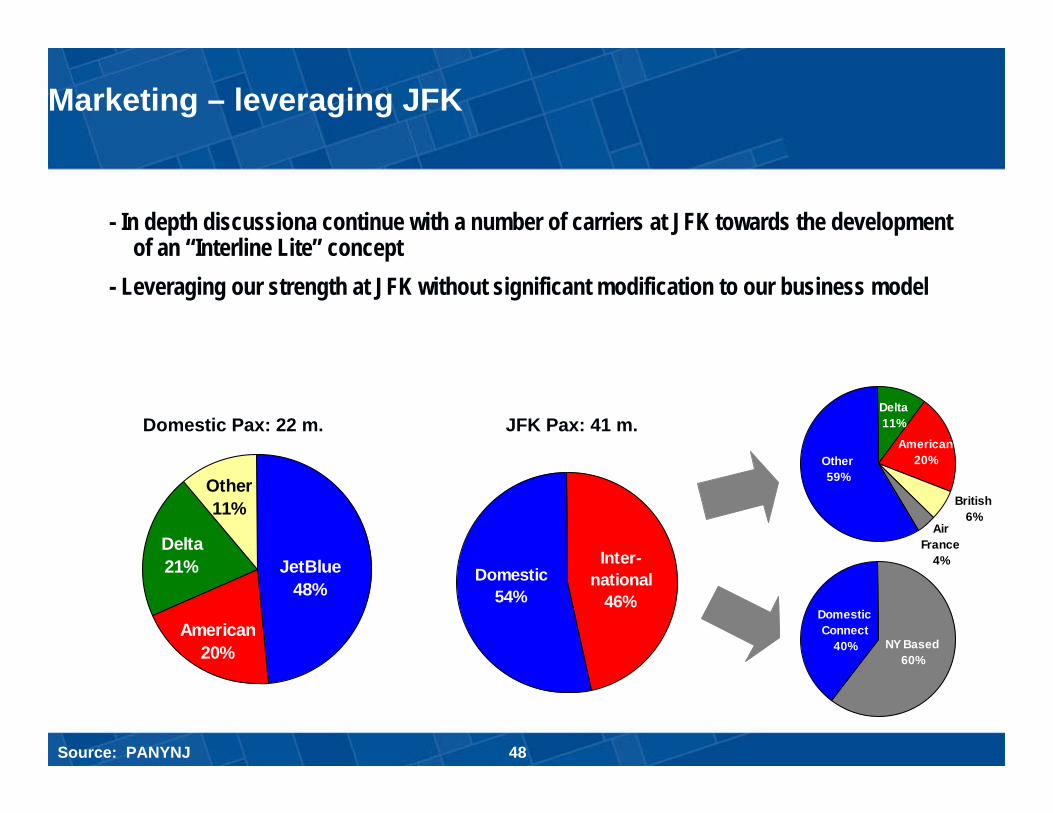
Inter-national
46%Domestic
54%
Other11%
Delta21%
American20%
JetBlue48%
Marketing – leveraging JFK
- In depth discussiona continue with a number of carriers at JFK towards the development of an “Interline Lite” concept
- Leveraging our strength at JFK without significant modification to our business model
Domestic Pax: 22 m. JFK Pax: 41 m.
DomesticConnect
40% NY Based60%
Other59%
Delta11%
American20%
British6%
Air France
4%
Source: PANYNJ 48
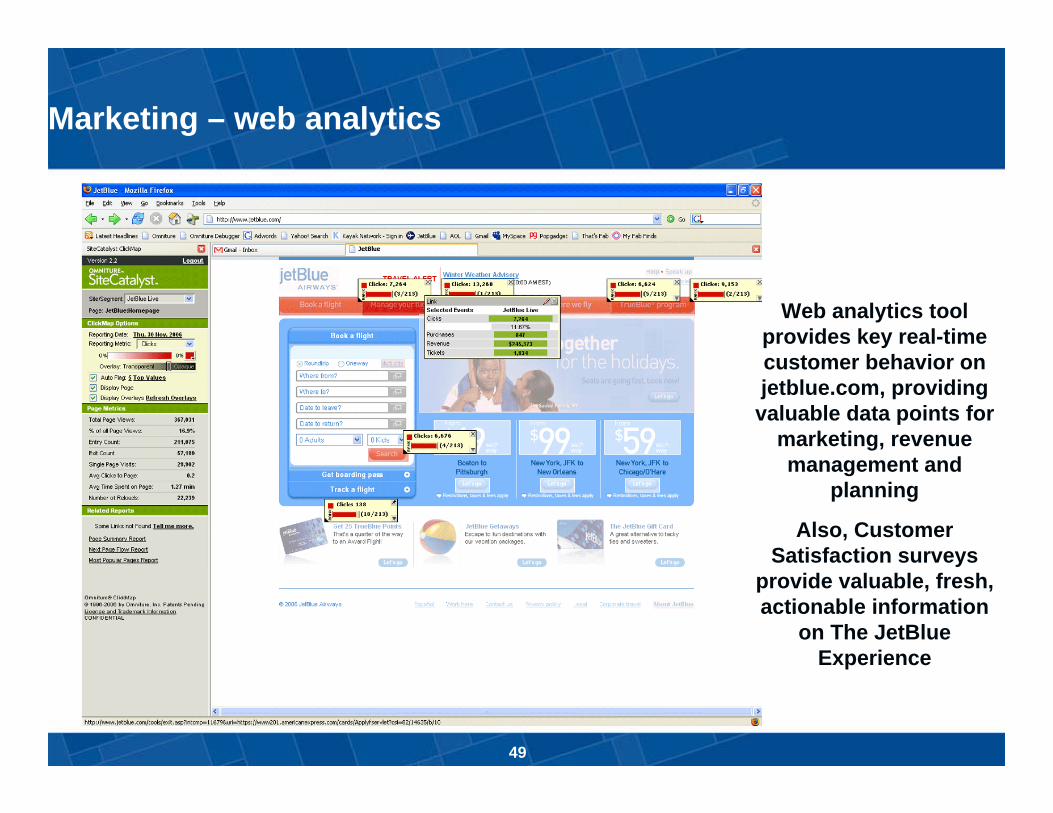
Marketing – web analytics
Web analytics tool provides key real-time customer behavior on jetblue.com, providing valuable data points for
marketing, revenue management and
planning
Also, Customer Satisfaction surveys
provide valuable, fresh, actionable information
on The JetBlue Experience
49
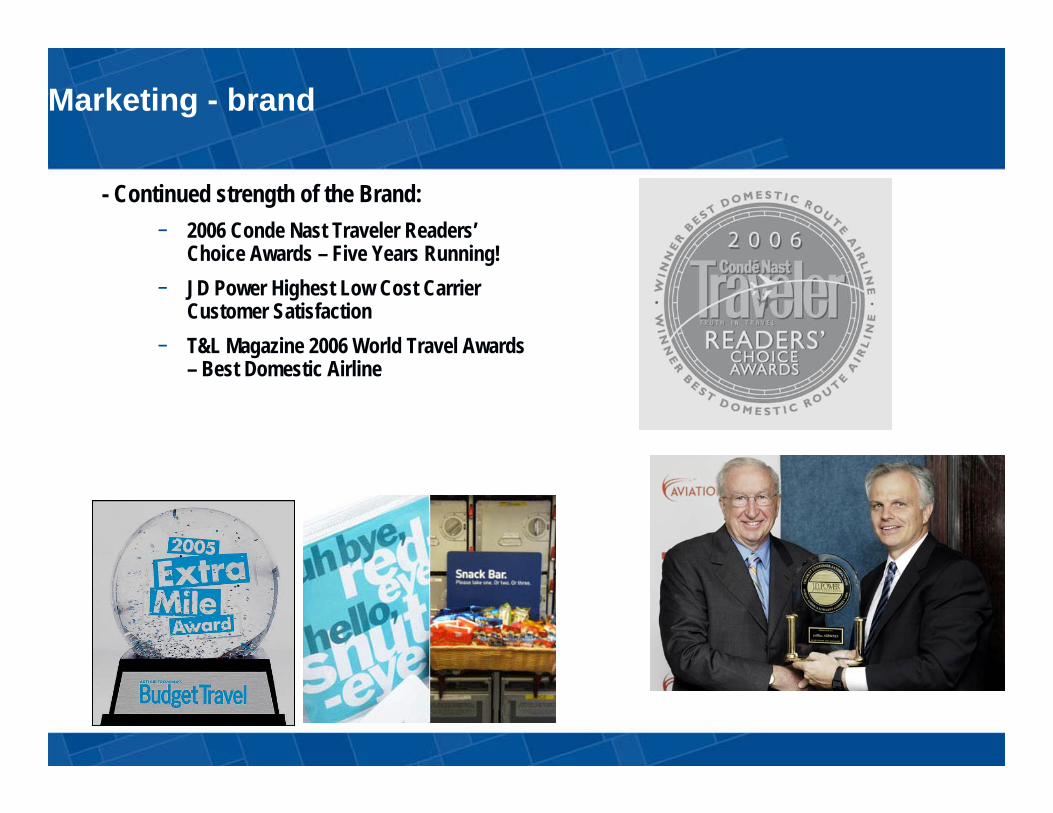
Marketing - brand
- Continued strength of the Brand:− 2006 Conde Nast Traveler Readers’
Choice Awards – Five Years Running!− JD Power Highest Low Cost Carrier
Customer Satisfaction− T&L Magazine 2006 World Travel Awards
– Best Domestic Airline
John Harvey, CFO
50
- Develop a sustainable low cost structure to drive bottom-line earnings
- Slow growth to improve free cash flow defecit
- Build cash ‘war chest’ to develop position of strength
Finance goals
51
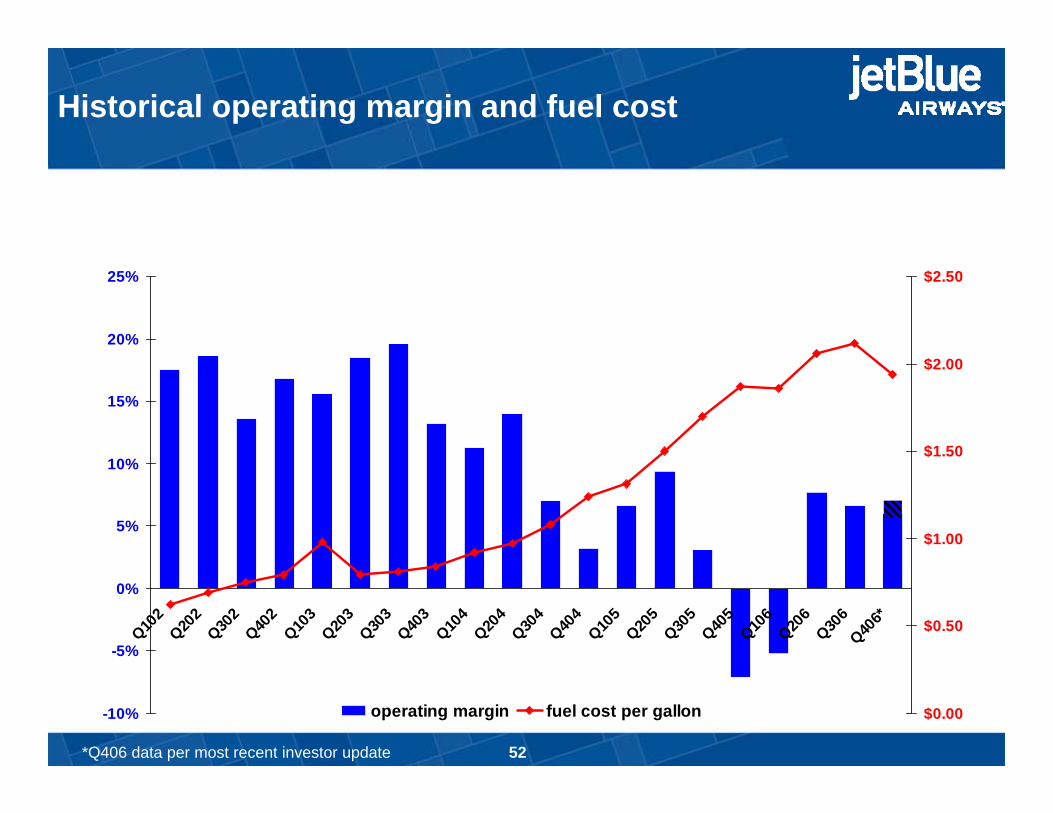
-10%
-5%
0%
5%
10%
15%
20%
25%
Q102
Q202
Q302
Q402
Q103
Q203
Q303
Q403
Q104
Q204
Q304
Q404
Q105
Q205
Q305
Q405
Q106
Q206
Q306
Q406*
$0.00
$0.50
$1.00
$1.50
$2.00
$2.50
operating margin fuel cost per gallon
*Q406 data per most recent investor update
Historical operating margin and fuel cost
52
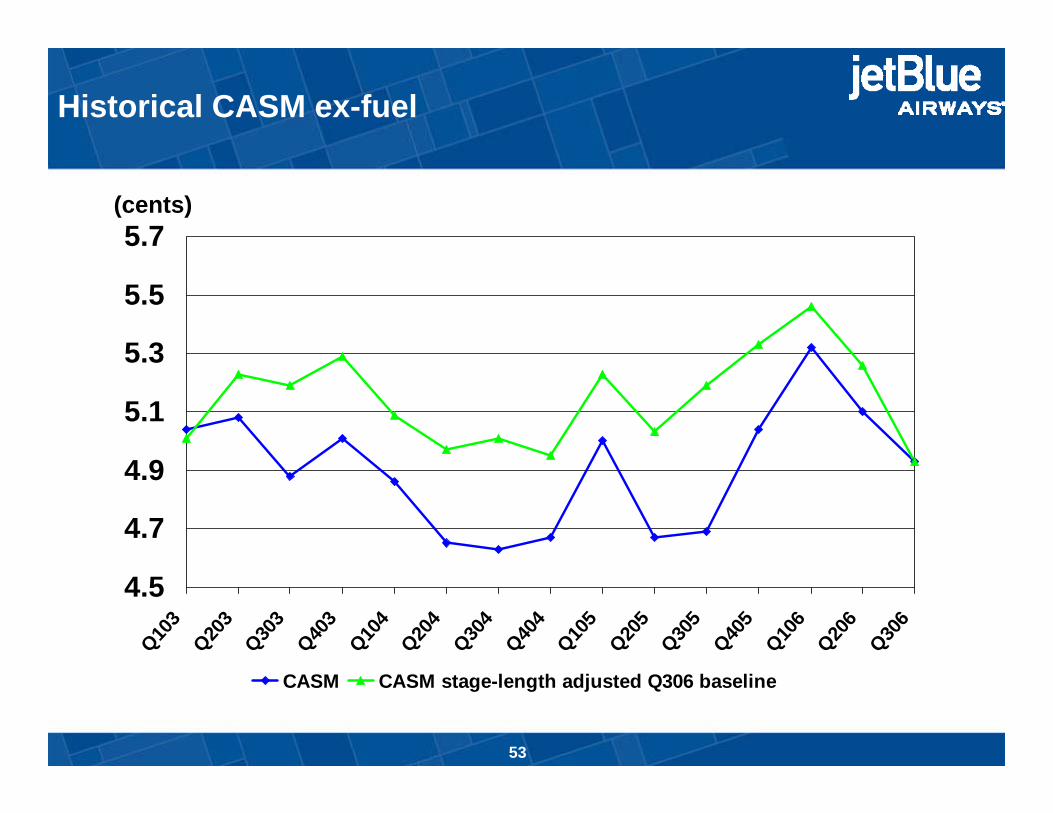
4.5
4.7
4.9
5.1
5.3
5.5
5.7
Q103
Q203
Q303
Q403
Q104
Q204
Q304
Q404
Q105
Q205
Q305
Q405
Q106
Q206
Q306
CASM CASM stage-length adjusted Q306 baseline
(cents)
Historical CASM ex-fuel
53
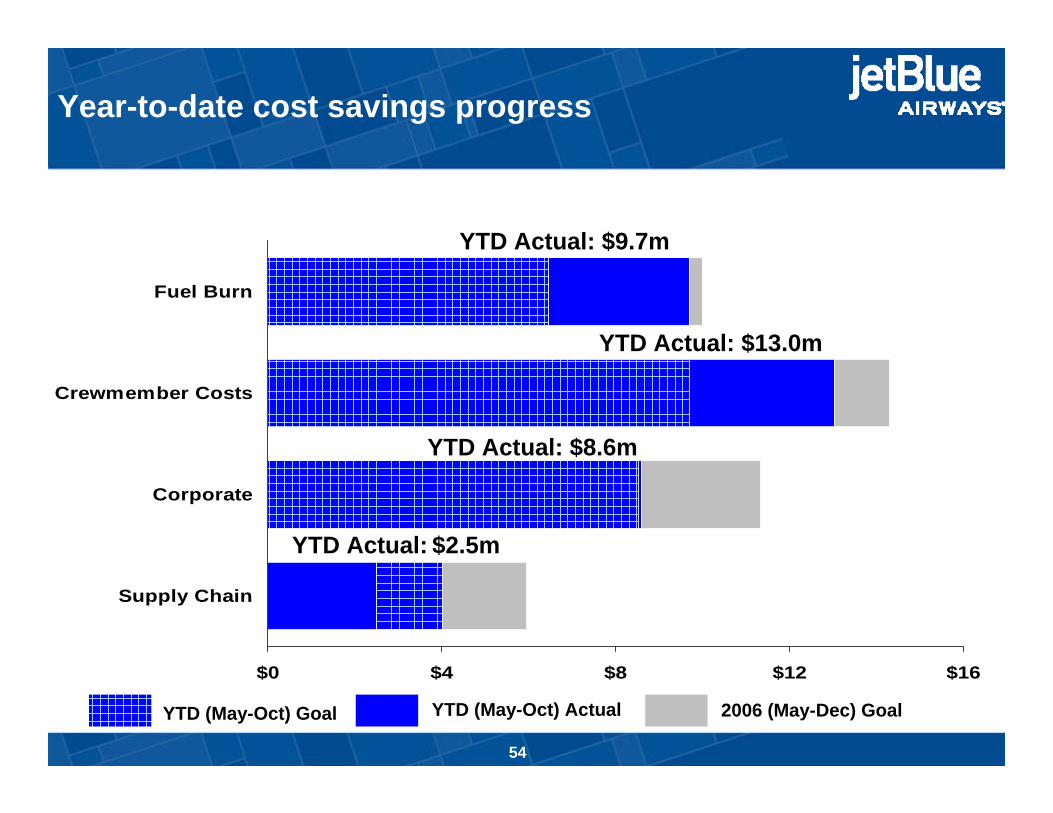
$0 $4 $8 $12 $16
Supply Chain
Corporate
Crewmember Costs
Fuel Burn
YTD Actual: $2.5m
YTD (May-Oct) Goal YTD (May-Oct) Actual 2006 (May-Dec) Goal
YTD Actual: $9.7m
YTD Actual: $13.0m
YTD Actual: $8.6m
Year-to-date cost savings progress
54
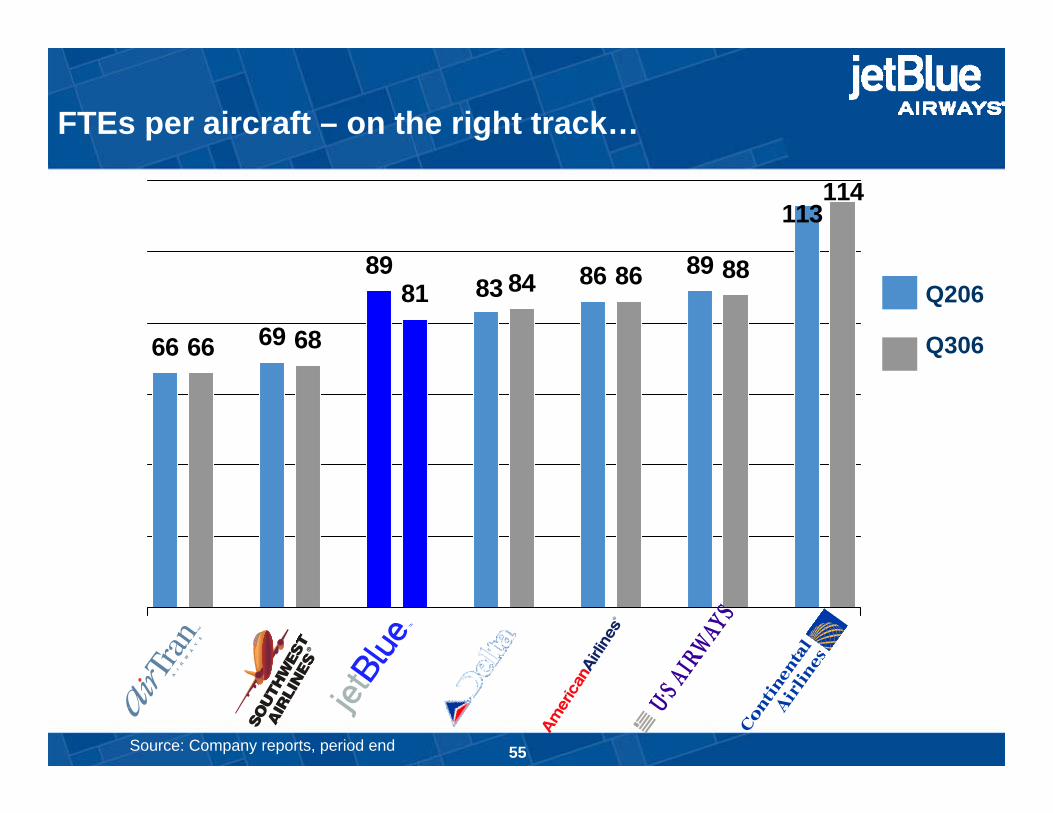
66 68
8981 84 86 88
114
66 69
83 86 89
113
FTEs per aircraft – on the right track…
Q206
Q306
Source: Company reports, period end 55
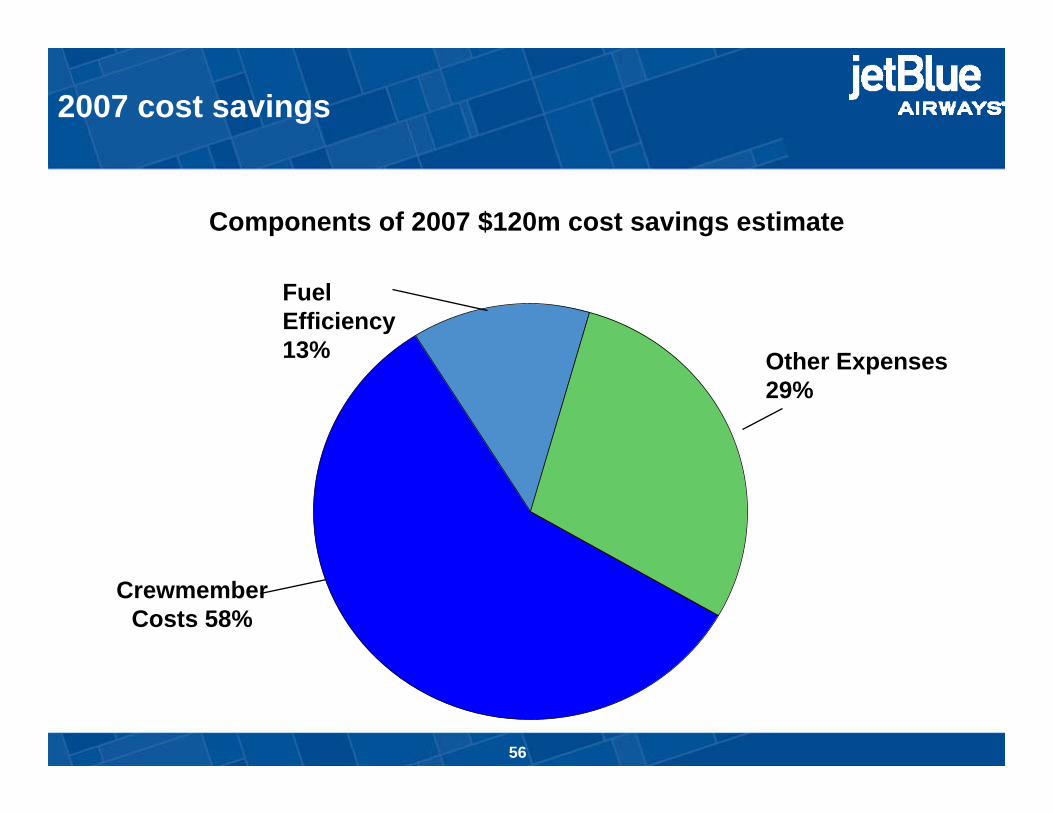
Crewmember Costs 58%
Fuel Efficiency 13% Other Expenses
29%
2007 cost savings
Components of 2007 $120m cost savings estimate
56
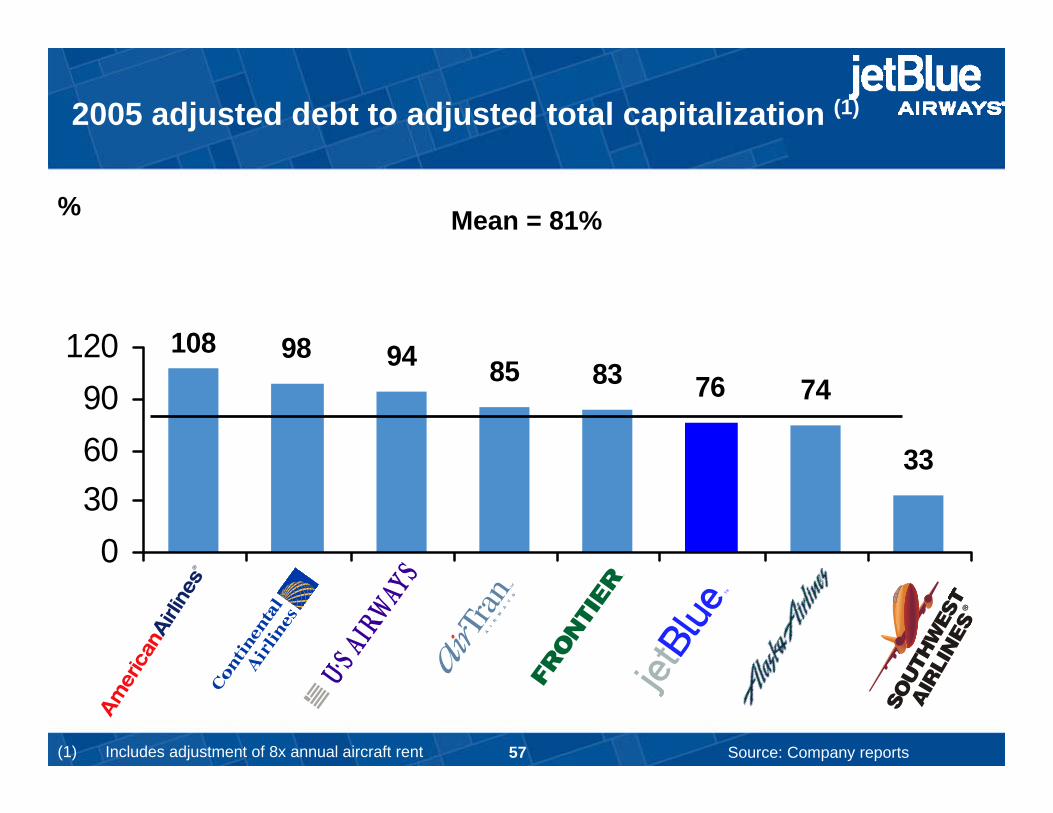
108 98 94 83 76 74
33
85
0306090
120
2005 adjusted debt to adjusted total capitalization (1)
(1) Includes adjustment of 8x annual aircraft rent
% Mean = 81%
Source: Company reports57
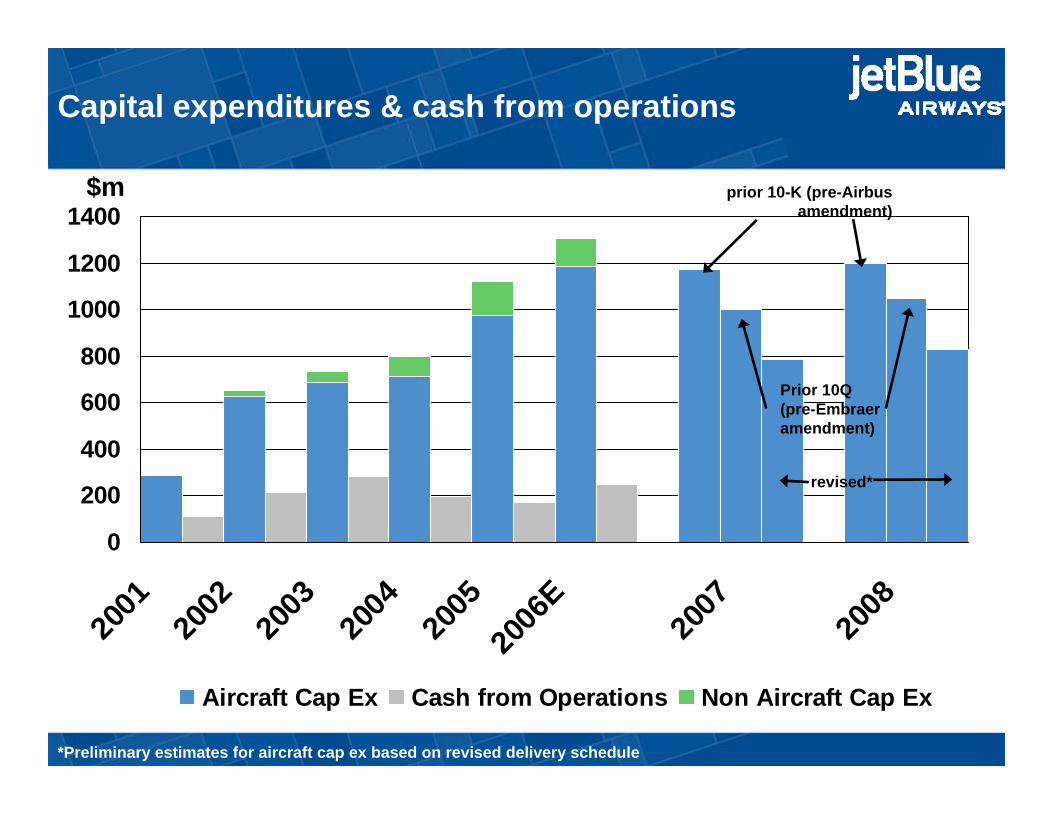
Capital expenditures & cash from operations
0
200
400
600
800
1000
1200
1400
2001
2002
2003
2004
2005
2006
E
2007
2008
Aircraft Cap Ex Cash from Operations Non Aircraft Cap Ex
$m prior 10-K (pre-Airbus amendment)
Prior 10Q (pre-Embraer amendment)
revised*
*Preliminary estimates for aircraft cap ex based on revised delivery schedule
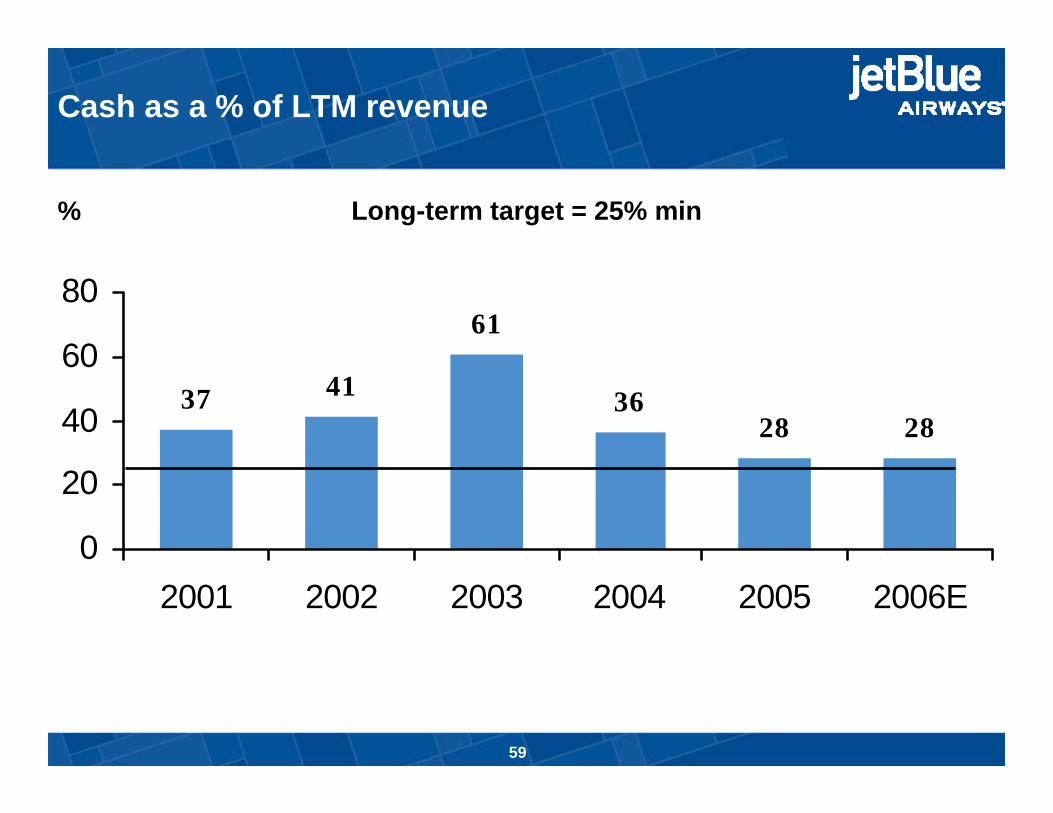
37 41
61
3628 28
0
20
40
60
80
2001 2002 2003 2004 2005 2006E
Cash as a % of LTM revenue
Long-term target = 25% min%
59
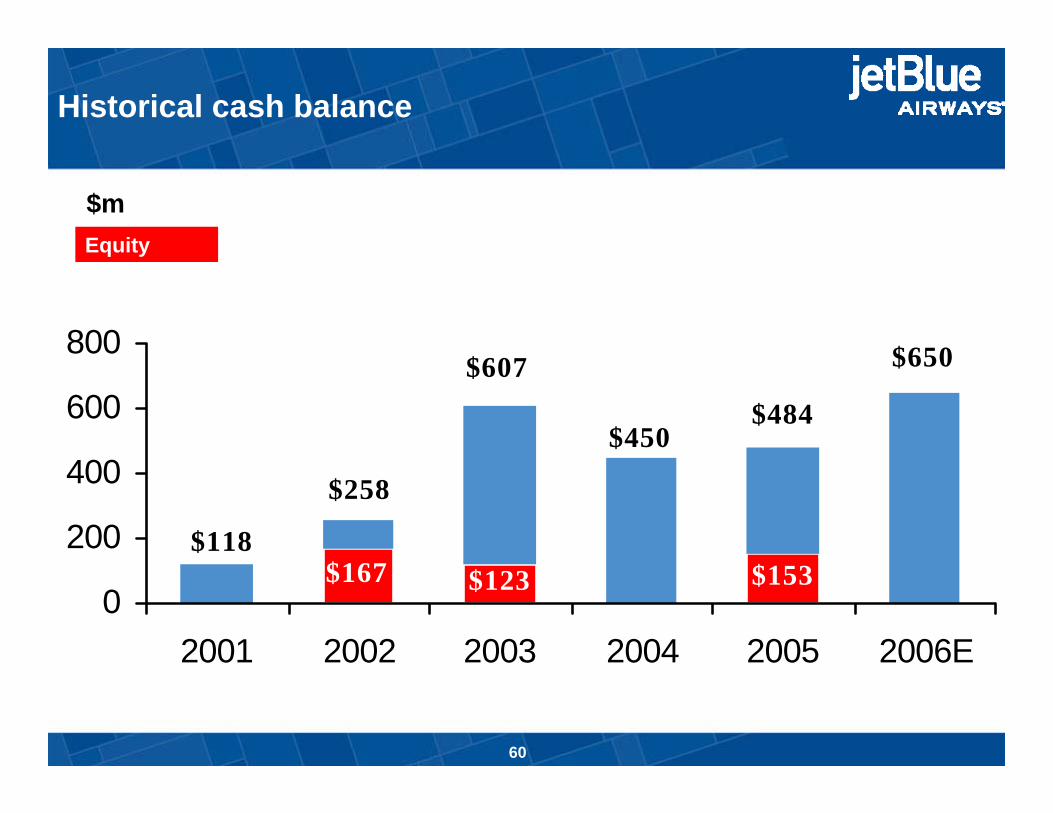
$167 $123 $153$118
$258
$607 $650
$484$450
0
200
400
600
800
2001 2002 2003 2004 2005 2006E
Historical cash balance
$mEquity
60
Dave Barger,
President & COO
61
62
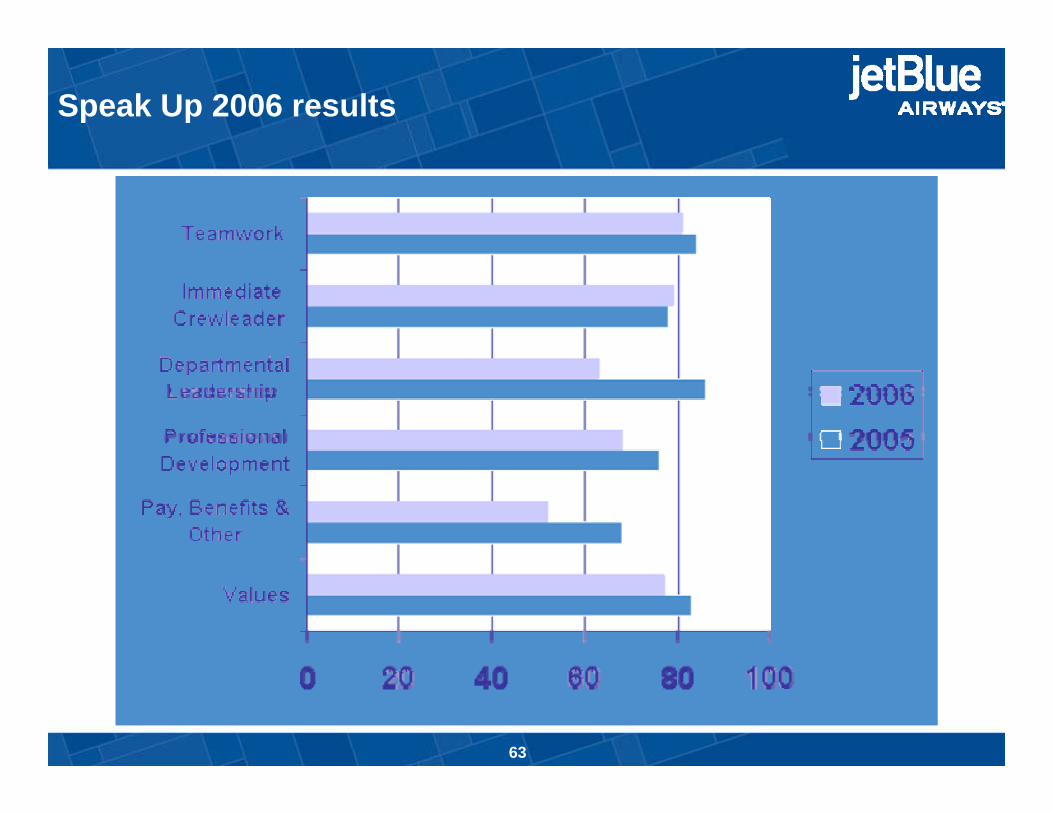
RTP: On the Right Track | Scale the Culture
Speak Up 2006 results
63
E190 reliability
I. Committee ReportsFrom entry into service until May 2006, E190 reliability had steadily improved
However, through the summer months, technical dispatch reliability (TDR) deteriorated relative to the A320
Our E190 experience is better than other operators
Utilization is 20% below plan due to TDR, length of haul and sparing philosophy
A fleet modification program to improve reliability is substantially complete
64
95.0
96.0
97.0
98.0
99.0
100.0
Janua
ryFeb
ruary
March
April
May
June
July
August
Septem
ber
October
%
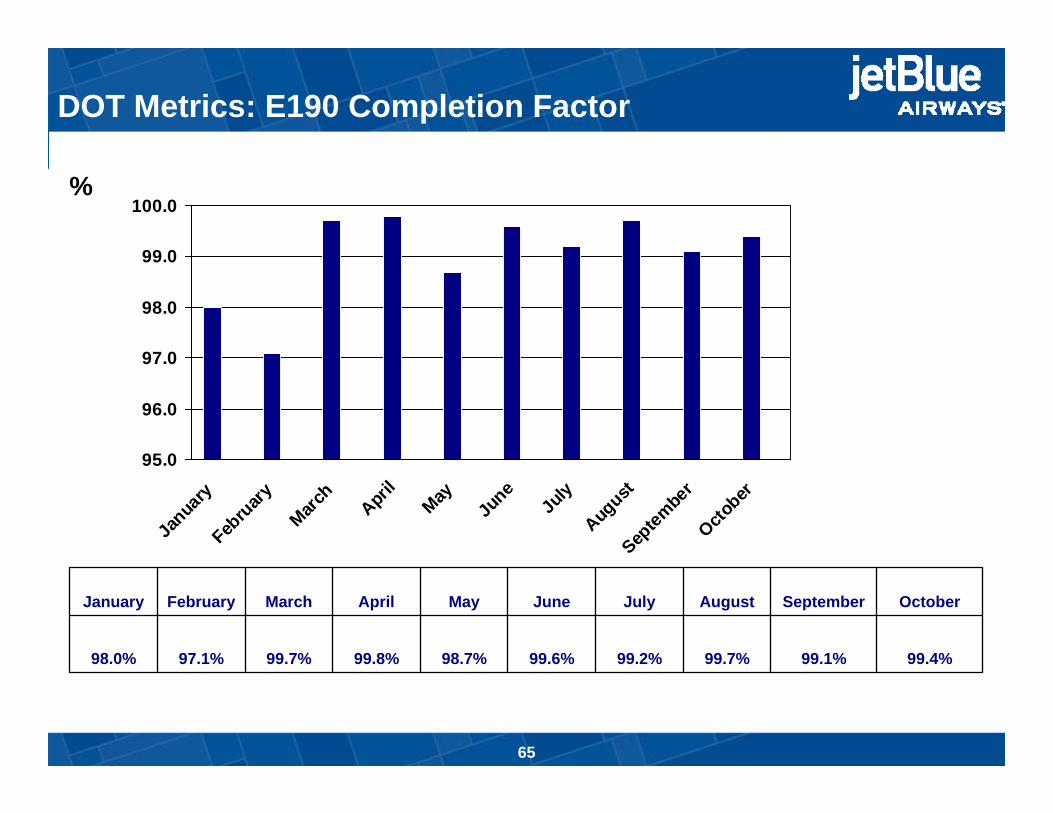
DOT Metrics: E190 Completion Factor
65
99.1%
September
99.4%99.7%99.2%99.6%98.7%99.8%99.7%97.1%98.0%
OctoberAugustJulyJuneMayAprilMarchFebruaryJanuary
40.0
50.0
60.0
70.0
80.0
90.0
Janua
ryFeb
ruary
March
April
May
June
July
August
Septem
ber
October
%
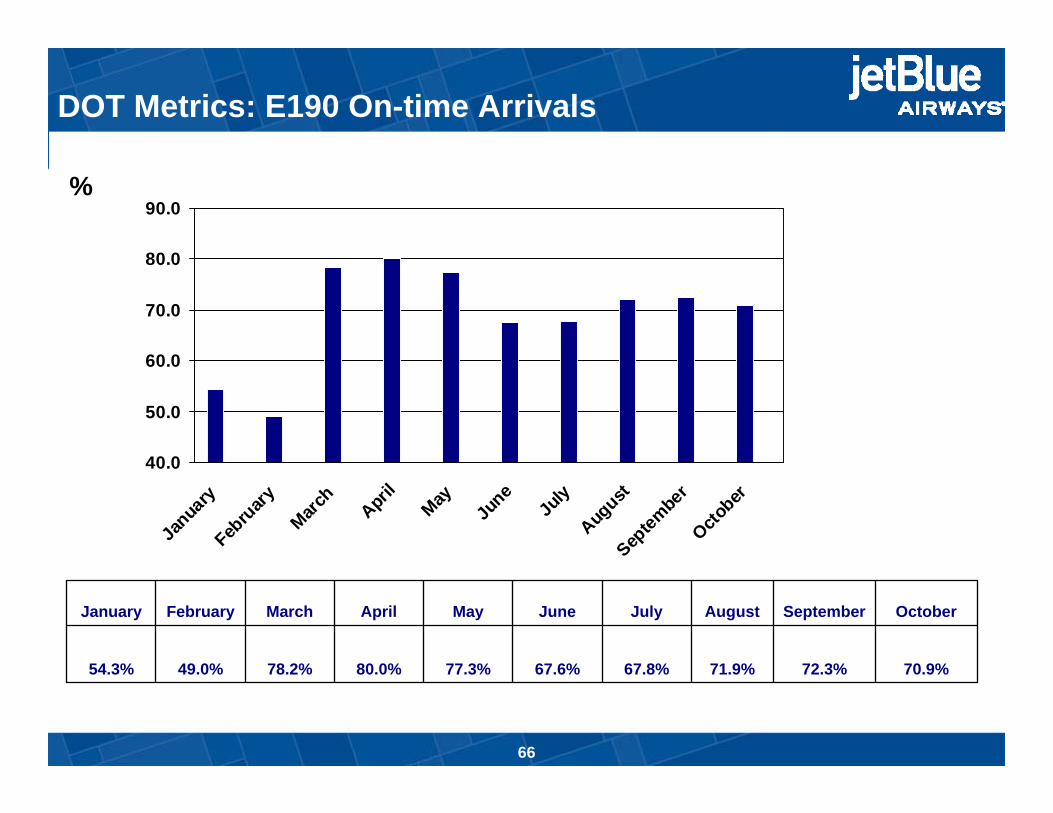
DOT Metrics: E190 On-time Arrivals
66
72.3%
September
70.9%71.9%67.8%67.6%77.3%80.0%78.2%49.0%54.3%
OctoberAugustJulyJuneMayAprilMarchFebruaryJanuary
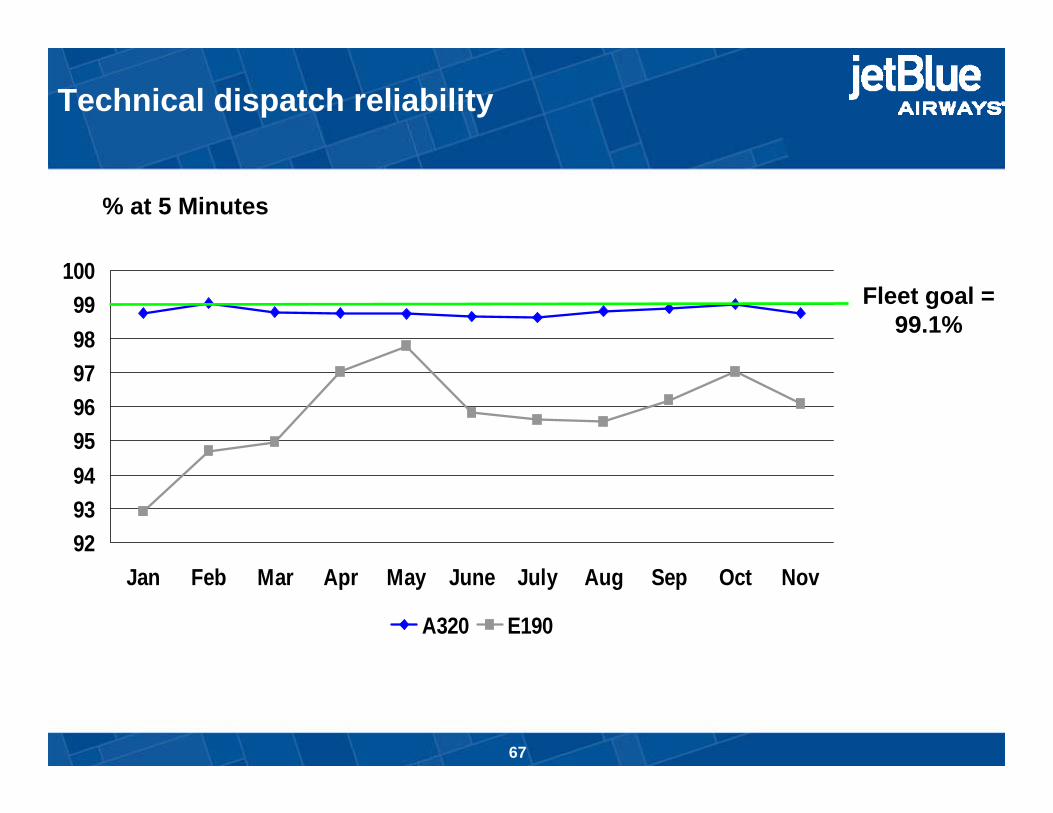
Technical dispatch reliability
9293949596979899
100
Jan Feb Mar Apr May June July Aug Sep Oct Nov
A320 E190
Fleet goal = 99.1%
% at 5 Minutes
67
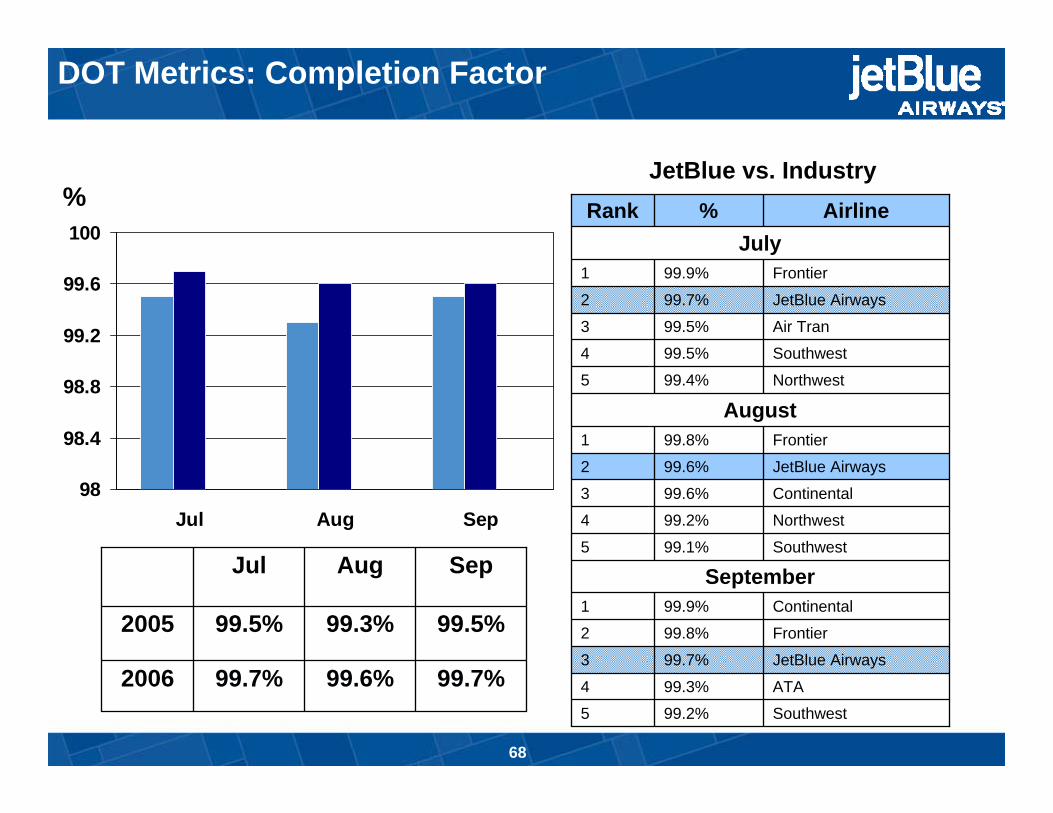
98
98.4
98.8
99.2
99.6
100
Jul Aug Sep
99.7%99.6%99.7%2006
99.5%99.3%99.5%2005
SepAugJul
%
Continental99.9%1
Frontier99.8%2
JetBlue Airways99.7%3
ATA99.3%4
Southwest99.1%5
September
Southwest99.2%5
Northwest99.2%4
Continental99.6%3
JetBlue Airways99.6%2
Frontier99.8%1
AugustNorthwest99.4%5
Southwest99.5%4
Air Tran99.5%3
JetBlue Airways99.7%2
Frontier99.9%1
JulyAirline%Rank
DOT Metrics: Completion Factor
JetBlue vs. Industry
68
0
20
40
60
80
Jul Aug Sep
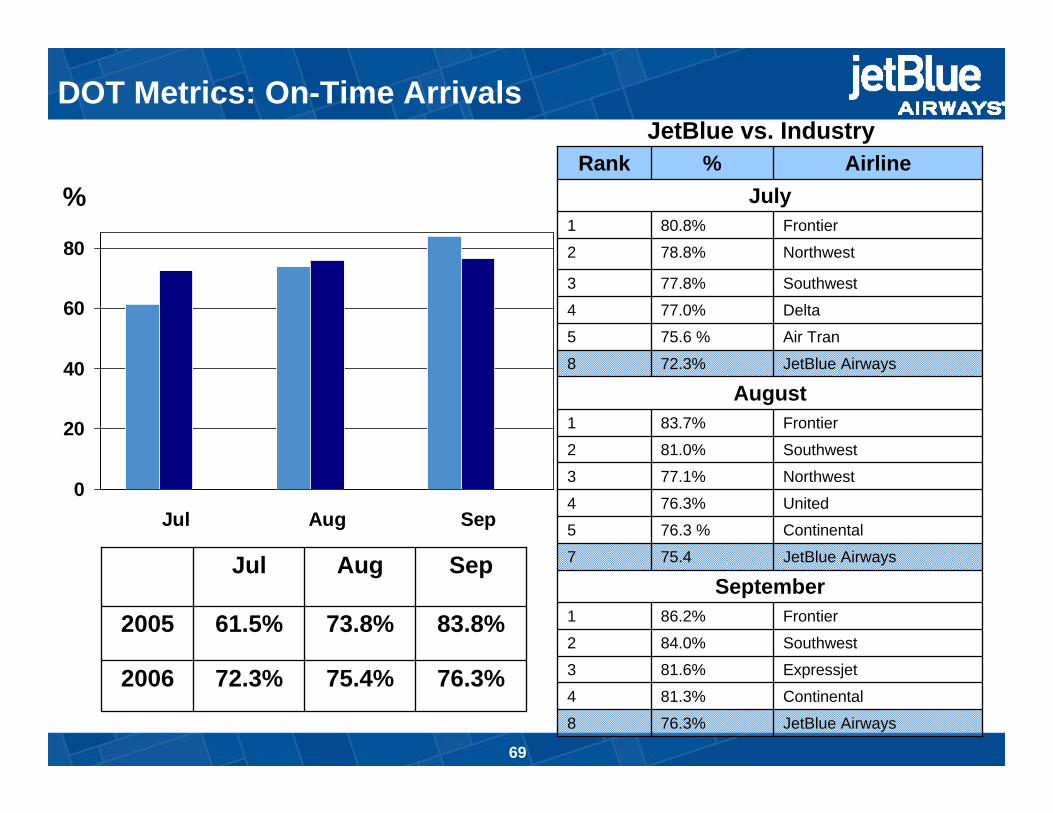
76.3%75.4%72.3%2006
83.8%73.8%61.5%2005
SepAugJul
%
Continental76.3 %5
JetBlue Airways75.47
Expressjet81.6%3
Southwest84.0%2
Frontier86.2%1
September
Continental81.3%4
Air Tran75.6 %5
JetBlue Airways76.3%8
United76.3%4
Northwest77.1%3
Southwest81.0%2
Frontier83.7%1
AugustJetBlue Airways72.3%8
Delta77.0%4
Southwest77.8%3
Northwest78.8%2
Frontier80.8%1
JulyAirline%Rank
DOT Metrics: On-Time ArrivalsJetBlue vs. Industry
69
2.40
3.20
4.00
4.80
5.60
Jul Aug Sep
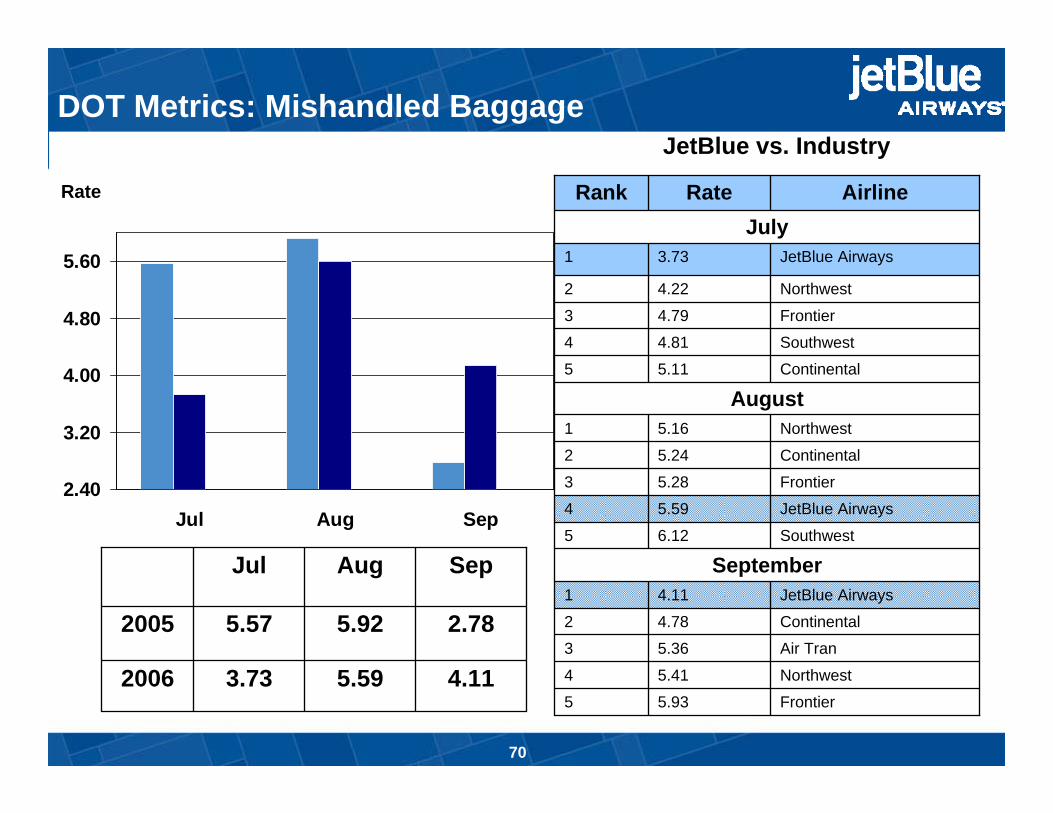
4.115.593.732006
2.785.925.572005
SepAugJul
Rate
Air Tran5.363
Continental4.782
JetBlue Airways4.111
SeptemberSouthwest6.125
Northwest5.414
Frontier5.935
JetBlue Airways5.594
Frontier5.283
Continental5.242
Northwest5.161
AugustContinental5.115
Southwest4.814
Frontier4.793
Northwest4.222
JetBlue Airways3.731
JulyAirlineRateRank
DOT Metrics: Mishandled BaggageJetBlue vs. Industry
70
0.00
0.10
0.20
0.30
0.40
0.50
0.60
Jul Aug Sep
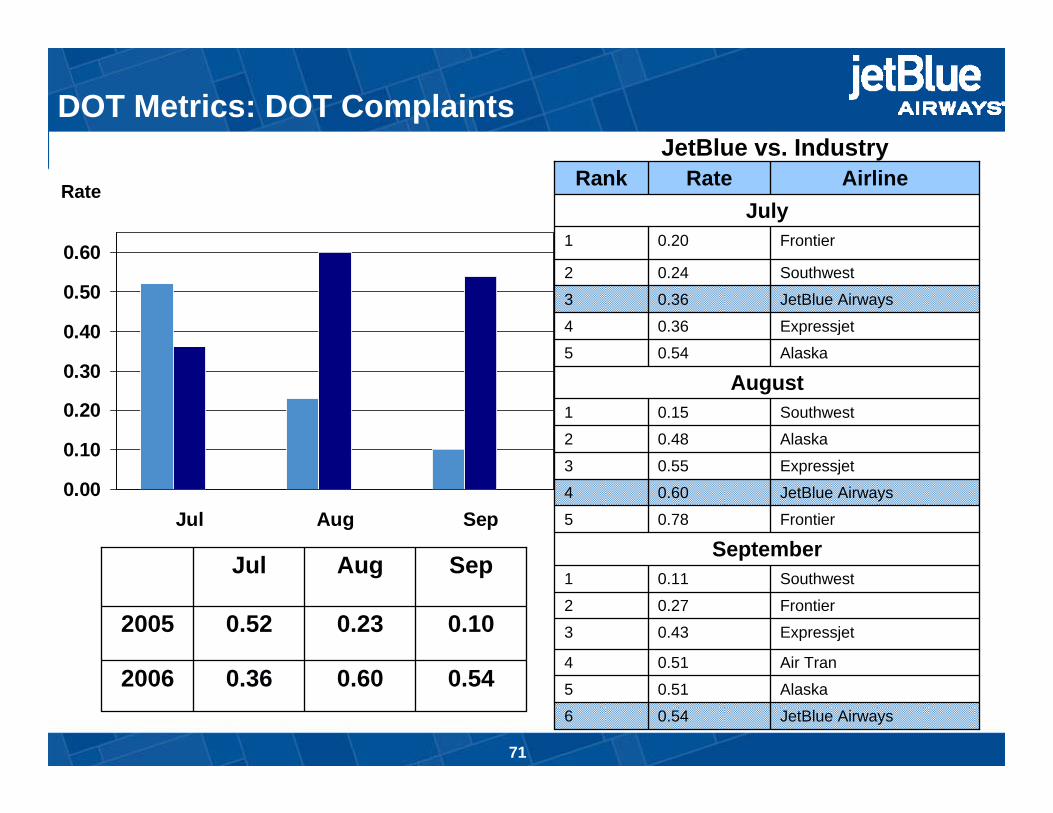
0.540.600.362006
0.100.230.522005
SepAugJul
Rate
Alaska0.515
Expressjet0.433
Frontier0.272
Southwest0.111
SeptemberFrontier0.785
Air Tran0.514
JetBlue Airways0.546
JetBlue Airways0.604
Expressjet0.553
Alaska0.482
Southwest0.151
AugustAlaska0.545
Expressjet0.364
JetBlue Airways0.363
Southwest0.242
Frontier0.201
JulyAirlineRateRank
DOT Metrics: DOT ComplaintsJetBlue vs. Industry
71
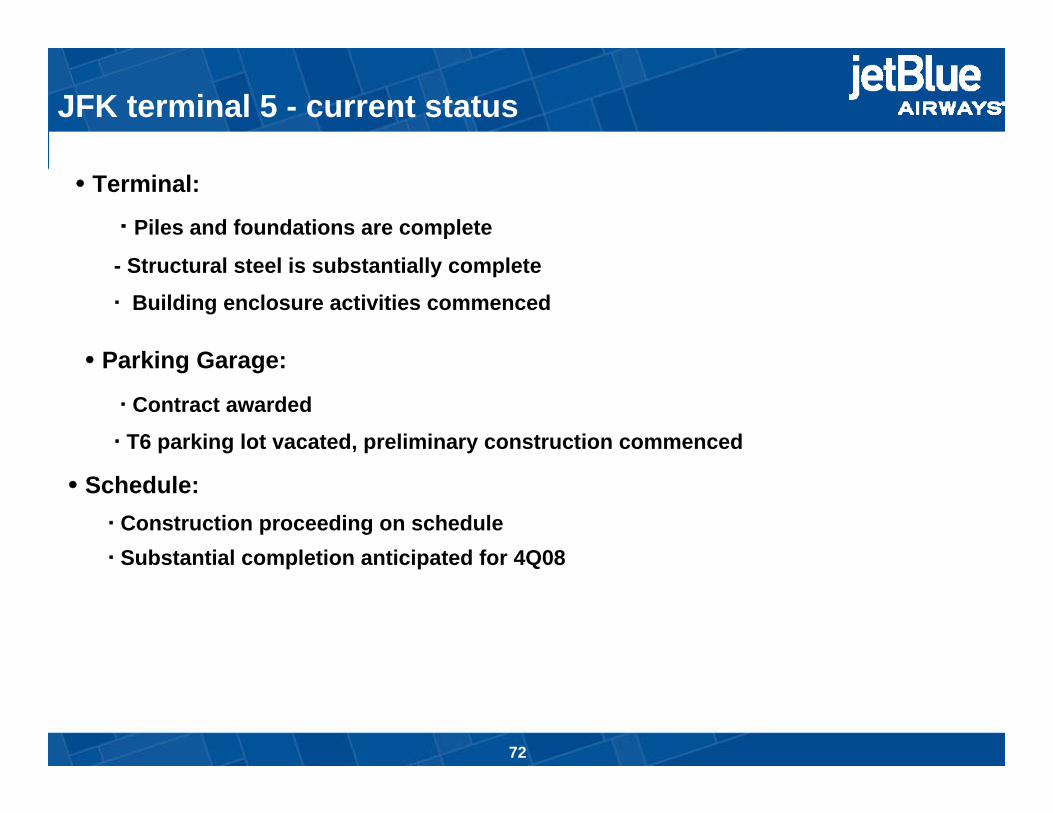
JFK terminal 5 - current status
I. Committee ReportsTerminal:
Piles and foundations are complete
- Structural steel is substantially complete
Building enclosure activities commenced
Parking Garage:
Contract awarded
T6 parking lot vacated, preliminary construction commenced
Schedule:Construction proceeding on scheduleSubstantial completion anticipated for 4Q08
72
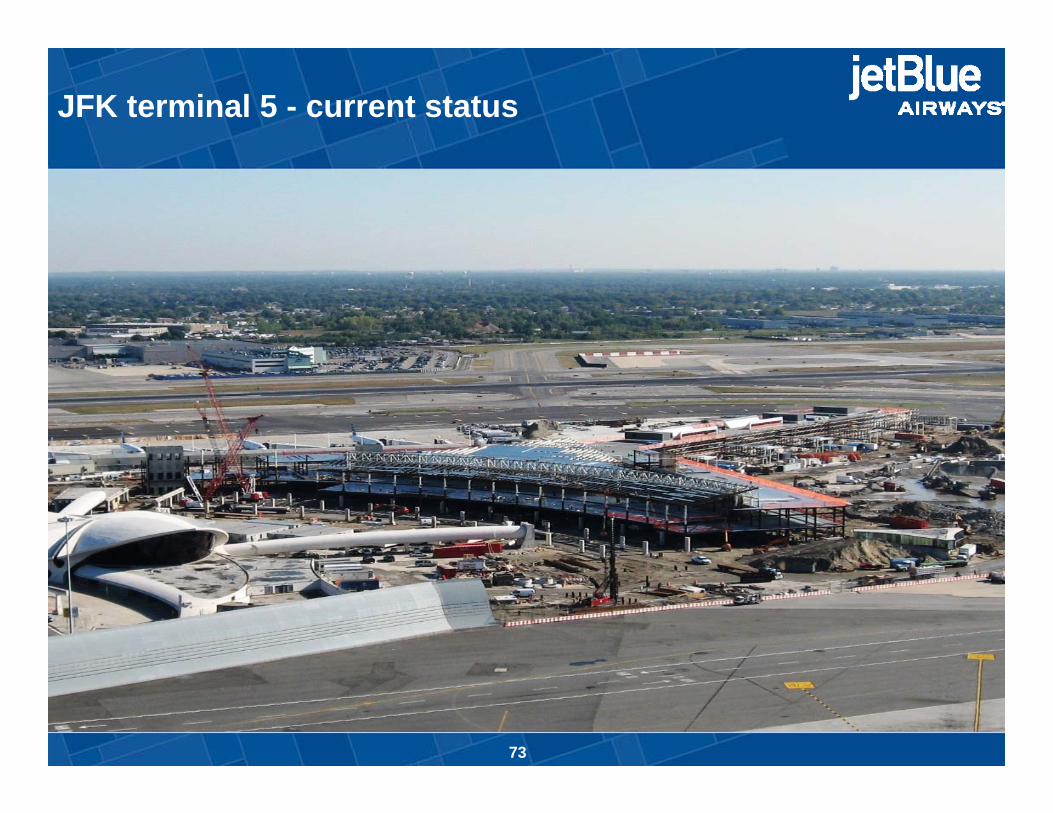
JFK terminal 5 - current status
73
JetBlue Airways
Investor Day
Lunch