Embed Size (px)
Citation preview
7/31/2019 Xu 2010 Single Muscle Fiber
http://slidepdf.com/reader/full/xu-2010-single-muscle-fiber 1/7
Analysis of Superoxide Production in SingleSkeletal Muscle Fibers
Xin Xu,† LaDora V. Thompson,‡ Marian Navratil,† and Edgar A. Arriaga*,†
Departments of Chemistry and Physical Medicine and Rehabilitation, University of Minnesota,Minneapolis, Minnesota 55455
Due to their high energetic profile, skeletal muscle fibers
are prone to damage by endogenous reactive oxygen
species (ROS), thereby causing alterations in muscle
function. Unfortunately, the complexity of skeletal muscle
makes it difficult to measure and understand ROS pro-
duction by fibers since other components (e.g., extracel-
lular collagen and vascular vessels) may also generate
ROS. Single cell imaging techniques are promising ap-
proaches to monitor ROS production in single muscle
fibers, but usually the detection schemes for ROS are not specific. Single cell analysis by capillary electrophoresis
(aka chemical cytometry) has the potential to separate and
detect specific ROS reporters, but the approach is only
suitable for small spherical cells that fit within the capil-
lary lumen. Here, we report a novel method for the
analysis of superoxide in single fibers maintained in
culture for up to 48 h. Cultured muscle fibers in indi-
vidual nanoliter-volume wells were treated with triph-
enylphosphonium hydroethidine (TPP-HE), which forms
the superoxide specific reporter hydroxytriphenylphos-
phonium ethidium (OH-TPP-E+). After lysis of each fiber
in their corresponding nanowell, the contents of each well were processed and analyzed by micellar electro-
kinetic capillary chromatography with laser-induced
fluorescence detection (MEKC-LIF) making it possible
to detect superoxide found in single fibers. Superoxide
basal levels as well as changes due to fiber treatment
with the scavenger, tiron, and the inducer, antimycin
A, were easily monitored demonstrating the feasibility
of the method. Future uses of the method include
parallel single-fiber measurements aiming at compar-
ing pharmacological treatments on the same set of
fibers and investigating ROS production in response
to muscle disease, disuse, exercise, and aging.
Reactive oxygen species (ROS) are one of the hallmarks of
multiple diseases and aging.1,2 Investigating ROS production and
their effects on skeletal muscle fibers is difficult due to the
heterogeneous and complex nature of skeletal muscle.3 This tissue
comprises different muscle fiber types with distinctive metabolic
properties,3 nerves, endothelial and blood cells,4 and extracellular
matrix, making it difficult to distinguish the unique patterns of
ROS production in each specific fiber type.5,6
Single cell analysis techniques are usually adequate to meet
bioanalytical demands imposed by sample heterogeneity and
complexity in biological systems.7 Among these, chemical cytom-
etry has been used to electrophoretically separate the contents
of individual cells.8-11 When using these techniques, small
spherical cells (or their contents) are completely injected into a
narrow-bore capillary for analysis.12,13 These techniques cannot
be used to analyze muscle fibers due to their morphological
properties (cylindrical and elongated) and dimensions (i.e., ∼100
µm diameter and ∼2.8 nL volume for isolated soleus muscle
fibers). One approach to analyze nonspherical cells is the use of
small vials (150 nL to 750 µL volume).14-16 This approach has
been used in the analysis of single neurons contents.15,16 Unfor-
tunately, skeletal muscle fibers are smaller than neurons (e.g.,
∼300 µm diameter, ∼14.1 nL volume),15 making it difficult to
handle them and place them into vials directly for processing. To
analyze samples smaller than the neurons, several studies have
reported the use of picoliter wells in the analysis of single
mammalian cells.17,18 In this study, we apply similar strategies
for single skeletal muscle fiber analysis by using 60-nL nanowells.
* Corresponding author. E-mail: [email protected]. Tel.: 1-612-624-8024. Fax:
1-612-626-7541.† Department of Chemistry.‡ Department of Physical Medicine and Rehabilitation.
(1) Finkel, T.; Holbrook, N. J. Nature 2000, 408, 239–47.(2) Raha, S.; Robinson, B. H. Trends Biochem. Sci. 2000, 25 , 502–8.(3) Gollnick, P. D.; Matoba, H. Histochemistry 1984, 81, 379–83.
(4) van der Poel, C.; Edwards, J. N.; Macdonald, W. A.; Stephenson, D. G.
Am. J. Physiol. Cell Physiol. 2007, 292 , C1353–60.(5) Powers, S. K.; Criswell, D.; Lawler, J.; Ji, L. L.; Martin, D.; Herb, R. A.;
Dudley, G. Am. J. Physiol. 1994, 266 , R375–80.(6) Leblanc, P. J.; Harris, R. A.; Peters, S. J. Am. J. Physiol. Endocrinol. Metab.
2007, 292 , E571–6.(7) Cannon, D. M., Jr.; Winograd, N.; Ewing, A. G. Annu. Rev. Biophys. Biomol.
Struct. 2000, 29 , 239–63.(8) Cohen, D.; Dickerson, J. A.; Whitmore, C. D.; Turner, E. H.; Palcic, M. M.;
Hindsgaul, O.; Dovichi, N. J. Annu. Rev. Anal. Chem. 2008, 1, 165–190.
(9) Stuart, J. N.; Sweedler, J. V. Anal. Bioanal. Chem. 2003, 375 , 28–9.(10) Borland, L. M.; Kottegoda, S.; Phillips, K. S.; Allbritton, N. L. Annu. Rev.
Anal. Chem. 2008, 1, 191–227.(11) Lapainis, T.; Sweedler, J. V. J. Chromatogr. A 2008, 1184, 144–58.(12) Anderson, A. B.; Gergen, J.; Arriaga, E. A. J. Chromatogr. B Anal. Technol.
Biomed. Life Sci. 2002, 769 , 97–106.(13) Krylov, S. N.; Starke, D. A.; Arriaga, E. A.; Zhang, Z.; Chan, N. W.; Palcic,
M. M.; Dovichi, N. J. Anal. Chem. 2000, 72 , 872–7.(14) Page, J. S.; Rubakhin, S. S.; Sweedler, J. V. Anal. Chem. 2002, 74, 497–
503.(15) Floyd, P. D.; Moroz, L. L.; Gillette, R.; Sweedler, J. V. Anal. Chem. 1998,
70 , 2243–2247.(16) Zhao, S. L.; Song, Y. R.; Liu, Y. M. Talanta 2005, 67 , 212–216.(17) Clark, R. A.; Hietpas, P. B.; Ewing, A. G. Anal. Chem. 1997, 69 , 259–263.(18) Sasuga, Y.; Iwasawa, T.; Terada, K.; Oe, Y.; Sorimachi, H.; Ohara, O.; Harada,
Y. Anal. Chem. 2008, 80 , 9141–9149.
Anal. Chem. 2010, 82, 4570–4576
10.1021/ac100577q 2010 American Chemical Society4570 Analytical Chemistry, Vol. 82, No. 11, June 1, 2010 Published on Web 05/06/2010
7/31/2019 Xu 2010 Single Muscle Fiber
http://slidepdf.com/reader/full/xu-2010-single-muscle-fiber 2/7
Another complication arises when single cells are taken from
a bulk preparation and are analyzed sequentially. Those cells
analyzed last may display compromised cellular functions. In order
to address this issue, several studies have reported the use of
cultured single skeletal muscle fibers.19,20 These studies make it
simpler to select specific types of fibers, avoid nonmyogenic cells,
and maintain an environment in which the fibers remain
functional.21,22 Although such a single muscle fiber preparation
has been used to characterize properties such as the activation
of satellite cells,23
adhesion of nerve cells,24
and the productionof nitric oxide,22 monitoring of these properties is performed
directly by fluorescence microscopy. A salient report described
the detection of ROS in single muscle fibers by fluorescence
microscopy.21 The measurement of ROS was, however, based on
the oxidation of a nonspecific probe, chloromethyl dichlorodihy-
drofluorescin (CM-H2DCF), which reacts with a variety of ROS
and reactive nitrogen species.21,25 Sensitive methodologies to
monitor specific ROS, such as superoxide, have been recently
developed based on the use of fluorogenic hydroethidine-based
probes or amperometry.26-31 Amperometric probes, while ad-
equate to monitor superoxide released from single fibers, cannot
report on intracellular superoxide levels. In this report, we usedone of these fluorogenic probes, triphenylphosphonium hydroet-
hidine (TPP-HE),30-32 which is membrane permeant and can also
accumulate in mitochondria.
In this study, we introduce a technology to analyze superoxide
within cultured single skeletal muscle fibers. We plated isolated
single skeletal muscle fibers in nanoliter-volume wells. The fibers
were functional (i.e., presence of mitochondrial membrane po-
tential and absence of externalized phosphatidylserine) up to 48 h.
For superoxide analysis, the fibers were incubated in their
respective nanovial with TPP-HE and lysed by freeze-thawing.
The nanoliter volume wells prevent excessive dilution of the fiber
contents after lysis and require small amounts of reagents.
Subsequently, the contents released from each individual muscle
fiber were analyzed by micellar electrokinetic capillary chroma-
tography with laser-induced fluorescence detection (MEKC-LIF).32
Detection of the superoxide specific product, OH-TPP-E+, from
each individual soleus skeletal muscle fiber demonstrated the
feasibility of superoxide detection. Further single fiber experi-
ments in which the fibers were treated with tiron (superoxide
dismutase mimetic) and antimycin A (superoxide production
inducer) validated the suitability of this approach for superoxide
detection from individual fibers. This technology has potential
to be used in studies comparing superoxide production in
different skeletal muscle fiber types as a function of muscle
performance, disease, and aging.
EXPERIMENTAL SECTION
Chemicals and Reagents. Tetramethylrhodamine methyl
ester (TMRM), Alexa Fluor 488 annexin V, propidium iodide, and
MitoSOX Red (TPP-HE) were obtained from Invitrogen-Molecular
Probes (Eugene, OR). Polydimethylsiloxane (PDMS) prepolymer
(Sylgard 184) was obtained from Dow Corning (Midland, MI).
All the other reagents were purchased from Sigma-Aldrich (St.
Louis, MO). The annexin-binding buffer contained 10 mM HEPES,
140 mM NaCl, and 2.5 mM CaCl2 (pH 7.4). The lysis buffer
contained 10 mM sodium borate, 1% w/v Triton X-100 and 50%
w/v glycerol (pH 9.4). Glycerol prevents the evaporation from
the small volume of lysis buffer ( ∼ 50 nL) during the disruption
step.17 The MEKC running buffer contained 10 mM sodium
borate and 2 mM cetyltrimethylammonium bromide (CTAB)
(pH 9.3). All buffers were prepared using Milli-Q deionized
water and filtered through 0.22- µm filters before use. Collagen
(type I) was dissolved in culture medium (0.4 mg/mL). For
collagen coating, each 35-mm Petri dish (Sarstedt Inc., part
no. 831800) or 24-mm PDMS plate was coated with a 120- µL
collagen solution for 15 min on ice. The excess collagen
solution on the top of the PDMS plate was scraped away using
a glass coverslip before use.
Isolation of Single Soleus Skeletal Muscle Fibers. Muscle
fiber segments, referred to herein as single muscle fibers,19 were
isolated from the soleus skeletal muscle of male Fischer 344 rats
(11 months old) following previously reported procedures.21,22
Briefly, the soleus muscles were dissected and immediately
transferred to minimum essential medium (MEM) containing 0.4%
(w/v) collagenase (type H) for 2 h at 37 °C. The muscles were
constantly shaken during the incubation period. Then a wide-bore
pipet with a 1.5-mm diameter tip was used to gently triturate the
digested muscle bundles and release the fibers. The obtained
muscle fiber suspension was centrifuged at 600 g for 30 s to
remove the muscle debris in the suspension. The pelleted fibers
were then resuspended in MEM and washed twice more.
For fluorescence microscopy evaluation of mitochondrialmembrane potential and phosphatidylserine externalization, the
fibers were plated onto 35-mm collagen-coated Petri dishes. For
superoxide analysis by MEKC-LIF, the fibers were plated onto
collagen-coated PDMS plates and allowed to settle into its 60-nL
volume wells. In both instances, fibers were cultured in MEM at
37 °C in 5% CO2.
Evaluation of Mitochondrial Membrane Potential. This
property was evaluated to assess the viability and respiratory
activity of single skeletal muscle fibers after isolation. An Olympus
IX-81 inverted microscope (Melville, NY) equipped with a TRITC
filter set (ex. 510-560 nm, 565 nm dichroic, em. 570-650 nm)
and a C9100-01 CCD camera (Hamamatsu, Bridgewater, NJ) was
(19) Bonavaud, S.; Agbulut, O.; D’Honneur, G.; Nizard, R.; Mouly, V.; Butler-
Browne, G. In Vitro Cell Dev. Biol. Anim. 2002, 38, 66–72.(20) Rosenblatt, J. D.; Lunt, A. I.; Parry, D. J.; Partridge, T. A. In Vitro Cell Dev.
Biol. Anim. 1995, 31, 773–9.(21) Palomero, J.; Pye, D.; Kabayo, T.; Spiller, D. G.; Jackson, M. J. Antioxid.
Redox Signal 2008, 10 , 1463–74.(22) Pye, D.; Palomero, J.; Kabayo, T.; Jackson, M. J. J. Physiol. 2007, 581,
309–18.
(23) Anderson, J.; Pilipowicz, O. Nitric Oxide 2002, 7 , 36–41.(24) Bischoff, R. J. Cell Biol. 1986, 102 , 2273–2280.(25) McArdle, F.; Pattwell, D. M.; Vasilaki, A.; McArdle, A.; Jackson, M. J. Free
Radic Biol. Med. 2005, 39 , 651–7.(26) Amatore, C.; Arbault, S.; Koh, A. C. W. Anal. Chem. 2010, 82 , 1411–1419.(27) Gaspar, S.; Niculite, C.; Cucu, D.; Marcu, I. Biosens. Bioelectron. 2010,
25 , 1729–1734.(28) Krylov, A. V.; Adamzig, H.; Walter, A. D.; Lochel, B.; Kurth, E.; Pulz, O.;
Szeponik, J.; Wegerich, F.; Lisdat, F. Sensors Actuators B -Chem. 2006,
119 , 118–126.(29) Ge, B.; Lisdat, F. Anal. Chim. Acta 2002, 454, 53–64.(30) Robinson, K. M.; Janes, M. S.; Pehar, M.; Monette, J. S.; Ross, M. F.; Hagen,
T. M.; Murphy, M. P.; Beckman, J. S. Proc. Natl. Acad. Sci. USA 2006,
103, 15038–43.(31) Zielonka, J.; Vasquez-Vivar, J.; Kalyanaraman, B. Nat. Protoc. 2008, 3, 8–
21.
(32) Xu, X.; Arriaga, E. A. Free Radical Biol. Med. 2009, 46 , 905–913.4571Analytical Chemistry, Vol. 82, No. 11, June 1, 2010
7/31/2019 Xu 2010 Single Muscle Fiber
http://slidepdf.com/reader/full/xu-2010-single-muscle-fiber 3/7
used to evaluate the mitochondrial membrane potential.33
SimplePCI 5.3 software (Compix, Cranberry Township, PA) was
used to control the hardware and capture all the images.
First, the muscle fibers were treated with 50 µg/mL saponin
at 4 °C for 20 min to selectively permeabilize their plasma
membrane;34 therefore, eliminating the effect of the plasma
membrane potential. Then, the cultured fibers were labeled with
50 nM TMRM in MEM for 30 min at 37 °C. After labeling, the
fibers were washed twice with PBS and imaged by epi-fluores-
cence microscopy. Then 100 µM carbonyl cyanide m-chlorophe-
nylhydrazone (CCCP) was added to disrupt the mitochondrial
membrane potential for 10 min, and the same fibers were imaged
again after CCCP treatment. The remaining fluorescence is
attributed to the nonspecific binding of TMRM to the mitochon-
drial membranes.33,35 Thus a value of relative TMRM fluorescence
was calculated for each muscle fiber as shown in eq 1, which is
indicative of the relative mitochondrial membrane potential of
individual muscle fibers.33
Rel. flouresence)
[( F before-
F background )-
( F after - F background )]/( F after - F background ) (1)
where F before and F after are average fluorescence intensity values
of each muscle fiber before and after CCCP treatment, and
F backgound is the average fluorescence intensity of the back-
ground in the image. Mitochondrial membrane potential
measurements were performed at 24, 48, and 72 h after plating
of the single muscle fibers.
Treatment and Lysis of Isolated Single Skeletal Muscle
Fibers in Nanoliter-Volume Wells. In order to prepare a
substrate with 100 nanowells, a silicon master was fabricated based
on previously reported methods.36 Briefly, a mixture of PDMS
prepolymer was casted onto the silicon master and cured at 65
°C for 1 h.37 The PDMS plate was then peeled from the master
and cleaned by 30-min sonication in ethanol. The cleaned PDMS
plate was then oxidized in a 0.35 mbar oxygen plasma for 30 s,38
which was carried out in the Nanofabrication Center at the
University of Minnesota. The plasma treated PDMS plate was
stored in Milli-Q deionized water prior to collagen coating. The
final device had 100 wells with 650 µm in diameter and 200 µm in
depth. The wells are spaced at intervals of 1.5 mm from each other.
For fiber analysis, the isolated muscle fibers were plated onto
a collagen-coated PDMS plate and allowed to settle into its 60-nL
volume wells at 37 °C for 30 min. The unattached fibers and those
in the medium were removed by aspiration and scraping with a
coverslip. Those attached fibers on the bottom of the wells were
not affected by the use of the coverslip since they were not
touched by the flat edge of the coverslip during the scrape.
Subsequently, MEM was added and the plate (attached fibers in
the wells) was maintained at 37 °C in 5% CO2 (within 48 h of
culture) (Figure 1, part i). To measure superoxide production,
the entire PDMS plate was incubated with 5 µM TPP-HE in MEM
for 30 min at 37 °C (Figure 1, part ii). These incubation conditions
have been previously used for whole cells and isolated mitochon-
dria.32 For control experiments, before incubation in the presence
(33) Navratil, M.; Terman, A.; Arriaga, E. A. Exp. Cell Res. 2008, 314, 164–172.(34) Kuznetsov, A. V.; Veksler, V.; Gellerich, F. N.; Saks, V.; Margreiter, R.;
Kunz, W. S. Nat. Protoc. 2008, 3, 965–76.
(35) Scaduto, R. C.; Grotyohann, L. W. Biophys. J. 1999, 76 , 469–477.
(36) Nagamine, K.; Onodera, S.; Torisawa, Y.; Yasukawa, T.; Shiku, H.; Matsue,
T. Anal. Chem. 2005, 77 , 4278–4281.(37) Duffy, D. C.; McDonald, J. C.; Schueller, O. J. A.; Whitesides, G. M. Anal.
Chem. 1998, 70 , 4974–4984.(38) Millare, B.; Thomas, M.; Ferreira, A.; Xu, H.; Holesinger, M.; Vullev, V. I.
Langmuir 2008, 24, 13218–13224.
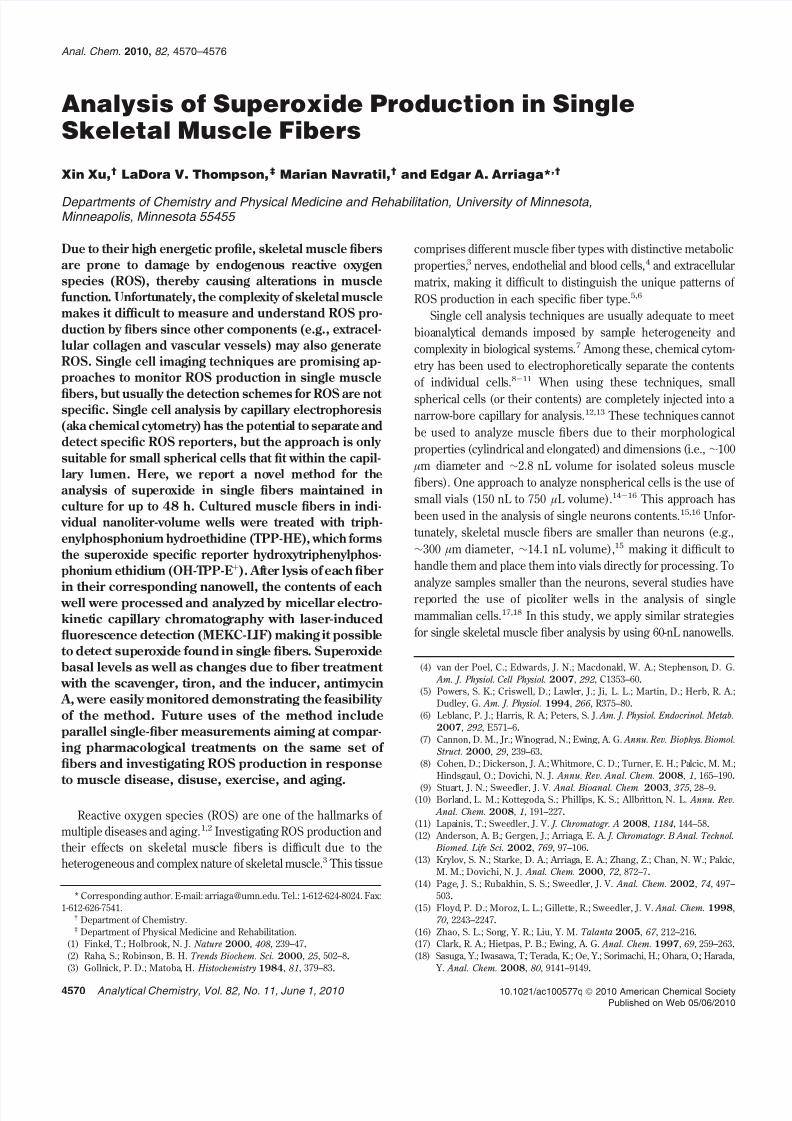
Figure 1. Handling of single skeletal muscle fibers. (i) Single muscle fibers are delivered onto a PDMS array of 100 wells held in a 35-mm Petri
dish; the fibers attach to the bottom of the wells; the attached fibers are cultured in MEM at 37 °C in 5% CO2. (ii) The PDMS array is incubated
with TPP-HE, which leads to formation of the superoxide reporter, OH-TPP-E+. (iii) The lysis buffer is delivered hydrodynamically by a capillary
(C1) into individual wells that contain one muscle fiber. (iv) Five freeze-thaw cycles (-80 and +37 °C, respectively) are applied to lyse the
single fibers in the wells; the whole single-fiber lysate is then aspirated into the capillary (C2). (v) The lysate within the capillary (C2) is delivered
into a microvial containing protease K and DNase I. (vi) A sample of the final lysate is injected into a capillary (C3) and subsequently analyzed
by MEKC-LIF.
4572 Analytical Chemistry, Vol. 82, No. 11, June 1, 2010
7/31/2019 Xu 2010 Single Muscle Fiber
http://slidepdf.com/reader/full/xu-2010-single-muscle-fiber 4/7
of TPP-HE, the entire plate was treated with 1 mM tiron22,25 or 5
µM antimycin A at 37 °C for 30 min.32
After washing the plate with PBS, wells containing one muscle
fiber were localized with the aid of an inverted microscope (TE300,
Nikon, Melville, NY) using bright field imaging. For delivering, a
150- µm-o.d., 50- µm-i.d. fused silica capillary (Polymicro Technolo-
gies, Phoenix, AZ) was fully filled with the lysis buffer ( ∼800 nL).
Then 50 nL of the lysis buffer containing 50% w/v glycerol was
then delivered into each individual well hydrodynamically at 7.3
kPa for 120 s by this capillary (Figure 1, part iii). Five freeze-thaw cycles ( -80 and +37 °C, the plate held at each temperature for
20 min in each cycle) were applied to the entire plate to completely
disrupt individual muscle fibers and release their contents (Figure
1, part iv). The efficiency of fiber lysis was assessed by comparing
the fluorescence intensity of the muscle fiber before and after its
disruption and the removal of the lysate in the well. After lysis,
the whole single-fiber lysate was suctioned into a capillary by
applying -10.8 kPa for 81 s, and then delivered into a microvial
with 5 µL lysis buffer containing 2 mg/mL protease K and 400
U/mL DNase I to remove the DNA (Figure 1, part v). DNA
digestion is important because variable amounts of DNA in the
samples may cause inconsistent fluorescence enhancement of OH- TPP-E+ due to the DNA intercalation with OH-TPP-E+.32 The
transfer of the single fiber lysate to a separate vial for DNA
digestion and CE analysis is necessary because of the following
reasons: (i) the volume of protease K and DNase I buffer
needed to digest single-fiber DNA exceeds the capacity of each
individual nanowell; (ii) high concentration of glycerol (50%
w/v) in the 50-nL single fiber lysate can deteriorate the
electrophoretic separations if injected directly for MEKC
analysis (data not shown); and (iii) when needed, this approach
allows to carry out several injections from the same fiber lysate.
After the DNA digestion, the sample was then analyzed by
MEKC-LIF to determine the amount of OH-TPP-E+
(Figure 1,part vi).
MEKC-LIF Analysis. The capillary electrophoresis instrument
used for the MEKC-LIF analysis of single fiber contents has been
previously described.12,32 The 488-nm line (12 mW) of an argon-
ion laser (Melles Griot, Irvine, CA) was used for excitation and
fluorescence was detected in the range of 607-662 nm range using
a bandpass filter (Omega Optical, Brattleboro, VT). The separations
were carried out using 150- µm-o.d., 50- µm-i.d. fused silica capillaries
(Polymicro Technologies, Phoenix, AZ) at -400 V/cm in MEKC
running buffer. Samples were injected hydrodynamically for 1 s at
10.8 kPa, which introduced 3.7 nL sample into the capillary. The
capillary was washed for 5 min with 0.1 M NaOH and 5 min withrunning buffer between each run. The limit of detection (signal/
noise )3) for ethidium standard was ∼0.5 amol.
Data Analysis. Data were presented as mean ± standard
deviation (SD). All the images were analyzed using Image J 1.42
software (NIH, Bethesda, MD). The MEKC electropherograms
were analyzed using Igor Pro 5.0 software (Wavemetrics, Lake
Oswego, OR), and the peak area of OH-TPP-E+ was normalized
to the volume of the analyzed muscle fiber, which was
estimated according to the fiber’s radius and length (Table S-1
of the Supporting Information ). The statistical significance of the
data was determined by student’s t test, with P values of <0.05
considered significant.
RESULTS AND DISCUSSION
Function of Single Skeletal Muscle Fibers in Culture after
Isolation. Muscle tissue is heterogeneous in nature, which
complicates the analysis of the properties attributed to individual
muscle fibers. In this report, we describe an approach to analyze
the contents of individual viable single fibers.
Single fibers were cultured in MEM immediately after the
isolation,21,22 thus making it possible to have more functional
fibers available for different treatments and evaluation of super-
oxide levels. The function of the isolated muscle fibers was initially assessed by monitoring the externalization of phosphatidylserine
up to 72 h. The translocation of phosphatidylserine from the inner
to the outside leaflet of the plasma membrane occurs during
apoptosis.39 By monitoring the levels of phosphatidylserine on the
outside leaflet of the plasma membrane, we established that fibers
were not apoptotic up to 48 h after isolation (Supporting Informa-
tion, Figure S-1).
The mitochondrial membrane potential plays a vital role in the
production of ATP in soleus muscle, which is predominantly
composed of type I fibers and has abundant mitochondria.40
Moreover, the mitochondrial membrane potential drives the
accumulation of the superoxide probe TPP-HE into the mitochon-dria within the muscle fiber,30 thus membrane potential is a critical
parameter to effectively monitor superoxide levels. To monitor
the mitochondrial membrane potential of single muscle fibers
during culture, we labeled the fibers with TMRM, a membrane
potential-sensitive cationic dye.35,41 TMRM is nontoxic to mito-
chondria at the low concentrations used here and has low
nonspecific binding to mitochondria compared to other dyes such
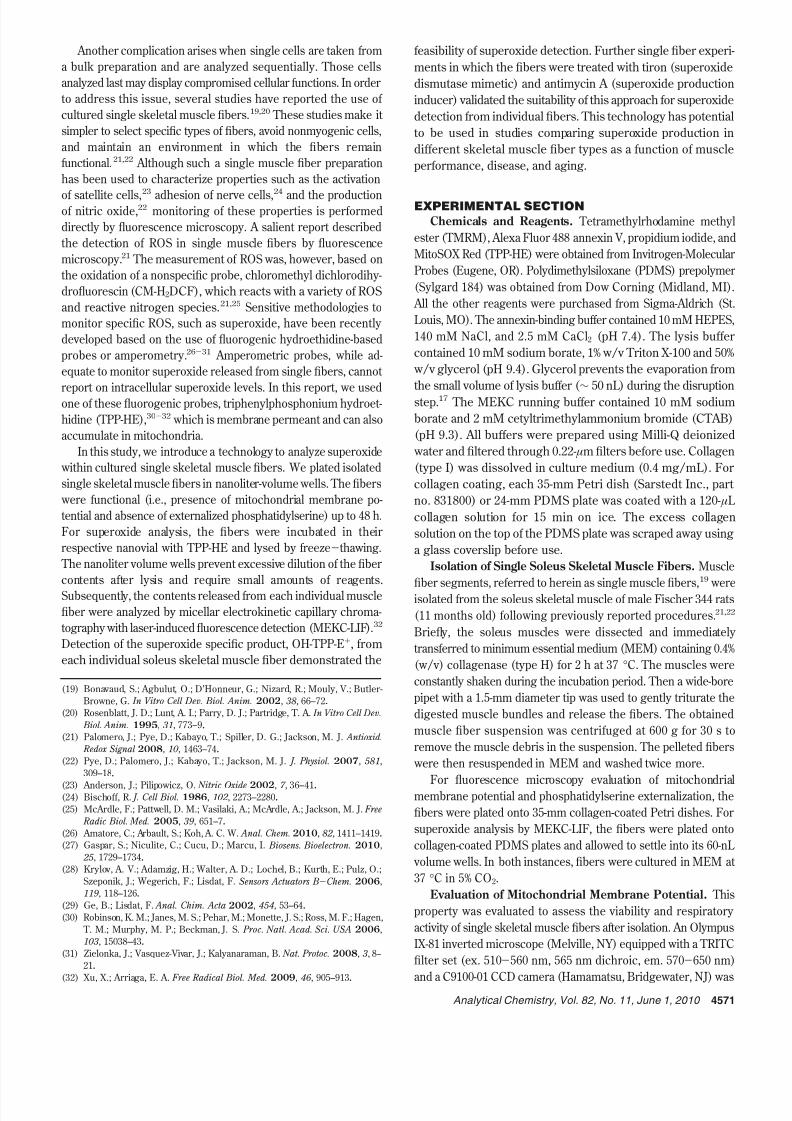
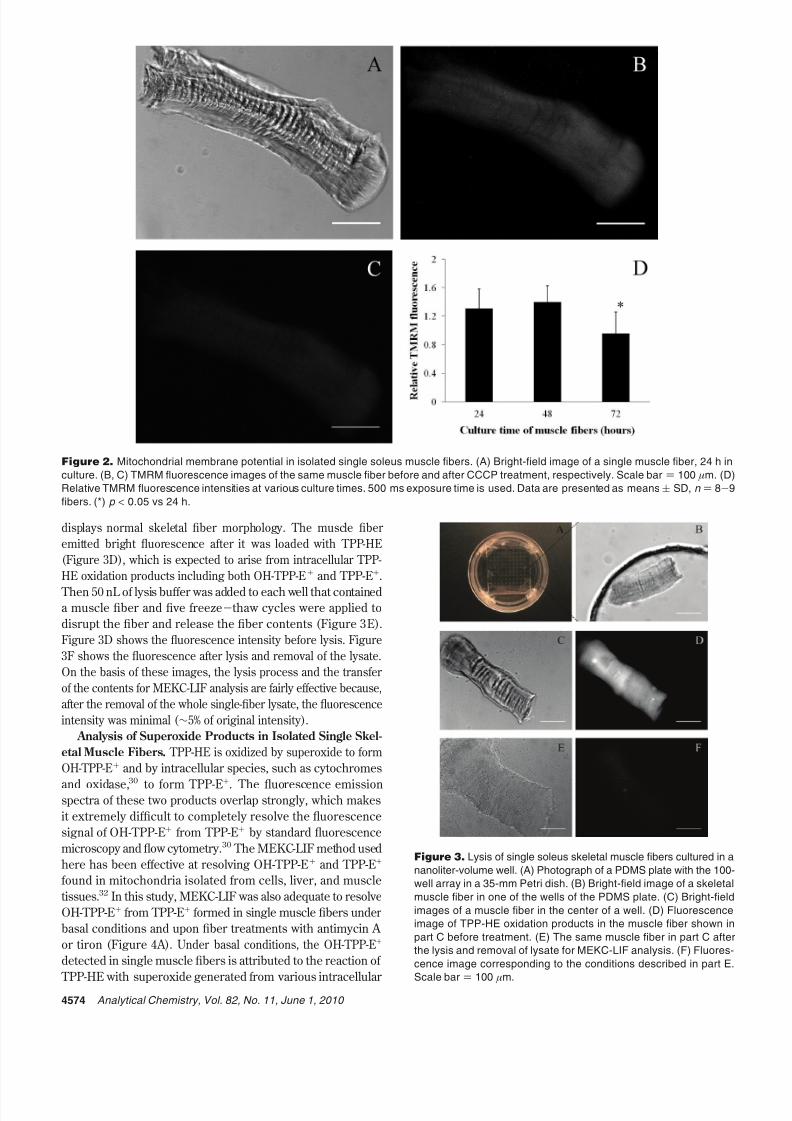
as rhodamine 123. Figure 2A shows the bright-field image of a
single soleus skeletal muscle fiber in culture for 24 h with the
characteristic striations.21 After the permeabilization of the plasma
membrane and TMRM staining, the muscle fiber displays bright
fluorescence due to the accumulation of TMRM within the fiber’s
mitochondria (Figure 2B). Upon treatment with the mitochondrial
uncoupler, CCCP, the mitochondrial membrane potential is
dissipated.33 The remaining fluorescence is thus independent from
the mitochondrial membrane potential (Figure 2C).33,35 The
relative TMRM fluorescence, before and after CCCP treatment
(see eq 1), is then a relative indicator of the mitochondrial
membrane potential of individual muscle fibers. As shown in
Figure 2D, the relative TMRM fluorescence was unchanged
between single muscle fibers cultured for 24 and 48 h, whereas
there was a significant decrease in the fibers cultured for 72 h.
These results show that isolated soleus skeletal muscle fibers in
culture are viable for up to 48 h after isolation and have adequate
mitochondrial membrane potentials to maintain their productionof reactive oxygen species (i.e., superoxide production).
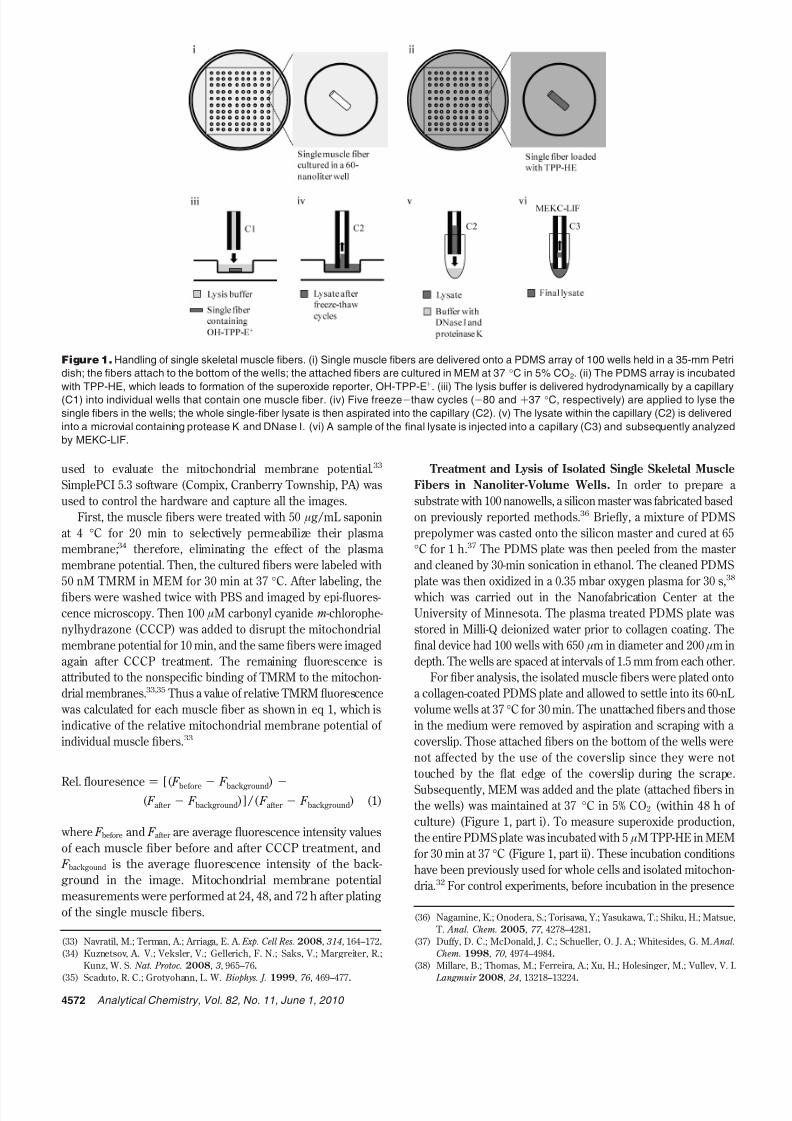
Handling of Isolated Single Skeletal Muscle Fibers in
Individual Wells. Single muscle fibers were plated into 60-nL
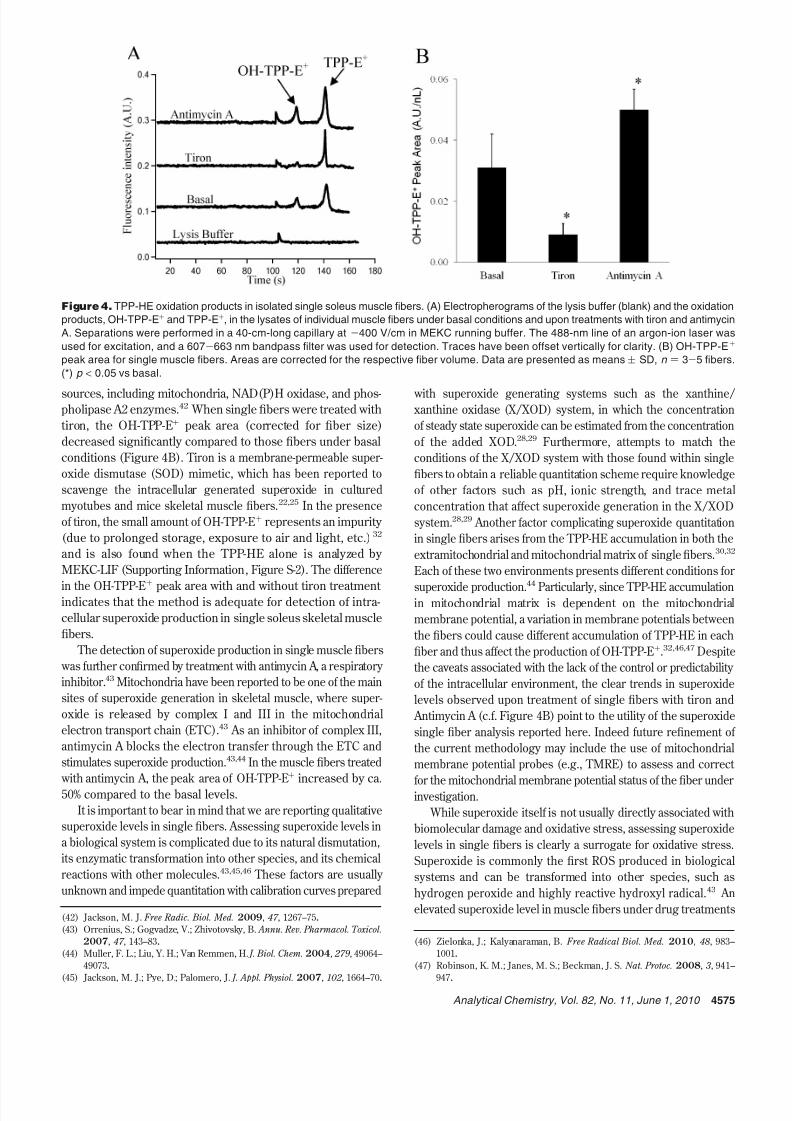
volume PDMS wells (Figure 3A and B) with the subsequent probe
staining and lysis steps carried out in the same wells. Figure 3C
shows the bright-field image of a single soleus muscle fiber
cultured in the center of a nanoliter-volume well for 24 h, which
(39) Liu, T.; Zhu, W.; Yang, X.; Chen, L.; Yang, R. W.; Hua, Z. C.; Li, G. X. Anal.
Chem. 2009, 81, 2410–2413.(40) Gueguen, N.; Lefaucheur, L.; Fillaut, M.; Herpin, P. Mol. Cell. Biochem.
2005, 276 , 15–20.
(41) Wong, A.; Cortopassi, G. A. Biochem. Bioph. Res. Co. 2002, 298, 750–754.4573Analytical Chemistry, Vol. 82, No. 11, June 1, 2010
7/31/2019 Xu 2010 Single Muscle Fiber
http://slidepdf.com/reader/full/xu-2010-single-muscle-fiber 5/7
displays normal skeletal fiber morphology. The muscle fiber
emitted bright fluorescence after it was loaded with TPP-HE
(Figure 3D), which is expected to arise from intracellular TPP-
HE oxidation products including both OH-TPP-E+ and TPP-E+.
Then 50 nL of lysis buffer was added to each well that containeda muscle fiber and five freeze-thaw cycles were applied to
disrupt the fiber and release the fiber contents (Figure 3E).
Figure 3D shows the fluorescence intensity before lysis. Figure
3F shows the fluorescence after lysis and removal of the lysate.
On the basis of these images, the lysis process and the transfer
of the contents for MEKC-LIF analysis are fairly effective because,
after the removal of the whole single-fiber lysate, the fluorescence
intensity was minimal ( ∼5% of original intensity).
Analysis of Superoxide Products in Isolated Single Skel-
etal Muscle Fibers. TPP-HE is oxidized by superoxide to form
OH-TPP-E+ and by intracellular species, such as cytochromes
and oxidase,30
to form TPP-E+
. The fluorescence emissionspectra of these two products overlap strongly, which makes
it extremely difficult to completely resolve the fluorescence
signal of OH-TPP-E+ from TPP-E+ by standard fluorescence
microscopy and flow cytometry.30 The MEKC-LIF method used
here has been effective at resolving OH-TPP-E+ and TPP-E+
found in mitochondria isolated from cells, liver, and muscle
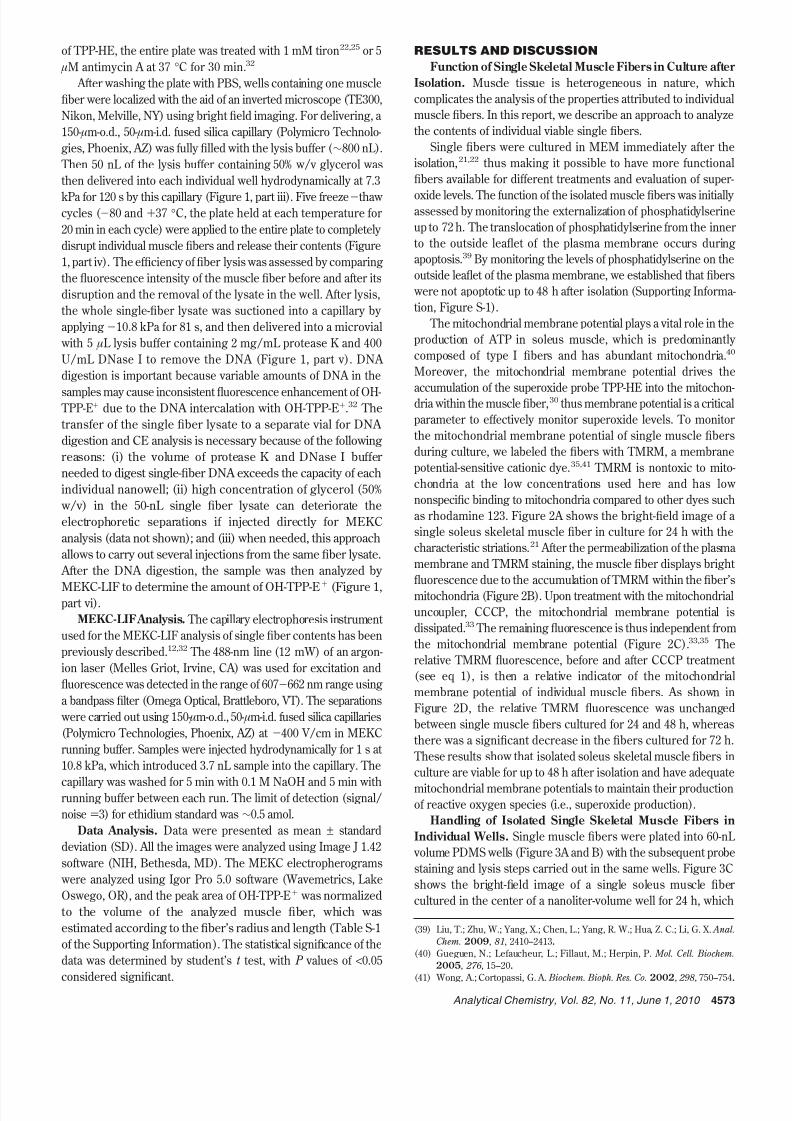
tissues.32 In this study, MEKC-LIF was also adequate to resolve
OH-TPP-E+ from TPP-E+ formed in single muscle fibers under
basal conditions and upon fiber treatments with antimycin A
or tiron (Figure 4 A). Under basal conditions, the OH-TPP-E+
detected in single muscle fibers is attributed to the reaction of
TPP-HE with superoxide generated from various intracellular
Figure 2. Mitochondrial membrane potential in isolated single soleus muscle fibers. (A) Bright-field image of a single muscle fiber, 24 h in
culture. (B, C) TMRM fluorescence images of the same muscle fiber before and after CCCP treatment, respectively. Scale bar ) 100 µm. (D)
Relative TMRM fluorescence intensities at various culture times. 500 ms exposure time is used. Data are presented as means( SD, n ) 8-9
fibers. (*) p < 0.05 vs 24 h.
Figure 3. Lysis of single soleus skeletal muscle fibers cultured in a
nanoliter-volume well. (A) Photograph of a PDMS plate with the 100-
well array in a 35-mm Petri dish. (B) Bright-field image of a skeletal
muscle fiber in one of the wells of the PDMS plate. (C) Bright-field
images of a muscle fiber in the center of a well. (D) Fluorescence
image of TPP-HE oxidation products in the muscle fiber shown in
part C before treatment. (E) The same muscle fiber in part C after
the lysis and removal of lysate for MEKC-LIF analysis. (F) Fluores-
cence image corresponding to the conditions described in part E.
Scale bar)
100 µm.
4574 Analytical Chemistry, Vol. 82, No. 11, June 1, 2010
7/31/2019 Xu 2010 Single Muscle Fiber
http://slidepdf.com/reader/full/xu-2010-single-muscle-fiber 6/7
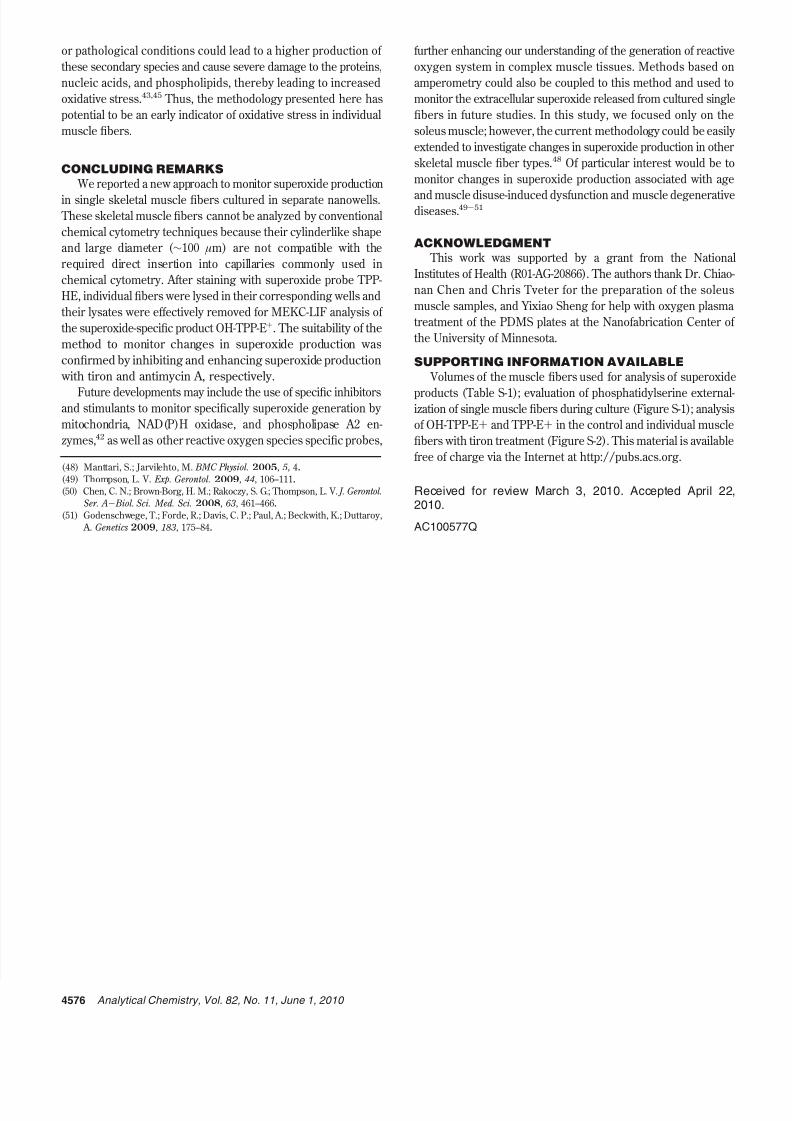
sources, including mitochondria, NAD(P)H oxidase, and phos-pholipase A2 enzymes.42 When single fibers were treated with
tiron, the OH-TPP-E+ peak area (corrected for fiber size)
decreased significantly compared to those fibers under basal
conditions (Figure 4B). Tiron is a membrane-permeable super-
oxide dismutase (SOD) mimetic, which has been reported to
scavenge the intracellular generated superoxide in cultured
myotubes and mice skeletal muscle fibers.22,25 In the presence
of tiron, the small amount of OH-TPP-E+ represents an impurity
(due to prolonged storage, exposure to air and light, etc.)32
and is also found when the TPP-HE alone is analyzed by
MEKC-LIF (Supporting Information, Figure S-2). The difference
in the OH-TPP-E+
peak area with and without tiron treatment indicates that the method is adequate for detection of intra-
cellular superoxide production in single soleus skeletal muscle
fibers.
The detection of superoxide production in single muscle fibers
was further confirmed by treatment with antimycin A, a respiratory
inhibitor.43 Mitochondria have been reported to be one of the main
sites of superoxide generation in skeletal muscle, where super-
oxide is released by complex I and III in the mitochondrial
electron transport chain (ETC).43 As an inhibitor of complex III,
antimycin A blocks the electron transfer through the ETC and
stimulates superoxide production.43,44 In the muscle fibers treated
with antimycin A, the peak area of OH-TPP-E+ increased by ca.
50% compared to the basal levels.
It is important to bear in mind that we are reporting qualitative
superoxide levels in single fibers. Assessing superoxide levels in
a biological system is complicated due to its natural dismutation,
its enzymatic transformation into other species, and its chemical
reactions with other molecules.43,45,46 These factors are usually
unknown and impede quantitation with calibration curves prepared
with superoxide generating systems such as the xanthine/ xanthine oxidase (X/XOD) system, in which the concentration
of steady state superoxide can be estimated from the concentration
of the added XOD.28,29 Furthermore, attempts to match the
conditions of the X/XOD system with those found within single
fibers to obtain a reliable quantitation scheme require knowledge
of other factors such as pH, ionic strength, and trace metal
concentration that affect superoxide generation in the X/XOD
system.28,29 Another factor complicating superoxide quantitation
in single fibers arises from the TPP-HE accumulation in both the
extramitochondrial and mitochondrial matrix of single fibers.30,32
Each of these two environments presents different conditions for
superoxide production.44
Particularly, since TPP-HE accumulationin mitochondrial matrix is dependent on the mitochondrial
membrane potential, a variation in membrane potentials between
the fibers could cause different accumulation of TPP-HE in each
fiber and thus affect the production of OH-TPP-E+.32,46,47 Despite
the caveats associated with the lack of the control or predictability
of the intracellular environment, the clear trends in superoxide
levels observed upon treatment of single fibers with tiron and
Antimycin A (c.f. Figure 4B) point to the utility of the superoxide
single fiber analysis reported here. Indeed future refinement of
the current methodology may include the use of mitochondrial
membrane potential probes (e.g., TMRE) to assess and correct
for the mitochondrial membrane potential status of the fiber under investigation.
While superoxide itself is not usually directly associated with
biomolecular damage and oxidative stress, assessing superoxide
levels in single fibers is clearly a surrogate for oxidative stress.
Superoxide is commonly the first ROS produced in biological
systems and can be transformed into other species, such as
hydrogen peroxide and highly reactive hydroxyl radical.43 An
elevated superoxide level in muscle fibers under drug treatments(42) Jackson, M. J. Free Radic. Biol. Med. 2009, 47 , 1267–75.(43) Orrenius, S.; Gogvadze, V.; Zhivotovsky, B. Annu. Rev. Pharmacol. Toxicol.
2007, 47 , 143–83.(44) Muller, F. L.; Liu, Y. H.; Van Remmen, H. J. Biol. Chem. 2004, 279 , 49064–
49073.
(45) Jackson, M. J.; Pye, D.; Palomero, J. J. Appl. Physiol. 2007, 102 , 1664–70.
(46) Zielonka, J.; Kalyanaraman, B. Free Radical Biol. Med. 2010, 48, 983–
1001.(47) Robinson, K. M.; Janes, M. S.; Beckman, J. S. Nat. Protoc. 2008, 3, 941–
947.
Figure 4. TPP-HE oxidation products in isolated single soleus muscle fibers. (A) Electropherograms of the lysis buffer (blank) and the oxidation
products, OH-TPP-E+ and TPP-E+, in the lysates of individual muscle fibers under basal conditions and upon treatments with tiron and antimycin
A. Separations were performed in a 40-cm-long capillary at -400 V/cm in MEKC running buffer. The 488-nm line of an argon-ion laser was
used for excitation, and a 607-663 nm bandpass filter was used for detection. Traces have been offset vertically for clarity. (B) OH-TPP-E+
peak area for single muscle fibers. Areas are corrected for the respective fiber volume. Data are presented as means ( SD, n ) 3-5 fibers.
(*) p < 0.05 vs basal.
4575Analytical Chemistry, Vol. 82, No. 11, June 1, 2010
7/31/2019 Xu 2010 Single Muscle Fiber
http://slidepdf.com/reader/full/xu-2010-single-muscle-fiber 7/7
or pathological conditions could lead to a higher production of
these secondary species and cause severe damage to the proteins,
nucleic acids, and phospholipids, thereby leading to increased
oxidative stress.43,45 Thus, the methodology presented here has
potential to be an early indicator of oxidative stress in individual
muscle fibers.
CONCLUDING REMARKS
We reported a new approach to monitor superoxide production
in single skeletal muscle fibers cultured in separate nanowells. These skeletal muscle fibers cannot be analyzed by conventional
chemical cytometry techniques because their cylinderlike shape
and large diameter ( ∼100 µm) are not compatible with the
required direct insertion into capillaries commonly used in
chemical cytometry. After staining with superoxide probe TPP-
HE, individual fibers were lysed in their corresponding wells and
their lysates were effectively removed for MEKC-LIF analysis of
the superoxide-specific product OH-TPP-E+. The suitability of the
method to monitor changes in superoxide production was
confirmed by inhibiting and enhancing superoxide production
with tiron and antimycin A, respectively.
Future developments may include the use of specific inhibitorsand stimulants to monitor specifically superoxide generation by
mitochondria, NAD(P)H oxidase, and phospholipase A2 en-
zymes,42 as well as other reactive oxygen species specific probes,
further enhancing our understanding of the generation of reactive
oxygen system in complex muscle tissues. Methods based on
amperometry could also be coupled to this method and used to
monitor the extracellular superoxide released from cultured single
fibers in future studies. In this study, we focused only on the
soleus muscle; however, the current methodology could be easily
extended to investigate changes in superoxide production in other
skeletal muscle fiber types.48 Of particular interest would be to
monitor changes in superoxide production associated with age
and muscle disuse-induced dysfunction and muscle degenerativediseases.49-51
ACKNOWLEDGMENT
This work was supported by a grant from the National
Institutes of Health (R01-AG-20866). The authors thank Dr. Chiao-
nan Chen and Chris Tveter for the preparation of the soleus
muscle samples, and Yixiao Sheng for help with oxygen plasma
treatment of the PDMS plates at the Nanofabrication Center of
the University of Minnesota.
SUPPORTING INFORMATION AVAILABLE
Volumes of the muscle fibers used for analysis of superoxide
products (Table S-1); evaluation of phosphatidylserine external-ization of single muscle fibers during culture (Figure S-1); analysis
of OH-TPP-E+ and TPP-E+ in the control and individual muscle
fibers with tiron treatment (Figure S-2). This material is available
free of charge via the Internet at http://pubs.acs.org.
Received for review March 3, 2010. Accepted April 22,2010.
AC100577Q
(48) Manttari, S.; Jarvilehto, M. BMC Physiol. 2005, 5 , 4.(49) Thompson, L. V. Exp. Gerontol. 2009, 44, 106–111.(50) Chen, C. N.; Brown-Borg, H. M.; Rakoczy, S. G.; Thompson, L. V. J. Gerontol.
Ser. A- Biol. Sci. Med. Sci. 2008, 63, 461–466.(51) Godenschwege, T.; Forde, R.; Davis, C. P.; Paul, A.; Beckwith, K.; Duttaroy,
A. Genetics 2009, 183, 175–84.
4576 Analytical Chemistry, Vol. 82, No. 11, June 1, 2010