Embed Size (px)
Citation preview

Xstrata
AnnualReport2008
Annual Report 2008
Xstrata plcBahnhofstrasse 2PO Box 1026301 ZugSwitzerlandTel: +41 41 726 6070Fax: +41 41 726 6089
www.xstrata.com

Xstrata is a global diversified mining group,listed on the London and Swiss StockExchanges, with its headquarters in Zug,Switzerland. Xstrata’s businesses maintaina meaningful position in seven majorinternational commodity markets: copper,coking coal, thermal coal, ferrochrome,nickel, vanadium and zinc, with a growingplatinum group metals business, additionalexposures to gold, cobalt, lead and silver,recycling facilities and a suite of globaltechnology products, many of which areindustry leaders. The Group’s operationsand projects span 19 countries.
For more information visitwww.xstrata.com
Design and production: Black Sun Plc, London, UK
This report has been printed on Heaven 42 paper. This paper is made from virgin wood fibre fromwell-managed forests independently certified according to the rules of the Forest Stewardship Council (FSC).
Printed at St Ives Westerham Press Ltd, ISO14001, FSC certified and CarbonNeutral®
SGS-COC-1732
Cover picture: Tintayacopper mine, southern Peru
The Business Review section of this report, comprising the Business,Strategy, Financial and Operating Reviews, has been prepared inaccordance with the Accounting Standards Board Reporting Statementon Operating and Financial Review (January 2006), as applicable bestpractice guidance for UK companies required to prepare a businessreview. The Chairman’s Statement, CEO’s Report and Business Reviewchapters, in particular the Strategy section, include an analysis ofthe main trends and factors likely to affect the future development,performance and position of the business. This includes statementsthat are, or may be deemed to be, ‘forward-looking statements’.We may also make written and oral forward-looking statements in:
> our interim reports, our summary financial statements to shareholders,our offering circulars and our prospectuses;
> our press releases and other written materials; and
> oral statements made by our officers, directors or employeesto third parties, including to financial analysts.
These forward-looking statements can be identified by the useof forward-looking terminology, including the words: ‘believes’,‘estimates’, ‘anticipates’, ‘expects’, ‘intends’, ‘plans’, ‘goal’, ‘target’,‘aim’, ‘may’, ‘will’, ‘would’, ‘could’ or ‘should’ or, in each case, theirnegative or other variations or comparable terminology and include allmatters that are not historical facts. They appear in a number of placesthroughout this Annual Report and include statements regarding ourintentions, beliefs or current expectations and those of our officers,directors and employees concerning, amongst other things, our resultsof operations, financial condition, liquidity, prospects, growth, strategiesand dividend policy and the industries in which we operate.
By their nature, forward-looking statements involve risks anduncertainties because they relate to events and depend on circumstancesthat may or may not occur in the future and may be beyond our abilityto control or predict. Forward-looking statements are not guarantees
of future performance. Our actual results of operations, financialcondition, liquidity, dividend policy and the development of theindustries in which we operate may differ materially from the impressioncreated by the forward-looking statements contained in this AnnualReport. Important factors that could cause these differences include, butare not limited to, general economic and business conditions, commodityprice volatility, industry trends, competition, changes in government andother regulation, including in relation to the environment, health andsafety and taxation, labour relations and work stoppages, changes inpolitical and economic stability, currency fluctuations, our ability tointegrate new businesses and recover our reserves or develop newreserves and changes in business strategy or development plans andother risks, including those described in the Business Review section ofthis Annual Report. Even if the results of operations, financial condition,liquidity and dividend policy and the development of the industries inwhich we operate are consistent with the forward-looking statementscontained in this Annual Report, those results or developments may notbe indicative of our results or developments in subsequent periods.
Forward-looking statements speak only as of the date they are made.Other than in accordance with our legal or regulatory obligations(including under the Listing Rules and the Disclosure and TransparencyRules), we do not undertake any obligation to update or revise publiclyany forward-looking statement, whether as a result of new information,future events or otherwise.
The Directors’ Report in this Annual Report has been prepared for themembers of the Company and its purpose is to assist shareholders toassess the Company’s strategies and the potential for those strategiesto succeed and for no other purpose. The Company, its directors,employees, agents and advisers do not accept or assume responsibilityfor any other purpose or to any other person to whom this AnnualReport is shown or into whose access it may come and any suchresponsibility or liability is expressly disclaimed.
Cautionary Note Regarding Forward-Looking Statements

Xstrata plc Annual Report 2008 1
Contents
1. Overview
02 2008 Highlights04 Worldwide Operations06 Performance by Business08 Chairman’s Statement
2. Strategy
12 Chief Executive’s Report17 Strategy21 Sustainable Development25 Principal Risks and Uncertainties
3. Performance
32 Key Performance Indicators37 Financial Review45 Operating Review45 Xstrata Alloys49 Xstrata Coal55 Xstrata Copper63 Xstrata Nickel69 Xstrata Zinc75 Xstrata Technology Services76 Operations Data
4. Governance
82 Board of Directors84 Executive Management85 Directors’ Report91 Corporate Governance Report98 Remuneration Report
5. Financial statements
110 Group Financial Statements110 Statement of Directors’ Responsibilities111 Independent Auditors’ Report112 Consolidated Income Statement113 Consolidated Balance Sheet115 Consolidated Cash Flow Statement116 Consolidated Statement of Recognised Income
and Expense117 Notes to the Financial Statements199 Parent Company Financial Statements and
Related Information199 Statement of Directors’ Responsibilities200 Independent Auditors’ Report201 Balance Sheet202 Notes to the Financial Statements208 Shareholder InformationIBC Cautionary Note

> Despite economic downturn, EBITDA was$9.7 billion, 11% lower than the recordprofitability achieved in 2007
> Record annual production of platinum,coking coal, thermal coal, mined nickel,zinc in concentrate and lead in concentrate
> Record thermal and coking coal andferrochrome contracts settled during 2008
> Real cost savings of $184 million achievedfrom productivity improvements, despiteongoing cost pressures
> Successful commissioning and rampup of new, lower cost production andintegration of Resource Pacific, Jubileeand Tahmoor acquisitions
> $5.5 billion new revolving debt facilityextends debt maturity with no significantrefinancing requirements until 2011
> Proactive and decisive response to financialcrisis: curtailment or suspension of marginaloperations; substantial reductions in capitalexpenditure; and significant operatingcost savings
> 2 for 1 rights issue to raise approximately$5.9 billion secures strong balance sheet,maintains commitment to investmentgrade and positions Xstrata to emergefrom downturn in position of strength
> $2 billion acquisition of world-class Prodecocoal operations from Glencore concurrentlywith rights issue
> Net debt of $16.3 billion at end 2008 withgearing of 40%, improving to gearing of lessthan 30% post-conclusion of the rights issue
2 Xstrata plc Annual Report 2008
Overview
2008 HighlightsRecord thermal and coking coal and ferrochrome contracts settledduring 2008 and a robust copper price for the majority of the yearhelped Xstrata to generate EBITDA of $9.7 billion for 2008.
Performance highlights
For more information see Financial Review p.37

0
5,000
10,000
15,000
20,000
25,000
0807
Revenue*
27,95228,542
0
1,000
2,000
3,000
4,000
5,000
6000
0807
Attributable profit*
4,698
5,424
0
5
10
15
20
25
30
0807
Net assets per share**
25.5126.29
0
2,000
4,000
6,000
8,000
10000
0807
EBIT*
7,261
8,792
0
2,000
4,000
6,000
8,000
10,000
12000
0807
EBITDA*
9,657
10,888
0
2,000
4,000
6,000
8,000
10,000
12000
0807
Cash generated from operations
8,888
11,046
0
3
6
9
12
15
18
0807
Total recordable injury frequency rate
10.1
12.3
0
1
2
3
4
5
6
0807
Earnings per share*
4.90
5.60
0
10
20
30
40
50
60
0807
Dividends per share
18.0
50.0
Xstrata plc Annual Report 2008 3
$27,952m-2%
$9,657m-11%
$7,261m-17%
$4,698m-13%
$4.90-13%
$8,888m-20%
$25.51-3%
18.0¢-64%
10.1-18%
* Excludes discontinued operations and exceptional items** Excluding own sharesUnless otherwise stated, the currency used throughout this report is US dollars
(per million hours worked)

4 Xstrata plc Annual Report 2008
Overview
Xstrata: Worldwide OperationsXstrata’s activities are organised into five global commoditybusinesses and a technology business, each of which operateswith a high level of autonomy. The Group’s operations andprojects span 19 countries.
For more information see p.45 For more information see p.49 For more information see p.55
Key locations Key locations Key locations
Description
Xstrata Copper is the fourth largestglobal copper producer, with mining andprocessing facilities located in Australia,Chile, Peru, Argentina and Canada. It alsomanages a recycling business with plants inthe USA. Xstrata Copper has a world-classportfolio of six copper developmentprojects, located in Peru, the Philippines,Chile, Argentina and Papua New Guinea.
Description
Xstrata Alloys is the world’s largestproducer of ferrochrome, is a leadingproducer of primary vanadium and has agrowing platinum group metals business.Xstrata Alloys also owns carbon andanthracite operations which supply keyraw materials to its ferrochrome smelters.Xstrata Alloys’ operations are located inSouth Africa.
Description
Xstrata Coal is the world’s largest exporterof thermal coal and a significant producerof premium quality hard coking coal andsemi-soft coal. Headquartered in Sydney,Australia, Xstrata Coal has interests in over30 operating coal mines in Australia, SouthAfrica and Colombia and an explorationproject in Nova Scotia, Canada.
South AfricaBoshoek plant, BoshoekLion plant, SteelpoortLydenburg plant, LydenburgRustenburg plant, RustenburgWonderkop plant, MarikanaBoshoek opencast mine, BoshoekHorizon mine, PilansbergKroondal mine, RustenburgThorncliffe mine, SteelpoortHelena mine, SteelpoortWaterval mine, RustenburgRhovan V2O5 and FeV, BritsMaloma mine, Maloma, SwazilandChar Technologies,WitbankAfrican Carbon Manufacturers,WitbankAfrican Carbon Producers,WitbankAfrican Fine Carbon, MiddelburgAfrican Carbon Union,WitbankMototolo, SteelpoortEland, Brits
AmericasCerrejón, ColombiaAustraliaCumnock, Hunter ValleyLiddell, Hunter ValleyMacquarie Coal JV – West Wallsend, Newcastle
– Westside, NewcastleMt Owen, Hunter ValleyRavensworth Operations, Hunter ValleyRavensworth Underground, Hunter ValleyOakbridge Group – Baal Bone,Western Coal Fields
– Beltana, Hunter Valley– Bulga, Hunter Valley
Tahmoor, Southern Coal FieldsUlan,Western Coal FieldsUnited, Hunter ValleyOaky Creek, Bowen BasinNewlands – Thermal, Bowen Basin
– Coking, Bowen BasinCollinsville – Thermal, Bowen Basin
– Coking, Bowen BasinRolleston, Bowen BasinSouth AfricaSouthstock Division – Opencast,Witbank
– Underground,WitbankMpumalanga Division – Spitzkop, Ermelo
– Tselentis, BreyteniMpunzi Division – Opencast,Witbank
– Underground,WitbankTweefontein Division – Opencast,Witbank
– Underground,Witbank
ArgentinaAlumbrera, CatamarcaAustraliaMount Isa, North West QueenslandErnest Henry, North West QueenslandTownsville Refinery, North QueenslandCanadaCCR, QuebecHorne, QuebecKidd Creek, OntarioChileAltonorte, Antofagasta RegionCollahuasi, Tarapacá RegionLomas Bayas, Antofagasta RegionPeruAntamina, Ancash RegionTintaya, Espinar Province
AlloysHQ: Rustenburg
CoalHQ: Sydney
CopperHQ: Brisbane

Xstrata plc Annual Report 2008 5
For more information see p.63 For more information see p.69 For more information see p.75
Key locations Key locations Key locations
Description
Xstrata Nickel is the fifth largest global nickelproducer and one of the world’s largestproducers of cobalt. Headquartered inToronto, Xstrata Nickel’s operations includemines and processing facilities in Canada,the Dominican Republic and Australia, anda refinery in Norway. Xstrata Nickel hasa promising portfolio of growth projectsin Canada, Tanzania and New Caledonia.
Description
Xstrata Zinc is one of the world’s largestminers and producers of zinc. Xstrata Zinc’soperations span Spain, Germany, Australia,the UK and Canada, with an interest in theAntamina copper-zinc mine in Peru. XstrataZinc’s growth projects include interestsin Australia.
Description
Xstrata Technology Services supports theprocesses involved in mining. It comprisesXstrata Technology, based in Brisbane,a specialist technology solutions providerand Xstrata Process Support, based inSudbury, an independent group whichprovide highly specialised technologicalsupport both to Xstrata’s operations andto third-party customers.
AustraliaSinclair,Western AustraliaCosmos,Western AustraliaBrazilAraguaia, ParaCanadaMontcalm, OntarioSudbury, OntarioRaglan, QuebecDominican RepublicFalcondo, BonaoNew CaledoniaKoniambo, North ProvinceNorwayNikkelverk, KristiansandTanzaniaKabanga, Kagera
AustraliaMcArthur River, Northern TerritoryMount Isa, North West QueenslandCanadaBrunswick Mine, New BrunswickBrunswick Smelting, New BrunswickCEZ Refinery, QuebecPerseverance Mine, QuebecGeneral Smelting, QuebecKidd Creek Refinery, OntarioGermanyNordenham, NordenhamPeruAntamina, Ancash RegionSpainSan Juan de Nieva, AsturiasHinojedo, CantabriaArnao, AsturiasUKNorthfleet, Northfleet
AustraliaXstrata Technology, BrisbaneCanadaXstrata Process Support, Ontario
NickelHQ: Toronto
ZincHQ: Madrid
Technology ServicesHQ: Brisbane and Sudbury

11,131
Contribution to Group EBIT
$2,297m 2007: $4,163m
32%
Contribution to Group Revenue
9,622
Contribution to Group EBIT
$3,549m 2007: $690m
49%
Contribution to Group Revenue
Key achievements
– Dramatic fall in copper prices, reducedsales volumes and lower production ledto a fall in Xstrata Copper’s revenue
– Copper volumes increased by 16% inthe second half compared to the firsthalf, when lower grades and a numberof one-off operational difficultiesreduced volumes
Key achievements
– Robust prices, strong operatingperformance and record sales volumesincreased the revenue achieved byXstrata Coal
– There was strong demand for thermaland coking coal in both the Pacific andAtlantic markets for the majority of 2008
– Successful integration of the acquiredTahmoor and Resource Pacific operations
Key achievements
– Record ferrochrome prices and strongcost control contributed to Xstrata Alloys’increased revenue
– Lion ferrochrome smelting complex andBokamoso pelletising plant contributedgreater than expected improvements inenergy efficiency and ore consumption
– Elandsfontein platinum operation wassuccessfully commissioned
6 Xstrata plc Annual Report 2008
Overview
Performance by BusinessA strong operating performance at Xstrata’s coal, alloys, nickeland zinc operations, led to record production across a numberof the Group’s key commodities during 2008.
For more information see p.45 For more information see p.49 For more information see p.55
9,476
Contribution to Group EBIT
Average number of employees in 2008 (excluding contractors) Average number of employees in 2008 (excluding contractors) Average number of employees in 2008 (excluding contractors)
$1,007m 2007: $389m
14%
Contribution to Group Revenue
$2,002m7%
$7,944m28%
$11,464m41%
CopperCoalAlloys

Key achievements
– The significant collapse in the nickel priceduring 2008, after record highs in 2007,reduced Xstrata Nickel’s revenue for 2008
– Record production was achieved at theNikkelverk refinery
– The Jubilee assets in Australia weresuccessfully integrated
4,520
Contribution to Group EBIT
$341m 2007: $2,172m
5%
Contribution to Group Revenue
5,029
Contribution to Group EBIT
$113m 2007: $1,529m
2%
Contribution to Group Revenue
162
Contribution to Group EBIT
$235m1%
$32m 2007: $43m
Contribution to Group Revenue
Key achievements
– Xstrata Technology Services maintaineda stable revenue despite project deferralsduring the year
– Strong demand for Xstrata Technology’ssolutions
– Increase in external customers usingXstrata Process Support’s services
Key achievements
– Lower zinc and lead prices impactedXstrata Zinc’s revenue during the year
– Cost savings of $87 million achievedthrough improved productivity andoperating efficiencies
– The Perseverance mine in Canadacommenced production
Xstrata plc Annual Report 2008 7
For more information see p.63 For more information see p.69 For more information see p.75
$3,105m11%
$3,202m12%
Technology ServicesZincNickel
Average number of employees in 2008 (excluding contractors) Average number of employees in 2008 (excluding contractors) Average number of employees in 2008 (excluding contractors)

Xstrata recorded a very strong financial performance in 2008,second only in the Company’s history to the record year of 2007.Xstrata’s businesses achieved production records in a numberof its key commodities, successfully integrated and optimisedacquired operations, created a meaningful new platinum business,commissioned new, lower-cost operations and achieved a seventhconsecutive year of real cost savings. Yet the Group’s overall strongperformance for the year masks a period of extreme turbulence infinancial and commodity markets. The unprecedented speed andseverity of the financial crisis in the second half of the year dealta severe blow to global economic growth and led to sharp andsudden declines in the price of most of Xstrata’s commodities.
StrategyThe Board remains committed to Xstrata’s long-term strategyof growth and diversification in pursuit of value. However, thefinancial crisis that has gripped the world’s major economies andmost industry sectors has led Xstrata’s Board and managementto direct attention to ensuring the Group remains robust throughthe period of uncertainty that lies ahead of us. This short-termimperative led, in the first instance, to our decision not to proceedwith a full offer for Lonmin plc in early October, in view of therisks associated with the requirement to refinance a significantportion of the acquisition debt facililties within 12 months. At thesame time, the Group took the opportunity to arrange a new,three-year bank facility to refinance existing short-term debt,removing any significant refinancing obligations for three years –a truly valuable attribute in current markets.
Between August and early October, Xstrata acquired a substantialstake of 24.9% of Lonmin. While, with the benefit of hindsight,the subsequent decline in Lonmin’s share price would haveafforded Xstrata an opportunity to purchase its stake at a loweraverage price at a later stage, your Board remains confident thatXstrata’s significant stake in one of the world’s leading platinumproducers represents a valuable long-term investment and addsto Xstrata’s strategic optionality.
My fellow Board members and I have remarked on the scale andspeed of actions being implemented across Xstrata’s businessesover the past few months to secure the Group’s financial positionand preserve cash, amidst challenging conditions. From initiativesto secure an appropriate capital structure, to innovative approachesto significantly reduce capital and production costs to maintainprofitability even at current low commodity prices, it is clear thatdecisive action is being taken at every level of the organisation,as outlined further in the reports that follow. Of course, someof these actions result in difficult decisions to suspend or closehigher cost operations. Where compulsory redundancies havebeen unavoidable, every effort is being made to mitigate theimpacts on employees, their families and communities, includingthrough the provision of appropriate employee assistanceprogrammes and other support.
The successful development of Xstrata’s strategy over the pastseven years has positioned the Group to capture the benefit ofrecent historically strong commodity markets. It has also providedXstrata with an excellent pipeline of prospective internal andexternal growth options. While current conditions mean thatcapital expenditure at a number of Xstrata’s projects is beingdeferred or curtailed, Xstrata’s management teams have beencareful to preserve our valuable acquisition and organic growth
8 Xstrata plc Annual Report 2008
Overview
Chairman’sStatement
Key points:> Strong financial performance in 2008> Swift response by Xstrata to the challenges
of the global economic downturn> Substantial rights issue launched> Well positioned to benefit from encouraging
medium- to longer-term prospects for demandfor commodities
Willy StrothotteChairman
To see a webcast of our results presentation,visit www.xstrata.com
options, which can be exercised as and when the conditions are right.We look forward to resuming Xstrata’s longer-term growth strategyin earnest at the appropriate time.
Xstrata management’s capacity and willingness to act quickly anddecisively has been underlined by the recent announcement of asubstantial rights issue. The proceeds from the rights issue will providea significant capital injection, allowing the repayment of debt andproviding a firm footing for future growth. Further details about therights issue and acquisition of the Prodeco coal operations have beenprovided in a comprehensive circular and prospectus, sent to eacheligible registered shareholder and available from Xstrata’s website.
All of the resolutions relating to the proposed Prodeco acquisitionand rights issue were approved by shareholders at an ExtraordinaryGeneral Meeting on 2 March 2009.
GovernanceXstrata benefits from a robust Board of some six independent non-executives, three executive directors and two non-executive directorsnominated by Glencore International. An external evaluation of theBoard’s effectiveness and performance was conducted in 2007 andin 2008 the Board conducted an internal assessment, led by SeniorIndependent Director David Rough. We are now implementing therecommendations arising from these assessments, in particular toaddress medium-term succession planning. During 2008, the Boardagreed that an external evaluation exercise will be regularlyundertaken every three years.
Robert MacDonnell has indicated that he intends to retire as anindependent non-executive director at the next Annual GeneralMeeting (AGM) in May 2009. Robert has served as a director ofXstrata plc since its initial public offering and before that, was anon-executive director of the former Swiss company, Xstrata AG.During his tenure, he has overseen the significant growth of theCompany into a global mining major and I thank him on behalfof the Company and Board for his guidance and the contributionhe has made to Xstrata’s development over the past several years.
I am delighted to announce that Peter Hooley has agreed to stand asan independent, non-executive director for election by shareholdersat the AGM on 5 May 2009. Peter held the position of Group FinanceDirector of Smith & Nephew plc until 2006 and is currently a non-executive director and Chairman of the Audit Committee of Cobhamplc and a director and Chairman of BSN Medical. I am confident thatPeter’s appointment to the Board will add significant value to Xstrata.Peter brings with him extensive financial markets and corporatetransactions experience and a strong track record of creatingshareholder value. Peter has agreed to act as an independent externalconsultant to the Board with effect from 3 March 2009 until the AGM.
Sustainable developmentXstrata’s commitment to the principles of sustainable developmentremains at the centre of our strategy and is increasingly integrated intothe Group’s day-to-day management practices and strategic decision-making. The most important of our many targets and objectives is ouraim that no fatalities or serious injuries are sustained by the men andwomen who work at Xstrata. We did not achieve this objective in 2008and I am deeply saddened to report that six workers lost their lives atXstrata’s operations or projects last year. Safety is a particular challengeduring times of uncertainty and this is an area to which we will continueto dedicate significant resources and management attention.
Xstrata plc Annual Report 2008 9
Outlook and prospectsEconomic prospects in 2009 remain uncertain. However, thedirectors believe that some support for commodities is likely to beprovided by the significant stimulus packages announced by manymajor countries, which prioritise commodity-intensive infrastructureinvestment. Another positive development is the mining industry’saction to curtail uneconomic supply and limit the build-up of excessinventories, which has occurred more rapidly and to a greater extentthan in previous downturns.
Notwithstanding the global economic downturn, the economicdevelopment and urbanisation of emerging economies remains asignificant trend that is set to positively influence the fortunes ofthe mining sector over an extended timeframe. With this in mind,Xstrata’s management and employees remain focused on taking theappropriate action to ensure the Group remains well positioned toweather current challenging conditions and benefit from encouragingmedium- to longer-term prospects for demand for commodities.
In view of Xstrata’s rights issue to repay debt, approved by Xstrata’sshareholders at the EGM on 2 March, the Board has decided not topay a final dividend for 2008. We will, of course, review the potentialto resume dividends at the earliest opportunity, taking into accountthe Group’s financial position and prospects.
There is no doubt that 2009 will represent a challenging operatingenvironment for Xstrata and the mining sector as a whole. YourBoard has every confidence that Xstrata has the requisite skills,management structure and financial flexibility to mitigate the risksand seize the opportunities created by current economic conditions,with the overarching objective of continuing to create value for itsshareholders over the long term.
Willy StrothotteChairman

10 Xstrata plc Annual Report 2008
Xstrata plc Annual Report 2008 11
212 Chief Executive’s Report17 Strategy21 Sustainable Development25 Principal Risks and Uncertainties
Strategy
Nickel at the Nikkelverk refineryin Norway, where record nickelproduction was achieved in 2008
<

12 Xstrata plc Annual Report 2008
Strategy: Business Review
Chief Executive’s Report
“Xstrata’s businessachieved a highlycreditable result in2008, generatingEBITDA of $9.7 billion.”
Mick DavisChief Executive
Key points:> Strong operating performance and
successful integration of acquisitions> Seven consecutive years of sustainable
real cost reductions> 2 for 1 rights issue to raise approximately
$5.9 billion> Acquisition of Prodeco, world-class
Colombian thermal coal operations
To see a webcast of our results presentation,visit www.xstrata.com

Despite the sudden and severe impact of a global banking crisis thatdramatically slowed economic growth from the third quarter and ledto a precipitous fall in commodity prices, Xstrata’s businesses achieved ahighly creditable result in 2008, generating EBITDA of $9.7 billion, 11%lower than the record profitability achieved in 2007. Earnings per shareof $4.90 were 13% lower than the prior year. The impact of markedlylower commodity prices in the final quarter was largely offset by thebenefit of record thermal and coking coal and ferrochrome contractssettled during the year, together with robust copper prices for themajority of 2008.
A strong operating performance at Xstrata’s coal, alloys, nickel andzinc operations, the successful integration of the acquired Tahmoorand Resource Pacific coal operations and Jubilee nickel assets, thecommissioning of the Perseverance zinc mine and Elandsfontein PGMoperations led to record production across a number of the Group’skey commodities. Copper volumes increased by 16% in the secondhalf compared to the first half, when lower grades and a numberof one-off operational difficulties reduced volumes.
The successful commissioning and ramp up of new, lower costproduction and a number of productivity improvements, in particularat Xstrata’s zinc and coal operations, mitigated ongoing inflationarycost pressures and achieved real cost savings of $184 million.At Xstrata Alloys, the Lion ferrochrome smelting complexand Bokamoso pelletising plant contributed greater than expectedimprovements in energy efficiency and ore consumption. Theseproprietary, industry-leading technologies continue to show theirworth, as further efficiency savings are set to mitigate the adverseimpact of standing charges in 2009 in respect of idled capacity,which currently represents some 80% of annual capacity.
Cost deflation in respect of major input items has lagged the severedecline in commodity prices but is beginning to accelerate, in particularfor fuel, raw materials and contract labour, and will contribute togreater operating cost savings in 2009. The impact of a stronger USdollar against the major commodity-producing currencies is alsoexpected to provide a significant offsetting benefit to lower pricesin 2009.
Rapid supply-side response tomarket conditionsEconomic growth projections in the main OECD countries werealready being reduced during the first half of 2008, but dramaticallydeclined in the wake of the financial crisis in September. Failing banksresulted in a severe tightening in money supply and liquidity continuesto be very constrained. The consequence has been rapid de-leveragingand destocking across the world economic system, with the US, UK,Japan and Euro-zone economies falling into recession and growthrates in the developing economies moderating significantly.
Since the financial crisis in September 2008, the majority of LMEcommodities have traded at ultimately unsustainable levels at orbelow their marginal cost of production.
It is striking and important to note that the mining industry hasresponded to this sudden reversal in fortunes with far greaterspeed and to a greater extent than in previous economic downturns.Restricted access to capital, in particular for junior mining companiesor marginal producers, has further contributed to the prompt closureof unprofitable operations and the curtailment of exploration anddevelopment of new growth projects. Consolidation of the sectorhas undoubtedly also played its part, with a smaller number of majorproducers acting responsibly and rationally in the face of extraordinaryfinancial market conditions and weak demand for commodities.
The response from nickel producers has perhaps been the most rapidand significant, with over one-fifth of global supply suspended orclosed to date and further cutbacks expected. One million tonnesof zinc or 9% of planned zinc production has been idled or closed.At the same time, significant proportions of ferrochrome capacityand 24 million tonnes or 13% of planned coking coal productionhas been removed from the traded market as cutbacks continueto be implemented in response to weak demand from steelmakers.
In the copper market too, previously planned global copper productionin 2009 is expected to be reduced by at least 9% or 1.6 million tonnesdue to production cutbacks and suspensions and the ongoing impactof mine underperformance at a number of major copper operations.Perhaps even more noteworthy is the likely impact on longer-termsupply growth, as announced cancellations or deferral of growthprojects have removed over 2.8 million tonnes of new copper supplyover the next four years, introducing significant future constraints.
While near-term market conditions remain very challenging, the swiftreduction of existing production and the suspension of loss-makingoperations will limit oversupply and ultimately result in a more balancedmarket as demand starts to increase from current depressed levels.
In the medium term, the current shortage of capital and poor short-term visibility are leading to substantial capital expenditure reductionsby major and junior miners to defer or forgo growth projects.Further delays to new production capacity to replace ageing mineswith declining grades and increasingly difficult mining conditions aresowing the seeds of future undersupply and significant price increasesacross a number of commodities, once global industrial productionand demand for commodities resume their longer-term growth trend.
Substantial global fiscal stimulus packagesThe mining industry’s response to the sudden downturn in globaleconomic conditions has been matched by government-led actionsto attempt to restart growth, improve liquidity and secure the globalbanking system. In total, over $1.7 trillion of fiscal stimulus packageshave been announced to date in major commodity-consumingregions including China, Japan, Europe and the US. A very significantproportion of this total – for example, more than 70%, or $400 billion,of China’s total investment – has been earmarked for metals-intensiveinfrastructure investment and is consequently expected to bolsterdemand for commodities.
Together with looser monetary policy to encourage industrialproduction and economic growth, these measures are expectedto begin to ease economic conditions in due course.
Xstrata’s response to the sudden downturnOur businesses have acted promptly and decisively in responseto sudden lower demand for key commodities and conservedcash during a period of heightened uncertainty by:
> suspending or closing higher cost or unprofitable production;
> aligning production with reduced demand;
> redoubling efforts to drive down operating costs and tightlycontrol working capital; and
> substantially reducing discretionary sustaining and expansionarycapital expenditure.
Suspension of marginal productionXstrata Zinc and Teck Cominco closed the joint venture LennardShelf zinc-lead operation in Western Australia in early August inresponse to ongoing lower zinc prices in what now appears to havebeen a prescient decision, given the financial meltdown in September.
Xstrata plc Annual Report 2008 13

Faced with the confluence of depressed nickel prices and recordoil prices during 2008, Xstrata Nickel acted swiftly to suspend itsFalcondo ferronickel operation in the Dominican Republic in Augustbefore placing the operation under care and maintenance in earlyDecember. Falcondo has traditionally been a swing producer and,while the decision to suspend an operation is never taken lightly,ceasing production in a timely manner avoided over $85 million ofoperating cash losses at this operation in the second half. At Sudbury,Xstrata Nickel accelerated the closure of the Thayer-Lindsley andCraig mines, which were approaching the end of their useful lives.
A number of other operations remain under review and I am confidentthat our management teams will continue to take prompt action toimprove the operating cost profile of our operations and ensure that ourbusinesses remain financially robust throughout the economic cycle.
Aligning production with demandThe sudden deterioration in economic conditions had a particularlystrong impact on the steel sector, affecting demand for all commoditiesused in stainless and carbon steel production. In response to weakerdemand for ferrochrome, the Xstrata-Merafe Chrome Ventureprogressively suspended 17 ferrochrome furnaces in South Africa,representing approximately 80% of annual production capacity,prioritising lower cost, energy efficient production from the Lionand Lydenburg Premus smelters.
Coking coal demand has similarly declined in line with lower steelproduction. Xstrata Coal’s Oaky No 1 mine in Queensland, Australia,suspended longwall operations as it came to the end of a section.A development unit has been installed to ensure the mine is ableto respond quickly when market conditions improve.
Production at McArthur River Mine was reduced to an annual rateof 2 million tonnes of ore per annum, from 2.5 million tonnes perannum, in line with deteriorating market demand for McArthurRiver’s bulk zinc-lead concentrate from ISF smelters.
Operational changes of this nature, especially the closure ofoperations, unfortunately but inevitably result in impacts on Xstrata’semployees and contractors, as operations seek to ensure they havethe appropriate workforce structure for prevailing market conditions.We have sought to minimise the impact of operational restructuringor closures on our workforce and avoid compulsory redundanciesto the extent possible, including through offering early retirementschemes or alternative positions within the Group, or by not fillingvacant positions. Overall headcount, including contractors, has beenreduced by 5,500 positions to date.
Despite the current period of uncertainty and significant changeat our operations, I am very pleased that Xstrata’s businesses havecontinued to achieve significant improvements in safety performance.The frequency of total recordable injuries recorded across the Groupimproved by 18% in 2008 compared to the previous year, withparticularly strong reductions in injuries at Xstrata Alloys, XstrataCopper and Xstrata Zinc.
Operating cost reductionsThe current economic climate has provided additional impetus andurgency to our management teams’ ongoing efforts to pursue everyopportunity to reduce costs. We have long recognised that year-on-year cost efficiencies are an important measure of our operationalexcellence and this is borne out by Xstrata’s track record of sustainablecost reductions on a real basis every year since the initial public offering
in 2002. Our approach to costs has always been to progressivelyoptimise productivity and efficiency without sacrificing the longer-termgrowth potential of our operations and this remains a key objective.I firmly believe that Xstrata’s devolved management structure providesa critical competitive advantage in this area. Operational managementteams are incentivised and have the authority to implement innovative,localised initiatives to enhance efficiency that together amount tosignificant, cumulative savings, without the burden of centralised decreesand programmes that ignore the realities of individual operations.
Xstrata Zinc’s recently announced series of measures to optimise itsMount Isa operations offers one example of the initiatives currentlyunder way throughout the Group. Xstrata Zinc aims to achievesubstantial reductions in operating and cash costs while increasingmetal production at Mount Isa. Handlebar Hill open pit mine will beplaced into care and maintenance, while production from the large-scale Black Star open pit operation and higher grade George Fisheroperation at Mount Isa will increase by 35% and 13% respectively.Together, with stockpiled ore from Handlebar Hill, this will enablean optimised throughput at the expanded zinc-lead concentratorof 7.3 million tonnes, 20% higher than in 2008, with improvedrecoveries and increased operational efficiencies. This strategicoperational change will result in a 23% increase in zinc metaloutput and a 17% increase in lead metal output over 2008 levels.Planned capital expenditure at Mount Isa will also be reduced by83% without impacting the integrity of our operations and furthercost savings will be achieved through reducing and deferring themovement of waste material at Black Star by 40%.
In total, operating costs at the Mount Isa zinc-lead operations willbe reduced by $135 million or 32% in 2009. Taking into accountthe increase in metal output and reductions to capital spending, cashsavings are expected to represent over half a billion dollars in 2009,excluding any beneficial impact from the stronger US dollar againstthe Australian dollar. This exceptional result is to the credit of XstrataZinc’s operational management and demonstrates the entrepreneurialapproach being taken across Xstrata’s businesses to reduce costs andimprove productivity.
Similarly, at Xstrata Nickel, the accelerated closure of higher costoperations at Sudbury, together with energy efficiency improvementsand low-capital capacity increases at Nikkelverk is targeted to reduceC1 cash costs at the combined Sudbury and Nikkelverk operationsby over 30% in 2009 compared to 2008, excluding foreignexchange impacts. This substantial cost improvement includes thetransformational impact on the cost profile of the Sudbury complexexpected from the commissioning of the Nickel Rim South operationlater this year. When fully commissioned, Nickel Rim South will morethan replace the lost metal volume from the closed mines, contributesignificantly higher by-product credits and offers substantially lowercash costs through the application of bulk mining methods.
Substantial reductions in planned capital expenditureXstrata’s businesses have developed a significant pipeline of greenfieldand brownfield organic growth options that can be progressed asmarket conditions allow and provide a significant source of futureproduction growth and value creation. Total capital expenditure roseto $5 billion in 2008, including $3.4 billion of expansionary capitalexpenditure to progress key growth projects and commission new, lowercost production including the Perseverance zinc-lead mine in Canadaand the Elandsfontein PGM mine and concentrator in South Africa.
14 Xstrata plc Annual Report 2008
Strategy: Business ReviewChief Executive’s Report continued

However, total expenditure fell below previous guidance for the full year,as Xstrata’s businesses acted quickly in the final months of the year toreduce and defer discretionary capital expenditure in the light of thefinancial crisis and lack of visibility into near-term economic conditions.
During the current period of depressed commodity prices and lowvisibility into near-term economic conditions, Xstrata’s focus is tooptimise cash by reducing capital spending, while preserving thevalue of its significant suite of growth options. An ongoing reviewof all capital expenditure projects has resulted in almost $3 billionof capital expenditure deferrals or reductions for 2009, reducinganticipated capital expenditure for 2009 by approximately 45%relative to previous guidance to $3.4 billion. Forecast expenditurecomprises $1.2 billion of essential sustaining capital expenditure and$2.2 billion of expansionary capital expenditure, of which some $500million relates to projects due to commission in 2009, including theGoedgevonden thermal coal mine in South Africa and the Nickel RimSouth project in Canada. Those elements of Xstrata’s extensive growthpipeline which have been deferred remain available to be acceleratedat the appropriate time and when market conditions allow.
AcquisitionsThrough our acquisition of Jubilee Mines nickel operations in January,Xstrata Nickel has gained access to dwindling nickel sulphide growthopportunities. Our coal team was also able to further its strategyto consolidate major coal complexes through the acquisition of theResource Pacific coal assets in February 2008.
On 1 October 2008, Xstrata announced that it would not proceedwith the proposed acquisition of Lonmin announced in August,due to the risk posed by the requirement to refinance a significantportion of the necessary acquisition facilities within one year. Instead,we increased our stake in Lonmin to 24.9%, providing a significantinterest in one of the world’s leading platinum producers.
We are confident that the long-term fundamentals on which ourinvestment cases in respect of these acquisitions were based remainsound and that these acquisitions represent value-accretive transactionsof long-life operations that will deliver substantial returns to shareholdersover many years. However, with the benefit of hindsight, we may havebeen able to secure these assets at a lower cost and at a time of lessfinancial stress.
Securing an appropriate capital structureThe early actions taken by our commodity businesses to mitigatethe impact of prevailing economic conditions are being matched bya number of proactive initiatives undertaken to secure Xstrata’s capitalstructure. While the Group did not take up the acquisition facilityassociated with the Lonmin transaction, we did proceed with a new$5 billion club facility with a broad group of relationship banks torefinance and extend significantly the tenure of the Group’s existingdebt and provide further headroom. In January 2009, the facility wasincreased by an additional $459 million to approximately $5.46 billion.
As a result of these actions, Xstrata benefits from substantial headroomand no significant debt refinancing requirements until 2011. Net debtof $16.3 billion at the year-end represented gearing (on a net debt tonet debt plus equity basis) of 40%.
Nonetheless, it is clear that, while appropriate for market conditionsexperienced in the first three quarters of the year and indeed in thepast few years, in the aftermath of an unprecedented financial crisis,
Xstrata’s absolute level of debt is now perceived as a potential constrainton the Group, given the uncertainty that exists over the near-termoutlook for commodities.
Our announcement of a 2 for 1 rights issue to raise £4.1 billion(approximately $5.9 billion) excluding costs, will provide a significantinjection of capital, mitigate the risks presented by the currentuncertainty and remove this potential constraint. The proceeds of therights issue will be used to repay bank debt. Specifically, we will payback in full the drawn amount under the Group’s recently increased$5.46 billion revolving facility, with the balance used to repay in partthe drawn balance under a $4.68 billion revolving facility.
Following the rights issue, Xstrata’s net debt will reduce toapproximately $12.7 billion and gearing will reduce to just under 30%,at the lowest end of our long-term target range. Including the netproceeds from the rights issue, the combined impact of the actionstaken by the Group to conserve cash and reduce operating and capitalcosts will add over $7 billion, providing Xstrata with a substantiallystrengthened balance sheet at a time of heightened uncertainty.
Glencore, Xstrata’s major shareholder with an interest of 34.5%, hasprovided irrevocable undertakings to take up its rights in full, and theremainder of the rights issue will be fully underwritten. The issue ofnew shares will be subject to shareholder approval at an extraordinarygeneral meeting to be convened by early March.
Acquisition of ProdecoThe planned rights issue, together with Glencore’s ongoing support forXstrata has provided Xstrata with an opportunity to acquire Glencore’sworld-class, cash-generative Prodeco coal operations in Colombia fora consideration of $2 billion. The addition of these premier operationsinto the Group will consolidate Xstrata Coal’s global leadership inthermal coal and strengthen its strategic position in Colombia, fromwhich it supplies both the European and US markets.
The Prodeco operations comprise the La Jagua and Calenturitas mines,which benefit from the potential to almost double production fromcurrent production of 9 million tonnes per annum of premium quality,export thermal coal. Prodeco also controls its own infrastructure, inthe form of export port facilities, a 40% share in a railroad rail facilitiesand proprietary rolling stock. Xstrata Coal management has detailedoperational experience at these assets, with one of Xstrata Coal’ssenior operational managers having recently held the position of ChiefOperating Officer of Prodeco and the acquisition represents a highlyattractive addition to our industry-leading thermal coal portfolio.As a related party transaction, the acquisition will also be subjectto shareholder approval.
However, Xstrata and Glencore failed to reach full agreement onan appropriate valuation of the Prodeco assets and, as a result, thetransaction agreement includes a call option, under which Glencoremay buy back the Prodeco assets from Xstrata at any point up to thefirst anniversary of the closing date, for a total cash considerationof $2.25 billion, plus the net balance of any cash invested by Xstrataand any profits accrued but not distributed to Xstrata. The call optionagreement ensures that, should the option be exercised, Glencorewill pay a repurchase price that adequately compensates Xstrata’sshareholders for the option granted. In my view, these arrangementsare fair to both parties and at the same time facilitate an orderly rightsissue process, which is to the benefit of all of Xstrata’s shareholders.
Xstrata plc Annual Report 2008 15

In light of the rights issue, the Board has decided not to declare a finaldividend for 2008. The total dividend for the year is therefore 18 UScents per share, paid as the interim dividend on 10 October 2008. TheBoard intends to resume dividend payments to shareholders at theearliest opportunity, while seeking to maintain a prudent capital structureagainst the backdrop of the macroeconomic climate and the Group’scash flow, capital requirements and dividend cover.
The primary objective of our announcements today is to ensure thatXstrata remains financially robust during current challenging marketconditions and going forward, given the lack of visibility into near-term economic conditions. However, looking through the prevailingperiod of uncertainty to the return of a more benign environment,the capital raising also provides the Group with an enhanced platformfrom which, at the appropriate time, to initiate the next stage ofXstrata’s growth.
A number of opportunities are beginning to emerge as a result ofthe dislocation of market values from underlying company valuationsand the distressed or forced sale of attractive, cash-generative assetsor projects. Once visibility into the outlook for commodity prices andcash flows improves, Xstrata will continue to use its proven ability toidentify and execute acquisition opportunities, seeking to improve thestrategic positioning of its business units and the Group as a whole.
We will continue to take a highly disciplined approach to growth.Shareholder value and a prudent approach to funding and capitalstructure will remain our primary considerations. Xstrata remainsfully committed to maintaining an investment grade balance sheetthroughout the economic cycle.
OutlookThe financial crisis has produced a marked lack of visibility into short-term economic activity, and as such, the outlook for 2009 is uncertain.Investment in infrastructure is set to increase during 2009 and 2010,reflecting the significant stimulus packages announced by manymajor governments which prioritise commodity-intensive investmentin many cases.
Notwithstanding prevailing near-term market conditions broughtabout by the financial crisis, the long-term positive trend for increaseddemand for metals and energy remains intact, driven by the ongoingindustrialisation of developing economies and the urbanisation of over20 million people per annum in China and India and over 65 to 70million people globally at current rates. Long-term positive demandtrends of this nature result in higher average commodity prices thanhistorical averages in real terms, as new supply struggles to keep pacewith increasing demand from emerging economies.
At the same time, current market conditions will exacerbate futuresupply constraints, as inventories are depleted by curtailments toexisting supply and exploration investment and growth projectsare deferred or cancelled.
When OECD economies return to a growth phase, the impactof synchronised demand growth from developed and emergingeconomies, coupled with greater commodity supply constraints,has the potential to lead to a rapid increase in commodity pricesand demand, resulting in substantial cash flows and margin expansionfor those metals and mining companies which have weathered thecurrent challenging conditions.
Previous downturns have shown that companies that act quicklyand decisively to secure their future emerge strongly from difficulteconomic conditions, with an improved competitive position. Therights issue, together with the proactive initiatives being undertakenby management and the addition of the cash-generative Prodecoassets, will ensure that Xstrata maintains a robust financial positionthroughout even an extended period of uncertainty, providinga strengthened position from which to pursue growth and valuecreation upon the inevitable return to growth of global economies.
Xstrata continues to operate a suite of cash-generative operationsacross a broad range of geographies, with excellent growth potentialand a strong competitive position in each of its key commoditymarkets. Against a background of strong medium- to longer-termfundamentals for the Group’s products and near-term actions tosecure Xstrata’s financial position, I am confident that the prospectsfor Xstrata remain very encouraging.
Mick DavisChief Executive
16 Xstrata plc Annual Report 2008
Strategy: Business ReviewChief Executive’s Report continued

At the time of Xstrata’s initial public offering in 2002, the Board and management set out ourstrategy to develop Xstrata as a distinct mining company focused on growth and the creationof shareholder value. Since that time, Xstrata has grown to become a major diversified mininggroup with a strong competitive position in each of its key commodity markets, a portfolio ofcash-generative operations and a world-class pipeline of organic growth options.
Xstrata’s strategy has been delivered through:
> the execution and integration of three major acquisitions delivering transformational growth;
> the opportunistic identification and completion of a number of bolt-on acquisitions to deliverincremental growth and improvements to the portfolio;
> the development of a significant internal pipeline of growth options; and
> substantial improvements to the capital and operating efficiency of its businesses.
Xstrata plc Annual Report 2008 17
Strategy
Transforming transactions
Entry into new commodities
Bolt-on acquisitions
Organic growth – brownfieldand greenfield
Net present value enhancementsand operational excellence
Pursue value-enhancing, substantialacquisitions which transform Xstrata’sscale, commodity offering andgeographic diversity
Discussions with Vale terminatedby mutual consent in March 2008;range of opportunities reviewedon an ongoing basis
Development of Elandsfontein operationsfacilitated entry into platinum; acquired24.9% of Lonmin, world’s third largestplatinum producer
Acquisitions of Jubilee Nickel andResource Pacific thermal coal operationscompleted in early 2008
Perseverance zinc mine, Elandsfonteinplatinum mine and concentrator andGlendell open cut coal mine successfullycommissioned on schedule and budget;significant progress made across extensivepipeline of organic growth projects
Real cost savings of $184 million achievedin 2008; significant increases to resourceestimates at Collahuasi, Antamina, andsouthern Peru copper operations; 2008total recordable injury frequency rateimproved by 18%
Further diversify Xstrata’s portfoliothrough buying or building entriesinto tier one commodities with strongfundamentals
Complete value-adding incrementalacquisitions to complement Xstrata’sexisting commodity businesses
Develop and successfully commissionnew mining and metals projects toprovide a valuable source of lowercost production growth
Extend useful life of operations,achieve sustainable cost reductions,improve safety and environmentalperformance, enhance our reputationas industry-leading stewards of ourshareholders’ assets
Description 2008 performance summary
Core Strategy: Growth and Value Creation

18 Xstrata plc Annual Report 2008
Strategy: Business ReviewStrategy continued
Diversified portfolio with significant industry positions
0
500
1,000
1,500
2000
XstrataENRCSamancorHernicAssmang
Top five ferrochrome producers (kt)
0
20
40
60
80
XstrataAdaroAngloAmerican
BHPBilliton
BumiResources
Top five thermal coal producers (mt)
0
20
40
60
80
BHPBilliton/
MitsubishiAlliance
TeckCominco/Fording
XstrataAngloAmerican
Rio Tinto
Top five coking coal exporters (mt)
0
500
1,000
1,500
2000
CodelcoFreeport-McMoRan
BHPBilliton
XstrataRio Tinto
Top five copper producers (mined) (kt)
0
100
200
300
400
MMCNorilsk
ValeBHPBilliton
PT AnekaTambang
Xstrata
Top five nickel producers (mined) (kt)
0
300
600
900
1200
XstrataOzMinerals
GlencoreTeckCominco
Vedanta
Top five zinc producers (mined) (kt)
Competitive position
Xstrata continues to pursue a core strategy of value creation andgrowth. However, since mid-September 2008 the global financialcrisis has led to an unprecedented liquidity shortage in financialmarkets leading to markedly lower expectations for global economicgrowth and sudden and severe declines in the price of commoditiesproduced by Xstrata. Given the lack of visibility into economicprospects and the uncertain outlook for commodity prices inthe short term, Xstrata’s near-term strategic imperatives are to:
> implement operating plans to reposition operations lower on thecost curve;
> optimise cash in the short term to ensure the Company remainsfinancially robust with an investment grade balance sheet evenunder a scenario in which the period of uncertainty is unexpectedlyprolonged; and
> position Xstrata to emerge from the current downturn withimproved financial flexibility, allowing the Group to pursue value-accretive growth opportunities presented by the current dislocationof market values and underlying valuations.
Xstrata’s businesses have acted rapidly and decisively in response tothe sudden lower demand for key commodities and need to conservecash by:
> suspending or closing higher cost or unprofitable production;
> aligning production with demand;
> redoubling efforts to drive down operating costs and working capital;
> substantially reducing discretionary sustaining and expansionarycapital expenditure; and
> securing a robust capital structure through refinancing andrestructuring existing debt and through a substantial, fullypre-emptive rights issue to repay existing debt.
Xstrata is the fifth largest diversified mining company in the world, withtop five industry positions in copper, export thermal coal, export cokingcoal, ferrochrome, zinc and nickel. In addition, the Group has recyclingfacilities, additional exposures to platinum, gold, cobalt, lead, silver andvanadium and a suite of mining and metals related technologies, manyof which are industry leaders. As a FTSE 100 diversified mining company,Xstrata’s key competitors are Anglo American plc, BHP Billiton plc andRio Tinto plc, all of which are listed on the London Stock Exchange,and Vale, a Brazilian mining company. Our financial KPIs on page 32show our performance against our key FTSE 100 listed competitors(collectively ‘FTSE Diversifieds’). A broader, global industry peer groupis used to benchmark total shareholder return performance, includingto determine performance under the Group’s long-term incentive plan.
Competitors*
Key FTSE 100 competitors: Global peer group**:Anglo American Alcoa IncBHP Billiton Arch Coal IncRio Tinto Companhia Vale do Rio Doce (Vale)
Copper & Gold IncEramet SAFreeport McMoRanGrupo Mexico SA de CVImpala Platinum Holdings LtdKorea Zinc IncMMC Norilsk NickelNordeutsche Affinerie AGPeabody Energy CorpTeck Cominco LtdVedanta Resources plc
* 2009 peer group**Includes FTSE Diversifieds
Strategy in focus
Based on 2008/09 Xstrata/CRU/Brook Hunt production estimates on a consolidated basis

Xstrata produces and sells exchange-traded base and precious metals,and bulk commodities where prices are negotiated on longer-termcontracts. Xstrata’s customer base consists principally of largeindustrial concerns.
Xstrata AlloysXstrata Alloys is currently the world’s largest and amongst the lowestcost integrated ferrochrome producers in the world (through the Xstrata-Merafe Chrome Venture), one of the world’s largest producers of primaryvanadium and a growing producer of platinum group metals. Over 80%of the world’s ferrochrome is utilised in the production of stainless steeland is sold on long-term contracts. The principal end-use of vanadium isas an alloying agent in steel. Xstrata produces vanadium pentoxide andferrovanadium, which are sold to a diversified international customerbase. Platinum Group Metals (PGMs) comprise platinum, palladium,rhodium, iridium, ruthenium and osmium. PGMs are used in autocatalysts and fuel cells, providing cleaner energy. Other key marketsinclude jewellery and industrial and consumer products. Furtherinformation on ferrochrome, vanadium and PGM markets is availableon page 46.
Xstrata CoalXstrata Coal is the world’s largest exporter of thermal coal, used togenerate electricity in coal-fired power stations. Xstrata is also oneof the largest producers of export semi-soft coal and among thetop five producers of export coking (or metallurgical) coal, used insteelmaking. Around 90% of Xstrata’s coal production is exported,with the remainder sold to domestic Australian and South Africanmarkets. Sales of coal are primarily through annually renewablelong-term contracts, with some sales concluded on the spot market.Xstrata’s Australian thermal coal operations supply major powergeneration companies in the Asia-Pacific region, while our Australianmetallurgical coal mines supply major steelmakers worldwide. Xstrata’sSouth African coal operations largely supply the Atlantic thermal coalmarket, where Europe is the major export destination. In Colombia,Xstrata has recently acquired Prodeco and also owns a one-third stakein the Cerrejón mine, both of which export high grade thermal coalto Europe and the Americas. Further information on coal markets isavailable on pages 50 to 51.
Xstrata CopperXstrata Copper is a fully-integrated producer of copper metal andconcentrate and is one of the world’s five largest producers of minedcopper. Xstrata’s excess copper concentrate production is sold tocustom copper smelters in South America, Asia and Europe, with over90% sold under contracts and the remainder sold on the spot market.Xstrata Copper’s refined copper metal cathodes are sold to producersof industrial products and traders in major copper consuming regions.North America accounted for approximately 53% of total sales in2008, with the remainder sold to customers in Europe and Asia.Cathodes are predominantly used in the manufacture of copperwire rod for electrical conductor applications. Further informationon copper markets is available on page 56.
Xstrata NickelXstrata Nickel is one of the world’s five largest producers of nickeland one of the largest recyclers and processors of nickel and cobalt-bearing materials. Xstrata Nickel’s Nikkelverk refinery in Norwayproduces very high grade purity nickel and cobalt from materialsourced from Xstrata Nickel’s mining operations in Canada andAustralia. Ferronickel from Xstrata’s Falcondo operation (currentlysuspended) is sold into the stainless steel market. The high gradenickel produced at Nikkelverk is typically sold into first end-useapplications such as high nickel alloys, superalloys, low alloy steel,foundry and electroforming. Cobalt from Nikkelverk is typically soldinto such end-use applications such as aerospace, land-based turbinesand electronics. Further information on nickel markets is available onpage 64.
Xstrata ZincXstrata Zinc is a fully integrated producer of mined zinc and leadconcentrate, zinc and lead metal and silver. Around half of all zincmetal produced globally is used to galvanise steel, an environmentallyfriendly way of protecting steel against corrosion. Zinc is also used inthe manufacture of die-cast alloys, brass and the production of zincoxides and chemicals. The majority of Xstrata’s zinc metal productionis sold under term contracts to the EU, Canada and the US. Zincconcentrates are sold mainly to Japan, South Korea, China, Australiaand Europe. Further information on zinc markets is available onpage 70.
Xstrata plc Annual Report 2008 19
Key products and markets
Revenue by origin
Africa 11%
Europe 10%
South America22%
North America26.5%
Australasia30.5%
Revenue by destination
North America23%
Europe29%
South America5%
Asia 36%
Africa 3%Australasia 4%
EBIT by origin
North America3.5%
South America27%
Africa 19%Australasia47.5%
Europe 3%
EBIT by commodity
Nickel 5%
Copper 32%
Zinc 2%
Coal 49%
Alloys 14%

20 Xstrata plc Annual Report 2008
Strategy: Business ReviewStrategy continued
We consider the following resources to be essential to the effectiveexecution of our strategy.
Diversified portfolioXstrata’s portfolio is diversified by commodity and by geography,balancing the risks associated with specific commodity price cyclesand operating locations and providing investors with more reliableand stable cash flows. Diversification also engenders healthycompetition for capital between Xstrata’s commodity businesses.
Extensive organic growth pipelineXstrata benefits from a significant growth pipeline across a numberof commodities, allowing the strategic sequencing of projects anddeployment of capital from which significant volume growth andsuperior returns can be achieved. Those elements of Xstrata’sextensive growth pipeline which have been deferred remainavailable to be accelerated at the appropriate time.
Acquisition and integration capabilityXstrata has developed and demonstrated a significant capability inthe opportunistic identification of acquisition opportunities; the abilityto execute transactions where the value proposition is compelling; andthe rapid integration of acquired operations. This capability has beenreplicated at the commodity business level, enabling smaller bolt-onacquisitions to be completed.
Devolved management structureXstrata’s management model is highly devolved and comprises avery lean corporate centre and fully resourced, standalone globalcommodity businesses. The role of the corporate centre is welldefined, to minimise bureaucracy and rational risk-taking issponsored to stimulate innovation. We believe this model isa significant competitive advantage and enables Xstrata to bemore opportunistic, and less bureaucratic than other companiesof a similar scale and geographic reach.
Financial positionWe are committed to maintaining a robust balance sheet andinvestment grade credit rating, ensuring access to a diverse range offunding sources. The ability to withstand periods of low commodityprices and to fund growth in a cost effective and timely manner, whenappropriate, is essential to enabling the Group to achieve its strategy.
Resource and reserve baseXstrata benefits from a significant resource and reserve base acrosseach of its major commodities. The Group’s focus on value creationand near-mine exploration has enabled us to extend or replace theresource base of a significant number of our assets over the pastseveral years. Xstrata’s resource base compares favourably withmining industry peers. The Group reserve and resource statementis published annually and is available from the Xstrata website.
Technological expertiseXstrata benefits from a significant depth of technological and technicalexpertise which is critical for improving the efficiency of Xstrata’soperations and for major project development. Xstrata TechnologyServices comprises Xstrata Technology and Xstrata Process Support. Inaddition, Xstrata’s commodity businesses also develop and implementproprietary technologies to improve efficiency.
Exploration capabilityXstrata does not maintain a central or standalone exploration function.Xstrata’s commodity businesses are responsible for undertaking ‘near-mine’ exploration around existing operations or in nearby regions,leveraging existing infrastructure and conducting targeted greenfieldexploration at known deposits.
Relationships with stakeholdersXstrata is committed to the maximum transparency that is commerciallypossible and to engaging openly, honestly and in a culturally appropriatemanner with its stakeholders. These include: the investment community,employees and unions, governments and regulators, communitiesassociated with our operations, customers, suppliers, business partners,non-governmental and development organisations.
Xstrata’s revenues and earnings depend in large part upon theprevailing prices for the commodities it produces. Commodity pricesare significantly affected by global economic conditions and industrialproduction. In recent years, commodity prices have exhibited a broadlyupward trend, reflecting demand generated by global economicgrowth, particularly in China and India as those countries urbaniseand industrialise. Commodity prices have also been influenced bythe growth of exchange-traded commodities futures markets.
Recently, however, the rapid deterioration in global economic conditionshas led to reduced global demand, stock drawdowns, increased useof scrap or recycled materials and the unwinding of speculative tradingpositions. As a result, the prices of many of Xstrata’s commodities havefallen significantly from their previous highs.
Although the short-term outlook for 2009 is uncertain, many majorgovernments have announced and implemented monetary and fiscalstimulus packages which will increase investment in commodity-intensive infrastructure during 2009 and 2010. In the medium term, ashortage of capital and poor short-term visibility is leading to the delayor cancellation of organic growth projects by major producers and theinability of the junior mining sector – which traditionally identifies newsupply – to raise new finance. As a result, new production capacityto replace ageing mines with falling grades and increasingly difficultmining conditions is likely to be delayed, contributing to significantfuture supply constraints.
Xstrata’s Board continues to believe that demand for commoditiesand consequently commodity prices will continue to be influenced bya long-term positive trend, driven by the ongoing industrialisation ofdeveloping economies and the urbanisation of over 65 to 70 millionpeople globally each year. When OECD economies return to growth,the impact of synchronised demand growth from developed andemerging economies, coupled with constricted commodity supply,has the potential to lead to a rapid increase in commodity demandand prices. This is likely to result in substantial cash flows and marginexpansion for those metals and mining companies which haveweathered the current challenging conditions.
Glencore International AG is Xstrata’s major shareholder and, atthe date of this document holds 34.45% of Xstrata’s issued sharecapital. The relationship between Xstrata and Glencore is regulatedby a Relationship Agreement which ensures that all commercialarrangements are transacted on an arm’s-length basis. Glencore isthe sole distributor of Xstrata nickel, cobalt and ferronickel production,has sales agreements with Xstrata Copper for substantial amounts ofits copper concentrate and copper cathode and is the marketing agentfor much of Xstrata Alloys’ ferrochrome and vanadium. Glencore hasa market advisory role with Xstrata Coal. Full details of related partycontractual arrangements are provided on pages 186 to 188.
Significant contractual arrangements
Future trends
Strategic resources

Xstrata plc Annual Report 2008 21
To achieve our Mission and deliver industry-leading returns to ourshareholders over the long term, we recognise that we must balancesocial, environmental and economic considerations in how we manageour business.
We are committed to the goal of sustainable development. We believethat operating to leading standards of health, safety and environmentalmanagement, contributing to the development of sustainablecommunities, and engaging with our stakeholders in two-way, opendialogue, regardless of our location, enhances our corporate reputationand is a source of competitive advantage. This enables us to gain accessto new resources, maintain a licence to operate, attract and retain thebest people, access diverse and low-cost sources of capital, identify andact upon business opportunities, and optimise our management of risks.
We comply in full with the laws and regulations in each countrywhere we operate. In addition, we operate in accordance withXstrata’s sustainable development framework, aspiring to achievethe highest international standards regardless of location and withoutexception. We conduct regular internal and external audits of ourbusinesses and operations to assure compliance with our businessprinciples, policies and standards.
Our aim is to be a leader in our industry in delivering value toour shareholders, contributing to the sustainable developmentof communities associated with our operations, operating safely,contributing to the well-being of our workforce and local communitiesand preserving the long-term health and viability of the environmentin which we operate. We achieve this through integrating sustainabledevelopment considerations into our day-to-day managementpractices, business planning and core strategy; monitoring andreporting on our performance and systems on a regular basis; andbenchmarking against our competitors and other sectors to achieveour aim of continuous improvement. In 2008, Xstrata was recognisedby the Dow Jones Sustainability Index as the leading company in thebasic resources sector for the second consecutive year.
Vision and strategy
Sustainable DevelopmentXstrata produces a separate, comprehensive Sustainability Report, which isexpected to be published in April 2009. The section below provides a summaryof our policies and practices in a number of key areas: vision and strategy;governance; our people; health and safety; environment and community.
Sustainablecom
munities
Health and safety
Gov
erna
nce and ethics
Our
peop
le
We
can
achi
eve
this
only
thro
ugh
genu
inepartnerships with employees, custom
ers, shareholders,localcomm
unitiesan
dot
hers
take
hold
ers,
whi
char
eba
sed on integrity, co-operation, transparency
andm
utualvalue-creation
Environment
Our approach
For more information visit: www.xstrata.com/sustainability
We will growand manage a diversifiedportfolio of metals and
mining businesses with thesingle aim of delivering
industry-leading returns forour shareholders.

Xstrata’s sustainable development assurance programme
The Xstrata Board sets and reviews Sustainable Development Policyglobally. Xstrata’s Board Health, Safety, Environment and Community(HSEC) Committee was established in 2005 to assist the Board inits HSEC responsibilities and to provide guidance on sustainabledevelopment issues. Further details about the Board HSEC Committeeand its activities during 2008 are provided in the CorporateGovernance section on pages 91 to 97.
Sustainable Development FrameworkXstrata’s Sustainable Development Framework sets out theGroup’s expectations and commitments relating to the sustainablemanagement of our business, comprising:
> Business Principles: Provide an unambiguous statement of howwe conduct our business – ethically, openly, responsibly, togetherand with others;
> Sustainable Development Policy: Sets out the principles we applyto our management of health, safety, our people, communities andthe environment;
> Sustainable Development Standards: Set out the Grouprequirements and expectations for each of our commoditybusinesses on sustainability issues; and
> Independent Assurance Programme: The key mechanismthrough which the Xstrata Board and management gain assurancethat the Group’s policies and standards are being met.
Xstrata’s business principles, policies and standards are availablefrom our website www.xstrata.com/sustainability.
Xstrata’s Sustainable Development Framework is regularly reviewedand a revised version was approved by the Executive Committee andBoard in December 2007. Our Sustainable Development Frameworkhas been mapped to show alignment to international standardsincluding the ICMM and UN Global Compact principles, VoluntaryPrinciples on Security and Human Rights, ISO14001 and OHSAS18001.
Governance
Strategy: Business ReviewSustainable Development continued
22 Xstrata plc Annual Report 2008
1. SD Risk andOpportunityIdentificationand Evaluation
2. SD Objectivesand Ambitions
3. SD Strategy 4. SD Priorities,Targets, Plans andResources
5. SDProgrammes,Systems, Processes,Reports
Sustainable development framework
Mission
BusinessPrinciples
SD Policy
SD Standards
SD Procedures and Guidelines
Commodity Business SD Frameworks
Operational SD Systems
VerificationSD Risk andVerification Audits(third party)
SD StandardsAudits(self-managed orthird party)

Xstrata plc Annual Report 2008 23
Xstrata’s long-term interests rely on the Company’s ability to attractand retain the best people, at every level, with the appropriate skills.We provide industry-leading career development opportunities,well structured employment contracts and fair and competitiveremuneration. The majority of our workforce is engaged oncollective employment agreements negotiated with unions andother representative organisations. We believe that all of the Group’soperations have, in general, good relations with our employees andthe unions that represent them.
As set out in Xstrata’s Sustainable Development Policy (‘SD policy’),we maintain a safe workplace that is based on mutual respect,fairness and integrity. We support our employees’ right to freedomof association and collective bargaining, provide fair remunerationand employ and promote on the basis of merit, upholding legislationin certain regions that aim to benefit historically disadvantagedgroups. We consult, communicate and provide appropriate supportto employees during significant organisational changes includingclosures, acquisitions, mergers and divestitures.
In 2008, Xstrata created a total of 3,409 new positions (2007: 3,045).A total of 311 permanent employees were made redundant and1,721 employees’ contracts were compulsorily terminated (excludingcontractors) in the period to 31 December 2008. The average numberof employees in 2008 was 40,049 (2007: 39,008) and the averagenumber of contractors was 28,291 (2007: 22,504).
Turnover increased in 2008 compared to the previous year, dueto competition for skilled labour in the earlier part of the yearand increased redundancies in the latter part of the year, reflectingeconomic conditions in each case. Given the low commodity priceenvironment, competition for skilled labour is reducing and voluntaryturnover is expected to decline in 2009. However, in response to therapid deterioration of economic conditions in late 2008, a numberof operations are suspending, scaling back or closing activities toconserve cash and ensure our businesses remain robust in challengingmarkets. These actions often require headcount to be reducedthrough redundancies, voluntary retirement or through not fillingvacant positions.
In the six months from September, overall headcount has beenreduced by approximately 5,500 positions across the Group, includingcontractors. Employee assistance programmes, retraining and othercommunity or financial assistance have been provided as appropriatefor affected employees.
A wide range of training, leadership and skills developmentprogrammes are in place at a Group and commodity business levelfor employees and management. We value and promote diversity inmanagement and the wider workforce. Xstrata’s SD policy states thatwe do not tolerate any form of workplace discrimination, bullying,harassment or physical assault and we provide a fair and non-discriminatory employee grievance system. We do not set formaldiversity targets, with the exception of South Africa, where ourbusinesses are complying with requirements under the Mining Charter.
Key performance indicators comprising employee turnover, diversity,training hours and expenditure are provided on page 33, with adescription of performance against these indicators on page 35.
Employees
We aim to operate a safe workplace that is injury- and fatality-free,and to enhance the well-being of employees, contractors andcommunities. Safety is given the highest priority by management.To achieve our aim of zero injuries, occupational illnesses or fatalities,we focus on the following:
> visible safety leadership;
> appropriate safety training at every level;
> fostering a positive safety culture, behaviour and awareness;
> identification and elimination/mitigation of safety and health hazards;
> operational integrity;
> safe work systems;
> occupational and community health and hygiene programmes;
> monitoring and management of contractors/partners’ safetyperformance;
> reporting, management and learning from actual and highpotential risk incidents; and
> preparing for and effectively responding to emergencies and crises.
Xstrata’s fatality prevention programmes have achieved substantialreductions in some principal causes of previous fatalities or criticalincidents at its operations. In particular, underground roof falls andnear-miss or actual incidents involving mobile equipment undergroundhave significantly reduced in South Africa, where the majority offatalities have historically occurred. Nonetheless in 2008, we deeplyregret that six people lost their lives at Xstrata’s managed operations,including four fatalities at South African operations. Every incident andhigh potential risk incident is reported and thoroughly investigated toensure we learn from them and we implement all appropriate trainingor hazard management improvements identified.
Injury frequency rates continue to improve significantly year-on-year,reflecting the impact of ongoing training, learning from incident andnear-miss investigations, initiatives to address behavioural and culturalissues that impact safety performance and ongoing safe workingprogrammes. In 2008, the frequency of total recordable injuriesreduced by 18% compared to 2007, or by 24% on a like-for-likebasis excluding 2008 acquisitions.
We encourage and support our people and the communities associatedwith our operations to participate in programmes which enhance theirhealth and well-being. Our health programmes encompass occupationalhealth, the well-being of our employees and community health issues.At each location, we identify the main health issues affecting ourworkforce, including global epidemic diseases such as HIV/AIDS, malariaand tuberculosis, and implement healthcare programmes in partnershipwith local health authorities and NGOs.
Xstrata’s South African workforce is particularly impacted by the HIV,AIDS and tuberculosis (TB) epidemics. Comprehensive, fully fundedworkplace testing, counselling and treatment programmes are in placeacross our South African operations. We have also initiated innovativepublic-private partnerships with provincial government and other
Health and safety

Strategy: Business ReviewSustainable Development continued
24 Xstrata plc Annual Report 2008
partners, to extend voluntary testing, counselling and treatmentinto communities associated with our operations. In 2008, 97% ofXstrata Coal South Africa employees and over 80% of Xstrata Alloysparticipated in voluntary HIV testing to know their HIV status.
Our health and safety performance against key indicators is shownon page 33 and described on page 35.
Xstrata’s SD policy sets out our aim to preserve the long-term health,function and viability of the natural environments affected by ouroperations. We have ISO 14001 compliant management systems inplace to ensure all Xstrata operations reach the high environmentalstandards we demand and that are expected by governments, industrybodies and society as a whole. Our SD policy sets out our commitmentto identify, reduce and, where possible, eliminate all significantimpacts of our mining, metallurgical and exploration activities on theenvironment. Our principal environmental impacts are in respect of:
> use of resources, particularly water and energy;
> climate change, due to direct and indirect greenhouse gas emissionsat our operations and the carbon emissions associated with burningthe coal we produce to generate energy;
> other emissions, including sulphur dioxide and heavy metals frommetallurgical plants;
> land disturbance and biodiversity impacts;
> waste material produced from our operations; and
> environmental impacts associated with our products and supply chain.
Our SD policy states our commitment to reduce direct and indirectgreenhouse gas emissions and to work with governments, industryand academia to help develop policies and technologies to addressclimate change, in particular to mitigate emissions from burning coalto generate power. Climate change presents a significant long-termrisk to our business because of increased regulation, rising energycosts, taxation of carbon emissions and physical threats from changesto weather patterns. Xstrata Coal continued to fund a number ofdevelopment projects into low emissions technologies and continuesto play a key advocacy role in engaging with government and industrybodies on carbon legislation and support for new technologies.
We aim to continually improve the efficiency with which we useraw materials, energy and natural resources. In 2008 our businessescontinued to implement initiatives to improve energy efficiency and wesignificantly increased our use of recycled water to replace fresh wateruse where appropriate. In line with our policy commitment to reduceharmful emissions to air, water and land, we initiated a number ofcapital projects to improve sulphur dioxide and heavy metals capture atour metallurgical operations in 2008. An extensive Smelter EmissionsProject is under way at our Mount Isa operations to achieve significantreductions in emissions by 2012.
We avoid net losses or degradation of natural habitats, biodiversityand landscape functions. Additional biodiversity offset areas wereimplemented during the year to set aside land for flora and faunaconservation and a number of monitoring programmes wereimplemented to assess potential biodiversity impacts in higherrisk regions.
Environment
Further progress was achieved in the Sudbury Soils Study in Canadaand the Whole of Emissions studies at Mount Isa, Australia, bothof which were initiated to examine potential human and ecologicalrisks from heavy metals. Soil remediation projects to address historiccontamination were successfully undertaken at a number of sites inAustralia and Canada in partnership with local authorities and industryparticipants. We also increased the capacity of our recycling operationsto process additional base and precious metals, prolonging the lifecycle of metals and reducing waste to landfill.
In 2008, Xstrata did not achieve its target of zero fines or penaltiesand incurred four environmental fines totalling $25,300. Two ofthe four incidents occurred at Australian operations and two at ourChilean operations. All incidents subject to fines were categorised ascategory two (minor impact requiring minor remediation) or lower andremediation plans have been implemented to prevent reoccurrence.
Our performance against key environmental indicators is provided onpage 34 and a description of our performance against environmentalindicators is provided on pages 35 to 36.
Xstrata’s SD policy states our commitment to contribute to the socialand economic development of sustainable communities associatedwith our operations. We engage and consult with communitiesaffected by our operations in a transparent and culturally appropriateway. We recognise their rights and respect local laws, customs andcultural heritage. At every stage of a project’s life cycle, we identifyand evaluate communities’ concerns and needs, as well as the actualand potential social impacts of our operations. All operations andprojects have procedures in place for community engagement andgrievances or conflict resolution mechanisms.
We prioritise local employment and procurement and providesupport for enterprise development, community skills developmentand training programmes, particularly in areas of high unemploymentand greater economic need. Our engagement and community supportprogrammes recognise that indigenous people and other groupsincluding women, the elderly and children are particularly vulnerableand seek to address the particular needs of these groups.
We avoid resettlement of communities wherever possible. Where thisis unavoidable, we adhere to the World Bank Operational Directive onInvoluntary Resettlement and seek to maintain or improve standardsof living and provide ongoing support for resettled communities. In2008, 20 households in South Africa and 139 households in SouthernPeru were resettled as a result of Xstrata’s activities.
Xstrata sets aside a minimum of 1% of Group profit before tax eachyear to fund initiatives that benefit the communities associated withour operations, often through multi-stakeholder partnerships overseveral years. Our funding programmes prioritise communities locatedin remote areas or in regions with a lower level of social and economicdevelopment and infrastructure. Although the overall level of fundingset aside each year is determined by our profitability, we manage ourfunding so that community initiatives receive stable and continuingfinancial support throughout the commodity cycle. A key priority isto avoid sole dependence on our finite operations.
Community

Some of Xstrata’s operations and facilities are intensive users of naturalgas, electricity, oil and other fuels. Factors beyond the control of Xstrata,such as strong demand from the Asia-Pacific region, political, regulatoryand economic uncertainties and the costs associated with emissionsfrom fossil fuels, as well as problems related to local generation andtransmission of power, for example, electricity constraints in SouthAfrica and natural gas shortages in Chile, can reduce the reliability ofenergy supply and increase energy prices. In some regions, Xstrata’senergy supply is dependent on one major or national power generationcompany, for example, Eskom in South Africa.
We manage this risk through implementing energy efficiency plansacross our operations and developing energy efficient technologies,for example, Xstrata Alloys’ proprietary Premus technology whichreduces the energy consumption of ferrochrome smelting by over20% compared to conventional processes. Long-term energycontracts are negotiated to reduce dependence on spot marketsand we seek to diversify power sources and identify alternatives.
Principal Risks and UncertaintiesThe risks set out below represent some of the principal uncertainties and trends which mayhave an impact on our ability to execute our strategy effectively in future. These risks havebeen assessed according to materiality, likelihood and residual risk after controls. Furtherinformation about Xstrata’s risk management processes and controls is provided in theCorporate Governance Report on pages 91 to 97 of this report.
Risk Mitigation
Xstrata’s revenue and earnings are dependent on prevailing commodityprices which are determined by the supply of, and demand for, rawmaterials and are closely linked to global economic growth. The recentrapid deterioration of the global macroeconomic environment has led toreduced demand and the majority of commodities trading at dramaticallylower levels. Commodity prices for all products, and particularly forexchange-traded commodities, may fluctuate widely and may havea material impact on financial results. The impact on Group earnings(EBIT) of movements in the price of each of Xstrata’s commodities is setout in the Financial Review. Commodity price trends and commentaryon the outlook for each of Xstrata’s commodity markets is provided inthe Operating Review sections of this report.
We manage the risk of commodity price fluctuations throughmaintaining a diversified portfolio of commodities and typically donot implement large-scale strategic hedging or price managementinitiatives. We aim to reduce costs on a continuous basis and maintainlow-cost, efficient operations, optimising our portfolio and returnsthroughout the commodity price cycle.
Commodity price volatility
Fluctuations in currency exchange rates
Energy
Xstrata’s products are generally sold in US dollars, while our operationsand operating costs are spread across several different countries andcurrencies. Fluctuations in exchange rates, in particular movements inthe Australian dollar, Canadian dollar and South African Rand againstthe US dollar, may have a material impact on our financial results.The impacts of currency exchange rate fluctuations on Group EBIT,together with average exchange rates in 2008 compared to 2007,are set out in the Financial Review.
We maintain a diversified portfolio of assets across several differentgeographies and operating currencies. From time to time we may alsohedge a portion of our currency exposures to fix costs in US dollars to USdollar revenues in relation to contracted terms. Foreign currency hedginginformation is provided in the Financial Review. Xstrata’s financialstructure, including exposure to interest payments, interest rate changesand amendments to taxation regulations, is regularly reviewed withthe assistance of external advisers, to ensure compliance with relevantregulations and to maximise financial efficiency. Xstrata maintainsa robust investment grade credit rating and Group Treasury policyis actively monitored and regularly reviewed.
Xstrata plc Annual Report 2008 25

Strategy: Business ReviewPrincipal Risks and Uncertainties continued
26 Xstrata plc Annual Report 2008
Risk Mitigation
Xstrata operates in a number of jurisdictions in which regulations orlaws have been introduced or are being considered to limit or reducegreenhouse gas emissions. While the precise future impact of the KyotoProtocol and related legislation or regulation is impossible to quantifyat this time, the likely effect will be to increase costs for fossil fuels,electricity and transportation, restrict industrial emissions, impose addedcosts for emissions in excess of permitted levels and increase costs formonitoring, reporting and accounting. Climate change legislation maylead to higher energy costs or restricted energy supply, which may havea material adverse impact on our ability to maintain production and/orcontain operating costs. Xstrata is the world’s largest producer of exportthermal coal. Any material decline in the use of coal as a power sourceas a result of carbon taxes, emissions trading or similar legislation mayhave a material adverse impact on Xstrata’s financial position. Climatechange may also result in weather-related events or other physicalthreats that may hamper production or damage assets.
Climate change issues are given a high priority by management andinitiatives are undertaken to continually improve understanding ofthe Group’s carbon footprint and to reduce the carbon intensityof operations and activities. Our commodity businesses activelyparticipate in industry and regulatory initiatives to address climatechange and associated issues. Xstrata Coal is actively investing inand advocating government support for research and developmentprojects to reduce greenhouse gas emissions from the use of coal inpower generation, together with other coal producers, governments,scientific and academic organisations. Demand for coal is expectedto be supported by forecast significant increases in global demand forenergy, particularly in developing countries, and by coal’s relative costposition, availability and security of supply.
Xstrata’s operations are affected by a number of factors which are, toa large extent, outside management’s control, including the availabilityof raw materials, water and power. In addition, Xstrata’s businessesare subject to numerous other operating risks which include: unusualor unexpected geological features, ground conditions or seismicactivity; climatic conditions (including as a result of climate change)such as flooding, drought or a reduction in permafrost; interruptionsto power supplies; congestion at commodities transport terminals;industrial action or disputes; environmental hazards; and technicalfailures, fires, explosions and other incidents at a mine, processingplant, cargo terminal or related facilities.
Our approach to operational risk is value driven and has the statedobjective of ensuring ‘an environment where we can confidently growshareholder value through developing and protecting our people, ourassets, our environment and our reputation’. We have in place a robustand comprehensive programme to identify, understand and managethe risks that affect our businesses and operations. Each commoditybusiness undertakes an annual risk review and updates its risk registeraccordingly. All operations implement and regularly review watermanagement plans to reduce fresh water use and maximise on-sitewater storage and re-use. Contingency plans are in place to restoreoperations quickly in the event of a severe weather event. Riskmanagement and planning processes include consideration ofsignificant physical risks from climate change.
Carbon emissions and climate change regulation
Operational risks
Mine reserves decline as commodities are extracted and not allreserves may be mined as profitably as anticipated. Successfulexploration and development activities and acquiring propertiescontaining economically recoverable reserves are necessary forXstrata’s future success. In order to develop reserves, variousgovernmental permits must be obtained.
We annually update our proven and probable reserve estimates as to bothquantity and quality periodically to reflect the extraction of commoditiesand new drilling or other data received, available from our website. Wemaintain a transparent and open relationship with regulators and local,regional and national government bodies and closely monitor compliancewith legislation and with the leading practice standards set out by theGroup’s Sustainable Development Framework.
Reserves
Xstrata benefits from a significant pipeline of organic growth projectsin a number of countries. Ineffective project development, includinglack of coordination with infrastructure constraints, cost overruns andunexpected delays due to problems obtaining, renewing or extendingrelevant operating, social or environmental permits or other legislativerequirements may constrain the Group’s ability to replace olderoperations with new, lower cost supply, impacting future revenues,costs and management’s reputation for successful projectdevelopment. In addition, as part of the Group’s near-term strategyto conserve cash, Xstrata’s businesses have deferred or cancelleda substantial portion of expansionary capital expenditure in 2009.The slowing of the development of project pipelines may impact theGroup’s ability to continue production at cost-effective levels. Whenthe global economy recovers, projects may not be sufficiently advancedto enable the Group to benefit fully from increased commodity prices.
Rigorous planning and risk management processes are in place leadingup to project approval and through the development process. Detailedprogress reports are provided on a regular basis for all major projectsto the Group Executive Committee. Cost control remains a keyconsideration of any project development and Xstrata’s commoditybusinesses have an excellent track record of delivering major capitalgrowth projects on time and on budget. Effective project managementprocedures are a key focus for Xstrata’s Internal Audit function.Xstrata regularly liaises with government bodies during thedevelopment of its growth projects. Deferrals of expenditure areoccurring to take advantage of declining input costs and are beingimplemented in such a way as to ensure projects can be rapidlyrecommenced as appropriate.
Project development

Xstrata plc Annual Report 2008 27
Risk Mitigation
Production curtailment
During the current environment of depressed commodity prices,Xstrata and other mining companies are curtailing production byclosing or suspending higher cost mines and production facilities.These actions are being taken to ensure Xstrata’s businesses remaincash positive, reduce average operating costs and avoid over-supplyingmarkets or building up unsold inventory. However, they may alsoincur costs in the form of redundancy payments; equipment removal;security; stabilisation; reclamation and site rehabilitation costs, thecost of resuming production or indirect costs in the form of foregonerevenue, deterioration of assets or increased unit costs. The closureor suspension of operations equally negatively impacts employeesand local communities and may impact the Group’s reputationas an industry-leading employer and corporate citizen.
A thorough review of likely impacts and risks is undertaken in advanceof suspending or closing higher cost operations and mitigating actionsare implemented to reduce associated costs, offset the socio-economicimpacts of closures where possible and implement support programmesfor affected employees. Suspended operations are maintained undercare and maintenance programmes to enable a rapid restart andpreserve asset quality and operational integrity.
Political, community and fiscal intervention
Xstrata’s operations and projects span 19 countries, some of which havemore complex, less stable political or social climates and consequentlyhigher country risk. Political risks include changes in laws, taxes orroyalties, expropriation of assets, currency restrictions or renegotiationof, or changes to, mining leases and permits. Similarly, communities incertain regions may oppose mining activities for various reasons. Any ofthese factors could have an adverse impact on Xstrata’s profitability in acertain geographic region or at certain operations. In South Africa, theserisks include the ability to convert existing mining licences to ‘new order’mining rights under the Mineral and Petroleum Resources DevelopmentAct (MPRDA) and Empowerment Charter.
We perform a thorough risk assessment on a country-by-countrybasis when considering activities and investments and regularlyreview political, regulatory and social risk to ensure that risks havebeen properly identified and managed to within acceptable levels.We work in partnership with our employees and local communities formutual benefits, earning and maintaining a social licence to operate.We manage a broad geographic spread of assets, diversifying politicalrisk across a number of territories. Investment terms and joint ventureor other partnership agreements are reviewed to ensure fairness andreduce the risk of renegotiation. Xstrata maintains a transparent andopen relationship with regulators and local, regional and nationalgovernment bodies and closely monitors compliance with legislationand with the leading practice standards set out by the Group’sSustainable Development Framework. In South Africa, Xstrata is ontrack to achieve employment equity, procurement, social developmentand other targets as set out by the Mining Charter.
Xstrata’s operations are subject to extensive health, safety andenvironmental regulations and legislation and communityexpectations. New or amended environmental, health and safetylegislation or regulations may result in increased operating costs or,in the event of non-compliance, the possibility of fines, penalties orother actions which may adversely affect Xstrata’s financial position.Rehabilitation costs, which are generally estimated and providedfor over the life of operations and based on the best informationavailable, may subsequently increase, impacting on Group earnings.Any breach of regulations or non-compliance with Xstrata’s own bestpractice standards in health, safety and environmental performanceand community relations may damage our reputation and, as a result,our licence to operate. Performance standards at acquired operationsmay not meet Xstrata’s expected performance standards.
Xstrata’s businesses monitor legislative requirements and engagewith government and regulators regularly, to ensure full compliance.Our commitment to the principles of sustainable development, whichincorporates environmental, economic and social performance, is anintegral part of our operating philosophy. Every managed operationis independently audited through Xstrata’s independent SustainableDevelopment Assurance Programme on a regular basis, and health,safety, environmental and social performance indicators are reportedregularly to the Group Executive Committee and Board. Acquiredoperations are assessed for HSE risks and opportunities as part of theintegration process and action plans implemented to address areasof underperformance.
Health, safety and environment

28 Xstrata plc Annual Report 2008
Strategy: Business ReviewPrincipal Risks and Uncertainties continued
Risk Mitigation
In June 2007, a new European Union regulation for the Regulation,Evaluation and Authorisation of Chemicals (‘REACH’) came into forceacross the EU. REACH is intended to place the burden of ensuringthe safety of chemical substances in terms of both occupational andenvironmental exposures onto industry instead of authorities. Manyof the commodities produced by Xstrata and the chemicals usedduring its production processes fall within the scope of REACH. REACHlegislation requires the producers of products classified as chemicalsto identify, register and carry out toxicity testing. Failure to do so willresult in these products being excluded from the EU. In particular,the EU 30th Adaptation to Technical Progress (ATP) to the DangerousSubstances Directive (which entered into force in October 2008)and the proposed 31st ATP, introduce new classifications for nickel-containing substances which result in additional labelling andpackaging requirements and may result in significant increased costs.Non-compliance with REACH legislation would close the EU marketto many of Xstrata’s commodities and potentially reduce revenues.
Xstrata has developed a coordinated Group approach to REACHlegislation. In addition, we are closely monitoring and involved withthe work of industry bodies, which are engaged in lobbying the EU onissues concerned with REACH. All of our businesses have undertakena review process to ensure the proper identification of all productsimported into the EU and requiring registration under REACH. To date,all pre-registration requirements have been completed by the relevantdeadlines to enable the continued manufacture and/or import ofaffected commodities and other chemicals. Registration of allapplicable products will be made by the relevant REACH deadlines.
REACH legislation in the EU
The majority of Xstrata’s workforce is unionised. We believe that allof our operations have, in general, good relations with employees andunions, but from time to time the Group’s operations have experiencedlimited work stoppages and other industrial action which interruptsproduction. The management of Xstrata’s operations depends ona relatively small number of key employees. The loss of certain keyemployees, particularly to competitors, could have a material adverseeffect on the Group. In addition, as Xstrata develops and expands, webelieve that our future success will depend on our ability to attract andretain highly skilled and qualified personnel, which is not guaranteed.
We aim to attract and retain the best people at every level of ourbusinesses and to provide them with the resources they requireto achieve and maintain our operational excellence. We provideindustry-leading career development opportunities, well structuredemployment contracts, competitive remuneration and fair and non-discriminatory workplaces. We believe our devolved managementstructure and supportive environment for rational risk-taking is animportant retention measure, offering unparalleled opportunities fordevelopment and entrepreneurial leadership, minimising bureaucracyand allowing every employee to play an active part in our success.Fast track and executive development programmes are in place acrossthe Group and formal succession planning is regularly reviewed.
Labour and key employees
Recent events in the credit markets have significantly restricted thesupply of credit, as financial institutions have applied more stringentlending criteria or exited the market entirely. The Group has asignificant amount of indebtedness, which will not require significantrefinancing until 2011. If current credit market conditions continue,however, it will be more costly for Xstrata to refinance its existingdebt as it falls due. In addition, it has become and may continue tobe more costly to raise new funds to take advantage of opportunities.
Xstrata is committed to maintaining an investment grade credit ratingand takes a considered approach to debt management. On 29 January2009, Xstrata announced a rights issue to repay existing debt andreduce the Group’s gearing to just under 30%, from 40% at the endof 2008. In addition, the Group benefits from significant headroomunder existing debt facilities and has no material debt refinancingrequirements until 2011. Xstrata’s treasury policy and performanceis actively monitored and reported each month to the ExecutiveCommittee and Xstrata maintains a robust financial position andan investment grade balance sheet.
Credit market conditions and credit ratings

Xstrata plc Annual Report 2008 29
Risk Mitigation
As Xstrata is unable to directly set the prices it receives for thecommodities it produces, its competitiveness and long-termprofitability depend, to a significant degree, on its ability to reducecosts and maintain low-cost, efficient operations. Important costinputs generally include extraction and processing costs of rawmaterials and consumables, such as reductants, reagents, power,fuels, labour, transport and equipment, many of which are particularlysusceptible to inflationary and supply and demand pressures. Increasesin these costs have moderated in recent months and in some caseshave actually declined. However, further increases in input costs maynegatively impact Xstrata’s earnings.
We recognise the importance of cost reduction as a driver of valuecreation and as a measure of the quality of our operational managementand our stewardship of the assets of our owners. Cost performanceis regularly reported to the Group Executive Committee and is animportant management performance measure and regular internalaudits at operations identify potential efficiencies. Xstrata’s dedicatedtechnology business, Xstrata Technology Services, is a world leader in thedevelopment of minerals processing and metals extraction technologiesto improve efficiency and reduce operating costs. Xstrata’s commoditybusinesses also invest in the development of lower cost proprietarytechnologies. In each of the last seven years, Xstrata has achieved realcost savings from its operational cost base. In 2008, $184 million ofreal cost savings were achieved in a very challenging environment.
Cost control

30 Xstrata plc Annual Report 2008

Xstrata plc Annual Report 2008 31
3
Ferrochrome at the Lion smelter inSouth Africa, which uses the lowcost, energy efficient proprietaryPremus technology
<
32 Key Performance Indicators37 Financial Review45 Operating Review45 Xstrata Alloys49 Xstrata Coal55 Xstrata Copper63 Xstrata Nickel69 Xstrata Zinc75 Xstrata Technology Services76 Operations Data
Performance

Key Performance IndicatorsXstrata’s Executive Committee and Board monitor a range offinancial and non-financial key performance indicators (KPIs),reported on a monthly or quarterly basis, to measure performanceover time.
Financial KPIs
0
200
400
600
800
080706050403
FTSE Diversifieds* CAGR† 43%
419506
374
25114485
Earnings Per Share* (US¢)
Earnings per share show attributable profit earnedper share to provide a basis for comparison. Xstrata’sgrowth in earnings per share is shown compared tothe average for Anglo American, BHP Billiton and RioTinto (FTSE Diversifieds).
0
3,000
6,000
9,000
12000
080706050403
Xstrata CAGR† 59%
9,65710,888
7,107
3,1032,065699 0
7,500
15,000
22,500
30000
080706050403
FTSE Diversifieds* CAGR† 35%
21,656
16,55815,11311,029
7,7134,863
EBITDA* ($m)
Xstrata’s earnings before interest, tax, depreciationand amortisation (EBITDA) before exceptional itemsare shown compared to the average for the FTSEDiversified miners. This provides an indication ofthe rate of earnings growth achieved.
0
15
30
45
60
080706050403
Xstrata* CAGR† 10%
34.537.840.338.5
32.0
20.1
0
15
30
45
60
080706050403
FTSE Diversifieds* CAGR† 10%
41.4 42.042.337.1
30.625.6
EBITDA* Margin (%)
The EBITDA margin shows earnings before interest,tax, depreciation and amortisation (EBITDA) beforeexceptional items as a percentage of revenue. It isa measure of how efficiently revenue is convertedinto EBITDA.
0
1
2
3
080706050403
Xstrata average 1% cost reduction
0.91.3
1.0
0.4
0.91.0
Cost savings
-6
-4
-2
0
2
080706050403
FTSE Diversifieds* average 2% cost increase
-2.2 -2.4-1.1-4.2-0.90.7
Cost increases
Real Cost Savings**(% of operating costs)
Sustainable real cost savings are an important driverof value and a measure of our operational excellence.Xstrata’s performance in achieving real cost savingsis shown against the average for the FTSE Diversifieds.Cost savings are shown as a percentage of net operatingcosts, based on contribution to EBIT variance.
FTSE 100 Xstrata
0
100
200
300
400
500
600
0807060504
GBPTotal Shareholder Return
TSR calculates the total return from an investmentin Xstrata, calculated from the growth in share pricetogether with the dividend income from the shares,with dividend income assumed to be reinvested. Thegraph shows the total return for a £100 investment inXstrata plc, benchmarked against the FTSE 100 indexof the largest UK companies.
* Xstrata EPS and EBITDA on statutory basis (i.e. acquisitionsincluded from date of transaction completion); EPS adjustedfor rights issues. Weighted average for Anglo American, BHPBilliton and Rio Tinto; BHP Billiton adjusted to Decemberfinancial year for comparison purposes
** Based on reported cost variance contribution to annualprofit variance; adjusted to include mining inflation impact
† Compound annual growth rate (CAGR) 2004-2008
Further information on the Group’s financialperformance is given within the financial reviewon pages 37 to 44.
0
200
400
600
800
080706050403
Xstrata CAGR† 80%
490560
434
271
16433
Performance
32 Xstrata plc Annual Report 2008

Non-financial KPIs
0
5
10
15
20
08*07*0605
Turnover (%)
12.4
7.45.2
10.3
0
4
8
12
16
08*07*0605
% of women in the workforce
10.79.49.6†
8.0
0
5
10
15
20
08*07*0605
% of female managers
X15
13
7
12
0
50
100
150
200
0807060504
Corporate Social Involvement ($m)
84.120.8
>
101.6
49.224.710
> In-kind (non-cash) contributions
CSI 2008 by category*
Health 8%
Culture/art 7%
Education12% Social/
communitydevelopment64%
Environment3%
Enterprise andjob creation6%
CSI 2008 by geography*
SouthAmerica45%
Africa19%
NorthAmerica8%
Europe2%
Australasia26%
Employees Turnover and Diversity (%)
Employee turnover is a measure of our success inretaining our people. Turnover includes voluntaryresignations, redundancies and performance-relatedterminations. Turnover and diversity data is calculatedas a percentage of total permanent employees(excluding contractors) and is shown for all availablereporting periods.
0
20
40
60
80
08*07*06
Average training hours per employee
XX
3832
44
69.0
0
500
1,000
1,500
2000
08*07*06
Average training spend per employee ($)
XX1,849
1,6181,340
Employees Training
Ongoing training and education is conducted bothin the workplace and at external institutions. Bothtraining hours and training spend are shown as anaverage per employee including contractors. Datais shown for all available reporting periods.
0
25
50
75
100
08*07*060504
New occupational illnesses
35
605658
37
82
New occupational illnesses by type*
Respiratoryconditions 10%
Musculo-skeletal 27%
Dermalconditions 8% Noise-induced
hearingloss 55%
Health Occupational Health
Xstrata’s operations aim to identify, assess and controloccupational health hazards and, where practicable,to eliminate work-related diseases. The charts showthe number of new occupational illness cases reportedby employees and contractors, together with 2008illnesses by type.
0
5
10
15
20
08*07*060504
Total recordable injury frequency rate
12.310.1 9.3
14.115.0
18.5
0
2
4
6
8
08*07*060504
Lost-time injury frequency rate
3.03.32.7 2.4
4.35.3
Safety Injury Frequency Rates
We believe that every work-related incident, illness andinjury is preventable. Total recordable injuries includelost-time injuries, medical treatment injuries andrestricted work injuries, providing a more completemeasure of safety performance. The total recordableinjury frequency rate and lost-time injury frequencyrates are reported per million hours worked andinclude contractors.
Corporate social involvement ($m)
Xstrata sets aside a minimum of 1% of annual Groupprofit before tax to fund initiatives that benefit localcommunities (2008: 1.6%). The charts show the cashamount set aside for initiatives in each geographicregion in which Xstrata operates and by category.In 2008, Xstrata’s businesses also calculated thetotal value of in-kind contributions (e.g. equipment,management time, etc.)
Xstrata publishes a separate Sustainability Report, which includesa full set of indicators, using the Global Reporting Initiative G3guidelines. The report is available from the Sustainability sectionof our website or as a hard copy on request.
Xstrata plc Annual Report 2008 33

0
10
20
30
40
08*07*06‡‡0504
Category 3 environmental incidents
11
23
8
20
35
Category 3 incidents by type*
Breach of airemissionslimits 1
Stormwaterdischargesoff-site 1
Groundcontamination3
Watercontamination3
Environmental incidents
Xstrata’s operations record environmental incidentsaccording to severity. Our target is to achieve zerocategory 3, 4 or 5 incidents, representing significant,serious or disastrous incidents. Category 3 incidentscause moderate, reversible environmental impact andrequire moderate remediation. No category 4 or 5incidents have ever occurred.
0
10
20
30
40
08*07*‡06‡‡0504
Greenhouse gas emissions (CO2-e mt)
Carbon intensityper tonne of product
25.2
17.4
26.9
14.518.6
CO2-e by CBU* (% of Group total)
Copper 12%
Zinc 16%
Nickel 9%
Alloys 30%
Coal 33%
Greenhouse gases(CO2 equivalents million tonnes)
Greenhouse gas emissions are measured as CO2
equivalent tonnes. Xstrata’s main sources of GHGsare from electricity used and from methane found inunderground coal seams in some regions. We seek toreduce greenhouse gas emissions through improvedenergy efficiency and by using coal-seam methaneto generate power wherever possible.
0
50
100
150
200
08*07*‡06‡‡0504
Energy usage (PJ)
127.4
61.9‡
127.1
55.458.2
Energy intensityper tonne of product
Energy source* (% of Group total)
Diesel 21%
Naphtha 7%
NaturalGas 6%
Coal/coke 3%
Electricity49%
Other fuels14%
Energy usage (petajoules PJ)
Energy is measured in petajoules and includeselectricity usage and direct energy sources. Efficiencyand energy consumption reductions drive bothcost savings and emissions reductions. We aimto progressively improve energy efficiency, andmeasure energy intensity per tonne of product.
0
100,000
200,000
300,000
400000
08*07*06‡‡0504
Fresh water intensity per tonneof product
Fresh water use (ML)
168,
700
85,6
00
255,
600
170,
000
75,3
00
74,9
00
0
150,000
300,000
450,000
600000
08*07*060504
Recycled water use (ML)
520,
400
520,
500
394,
200
101,
300
98,9
00
92,9
00
Water (megalitres-ML)
Effective water management and conservation iscritical to Xstrata’s operations, a number of whichare located in arid regions. Xstrata measures totalfresh water used and water recycled. We seek toreduce fresh water extracted and progressivelyincrease the amount of water that is recycled.
* Acquisitions included from date of completion† Restated due to revised total employee numbers‡ Restated following further research into Xstrata’s carbon footprint and third-party verification‡‡ 2006 data excludes Falconbridge acquisition
Performance:Key Performance Indicators continued
34 Xstrata plc Annual Report 2008
Non-financial KPIs

Xstrata plc Annual Report 2008 35
Xstrata’s Executive Committee and Board monitor a range of financialand non-financial KPIs on a regular basis to measure the Group’sperformance. The performance indicators provided in this report arenot comprehensive and a number of additional KPIs are used at theGroup and commodity business level.
Financial KPIsXstrata’s financial performance is described in detail in the FinancialReview on pages 37 to 44.
Non-financial KPIsEmployeesThe retention of skilled and key personnel is a high strategic priorityfor management and is identified as a principal risk facing the Group.Employee turnover increased to 12% in 2008 (2007: 7%). Voluntaryturnover (excluding compulsory redundancies or performance-relatedterminations) of 7% in 2008 remained at a similar level to the previousyear (2007: 6.5%). This reflected strong competition for skilled labourfor the majority of the year and consequently, voluntary turnover wasparticularly high in core mining regions such as South Africa, Australiaand Canada. Compulsory redundancies also increased in 2008,primarily due to the suspension of the Falcondo ferronickel operationin the Dominican Republic during the year, due to continued lownickel prices and high costs.
In 2008, women represented 10.7% of Xstrata’s total workforce(2007: 9.4%) and 14.6% of all managers (2007: 13.4%). In SouthAfrica, the Mining Act sets out a target of 40% participation in theworkforce by historically disadvantaged South Africans (HDSAs) by2009 and our South African operations are on track to achievethese targets.
In 2008, expenditure on training for all employees (including long-term contractors) rose to $1,849 per employee, 14% higher thanin 2007, while training hours per employee rose by 16% to 38 hoursper employee. The increase in each case reflects our continuedcommitment to investing in our people’s skills and in particularsignificant investment in risk management, behavioural and othersafety training.
HealthOccupational illnesses are a measure of the number of new casesreported by our workforce during the year. In a number of instances,illnesses reported during the year are attributable to historicaloperational practices (for example, noise-induced hearing loss ormusculo-skeletal illnesses, where the time lag between exposureand reporting the illness may be considerable), incidents may also beattributable to more recent exposure, for example, respiratory illnessesrelating to occupational asthma or dust exposure. In each case, Xstrataaims to identify, assess and control occupational exposure to hazards
with an overall aim of eliminating occupational illnesses. In 2008,60 new occupational illnesses were reported (2007: 35). The increasewas due to increased reported illnesses at operations acquired in 2008and at Mount Isa, as a result of a comprehensive health screeningand information programme, through which 12 additional caseswere identified, comprising noise-induced hearing loss and musculo-skeletal illnesses.
Noise-induced hearing loss accounted for the majority of new casesin 2008, while the number of new musculo-skeletal illnesses reportedincreased significantly, reflecting the impact of historical practices andthe ageing profile of our workforce in a number of regions.
SafetyTragically, six people lost their lives at Xstrata’s managed operationsin 2008 (2007: nine fatalities) in five separate incidents, in South Africa,Peru and Argentina. Xstrata is investing significantly in behaviouralsafety training and major hazard management training, with aparticular focus on addressing cultural issues that contribute to safetyrisks in developing countries. Safety is a particular concern duringtimes of change and uncertainty. Xstrata’s operational and executivemanagement are responding to increased risks posed by the prevailinguncertain economic environment, including through increasing employeecommunications and awareness programmes and by continuingto invest in safety training and operational integrity as a priority.
The Group achieved a seventh consecutive year of significantreductions in the frequency of total recordable and lost-time injuries.The total recordable injury frequency rate reduced by 24% on a like-for-like basis compared to 2007, or by 18% including the performanceof operations acquired in 2008 to 10.1 per million hours worked. Thefrequency of lost-time injuries sustained reduced by 20% like-for-likeor by 11% including acquired operations to 2.7 per millionhours worked.
Corporate social involvementXstrata sets aside a minimum of 1% of Group profit before tax eachyear to fund corporate social involvement initiatives. This investmentis primarily directed to initiatives to benefit the communities associatedwith our operations. In addition to cash donations and fundingfor partnerships with a wide range of development, community,governmental and industry partners, Xstrata’s businesses also makenon-cash, in-kind donations, for example, providing equipment orpersonnel time. In total, $84.1 million in cash was set aside for CSIin 2008, equivalent to 1.6% of Group profit before tax for the year.In-kind donations contributed a further $20.8 million of benefits tocommunities and charities in the regions in which we operate.
Environmental incidentsXstrata’s businesses record all environmental incidents on a scaleaccording to environmental impact, with category one incidentsrepresenting very minor incidents with negligible impact and categoryfour and five incidents representing major or disastrous incidents withmedium- to long-term impacts respectively. Our target is to operatewith zero category three incidents (moderate, reversible environmental
Performance against KPIs

36 Xstrata plc Annual Report 2008
Performance:Key Performance Indicators continued
impact requiring moderate remediation) or above. No category fouror five incidents have ever occurred at Xstrata’s operations. In 2008,the number of category three incidents reduced to eight incidents(2007: 11 category three incidents). In previous years, stormwaterdischarges off-site have presented a particular challenge at Xstrata’sMount Isa operations. Due to improved stormwater managementsystems at the site, no category three incidents were recorded atMount Isa operations in 2008. However, in South Africa, severe stormweather and heavy rainfall in August resulted in three incidencesof dam overflows or breaches at coal operations. The remainder ofcategory three incidents related to procedural failures at operations.Remedial action plans have been implemented for all category threeincidents and any environmental impacts have been fully remediated.
Greenhouse gas emissionsIn 2008, Xstrata’s direct and indirect greenhouse gas emissionsfrom its operations remained at a similar level to the previous yearon a like-for-like basis, excluding operations acquired in 2008. Includingthe impact of operations acquired during 2008, total greenhouse gasemissions rose to 26.9 million tonnes, 7% higher than the previousyear (2007: 25.2mt CO2-e). Acquired underground coal operationsat Ravensworth underground and Tahmoor in Australia contributedan additional 1.5mt of CO2-e to the Group’s emissions, primarily dueto methane emissions from these mines. Indirect emissions attributableto electricity usage remained at a similar level to the previous year. Datafor 2007 was restated to include emissions attributable to ‘bunker C’oil, a heavy fuel oil used in Canada, which had not previously been fullyincluded in the Group’s reported data.
In addition to absolute tonnes of CO2-e generated directly at itsoperations and through electricity usage, Xstrata also measures the‘carbon intensity’ of its operations. This measure normalises carbonemissions (in million tonnes) against production (in million tonnes) andprovides a basis for comparison year-on-year notwithstanding changesto production levels across the Group. In 2008, the carbon intensityof the Group’s operations increased by approximately 8%, due tothe inclusion of the acquired, relatively high-methane undergroundcoal mines into the portfolio and due to increased use of diesel ata number of Xstrata’s open cut coal and copper mines as haulagedistances increase.
EnergyApproximately 50% of Xstrata’s energy consumption is fromelectricity, predominantly used at metallurgical operations, whereenergy efficiency is an important component of financial performanceand efficiency. At the Group’s mining operations, the primary sourceof energy is diesel, used to fuel the mining fleet and mobile equipment.
In 2008, energy use at Xstrata’s operations remained at a similar levelto the previous year at 127.1 petajoules (PJ), including operationsacquired in 2008 (2007: 127.4PJ). Consequently, the energy intensityof our operations remained at a similar level to the previous year.Stable electricity consumption and increased diesel usage, due tohigher production and longer haulage distances at open cut mines,were offset by reduced energy from coke and other fossil fuels, as aresult of lower production and improved efficiency at Xstrata Alloys’operations. Energy consumption figures for 2007 were restated from112.7PJ previously reported, due to the addition of energy frombunker C heavy fuel oil (see greenhouse gas emissions above).
WaterEffective fresh water management and conservation is critical toXstrata’s operations, a number of which are located in arid regions.In addition, our operations seek to maximise the use of process andrecycled fresh water, further reducing our impact on fresh watersupplies. In 2008, Xstrata’s operations used a similar amount offresh water to the prior year (<1% increase), despite the impactof a number of operations commissioning during the year, includingthe Elandsfontein platinum operations and Boshoek open castchrome mine.
Fresh water intensity measures the volume of fresh water used,denominated by production volumes, to provide a basis for year-on-year comparison of our progress towards our aim of using less freshwater per tonne of product. In 2008, the fresh water intensity ofour operations only marginally increased, in line with slightly higherwater use.
Recycled water is typically used in place of fresh water for processessuch as dust suppression. In 2008, water management plans at everymanaged operation, together with increased rainfall in South Africa,which allowed run-off rainwater to be recycled and reused, increasedthe volume of recycled water used at our operations. Volumes roseby 30% to 511,400ML (2007: 394,200ML), further boosted by thecommencement of production at a number of mining operations andthe impact of acquired operations, slightly offset by the suspensionof operations at Falcondo in August.

Xstrata plc Annual Report 2008 37
Key points:
> Robust demand for commodities in early2008 impacted by financial crisis
> Severe declines in base metal prices largelyoffset by record coal and ferrochromecontract prices
> US dollar strengthened against keyoperating currencies
> Real cost savings of $184 million achieved
> No significant refinancing of debt requireduntil 2011
Financial Review
Statutory consolidated results
Year ended Year ended$m 31.12.08 31.12.07
Alloys 2,002 1,352
Coal 7,944 4,201
Copper 11,464 12,794
Nickel 3,105 5,252
Zinc 3,202 4,726
Technology 235 217
Total Group Revenue 27,952 28,542
Attributable Total Group Revenue 27,092 27,449
Alloys 1,094 448
Coal 4,173 1,194
Copper 3,160 4,987
Nickel 816 2,577
Zinc 444 1,822
Technology 38 47
Corporate and unallocated (68) (187)
Total Group EBITDA 9,657 10,888
Attributable Total Group EBITDA 9,470 10,324
Alloys 1,007 389
Coal 3,549 690
Copper 2,297 4,163
Nickel 341 2,172
Zinc 113 1,529
Technology 32 43
Corporate and unallocated (78) (194)
Total Group EBIT 7,261 8,792
Attributable Total Group EBIT 7,156 8,292

Basis of Presentation of Financial InformationFinancial information is presented in accordance with InternationalFinancial Reporting Standards (IFRS) as adopted for use in theEuropean Union. The reporting currency of Xstrata plc is US dollars.Unless indicated to the contrary, revenue, earnings before interest,taxation, depreciation and amortisation (EBITDA) and earnings beforeinterest and taxation (EBIT) are reported in the Chief Executive’s Reportand the Operating and Financial Review before exceptional items.Exceptional items are significant items of income and expense which,due to their nature or expected infrequency, are presented separatelyon the face of the income statement.
Unless indicated to the contrary, all data and commentary in the ChiefExecutive’s Report and the Operating and Financial Review exclude theXstrata Aluminium operations which were sold during the first half of2007. All dollar and cent figures provided refer to US dollars and cents.
Consolidated Operational ResultsRobust demand for commodities and stable economic conditions inthe first half of the year were interrupted by the severe and suddenimpact of the global financial crisis on the availability of liquidity andexpectations for global economic growth.
While zinc and nickel prices were markedly lower in the first halfcompared to the record high levels of 2007, copper prices traded at ornear historic highs in the early part of the year and very tight cokingand thermal coal markets supported record spot and contractsettlements. As the full scale of the global crisis became evident,ultimately culminating in the failure of several financial institutionsand a complete paralysis of credit markets in the autumn, commodityprices declined dramatically.
Overall, revenue for the year declined marginally compared to 2007 to$28 billion. EBITDA decreased by 11% to $9.7 billion, with EBIT 17%lower at $7.3 billion. The impact of lower prices on Xstrata’s earningswas contained to $49 million, as the impact of lower base metal priceswas largely offset by the benefit of record coal contracts in 2008 andstrong prices for Xstrata Alloys’ products. The US dollar strengthenedagainst most currencies, with particularly material increases againstthe currencies of commodity-based economies, adding $207 millionto EBIT compared to the prior year. However, as with prior years, theheadwinds of higher industry input costs together with CPI inflationcontinued to erode earnings by $1,257 million compared to 2007,as cost depreciation lagged the sharp declines in commodity pricesand economic conditions.
EBIT variances
$m
EBIT 31.12.07* 8,587
Sales price** (49)
Volumes (378)
Unit cost – real 184
Unit cost – CPI inflation (464)
Unit cost – mining industry inflation (793)
Unit cost – foreign exchange 207
Acquisitions 211
Other income and expenses (68)
Depreciation and amortisation (excluding foreign exchange) (176)
EBIT from operations 31.12.08 7,261
* Excludes one-off impact of nickel inventory sale to Glencore in 2007 of $205 million** Net of commodity price-linked costs, treatment and refining charges
Reduced production volumes impacted earnings by $378 million year-on-year, as record coal, zinc and lead concentrate, platinum and nickelproduction was offset by lower copper and ferronickel volumes, and,to a lesser extent, the impact of ferrochrome furnace suspensions inthe fourth quarter.
The inclusion of the acquired Tahmoor, Ravensworth underground coaloperations and an additional 50% interest in Narama, together withproductivity improvements at Newlands Northern underground mineand the ramp up of Glendell and the Ulan Underground to full designcapacity, delivered record volumes and cost efficiencies at Xstrata Coal.
Zinc production and sales volumes benefited from concentratorexpansions in Australia and the commencement of productionat the Perseverance mine in Canada on 1 July 2008.
Copper volumes for the year were impacted by operational difficultiesand planned lower head grades at Mount Isa and Alumbrera mines.Ferronickel production was lower as a result of the suspension andsubsequent mothballing of the Falcondo operation in the second half.
Real cost savings of $184 million were achieved in 2008, markinga seventh consecutive year of real cost savings. Savings were achievedthrough productivity improvements at the zinc and coal operations,and the ramp up and prioritisation of lower cost production at XstrataAlloys’ Lion smelter which, together with the Bokamoso pelletisingplant, has exceeded the expected reduction in overall unit costs. XstrataCoal also benefited from the improved performance of the NewcastlePort and demonstrated the flexibility of the diverse portfolio of itsoperations through the opportunistic sale of stockpiles during theadverse weather in Queensland. While higher input costs continuedto weigh on earnings in 2008, mining sector inflation is expectedto moderate in the near term due to the poor macroeconomicenvironment, lower commodity price-linked costs including royaltiesand labour bonuses, and curtailments to mine production across theindustry. In particular, lower oil prices will have a significant impact onfuel and energy costs.
Higher earnings from acquisitions include the acquired Resource Pacificcoal assets following completion of the transaction in February 2008.
Other income and expenses include the negative impact of theintroduction of export retention taxes by the Argentine government,which reduced earnings at Alumbrera. In addition, higher standingcharges for idled chrome furnaces, the impact of lower nickel ore gradesand the absence of gains on disposal of nickel exploration propertiesin 2007 also resulted in a reduced EBIT compared to the prior year.
38 Xstrata plc Annual Report 2008
Performance:Financial Review continued

Average commodity prices
Average Average %Unit price 2008 price 2007 change
Australian FOB export coking* $/t 232.5 98.1 137
Australian FOB exportsemi-soft coking* $/t 157.5 62.5 152
Australian FOB exportthermal coal* $/t 95.6 51.2 87
Americas FOB exportthermal coal* $/t 80.9 52.3 55
South African exportthermal coal* $/t 78.4 51.7 52
Copper (average LMEcash price) $/t 6,956 7,139 (3)
Nickel (average LME cash price) $/t 21,104 37,089 (43)
Lead (average LME cash price) $/t 2,084 2,594 (20)
Zinc (average LME cash price) $/t 1,870 3,257 (43)
Ferrochrome (Metal Bulletin) ¢/lb 175.8 89.3 97
Ferrovanadium(Metal Bulletin) $/kg 61.2 37.2 65
Platinum (average LBMcash price) $/oz 1,564 1,337 17
* Average received price
LME prices continued to exhibit dramatic volatility, with copper pricespeaking at $8,730 per tonne in July, before falling to a low of $2,845per tonne in late December. Average coal prices were significantlyhigher than in the prior year, reflecting record contract prices fromApril and robust spot prices which peaked at around $170 per tonne.At the end of 2008, spot coal prices had declined along with otherfuels, to approximately $80 per tonne. The outlook for thermal coaldemand remains robust into 2009 as coal retains its cost-competitiveposition compared to alternative fuels. The majority of LME metals arecurrently trading at unsustainable levels at or below industry marginalcosts, resulting in a significant proportion of current productionbecoming cash negative. Rapid industry capacity cuts are startingto take effect as attempts are being made to mitigate cash losses andto align production with demand. Furthermore, significant existingand future capacity is being curtailed in the face of limited availabilityof liquidity and debt funding, particularly for junior companies.
Currency table to $ (USD)
Average Average % At At2008 2007 change 31.12.08 31.12.07
USD:ARS 3.16 3.12 1 3.45 3.15
AUD:USD 0.85 0.84 1 0.70 0.88
USD:CAD 1.07 1.07 – 1.22 1.00
USD:CHF 1.08 1.20 (10) 1.07 1.13
USD:CLP 524 522 – 637 498
USD:COP 1,968 2,075 (5) 2,249 2,018
USD:PEN 2.92 3.13 (7) 3.13 3.00
EUR:USD 1.47 1.37 7 1.40 1.46
GBP:USD 1.85 2.00 (8) 1.46 1.98
USD:ZAR 8.27 7.05 17 9.32 6.86
Comparison of average 2008 to 2007 exchange rates, maskssignificant fluctuations during the year. The US dollar strengthenedsignificantly against the Australian dollar and South African rand inthe second half of 2008 as investors sought a safe haven currency inturbulent markets and local ‘commodity-based’ currencies weakenedin line with prices. The ongoing relative strength of the US dollarprovides a significant mitigant to the decline in commodity pricesthrough its impact on unit costs.
EarningsThe effective tax rate in the year declined to 25% compared to 28%in 2007, due to lower earnings in higher tax jurisdictions and astrengthening US dollar impacting entities which for tax purposes,lodge returns in local currencies. Minority interests decreased due tolower profits from Minera Alumbrera, particularly in the second halfof 2008.
Earnings summary
Year ended Year ended$m 31.12.08 31.12.07
EBIT (before exceptional items) 7,261 8,792
Net finance costs (660) (793)
Income tax expense (1,634) (2,301)
Effective tax rate 25% 29%
Minority interests (269) (326)
Attributable profit (before exceptional items)from continuing operations 4,698 5,372
Earnings per share (before exceptional items)from continuing operations 4.90 5.60
Loan issue costs written-off – (60)
Net losses from recycled foreign currencytranslation reserve (226) (62)
LionOre break fee (after costs) – 275
Restructuring and closure costs (125) –
Liability fair value adjustments (194) (25)
Profit from discontinued operations – 53
Impairment of assets (974) –
Share of loss from associates (34) –
Inventory write downs (93) –
Profit on restructure of joint venture 213 –
Income tax on exceptional items 330 (10)
(1,103) 171
Attributable profit 3,595 5,543
Earnings per share 3.75 5.78
Post-tax exceptional items amounted to $1,103 million and includea tax credit on exceptional items of $330 million and net losses fromrecycled foreign translation reserves of $226 million. Exceptional EBITitems of $1,207 million include $974 million of asset impairmentsfollowing Xstrata’s early actions to close or suspend marginaloperations in the light of the low commodity price environment.The Group-wide impairment assessment that has been performedconfirms that, on an overall Group basis, the recoverable amountsof Xstrata’s assets exceed book value as at 31 December 2008 bysome $25 billion. However, as a result of the IFRS requirement toperform impairment testing at an asset or cash-generating unit level,
Xstrata plc Annual Report 2008 39Xstrata plc Annual Report 2008 39

impairments in certain assets have been identified. The strengtheningUS dollar has reduced, in US dollar terms, the carrying value of a numberof Xstrata’s operations which have local functional currencies (mainlythe Australian dollar, South African Rand and Euro). The overall impactof these exchange rate movements has been to reduce the net bookvalue of Xstrata’s assets by approximately $5 billion between 30 June2008 and 31 December 2008, with a corresponding movement inthe foreign currency translation reserve.
The value of the Xstrata Nickel’s Falcondo assets in the DominicanRepublic was impaired by $455 million including goodwill of$176 million, following the decision to place the operation onprolonged care and maintenance. In the copper business, theKidd operations in Canada incurred an impairment of $227 millionfollowing a re-evaluation of closure and rehabilitation costs. In northChile, Altonorte and Lomas Bayas incurred an impairment of thecarrying value of property, plant and equipment assets of $92 millionand $144 million respectively including goodwill of $37 million. Thiswas due predominantly to the impact of weaker domestic demandfor sulphuric acid and medium-term environmental capital expenditurerequirements on future cash flows.
In addition to these material impairment charges, restructuringand closure costs amounting to $53 million were incurred to closethe Lennard Shelf zinc operation in Western Australia in Augustand $18 million of asset impairments. In November 2008, Xstrataannounced the early closure of the Craig and Thayer-Lindsley nickelmines in Canada, incurring $52 million of closure costs and $20 millionof asset impairments. An impairment of $93 million was applied tonickel inventory in light of lower nickel prices and consequently lowernet realisable value. Volumes of inventory were higher than usual atyear-end, due to product from XNA mines being transferred to feedthe Sudbury operations in Canada in the final quarter, which resultedin a build-up of inventory in the operational pipeline.
Additional closure costs of $12 million for Falcondo and $8 million forthe corporate office downsizing. Xstrata Alloys’ minerals reserves weresubject to an impairment of $18 million and a net impairment chargeof $34 million was recorded in respect of the Group’s investmentin Lonmin.
A restructuring of the Group’s interest in the Douglas Tavistock JointVenture (DTJV) was undertaken in the first half of 2008. Under theterms of the restructuring, the Group acquired and now managesmobile equipment and reserves equivalent to its 16% interest ofthe joint venture, in an area contiguous to its 100%-owned ArthurTaylor Colliery Open-cast Mine (ATCOM). This is classified as a businesscombination under IFRS and recognising the fair value of the assetsacquired in place of an interest in the DTJV resulted in an exceptionalgain of $213 million. Additional exceptional items were also reportedin South Africa, ensuing from an adjustment in the liability due toBEE partners, as a result of a change in the valuation of the assets’ability to generate returns, resulting in a net exceptional chargeof $194 million.
The following table indicates EBIT sensitivities for 2009 after allowingfor contracted sales and any commodity or currency hedging in placeat 2008 year-end, together with sensitivities assuming no contractedsales or hedging.
EBIT sensitivities
IndicativeImpact on full-year
$m 2009 EBIT* EBIT**
1¢/lb movement in ferrochrome price 10 11
$1/kg movement in ferrovanadium price 3 3
$1/tonne movement in Australian thermalexport FOB coal price 27 37
$1/tonne movement in Australian cokingexport FOB coal price 3 5
$1/tonne movement in South African exportthermal FOB coal price 8 11
1¢/lb movement in copper price 27 27
$10/oz movement in gold price 5 5
$1/lb movement in nickel price 144 144
1¢/lb movement in zinc price 22 22
$100/tonne movement in zinc treatmentcharge price 68 10
1¢/lb movement in lead price 6 6
$100/oz movement in platinum price 12 12
$100/oz movement in palladium price 6 6
10% movement AUD 392 403
10% movement CAD 191 199
10% movement EUR 32 32
10% movement ZAR 132 142
* After impact of currency and commodity hedging, and contracted, priced salesas at 31 December 2008
** Assuming current annualised production and sales profiles, no currencyor commodity hedging and no contracted, priced sales and purchases at31 December 2008
40 Xstrata plc Annual Report 2008
Performance:Financial Review continued

Cash Flow, Net Debt and Financing SummaryCash generated from operations in the period was lower than theprevious year at $8.9 billion, due in part to a number of one-off cashbenefits in 2007, including the receipt of the LionOre terminationpayment of $275 million, the one-off benefit of the sale of nickelinventory of $205 million and cash flows generated from the aluminiumbusiness unit, disposed in May 2007. Free cash flow reduced to$5 billion, due partly to higher sustaining capital expenditure of$1.7 billion, offset by lower interest and tax payments.
Income tax payments dropped by 41% from 2007 to $1.8 billion.
Expansionary capital expenditure rose to $3.2 billion. The cost ofthe acquisition of a 24.9% stake in Lonmin totalled $1,878 million,comprising the initial acquisition of 10.7% of Lonmin’s issued sharecapital at a price of £33 per share in August and the subsequentacquisition of a further 14.2% at an average price of £19.79 pershare in October.
The acquisitions of Jubilee Mines, a Western Australian nickelproducer, and Resource Pacific, owner of the Newpac undergroundcoal mine in New South Wales, Australia were completed in theperiod with a total cash outlay of $3.6 billion.
During the year, Xstrata issued a three-tranche bond under its EuroMedium-Term Note Programme, comprising EUR750 million 5.875%guaranteed notes due 2011, EUR600 million 6.25% guaranteednotes due 2015 and £500 million 7.375% guaranteed notes due2020. These bonds have been swapped into US dollars and tofloating interest rates. The proceeds from the bond issues wereused to refinance existing bank debt and further extend theGroup’s debt maturity profile.
In October, as part of the discussions with relationship banks regardingthe proposed acquisition of Lonmin and associated debt facilities,Xstrata secured a new $5 billion revolving debt facility with a syndicateof 15 banks to refinance existing debt and remove any significantrefinancing obligation until 2011. In January 2009, the facility wassubsequently increased by an additional $0.5 billion.
The Group now benefits from a comfortable debt maturity profileand significant headroom. Net debt increased by $4.7 billion to$16.3 billion, increasing gearing (defined as net debt to net debtplus equity) to 40% at the end of the year.
On 29 January, Xstrata announced a proposed 2 for 1 rights issue toraise approximately $5.9 billion. The successful completion of the rightsissue will provide an appropriate capital structure, even in the event ofa prolonged economic downturn, maintain the Group’s commitment toan investment grade balance sheet and will enable Xstrata to emergefrom the current downturn in a strengthened position.
Movement in net debt
Year ended Year ended$m 31.12.08 31.12.07
Cash generated from operations* 8,888 11,046
Net interest paid (552) (671)
Dividends received 2 4
Tax paid (1,753) (2,965)
Cash flow before capital expenditure 6,585 7,414
Sustaining capital expenditure (1,650) (1,432)
Disposals of fixed assets 101 86
Free cash flow 5,036 6,068
Expansionary capital expenditure (3,200) (1,430)
Cash flow before acquisitions 1,836 4,638
Purchase of investments (155) (41)
Purchase of share in associate (1,878) –
Purchase of subsidiaries and operations netof cash acquired (3,654) (2,130)
Sale of aluminium business, netof cash disposed – 1,120
Other investing activities 43 (44)
Net cash flow before financing (3,808) 3,543
Purchase of own shares (525) (14)
Equity capital management share buy-back – (518)
Sale and issue of own shares 64 56
Equity dividends paid (499) (443)
Dividends paid to minority interests (221) (485)
Redemption of minority interests – (22)
Debt acquired with operations (14) (301)
Redemption of convertible bonds – 202
Reclassification from equity and liabilities to debt – (200)
Fair value adjustment to Canadiancapital market notes – (113)
Payments from minority interests 301 180
Other non-cash movements 20 (70)
Movement in net debt (4,682) 1,815
Net debt at the start of the year (11,624) (13,439)
Net debt at the end of the period (16,306) (11,624)
* Includes net termination payment from LionOre of $275 million in 2007
Xstrata plc Annual Report 2008 41

Reconciliation of EBITDA to cash generated from operations
Year ended Year ended$m 31.12.08 31.12.07
EBITDA 9,657 10,888
Exceptional items (125) 275
Discontinued operations – 120
Share of results from associates (12) (15)
Share-based compensation plans 6 103
Increase in inventories 167 (652)
Increase in trade and other receivables 868 (348)
Increase in deferred stripping and other assets (299) (106)
Increase in trade and other payables (640) 562
Accrual for capital expenditure (273) (10)
Movement in provisions and other non-cash items (461) 229
Cash generated from operations 8,888 11,046
Net debt summary
As at As at$m 31.12.08 31.12.07
Cash 1,156 1,148
External borrowings (17,352) (12,640)
Finance leases (110) (132)
Net debt (16,306) (11,624)
Net debt to net debt plus equity 40% 32%
Working Capital
Working capital
As at As at$m 31.12.08 31.12.07
Inventories 3,573 4,167
Trade and other receivables 2,106 2,967
Prepayments 288 265
Trade and other payables (3,233) (3,745)
Net working capital 2,734 3,654
Working capital balances decreased during the course of 2008 dueto lower sales prices for exchange-traded metals, which reduceddebtors, together with the impact of the stronger US dollar onthe value of inventories.
Treasury Management and FinancialInstrumentsThe Group is generally exposed to US dollars through its revenuestream and seeks to source debt capital in US dollars directly or byborrowing in other currencies and swapping them into US dollars.Over 90% of the Group’s debt is priced with reference to short-datedUS floating interest rates, ensuring that Xstrata reaps the full benefitof the natural hedge to commodity prices provided by US interestrates. In a low commodity price environment, this capital structuresignificantly reduces the cost of the Group’s debt financing.
Currency cash flow hedging may be used to reduce the Group’s short-term exposure to fluctuations in the US dollar against local currencies.The unrealised mark-to-market gain at 31 December 2008 was$4 million. Currency hedging losses reflected in the income statementfor the year amounted to $9 million.
The Group did not enter into any strategic, long-term base metalshedging contracts in the period. The unrealised mark-to-market losson coal and gold hedges at 31 December 2008 for contracts maturingin 2009 was $75 million, based on the forward curve at that date.
42 Xstrata plc Annual Report 2008
Performance:Financial Review continued

Consolidated Capital Expenditure
Capital expenditure summary
(excludes deferred stripping expenditure)
Year ended Year ended$m 31.12.08 31.12.07
Alloys 101 56
Coal 459 460
Copper 557 425
Nickel 267 281
Zinc 278 219
Technology 3 3
Unallocated 9 11
Total Sustaining 1,674 1,455
Attributable Sustaining 1,633 1,426
Alloys 121 64
Coal 745 347
Copper 558 296
Nickel 1,645 424
Zinc 377 285
Technology 3 1
Total Expansionary 3,449 1,417
Attributable Expansionary 2,983 1,396
Alloys 222 120
Coal 1,204 807
Copper 1,115 721
Nickel 1,912 705
Zinc 655 504
Technology 6 4
Unallocated 9 11
Total 5,123 2,872
Attributable total 4,616 2,822
In 2008, total capital expenditure rose to $5 billion. Expansionarycapital expenditure of $3.4 billion fell below previous guidance for2008 of $3.7 billion, as a number of discretionary expenditure itemswere deferred or foregone in the latter part of the year, reflectingthe Group’s focus on cash optimisation following the sharp reversalin economic conditions. Sustaining capital expenditure remainedin line with full-year guidance at $1.7 billion.
Major items of expansionary capital expenditure during the yearincluded further spending at a number of the Group’s majorbrownfield and greenfield growth projects. Capital expenditure atXstrata Nickel rose to $1.6 billion in 2008. Over $866 million wasspent at Koniambo (on a 100% basis) to make significant progress inthe construction of this major greenfield project, which at full capacitywill produce 60,000 tonnes of nickel with first quartile costs. XstrataNickel’s partner SMSP contributed $173 million during the year.Expenditure of $205 million was invested at Xstrata Nickel Australasiato develop the Cosmos and Sinclair operations and continueexploration drilling. The Nickel Rim South project incurred $234 millionof capital expenditure for deposit definition and to progress theoperation’s ramp up as it approaches commissioning. Together withthe accelerated closure of end-of-life operations, the Nickel RimSouth project will transform Xstrata Nickel’s Sudbury operations andsignificantly reduce the overall cost profile of the complex when itcommences production this year. Capital spending at Xstrata Coalincluded the Goedgevonden thermal coal operation in South Africawhich is on track to commence production in the second quarter,the expansion of Glendell and expenditure to progress the large-scaleWandoan project. New operations commenced during 2008 at XstrataZinc’s Perseverance mine in Canada, Xstrata Nickel’s Sinclair mine inWestern Australia and the Elandsfontein PGM mine and concentratorin South Africa. Expansion projects were completed at Lomas Bayasand Altonorte copper operations during the second half and pre-feasibility and feasibility studies were progressed or completed at anumber of copper growth projects including Tampakan, Las Bambas,Antapaccay, El Pachón, El Morro, Energía Austral and in respect ofexpansions to the Collahuasi and Antamina operations.
Xstrata’s businesses are undertaking ongoing reviews of bothsustaining and expansionary capital expenditure and have alreadyidentified significant reductions in 2009 expenditure, throughthe deferral or suspension of capital spending during a period ofdepressed commodity prices, lower cash flows and poor visibilityinto the near-term outlook. Capital expenditure deferrals have beenstructured to retain maximum optionality from Xstrata’s significantorganic growth pipeline, positioning the Group to rapidly bringon lower cost organic growth in key commodities when marketconditions allow.
Acquisitions and DisposalsOn 29 October 2007, the Group announced a cash offer for sharesin Jubilee Mines NL (Jubilee) of AUD23 per share. Xstrata gainedcontrol of Jubilee on 31 January 2008 and had acquired 100% of theshares in Jubilee by 31 March 2008 for a total cost of $2,751 millionnet of cash acquired. The acquisition has brought Xstrata Nickel accessto the major Western Australian nickel belt through the operationalCosmos nickel mine, together with further growth options from theSinclair growth project, which was commissioned in October, anda highly prospective land position.
Xstrata plc Annual Report 2008 43

44 Xstrata plc Annual Report 2008
Performance:Financial Review continued
On 5 December 2007, the Group announced an unconditionalcash offer for Resource Pacific Holdings Limited (Resource Pacific)of AUD2.85 per share and on 8 February 2008 the offer price wasincreased to AUD3.20 per share. Xstrata gained control of ResourcePacific on 20 February and the acquisition completed on 23 April2008. The total cost of the acquisition was $903 million net of cashacquired. Resource Pacific was previously listed on the Australian stockexchange and owns a 90% interest in the Newpac underground coalmine located in the Hunter Valley coalfields of New South Wales,Australia. Under a put option granted as part of the co-operationagreement entered into between Marubeni Corporation andXstrata Coal, Marubeni Corporation purchased 11.98% of ResourcePacific equivalent to 40.5 million shares for a total considerationof AUD130 million ($122 million) on 21 October 2008 to bringits total shareholding to 22.2%. Xstrata Coal now owns 77.8%.
On 5 September 2008, Xstrata Copper purchased a 17.83% stakein Indophil Resources NL (Indophil) from Lion Selection for AUD 82million (approximately $68 million). The acquisition followed theexpiry of Xstrata Copper’s offer for Indophil at AUD1.28 per share on29 August, 2008 and brought Xstrata’s total shareholding in Indophilto 19.99%. Indophil’s flagship asset is its 34.23% interest, with a rightto acquire an additional 3.27%, in the Tampakan copper project in thesouthern Philippines. Xstrata Copper has management control of theTampakan project.
On 6 August 2008, Xstrata announced a proposed cash offer forLonmin, the world’s third largest platinum producer, valuing Lonmin’sissued share capital at approximately £5 billion ($10 billion at the thenprevailing exchange rate), and announced that it had acquired 10.7%of Lonmin’s issued share capital. The proposed offer reflected theGroup’s long-stated intention to develop a world-class platinumbusiness. Subsequent market turbulence and uncertainty over thefuture refinancing of acquisition debt led Xstrata to decide not toproceed with a full offer on 1 October 2008, however, the Groupincreased its stake in Lonmin to bring its holding to 24.9% to providea significant stake in a business with attractive long-term fundamentals.
DividendsIn light of the rights issue, Xstrata’s Board of Directors has decided towaive the final dividend for 2008. As a result, the full year dividendwill consist of the interim dividend of 18¢ per share, which wasdeclared in August and paid on 10 October. The Board recognises theimportance of dividend payments to shareholders and will resumedividend payments at the earliest opportunity.
Further details regarding tax refunds on dividend payments, togetherwith currency election and dividend mandate forms, are available fromXstrata’s website (www.xstrata.com) or from the Company’s Registrars.
Share DataUnder IFRS, own shares (treasury stock) are deducted from the totalissued share capital when calculating earnings per share. During theperiod, 4,664,407 shares were disposed of and six million shares wereissued to the Share Ownership Trust (an employees’ share schemeas that term is defined for the purposes of the Companies Act 1985and within the provisions) to service the exercise of employee shareoptions. During the year, Batiss Investments purchased 6.92 millionshares under the equity capital management programme, at anaverage price of £36.85 per share, bringing the total number of sharesheld by Batiss Investments to 16.23 million, representing 1.66% ofXstrata’s issued share capital.
Share price
XTA LSE XTA SWX(GBP) (SFR)
Closing price 31.12.07 35.50 81.75
Closing price 31.12.08 6.40 9.80
Period high 44.20 90.80
Period low 5.75 9.70
Period average 29.04 9.69
Shares in issue for EPS calculations
Number ofshares (000s)
Weighted average for year ended 31.12.08used for statutory eps calculation 958,667
Weighted average for year ended 31.12.07used for statutory eps calculation 959,549
Total issued share capital as at 31.12.08 977,671
Publicly disclosed major shareholders
% ofNumber of ordinary
ordinary shares issued shareName of shareholder of US$0.50 each capital
Glencore International AG* 336,801,333 34.45
Capital Research and Management 51,492,225 5.27
AXA S.A. 41,225,636 4.21
Legal & General Group Plc 29,999,246 3.06
* The voting rights comprised in this interest are directly controlled by FingesInvestment B.V., a wholly-owned subsidiary of Glencore International AG

Xstrata plc Annual Report 2008 45
Peet NienaberChief Executive Xstrata Alloys
Xstrata Alloys’ EBIT rose by 159% in 2008 to$1 billion, due to record ferrochrome prices andstrong cost control, which resulted in real costsavings of $32 million in 2008. An increase inplatinum group metals in concentrate production,following the successful commissioning of theElandsfontein operation was offset by lowerferrochrome volumes. Higher mining and CPIinflation were more than outweighed by thepositive impact of the weaker South AfricanRand against the US dollar.
Alloys
Alloys Financial data
2008 2007
Revenue ($m) 2,002 1,352
EBITDA ($m) 1,094 448
EBIT ($m) 1,007 389
Share of Group EBIT (%) 13.9 4.4
Capital expenditure ($m) 222 120
Alloys Operations
Production 2008 2007
Ferrochrome (kt)* 1,126 1,219
Ferrovanadium (k kg) 3,622 4,280
V2O5 (k lbs) 16,604 18,870
Platinum Group Metals** (oz) 222,516 99,215
Employees 9,476 8,499
Average prices
Chrome (US¢/lb) (European benchmark) 175.8 89.3
Ferrovanadium (US$/kg) (Metal Bulletin) 61.2 37.2
Vanadium pentoxide (US$/lb) (Metal Bulletin) 13.5 7.4
Platinum ($/oz)(London Platinum & Palladium Market) 1,578 1,337
Palladium ($/oz)(London Platinum & Palladium Market) 353 355
Rhodium ($/oz) (Metals Week) 6,483 6,201
Contribution to GroupEBIT in 2008
Contribution to Grouprevenue in 2008
7% 14%
* Xstrata’s 79.5% share of the Xstrata-Merafe Chrome Venture** 100% consolidated
For more information visit:
www.xstrataalloys.com

Ferrochrome and VanadiumThe first half of 2008 was characterised on the one hand by robustsupply demand fundamentals driven by high stainless steel meltproduction, which steadily increased from the beginning of theyear and on the other hand by supply-side cutbacks resulting frompower restrictions imposed by South Africa’s power utility Eskom.Ferrochrome base prices remained strong throughout the year andthe average European benchmark price for 2008 of 175.8¢ perpound was 97% higher than in the previous year.
In the first half, global ferrochrome production reached 2 milliontonnes per quarter for the first time, 6% higher than for thesame period in 2007. However, a typically slow third quarter wasexacerbated by lower steel production in China during the OlympicGames and was followed by a dramatic fall in demand during thefourth quarter as the global financial turmoil impacted all majorcommodity markets. Between July and December 2008, the Europeanbenchmark ferrochrome price fell by 9% while the spot price fellby 53%.
The supply-side response to weaker demand has been rapid andsignificant cuts were announced by all the major ferrochromeproducers during the fourth quarter of 2008. Stainless melt growthwill be significantly below its long-term average for the secondconsecutive year, with global production for 2008 estimated tohave declined by approximately 11% to 25.5 million tonnes.
Exports of South African chrome ore increased significantly as a resultof the power restrictions in the first half of 2008 which constraineddomestic beneficiation. As a result of the increased availability ofore and robust ferrochrome prices enabled previously uneconomicalcapacity to restart in various regions, including China and India. Theincreased supply of ferrochrome coupled with deterioration in demandresulted in the ferrochrome spot price softening to levels below theprevailing international contract price towards the end of 2008.
Similarly, demand for vanadium was robust in the first half butweak in the latter part of the year. Strong demand and severe supplydisruptions in China and South Africa during the first part of theyear resulted in prices more than doubling. The impact of the globalfinancial crisis from September caused the ferrovanadium price todecline by 71% from its highs earlier in 2008, to end the year at$26.50. The average price for 2008 of $61.18 per kilogram ofvanadium was 65% higher than the previous year.
OutlookPlanned expansions to South African ferrochrome capacity in 2008were largely deferred due to the ongoing power constraints. Thesedeferrals have been further extended in South Africa and globally,in response to the current economic slowdown.
The outlook for ferrochrome and vanadium remains, however, robustin the medium to long term. In the medium term, steel productionis expected to increase from current low levels, supported by majoreconomic stimulus plans, which include significant investment ininfrastructure. Stainless melt production in 2009 is expected to decreaseby around 3% to approximately 24 million tonnes. As global demandrecovers, production cutbacks coupled with the deferral or cancellationof capacity expansions will reduce oversupply and will again placeupward pressure on prices
Platinum Group MetalsStrong demand in recent years for platinum group metals (PGM)has been driven by growth in automobile production and tighteningemissions legislation creating increased demand for catalytic converters,while tight supply was due largely to mine underperformance at anumber of producers. In early 2008, platinum and rhodium prices roseto all time record levels of $2,275 and $10,100 per ounce, respectively,in response to the South African power constraints, adverse weatherconditions and temporary mine closures due to safety issues.
Demand for platinum from the auto catalyst industry fell in responseto weakening global economic conditions, particularly in the fourthquarter of 2008 as the severity of the global financial turmoil becameapparent. The platinum price traded down to parity with gold for thefirst time since 1997. From the record highs reached earlier in the year,platinum and rhodium prices decreased by 61% and 88% respectively,ending the year at $899 and $1,250 per ounce respectively.
Weaker demand is leading a number of PGM producers to scale backproduction and to defer planned expansions.
OutlookDespite the current economic situation, the medium to long-termoutlook for PGMs remains positive. Recent deferrals of capital projectsare likely to lead to more severe supply-side constraints, while demandis expected to improve in line with economic conditions and in responseto the stimulus packages introduced by major countries, the tighteningof emissions legislation globally and increased penetration of diesel-powered vehicles in Europe and, in particular, the US.
46 Xstrata plc Annual Report 2008
Markets
The Bokamoso pelletising project at Wonderkopin South Africa reached full production capacityduring 2008, exceeding name-plate capacity bymore than 15% for three consecutive months
Performance: Operating ReviewAlloys continued

Xstrata plc Annual Report 2008 47
Xstrata Alloys’ EBIT rose by 159% in 2008 to $1 billion, due to recordferrochrome prices and strong cost control, which resulted in real costsavings of $32 million in 2008. Lower ferrochrome volumes offset thebenefit of increased PGM volumes. Higher mining and CPI inflationwere more than outweighed by the positive impact of the weakerSouth African Rand against the US dollar.
Ferrochrome and VanadiumEBIT from the ferroalloys division rose by 175% in 2008 to$907 million, primarily due to record ferrochrome prices andexcellent cost control.
Attributable saleable production of 1.1 million tonnes of ferrochromewas 8% lower compared to the previous year, following significantproduction cuts during the last quarter of the year in response tothe worldwide economic slowdown. In November and December,the Xstrata-Merafe Chrome Venture announced the temporarysuspension of 11 furnaces. In January 2009, the Venture announcedthe suspension of a further six furnaces, bringing total suspendedproduction to 80% of annual capacity. Reduced power supply as wellas a planned plant closure in December 2008 impacted adversely onferrovanadium volumes, which fell by 15% in 2008.
Power supply from Eskom, the South African power supplier, wasreduced by 10% during the first half of 2008, in an effort to stabilizethe national grid. This had a significant impact on Xstrata Alloys’operations and is anticipated to continue to impact production andsupply growth over the next five years, until new generating capacitycomes on line. In response to the power constraints, a task team hasbeen set up to investigate short- medium- and long-term generationalternatives, including the establishment of an independent powergeneration facility.
Cost savings of $22 million were achieved as a result of ongoingprocess improvement initiatives and investments to reduce costs,including lower cost new capacity at Project Lion and Bokamoso,which resulted in an improvement of 13% in power efficiency and a9% improvement in ore consumption efficiencies. These technologiesallow some replacements of metallurgical grade coke with lowerpriced reductants, mitigating the impact of a year-on-year increaseof 71% in the average consumption prices of metallurgical gradecoke and char.
Platinum Group MetalsEBIT from the growing platinum group metals (PGM) division increasedby 70% to $100 million in 2008 primarily as a result of a 124% increasein PGM in concentrate production to 224,305 ounces in 2008 followingthe successful commissioning of the Elandsfontein operation. Improvedvolumes contributed $72 million to EBIT and more than offset thenegative impact of the rapid decline in PGM prices in the secondhalf of the year.
Steady state production from the Elandsfontein opencast operationwas achieved ahead of schedule and within budget in June 2008 andthe mine is now producing approximately 250,000 tonnes of ore permonth. Production at the Mototolo joint venture was slightly lowerthan in 2007, due to unforeseen geological conditions at the LebowaShaft which negatively impacted grade and ore volume. Miningconditions are expected to improve during 2009.
The development of the Mototolo on-reef decline clusters hasprogressed well, making additional mining faces available to supportramp up to steady state production of 200,000 tonnes per month byearly 2010. The MF2 concentrator is performing according to design.
Operations
Financial and operating data
Year ended Year ended$m 31.12.08 31.12.07
Ferrochrome and vanadium
Revenue 1,733 1,223
EBITDA 959 382
Depreciation and amortisation (52) (52)
EBIT 907 330
Share of Group EBIT 12.5% 3.7%
Capital employed 969 1,092
Return on capital employed* 83.0% 31.0%
Capital expenditure 108 103
Sustaining 95 56
Expansionary 13 47
Platinum group metals
Revenue 269 129
EBITDA 135 66
Depreciation and amortisation (35) (7)
EBIT 100 59
Share of Group EBIT 1.4% 0.7%
Capital employed 3,121 1,774
Return on capital employed* 6.7% 16.4%
Capital expenditure 114 17
Sustaining 6 –
Expansionary 108 17
* ROCE % based on average exchange rates for the year
EBIT variances
$m
EBIT 31.12.07 389
Sales price* 619
Volumes (26)
Unit cost – real 32
Unit cost – CPI inflation (68)
Unit cost – mining inflation (61)
Unit cost – foreign exchange 206
Other income and expenses (47)
Depreciation and amortisation (excluding foreign exchange) (37)
EBIT 31.12.08 1,007
* Net of commodity price-linked costs, treatment and refining charges

48 Xstrata plc Annual Report 2008
Performance: Operating ReviewAlloys continued
Summary production data
Year ended Year ended31.12.08 31.12.07
Ferrochrome (kt)* 1,126 1,219
Vanadium**
Ferrovanadium (k kg) 3,622 4,280
V2O5 (k lbs) 16,604 18,870
Platinum Group Metals (oz)**
Platinum 138,098 57,303
Palladium 65,774 32,618
Rhodium 18,644 9,294
Indicative average published prices (Metal Bulletin)
Ferrochrome (¢lb) 175.8 89.3
V2O5 ($/lb) 13.5 7.4
Ferrovanadium ($/kg V) 61.2 37.2
Average LBM Platinum price ($/oz) 1,564 1,337
Average LBM Palladium price ($/oz) 347 355
Average LBM Rhodium price ($/oz) 6,160 6,201
* Including Xstrata’s 79.5% share of the Xstrata-Merafe Chrome Venture** 100% consolidated
The Lion ferrochrome smelter in South Africautilises Xstrata’s proprietary Premus technologyenabling lower cost, energy-efficient production
FerrochromeThe Bokamoso pelletising project reached full production capacityduring 2008 and exceeded name-plate capacity by more than 15%for three consecutive months.
The additional agglomeration capacity provided by the Lion andBokamoso projects allowed for the production and use of increasedvolumes of fine UG2 chrome ore. Optimisation of the UG2 concentratingplants and additional production from the Mototolo and Elandconcentrators resulted in a production increase of 20% to 1.5 milliontonnes UG2 during 2008. The maximum use of UG2 is favouredduring periods of reduced ferrochrome production at the smeltersin order to optimise production costs.
The Boshoek opencast reserves have been successfully developed andare now in operation at a sustainable level. The development of theMagareng opencast reserves and mine was completed during 2008to supplement chromite ore supplies to Lion and Lydenburg.
Xstrata Alloys has submitted 11 applications for new orderprospecting and mining rights under South Africa’s Mineral andPetroleum Resources Development Act. All of these applicationshave been granted to Xstrata Alloys by the Department of Mineralsand Energy. Of the 11 applications made to convert existing oldorder mining rights, nine have been granted and notarially executed.The outstanding conversions are being processed.
Platinum Group MetalsThe Western Decline System at the Elandsfontein mine will commencesinking in early 2009 and the Eastern Decline System is scheduledto follow approximately 18 months later. Production from theunderground operations is scheduled to replace opencast tonnage,maintaining current milling throughput. The Western Decline Systemshould reach steady state production by 2011 and the Eastern DeclineSystem by 2012, doubling current production levels. Elandsfontein hasan estimated mine life of approximately 50 years.
The acquisition of the De Wildt property for $12 million has enhancedthe Elandsfontein resource and will result in an extension of the openpit mineable area as well as provide access to the Madibeng leasearea. An extensive exploration programme at the Madibeng andDe Wildt properties commenced during August 2008. Explorationdrilling is also under way at the Beestkraal property, where thefirst five boreholes have intersected both the Merensky and UG2reef horizons.
A binding Heads of Agreement was concluded with Nkwe PlatinumLtd and Genorah Resources Ltd in August, giving Xstrata theexclusive option to acquire a 50% interest in the project located onthe Eastern Limb of the Bushveld Igneous Complex. Pre-feasibilitywork is progressing well with a total of 53,000 metres of explorationdrilling completed to date. The pre-feasibility drilling programme isscheduled to be completed in the third quarter of 2009.
Developments
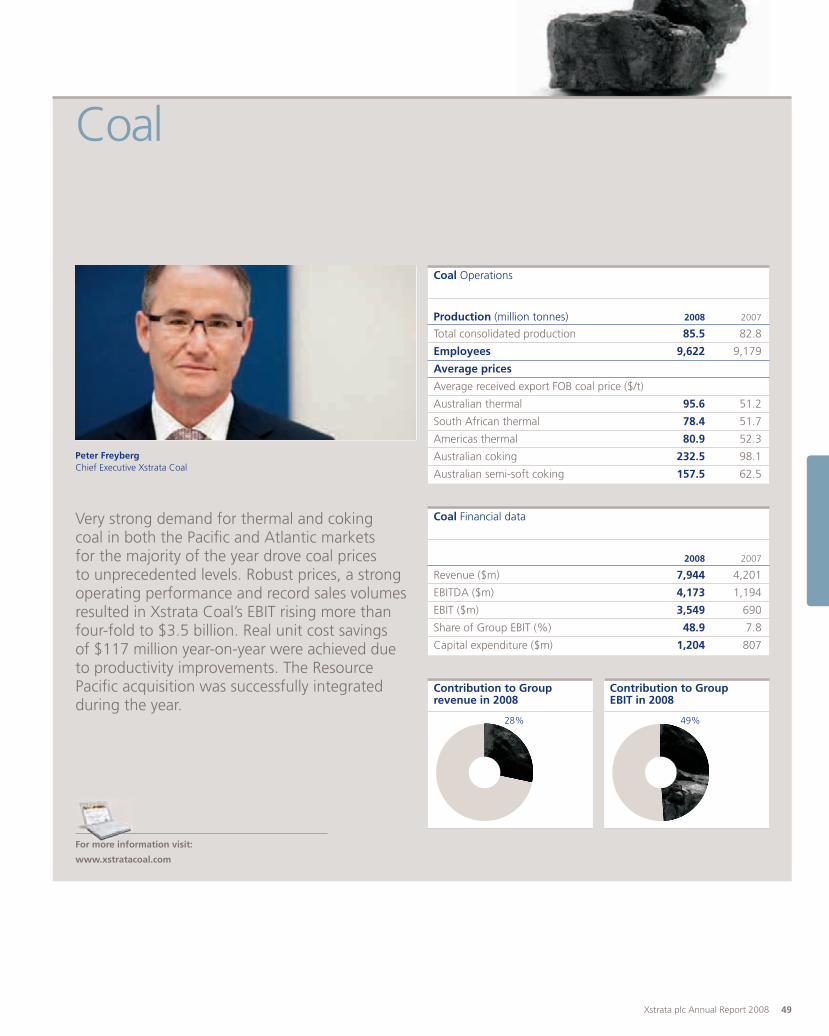
Xstrata plc Annual Report 2008 49
Peter FreybergChief Executive Xstrata Coal
Very strong demand for thermal and cokingcoal in both the Pacific and Atlantic marketsfor the majority of the year drove coal pricesto unprecedented levels. Robust prices, a strongoperating performance and record sales volumesresulted in Xstrata Coal’s EBIT rising more thanfour-fold to $3.5 billion. Real unit cost savingsof $117 million year-on-year were achieved dueto productivity improvements. The ResourcePacific acquisition was successfully integratedduring the year.
Coal
Coal Financial data
2008 2007
Revenue ($m) 7,944 4,201
EBITDA ($m) 4,173 1,194
EBIT ($m) 3,549 690
Share of Group EBIT (%) 48.9 7.8
Capital expenditure ($m) 1,204 807
Coal Operations
Production (million tonnes) 2008 2007
Total consolidated production 85.5 82.8
Employees 9,622 9,179
Average prices
Average received export FOB coal price ($/t)
Australian thermal 95.6 51.2
South African thermal 78.4 51.7
Americas thermal 80.9 52.3
Australian coking 232.5 98.1
Australian semi-soft coking 157.5 62.5
Contribution to GroupEBIT in 2008
Contribution to Grouprevenue in 2008
28% 49%
For more information visit:
www.xstratacoal.com
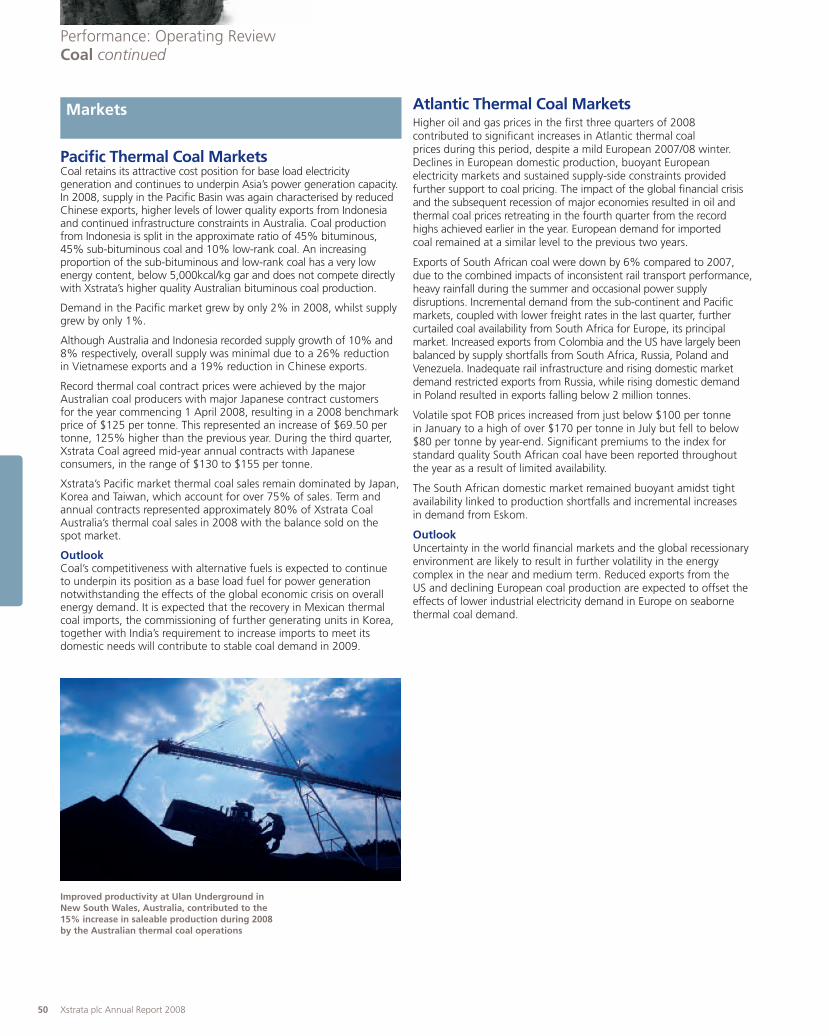
Pacific Thermal Coal MarketsCoal retains its attractive cost position for base load electricitygeneration and continues to underpin Asia’s power generation capacity.In 2008, supply in the Pacific Basin was again characterised by reducedChinese exports, higher levels of lower quality exports from Indonesiaand continued infrastructure constraints in Australia. Coal productionfrom Indonesia is split in the approximate ratio of 45% bituminous,45% sub-bituminous coal and 10% low-rank coal. An increasingproportion of the sub-bituminous and low-rank coal has a very lowenergy content, below 5,000kcal/kg gar and does not compete directlywith Xstrata’s higher quality Australian bituminous coal production.
Demand in the Pacific market grew by only 2% in 2008, whilst supplygrew by only 1%.
Although Australia and Indonesia recorded supply growth of 10% and8% respectively, overall supply was minimal due to a 26% reductionin Vietnamese exports and a 19% reduction in Chinese exports.
Record thermal coal contract prices were achieved by the majorAustralian coal producers with major Japanese contract customersfor the year commencing 1 April 2008, resulting in a 2008 benchmarkprice of $125 per tonne. This represented an increase of $69.50 pertonne, 125% higher than the previous year. During the third quarter,Xstrata Coal agreed mid-year annual contracts with Japaneseconsumers, in the range of $130 to $155 per tonne.
Xstrata’s Pacific market thermal coal sales remain dominated by Japan,Korea and Taiwan, which account for over 75% of sales. Term andannual contracts represented approximately 80% of Xstrata CoalAustralia’s thermal coal sales in 2008 with the balance sold on thespot market.
OutlookCoal’s competitiveness with alternative fuels is expected to continueto underpin its position as a base load fuel for power generationnotwithstanding the effects of the global economic crisis on overallenergy demand. It is expected that the recovery in Mexican thermalcoal imports, the commissioning of further generating units in Korea,together with India’s requirement to increase imports to meet itsdomestic needs will contribute to stable coal demand in 2009.
Atlantic Thermal Coal MarketsHigher oil and gas prices in the first three quarters of 2008contributed to significant increases in Atlantic thermal coalprices during this period, despite a mild European 2007/08 winter.Declines in European domestic production, buoyant Europeanelectricity markets and sustained supply-side constraints providedfurther support to coal pricing. The impact of the global financial crisisand the subsequent recession of major economies resulted in oil andthermal coal prices retreating in the fourth quarter from the recordhighs achieved earlier in the year. European demand for importedcoal remained at a similar level to the previous two years.
Exports of South African coal were down by 6% compared to 2007,due to the combined impacts of inconsistent rail transport performance,heavy rainfall during the summer and occasional power supplydisruptions. Incremental demand from the sub-continent and Pacificmarkets, coupled with lower freight rates in the last quarter, furthercurtailed coal availability from South Africa for Europe, its principalmarket. Increased exports from Colombia and the US have largely beenbalanced by supply shortfalls from South Africa, Russia, Poland andVenezuela. Inadequate rail infrastructure and rising domestic marketdemand restricted exports from Russia, while rising domestic demandin Poland resulted in exports falling below 2 million tonnes.
Volatile spot FOB prices increased from just below $100 per tonnein January to a high of over $170 per tonne in July but fell to below$80 per tonne by year-end. Significant premiums to the index forstandard quality South African coal have been reported throughoutthe year as a result of limited availability.
The South African domestic market remained buoyant amidst tightavailability linked to production shortfalls and incremental increasesin demand from Eskom.
OutlookUncertainty in the world financial markets and the global recessionaryenvironment are likely to result in further volatility in the energycomplex in the near and medium term. Reduced exports from theUS and declining European coal production are expected to offset theeffects of lower industrial electricity demand in Europe on seabornethermal coal demand.
50 Xstrata plc Annual Report 2008
Performance: Operating ReviewCoal continued
Improved productivity at Ulan Underground inNew South Wales, Australia, contributed to the15% increase in saleable production during 2008by the Australian thermal coal operations
Markets

Xstrata plc Annual Report 2008 51
Coking Coal MarketsCoking coal markets experienced significant fluctuations in supply anddemand throughout 2008. The first half experienced unprecedentedcustomer demand for available tonnes, following the extreme floodingevents in Queensland during the first quarter which severely restrictedthe availability of prime hard coking coal and reduced Australiancoking coal export supply in the first half by 6 million tonnes. Steelproducers looked to US suppliers to cover the supply shortfall, liftingUS exports by 9 million tonnes over the full year.
In stark contrast, the second half of 2008 saw the steel andmanufacturing industries significantly impacted by the sudden globalfinancial liquidity crisis, resulting in reduced customer demand for allgrades of metallurgical coal. Full year 2008 data indicates global steelproduction in coking coal importing countries grew by only 1% over2007, leading to increased coking coal demand of 8 million tonnes.Australian and Canadian metallurgical coal exports were marginallybelow 2007 levels.
In April, term prices of $300 per tonne were agreed with customersfor prime hard coking coals for the year ending March 2009 by theleading producer. This settlement represented an increase of $202per tonne (206%) over the previous year, and in some cases includesthe cancellation of some of the carry over arising from the floods inQueensland in early 2008. With the exception of Xstrata, all other hardcoking coal suppliers subsequently settled at an equivalent price level.
Xstrata concluded its 2008 price negotiations with term customerswhile simultaneously developing a new customer base largely withinthe rapidly expanding Indian steel industry. For the contract yearcommencing April 2008, the average contract price for prime hardcoking coal agreed was $360 per tonne.
Asian steel mills and Australian coal producers settled prices forNSW high volatile semi-soft coking coals at approximately $240 pertonne, which applies for the contract year commencing 1 April 2008representing an increase of 276% over last year’s term price of$63.90 for Xstrata brands.
Term and annual contracts account for in excess of 70% of Xstrata’shard coking coal and semi-soft coking coal sales. Xstrata’s hard cokingcoal is sold into each major market while Japan remains the dominantmarket for semi-soft coking coal.
OutlookThe coking coal market in 2009 is expected to remain heavilyaffected by the global economic downturn. In response to low prices,approximately 24 million tonnes of coking coal production curtailmentshave been announced for 2009 representing approximately 13%of planned production levels prior to the economic downturn in thesecond half of 2008. However, until steel consumption begins torecover, all metallurgical coal grades will continue to be in oversupply,although the declining value of the Australian dollar will provideXstrata with some cost offset to declining prices.
The Colombian Cerrejón operation achieveda record operating result in 2008 as it rampsup to 32 million tonnes per annum.

Financial and operating data
Year ended Year ended$m 31.12.08 31.12.07
Revenue: operations† 7,633 3,965
Coking Australia 1,595 587
Thermal Australia 4,139 1,996
Thermal South Africa 1,058 864
Thermal Americas 841 518
Revenue: other 311 236
Coking Australia 2 –
Thermal Australia 260 180
Thermal South Africa 49 56
Total revenue 7,944 4,201
Coking Australia 1,597 587
Thermal Australia 4,399 2,176
Thermal South Africa 1,107 920
Thermal Americas 841 518
EBITDA 4,173 1,194
Coking Australia 1,022 214
Thermal Australia 2,191 508
Thermal South Africa 542 235
Thermal Americas 418 237
Depreciation and amortisation (624) (504)
Coking Australia (92) (71)
Thermal Australia (317) (231)
Thermal South Africa (131) (126)
Thermal Americas (84) (76)
EBIT 3,549 690
Coking Australia 930 143
Thermal Australia 1,874 277
Thermal South Africa 411 109
Thermal Americas 334 161
Capital employed 8,343 8,557
Australia 5,194 5,269
South Africa 1,317 1,481
Americas 1,832 1,807
Share of Group EBIT 48.9% 7.8%
Australia 38.6% 4.8%
South Africa 5.7% 1.2%
Americas 4.6% 1.8%
Return on capital employed* 37.0% 9.2%
Australia 44.6% 10.0%
South Africa 27.7% 7.6%
Americas 18.2% 8.9%
Capital expenditure 1,204 807
Australia 776 489
South Africa 346 231
Americas 82 87
Sustaining 459 460
Expansionary 745 347
† Includes purchased coal for blending with mine production* ROCE % based on average exchange rates for the year
EBIT variances
$m
EBIT 31.12.07* 690
Sales price* 2,823
Volumes 63
Unit cost – real 117
Unit cost – CPI inflation (230)
Unit cost – mining industry inflation (206)
Unit cost – foreign exchange 81
Other income and expenses 47
Depreciation and amortisation (excluding foreign exchange) (83)
Business combinations 247
EBIT 31.12.08 3,549
* Net of commodity price-linked costs, treatment and refining charges
Very strong demand for thermal and coking coal in both the Pacificand Atlantic markets for the majority of the year drove coal prices tounprecedented levels. Robust prices were complemented by a strongoperating performance and record sales volumes at Xstrata Coal’soperations, which contributed an additional $63 million to EBITcompared to 2007. Overall, Xstrata Coal EBIT rose more than four-fold to $3.5 billion, with stronger prices contributing an additional$2.8 billion to 2008 earnings.
Sales volumes increased for all operating regions except SouthAfrica, which struggled with rail constraints. Coking coal productionbenefited from a full year of Tahmoor sales and opportunistic salesfrom the Oaky Creek Complex to take advantage of excess capacityduring the Queensland floods in the first quarter of 2008. Australianthermal coal sales benefited from the continued ramp up at UlanUnderground and the commencement of the owner-operatedGlendell operation. Cerrejón continues to increase sales in line withits expansion to 32 million tonnes per annum total operating capacity.
Inflationary pressures in mining sector input costs continued in 2008,in particular for fuel and explosives and impacted EBIT by $436 millioncompared to 2007. Excluding the effect of CPI, royalties and coalmining sector inflation, real unit cost savings of $117 million year-on-year were achieved due to productivity improvements at the NewlandsNorthern Underground, the improved Ulan underground performance,changes in the domestic sales mix in South Africa, partially offset by costincreases at Bulga Opencut due to an increase in contractor overburdenremoval, ongoing geological issues at Beltana and Rolleston, geotechnicalissues at Newlands Opencut operations, and the planned closure of theImpunzi Underground.
The rapid depreciation in exchange rates in the last quarter of the yearmore than offset stronger operating currencies in the early part of theyear, with foreign exchange contributing an additional $81 million toEBIT compared to the prior year.
Australian Thermal CoalThe strength of the Asian coal markets drove up the price of coalduring 2008, with the average realised thermal price in 2008 risingto $96 per tonne, an increase of 87% on the prior year. Averagerealised semi-soft prices also increased relative to the 2007 levels, upby 152% to $158 per tonne, leading to an increase in EBIT of 577%,to $1.9 billion.
Saleable production increased by 15% over 2007 levels to 40 milliontonnes, due to an improved performance at the Newlands NorthernUnderground, continued ramp up at Ulan Underground and thecommencement of the owner-operated Glendell operation at the
52 Xstrata plc Annual Report 2008
Performance: Operating ReviewCoal continued
Operations

Mount Owen Complex. Improved performance by Port Waratah CoalServices (PWCS) in New South Wales decreased demurrage expenditurein 2008.
Australian coking coalIn 2008, market prices for coking coal reached record levels, drivenby strong demand and a shortage of supply due to the floods inQueensland in the first quarter of the year. EBIT from the cokingcoal operations increased to $930 million, up 550% on 2007,as a result of significantly higher average received prices of$233 per tonne, an increase of 137% over the previous year.
Overall coking coal sales volumes increased in 2008, benefiting fromthe inclusion of Tahmoor for the full 12 months, plus opportunisticsales from the Oaky Creek Complex during the floods in the firstquarter. This was partially offset by the impacts of the globaleconomic crisis and the significant downturn in demand from steeland manufacturing industries in the fourth quarter. As a consequence,Xstrata Coal made the decision to suspend longwall operations at theOaky Number 1 mine and will continue to meet customer demand viaexisting stockpiles and production from the Oaky North operation.
South AfricaEBIT from the South African operations increased by 277% to$411 million due to significantly higher average realised prices, whichwere 52% higher than in 2007 at $78 per tonne, on the strength ofthe Atlantic Coal market, real unit cost savings and the weaker SouthAfrican Rand.
Sales volumes decreased by 4% to 24 million tonnes in 2008,predominantly due to the rail constraints experienced during the yearwhich resulted in a decline in export tonnes of 10% to 12.3 milliontonnes. To mitigate this reduction in export capacity, efforts weremade to secure additional domestic sales to supplement lost exportsales, resulting in a 5% increase in domestic sales to 11.7 milliontonnes. The domestic sales were primarily for ESKOM to assist inalleviating the power issues across the country. Production for 2008decreased by 2 million tonnes, mainly due to the planned closure ofthe Impunzi Underground operation.
Real unit costs, excluding removing the effect of inflation and one-off costs, improved significantly due to the continued ramp up at thelow cost Goedgevonden operation and the change in the sales mixdue to a higher proportion of lower cost domestic sales, partiallyoffset by the closure of the Impunzi Underground. The South AfricanRand depreciated approximately 17% during the year, which alsobenefited EBIT.
AmericasThe Cerrejón operation in Colombia achieved a record operatingresult for 2008, with Xstrata Coal’s share of EBIT more than doublingto $334 million compared to the previous year. This result was due tothe strength of the Atlantic coal market during the year which enabledCerrejón to achieve average realised prices of $81 per tonne, 55% upon 2007.
Sales volumes increased to 10.5 million tonnes, up 6% on 2007.Productivity improvements were achieved as a result of the investmentsmade in equipment to achieve increased total production capacityof 32 million tonnes per annum by year’s end. Xstrata Coal’s shareof production has increased to 10.4 million tonnes in 2008.
Operating costs at Cerrejón were impacted by significant inflationarypressures in 2008, in particular fuel and explosives. After removingthe effect of inflation and one-off costs, real unit cost savings havebeen achieved through productivity improvements.
Summary production data
Year ended Year ended(million tonnes) 31.12.08 31.12.07
Total consolidated production 85.5 82.8
Australian coking 6.9 6.8
Australian semi-soft coking 5.3 6.4
Australian thermal 40.2 35.0
South African thermal* 22.7 24.7
Americas thermal 10.4 9.9
Consolidated Australian sales total 51.8 46.5
Coking export 7.0 6.0
Semi-soft coking export 5.3 6.4
Thermal export 31.3 26.6
Thermal domestic 8.2 7.5
Consolidated South African sales total* 24.0 24.9
Thermal export 12.3 13.7
Thermal domestic 11.7 11.2
Consolidated Americas sales total 10.5 9.9
Attributable Australian sales total 49.5 43.9
Coking export 7.0 6.0
Semi-soft coking export 4.8 5.8
Thermal export 29.6 24.7
Thermal domestic 8.1 7.4
Attributable South African sales total* 19.6 20.1
Thermal export 9.8 11.0
Thermal domestic 9.8 9.1
Average received export FOB coal price ($/t)
Australian coking 232.5 98.1
Australian semi-soft coking 157.5 62.5
Australian thermal 95.6 51.2
South African thermal 78.4 51.7
Americas thermal 80.9 52.3
* For production reporting, DTJV is included for the full year ended 31 December2008. For financial reporting, DTJV is excluded from Xstrata Coal’s ex-mine resultsdue to the DTJV restructuring announced on 3 March 2008
Xstrata plc Annual Report 2008 53

Xstrata Coal continued to progress the development of its world-classportfolio of low-cost expansion and development options.
AustraliaXstrata Coal achieved majority ownership of the Ravensworthunderground coal mine in the first quarter of 2008. Since assumingmanagement control, the operation has been fully integrated, withlongwall production recommencing in the third quarter.
In March, Xstrata commenced operations at its New South WalesGlendell operation, having received government approval to increasethe maximum rate of run of mine coal production of Glendell from3.6 million tonnes per year to 4.5 million tonnes per annum. The coalfrom Glendell is being processed through the expanded Mount OwenCoal Handling and Processing Plant, which was commissioned inJanuary ahead of time and within budget.
The Liddell operation in New South Wales was also successfullyexpanded from 4.5 million tonnes per year to 7 million tonnes perannum ROM on a managed basis, with the completion of the newLiddell Coal Processing Plant on time and within budget in the fourthquarter of 2008.
Development of the Blakefield South underground operation, withinthe Bulga Coal Complex, continues. Blakefield South will replace thehigh productivity Beltana underground mine and first longwall coal isexpected in 2010.
Planned expansions of the Ulan mine and the Ravensworth complexwere advanced through pre-feasibility studies into the feasibility phase,both of which will continue through 2009.
Xstrata Coal completed feasibility studies and received the mininglease for its proposed $1 billion Mangoola Coal Project in New SouthWales. The Mangoola mine will produce up to 10.5 ROM milliontonnes of both export and domestic quality thermal coal annuallyand has an expected mine life of 18 years. In August, the XstrataBoard approved the development of the open cut thermal coal mine.
The large Wandoan coal project completed pre-feasibility in late 2008and released the Environmental Impact Statement for public review inDecember. A large scale sample pit development in the middle of theyear generated washed coal for market testing and trial burns, withfavourable results. The Wandoan project, located in the Surat basin inQueensland, is expected to deliver over 20 million tonnes of thermalcoal annually and feasibility studies will continue throughout 2009.There was also a significant increase in the project’s coal resourcesto 2,530 million tonnes and a maiden marketable reserve of395 million tonnes.
South AfricaIn March 2008, Xstrata announced the restructure of its DouglasTavistock Joint Venture (DTJV) with BHP Billiton Energy Coal SouthAfrica (BECSA) in March 2008. Under the terms of the restructuring,Xstrata acquired and now manages the mining of reservesapproximately equivalent to its original 16% share in the DTJV, in anarea contiguous to its 100% owned Arthur Taylor Colliery Open-CastMine (ATCOM) operations. Xstrata will commence separate miningoperations from 1 July 2009. The restructuring enables Xstrata tointegrate the acquired discrete reserves from the former DTJV intoXstrata Coal’s 100% owned ATCOM complex, to leverage existinginfrastructure and take direct management control of the operation,which will be renamed ATCOM East. The new operation has 157 milliontonnes of coal reserves.
The new Goedgevonden opencut thermal mine is now well advancedand is expected to commence plant commissioning on schedule in thesecond quarter of 2009.
AmericasThe ramp up of the Cerrejón open cut mine to 32 million tonnes perannum was completed in the second half of the year. The feasibilitystudy for a subsequent increase to 40 million tonnes per annum isunder way.
The Donkin Coal project in Canada completed the next stage of thepre-feasibility process, with Xstrata Coal committing to commencea detailed exploration project in the first quarter of 2009.
54 Xstrata plc Annual Report 2008
Performance: Operating ReviewCoal continued
Transporting coal at Newlands in Queensland,Australia, where the underground operationachieved productivity improvements during 2008
Developments
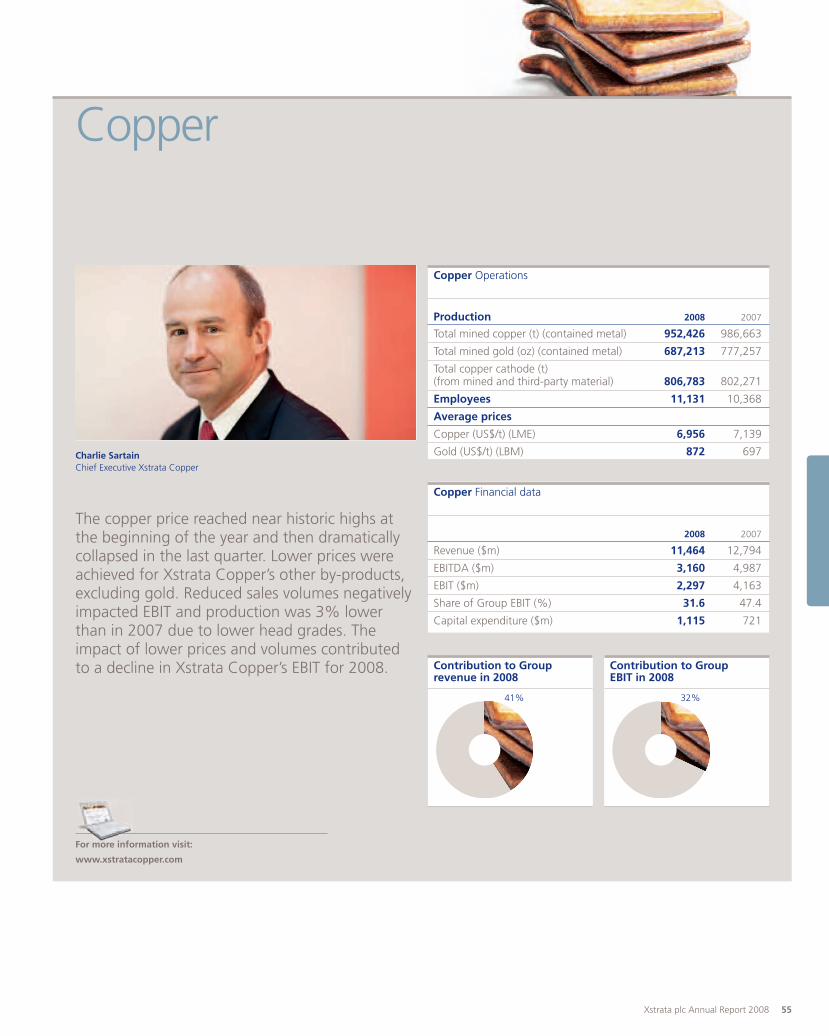
Xstrata plc Annual Report 2008 55
Charlie SartainChief Executive Xstrata Copper
The copper price reached near historic highs atthe beginning of the year and then dramaticallycollapsed in the last quarter. Lower prices wereachieved for Xstrata Copper’s other by-products,excluding gold. Reduced sales volumes negativelyimpacted EBIT and production was 3% lowerthan in 2007 due to lower head grades. Theimpact of lower prices and volumes contributedto a decline in Xstrata Copper’s EBIT for 2008.
Copper
Copper Financial data
2008 2007
Revenue ($m) 11,464 12,794
EBITDA ($m) 3,160 4,987
EBIT ($m) 2,297 4,163
Share of Group EBIT (%) 31.6 47.4
Capital expenditure ($m) 1,115 721
Copper Operations
Production 2008 2007
Total mined copper (t) (contained metal) 952,426 986,663
Total mined gold (oz) (contained metal) 687,213 777,257
Total copper cathode (t)(from mined and third-party material) 806,783 802,271
Employees 11,131 10,368
Average prices
Copper (US$/t) (LME) 6,956 7,139
Gold (US$/t) (LBM) 872 697
Contribution to GroupEBIT in 2008
Contribution to Grouprevenue in 2008
41% 32%
For more information visit:
www.xstratacopper.com

During the early part of 2008, Chinese demand strength and ongoingsupply disruptions contributed to strong but volatile copper prices.From the second half of the year onwards, prices were impacted bychallenging financial and credit environments and weaker globalmacroeconomic conditions. The LME copper price declined rapidlyfrom a mid-year high of $4.08 per pound to $1.32 per pound at year-end. The average price for 2008 was $3.15 per pound, 2.5% or 8¢per pound lower than in 2007.
The financial crisis and resultant negative sentiment on the outlookfor global economic prospects saw copper end-use demand stall in theOECD economies during the fourth quarter. Major copper-consumingsectors, including construction and transportation, were particularlybadly affected and refined demand fell sharply. Demand from Chinaalso slowed during the second half, largely due to the government’scredit-tightening measures aimed at cooling inflation, as well as aslowing housing sector and weaker export markets.
The tight physical market that persisted during the first half of 2008unwound over the final months of the year, resulting in increaseddeliveries of cathode to exchange warehouses. Global copperexchange inventories ended 2008 at 390,000 tonnes, an increaseof 152,000 tonnes or 64% on the closing level in 2007.
On the supply side, the rapid decline in LME copper prices along withliquidity constraints have caused the closure of several marginal mines,as well as production cutbacks, project delays and the cancellation ordeferral of exploration expenditure.
However, supply losses have not yet been sufficient to offset thedecline in demand and concentrate market tightness has eased amidlower demand from custom smelters. Following mid-year contractsettlements at $42 per dry metric tonne and 4.2¢ per pound, spotterms had risen to $75 per dry metric tonne and 7.5¢ per pound bythe end of the year, and the 2009 annual benchmark has also beenset at this level.
OutlookMacroeconomic conditions are expected to remain weak during 2009,limiting copper demand growth. Government efforts in a number ofmajor copper consuming economies to stimulate economic growthusing fiscal measures are expected to provide some level of supportto end-use demand, particularly in China. Further supply cuts are alsolikely in the event that prices remain depressed for a prolonged period.
To date, industry participants have announced the curtailment orsuspension of over 600,000 tonnes of unprofitable production. Globalmine supply is expected to be further constrained by operationalunderperformance such as pit wall problems, lower grades and millavailability and it is estimated this will reduce global copper supplyby 1.0 million tonnes in 2009 (1.4 million tonnes in 2008). Thecombination of both curtailment of unprofitable production andoperational underperformance represents a production cutbackof approximately 9% of planned 2009 production levels prior to theeconomic downturn in the second half of 2008. Perhaps even morenoteworthy is the likely impact on longer-term supply growth, asannounced cancellations or deferral of growth projects have removedover 2.8 million tonnes of new copper supply over the next four years,introducing significant future constraints. These actions are likelyto assist a rapid tightening of the physical market when demandincreases as a result of fiscal stimulus packages and improvingglobal economic conditions.
Performance: Operating ReviewCopper continued
56 Xstrata plc Annual Report 2008
Haul truck maintenance at Alumbrera in Argentina
Markets
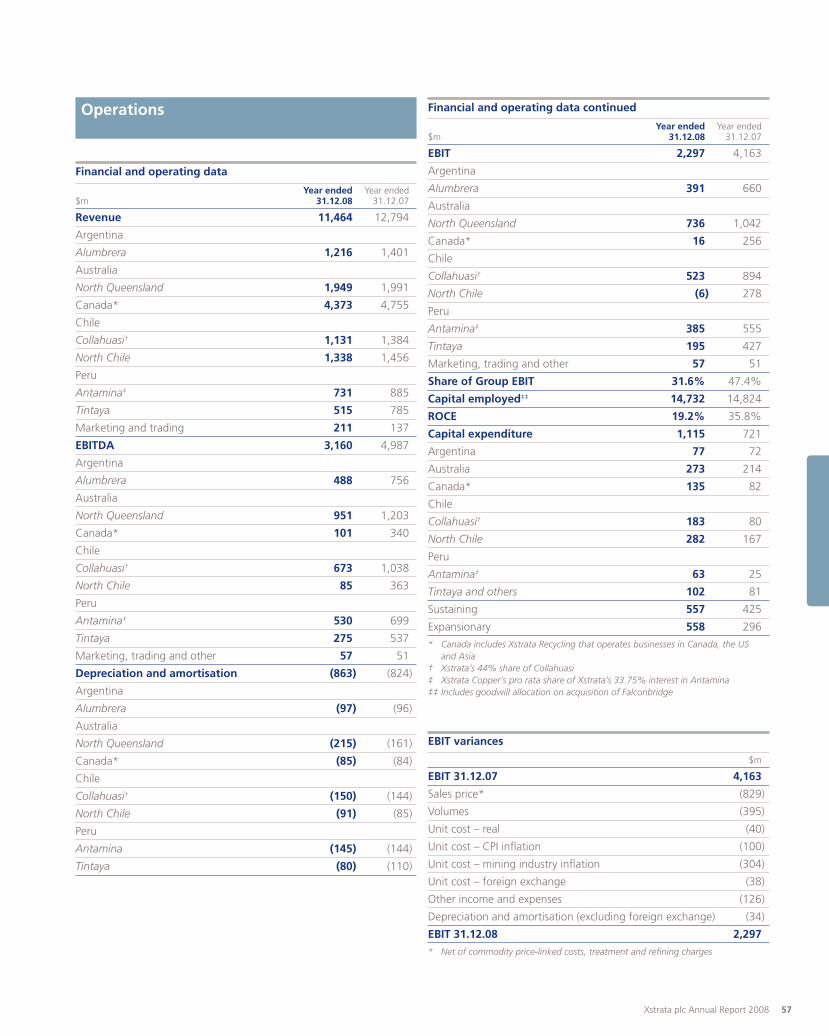
Xstrata plc Annual Report 2008 57
Financial and operating data
Year ended Year ended$m 31.12.08 31.12.07
Revenue 11,464 12,794
Argentina
Alumbrera 1,216 1,401
Australia
North Queensland 1,949 1,991
Canada* 4,373 4,755
Chile
Collahuasi† 1,131 1,384
North Chile 1,338 1,456
Peru
Antamina‡ 731 885
Tintaya 515 785
Marketing and trading 211 137
EBITDA 3,160 4,987
Argentina
Alumbrera 488 756
Australia
North Queensland 951 1,203
Canada* 101 340
Chile
Collahuasi† 673 1,038
North Chile 85 363
Peru
Antamina‡ 530 699
Tintaya 275 537
Marketing, trading and other 57 51
Depreciation and amortisation (863) (824)
Argentina
Alumbrera (97) (96)
Australia
North Queensland (215) (161)
Canada* (85) (84)
Chile
Collahuasi† (150) (144)
North Chile (91) (85)
Peru
Antamina (145) (144)
Tintaya (80) (110)
Financial and operating data continued
Year ended Year ended$m 31.12.08 31.12.07
EBIT 2,297 4,163
Argentina
Alumbrera 391 660
Australia
North Queensland 736 1,042
Canada* 16 256
Chile
Collahuasi† 523 894
North Chile (6) 278
Peru
Antamina‡ 385 555
Tintaya 195 427
Marketing, trading and other 57 51
Share of Group EBIT 31.6% 47.4%
Capital employed‡‡ 14,732 14,824
ROCE 19.2% 35.8%
Capital expenditure 1,115 721
Argentina 77 72
Australia 273 214
Canada* 135 82
Chile
Collahuasi† 183 80
North Chile 282 167
Peru
Antamina‡ 63 25
Tintaya and others 102 81
Sustaining 557 425
Expansionary 558 296
* Canada includes Xstrata Recycling that operates businesses in Canada, the USand Asia
† Xstrata’s 44% share of Collahuasi‡ Xstrata Copper’s pro rata share of Xstrata’s 33.75% interest in Antamina‡‡ Includes goodwill allocation on acquisition of Falconbridge
EBIT variances
$m
EBIT 31.12.07 4,163
Sales price* (829)
Volumes (395)
Unit cost – real (40)
Unit cost – CPI inflation (100)
Unit cost – mining industry inflation (304)
Unit cost – foreign exchange (38)
Other income and expenses (126)
Depreciation and amortisation (excluding foreign exchange) (34)
EBIT 31.12.08 2,297
* Net of commodity price-linked costs, treatment and refining charges
Operations

The dramatic fall in copper prices, in the last quarter of 2008 heavilyinfluenced the EBIT for the year, compounded by lower prices forXstrata Copper’s other by-products, with the exception of gold.Lower commodity prices reduced earnings by $829 million comparedto the prior year.
The impact of 2007 provisional price settlements on the realisedcopper price for 2008 was to increase earnings by $349 millioncompared to the impact of 2006 provisional price settlements in2007. As at 31 December 2008, provisionally priced sales amountedto 243,000 tonnes to be settled in 2009. Provisionally priced sales atyear-end were valued at prevailing market rates resulting in a negativemark-to-market December adjustment of $2 million.
With the dramatic collapse of copper prices in the second half of theyear, the EBIT impact attributable to the difference in final settlementsof provisionally priced sales during the first half of the year relativeto settlements in the second half is $611 million.
Reduced sales volumes eroded EBIT by $395 million, with productionreduced by 3% for the full year, mainly as a result of lower headgrades at Alumbrera and Mount Isa mines. The reduced productionalso had an unfavourable impact on real unit costs.
Higher CPI and mining industry related inflation, particularly in electricity,sulphuric acid, fuel and steel prices, reduced earnings by $404 million,while the weaker US dollar against all local currencies during the firsteight months of the year offset the impact of a marked strengtheningof the US dollar from September and decreased EBIT by $38 million.Other income and expenses include the introduction of export retentionstaxes in Argentina and negatively impacted earnings by $104 million.
ArgentinaLower realised copper prices together with reduced gold andcopper head grades decreased EBIT at Minera Alumbrera by 41%to $391 million. EBIT was also impacted by the higher costs of fuel,electricity, grinding balls and the commencement of the first fullyear of export tax payments to the national government.
Copper in concentrate and gold production decreased by 13% and18% respectively compared to 2007, due to planned lower headgrades, reduced throughput in the third quarter due to difficulties intreating high gypsum content in ore, and the delayed commissioningof the flotation expansion project. A difficult first half performancewas partially offset by an overall strong second half copper inconcentrate production which increased by 39% compared to thefirst six months of the year. For the full year, copper in concentratesales volumes were 13% lower compared to the previous year.
AustraliaThe North Queensland division, comprising the Ernest Henry andMount Isa operations, registered EBIT of $736 million for 2008, 29%lower than 2007 mainly due to lower copper prices, reduced volumesof copper sales from the division’s own operations, lower volumesof gold sales and mining industry inflation, in particular increasesto diesel, steel, explosives and reagents. Copper sales for 2008were in line with the previous year at 279,400 tonnes.
The North Queensland mining operations produced 262,500 tonnesof copper in concentrate, a decrease of 2% compared to 2007 dueto planned lower head grades at Mount Isa, partially offset by highermilled tonnes and grades at Ernest Henry. Production of copper inconcentrate decreased by 12% at Mount Isa to 151,600 tonnes,but increased by 16% to 110,900 tonnes at Ernest Henry.
Mount Isa smelter anode production improved by 8% to 236,200tonnes as the smelter expansion project delivered improved productivitiesin the second half. This, together with purchased anode from XstrataCopper’s Altonorte smelter in Chile, resulted in an increase of 15%in copper cathode production from the Townsville refinery comparedto 2007.
CanadaEBIT at the Canada division declined significantly from 2007 to$16 million, due to lower copper and zinc prices, reduced coppersales volumes, lower treatment and refining revenue, higher seafreight costs and a stronger Canadian dollar.
Copper in concentrate production at Kidd decreased by 8% to 42,700tonnes due to planned lower copper head grades. Zinc in concentrateproduction increased by 24% to 116,300 tonnes compared to thesame period in 2007, due to higher zinc head grades.
The combined impact of a planned maintenance shutdown, anadditional three-week outage to reduce the dependence on marginaloffshore concentrate and a 36-day strike at the metallurgical sitereduced throughput at the Kidd smelter by 25% to 340,400 tonnesof concentrate, contributing to a 32% decrease in copper cathodeproduction at the Kidd refinery.
The Horne smelter produced 171,500 tonnes of anodes, 3% lessthan the prior year due to an unplanned maintenance shutdown thatreduced throughput by 4%. The volume of recycled feeds, procuredby Xstrata Recycling for processing at the Horne smelter, increasedby 7% to 127,800 tonnes.
Higher anode supply helped boost copper cathode production atthe CCR refinery by 8% to 344,800 tonnes compared to 2007,when output was affected by a labour dispute in the first half.
58 Xstrata plc Annual Report 2008
Performance: Operating ReviewCopper continued

Xstrata plc Annual Report 2008 59
ChileCollahuasiXstrata’s 44% share in Collahuasi generated EBIT of $523 million,a decrease of 41% compared to 2007, due to the significant impactof provisional price revaluations on the final quarter sales revenueof $283 million, lower molybdenum sales prices and volumes, higherocean freight costs and significant mining industry inflation, offsetpartially by increased copper production.
Despite adverse weather conditions, metallurgical difficulties in theconcentrator and unplanned maintenance shutdowns, including a14-day stoppage of the main SAG mill, Xstrata’s share of total copperproduction increased by 3% to 204,300 tonnes compared to 2007when the main SAG mill was shut down for 46 days to replace thestator. Strong production was achieved in the last quarter of 2008,improving 21% over the average of the first three quarters, followingan organisational review and restructuring of the executive andoperational management teams of the joint venture.
During 2008, Collahuasi received $33 million in partial payments frominsurers to cover the SAG mill stator failure. Negotiations are ongoingand final settlement of the claim is expected in the first half of 2009.
North ChileTwo earthquakes in the last quarter of 2007 impacted the performanceof the North Chile division during 2008, contributing to lower anodeand sulphuric acid production at Altonorte and decreased cathodeproduction at Lomas Bayas. Force majeure was declared in March2008 on Altonorte acid and anode sales contracts due to earthquakedamage to acid plants numbers 2 and 3. In September, the number 2acid plant was decommissioned and acid supply contracts terminated.New acid supply contracts have subsequently been agreed.
Anode and acid production volumes declined by 15% and 10%respectively compared to 2007 as a result of the restricted sulphuricacid capture and storage capacity and, to a lesser extent, lower copperin concentrate feed grades.
Cathode production at Lomas Bayas decreased by 4% to 59,100tonnes compared to 2007 due to the impacts of the earthquakes oncrushing and conveyor lines and from the impact of lower ore gradesand recoveries. Record monthly cathode production of 6,500 tonneswas achieved in December reflecting the operation of the leach padand EW plant at the new design capacity of 75,000 tonnes per annum.
The North Chile division generated an EBIT loss of $6 million in 2008on a pre-exceptional basis, due to lower copper prices, reducedcopper production at Lomas Bayas and lower acid production andsales at Altonorte and higher energy and purchased acid prices.
PeruAntaminaXstrata’s 33.75% attributable share of Antamina’s financialperformance is divided between Xstrata Copper and Xstrata Zinc onthe basis of sales revenues for copper and zinc respectively. XstrataCopper’s share of Antamina EBIT declined by 31% to $385 millionin 2008 compared to the previous year mainly due to lower realisedcopper, molybdenum and silver prices and higher costs due to miningindustry inflation.
Higher copper head grades boosted copper in concentrate productionby 4% to 116,000 tonnes, and more than offset the impact of anunplanned 11-day shutdown of the SAG mill and consequent reducedmill throughput and speed. The successful commissioning of a pebblecrushing plant in mid-2008 compensated for the SAG mill’s performance.
TintayaEBIT decreased by 54% at Tintaya to $195 million in 2008, dueto lower realised copper prices, mining cost inflation, impactingparticularly the costs of sulphuric acid, grinding media, lime, tyres,fuel, and explosives, and reduced sales volumes as a result of lowerproduction compared to the previous year.
A strong production performance in the second half largely offsetadverse weather conditions and high clay content ores in the earlierpart of the year, resulting in copper concentrate production slightlybelow the prior year. Increased annual concentrator throughput of 5%compensated for lower copper sulphide grades and recoveries. Goldin concentrate production decreased by 5% due to a 26% declinein gold head grades.
Copper cathode production from the SX/EW plant decreased by 24%to 27,300 tonnes due to lower oxide ore mined, reduced recoveriesand grade on leach pads compared to 2007, as lower grade stockpileswere used for blending to mitigate the difficulties of processing oreswith unusually high clay content.
Summary production data
Year ended Year ended31.12.08 31.12.07
Total mined copper (t) (contained metal) 952,426 986,663
Total mined gold (oz) (contained metal) 687,213 777,257
Total copper cathode (t)(from mined and third-party material) 806,783 802,271
Consolidated C1 cash cost– post by-product credits (US¢/lb) 89.3 56.9

In recent months, Xstrata Copper management has been proactivelyresponding to the global economic crisis and its impact on the copperindustry. Operational and project reviews have resulted in significantreductions in operating and capital cost projections into 2009 andorganisational reviews across the divisions have resulted in headcountreduction, including through the non-replacement of vacant positions,at a number of operations.
ArgentinaMinera AlumbreraMinera Alumbrera completed commissioning of the new molybdenumplant during 2008, producing 450 metric tonnes of molybdenumconcentrate to the end of the year. A further 38 million tonnes ofadditional ore reserves were defined in the first half of 2008 as part ofthe ongoing ore delineation drilling programme in the Alumbrera pit,undertaken both within the existing ore envelope and for extensionsat depth.
El PachónFollowing the publication of a Mineral Resource estimate for El Pachónin March 2008, work continued through the remainder of the year toupdate feasibility studies, with a particular focus on the impact of thenew fiscal regime being proposed by the federal government on theproject’s economics. No decision has yet been taken as to the likelytiming of any final feasibility study on the El Pachón project.
AustraliaNorth QueenslandDuring 2008, studies advanced into underground mass miningoptions for both Mount Isa and Ernest Henry mines, resulting in a19% increase to 56 million tonnes to underground Mineral Resourcesat Ernest Henry and publication of an initial underground MineralReserve estimate of 10 million tonnes. The feasibility study intoa potential large scale underground sub-level caving operation atErnest Henry is expected to be completed in the first half of 2009.
In August 2008, the Ernest Henry open pit had a wedge failure in thesouthern wall. Whilst this did not impact ore production in 2008, aspart of the ongoing reassessment of ground conditions, engineeringand geotechnical assessments are currently under way to determinethe optimal mine plan and schedule.
The last phase of the copper smelter expansion project, namelythe construction and commissioning of two new oxygen plantswas completed in the fourth quarter of 2008, raising the nominalproduction capacity to the targeted 300,000 tonnes per annum.A feasibility study evaluating further emissions capture enhancementsat the copper smelter is continuing.
CanadaIn 2008, Kidd Mine received approval to extend the mining zone atMine D from 9,100 feet to 9,500 feet, thereby allowing it to maintaina mining rate of 2.7 million tonnes per annum until 2012 andextending the operation’s life by one year to 2017.
A number of key environmental initiatives were completed during2008, including improvements to tailing effluent quality at the KiddMetallurgical site, and increased capture of fugitive lead emissionsat Kidd smelter and fugitive arsenic emissions at the Horne smelter.
Reclamation activities continued at the closed Murdochville mine andmetallurgical facility and associated town site. The soil remediationprogram for all private residences in the town was completed one yearahead of schedule. Soil remediation activities commenced in the areaaround the port operations in Gaspé and are targeted for completionin the summer of 2009.
ChileCollahuasiDuring 2008, approvals were secured to commit $183 million (100%share) for the construction of an enlarged primary crusher/conveyorsystem to increase the ore delivery rate from the main Rosario pit tothe concentrator to 170,000 tonnes per day, as part of Collahuasi’sPhase 1 expansion strategy to increase annual copper productioncapacity to 600,000 tonnes from the second half of 2010. The resultsof the completed feasibility study into this project will be consideredby Collahuasi shareholders during the first half of 2009.
In January 2008, Collahuasi announced a 28% increase in totalestimated Mineral Resources to 5.1 billion tonnes.
North ChileThe Lomas Bayas expansion project to increase production by 15%to 75,000 tonnes per annum was successfully commissioned withinthe approved budget of $70 million in November 2008, assisting withthe lowering of the cash cost profile of the operation. The timing of acommitment to the Lomas II project, which would extend the mine lifeto 2020, is currently under review.
Geological test-work has identified significant sulphide mineralisationdirectly beneath the existing mining operation at Lomas Bayas.A diamond-drilling campaign totalling 6,000 metres has beenbudgeted for 2009 to quantify the tonnage and grade of thisresource for further technical and economic analysis.
The Altonorte phase IV expansion to 1.2 million tonnes per annumof smelter feed was successfully commissioned in October, comprisingthe construction of the new no. 1 acid plant that will increase annualacid capacity to 1.1 million tonnes.
Molybdenum roasting operations were suspended in October 2008due to insufficient feedstock and poor market conditions following theglobal economic downturn. Mine off-take contractual commitmentsfor 2009 will be assigned to a third-party during a strategic review ofmolybdenum operations following the completion of the Altonorteleaching and roasting expansion study.
Energia AustralIn 2008, engineering and environmental impact studies progressedon the proposed 1,100MW hydropower project, comprising threegenerating facilities and a transmission line in southern Chile’s Aysénregion. An Environmental Impact Study for the Rio Cuervo generatingfacility is expected to be submitted to the relevant authorities in thefirst quarter of 2009.
60 Xstrata plc Annual Report 2008
Performance: Operating ReviewCopper continued
Developments

Xstrata plc Annual Report 2008 61
El MorroA final Feasibility Study and an Environmental Impact Study (EIS)for El Morro were completed in 2008. The EIS was submitted to theauthorities for approval in November 2008 and is currently undergoingthe official public consultation phase, which ends on 2 March 2009.
A decision on whether to progress the project is expected by the endof 2009, subject to obtaining the necessary community and regulatorysupport and to market conditions.
PeruAntaminaIn mid-2008 the pebble crushing circuit was successfullycommissioned for a total investment of $42.7 million, resulting inimproved throughput productivities at the concentrator.
In November, Antamina announced a 77% increase to estimatedMineral Reserves, equivalent to an additional 325 million tonnes of ore,taking proven and probable reserves to 745 million tonnes at a coppergrade of 1.06%. The increased reserves incorporate data obtained fromover 105,000 metres of drilling carried out from late 2006 throughSeptember 2007 and indicate the potential for further expansion.
In 2008, Antamina completed 115,000 metres of resource definitiondrilling, less than the 132,000 metres originally planned as capitalexpenditure was reduced in view of the difficult global financialenvironment in the latter half of the year.
Antamina is progressing with a feasibility study into an expansionof the processing capacity of the concentrator, supported by thesignificant increase in the mineral resource base. Results of thefeasibility study are expected to be available for Antamina shareholderconsideration during the first half of 2009.
Southern PeruIn March 2008, Xstrata Copper announced a total Mineral Resourceof over 1.6 billion tonnes of copper mineralisation in southern Peru,including the Tintaya mine and the Antapaccay, Coroccohuayco andLas Bambas development projects. During 2008, feasibility studiescommenced at Antapaccay and Las Bambas projects, including anumber of studies to examine synergies between these sites as partof an overall integrated regional strategy, including operational, portand transport infrastructure and power supply. A 20,000 metre in-filldrilling programme was successfully completed at Antapaccay in 2008and the feasibility study remains on target for completion in the thirdquarter of 2009.
At the Las Bambas project, 67,000 metres of infill drilling werecompleted to progress feasibility studies, with encouraging resultsfrom metallurgical test work. A proposed resettlement programmewas presented to the Fuerabamba community and discussionsare progressing.
Some 20 kilometres of geophysical surveys were completed in theCoroccohuayco area, 10 kilometres south east of Tintaya, wheresurface oxide ores have been identified as well as importantsulphide anomalies.
PhilippinesAt the Tampakan project, work on the Extended Pre-Feasibility Study(XPFS) continued throughout 2008, and included some 9,000 metresof drilling. The results of the pre-feasibility study were delivered to theSagittarius Mines Inc. (SMI) shareholders in late December. In view ofthe preliminary outcomes of the study and current market conditions,SMI management will further review the detailed engineering,processing requirements and scope of the potential operation duringthe first half of 2009. This review is intended to produce a viabledevelopment proposition which will be considered by the partnersin SMI before any decision is made to move to a final feasibilitystudy stage.
Papua New GuineaA scoping study for the Frieda River project completed in early 2008showed encouraging technical and commercial results and in excessof 20,000 metres of drilling was completed in 2008. Xstrata Copper’sfirst Mineral Resource estimate for the Frieda River project of51 million tonnes for the Nena high grade deposit and 840 milliontonnes for the Horse-Ivaal-Trukai porphyry deposit will be publishedin the Group’s new Reserves and Resources statement. Approval hasbeen given to start pre-feasibility work.
Warren Johnson and Graham McAdam preparinga risk assessment for maintenance activities at theTownsville refinery, Australia

Sales volumes
Year ended Year ended31.12.08 31.12.07
Argentina – Alumbrera†
Copper in concentrate (t) inter-company(payable metal) 10,267 9,636
Copper in concentrate (t) third-parties(payable metal) 141,053 163,590
Total copper (t) (payable metal) 151,320 173,226
Gold in concentrate (oz) inter-company(payable metal) 28,013 30,876
Gold in concentrate (oz) third-parties(payable metal) 402,980 487,624
Gold in doré (oz) (payable metal) 59,559 73,845
Total gold (oz) (payable metal) 490,552 592,345
Australia – North Queensland
Refined copper – mined copper (t) 231,283 220,166
Refined copper – inter-company andthird-party sourced (t) 34,502 11,105
Copper in concentrate (t) (payable metal) 12,404 37,377
Other products (payable metal) 1,218 8,868
Total copper (t) (payable metal) 279,407 277,516
Gold in concentrate and slimes (oz)(payable metal) 121,391 136,790
Canada
Refined copper – mined copper (t) 27,286 45,953
Refined copper – inter-company sourced (t) 232,643 136,094
Refined copper – third-party sourced (t) 176,834 264,653
Other products inter-company (t) (payable metal) 17,670 28,294
Other products third-parties (t) (payable metal) 25,445 34,706
Total copper (t) (payable metal) 479,878 509,700
Total zinc in concentrate (t) (payable metal) 73,966 60,440
Gold in concentrate and slimes (oz)(payable metal) 856,118 839,435
Chile – Collahuasi††
Copper in concentrate (t) inter-company(payable metal) 33,005 36,303
Copper in concentrate (t) third-parties(payable metal) 142,556 131,921
Copper cathode (t) (payable metal) 21,839 25,904
Total copper (t) (payable metal) 197,400 194,128
Chile – Lomas Bayas and Altonorte
Copper cathode (t) (payable metal) 59,475 64,644
Copper anode – inter-company (payable metal) 124,999 119,096
Copper anode – third-parties (payable metal) 122,587 154,790
Total copper (t) (payable metal) 307,061 338,530
Gold in concentrate and slimes (oz)(payable metal) 24,177 34,472
Peru – Antamina‡
Copper in concentrate (t) inter-company(payable metal) 22,908 27,001
Copper in concentrate (t) third-parties(payable metal) 87,065 79,351
Total copper (t) (payable metal) 109,973 106,352
Sales volumes continued
Year ended Year ended31.12.08 31.12.07
Peru Tintaya
Copper in concentrate (t) inter-company(payable metal) 8,804 –
Copper in concentrate (t) third-parties(payable metal) 63,312 81,418
Copper cathode (t) (payable metal) 25,455 36,023
Total copper (t) (payable metal) 97,571 117,441
Gold in concentrate (oz) (payable metal) 23,841 32,881
Mined copper sales (t) (payable metal) 887,930 968,155
Custom copper sales (t) (payable metal) 734,680 748,738
Inter-company copper sales (t) (payable metal) (217,653) (220,330)
Total copper sales (t) (payable metal) 1,404,957 1,496,563
Total gold sales (oz) (payable metal) 1,488,066 1,605,047
Average LME copper cash price ($/t) 6,956 7,139
Average LBM gold price ($/oz) 872 697
† 100% consolidated figures†† Including Xstrata’s 44% share of Collahuasi‡ Including Xstrata Copper’s pro rata share of Xstrata’s 33.75% interest in Antamina
62 Xstrata plc Annual Report 2008
Performance: Operating ReviewCopper continued
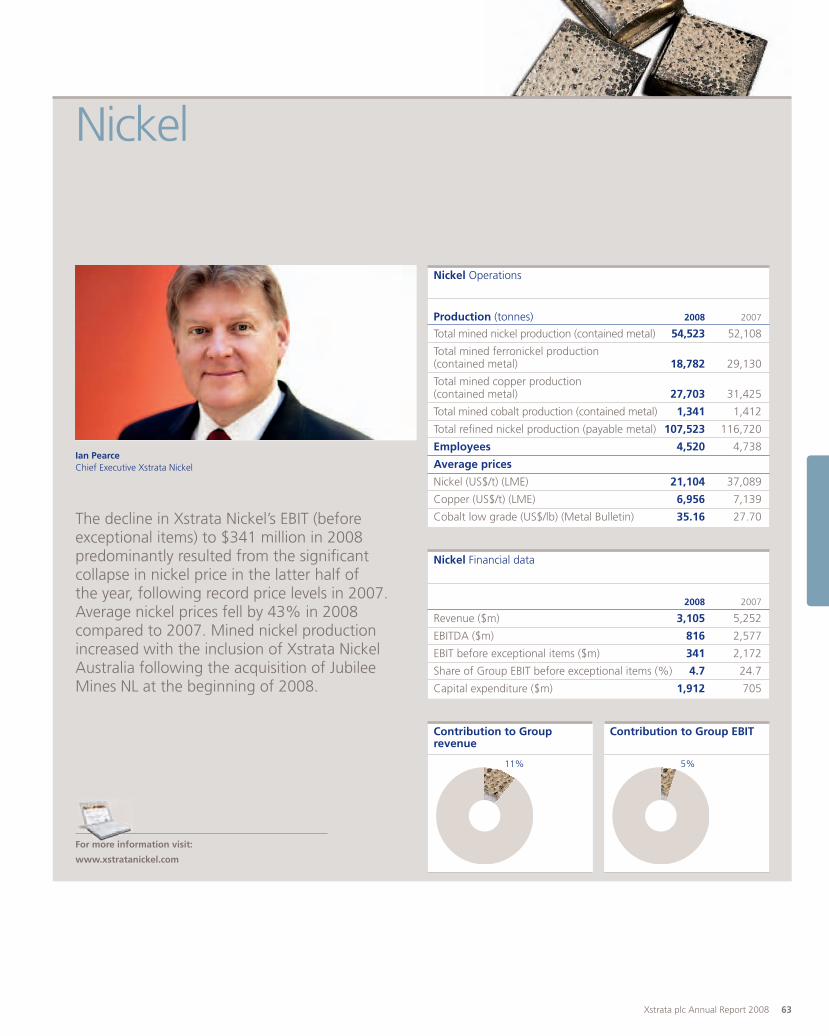
Xstrata plc Annual Report 2008 63
Nickel
Ian PearceChief Executive Xstrata Nickel
The decline in Xstrata Nickel’s EBIT (beforeexceptional items) to $341 million in 2008predominantly resulted from the significantcollapse in nickel price in the latter half ofthe year, following record price levels in 2007.Average nickel prices fell by 43% in 2008compared to 2007. Mined nickel productionincreased with the inclusion of Xstrata NickelAustralia following the acquisition of JubileeMines NL at the beginning of 2008.
Nickel Financial data
2008 2007
Revenue ($m) 3,105 5,252
EBITDA ($m) 816 2,577
EBIT before exceptional items ($m) 341 2,172
Share of Group EBIT before exceptional items (%) 4.7 24.7
Capital expenditure ($m) 1,912 705
Nickel Operations
Production (tonnes) 2008 2007
Total mined nickel production (contained metal) 54,523 52,108
Total mined ferronickel production(contained metal) 18,782 29,130
Total mined copper production(contained metal) 27,703 31,425
Total mined cobalt production (contained metal) 1,341 1,412
Total refined nickel production (payable metal) 107,523 116,720
Employees 4,520 4,738
Average prices
Nickel (US$/t) (LME) 21,104 37,089
Copper (US$/t) (LME) 6,956 7,139
Cobalt low grade (US$/lb) (Metal Bulletin) 35.16 27.70
Contribution to Group EBITContribution to Grouprevenue
11% 5%
For more information visit:
www.xstratanickel.com

The nickel price experienced extreme volatility in 2008, peakingin March at $33,300 per tonne and then falling significantly in thesecond half due to deteriorating physical fundamentals, compoundedby the rapid unwinding and deleveraging of commodity investments.In the second half of 2008, the nickel market was heavily impactedby the rapid deceleration of global industrial production.
Nickel cash prices fell steadily from the second quarter to a lowof $8,810 per tonne in late October. LME cash prices averaged$21,104 per tonne for the year, a decrease of 43% over 2007.
Towards the end of the year, stainless steel mills cut productionsignificantly in response to weakened demand that reflectedwidespread uncertainty over the global economic outlook. Demandfrom downstream metal consumers reduced and stocks were drawndown throughout the supply chain. Chinese stainless steel capacityutilisation remains low, although some previously idled productionfacilities were restarted in December. Material restocking in thestainless sector is now not expected until the second half of 2009.As a result of lower nickel prices, austenitic ratios have stabilised,following record nickel prices in 2007 which led steelmakers to switchproduction away from nickel-intensive austenitic steel grades towardsferritic grades.
Demand from non-stainless steel applications for nickel is beginningto be impacted by the global economic slowdown and orders fromthe aerospace and land turbine sectors are slowing. At the same time,scrap availability is relatively high.
However, the nickel industry’s supply-side response has beenparticularly rapid and significant. The curtailment or suspension ofunprofitable operations has resulted in approximately 350,000 tonnesof refined nickel production being taken out of 2009 production,representing approximately 21% of the previously expected level ofglobal supply in 2009. In addition, growth projects and explorationexpenditure continue to be cancelled or deferred, introducingsignificant constraints to future supply. Nickel production from Chinesepig iron has now largely ceased, due to the impact of low metal priceson these high-cost producers. While the supply-side response continuesto gain momentum, production curtailments in the fourth quarter werenot sufficient to fully mitigate the impact of the sharp fall in demand.As a result, LME inventories steadily increased, finishing the year at78,822 tonnes, a 64% increase over closing levels the previous year.
OutlookThe full impact of nickel production cuts is expected to stabilise themarket in 2009. Supply from Chinese nickel pig iron and other highcost facilities is unlikely to resume given the prevailing economicclimate and lack of visibility into near-term market conditions. If theweak pricing environment persists, further announcements of supplycurtailments from industry participants can be expected. The closureof additional production facilities will tighten physical markets andprices are expected to be supported by the economic cash break-evencosts of nickel producers. In the medium to longer term, the outlookis expected to improve as global demand recovers and the physicalavailability of nickel tightens.
64 Xstrata plc Annual Report 2008
Performance: Operating ReviewNickel continued
The Nikkelverk refinery in Norway achieved a newrecord for nickel production in 2008. Matte fromSudbury, Canada, being unloaded at Nikkelverk’s dock.Yngvar Finne bags and seals the anodes used duringthe extraction process
Markets
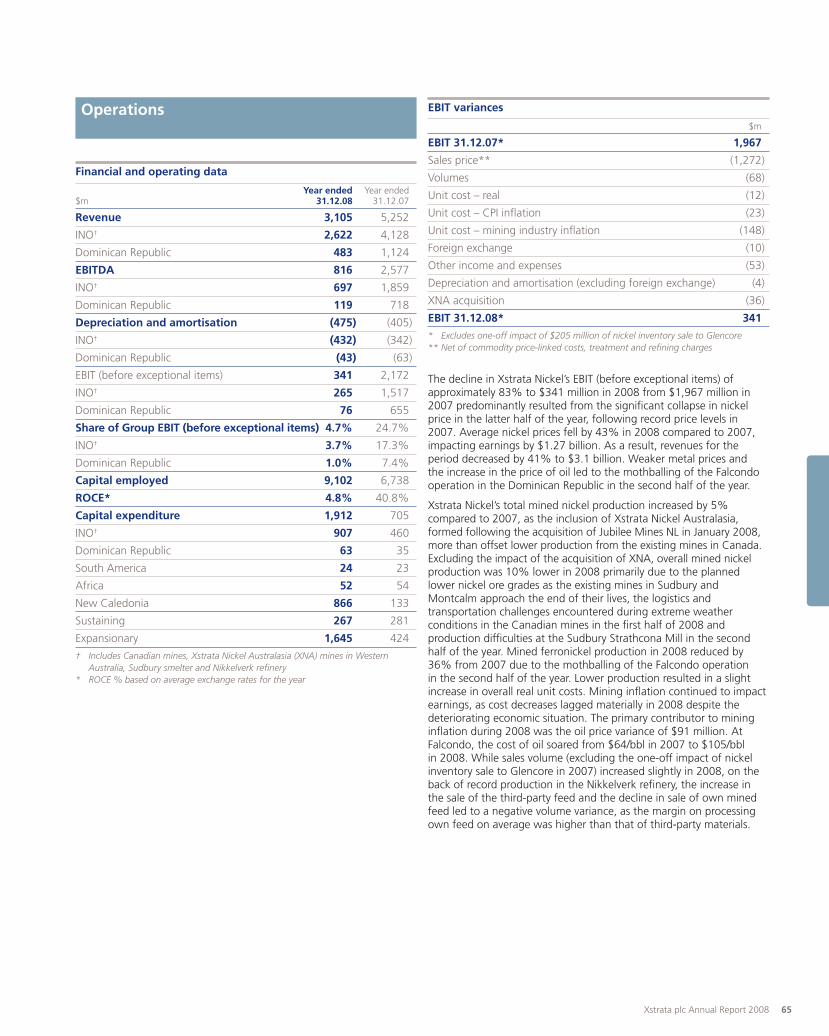
Xstrata plc Annual Report 2008 65
Financial and operating data
Year ended Year ended$m 31.12.08 31.12.07
Revenue 3,105 5,252
INO† 2,622 4,128
Dominican Republic 483 1,124
EBITDA 816 2,577
INO† 697 1,859
Dominican Republic 119 718
Depreciation and amortisation (475) (405)
INO† (432) (342)
Dominican Republic (43) (63)
EBIT (before exceptional items) 341 2,172
INO† 265 1,517
Dominican Republic 76 655
Share of Group EBIT (before exceptional items) 4.7% 24.7%
INO† 3.7% 17.3%
Dominican Republic 1.0% 7.4%
Capital employed 9,102 6,738
ROCE* 4.8% 40.8%
Capital expenditure 1,912 705
INO† 907 460
Dominican Republic 63 35
South America 24 23
Africa 52 54
New Caledonia 866 133
Sustaining 267 281
Expansionary 1,645 424
† Includes Canadian mines, Xstrata Nickel Australasia (XNA) mines in WesternAustralia, Sudbury smelter and Nikkelverk refinery
* ROCE % based on average exchange rates for the year
EBIT variances
$m
EBIT 31.12.07* 1,967
Sales price** (1,272)
Volumes (68)
Unit cost – real (12)
Unit cost – CPI inflation (23)
Unit cost – mining industry inflation (148)
Foreign exchange (10)
Other income and expenses (53)
Depreciation and amortisation (excluding foreign exchange) (4)
XNA acquisition (36)
EBIT 31.12.08* 341
* Excludes one-off impact of $205 million of nickel inventory sale to Glencore** Net of commodity price-linked costs, treatment and refining charges
The decline in Xstrata Nickel’s EBIT (before exceptional items) ofapproximately 83% to $341 million in 2008 from $1,967 million in2007 predominantly resulted from the significant collapse in nickelprice in the latter half of the year, following record price levels in2007. Average nickel prices fell by 43% in 2008 compared to 2007,impacting earnings by $1.27 billion. As a result, revenues for theperiod decreased by 41% to $3.1 billion. Weaker metal prices andthe increase in the price of oil led to the mothballing of the Falcondooperation in the Dominican Republic in the second half of the year.
Xstrata Nickel’s total mined nickel production increased by 5%compared to 2007, as the inclusion of Xstrata Nickel Australasia,formed following the acquisition of Jubilee Mines NL in January 2008,more than offset lower production from the existing mines in Canada.Excluding the impact of the acquisition of XNA, overall mined nickelproduction was 10% lower in 2008 primarily due to the plannedlower nickel ore grades as the existing mines in Sudbury andMontcalm approach the end of their lives, the logistics andtransportation challenges encountered during extreme weatherconditions in the Canadian mines in the first half of 2008 andproduction difficulties at the Sudbury Strathcona Mill in the secondhalf of the year. Mined ferronickel production in 2008 reduced by36% from 2007 due to the mothballing of the Falcondo operationin the second half of the year. Lower production resulted in a slightincrease in overall real unit costs. Mining inflation continued to impactearnings, as cost decreases lagged materially in 2008 despite thedeteriorating economic situation. The primary contributor to mininginflation during 2008 was the oil price variance of $91 million. AtFalcondo, the cost of oil soared from $64/bbl in 2007 to $105/bblin 2008. While sales volume (excluding the one-off impact of nickelinventory sale to Glencore in 2007) increased slightly in 2008, on theback of record production in the Nikkelverk refinery, the increase inthe sale of the third-party feed and the decline in sale of own minedfeed led to a negative volume variance, as the margin on processingown feed on average was higher than that of third-party materials.
Operations

INOIn 2008, EBIT fell to $265 million, compared to $1,517 million in theprevious year, when record prices generated strong financial results.
Refined nickel sales volumes from Xstrata Nickel’s Integrated NickelOperations (INO), which comprise the Sudbury mines and smelter,Montcalm and Raglan mines in Canada, together with the Nikkelverkrefinery in Norway and Xstrata Nickel Australasia (XNA which wasformed following the acquisition of Jubilee Mines NL), decreased by3% compared to 2007. This decrease is mainly due to the impact in2007 of a one-off inventory sale of approximately 5,300 tonnes ofnickel and 400 tonnes of cobalt to Glencore. Excluding this impact,volumes increased by 3% driven by record production at theNikkelverk refinery of 88,741 tonnes in 2008.
Mined nickel production from Xstrata Nickel’s Canadian minesdecreased by 10% to 46,913 tonnes, reflecting lower productionfrom Craig and Thayer-Lindsley mines as these operations approachthe end of their productive lives. The impact of lower mined productionwas offset by a 5% increase in third-party feed, as well as the benefitof nickel concentrate received from Xstrata Nickel Australasia.
Sudbury and MontcalmMined nickel production from the Sudbury operations was impactedby planned lower nickel ore grades, which fell to 0.98% from1.04% in 2007 as existing Sudbury mines approach the end of theirproductive life. In response to weak market conditions, the acceleratedclosure of Craig and Thayer-Lindsley nickel mines was announced inNovember 2008 with their production to be replenished by the new,low-cost Nickel Rim South mine. The Nickel Rim South growth projectis due to begin production in 2009 and will transform the averageoperating cost of Sudbury to a low-cost, sustainable complex thatwill remain robust throughout the economic cycle. Total mined oreprocessed through Sudbury’s Strathcona mill declined by 20% to1.5 million tonnes as head grade declined and the mill experiencedproduction difficulties in the second half of the year. Lower grades atMontcalm and the logistics challenges caused by harsh winter weatherin the first half of the year also impacted production of mined nickel,which was 12% lower than in 2007.
At the Sudbury smelter, production of nickel in matte declinedby 4% to 64,906 tonnes in 2008 as a result of lower mine feed,partially offset by record third-party materials and the introductionof concentrate from Xstrata Nickel Australasia. Production of copperin matte decreased by 19% to 17,811 tonnes, while cobalt in matteincreased by 6% to 2,648 tonnes.
RaglanThe Raglan mine’s expansion in the Canadian Arctic during 2008increased annual mined ore by 17% to 1.3 million tonnes in 2008.Production of nickel-in-concentrate decreased slightly, primarilyas a result of lower head grades in the first half of the year. Headgrade improved in the second half of the year to 2.30% as miningtransitioned into new ore zones.
Xstrata Nickel AustralasiaMetal in concentrates produced for the period commencing1 February 2008 (the date of the completion of the Jubilee acquisition)to 31 December 2008, totalled 7,610 tonnes of nickel, 303 tonnesof copper and 120 tonnes of cobalt. Total ore milled in the periodwas 262,857 tonnes. In October 2008, the Sinclair mine commencedoperations on schedule and budget and continued the ramp up of theproject towards the end of the year. In order to unlock the potentialsynergy from its formation, XNA began shipping its concentrates tothe Sudbury smelter for processing in the fourth quarter of 2008.
NikkelverkNickel production at the Nikkelverk refinery set a new annual recordof 88,741 tonnes nickel and 37,027 tonnes copper, 1% and 8%higher than in 2007 respectively. These production records weremainly achieved as a result of increased operational efficiency atthe nickel and copper tankhouses.
Cobalt production was unfavourably impacted by lower cobalt-content feed and decreased by 6% compared to the previous year.Total production of precious metals increased by 4% from 2007 andproduction records for palladium, rhodium and gold were achieved.Overall production costs benefited from record precious metal pricesin the first half of the year and increased production volumes.
FalcondoIn 2008, EBIT from the Dominican Republic decreased to $76 million,compared to $655 million in 2007, as a result of higher oil prices andthe decline in nickel prices.
The Falcondo operation in the Dominican Republic was temporarilysuspended in August, and subsequently went into care and maintenancein December due to continued weak market conditions. Falcondo istraditionally a swing producer and the combination of high oil prices,which make up the majority of Falcondo’s costs, and low nickel pricesin 2008 meant that the operation was no longer economically viable.As a result of the shutdown, production from Falcondo fell by 36%to 18,782 tonnes compared to the prior year and sales volumesdecreased by 37% to 19,847 tonnes.
Summary production data
Year ended Year ended31.12.08 31.12.07
Total mined nickel production (t)(contained metal) 54,523 52,108
Total mined ferronickel production (t)(contained metal) 18,782 29,130
Total mined copper production (t)(contained metal) 27,703 31,425
Total mined cobalt production (t)(contained metal) 1,341 1,412
Total refined nickel production (t)(payable metal) 107,523 116,720
Consolidated nickel cash cost (C1)– post by-product credits (US$/lb) 4.68 4.04
Consolidated ferronickel cash cost (C1)– post by-product credits (US$/lb) 8.07 6.16
66 Xstrata plc Annual Report 2008
Performance: Operating ReviewNickel continued

Xstrata plc Annual Report 2008 67
Koniambo ProjectDuring 2008, the Koniambo Nickel project in New Caledonia continuedto advance with a number of large construction contracts awarded,including the module construction programme, power station,equipment, technology packages, mass earthworks and dredging.With capital conservation a priority for 2009, re-sequencing activitiesat Koniambo are under way, resulting in reduced capital expendituresin 2009 and deferral of the related spending to subsequent years. As aresult of the re-sequencing, the Koniambo implementation timeline haschanged, with the first ore planned to be processed during the first halfof 2012 and target ramp up expected to reach full annual productionof 60,000 tonnes of nickel in ferronickel within the following twoyears. The Group has undertaken these activities in consultationwith its joint venture partner and local authorities.
Kabanga NickelThe Kabanga project in Tanzania is a 50:50 joint venture betweenXstrata Nickel and Barrick Gold Corporation. Indicated resources atKabanga are estimated at 23.2 million tonnes at 2.64% nickel andan additional 28.5 million tonnes of inferred resources at 2.7% nickel,at a 1% nickel cut-off grade. The pre-feasibility study for the projectwas completed at the end of 2008. Work plans for the executionphase are currently under review to ensure the project’s timingcoincides with improved market conditions.
AraguaiaThe Araguaia project is located in the north-western Brazilian stateof Para. Mineral resources include a measured resource of 16.1 milliontonnes at 1.44% nickel, an indicated resource of 88.6 million tonnesat 1.3% nickel and an inferred resource of 37.6 million tonnes at1.3% nickel at a 0.9% nickel cut-off grade. Drilling has now beencompleted. Engineering studies of the project at the scoping studylevel are still ongoing and environmental baseline evaluations havecommenced, although further development is being deferred givencurrent market conditions.
Nickel Rim SouthThe Nickel Rim South project in the Sudbury basin remains onschedule to ramp up to 60% of its ultimate 1.25 million tonne perannum production capacity in 2009, equivalent to approximately7,400 tonnes of nickel. The project’s first phase, budgeted atC$627 million (approximately US$517 million) was completed inDecember 2008. Phase 1 included construction of the main andvent shafts, which were completed without a lost-time injury, ontime and within budget. The remaining project capital expenditureof C$300 million (approximately $270 million) is for the completionof mine development and infrastructure, which commenced in 2008and will continue through 2009 and early 2010. Nickel Rim South isexpected to provide a high-value ore feed for more than 15 yearswhile significantly reducing Sudbury’s unit costs and will play a keyrole in transforming the Sudbury operations.
In Canada, Nickel Rim South is on schedule toramp up to 60% capacity in 2009. Nickel RimSouth will provide high-value ore feed thatwill significantly reduce Sudbury’s costs
Developments

SudburyFollowing the November 2008 announcement of the acceleratedclosure of the end-of-life Craig and Thayer-Lindsley operations atSudbury, Xstrata Nickel announced in February 2009 the immediateplacing on care and maintenance of the Fraser Mine Complex. TheStrathcona Mill will be reduced to two work shifts from four as aresult of reduced feed. Total production from the Sudbury smelteris expected to remain at a similar level compared to 2008 productionas shortfalls arising from the cessation of Sudbury mines will be offsetby concentrates from Nickel Rim South and Xstrata Nickel Australasia.Concentrates will also continue to be processed from Xstrata Nickel’sMontcalm and Raglan operations, together with third-party feed.
Fraser MorganIn February 2009, Xstrata Nickel announced the indefinite deferralof the 7,700 tonne per annum Fraser Morgan project as part of itsrestructuring of the Sudbury operations. The Fraser Morgan projectwill be evaluated on an ongoing basis and may be re-initiated ifmarket conditions allow.
NikkelverkFeasibility studies confirmed expansion plans for the Nikkelverkrefinery to a sustained capacity of 92,000 tonnes of nickel per yearby 2011 without investing additional capital.
FalcondoOn 19 August 2008, Falcondo announced the temporary suspensionof its ferronickel mining and processing operations in the DominicanRepublic, as a result of market conditions. Subsequently, on4 December 2008, Falcondo announced the continued shutdownof its nickel production operations, placing them under care andmaintenance. Around 30% of the operation’s full-time equivalentemployees were retained to maintain the operating assets, operatethe power plant to provide electricity to the Dominican Republicnational grid, conduct progressive mine rehabilitation and reforestationactivities and continue work on the energy conservation project,aimed at investigating the potential to convert the operation’smain energy source from oil to a viable alternative energy source.
Work relating to the maintenance of surface rights and local permittingcontinues at the Loma Miranda project. Following an extensive drillingprogramme, a preliminary resource estimate indicates a 50% increasein indicated resources.
RaglanThe scoping study for the high-grade Zone 5-8, the largest mineralisedzone in Raglan’s history, was completed during 2008 and the pre-feasibility for Mine 7 is planned for completion by the end of the firstquarter of 2009. An extension to Raglan’s permanent accommodationcomplex and the rehabilitation of the Deception Bay wharf were alsocompleted in 2008. In 2009, emphasis will be placed on existing minesand sustaining production at 1.3 million tonnes per annum.
SinclairXNA’s Sinclair Nickel Project completed construction and commencedoperations in the third quarter. With an expected capacity ofapproximately 300,000 tonnes of ore, producing 5,500 to 6,000tonnes of nickel-in-concentrate, the Sinclair Nickel mine’s depositshows promising potential for increased resource size. The rampup of this project is under review and subject to adjustment basedon prevailing market conditions.
Sales volumes
Year ended Year ended31.12.08 31.12.07
North America – Sudbury, Montcalm,Raglan and Sudbury Smelter
Total nickel (t) (payable metal) 89,567 92,548
Copper in concentrate (t)inter-company (payable metal) 16,997 18,606
Total copper (t) (payable metal) 54,292 52,968
Australia – XNA
Nickel in concentrate (t) third-parties(payable metal) 2,774 –
Copper in concentrate (t) third-parties(payable metal) 77 –
Cobalt in concentrate (t) third-parties(payable metal) 16 –
Dominican Republic – Falcondo
Ferronickel (t) (payable metal) 19,847 31,357
Europe – Nikkelverk
Refined nickel from own mines (t)(payable metal) 43,748 55,928
Refined nickel from third parties (t)(payable metal) 45,819 36,620
Total nickel (t) (payable metal) 89,567 92,548
Total nickel sales (t) (payable metal) 92,341 92,548
Total ferronickel sales (t) (payable metal) 19,847 31,357
Total copper sales (t) (payable metal) 54,369 52,968
Total cobalt sales (t) (payable metal) 3,153 3,523
Average LME nickel cash price ($/tonne) 21,104 37,089
Average Metal Bulletin cobalt low gradeprice ($/lb) 35.16 27.70
Average LME copper cash price ($/tonne) 6,956 7,139
68 Xstrata plc Annual Report 2008
Performance: Operating ReviewNickel continued

Xstrata plc Annual Report 2008 69
Zinc
Santiago ZaldumbideChief Executive Xstrata Zinc
Xstrata Zinc’s EBIT declined in 2008 largely due tothe impact of lower zinc and lead prices. Despitethe impact of continued mining sector and CPIinflation on earnings, increased volumes and realsavings of $87 million were achieved primarilyas a result of enhanced productivity from highervolumes and operating efficiencies. The newPerseverance mine in Canada commencedproduction ahead of schedule during the year.
Zinc Operations
Production (tonnes) 2008 2007
Total zinc in concentrate production (t) 861,033 735,555
Total zinc in metal production (t) 795,565 843,726
Total lead in concentrate production (t) 251,496 213,735
Total lead in metal production (t) 220,391 190,168
Employees 5,029 4,734
Average prices
Zinc (US$/t) (LME) 1,870 3,257
Lead (US$/t) (LME) 2,084 2,594
Contribution to Group EBITContribution to Grouprevenue
12% 2%
Zinc Financial data
2008 2007
Revenue ($m) 3,202 4,726
EBITDA ($m) 444 1,822
EBIT before exceptional items ($m) 113 1,529
Share of Group EBIT before exceptional items (%) 1.6 17.4
Capital expenditure ($m) 655 504
For more information visit:
www.xstratazinc.com

ZincSupply of refined zinc outpaced global demand during 2008 forthe first time since 2003. LME warehouse zinc metal stocks rose by165,000 tonnes to 253,475 tonnes. Nonetheless, at the end of theyear, exchange zinc stock levels were still relatively low by historicalstandards, representing only eight days of global consumption. Theaverage LME zinc price remained above $2,000 per tonne duringthe first five months of the year, but fell steeply in the final quarterto end the year at $1,120 per tonne. The average price for the yearwas $1,870 per tonne, 42% lower than the prior year average of$3,251 per tonne.
Global zinc demand softened during the year and totalled 11.4 milliontonnes in 2008 as consumer and business spending fell markedly inthe main zinc-consuming industries of construction and vehicles in thesecond half of the year. While demand continued to grow in China, thiswas offset by weakened demand in the rest of the world, particularlyin Western Europe and North America.
Global refined zinc production grew in 2008 by approximately 3% to11.5 million tonnes, with most of the increase from smelters in Chinaand India. During 2008, margins were squeezed as the zinc pricefell faster than costs. By the end of the year a significant numberof smelters had announced production cuts, most of which cameinto effect in early 2009.
In 2008, China’s smelters imported a record amount of zinc-in-concentrate, nearly 900,000 tonnes, as its domestic mine growthwas cut back in response to weaker zinc price and negative margins.Mined zinc production in China contracted by almost 2% year-on-year. In the final quarter of the year, other mine production cutsoccurred, mainly in North America and Western Europe. Overall,global mined zinc production grew by just over 5% to 11.5 milliontonnes, mainly from Australia, India, Peru and Bolivia.
The zinc concentrate market weakened in 2008 as smelter productiongrew at a lower rate than mined production. Benchmark treatmentcharges increased to $300 per tonne on a $2,000 per tonne zinc pricebasis compared to $300 per tonne on a $3,500 per tonne zinc basisin 2007.
OutlookIn response to low prices, 1.0 million tonnes of zinc curtailmentshave been announced for 2009, representing over 9% of plannedproduction levels prior to the economic downturn in the secondhalf of 2008. Further mine cutbacks are likely if zinc prices remainat low levels. In the medium to long term, as the stimulus plans of themajor economies take effect, global zinc consumption is expected toincrease from rising demand from the galvanised sheet sector, fuelledby vehicle production, infrastructure projects and consumer goods.
LeadGlobal lead consumption is estimated to have increased in 2008 byapproximately 3% compared to the previous year. China continuesto be the driving force behind global growth, with consumptionincreasing by 14% or an additional 371,000 metric tonnes year-on-year, driven primarily by demand for stationary, automobile andelectric-powered bicycle batteries.
In 2008, global refined lead production rose by 5% to 8.5 milliontonnes, driven primarily by higher production from China and otherAsian countries. As a result, global demand and supply for refinedlead remained broadly balanced, ending the year with a small surplusof approximately 60,000 metric tonnes.
Global mined lead production increased by 7% in 2008 to 3.6 milliontonnes. The main contribution to the increase came from Canada,China, Russia and Bolivia. Mine production is expected to remain flatin 2009 as a result of mine production cuts in response to low prices.
LME stocks fluctuated during the year between a low of 40,950 metrictonnes and a high of some 101,900 metric tonnes, ending 2008 at45,150 metric tonnes, representing two days of global consumption.
The average LME monthly cash price for lead started the year at$2,608 per tonne, peaking in February at $3,080, before falling toa low of $880 per tonne in mid-December. The average LME cashprice for 2008 was $2,084 per tonne, 20% lower than in 2007.
OutlookLead market conditions are expected to remain challenging in the firstmonths of 2009 as the weak automotive sector reduces demand forbatteries although the market for replacement batteries is expectedto remain relatively robust. Recent mine and refined metal productioncuts and historically low levels of LME stocks should help to offsetdemand weakness and generate a market surplus for the remainderof the year.
Performance: Operating ReviewZinc continued
70 Xstrata plc Annual Report 2008
Zinc ‘jumbo strip’ at the dock of San Juan deNieva, Spain, the world’s largest zinc smelter
Markets

Xstrata plc Annual Report 2008 71
Financial and operating data
Year ended Year ended$m 31.12.08 31.12.07
Revenue 3,202 4,726
Zinc lead Australia 360 519
Lead Europe 486 467
Zinc Europe 1,308 2,192
Zinc North America 971 1,414
Zinc Peru** 77 134
EBITDA 444 1,822
Zinc lead Australia 41 575
Lead Europe 16 10
Zinc Europe 195 479
Zinc North America 133 607
Zinc Peru** 59 151
Depreciation and amortisation (331) (293)
Zinc lead Australia (95) (60)
Lead Europe (4) (4)
Zinc Europe (44) (39)
Zinc North America (155) (157)
Zinc Peru** (33) (33)
EBIT 113 1,529
Zinc lead Australia (54) 515
Lead Europe 12 6
Zinc Europe 151 440
Zinc North America (22) 450
Zinc Peru** 26 118
Share of Group EBIT 1.6% 17.4%
Australia (0.7)% 5.9%
Europe 2.2% 5.1%
North America (0.3)% 5.1%
Zinc Peru** 0.4% 1.3%
Capital employed† 5,421 5,089
ROCE* 2.7% 45.1%
Capital expenditure 655 504
Australia 460 334
Europe 91 60
North America 104 110
Sustaining 278 219
Expansionary 377 285
* ROCE % based on average exchange rates for the year** Xstrata Zinc’s pro-rata share of Xstrata’s 33.75% interest in Antamina† Includes goodwill allocation on acquisition of Falconbridge
EBIT variances
$m
EBIT 31.12.07 1,529
Sales price* (1,390)
Volumes 48
Unit cost – real 87
Unit cost – CPI inflation (44)
Unit cost – mining industry inflation (74)
Unit cost – foreign exchange (32)
Other income and expenses 7
Depreciation and amortisation (excluding foreign exchange) (18)
EBIT 31.12.08 113
* Net of commodity price-linked costs, treatment and refining charges
Transporting ore from the George Fisher mine tothe Mount Isa concentrator, Queensland, Australia.Production in 2008 increased by 10% at George Fisher
Operations

Xstrata Zinc’s EBIT declined to $113 million from $1,529 million in 2007,largely due to the impact of lower zinc and lead prices which reducedearnings by $1,390 million. Continued mining sector and CPI inflationimpacted earnings by a total of $118 million as cost reductions,resulting from current economic conditions, lagged. Major itemsincluded higher electrical energy prices in Europe and increased contractlabour costs across the operations. However, inflationary impactswere more than offset by real cost savings and improved volumes,which together contributed $135 million to earnings. Cost savings of$87 million were achieved primarily as a result of enhanced productivityfrom higher volumes and operating efficiencies. Consolidated C1 cashcosts increased from 51.7¢ per pound in 2007 to 58.3¢ per pound in2008, mainly due to higher mining industry inflation, partially offset byincreased volumes and by-product credits.
Expansions at the Australian operations and the commencement inJuly of production at Perseverance mine increased zinc in concentrateproduction by 17% compared to 2007, despite the closure in Augustof the Xstrata Zinc-Teck Cominco joint venture Lennard Shelf mine inWestern Australia. Zinc metal production was 6% lower in 2008 dueto a transformer failure at the San Juan de Nieva smelter and a six-week strike at Kidd smelter.
Lead in concentrate production rose by 18% in 2008 due toexpansions, higher grades and improved concentrator recoveriesat the Australian operations. Lead metal production increased by16% as higher volumes of Mount Isa lead concentrate were refinedat Northfleet.
Zinc Lead AustraliaDespite a strong operational performance and improved volumes,Xstrata Zinc’s Australian operations recorded an operating loss of$54 million, as declining prices, lower mined grades and higher inputcosts outweighed the positive impact of increased ore throughputand improved recoveries at the Mount Isa zinc-lead concentratorand higher mined production.
George Fisher mine increased production in 2008 by 10% to3.1 million tonnes. The completion of the KG53 decline/incline projectin September allowed for production from George Fisher North UpperLevel to be trucked to the surface in the fourth quarter of 2008.
The Black Star Open Cut operation has maintained ore production,complementing feed from the George Fisher and Handlebar Hill opencut mines to ensure the concentrator was fully utilised. Handlebar HillOpen Cut mined first ore in June 2008 and produced 980,050 tonnesof ore during the year.
Performance at the Mount Isa zinc-lead concentrator improvedsignificantly and throughput increased from 5.0 million tonnes in 2007to 6.1 million tonnes in 2008 as the expansion project progressed. Zincmetal in concentrate rose by 25% to 283,100 tonnes. Real cost savingswere achieved through optimising reagent usage and improvements inenergy efficiency. These improvements were partially offset by inflationaryincreases in the price of many consumables.
In 2008, the Mount Isa lead smelter achieved a record year withproduction up by 33% to 167,303 tonnes of crude lead. This was theresult of increased concentrate feed from the zinc-lead concentratorand increased volumes of third-party lead concentrate feed.
McArthur River Mine continued its open pit development, mining fromStage D and Stage E with stripping commencing on Stage F. Miningproduction increased marginally over 2007 levels to 2 million tonnes.Average head grades decreased from 10.2% in 2007 to 9.6% in 2008in line with the mine plan.
Concentrator throughput at McArthur River Mine increased by12% to 2.1 million tonnes following the commissioning of increasedconcentrator capacity in the third quarter. Zinc metal in concentrateincreased by 3% to 142,460 tonnes, due to increased throughputtonnage, but was partially offset by lower feed grade to the mill.
Zinc Lead EuropeEBIT at the European operations of $163 million declined in linewith lower prices and slightly lower zinc metal volumes.
Consolidated zinc metal production in 2008 decreased by 4%,primarily due to the failure of a cellhouse transformer at the world-class San Juan de Nieva smelter that was partially offset by slightlyhigher production from the Nordenham smelter in Germany. Despitethe failure, the San Juan de Nieva smelter ran at 90% capacity for11 months and the roasters ran at full capacity, allowing 19,279tonnes of calcine to be supplied to Nordenham smelter to realisefurther operational synergies between the European operations. SanJuan de Nieva remains in the first quartile of the industry cost curveand is the world’s largest zinc smelter. The expansion of the silverrecovery plant at San Juan de Nieva was completed in March 2008allowing for the doubling of lead silver concentrate production to20,922 tonnes, with a lead content of 30%.
Lead production at Britannia Refined Metals Northfleet lead refinery inthe UK, rose to 139,062 tonnes, 16% higher than in 2007, as a resultof improved lead output from Mount Isa. Disruptions to shipmentsmid-year caused variations in crude lead and finished product stock,constraining sales volumes to 134,445 tonnes, 8% higher than in2007. Silver production was 36% higher than in 2007 due to highertonnage and an increase in the average silver grade in crude lead.
Zinc Lead AmericasEBIT at the Zinc Lead Americas declined to a small operating loss of$22 million, more than offset by earnings of $26 million from XstrataZinc’s share of the Antamina copper-zinc operation in Peru. Atthe Brunswick mine, ore processed in 2008 decreased by 3% to3.3 million tonnes. Mine head grades and zinc metallurgical recoveriesremained flat at 8.4% and 87.4% respectively, producing 242,478tonnes of zinc-in-concentrate, a 4% reduction from 2007. The mineexperienced two large seismic events in January and September whichrestricted mining to around 90% of planned tonnage. As part of themine’s energy management programme, energy consumption hasbeen reduced by 10% and direct greenhouse gas emissions havedecreased by 14% over the past two years.
The Brunswick smelter processed a total of 234,760 tonnes of newfeed materials, an 11% increase over 2007. A record amount ofrecycled and secondary feed was processed during 2008 representing46% of the total feed processed and contributing to higher operatingmargins. Refined lead production at 81,329 tonnes was 15% higherthan 2007 while silver doré production declined significantly, reflectinglower feed grades.
The new Perseverance mine in Northern Quebec commenced productionahead of schedule on 1 July 2008 and within the original budget. In2008, Perseverance produced 60,265 tonnes of zinc concentrate and3,793 tonnes of copper concentrate. At full production, the mine willproduce 228,000 tonnes of zinc concentrate and 35,000 tonnes ofcopper concentrate with a mine life of five and a half years.
The CEZinc refinery in Quebec produced 264,231 tonnes of cast zinc,a slight improvement on 2007 production. Sulphuric acid productionof 456,556 tonnes declined slightly from the prior year. A total of508,008 tonnes of concentrate was processed, a 1% reduction from2007. In February 2008, a new four-year collective agreement wasconcluded with unionised employees.
72 Xstrata plc Annual Report 2008
Performance: Operating ReviewZinc continued

Xstrata plc Annual Report 2008 73
The Kidd zinc hydrometallurgical plant produced 121,193 tonnes ofzinc metal, representing a 15% decrease from 2007, due to a six-week strike in the fourth quarter of 2008. During the year, costreduction initiatives were implemented in the cellhouse and casting toimprove operational efficiencies. A maintenance shutdown is plannedfor the second quarter of 2009.
In 2008, zinc ore processed at Antamina mine rose by 14% to3.8 million tonnes (Xstrata’s 33.75% attributable share). Higherzinc ore grades were partially offset by lower zinc recoveries of85.3% compared to 87.3% in 2007. As a result, Xstrata Zinc’s shareof Antamina zinc metal in concentrate produced was 117,381 tonnes,19% higher than in 2007.
Summary production data
Year ended Year ended31.12.08 31.12.07
Total zinc in concentrate production (t) 861,033 735,555
Total zinc in metal production (t) 795,565 843,726
Total lead in concentrate production (t) 251,496 213,735
Total lead in metal production (t) 220,391 190,168
Consolidated Zinc cash cost (C1) –post by-product credits (US¢/lb) 58.33 51.69
Zinc Lead AustraliaA strategic review aimed at optimising efficiency and productivityand securing the long-term future of Mount Isa operations duringchallenging operating conditions has resulted in a restructuring ofXstrata Zinc’s Mount Isa zinc-lead operations includes placing itsHandlebar Hill operation on care and maintenance from early February2009. Production from Handlebar Hill will be replaced by increasedoutput from the George Fisher and Black Star operations at Mount Isa.
The open pit development at McArthur River was completed onschedule during 2008. The capacity of the concentrator at McArthurRiver Mine was increased from annual throughput of 1.8 milliontonnes of ore to 2.5 million tonnes of ore. The concentrator achievedthe design 2.5 million tonnes throughput rate in November 2008.
However, production in December was reduced by approximately25% in the light of current market conditions, and all mining and civilworks were suspended on 17 December, following a decision by theFull Bench of the Australian Federal Court to invalidate the originalapproval granted for the MRM expansion due to a procedural errorby the Federal Government. MRM resubmitted its application to theFederal Environment Minister shortly after this judgement and on22 January, the Minister gave preliminary, conditional approval for theexpansion, subject to a 10-day consultation period. Stockpiled ore wasprocessed at the site while mining was suspended, but was depletedby 23 January, at which time the operation was placed into care andmaintenance. On 20 February, the Minister approved MRM’s open pitdevelopment and operations have recommenced.
Zinc Lead EuropeExploration efforts in Ireland, accomplished with a 23.6% joint venturepartner, Minco plc, have identified significant zinc mineralisation at thePallas Green property near Limerick. An exploration programme wascarried out in 2008 to define economic reserves and initiate baselinestudies and further work is planned for 2009.
Brian Mutare, a mechanical fitter at the zinc-lead concentrator at MountIsa, Queensland, Australia. Performance at the Mount Isa zinc-leadconcentrator improved significantly during 2008 with throughputincreasing from 5 million tonnes in 2007 to 6.1 million tonnes
Developments

Sales volumes
Year ended Year ended31.12.08 31.12.07
Australia – Mount Isa
Zinc in concentrate (t)third-party sales (payable metal) 171,137 94,911
Zinc in concentrate (t)inter-company sales (payable metal) 69,580 102,204
Total zinc (t) (payable metal) 240,717 197,115
Lead in concentrate (t)third-party sales (payable metal) 3,656 2,617
Lead in bullion (t) inter-company sales(payable metal) 155,401 124,826
Total lead (t) (payable metal) 159,057 127,443
Silver in concentrate (koz) third-party sales(payable metal) 385 336
Silver in bullion (koz) inter-company sales(payable metal) 9,172 7,678
Total silver (koz) (payable metal) 9,557 8,014
Australia – McArthur River
Zinc in concentrate (t)third-party sales (payable metal) 115,241 104,319
Lead in concentrate (t)third-party sales (payable metal) 29,945 20,358
Silver in concentrate (koz)third-party sales (payable metal) 318 199
Australia – Lennard Shelf*
Zinc in concentrate (t)third-party sales (payable metal) 13,617 10,162
Zinc in concentrate (t)inter-company sales (payable metal) 3,561 5,079
Total zinc in concentrate (t)(payable metal) 17,178 15,241
Lead in concentrate (t)third-party sales (payable metal) 2,117 2,637
Lead in concentrate (t)inter-company sales (payable metal) 2,291 2,994
Total lead in concentrate (t) (payable metal) 4,408 5,631
Europe – San Juan de Nieva
Refined zinc (t) 432,507 457,210
Europe – Nordenham
Refined zinc (t) 144,994 146,151
Noranda zinc (t) – 5,709
Europe – Northfleet
Refined lead (t) 134,445 124,667
Noranda lead (t) – 3,562
Refined silver (koz) 7,729 6,133
Sales volumes continued
Year ended Year ended31.12.08 31.12.07
North America – Brunswick
Zinc in concentrate (t) third-party sales(payable metal) 95,755 32,359
Zinc in concentrate (t)inter-company sales (payable metal) 89,933 162,022
Total zinc (t) (payable metal) 185,688 194,381
Lead concentrate (t)third-party sales (payable metal) 5,982 12,279
Lead concentrate (t)inter-company sales (payable metal) 49,285 47,736
Zinc in bulk concentrate (t)third-party sales (payable metal) 10,111 17,119
Lead in bulk concentrate (t)third-party sales (payable metal) 8,290 13,224
Silver in bulk concentrate (koz)third-party sales (payable metal) 522 785
Silver in bulk concentrate (koz)inter-company sales (payable metal) – –
Refined lead & Alloys (t) 77,228 44,105
Silver doré (koz) inter-company sales 4,810 3,987
North America – CEZ**
Refined zinc (t) 64,669 65,533
Perseverance
Zinc in concentrate (t)third-party sales (payable metal) 8,269 –
Zinc in concentrate (t)inter-company sales (payable metal) 39,140 –
Total zinc (t) (payable metal) 47,409 –
North America – Kidd Creek
Refined zinc (t) 124,917 126,355
Peru – Antamina zinc***
Zinc in concentrate (t)third-party sales (payable metal) 99,441 68,937
Zinc in concentrate (t)inter-company sales (payable metal) – 14,883
Total zinc (t) (payable metal) 99,441 83,820
Total zinc metal third-party sales (t) 767,087 800,958
Total zinc in concentrate thirdparty sales (t) 513,571 327,807
Total lead metal third-party sales (t) 211,673 172,334
Total lead in concentrate thirdparty sales (t) 49,990 51,115
Total silver metal third-party sales (koz) 7,729 6,133
Total silver in concentrate thirdparty sales (koz) 1,225 1,320
Average LME zinc price (US$/t) 1,870 3,257
Average LME lead price (US$/t) 2,084 2,594
* Xstrata Zinc’s pro rata share of Lennard Shelf sales volumes (50%)** Xstrata Zinc’s pro rata share of CEZ sales volumes (25%)***Xstrata Zinc’s pro rata share of zinc sales from Xstrata’s 33.75% interest in Antamina
74 Xstrata plc Annual Report 2008
Performance: Operating ReviewZinc continued

Xstrata plc Annual Report 2008 75
Xstrata Technology Services supports the processesinvolved in mining. It comprises Xstrata Technology,based in Brisbane, a specialist technology solutionsprovider and Xstrata Process Support, based inSudbury, an independent group which providehighly specialised technological support both toXstrata’s operations and to third-party customers.
XstrataTechnologyServices
Xstrata Technology Services supports the processes involvedin mining. It comprises Xstrata Technology, based in Brisbane,a specialist technology solutions provider and Xstrata ProcessSupport, based in Sudbury, an independent group whichprovide highly specialised technological support both toXstrata’s operations and to third-party customers.
Xstrata TechnologyXstrata Technology experienced strong demand for its technologysolutions products during most of 2008, although deterioratingeconomic conditions resulted in a decline in EBIT by 26% dueto the deferral of a number of projects following the suddenshortage of funding experienced by some customers followingthe onset of the credit crisis.
Xstrata Technology’s IsaMill™ division grew during 2008 as itstechnology was adapted for mainstream grinding applications.Orders were received from Australia, Europe, USA, Mexico andSouth Africa, with most of the mills to be commissioned in 2009.During the year, four new ISASMELT™ furnaces were designed,including the first Isaconvert™ furnace for Mopani CopperMines in Zambia. This furnace will improve the environmentalperformance and efficiency of copper smelting compared withconventional converter technology.
Xstrata Process SupportXstrata Process Support provides high expertise technical servicesto the minerals sector and demand for its services from Xstrata’soperations continues to be strong. EBIT remained stable in 2008.External customers accounted for 25% of total revenue, anincrease on the 10% achieved in 2007.
In 2008, the Process Mineralogy group provided ore characterisationand process design services to Xstrata Nickel in Canada andXstrata Copper in Australia. The Process Mineralogy group hasseen strong demand growth from Xstrata’s PGM operationsand external customers who are seeking to improve thecharacterisation of their ore bodies. The Extractive Metallurgygroup experienced strong demand in 2008 for its processmodelling expertise from both internal and external clients,including Xstrata Nickel, for which it is developing processesfor new ore bodies. During 2008, the Process Control groupdelivered improved control of the primary grinding circuit atSudbury nickel operations and designed and commissioned thecontrol systems for a major expansion of nickel recycling capacity.It contributed to control improvements at Kidd copper operationsand is a member of the standard concentrator design team forXstrata Copper.
Financial and operating data
Year ended Year ended$m 31.12.08 31.12.07
Revenue 235 217
EBITDA 38 47
Depreciation and amortisation (6) (4)
EBIT 32 43
Capital expenditure 6 5
Employees 162 137
For more information visit:
www.xstratatechnologyservices.com

Annualproductioncapacity 100% 100%(full plan production production Accounting/
Name of operation Ownership time basis) 2008 2007 status Location
Xstrata Alloys
Boshoek plant 79.5% 240kt 190kt 192kt Joint venture Boshoek, South Africa
Lion plant 79.5% 360kt 242kt 230kt Joint venture Steelpoort, South Africa
Lydenburg plant 69.6% 396kt 283kt 341kt Joint venture Lydenburg, South Africa
Rustenburg plant 79.5% 430kt 302kt 381kt Joint venture Rustenburg, South Africa
Wonderkop plant 79.5% 553kt 400kt 389kt Joint venture Marikana, South Africa
Boshoek opencast mine 79.5% 1,344kt 1,331kt 602kt Joint venture Boshoek, South Africa
Horizon mine 79.5% 144kt 38kt 68kt Joint venture Pilansberg, South Africa
Kroondal mine 79.5% 1,320kt 1,134kt 1,266kt Joint venture Rustenburg, South Africa
Thorncliffe mine 79.5% 1,320kt 1,150kt 1,195kt Joint venture Steelpoort, South Africa
Helena mine 79.5% 960kt 434kt 335kt Joint venture Steelpoort, South Africa
Waterval mine 79.5% 480kt 66kt – Joint venture Rustenburg, South Africa
Rhovan V2O5 74% 22,000k lbs 16,604k lbs 18,870k lbs Joint venture Brits, South AfricaFeV 74% 6,000k kg 3,622k kg 4,280k kg
Maloma mine 75% 660kt 280kt 413kt Subsidiary Maloma, Swaziland
Char Technologies 100% 112kt 92kt 103kt Subsidiary Witbank, South Africa
African Carbon Manufacturers 100% 153kt 125kt 126kt Subsidiary Witbank, South Africa
African Carbon Producers 100% 158kt 124kt 143kt Subsidiary Witbank, South Africa
African Fine Carbon 100% 156kt 101kt 143kt Subsidiary Middelburg, South Africa
African Carbon Union 74% 133kt 102kt 114kt Subsidiary Witbank, South Africa
Mototolo 37% 240koz 158koz 171koz Joint venture Steelpoort, South Africa
Eland 74% 240koz 145koz 14koz Joint venture Brits, South Africa
76 Xstrata plc Annual Report 2008
Performance: Operating ReviewOperations Data

Xstrata plc Annual Report 2008 77
Annualproductioncapacity 100% 100%(full plan production production Accounting/
Name of operation Ownership time basis) 2008 2007 status Location
Xstrata Coal
Americas
Cerrejón 33.3% 32,000kt 31,231kt 29,626kt Joint venture Colombia
Australia
Cumnock* 90% 0kt 824kt 944kt Joint venture Hunter Valley
Liddell 67.5% 4,900kt 3,032kt 3,182kt Joint venture Hunter Valley
Macquarie Coal JV
– West Wallsend 80% 2,400kt 1,910kt 1,961kt Joint venture Newcastle
– Westside 80% 700kt 751kt 895kt Joint venture Newcastle
Mount Owen 100% 8,000kt 7,188kt 5,062kt Subsidiary Hunter Valley
Ravensworth Operations 100% 4,300kt 4,255kt 4,042kt Subsidiary Hunter Valley
Ravensworth Underground 70.2% 3,000kt 1,101kt – Joint venture Hunter Valley
Oakbridge Group
– Baal Bone 74.1% 1,800kt 1,220kt 1,481kt Subsidiary Western Coal Fields
– Beltana 68.3% 5,000kt 4,507kt 5,418kt Joint venture Hunter Valley
– Bulga 68.3% 6,000kt 4,819kt 5,267kt Joint venture Hunter Valley
Tahmoor 100% 2,000kt 1,486kt 257kt Subsidiary Southern coal fields
Ulan
– Ulan Underground 90% 6,200kt 6,199kt 3,713kt Joint venture Western Coal Fields
– Ulan Opencut** 90% 0kt 797kt 1,924kt Joint venture
United 95% 2,300kt 2,217kt 2,513kt Joint venture Hunter Valley
Oaky Creek 55% 8,700kt 6,743kt 7,999kt Joint venture Bowen Basin
Newlands
– Thermal 55% 8,600kt 6,277kt 4,741kt Joint venture
– Coking 55% 1,400kt 1,913kt 2,430kt Joint venture Bowen Basin
Collinsville
– Thermal 55% 3,600kt 2,657kt 2,551kt Joint venture
– Coking 55% 1,700kt 1,126kt 1,441kt Joint venture Bowen Basin
Rolleston 75% 8,000kt 7,235kt 6,773kt Joint venture Bowen Basin
South Africa
Southstock Division
– Opencast 79.8% 700kt 681kt 597kt Subsidiary Witbank
– Underground 79.8% 5,000kt 4,647kt 4,472kt Subsidiary Witbank
Mpumalanga Division
– Spitzkop 79.8% 1,400kt 1,108kt 1,017kt Subsidiary Ermelo
– Tselentis 79.8% 1,400kt 1,322kt 1,801kt Subsidiary Breyten
Impunzi Division
– Opencast 79.8% 5,400kt 2,287kt 4,256kt Subsidiary Witbank
– Underground** 79.8% 0kt 1,079kt 2,500kt Subsidiary Witbank
Tweefontein
– Opencast 79.8% 3,500kt 3,481kt 1,557kt Subsidiary Witbank
– Underground 79.8% 2,700kt 2,699kt 3,554kt Subsidiary Witbank
Goedgevonden*** 74% 6,000kt 2,919kt 1,689kt Joint venture Witbank
* Current operations completed, decision on remaining reserves pending** Capacity once commissioned*** Planned closure due to the exhaustion of reserves

78 Xstrata plc Annual Report 2008
Performance: Operating ReviewOperations Data continued
Annualproductioncapacity 100% 100%(full plan production production Accounting/
Name of operation Ownership time basis) 2008 2007 status Location
Xstrata Copper
Argentina
Alumbrera 50% 41mt ore 37.5mt 38.6mt Subsidiary Catamarca,156kt Cu in conc 156.9kt Cu in conc 180.2kt Cu in conc Argentina415koz Au in conc 443.9koz Au in conc 540.7koz Au in conc40koz Au in doré 60.5koz Au in doré 74.4koz Au in doré
Australia
Mount Isa 100% 6.2mt ore 5.9mt ore 6.0mt ore Subsidiary North West
170kt Cu in conc 151.6kt Cu in conc 172.6kt Cu in conc Queensland,
300kt Cu in anode 236.2kt Cu in anode 217.9kt Cu in anode Australia
Ernest Henry 100% 11mt ore 12.2mt ore 11.5mt ore Subsidiary North West115kt Cu in conc 110.9kt Cu in conc 95.8kt Cu in conc Queensland,120koz Au in conc 146.1koz Au in conc 123.3koz Au in conc Australia
Townsville Refinery 100% 300kt Cu cathode 266.5kt Cu cathode 232.0kt Cu cathode Subsidiary North Queensland,Australia
Canada
CCR 100% 370kt Cu cathode 344.8kt Cu cathode 319.6kt Cu cathode Subsidiary Quebec, Canada
Horne 100% 180kt Cu in anode 171.5kt Cu in anode 177.3kt Cu in anode Subsidiary Quebec, Canada
Kidd Creek 100% 50kt Cu in conc 42.7kt Cu in conc 46.6kt Cu in conc Subsidiary Ontario, Canada135kt Cu in cathode 87.3kt Cu in cathode 127.8kt Cu in cathode
Chile
Altonorte 100% 290kt Cu in anode 231.9kt Cu in anode 272.8kt Cu in anode Subsidiary AntofagastaRegion, Chile
Collahuasi 44% 48mt ore 58mt ore 62mt ore Joint venture Tarapacá400kt Cu in conc 415.0kt Cu in conc 393.9kt Cu in conc Region, Chile60kt Cu cathode 49.4kt Cu cathode 58.2kt Cu cathode
Lomas Bayas 100% 13.5mt ore 13.7mt 13.1mt Subsidiary Antofagasta65kt Cu cathode 59.1kt Cu cathode 61.4kt Cu cathode Region, Chile
Peru
Antamina (joint with 33.75% 35mt ore 38mt ore 35mt ore Joint venture Ancash Region,Xstrata Zinc) 370kt Cu in conc 343.7kt Cu in conc 329.9kt Cu in conc Peru
Tintaya 100% 10mt ore 8.9mt 11.8mt Subsidiary Espinar Province,85kt Cu in conc 83.6kt in conc 83.8kt in conc Peru35kt Cu cathode 27.3kt Cu in cathode 36.0kt Cu in cathode
Xstrata Nickel
Australia
Cosmos 100% 250kt ore 226kt ore – Subsidiary Mt Keith-Leinster,13kt Ni in conc 7.3kt Ni in conc Western Australia
Sinclair 100% 300kt ore 37kt ore – Subsidiary Mt Keith-Leinster,6kt Ni in conc 0.3kt Ni in conc Western Australia
Canada
Montcalm 100% 875kt ore 927kt ore 941kt ore Subsidiary Ontario, Canada11kt Ni in conc 9kt Ni in conc 10kt Ni in conc
Sudbury 100% 2.7mt ore 1.9mt ore 2.2mt ore Subsidiary Ontario, Canada130kt Ni-Cu matte 114kt Ni-Cu matte 122kt Ni-Cu matte
Raglan 100% 1.3mt ore 1.3mt ore 1.2mt ore27kt Ni in conc 26kt Ni in conc 26kt Ni in conc Subsidiary Quebec, Canada

Xstrata plc Annual Report 2008 79
Annualproductioncapacity 100% 100%(full plan production production Accounting/
Name of operation Ownership time basis) 2008 2007 status Location
Dominican Republic
Falcondo 85.3% 4.0mt ore 2.7mt ore 4.1mt ore Subsidiary Bonao,28.5kt Ni in FeNi 18.8kt Ni in FeNi 29.1kt Ni in FeNi Dominican Republic
Norway
Nikkelverk 100% 90kt Ni 88.7kt Ni 87.6kt Ni Subsidiary Kristiansand,39kt Cu 37.0kt Cu 34.2kt Cu Norway5.2kt Co 3.7kt Co 3.9kt Co
Xstrata Zinc
Australia
Lennard Shelf 50% Closed in 31kt Zn in conc 42kt Zn in conc Joint venture Western AustraliaAugust 2008 9kt Pb in conc 12.4kt Pb in conc
McArthur River 100% 2.5mt ore 2mt ore 1.9mt ore Subsidiary Northern Territory,181kt Zn in conc 142kt Zn in conc 138kt Zn in conc Australia
Mount Isa 100% 6.4mt ore 6.4mt ore 5.1mt ore Subsidiary North West283kt Zn in conc 283kt Zn in conc 277kt Zn in conc Queensland,
170kt Pb in bullion 167kt Pb in bullion 126kt Pb in bullion Australia300t Ag in bullion 317t Ag in bullion 234t Ag in bullion
Canada
Brunswick Mine 100% 3.6 mt ore 3.3mt ore 3.4mt ore Subsidiary New Brunswick,275kt Zn in conc 242kt Zn in conc 252kt Zn in conc Canada80 kt Pb in conc 70kt Pb in conc 70kt Pb in conc210t Ag in conc 194t Ag in conc 195t Ag in conc8kt Cu in conc 6kt Cu in conc 8kt Cu in conc
Brunswick Smelting 100% 110kt refined lead 81.3kt refined lead 70.7kt refined lead Subsidiary New Brunswick,450t silver doré 152t silver doré 155t silver doré Canada
CEZ Refinery 25% 301kt Zn 292kt Zn 292kt Zn Associate Quebec, Canada
Perseverance Mine 100% 949Kt ore 511Kt ore – Subsidiary Quebec, Canada113.9kt Zn in conc 60.3kt Zn in conc –6.9kt Cu in conc 3.8kt Cu in conc –
General Smelting 100% 27kt Zn and Pb 8kt Zn and Pb 8kt Zn and Pbfoundry products foundry products foundry products Subsidiary Quebec, Canada
Kidd Creek Refinery 100% 153kt Zn 121kt Zn 143kt Zn Subsidiary Ontario, Canada
Germany
Nordenham 100% 157kt Zn 151kt Zn 150kt Zn Subsidiary Nordenham,151kt saleable Zn 144kt saleable Zn 144kt saleable Zn Germany
Peru
Antamina (joint withXstrata Copper) 33.75% 35mt ore 348kt Zn 292kt Zn Joint venture Ancash Region,
403kt Zn Peru
Spain
San Juan de Nieva 100% 507kt Zn 450kt Zn 478kt Zn Subsidiary Asturias, Spain487kt saleable Zn 431kt saleable Zn 458kt saleable Zn
Hinojedo 100% 47kt calcine 40kt calcine 37kt calcine Subsidiary Cantabria, Spain31kt SO2 26kt SO2 24kt SO2
Arnao 100% 24kt ZnO 16kt ZnO 10kt ZnO Subsidiary Asturias, Spain
UK
Northfleet 100% 180kt primary Pb 139kt primary Pb 119kt primary Pb Subsidiary Northfleet, UK360t refined Ag 246t Ag 181t Ag

80 Xstrata plc Annual Report 2008

Xstrata plc Annual Report 2008 81
4
Coal from Xstrata Coal’s Australianoperations. Very strong demandfor thermal and coking coal droveprices to unprecedented levelsduring 2008
<
82 Board of Directors84 Executive Management85 Directors’ Report91 Corporate Governance Report98 Remuneration Report
Governance
1. Willy Strothotte
Willy Strothotte, aged 64, has been Chairman of Xstrata since February 2002.From 1961 to 1978 Mr. Strothotte held various positions with responsibility forinternational trading in metals and minerals in Germany, Belgium and the USA.In 1978, Mr. Strothotte joined Glencore International, taking up the position ofHead of Metals and Minerals in 1984. Mr. Strothotte was appointed Chief ExecutiveOfficer of Glencore in 1993 and held the combined positions of Chairman andChief Executive Officer from 1994 until 2001, when the roles of Chairman andChief Executive were split. Mr. Strothotte, has been Chairman of Xstrata AG since1994, is Chairman of Glencore International and is currently a director of CenturyAluminium Corporation, Minara Resources Limited and KKR Financial Holdings LLC.
2. Mick Davis
Mick Davis, aged 51, is the Chief Executive of Xstrata. Mr. Davis was appointed asChief Executive of Xstrata AG in October 2001, and was appointed to the Boardof Xstrata in February 2002. Previously, Mr. Davis was Chief Financial Officer andan Executive Director of Billiton Plc, appointed in July 1997 and served as ExecutiveChairman of Ingwe Coal Corporation Limited from 1995. He joined Gencor Limitedin early 1994 from Eskom, the South African state-owned electricity utility, wherehe was an Executive Director.
3. David Rough
David Rough, aged 58, was appointed to the Board of Xstrata in April 2002, isDeputy Chairman, the Senior Independent Director and Chairman of the NominationsCommittee. Mr. Rough was a director of Legal & General Group Plc before retiringfrom Legal & General in June 2002. As Group Director (Investments), Mr. Roughheaded all aspects of fund management within Legal & General Investments.Mr. Rough is currently a director of Friends Provident plc, Land Securities Group plc,and Brown, Shipley & Co Ltd.
4. Ivan Glasenberg
Ivan Glasenberg, aged 52, was appointed to the Board of Xstrata in February 2002.Mr. Glasenberg is Chief Executive Officer of Glencore International, which he joinedin 1984. He worked in the coal department of Glencore in South Africa for threeyears and in Australia for two years. From 1989 to 1990, he managed GlencoreInternational’s Hong Kong and Beijing offices. In 1991 he became Head of theGlencore Coal Department and in 2002 Chief Executive Officer of GlencoreInternational. He is also currently a director of Minara Resources Limited andUnited Company Rusal Limited.
5. Paul Hazen
Paul Hazen, aged 67, was appointed a director of Xstrata in February 2002.Mr. Hazen is a former Chairman and CEO of Wells Fargo and Company fromwhich he retired in April 2001 as Chairman after a 30-year career with the bank.He was also a director of Phelps Dodge Corporation until February 2003 and DeputyChairman and Lead Independent Director of Vodafone Group Plc until July 2006.Mr. Hazen is currently Chairman of Accel-KKR and of KKR Financial Corporationand also serves as Lead Independent Director of Safeway, Inc.
6. Claude Lamoureux
Claude Lamoureux, aged 66, joined the Board of Xstrata on 6 May 2008 and wasuntil 1 December 2007, President and Chief Executive Officer of the Ontario Teachers’Pension Plan Board. Previously, he spent 25 years as a financial executive withMetropolitan Life in Canada and the US. He is also a director of Northumbrian WaterGroup plc, Cordiant Capital, Glass Lewis, Maple Leaf Foods Inc., Atrium InnovationsInc., the Canadian Institute for Advanced Research, The Foundation for InvestorsRights, Glass Lewis, The Learning Partnership and the York University Foundation.
82 Xstrata plc Annual Report 2008
Governance
Board of Directors1
3
5
2
4

Xstrata plc Annual Report 2008 83
7. Robert MacDonnell
Robert MacDonnell, aged 71, was appointed to the Board of Xstrata in February2002. Prior to joining Kohlberg Kravis Roberts & Co. in 1976, Mr. MacDonnell wasa Management Consultant at Arthur Andersen & Co. He subsequently formed hisown firm, which specialised in small management buyouts. Mr. MacDonnell became thefirst non-founding partner of KKR in 1982 and participated in virtually all investmentdecisions until the firm expanded in the late 1980s. He is also a director of Safeway, Inc.Mr. MacDonnell will retire from the Board of Xstrata at the Annual General Meeting.
8. Trevor Reid
Trevor Reid, aged 48, is the Chief Financial Officer of Xstrata. Mr. Reid joined XstrataAG in January 2002, and was appointed to the Board of Xstrata in February 2002.Prior to joining Xstrata, he was Global Head of Resource Banking at the StandardBank Group. He joined the Standard Bank Group in 1997 from Warrior InternationalLimited, a corporate finance boutique specialising in the minerals sector.
9. Sir Steve Robson CB
Sir Steve Robson CB, aged 65, was appointed to the Board of Xstrata in February2002 and is Chairman of the Audit Committee. Sir Steve retired as Second PermanentSecretary at HM Treasury in January 2001. He had joined HM Treasury after leavinguniversity. His early career included a period as Private Secretary to the Chancellor ofthe Exchequer and a two-year secondment to Investors in Industry plc (3i). From 1997until his retirement, his responsibilities included the legal framework for regulationof the UK financial services industry, public private partnerships, procurement policyincluding the private finance initiative and the Treasury’s enterprises and growth unit.Sir Steve is also a director of JPMorgan Cazenove Holdings and the FinancialReporting Council.
10. Ian Strachan
Ian Strachan, aged 65, was appointed to the Board of Xstrata in May 2003 andis the Chairman of the Health, Safety, Environment and Community Committee.Mr. Strachan is a director of Johnson Matthey plc, Rolls-Royce Group plc, CaithnessPetroleum Limited and Transocean Inc. Mr. Strachan was Chairman of Instinet Groupfrom 2003 to 2005 and Chief Executive of BTR plc from 1996 to 1999. Mr. Strachanjoined Rio Tinto plc (formerly RTZ plc) as CFO in 1987, and was Deputy ChiefExecutive from 1991 to 1995.
11. Santiago Zaldumbide
Santiago Zaldumbide, aged 66, is an Executive Director of Xstrata, Chief Executiveof Xstrata Zinc and Executive Chairman of Asturiana de Zinc. Mr. Zaldumbide wasappointed to the Board of Xstrata in February 2002. He is a previous Chief ExecutiveOfficer and director of Union Explosivos Rio Tinto and of Petroleos del Norte. In 1990,Petroleos del Norte became part of the Repsol Oil Group where Mr. Zaldumbidewas responsible for establishing the international structure of the enlarged RepsolOil Group. In 1994 he was appointed Chief Executive Officer of the CorporaciónIndustrial de Banesto and, in December 1997, Chairman and Chief Executive Officerof Asturiana de Zinc. Mr. Zaldumbide is also a member of the European AdvisoryCouncil of Air Products and Chemicals, Inc. and a director of ThyssenKrupp SA.
6
8
10
7
9
11

Mick DavisChief Executive
Trevor ReidChief Financial Officer
Santiago ZaldumbideChief Executive Xstrata Zinc
Xstrata Alloys
Bill Barrett, Executive Director Special ProjectsDeon Dreyer, Managing Director Chromeand VanadiumJeff McLaughlan, Marketing DirectorMark Moffett, Chief Financial OfficerBen Moolman, Managing Director PlatinumEric Ratshikhopha, Executive DirectorCorporate DevelopmentMike Rossouw, Executive Director Operations
Xstrata Coal
Garry Beck, General Manager MarketingSteven Bridger, Executive General ManagerMick Buffier, Group Executive CorporateAffairs, Government and Industry Relationsand Sustainable DevelopmentIan Cribb, Chief Operating OfficerNew South WalesMark Eames, Chief Development OfficerJeff Gerard, Chief Operating OfficerSouth AfricaMurray Houston, Executive General ManagerSouth AfricaEarl Melamed, Chief Financial OfficerReinhold Schmidt, Chief Operating OfficerQueenslandJamie Frankcombe, Executive GeneralManager AmericasShaun Palmer, General Manager HumanResources
Xstrata Copper
Stefan Buys, Chief Operating Officer North ChileRoberto Darouiche, General ManagerAlumbreraBob Drabik, Executive General Manager ProjectDevelopmentClaude Ferron, Chief Operating Officer CanadaCopperPeter Forrestal, Executive General ManagerProject EvaluationLouis Irvine, Chief Financial OfficerSteve de Kruijff, Chief Operating OfficerNorth Queensland CopperJosé Marun, Chief Operating OfficerSouthern PeruNeal O’Connor, General CounselAlberto Olivero, Executive General ManagerHuman Resources
Xstrata Nickel
Ian Pearce, Chief Executive OfficerMarc Boissoneault, Vice President Sudbury
Michel Boucher, General Manager RaglanAl Coutts, Executive General Manager,AustralasiaDominique Dionne, Vice PresidentCorporate AffairsSteve Flewelling, Senior Vice PresidentProjects and ExplorationErnest Mast, President and GeneralManager FalcondoDoug McLarty, Vice President LegalLee Nehring, Vice President Sustainabilityand Human ResourcesØivind Stenstad, Managing DirectorNikkelverkShaun Usmar, Chief Financial Officer
Xstrata Zinc
Iñigo Abarca, Chief Legal CounselJaime Arias, General Manager SpanishOperationsManuel Alvarez Dávila, Chief OperatingOfficer Canadian DivisionAssistant to the Chief ExecutiveMario Chapados, General Manager CEZincJean Desrosiers, Vice President MiningOperations, CanadaBrian Hearne, Chief Operating OfficerAustralian DivisionKevin Hendry, Executive General ManagerMount Isa Zinc/Lead OperationsJuan León, Chief Financial OfficerRainer Menge, General Manager GermanOperationsEtienne Moller, General Manager McArthurRiver MineEmilio Tamargo, General Manager BusinessDevelopment & ResearchNeil Wardle, General Manager BritanniaRefined Metals
Corporate
Brian Azzopardi, Group ControllerClaire Divver, General Manager GroupCorporate AffairsRichard Elliston, Company SecretaryGlenn Field, Global Head of Internal Auditand RiskPaul Jones, Group General ManagerSustainable DevelopmentPhil Jones, General Manager Human ResourcesAndrew Latham, General Manager Head ofGroup Business DevelopmentHanré Rossouw, General ManagerInvestor RelationsMark Sawyer, General Manager GroupBusiness DevelopmentIan Wall, Group TreasurerJason Wilkins, Head of IT
84 Xstrata plc Annual Report 2008
Governance
Executive Management
Executive Committee Executive Management
Peter FreybergChief Executive Xstrata Coal
Benny LeveneChief Legal Counsel
Thras MoraitisExecutive General Manager GroupStrategy and Corporate Affairs
Peet NienaberChief Executive Xstrata Alloys
Ian PearceChief Executive Xstrata Nickel
Charlie SartainChief Executive Xstrata Copper
Results and DividendThe Group’s financial results are set out in the Financial Informationsection and in the Financial Review section of this report.
In light of the rights issue, Xstrata’s Board has decided to waive thefinal dividend for 2008. As a result, the total 2008 dividend will consistof the interim dividend of 18¢ per share, which was declared in Augustand paid on 10 October 2008. The Board recognises the importance ofdividend payments to shareholders and will resume dividend paymentsat the earliest opportunity.
Principal ActivitiesXstrata is a major global diversified mining group, listed on theLondon and Swiss stock exchanges with its headquarters in Zug,Switzerland. Additional information on the Group’s operations isprovided in the Strategy, Financial Review and Operating Reviewsections of this report.
Review of the Business, Future Developments and Post-balanceSheet EventsA review of the business and the future developments of the Group,including the principal risks and uncertainties, is presented in theChairman’s Statement and the Strategy section from page 8 to 29.The financial position of the Group, its cash flows, liquidity positionand borrowing facilities are described in the Financial Review onpages 37 to 44.
A full description of acquisitions, disposals, and changes to Groupcompanies undertaken during the year, including post-balance sheetevents, is included in the Financial Review on pages 37 to 44.
Exploration and Research, DevelopmentThe Group business units carry out exploration and research anddevelopment activities that are necessary to support and expandtheir operations.
Financial InstrumentsThe Group’s objectives, policies and processes for managing its capital; itsfinancial risk management objectives; details of its financial instrumentsand hedging activities; and its exposure to credit risk and liquidity riskare discussed on pages 37 to 44 of the Financial Review and in Note37 of the Financial Statements.
Health, Safety, Environment & Community (HSEC)A review of health, safety and environmental performance andcommunity participation is presented in the Sustainable Developmentsection of this report on pages 21 to 24.
Political and Charitable DonationsIn accordance with Xstrata’s corporate social involvement (CSI)policy, no political donations were made in 2008. Xstrata’s corporatesocial involvement expenditure supports initiatives that benefit thecommunities local to the Group’s operations in the areas of health,education, sport and the arts, community development, job creationand enterprise. In 2008, Xstrata set aside over $84 million for CSIinitiatives. Donations during the year to UK registered charitiestotalled £368,466.
Employee Policies and InvolvementThe Group’s policy and performance regarding employee involvement,disabled employees, labour relations and employee share schemesis described in the Sustainable Development section of this reporton pages 21 to 24.
Corporate GovernanceA report on corporate governance and compliance with the provisionsof the Combined Code is set out on pages 91 to 97.
Xstrata plc Annual Report 2008 85
Directors’ Report
Appointment of DirectorsThe rules for the replacement and appointment of directors are setout in the Articles of Association. Directors may only be appointedby the shareholders of the Company by ordinary resolution andnot by the Board of Directors. Under the terms of a RelationshipAgreement to which the Company is a party with GlencoreInternational AG (‘Glencore’) dated 20 March 2002, Glencore,as a controlling shareholder of Xstrata, can nominate up to threedirectors or (if lower or higher) such number of directors equal toone less than the number of directors who are independent directors.
At every AGM of Xstrata, one-third of the directors or if their numberis not three or a multiple of three, the number nearest to one-third,but at least one, must retire by rotation. The directors to retire arethose who have been longest in office. Any director who has at thestart of the AGM been in office for more than three years since hislast appointment or reappointment shall retire at the AGM. Asbetween those who were appointed or reappointed on the same day,those to retire are (unless they otherwise agree) determined by lot. Aretiring director is eligible for re-election.
In accordance with the Articles of Association, four directors will retireand three will offer themselves for re-election at the forthcoming AGM.Details of the resolutions that will be put to the AGM are given in theNotice of AGM. Further details about the directors and their roles withinthe Group are given in the directors’ biographies on pages 82 to 83.
Powers of the DirectorsSubject to Xstrata’s Memorandum and Articles of Association,UK legislation, and to any directions given by special resolution,the business of the Company is managed by the Board which mayexercise all the powers of the Company. The Articles of Associationcontain specific provisions concerning Xstrata’s power to borrowmoney and also provide the power to make purchases of any ofits own shares. The directors have no existing authority to purchaseXstrata’s own shares. The directors have been authorised to allot andissue ordinary shares. These powers are exercised under authorityof resolutions of the Company passed at its Extraordinary GeneralMeeting, held on 2 March 2009. Further details of the authorities theCompany will be seeking at the next AGM to issue and allot ordinaryshares of $0.50 each are set out on pages 89 to 90 of this report.
Details of interests in the share capital of the Company of thosedirectors in office as at 31 December 2008 are given below. None ofthe shares were held non-beneficially. No director held interests in theshares of any subsidiary company.
On 26 February 2009, Mick Davis, Trevor Reid and SantiagoZaldumbide acquired beneficial interests in ordinary shares in theCompany upon the vesting of deferred bonus shares awarded underthe Executive Committee Bonus Plan. This resulted in an increase ofthe total beneficial holdings of Mick Davis of 72,773 shares to487,262 shares; of Trevor Reid of 34,120 shares to 87,883 shares;
86 Xstrata plc Annual Report 2008
Governance:Directors’ Report continued
Ordinary shares Ordinary shares Ordinary shares Ordinary sharesheld beneficially held beneficially held beneficially held beneficially
Name of director as at 1 January 2008 as at 31 December 2008 Name of director as at 1 January 2008 as at 31 December 2008
Executive Non-executive
Mick Davis 195,173 414,489 Ivan Glasenberg – –
Trevor Reid – 53,763 Paul Hazen 238,213 238,213
Santiago Zaldumbide – – Claude Lamoureux – 9,000
Robert MacDonnell 394,560 304,560
Sir Steve Robson – –
David Rough 13,604 12,999
Willy Strothotte – –
Ian Strachan 8,666 14,366
Directors and their interestsThe directors as at 31 December 2008 were:
Director Position First appointed Re-elected Retirement by rotation at AGM
Mick Davis Chief Executive 25 February 2002 8 May 2007
Ivan Glasenberg Non-executive 25 February 2002 9 May 2006 Standing for re-election
Paul Hazen Non-executive* 25 February 2002 6 May 2008
Claude Lamoureux Non-executive* 6 May 2008
Robert MacDonnell Non-executive* 25 February 2002 9 May 2006 Retiring
Sir Steve Robson Non-executive* 25 February 2002 8 May 2007
David Rough Deputy Chairman,Senior Independent Directorand non-executive* 1 April 2002 8 May 2007
Trevor Reid Chief Financial Officer 25 February 2002 8 May 2007 Standing for re-election
Ian Strachan Non-Executive* 8 May 2003 6 May 2008
Willy Strothotte Chairman and Non-executive 25 February 2002 6 May 2008
Santiago Zaldumbide Executive 25 February 2002 9 May 2006 Standing for re-election
* Denotes independent director

and of Santiago Zaldumbide from nil to 41,947 shares. These sharesare held in trust for the directors by K.B. (C.I) Limited on terms thatthe shares will not be transferred to the directors until 18 March 2009following termination of the rights trading period.
In addition to the above interests in shares, the executive directors,along with other employees, also have interests in the share capitalof the Company in the form of conditional rights to free shares andoptions to subscribe for shares and deferred bonus shares and in thecase of Mick Davis, shares awarded under the Added Value IncentivePlan, subject to vesting. Details of these interests are disclosed in theDirectors’ Remuneration Report on pages 98 to 107.
Directors’ Conflicts of Interest.With the coming into effect of section 175 of the Companies Act2005 on 1 October 2008, a director of a company must avoid asituation in which he has, or can have, a direct or indirect interest thatconflicts, or possibly may conflict, with the interests of the company.The duty is not infringed if the matter has been authorised by thedirectors of the relevant company. Under the Act, the board ofdirectors of the relevant company has the power to authorise potentialor actual conflict situations. The Board has established effectiveprocedures to enable Xstrata’s directors to notify the Company of anyactual or potential conflict situations and for those situations to bereviewed and, if appropriate to be authorised by the Board, subjectto conditions and for an initial period of one year. The NominationsCommittee undertakes the role of reviewing notifications in detailand making appropriate recommendations to the Board regardingauthorisation. Directors’ conflict situations will be reviewed annually.A register of authorisations is maintained.
Share CapitalOn 29 January 2009, the Company announced a 2 for 1 Rights Issueto raise proceeds of $5.9 billion in cash. At the Extraordinary GeneralMeeting (‘EGM‘) held on 2 March 2009 to approve the Placing andOpen Offer and the related party acquisition of Prodeco from GlencoreInternational AG, a resolution was passed increasing the authorisedshare capital of the Company from $750,000,000.50 and £50,000to $2,250,000,000 and £50,000 by the creation of an additional3,000,000,000 ordinary shares of $0.50 each in the capital of theCompany having the rights and privileges and being subject to therestrictions contained in the Articles of Association of the Companyand ranking pari passu in all respects with the existing ordinary sharesof $0.50 each in the capital of the Company.
As a result of the passing of resolutions at the EGM on 2 March2009, the Company has provisionally alloted 1,955,341,080 ordinaryshares which, when issued, will have the effect of increasing Xstrata’sissued ordinary share capital to $1,466,505,810 represented by2,933,011,620 ordinary shares.
On 16 October 2006, the Financial Services Authority as UK ListingAuthority approved the admission to the Official List by way ofblocklisting of 13,575,432 ordinary shares of $0.50 each to beissued upon conversion of the Xstrata Capital Corporation A.V.V. 4%Guaranteed Convertible Bonds due 2017. During the course of theyear, notice was given in respect of 100,000 bonds to convert theminto Xstrata Capital preference shares which were then exchangedinto Xstrata ordinary shares. The total number of shares issued in theyear resulting from these conversions totalled 3,620, leaving a further13,571,812 ordinary shares to be allotted upon conversion ofoutstanding bonds.
The Company has in place an equity capital management programme(’ECMP’) under which up to 10% of the issued share capital of theCompany can be purchased in the market by Batiss Investments Limited(’Batiss’). During the course of the year, Batiss purchased 6,920,000ordinary shares of $0.50 each in Xstrata through the ECMP for a total
consideration of GBP256,879,645. On 2 March 2009, the total numberof shares held by Batiss amounted to 16,230,000 ordinary shares or1.66% of Xstrata’s issued ordinary share capital.
The ordinary issued share capital was increased on 16 January 2008when the directors issued and allotted six million new ordinary sharesof US$0.50 each to K.B. (C.I.) Nominees Limited for a considerationof GBP209,400,000. This issue was made for the purposes of theCompany’s Employee Share Ownership Trust, an employees’ sharescheme. The six million new ordinary shares rank pari passu with theexisting ordinary shares, trade on the London Stock Exchange andthe SIX Swiss Exchange and were admitted to the Official List on22 January 2008.
Share RightsThe rights and obligations attached to Xstrata’s ordinary shares areset out in the Articles of Association, copies of which can be obtainedfrom Companies House in the UK or by writing to the CompanySecretary. Subject to the Companies Acts (as defined in the Articlesof Association), and without prejudice to any rights attached toany existing shares or class of shares, any share may be issued withsuch rights or restrictions as the Company may by ordinary resolutiondetermine or, subject to and in default of such determination, as theBoard may determine.
Ordinary SharesHolders of ordinary shares are entitled to attend, speak and vote atgeneral meetings of the Company, and to appoint proxies to exercisetheir rights. Holders of ordinary shares may receive a dividend and ona winding up may share in the assets of the Company.
Deferred SharesThe holders of deferred shares do not have the right to receive noticeof any general meeting of the Company nor the right to attend, speakor vote at any such general meeting. The deferred shares have norights to dividends and, on a winding-up or other return of capital,entitle the holder only to the repayment of the amounts paid uponsuch shares after repayment of the nominal amount paid up on theordinary shares, the nominal amount paid up on the special votingshare plus the payment of GBP100,000 per ordinary share. TheCompany may, at its option, redeem all of the deferred shares in issueat any time (but subject to the minimum capital requirement of theCompanies Act 1985) at a price not exceeding GBP1.00 for each shareredeemed to be paid to the relevant registered holders of the shares.
Special Voting ShareCertain rights, that are inalienable under Swiss law, have beenpreserved in the Xstrata plc Articles of Association by creating aspecial voting share that carries weighted voting rights sufficient todefeat any resolution which could amend or remove these entrenchedrights. The holder of the special voting share is the Law DebentureTrust Corporation plc which has entered into a voting agreementwith the Company, specifying the conditions upon which it is entitledto exercise its right to vote. The special voting share does not carry aright to receive dividends and is entitled to no more than the amountof capital paid up in the event of liquidation.
Shares held by Xstrata plc Employee Share Ownership TrustsAt 31 December 2008, the trustee of the Xstrata plc Employee ShareOwnership Trusts, which is an independent trustee, held 5,073,344shares under the terms of the trusts for the benefit of employees andformer employees of the Company. The trusts are discretionary trustsand the shares are held to meet employees’ entitlements underthe Company’s Long Term Incentive Plan and Service ContractArrangements. Employees have no voting rights in relation to theshares while they are held in trust. The trustee has full discretion toexercise the voting rights or to abstain from voting. Shares acquiredby employees through the Company’s Long Term Incentive Plan rankpari passu with shares in issue and have no special rights.
Xstrata plc Annual Report 2008 87

Voting RightsSubject to the rights and restrictions attached to any class of shares:
(i) on a show of hands, every member present in person or by proxyhas one vote (save that neither the holder of the special votingshare nor any holder of deferred shares shall be entitled to vote)and a proxy appointed by a member on behalf of such member’sshareholding shall also have one vote;
(ii) on a poll:
(A) every member present in person or by proxy (except the holderof the special voting share and any holder of the deferredshares shall have:
(i) one vote for each fully paid share; and
(ii) for each partly-paid share, such proportion of the votesattached to a fully paid share as would mean that suchproportion is the same as the proportion of the amountpaid up on the total issue price of that share;
(B) the holder of the special voting share shall, on an EntrenchedRights Action, have enough votes to defeat the resolution but,on all other decisions, shall have no votes; and
(C) the holders of the deferred shares shall not be entitled to vote.
Restrictions on Transfer of SharesThere are no restrictions on the transfer of ordinary shares in theCompany other than:
(i) the right of the Board to refuse to register the transfer of acertificated share which is not a fully paid share provided thatthe refusal does not prevent dealings in shares of that class inthe Company from taking place on an open and proper basis.The Board may also refuse to register the transfer of a certificatedshare, unless the instrument of transfer (a) is lodged, duly stamped(if applicable) with the Company and (except where the shares areregistered in the name of a recognised person and no certificateshall have been issued therefor) is accompanied by the relevantshare certificate and such other evidence of the right to transferas the Board may require; (b) is in respect of one class of shareonly; and (c) is in favour of not more than four persons;
(ii) pursuant to Xstrata’s share dealing code whereby the directors ofthe Company require and employees may require approval to dealin Xstrata’s shares;
(iii) certain restrictions may from time to time be imposed by lawsand regulations (for example, insider trading laws); and
(iv) where a person whose shares represent at least a 0.25% interestin Xstrata’s shares has been served with a disclosure notice and hasfailed to provide the Company with information concerning interestsin those shares, except as otherwise provided in the Articles.
The Company is not aware of any arrangements between shareholdersthat may result in restrictions on the transfer of ordinary shares and forvoting rights.
The Board shall decline to register any transfer of the special votingshare unless approved in accordance with a voting deed betweenthe Company and the holder of the special voting share.
Major Interests in SharesOn 2 March 2009, the following major interests in the ordinaryissued shares of $0.50 each of the Company had been notifiedto the Company:
% ofNumber of ordinary
ordinary shares issued shareName of shareholder of $0.50 each capital
Glencore International AG* 336,801,333 34.45
Capital Research and Management 51,492,225 5.27
AXA S.A. 41,225,636 4.21
Legal & General Group Plc 29,999,246 3.06
* The voting rights comprised in this interest are directly controlled by FingesInvestment B.V., a wholly-owned subsidiary of Glencore International AG
Directors’ LiabilitiesThe Company has granted qualifying third-party indemnities toeach of its directors against any liability which attaches to them indefending proceedings brought against them, to the extent permittedby the Companies Acts. In addition, directors and officers of theCompany and its subsidiaries are covered by Directors & Officersliability insurance.
Creditor Payment Policy and PracticeIn view of the international nature of the Group’s operations thereis no specific Group-wide policy in respect of payments to suppliers.Individual operating companies are responsible for agreeing terms andconditions for their business transactions and ensuring that suppliersare aware of the terms of payment. It is Group policy that paymentsare made in accordance with those terms, provided that all tradingterms and conditions have been met by the supplier.
Xstrata plc is a holding company with no business activity other thanthe holding of investments in the Group and therefore had no tradecreditors at 31 December 2008.
Articles of AssociationXstrata’s Articles of Association (adopted by special resolution on19 March 2002, amended by special resolutions passed on 9 May2005 and 6 May 2008) may only be amended by special resolutionat a general meeting of the shareholders.
Significant AgreementsThe Companies Act 2006 requires the Company to disclose thefollowing significant agreements that contain provisions entitlingthe counterparties to exercise termination or other rights in theevent of a change of control of the Company:
Relationship AgreementThe Company is party to the Relationship Agreement with GlencoreInternational AG (’Glencore’) dated 20 March 2002. The Agreementregulates the continuing relationship between the parties. In particularit ensures that (a) the Company is capable of carrying on its businessindependently of Glencore as a controlling shareholder (as such term isdefined in the Agreement); (b) transactions and relationships betweenGlencore (or any of its subsidiaries or affiliates) and the Company areat an arm’s-length and on normal commercial terms; (c) Glencore shallbe entitled to nominate up to three directors or (if lower or higher)such number of directors equal to one less than the number ofdirectors who are independent directors; and, (d) directors of theCompany nominated by Glencore shall not be permitted to vote onany Board resolution, unless otherwise agreed by the independentdirectors, to approve any aspect of the Company’s involvement in orenforcement of any arrangements, agreements or transactions withGlencore or any of its subsidiaries or affiliates. It is expressed that theAgreement terminates in the event that Glencore ceases to be a
88 Xstrata plc Annual Report 2008
Governance:Directors’ Report continued

controlling shareholder of the Company following a sale or disposalof shares in the Company or if the Company ceases to be listed onthe Official List and traded on the London Stock Exchange.
$4.68 billion Syndicated FacilityOn 25 July 2007, Xstrata (Schweiz) AG and Xstrata Finance (Canada)Limited entered into a $4.68 billion multicurrency revolving loanfacility agreement with, amongst others, Barclays Capital and TheRoyal Bank of Scotland plc (as arrangers and bookrunners), BarclaysBank plc (as the facility agent) and the banks and financial institutionsnamed therein as lenders (the ’Syndicated Facilities Agreement’).
Upon a change of control, no borrower may make a further utilisationunless otherwise agreed. The majority lenders, as defined in theagreement, can also require that the Syndicated Facilities Agreementis immediately terminated and declare that all outstanding loans,become immediately payable. Alternatively, if the majority lendersdo not require cancellation, but a specific lender does on the basis ofinternal policy, that particular lender can require that its commitmentsare cancelled and all amounts outstanding in respect of that lender’scommitments shall become immediately payable.
$500 million Notes due 2037On 30 November 2007, Xstrata Finance (Canada) Limited issued$500 million 6.90% notes due 2037, guaranteed by the Company,Xstrata (Schweiz) AG and Xstrata Finance (Dubai) Limited. The termsof these notes require Xstrata Finance (Canada) Limited to make anoffer to each noteholder to repurchase all or any part of such holder’snotes at a repurchase price in cash equal to 101% of the aggregateprincipal amount of the notes so repurchased plus any accrued andunpaid interest on the principal amount of the notes repurchasedto the date of repurchase, if both of the following occur:
1) a change of control (as defined in the terms and conditions of thenotes) of Xstrata; and
2) the notes are rated below investment grade by each of Moody’sand Standard & Poor’s on any date from 30 days prior to thedate of the public notice of an arrangement that could result ina change of control (as defined in the terms and conditions of thenotes) until the end of the 60-day period following public noticeof the occurrence of a change of control.
€750 million Notes due 2011On 23 May 2008, Xstrata Canada Financial Corporation issued€750,000,000 5.875% guaranteed notes due 2011, €600,000,0006.25% guaranteed notes due 2015 and £500,000,000 7.375%guaranteed notes due 2020 (the ’2008 MTN Notes’). The 2008 MTNNotes are guaranteed by each of Xstrata plc, Xstrata (Schweiz) AG,Xstrata Finance (Dubai) Limited and Xstrata Finance (Canada) Limitedand were issued pursuant to the $6,000,000,000 Euro Medium TermNote Programme.
Pursuant to the terms and conditions of the 2008 MTN Notes, if:
1) a change of control occurs (as defined in the terms and conditionsof the 2008 MTN Notes); and
2) the 2008 MTN Notes carry, on the relevant announcement dateof the change of control:
a) an investment grade credit rating and such rating is eitherdowngraded to a non-investment grade credit rating or iswithdrawn; or
b) a non-investment grade credit rating and such rating isdowngraded by one or more notches or is withdrawn; or
c) no credit rating and a negative rating event (as defined inthe terms and conditions of the 2008 MTN Notes) occurs,
each holder has the option to require Xstrata Canada Financial Corp.to redeem such 2008 MTN Notes in cash at the principal amountplus interest accrued to (but excluding) the date of redemption.
$5.459 billion Revolving Loan FacilityOn 1 October 2008, the Company entered into a $5 billion multicurrencyrevolving loan facility agreement with, amongst others, Barclays Bank plc(as the facility agent) and the banks and financial institutions namedtherein as lenders. The facility was amended on 30 December 2008to increase the facility amount to $5.459 billion. This agreementcontains change of control provisions, in substance, identical tothose set out in the above referenced Syndicated Facilities Agreement.
Xstrata Plc Long Term Incentive PlanThe rules of Xstrata’s employee share plans set out the consequencesof a change of control of the Company on employees’ rights underthe plans. Generally such rights will vest on a change of control andparticipants will become entitled to acquire shares in the Companyor, in some cases, to the payment of a cash sum of equivalent value.
Annual General MeetingThe Annual General Meeting (AGM) of the Company will be held atTheater-Casino Zug, Artherstrasse 2-4, Zug, Switzerland on Tuesday5 May 2009 at 11:00 am (Central European Summer Time). A livewebcast will be provided of the AGM through Xstrata’s websitewww.xstrata.com. A telephone dial-in facility will also be providedon a listen-only basis. Further details of the dial-in facility and webcastwill be available from Xstrata’s website www.xstrata.com at least oneweek in advance of the meeting.
Special Business at the AGMThe Notice convening the meeting is sent to shareholders separatelywith this Report. Resolutions 1 to 7 are termed ordinary business whileresolutions 8 and 9 will be special business. These resolutions are:
Resolution 8, which will be proposed as an ordinary resolution,seeks to authorise the directors:
(A) to allot relevant securities (as defined in the Companies Act 1985)up to an aggregate nominal value of $488,835,270 which is equalto approximately one-third (33.33%) of Xstrata’s issued ordinaryshare capital as at 2 March 2009; and
(B) to allot relevant securities comprising equity securities(as defined in the Companies Act 1985) up to a nominal amountof $977,670,540 which is equal to approximately two-thirdsof Xstrata’s issued ordinary share capital as at 2 March 2009in connection with an offer by way of a rights issue.
The Association of British Insurers has revised its guidelines on shareallotments following a report of the Rights Issue Review Group. Basedon the new guidelines, the cap on the annual allotment authorityunder section 80 of the Companies Act 1985 has been increased fromone-third to two-thirds of issued share capital but the amount of anyauthority above one-third has to be applied only to fully pre-emptiverights issues, and can be raised for one year only. If the additionalauthority is taken and a decision is taken to make an issue pursuantto such authority, the ABI expects that all directors wishing to remainin office will stand for re-election at the next AGM after the decisionto make the issue in question.
The authority extends until the end of the next AGM. The Board doesnot have any present intention of exercising this authority other thanfor the purposes of Xstrata’s employee share schemes.
Xstrata plc Annual Report 2008 89

Resolution 9 will be proposed as a special resolution and will empowerthe directors to allot for cash, equity securities of a nominal amountnot exceeding $73,325,290.50 (equivalent to 146,650,581 ordinaryshares of $0.50 each, representing 5% of the issued share capital)without first offering such securities to existing ordinary shareholders.The authority extends until the end of the next AGM. Any issueof shares for cash will, however, still be subject to the requirementsof the UK Listing Authority.
The Board intends to follow the provisions of the Financial ReportingCouncil’s Pre-Emption Group statement of principles regarding theissue of not more than 7.5% of Xstrata’s ordinary share capital for cashother than to existing shareholders in any rolling three-year period.
Electronic proxy votingRegistered shareholders have the opportunity to submit their votes(or abstain) on all resolutions proposed at the AGM by means of anelectronic voting facility operated by Xstrata’s Registrar, ComputershareInvestor Services plc. This facility can be accessed by visitingwww-uk.computershare.com/Investor/Proxy/. As usual, paper proxycards will be distributed to all registered shareholders with the Noticeof Annual General Meeting.
CREST members who wish to appoint a proxy or proxies through theCREST electronic proxy appointment service may do so by using theprocedures described in the CREST Manual. CREST Personal Membersor other CREST sponsored member and those CREST members whohave appointed one or more voting service provider(s) should referto their CREST sponsor or voting service provider(s) who will be ableto take the appropriate action on their behalf. The Company may treatas invalid a CREST proxy instruction in the circumstances set out inRegulation 35(5)(a) of the Uncertificated Securities Regulations 2001.
Electronic Copies of the Annual Review and FinancialStatements 2008 and Other PublicationsA copy of the 2008 Annual Report (which includes the Overviewand Strategy sections, Operating and Financial Reviews, FinancialStatements, Directors’ Report, Corporate Governance Report andDirectors’ Remuneration Report), the Notice of the Annual GeneralMeeting, the 2008 Sustainability Report (available in early April)and other corporate publications, reports, press releases andannouncements are available on Xstrata’s website at www.xstrata.com.
AuditorsA resolution will be put to the members at the forthcoming AGM toreappoint Ernst & Young LLP as auditors and to authorise the Boardto determine the auditor’s remuneration.
Disclosure of information to auditorsHaving made enquiries of fellow directors and of Xstrata’s auditors,each director confirms that so far as each director is aware, there isno relevent audit information of which Xstrata’s auditor is unawareand each director has taken all the steps that he ought to havetaken as a director in order to make himself aware of any relevantaudit information and to establish that Xstrata’s auditor is aware ofthat information.
Going ConcernThe directors believe, after making inquiries that they consider tobe appropriate, that the Company has adequate resources to continuein operational existence for the foreseeable future. For this reasonthey continue to adopt the going concern basis in preparing thefinancial statements.
By order of the Board.
Richard EllistonCompany Secretary
2 March 2009
90 Xstrata plc Annual Report 2008
Governance:Directors’ Report continued

Xstrata plc Annual Report 2008 91
The Board is fully committed to the principle of best practice incorporate governance. This report describes how the Companyhas applied the main principles of the Combined Code on CorporateGovernance issued by the Financial Reporting Council on June 2008(the ’Code’).
During the year under review, the Company has complied with theprovisions contained in Section 1 of the Combined Code, except,with regard to membership of the Remuneration Committee (CodeProvision B.2.1) as the Chairman of the Committee is not consideredindependent and save that no individual member of the AuditCommittee has been identified as having recent and relevantfinancial experience (Code Provision C.3.1). These two pointsare explained below.
A.1 The BoardThe Board is satisfied that it meets the requirements of the Codein maintaining an effective Board which is collectively responsiblefor the success of the Company.
At the Annual General Meeting on 6 May 2008, Claude Lamoureuxwas elected a director of the Company. There were no other changesto the membership of the Board during the year. The Board, chairedby Willy Strothotte, has 11 directors, comprising three executivedirectors and eight non-executive directors. The three executivedirectors are Mick Davis, the Chief Executive, Trevor Reid, ChiefFinancial Officer, and Santiago Zaldumbide, Chief Executive of XstrataZinc. David Rough, an independent non-executive director is theDeputy Chairman. The non-executive directors possess a range ofexperience and are of sufficiently high calibre to bring independentjudgement to bear on issues of strategy, performance, and resourcesthat are vital to the success of the Group.
The Board is responsible for the governance of the Group on behalfof shareholders within a framework of policies and controls whichprovide for effective risk assessment and management. The Boardprovides leadership and articulates the Company’s objectives andstrategy to achieve those objectives. The Board sets standards ofconduct, as documented in an approved Statement of BusinessPrinciples, which provide an ethical framework for all Xstratabusinesses. While the Board focuses on strategic issues, financialperformance, risk management and critical business issues, it alsohas a formal schedule of matters specifically reserved to it for decision.These reserved matters which are documented in a comprehensive
A. Directors
regime of authorisation levels and prior approval requirements forkey corporate decisions and actions, are reviewed and updatedannually by the Board. Such matters reserved to the Board include,but are not limited to, approval of budgets and business plans,major capital expenditure, major acquisitions and disposals, andother key commitments. Certain powers are delegated by the Boardto an Executive Committee which is a committee of the Board ofXstrata (Schweiz) AG, the main trading subsidiary of Xstrata plc.This Committee and a description of its powers are describedon page 97.
The Company has a policy based on the Model Code publishedin the Listing Rules, which covers dealings in securities and appliesto directors, persons discharging managerial responsibilities, andemployee insiders.
Five scheduled Board meetings were held during the year andone additional meeting was held. Attendance by directors at Boardmeetings and at meetings of standing committees of the Board isshown below. In addition, the Chairman held a separate meetingwith the non-executive directors without the executive directorsbeing present and the non-executive directors held a separatemeeting without the Chairman being present. All Board meetingsare held in Switzerland.
There are four formally constituted committees of the Board. Detailsof attendance at Board and committee meetings is given below. Therole and work of these committees is described in detail on pages 95to 97.
Attendance at Board meetings and committees of the Board
Health, Safety,Board (6 of Environment
which 5 were Audit Remuneration & Community NominationsDirector scheduled) (4) (3) (4) (5)
Mick Davis 5 4
Ivan Glasenberg 6 5
Paul Hazen 4 2
ClaudeLamoureux* 5 2 3
RobertMacDonnell 6 5
Sir Steve Robson 5 4
David Rough 6 4 3 4 5
Trevor Reid 5
Ian Strachan 4 3 4
Willy Strothotte 5 3
SantiagoZaldumbide 5
* Elected on 6 May 2008
Corporate Governance
Corporate Governance Report
The Combined Code

92 Xstrata plc Annual Report 2008
Governance:Corporate Governance Report continued
A.2 Chairman and Chief ExecutiveA clear separation is maintained between the responsibilities of theChairman and the Chief Executive. This is documented in a statementapproved by the Board. The Chairman is responsible for leadership ofthe Board and creating the conditions for overall Board and individualdirector effectiveness while the Chief Executive is responsible for overallperformance of the Group including the responsibility for arranging theeffective day-to-day management controls over the running of the Group.
A.3 Board Balance and IndependenceOf the eight non-executive directors, six are considered by the Boardto be independent of management and free from any business orother relationship which could materially interfere with the exerciseof their independent judgement and two, Willy Strothotte and IvanGlasenberg, are directors of Glencore International AG (’Glencore’).Willy Strothotte is Chairman and Ivan Glasenberg is Chief ExecutiveOfficer of Glencore. The Board has considered these associations andconsiders the industry expertise and experience of these directorsbeneficial to the Group.
David Rough is the Deputy Chairman and the Senior IndependentDirector. His role and responsibilities as the Senior IndependentDirector are detailed in and formalised by Board resolution and, insummary, are that he should be available to shareholders to discusstheir concerns where the normal channels would not be appropriatefor this purpose, to have contact with analysts and major shareholdersto obtain a balanced understanding of their issues and concerns, tochair the Nominations Committee and to lead the Board and directorappraisal process.
The non-executive directors have a particular responsibility to ensurethat the strategies proposed by the executive directors are fullyconsidered. To enable the Board to discharge its duties, all directorsreceive appropriate and timely information and briefing papers aredistributed to all directors.
The Board reviews annually the composition and chairmanship of itsstanding committees, namely the Audit, Remuneration, Nominationand the Health, Safety, Environment & Community Committee.
A.4 Appointments to the BoardThe Nominations Committee ensures that there is a formal, rigorousand transparent procedure for the appointment of new directors.Recommendations for appointments are made on merit and againstobjective criteria. The report on the Nominations Committee is setout on pages 96 to 97.
Following a search for a new independent non-executive directorconducted on behalf of the Company by an independent searchconsultancy and led by the Nominations Committee, Mr Peter Hooleywas invited to join the Board as an independent non-executive directorand will be proposed by the Board for election by the shareholders atthe Annual General Meeting on 5 May 2009. Mr Hooley was GroupFinance Director of Smith & Nephew plc until 2006. Since 2002, hehas been a non-executive director of Cobham plc, the aerospace anddefence group and is chairman of its Audit Committee. He is alsoa director and chairman of BSN medical, a medical textiles business.With his extensive financial markets experience and a strong trackrecord of creating shareholder value, the Board is confident thatMr Hooley will add significant value to Xstrata. Mr Hooley has agreedto act as an independent external consultant to the Board with effectfrom 3 March 2009 until the AGM.
A.5 Information and Professional DevelopmentAs part of the annual Board evaluation process, the Board expressedits view that the Board papers are prepared to a high standard, arecirculated in a timely manner and provide all relevant information anddirectors were satisfied that the Board is kept informed of all areas ofmajor importance to the Company. The Board was also satisfied that itreceives regular information on legal and regulatory developments andprocedures are in place to give directors the opportunity for furthertraining in order to regularly update their skills and knowledge.
All directors are made aware that they may take independentprofessional advice at the expense of the Company in the furtheranceof their duties. All directors had access to the advice and services ofthe Company Secretary, who is responsible to the Board for ensuringthat all governance matters are complied with and assists withprofessional development as required.
Arrangements have been approved by the Board to ensure that newdirectors should receive a full, formal and tailored induction on joiningthe Board. In addition, ongoing support and resources are providedto directors in order to enable them to extend and refresh their skills,knowledge and familiarity with the Company. Professional developmentand training is provided in three complementary ways: regular updatingwith information on changes and proposed changes in laws andregulations affecting the Group or its businesses; arrangements,including site visits, to ensure directors are familiar with the Group’soperations; and opportunities for professional and skills training.
A.6 Performance EvaluationThe Board undertook an evaluation of its own performance and thatof its Committees and of its individual directors in accordance withthe Code. The process was devised and conducted internally underthe direction of the Senior Independent Director, following theprevious year’s external process. In general, directors were verysatisfied with the Board’s performance and the Board is considered tobe fit for purpose. Medium-term succession planning was identified asan area of some concern, whilst there was agreement on the Group’slong-term strategy. It was agreed that Board evaluations, which areconducted annually, will be conducted by external evaluators everythree years.
A.7 Re-election of DirectorsUnder the Articles, one-third of all directors are required to retire byrotation at each AGM and any director who, at the start of an AGM,has been in office for more than three years since his election mustretire. Retiring directors may offer themselves for re-election. Thesuccession plan was updated and approved by the Board during theyear to ensure there was a balance of skills and experience on theBoard and to plan for an orderly refreshing of Board membership. It isproposed that Messrs Glasenberg, MacDonnell, Reid and Zaldumbidewill retire and Messrs Glasenberg, Reid and Zaldumbide will offerthemselves for re-election at the AGM on 5 May 2009. Following theappraisal of the non-executive directors, the Board was satisfied thateach director’s performance continues to be effective and that eachdirector continues to demonstrate commitment to the role, andrecommended the re-election of the three directors.

Xstrata plc Annual Report 2008 93
Remuneration is covered in the Remuneration Report on pages 98 to107 and, with regard to the Remuneration Committee, on page 96.
C.1 Financial ReportingThe Board is mindful of its responsibility to present a balanced andclear assessment of the Company’s position and prospects and theBoard is satisfied that it has met this obligation. This assessment isprimarily provided in the Chairman’s Statement, the Chief Executive’sReport, and the Operating and Financial Review contained in thisReport. The Statement of Directors’ Responsibilities in respect ofthe Consolidated Financial Statements are set out on page 110.
C.2 Internal ControlGeneralAn ongoing process in accordance with the Guidance of the TurnbullCommittee on internal control has been established for identifying,evaluating and managing the significant risks faced by the Group. Thisprocess has been in place throughout the year under review and up tothe date of the approval of the Annual Report and Financial Statements.
The Audit Committee reviews this process and the effectiveness ofthe system of internal control by considering the regular reports frommanagement on key risks, mitigating actions and internal controls,management representations and assertions and the reports on riskmanagement and internal control from Internal Audit, the ExternalAuditors and other assurance providers such as Health, Safety,Environmental and Community Management.
The principal aim of the system of internal control is the managementof business risks that are significant to the fulfilment of the Group’sbusiness objectives with a view to enhancing the value of theshareholders’ investment and safeguarding of assets. The internalcontrol systems have been designed to manage rather than eliminatethe risk of failure to achieve business objectives and provide reasonablebut not absolute assurance against material misstatement or loss.
The directors confirm that they have reviewed the effectivenessof the system of internal control.
Control EnvironmentThe key elements and procedures that have been establishedto provide an effective system of internal control are as follows:
(i) Organisational StructureThere is a well-defined organisational structure with clear operatingprocedures, lines of responsibility and delegated authority.
The way the Group conducts its business, expectations of managementand key accountabilities are embodied in the Group’s policies, itsStatement of Business Principles and Board Level Authority Limits.
The Group operates a decentralised management model with appropriateauthority delegated to Commodity Business Unit Boards for the Alloys,Coal, Copper, Nickel and Zinc/Lead businesses. The Business Units areresponsible for profitability to the level of earnings before interest andtaxation (EBIT). Business Unit Boards meet regularly and either the GroupCEO or CFO attend as representatives of Head Office.
B. Remuneration
C. Accountability and Audit
The Board sets overall policy and delegates the authority to implementthat policy to its commodity business units and supporting functions.
Group policies are established by head office management forapplication across the whole Group.
(ii) Risk Identification and EvaluationThe Board considers effective risk management as essential tothe achievement of the Group’s objectives and has implemented astructured and comprehensive system across the Group. The GroupRisk Management Policy is published on the Xstrata website atwww.xstrata.com as part of the Governance section.
The Xstrata approach to risk management is value driven and hasthe stated objective of ensuring “an environment where we canconfidently grow shareholder value through developing and protectingour people, our assets, our environment and our reputation”. Theprocess is thorough and robust and is an essential element of theGroup’s approach to business planning.
Each commodity business unit and the head office carry out acomprehensive annual risk review and update its risk registeraccordingly. Objectives in the business plan are aligned with risks and asummary of the key risks, related internal controls, accountabilities andfurther mitigating actions that are planned is appended to the businessplan that is reviewed and approved by the Executive Committee.
Progress against plans, significant changes in the business risk profileand actions taken to address controls and mitigate risks are reportedquarterly to the Business Unit and Xstrata plc Audit Committees, as wellas to the Executive Committee and the Board as and when necessary.
The output of the process has been reviewed by the Group andcommodity business unit audit committees, and accords with theTurnbull Guidance.
(iii) Information and Financial Reporting SystemsThe Group’s comprehensive planning and financial reporting proceduresinclude detailed operational budgets for the year ahead and a three-year rolling plan. The Board reviews and approves the budget and plan.Plans and budgets are prepared on the basis of consistent economicassumptions determined by the Group Finance function. Performanceis monitored and relevant action taken throughout the year throughthe monthly reporting of key performance indicators, updated forecastsfor the year together with information on the key risk areas.
Comprehensive monthly management reports on a divisional andconsolidated basis, including updated forecasts for the year, areprepared and presented to the Executive Committee by the GroupController. Detailed consolidated management accounts, togetherwith an executive summary from the Chief Executive, are circulatedto all directors on a monthly basis.
(iv) Investment AppraisalA budgetary process and authorisation levels regulate capitalexpenditure. For expenditure beyond specified levels, detailed writtenproposals are submitted to the Executive Committee in accordancewith Board delegated authority limits. A standardised format is usedthat includes a detailed calculation of return on equity. Economicassumptions are consistent with those included in management reportsand budgets and are agreed with Group Finance. Reviews are carriedout after the project is complete, and for some projects during theconstruction period, to monitor progress against plan; major overrunsare investigated. Commercial, legal, sustainable development andfinancial due diligence work, using outside consultants, is undertakenin respect of acquisitions as appropriate.

94 Xstrata plc Annual Report 2008
Governance:Corporate Governance Report continued
(v) Treasury CommitteeA Treasury Committee operates as a sub-committee of the ExecutiveCommittee of Xstrata (Schweiz) AG. Its membership consists of theChief Executive, the Chief Financial Officer, the Group Treasurer andGroup Controller. The Committee recommends Group policy, whichis submitted to the Group Board for approval, relating to all aspects offunding, management of interest rate and foreign exchange exposuresand it coordinates relationships with banks, rating agencies and otherfinancial institutions. The Committee monitors all significant treasuryactivities undertaken by Group companies and ensures compliancewith Group policy.
(vi) Internal AuditInternal Audit is an important element of the overall process bywhich the Executive Committee and the Board obtains the assuranceit requires that risks are being properly identified, managed andcontrolled. Risk-based internal audit plans, prepared on an annualbasis, are approved by the Audit Committee.
Internal Audit completed a full programme of work in 2008, coveringthe Business Units and Head Office, focusing in particular on themore significant risks and related internal controls identified in the riskself-assessment process. Findings and agreed actions were reportedto management and to the Audit Committee.
The Group-wide internal audit function is supplemented by servicesprovided as required by KPMG LLP as an outsourced service provider.
(vii) Fraud ManagementThere is a formal Group policy relating to fraud management,including reporting and investigation arrangements and, in linewith best practice, includes whistleblowing procedures. There areindependently operated confidential hotlines in various countries inwhich the Group operates, through which employees or contractorsor any other parties can report any breach of Xstrata’s BusinessPrinciples, including fraud. The contact details are published in theStatement of Business Principles which can be found on the Xstratawebsite at www.xstrata.com/sustainability/policies/businessprinciples.All incidents reported are fully investigated and the results arereported to the Audit Committee.
C.3 Audit Committee and AuditorsA principle of the Code is that the Board should establish formaland transparent arrangements for considering how it should applythe financial reporting and internal control principles and formaintaining an appropriate relationship with the external auditors,Ernst & Young LLP. These responsibilities are delegated to and aredischarged by the Audit Committee whose work is described onpages 95 to 96.
The Audit Committee undertakes annually a comprehensiveevaluation of the external auditor’s performance across the Groupfor the purpose of making a recommendation to the Board regardingthe re-election of the external auditor at the AGM.
D.1 Dialogue with shareholdersThe Company is required to have a dialogue with shareholders, basedon the mutual understanding of objectives, and it is the responsibilityof the Board as a whole to ensure that a satisfactory dialogue doestake place. The Code recognises that most shareholder contact iswith the Chief Executive and the Chief Financial Officer. However,the Chairman, the Senior Independent Director, and other directorsas appropriate, should maintain contact with major shareholdersin order to understand their issues and concerns.
The Board places considerable importance on effective communicationwith shareholders. The Chief Executive and Chief Financial Officer,assisted by the Executive General Manager of Corporate Affairs,maintain regular dialogue with and give briefings throughout theyear to analysts and institutional investors and are involved in astructured programme of investor, analyst and media site visits.Presentations are given by the Chief Executive and Chief FinancialOfficer after Xstrata’s preliminary announcements of the year-endresults and at the half year. Care is taken to ensure that any price-sensitive information is released to all shareholders, institutional andprivate, at the same time in accordance with the Disclosure Rules andSwiss Stock Exchange requirements.
The Senior Independent Director was available to shareholders forany concern which contact with the Group Chairman, Chief Executiveor Chief Financial Officer failed to resolve or for which such contactwas inappropriate.
All shareholders can obtain access to the Annual Report and Accountsand other current information about the Company through Xstrata’swebsite at www.xstrata.com. The Operating and Financial Reviewson pages 32 to 75 include a detailed report on the business andfuture developments.
D.2 Constructive use of the AnnualGeneral MeetingAll directors normally attend Xstrata’s AGM and shareholders areinvited to ask questions during the meeting and to meet directors afterthe formal proceedings have ended. Shareholders at the meeting areadvised as to the level of proxy votes received including percentagesfor and against and the abstentions in respect of each resolutionfollowing each vote on a show of hands.
At the time of the listing in March 2002, shareholders in the oldXstrata AG were informed that the Company would offer shareholdersthe opportunity to attend general meetings in Switzerland where thehead office resides, even though the Company was incorporated andhas its registered office in England. Given this history and the numberof shares still held in or through Switzerland, the Board continues toconsider it is appropriate for the AGM to be held in Zug, Switzerland.A live webcast will be provided of the AGM through Xstrata’s websitewww.xstrata.com. A telephone dial-in facility will also be provided ona listen-only basis.
D. Relations with Shareholders

Xstrata plc Annual Report 2008 95
The Board uses the AGM to communicate with institutional andprivate investors and welcomes their participation. At the AGMon 6 May 2008, the Chairman and the Chairmen of the Audit,Remuneration, Nominations and HSEC Committees were presentto answer questions. Details of the resolutions to be proposed atthe Annual General Meeting on 5 May 2009 can be found in theNotice of the Meeting.
Board CommitteesThe terms of reference of the Audit, Remuneration, Nominationsand HSEC Committees are available on the Company’s websitewww.xstrata.com.
Audit CommitteeThe Audit Committee assists the Company’s Board in discharging itsresponsibilities with regard to financial reporting, external and internalaudits and controls, including reviewing Xstrata’s annual financialstatements, considering the scope of the Company’s annual externalaudit and the extent of non-audit work undertaken by external auditors,approving the Company’s internal audit programme, advising on theappointment of external auditors and reviewing the effectiveness ofthe Company’s internal control systems, risk management systems,risk registers and the Group’s whistleblowing procedures.
The Code recommends that all members of the Audit Committeeshould be non-executive directors, all of whom are independent incharacter and judgement and free from relationships or circumstanceswhich are likely to affect, or could appear to affect, their judgementand that at least one member should have recent and relevantfinancial experience. The Audit Committee comprises fourindependent non-executive directors: Sir Steve Robson (Chairmanof the Audit Committee), Claude Lamoureux, David Rough and IanStrachan. The Board considered membership of the Committee duringthe year and, while bearing in mind the Combined Code provisionthat at least one member of the Audit Committee should have recentand relevant financial experience, declared its satisfaction that themembers of the Committee have requisite skills and attributes, andcollectively have sufficient recent and relevant financial experience todischarge its role and responsibilities. The Board therefore considersthat it complies with Combined Code recommendations regarding thecomposition of the Audit Committee and is consistent with the mainprinciple in C.3 of the Code and contributes to good governance.
The Chief Executive, the Chief Financial Officer, the Group Controller,representatives of Xstrata’s external auditors and the Head of InternalAudit normally attend the meetings. Other directors of the Companyand senior management may also, on invitation by the Committee,attend and speak, but not vote at any meeting of the Audit Committee.In order to further enhance communication and best practice, thechairmen of the Company’s Business Unit Audit Committees and thechief executives of the business units are also invited to attend the AuditCommittee meetings on a rotational basis.
The Audit Committee reports its activities and makes recommendationsto the Board of Directors of Xstrata. The Audit Committee met fourtimes during the year ended 31 December 2008. During that yearthe Committee:
(a) reviewed for submission to Xstrata’s Board, the 2007 annualfinancial statements and the 2008 interim financial statementsand reviewed the external auditor’s detailed reports thereon;
(b) approved the form in which interim management statementswill be released by the Company;
(c) reviewed the appropriateness of the Xstrata Group’s accountingpolicies;
(d) regularly reviewed the potential impact on the Xstrata Group’sfinancial statements of a range of matters which involve significantjudgement, estimation or uncertainty, and the possible impairmentof fixed asset values;
(e) assessed and concluded that there was nothing of any materialityin the Litigation Report;
(f) reviewed the external auditor’s plan and scope for the audit ofthe Xstrata Group accounts, and approved their remunerationboth for audit and non-audit work, and their terms of engagement.In February 2008, the Audit Committee looked at the relationbetween audit and non-audit fees over the last six years. Therewas some volatility in non-audit fees which reflected years ofmajor acquisitions. Otherwise the audit fees were in line withXstrata’s peers. Non-audit fees paid to the auditors were higherthan the peer group due to a number of major acquisitions;
(g) recommended to the Board the reappointment of the externalauditors following an evaluation of their effectiveness andconfirmation of auditor objectivity and independence;
(h) examined the effectiveness of the Company’s risk managementsystem including its risk management process and profile,the Company’s internal control systems and operations whichwere examined and tested by the internal auditors. The AuditCommittee reviewed counterparty risk management processes.Counterparty risk is monitored weekly to identify anyconcentration of risk;
(i) reviewed the structure and limits of the Xstrata Group insurancepolicies, and these were considered to be appropriate;
(j) reviewed and approved the internal audit plans for 2008,the effectiveness of the internal audit function and, at eachmeeting, reviewed the reports on findings and on progressagainst recommendations. The Audit Committee also requesteda report at each meeting in respect of major projects in termsof achievement of agreed control objectives and projectmanagement delivery targets;
(k) reviewed a Statement of Reserves and Resources, reviewed byan independent expert to ensure consistency of reporting acrossthe Group and with international standards;
(l) approved a statement on the process by which the AuditCommittee and Xstrata’s Board review the effectiveness ofinternal control; and
(m) reviewed the whistleblowing arrangements, the report onwhistleblowing and fraud related matters.

96 Xstrata plc Annual Report 2008
Governance:Corporate Governance Report continued
Following each Committee meeting, separate meetings were held bythe Committee with the external auditors in the absence of executivemanagement, with executive management in the absence of theexternal auditors and with the internal auditor in the absence ofexecutive management and the external auditors.
The Group has a specific policy governing the conduct of non-auditwork by the external auditors which ensures that the Company isin compliance with the requirements of the Combined Code andthe Ethical Standards for Auditors published by the AuditingPractices Board.
The auditors are permitted to provide non-audit services that arenot in conflict with auditor independence. Six-monthly reports aremade to the Audit Committee detailing non-audit fees paid to boththe external and internal auditors. However, prior approval of theAudit Committee is required for each specific service providedby the external auditors. A range of non-audit services has beenpre-approved in principle by the Audit Committee. However, wherethe fee is likely to be in excess of $100,000 for such services, specificre-approval is required, while prior approval of the Chief FinancialOfficer is required for those pre-approved services where the feeis likely to be less than $100,000.
The Audit Committee is supported and assisted in its work by separateAudit Committees for each Commodity Business Unit in line withthe decentralised commodity business unit model. The Business UnitAudit Committees are independent of the executive managementof the Business Unit and are chaired by suitably qualified individualsindependent of Xstrata. The terms of reference of these Committeesfollow those of Xstrata’s Audit Committee. Meeting dates precedethose of Xstrata’s Audit Committee and minutes of their meetingsare circulated to Xstrata’s Audit Committee.
Remuneration CommitteeThe principal roles of the Remuneration Committee are: (i) toconsider and determine all elements of the remuneration of theChief Executive and Chief Financial Officer and of the heads ofthe major operating subsidiaries or business units of the Company(the ’Executive Group’) as defined by the Chief Executive; and (ii) todetermine targets for any performance-related pay schemes operatedby the Company. At its meetings, the Remuneration Committeemakes recommendations to the Board in regard to all elements ofthe remuneration for the executive directors and the members of theExecutive Group. The Remuneration Committee receives independentadvice on benchmarking and best practice. The terms of reference ofthe Remuneration Committee conform with the terms of referenceset out in the Code. The recommended revision of the fee structurefor non-executive directors was approved by the Board as a whole.
The Remuneration Committee is chaired by Willy Strothotte. AsChairman of Xstrata and Chairman of Glencore, he is not consideredto be an independent director and therefore is not compliant withthe Code. The Board regards Willy Strothotte’s membership as criticalto the work of the Committee due to his extensive knowledge andexperience of the global mining resources sector. The Board considersthat this is consistent with the main principle in Code B.2 of theCode and contributes to good governance. David Rough and PaulHazen, the other members of the Committee, are both non-executivedirectors and independent. The Committee met three times during theyear. The Chief Executive attends meetings by invitation but does notparticipate at a meeting of the Committee (or during the relevant part)at which any part of his remuneration is being discussed or participatein any recommendation or decision concerning his remuneration.
The Remuneration Committee’s activities in respect of the yearended 31 December 2008 included:
(a) determining the bonuses for 2007 performance and salariesfor 2009 for the executive directors and members of theExecutive Committee;
(b) recommending for approval by the Board, a revised fee structurefor non-executive directors to apply from 1 January 2008;
(c) determining the vesting percentage applicable to awards underthe Long Term Incentive Plan 2005 which vested in March 2008,approving the number of share options and contingent shareawards to be awarded under the 2008 Long Term IncentivePlan awards and the individual awards to members of theExecutive Committee;
(d) agreeing a policy in respect of the vesting of awards underthe Long Term Incentive Plan for scheme participants whoretire from employment with the Group;
(e) approving an award under the Added Value Incentive Planto the Chief Executive;
(f) approving proposed amendments to the Added Value IncentivePlan and the text of a circular submitted to the 2008 AGM forapproval by the shareholders;
(g) clarifying the rules regarding the treatment of deferred bonusesin the event of a change of control;
(h) approving the amount of the total award to be granted underthe Long Term Incentive Plan in 2009; and
(i) agreeing to changes to the Comparator Group of miningcompanies against which TSR performance will be measuredin respect of future grants under the Long Term Incentive Plan.
Details of Xstrata’s remuneration for executive directors, benefits, shareoptions, pensions entitlements, service contracts and compensationpayments are given in the Remuneration Report on pages 98 to 107.A resolution to approve the Remuneration Report will be proposedat the AGM.
Nominations CommitteeThe Nominations Committee assists Xstrata’s Board in dischargingits responsibilities relating to the composition of the Board.The Nominations Committee is responsible for reviewing, fromtime-to-time, the structure of Xstrata’s Board, identifying, evaluatingand recommending candidates for Board vacancies and makingrecommendations on the continuation of existing directors in officeto ensure there is a balanced Board in terms of skills, knowledge andexperience. The Committee also determines succession plans for thechairman and chief executive officer, and assesses directors’ potentialconflict of interest situations and makes recommendations thereonto the Board.
The Committee comprises David Rough (Committee Chairman), IvanGlasenberg and Robert MacDonnell. Of these non-executive directors,Ivan Glasenberg is not considered independent.

Executive CommitteeThe Executive Committee is a Committee of the Board of Xstrata(Schweiz) AG, the main direct subsidiary of Xstrata plc. The ExecutiveCommittee obtains its responsibility and authority from the Xstrata(Schweiz) AG Board and is directly accountable to the Xstrata plcBoard. It is chaired by Mick Davis and comprises executive directors,Trevor Reid and Santiago Zaldumbide (also Chief Executive of XstrataZinc) together with the Chief Executives of the other Business Units,Charlie Sartain (Xstrata Copper), Peter Freyberg (Xstrata Coal), IanPearce (Xstrata Nickel), Peet Nienaber (Xstrata Alloys), Benny Levene(Chief Legal Counsel) and Thras Moraitis (Executive General Manager,Group Strategy and Corporate Affairs). Other members of seniormanagement are invited to attend Executive Committee meetings asrequired. The Executive Committee is responsible for implementingstrategy, approval of matters consistent with its delegated levels ofauthority and overseeing the various businesses which comprise theGroup. It meets regularly during the year and no meetings are heldin the UK.
Xstrata plc Annual Report 2008 97
During the year ended 31 December 2008, the Nominations Committeemet five times. Its activities in respect of that year included:
(a) reviewing the plan for the retirement by rotation and re-election ofdirectors of Xstrata and the framework for Board succession planningfor 2009/11 and recommending that all independent non-executivedirectors appointed in 2002 should be replaced by 2011;
(b) appointing an executive search consultancy to identify and proposea shortlist of potential candidates for appointment to the Board in2009 and making recommendations thereon to the Board. This isdesigned to take into account matters such as the size of Xstrata,product diversity and geographical spread, as well as maintaininga balance to the Board in relation to independent/non-independentmembers, their skills and experience;
(c) overseeing the annual evaluation of the Board’s performance,its committees and directors; and
(d) assessing directors’ potential conflict of interest situations,proposing terms on which those situations might be authorisedand recommending these for authorisation by the Board.
Health, Safety, Environment and Community CommitteeThe principal roles of the Health, Safety, Environment & Community(HSEC) Committee are to review and make recommendations to theBoard on the appropriateness and effectiveness of health, safety,environment and community strategy, systems and methodology.It also reviews the results of any investigation into significant health,safety, environment and community incidents and keeps the Boardinformed of new developments, trends and/or forthcoming significantlegislation on health, safety, environment and community matterswhich may be relevant to the Xstrata Group’s operations, its assetsor employees.
The HSEC Committee comprises Ian Strachan, who chairs the HSECCommittee, Mick Davis, Claude Lamoureux and David Rough.
During the year ended 31 December 2008, the HSEC Committeemet four times. Its activities in respect of that year included:
(a) monitoring and evaluating reports on the implementation andeffectiveness of the Sustainable Development (SD) Policy, SDmanagement standards, SD strategy and the SD AssuranceProgramme;
(b) monitoring and evaluating the implementation and effectivenessof Xstrata Coal, Xstrata Alloys and Xstrata Zinc’s SD and HSECstrategies, plans and performance;
(c) monitoring and evaluating reports on high potential risk HSECincidents and the results of investigations into critical HSECincidents, including facilities;
(d) receiving a report on 2007 HSEC performance against targetsand 2008 monthly performance;
(e) monitoring and evaluating new developments, issues and/orrelevant legislation on HSEC matters; and
(f) approving a policy on SD governance, SD performance in 2008and approving the Sustainability Report.

98 Xstrata plc Annual Report 2008
Information not subject to audit
Remuneration CommitteeThe Remuneration Committee is chaired by Willy Strothotte and itsother members are David Rough and Paul Hazen, all of whom arenon-executive directors. The Board recognises that Willy Strothotteis not an independent non-executive director as defined by theCode, but regards his membership as critical to the workings ofthe Committee due to his extensive knowledge and experienceof the global mining resources sector.
The Remuneration Committee reviews the structure of remunerationfor executive directors on an ongoing basis and has responsibilityfor the determination, within agreed terms of reference, of specificremuneration packages for executive directors and other members ofthe Executive Committee, including salaries, pension rights, bonuses,long-term incentives, benefits-in-kind and any compensation payments.The Committee is also aware of the level and structure of remunerationfor senior management and advises on any major changes in employeeremuneration and benefit structures throughout the Group, includingthe continuous review of incentive schemes to ensure that they remainappropriate for the Group. The Remuneration Committee commits tobringing independent thought and scrutiny to the development andreview process of the Group with regards to remuneration.
The Committee met three times during 2008. The Chairman willcontinue to ensure that the Group maintains contact, as necessary,with its principal shareholders about remuneration. The purposeand function of the Committee in the future will not differ materiallyfrom this year and its terms of reference can be found on the Group’swebsite (www.xstrata.com).
The remuneration of non-executive directors, other than the Chairman,will be considered by the Chairman and the Chief Executive and willnot be considered by the Remuneration Committee. The Chairman’sremuneration will be determined by the Remuneration Committeewhile the Chairman is absent.
The Chief Executive attends the Remuneration Committee meetings byinvitation and assists the Remuneration Committee in its considerations,except when issues relating to his own remuneration are discussed. TheRemuneration Committee is provided with national and internationalpay data collected from external survey providers.
During the year, Hay Group provided independent advice to theRemuneration Committee on executive remuneration. The Groupalso uses the Hay Group method for determining salaries for positionsbelow Executive Committee level. The Hay Group provided no otherservices to the Group during 2008.
Remuneration PolicyXstrata’s remuneration policy is designed to attract, retain and motivatethe highly talented individuals needed to deliver its business strategyand to maximise shareholder wealth creation.
The policy for 2009 and, so far as practicable, for subsequentyears, will be framed around the following principles for theExecutive Committee:
> remuneration arrangements will be designed to support Xstrata’sbusiness strategy and to align it with the interests of Xstrata’sshareholders;
> total reward levels will be set at appropriate levels to reflect thecompetitive global market in which Xstrata operates, with theintention of positioning such levels within the top quartile foroutstanding performance when measured against a peer groupof global mining companies and the FTSE100;
> a high proportion of the remuneration should be ‘at risk’, withperformance-related remuneration making up at least 50% of thetotal potential remuneration for Executive Committee members; and
> performance-related payments will be subject to the satisfaction ofdemanding and stretching performance targets over the short andlong term. These performance targets will be set in the context of theprospects of the Group, the prevailing economic environment in whichit operates, and the relative performance of comparator companies.
The Remuneration Committee considers that a successful remunerationpolicy needs to be sufficiently flexible to take account of futurechanges in the business environment and in remuneration practices.Consequently, the remuneration policy and the RemunerationCommittee’s terms of reference for subsequent years will bereviewed annually in the light of matters such as changes to corporategovernance best practice or changes to accounting, legislation orbusiness practices among peer group mining companies. This willhelp to ensure that the policy continues to provide Xstrata with acompetitive reward strategy. In doing so, the Committee will takeinto account the UK Listing Rules, the provisions of the Code andassociated guidance attached to it, as well as the guidance providedby a number of institutional investor representative bodies on thedesign of performance-related remuneration. Policies will be sensitiveto pay and employment conditions elsewhere in the Group.
The Remuneration Committee is satisfied that Xstrata’s pay andemployment conditions for non-Board employees around the world areappropriate to the various markets in which Xstrata operates. TheRemuneration Committee does not consider a ratio comparison betweenexecutive directors and non-Board employees to be a useful way ofassessing the fairness and equitability of Xstrata’s remuneration practices.The vastly different costs of living in the countries where Xstrata hasoperations and fluctuations in exchange rates mean any such trendanalysis or comparisons with competitors would be meaningless.
Governance
Remuneration Report
98 Xstrata plc Annual Report 2008

Elements of RemunerationThe total remuneration package for executive directors comprisesthe following principal elements:
> base salary;
> annual bonus plan including deferred element;
> participation in long-term incentive arrangements;
> subsisting rights under the Xstrata AG share scheme in relationto individual arrangements (as detailed below);
> pension; and
> other benefits including housing allowance (where essential forthe performance of duties), permanent health, life and privatemedical insurance.
Base SalaryThe base salary of the executive directors is subject to annual review bythe Remuneration Committee. The Remuneration Committee reviewsexternal pay data to ensure that the levels of remuneration remaincompetitive and appropriate in the light of the Group’s policy. TheRemuneration Committee is also responsible for ensuring that thepositioning of the Group’s remuneration relative to its peers does notresult in increases in remuneration without a corresponding increasein performance or responsibilities. When setting base salaries, theCommittee also considers the impact on pension contributions andassociated costs. During 2008 (with effect from 1 January 2008), basesalary increases for Mick Davis, Trevor Reid and Santiago Zaldumbidewere 14%, 22% and 6% respectively. Respective base salarieseffective from 1 January 2009 will be GBP1,310,000, GBP660,000and EUR970,000, representing increases of 4.80%, 5.60% and4.08% respectively on salaries paid during 2008.
Santiago Zaldumbide provides his services to the Group under aprofessional services agreement entered into between him andAsturiana on 23 July 2007 to act as Chairman and Chief ExecutiveOfficer of Xstrata Zinc. This agreement replaced a similar agreementwith Asturiana dated 29 January 1998, which was terminated byagreement on 23 July 2007. The current agreement is in force from itsdate of signature (23 July 2007) and continues indefinitely thereafterunless terminated by one of the parties giving the other written noticeof no less than six months. The annual gross fee payable to SantiagoZaldumbide for the year ended 31 December 2008 was EUR932,000including an amount in lieu of any pension-related payment. Thisannual fee is subject to review in line with the other executive directors.
Santiago Zaldumbide’s appointment as a director of Xstrata is subjectto the existence of the above-referenced agreement between SantiagoZaldumbide and Asturiana. Santiago Zaldumbide receives no additionalremuneration for his position as director of Xstrata plc but is eligibleto participate in the Bonus Plan and the Long Term Incentive Plan.
Bonus PlanExecutive directors and the other members of the Executive Committeeare eligible to participate in the Executive Committee Bonus Plan (‘theBonus Plan’). The Bonus Plan focuses on the achievement of annualobjectives, which align the short-term financial performance of theGroup with the creation of shareholder value.
The bonus is based on Xstrata’s operational performance as measuredby return on equity and net profit. Specific targets for return on equityand the proportion of net profits that make up the bonus pool aredetermined each year by the Remuneration Committee. Before thepool is finalised the Remuneration Committee actively considerswhether the pool is appropriate in light of the other key financialand non-financial drivers of future shareholder value.
The payment of any bonus under the Bonus Plan is subject to a hurdlerate (for the financial years ending 31 December 2008 and 2009 it willbe set such that the Group’s return on equity will be at least equal tothe Group’s average cost of borrowing). If this hurdle is not reached,the bonus pool will be zero. The Remuneration Committee has thediscretion to vary the basis of calculation and the performance targetsfor subsequent years.
The amount of the bonus pool that is distributed in any one year,and the relative proportions payable to each participant (or, at thediscretion of the Remuneration Committee, to a trust for his/herbenefit) will be at the discretion of the Remuneration Committee.Individual performance criteria have been agreed with each participant,which will be evaluated by the Remuneration Committee in determiningindividual allocations from the bonus pool.
The maximum bonus payable under the Bonus Plan for executivedirectors is 300% of salary. The highest level of bonus will only beavailable for truly outstanding performance. Bonuses will be payablein up to three tranches, as follows:
> the maximum bonus which any one participant is eligible to receivein cash will be limited to 100% of the individual’s base salary;
> any additional bonus up to a further 100% of base salary will bedeferred for a period of one year; and
> any remaining bonus will be deferred for a period of two years.
The deferred elements take the form of conditional awards of Xstratashares which vest subject to the participant remaining in employmentthroughout the deferral period. The number of shares awarded will bedetermined by reference to the market value of the shares at the dateconcurrent awards under the LTIP are made.
There is no intention to use newly issued ordinary shares for the BonusPlan and any shares required for the satisfaction of deferred bonuseswill be acquired by market purchase.
Other BenefitsIn 2008, following termination of discussions with Vale, and in lightof unprecedented approaches from executive recruitment firms, asmall group of senior executives whose particular skills and servicesthe Company was seeking to retain, were awarded a one-off retentionbonus payable in May 2009 conditional upon, amongst other things,their remaining in employment to and including 30 April 2009.
In order to facilitate travel to the Group’s operations, many of whichare located in remote locations not served by commercial flight routes,Xstrata leases a private aircraft to be used from time to time forbusiness travel by Group executive management. During the year,the Remuneration Committee approved the private use of leasedaircraft for Mick Davis, subject to any private usage not conflictingwith company requirements, for a limited number of hours perannum, not all of which were utilised in 2008.
Long Term Incentive ArrangementsAll equity-based awards are subject to an overall limitation on thenumber of shares issued, transferred from treasury, or that remainissuable pursuant to awards of 10% within any ten-year period afterthe listing date.
Added Value Incentive PlanThe Added Value Incentive Plan (the ‘AVP’) is designed to incentivisethe Chief Executive by providing a share of the long-term value hecreates for shareholders over and above the value created by Xstrata’speer companies and to create alignment with shareholders by meansof share ownership. The Remuneration Committee believes that theChief Executive has a unique role in delivering value to shareholders
Xstrata plc Annual Report 2008 99

through the efficient utilisation of Xstrata’s assets and by makingvalue-enhancing acquisitions and divestments. For this reason,membership of the AVP is restricted to the current Chief Executiveand any future successor in that role.
The Chief Executive’s participation in the AVP is contingent on hisbuilding up and maintaining a holding of at least 350,000 ordinaryXstrata shares.
The Chief Executive will not be eligible for awards under the Xstrataplc Long Term Incentive Plan (the ‘LTIP’) in any year when an AVPcycle commences.
Payments under the scheme will be based upon the growth inthe Company’s total shareholder return (‘TSR’) over the relevantperformance period relative to an index of global mining companies,which form the Xstrata TSR Index. Performance will be assessed overperiods of both three years (‘Phase 1’) and five years (‘Phase 2’) fromdate of award.
At the end of a Phase 1 performance period Xstrata TSR will becalculated and compared to the Xstrata TSR Index, and the AddedValue created over the performance period will be calculated.
If this figure is positive, it will be multiplied by a participationpercentage (which is 0.5% of the Added Value for the 2005 PlanCycle, 0.3% for the 2006 and 2007 Plan Cycles and 0.5% for the2008 Plan Cycle) to calculate the ‘Phase 1 Base Reward’. The maximumaggregate participation percentage for Plan Cycles commencing in anythree-year period cannot exceed 1.1%. No payments will be made ifXstrata underperforms the Xstrata TSR Index.
There is a cap which applies to the calculation at the end of the Phase 1performance period. If the cap has been applied then the ChiefExecutive will become eligible for Phase 2 of a Plan Cycle. At the endof the Phase 2 performance period the calculation will be carried outin the same way as at the end of Phase 1, but only to the extent thatperformance exceeds the applicable cap.
The Remuneration Committee recognises that the absolute valuereceived by shareholders is higher when outperforming a rising marketthan outperforming a market which is static or falling, therefore, twomodifiers are applied. Firstly, the Phase 1 and Phase 2 Base Rewardswill be increased or decreased in line with the Xstrata share price indexmeasured against the comparator group. Secondly, a reduction will be
made for lower levels of absolute performance, by applying a multiplierto the indexed Base Rewards to calculate the Final Rewards. For the2008 Plan Cycle and future plan cycles, for absolute TSR of 25% andabove a multiplier of 1 will be applied, for absolute TSR of -25% orbelow a multiplier of 0.5 will be applied. For the 2005, 2006 and 2007Plan Cycle, the multiplier for absolute TSR of -25% is 0. Between -25%and +25% straight-line interpolation will apply. Provided Xstrata’s TSRis at least equal to the TSR index, the Phase 1 Final Reward under eachPlan Cycle will be at least $1 million. The multiplier was adjusted forthe 2008 Plan Cycle and for future Plan Cycles as the RemunerationCommittee considered it was necessary in order to ensure that theAVP continues to offer an adequate incentive and reward formitigating shareholder losses in a falling market.
50% of the Final Reward for a Phase of a Plan Cycle shall be payablein cash or in shares, as determined by the Remuneration Committee,as soon as practicable following determination of the Final Rewardfor that Phase by the Remuneration Committee. Of the remaining50% of a Phase 1 Final Reward, 25% shall be deferred for a periodof one year and 25% shall be deferred for a period of two years.The remaining 50% of a Phase 2 Final Reward shall be deferredfor a period of one year.
The Xstrata TSR and Share Price Indices will be weighted by marketcapitalisation. The comparator group for each plan cycle comprisesrelevant global mining firms. These are shown below.
In the event of one or more constituents undergoing a take-over,merger, dissolution, variation in capital or any other event that willmaterially affect calculation of an Index, the Remuneration Committeeshall determine how this should be reflected in the Index calculation.The Remuneration Committee may add other relevant competitorsto the Index if required.
In the event of a change of control, all open Plan Cycles will vestimmediately. The Final Reward under each open Plan Cycle will becalculated as if the performance period terminated on the date of thetransaction save that the Committee has discretion to disapply thecap that would otherwise apply in the calculation of Phase 1 ExcessReturn. In the event of the Chief Executive ceasing to be an Xstrataemployee as a result of death, ill health or disability, all open PlanCycles will vest immediately. The Final Reward under each open PlanCycle will be calculated as if the performance period terminatedon the date of cessation of employment. In the event of the Chief
100 Xstrata plc Annual Report 2008
Governance:Remuneration Report continued
Comparator group for the TSR and Share Price Indices
2005 2006 2007 2008 2009
Alcoa Inc As for 2005 As for 2006 As for 2007 As for 2008Alcan Inc but excluding: but excluding: but excluding: but excluding:Anglo American plc Elkem ASA Inco Limited Alcan Inc Coal & Allied Industries LtdArch Coal Inc Falconbridge Limited Lonmin plcBHP Billiton plc Phelps Dodge Corp Umicore SACoal & Allied Industries Ltd And including:Elkem ASA Companhia ValeEramet SA do Rio Doce (Vale)Grupo Mexico SA de CV Vedanta Resources plcInco Ltd Freeport McMoRanKorea Zinc Inc Copper & Gold IncLonmin plc MMC Norilsk NickelFalconbridge Ltd Impala Platinum Holdings LtdNorddeutsche Affinerie AGPeabody Energy CorpPhelps Dodge CorpRio Tinto plcTeck Cominco LtdUmicore SA

Xstrata plc Annual Report 2008 101
Executive ceasing to be an Xstrata employee other than in thecircumstances described above, all Plan Cycles will lapse and nopayments will be made unless the Remuneration Committee in itsabsolute discretion determines otherwise. In the event of a variationin the capital of Xstrata, the Participation Percentages may be adjustedin such a way as the Remuneration Committee determines.
The Added Value Incentive plan will terminate on 9 May 2010,after which no further awards will be granted.
2005 AVP cyclePhase 1 of the 2005 cycle vested on 9 May 2008 when the increaseof Xstrata’s TSR was 404.26%, the growth of the Xstrata TSR Indexwas 238.16% and the growth of the Xstrata Price Index was 220.65%.This performance represents an outperformance of 166.10%. As aresult, the cap was applied to the Phase 1 Added Value and Phase 2was triggered. As at 31 December 2008, it is not expected any paymentwill be made under Phase 2 of the 2005 Plan Cycle, however, thedetermination of final reward will be made at the end of the Phase 2performance period on 9 May 2010. For further information pleasesee page 106.
2006 AVP cycleAs at 31 December 2008, the decrease of Xstrata’s TSR was 62.29%,the decrease of the Xstrata TSR index was 32.62%, and the decreaseof the Xstrata Share Price Index was 36.31%, as calculated under theAVP for the 2006 Plan Cycle. This performance represents an under-performance of 29.67%. If this is the outcome at the end of thethree-year period no payment will be made under the plan.
2007 AVP cycleAs at 31 December 2008, the decrease of Xstrata’s TSR was 79.35%,the decrease of the Xstrata TSR index was 47.92%, and the decreaseof the Xstrata Share Price Index was 49.90%, as calculated under theAVP for the 2007 Plan Cycle. This performance represents an under-performance of 31.43%. If this is the outcome at the end of thethree-year period no payment will be made under the plan.
2008 AVP cycleAs at 31 December 2008, the decrease of Xstrata’s TSR was 87.23%,the decrease of the Xstrata TSR index was 66.51%, and the decreaseof the Xstrata Share Price Index was 67.21%, as calculated under theAVP for the 2008 Plan Cycle. This performance represents an under-performance of 20.72%. If this is the outcome at the end of thethree-year period no payment will be made under the plan.
Long Term Incentive PlanExecutive directors are eligible to participate in the Long TermIncentive Plan (the ‘LTIP’). The LTIP aims to focus management’sattention on continuous and sustainable improvements in theunderlying financial performance of the Group and on the deliveryof superior long-term returns to Xstrata’s shareholders by providingexecutives with the opportunity to earn superior levels of rewardfor outstanding performance. In addition, the LTIP further aligns theinterests of shareholders and management by encouraging executivesto build a shareholding in the Group.
The LTIP provides for the grant of both contingent awards of freeshares (‘Free Share Awards’) and share options on the same occasionto the same individual. The two elements are complementary andensure that the cyclical nature of the industry does not have anexcessively adverse effect on employee remuneration in circumstanceswhere the performance of the Group has otherwise been good,relative to that of competitors.
The Free Share Awards will ensure that where the Group hasperformed well over the specified performance period, participantswill be rewarded even if there is no substantial share price growth dueto external factors, such as commodity prices or general economic
conditions. The option element will only provide a benefit toparticipants when shareholders also benefit from future shareprice growth. The options will be subject to stretching performancetargets to ensure that windfall growth in the share price as a resultof external factors does not deliver rewards which are not justified bythe performance of the Group, relative to its peer group. The policyregarding performance targets is discussed in more detail below.
The number of ordinary shares over which options will be grantedwill be calculated using a binomial valuation of the option (or a similarapproach) which the Remuneration Committee considers representsboth the cost to Xstrata of providing the benefit and the value ofthe option itself as a component of the total remuneration package.The option value at grant will be subject to a lower and upper limitas determined by the Remuneration Committee from time to time.In determining the value of Free Share Awards, the value of theunderlying shares will be used.
Using the method above, the value ratio of Free Share Awards toshare options for awards made during 2008 was in general 1:1, basedon the value at the time of grant. The Remuneration Committee maychange the ratio for future awards if it is thought appropriate.
The Remuneration Committee has determined that annual awards willbe made under the LTIP to minimise the impact of share price volatilityand to reflect existing best practice. The rules of the LTIP provide that theaggregate value of options and Free Share Awards made to an individualin any one year may not exceed an amount equal to two times basesalary in normal circumstances (although, in exceptional circumstances,the limit may be up to, but may not exceed, four times base salary).
Summary of performance conditionsDuring 2006, 2007 and 2008, executive directors were grantedmarket value options and Free Share Awards under the LTIP. Thevesting of both the options and Free Share Awards is subject to thesatisfaction of stretching performance conditions over a three-yearperformance period. Half of the options and Free Share Awards areconditional on TSR relative to a peer group and half are conditionalon the Group’s real cost savings relative to targets set on a stretchingscale over the three-year period, as follows:
For the awards conditional on TSR, 25% of the combined award willvest if TSR growth is at the median of the specified peer group, thefull 50% of the combined award will vest for performance at or abovethe second decile with straight-line vesting between these points.No vesting will occur for TSR growth below median performance.
For the remaining award, vesting is conditional on the Group’s realcost savings relative to targets set on a stretching scale: 5% of thecombined award will vest for 1% cost savings, 35% for 2% costsavings and 50% for 3% or more cost savings, with straight-linevesting between these points. No vesting will occur for cost savingsthat are less than 1%. Real cost savings will be measured in relationto operating costs after adjusting for the effects of inflation, excludingdepreciation, commodity price-linked costs, effects of currencies ontranslation of local currency costs and planned life of mine adjustments.
Since the Group’s share price and those of its peers are significantlyinfluenced by the cycle in commodity prices, the RemunerationCommittee considers TSR relative to a peer group to be an appropriateperformance measure as it rewards relative success in growingshareholder value through the development and execution of thecorporate strategy. The Remuneration Committee is also satisfied thatTSR will be a genuine reflection of the Group’s underlying financialperformance. The use of the second measure, Group real cost savingsrelative to targets, reflects the Group’s strategic initiative to addshareholder value through productivity and cost efficiencies. Furthermore,the use of a financial performance measure alongside a relative TSRmeasure is aligned with current corporate governance best practice.

The performance targets are not capable of being retested at the end ofthe performance period, so that any proportion of a Free Share Awardor option which does not vest after three years will lapse, althoughvested options will remain exercisable for a maximum of seven yearsor such shorter period as the Remuneration Committee may specify(after which they will lapse).
In the event of a change of control, all Free Share Awards and optionswill vest in full or (in certain circumstances) may be exchanged forequivalent options or LTIP awards over shares in the acquiring company.
The peer group of global mining companies used to determine thevesting of the options and Free Share Awards conditional on TSR underthe LTIP, comprises the same comparator group used to form the XstrataShare Indices for the CEO’s Added Value Incentive Plan for the relevantyear detailed above. The Remuneration Committee may, at its absolutediscretion, vary, add, remove or alter the companies making up the peergroup where events happen which cause the Remuneration Committeeto consider that such a change is appropriate to ensure that theperformance condition continues to represent a fair measure ofperformance. This is provided that the Remuneration Committeereasonably considers such a varied or amended performance conditionis not materially easier or more difficult to satisfy.
In calculating the TSR, the common currency of US dollars will be usedand the share price of a notional parcel of shares of the Group and thecompanies in the specified peer group will be averaged over a periodpreceding both the start and end of the relevant performance period.The Remuneration Committee has resolved that averaging over a three-month period eliminates the volatility in spot share prices that couldotherwise distort the assessment of whether the target has been met.
The TSR of the Group and each member of the peer group overany performance period is calculated by taking the growth betweenthe closing value and the base value of 100 shares expressed as apercentage of the base value, on the assumption that any net dividendper share paid by any company during the relevant performanceperiod is reinvested in shares on the last day of the month duringwhich the relevant shares go ex-dividend. This calculation is subject tosuch adjustments to closing value and base value as the RemunerationCommittee considers appropriate to reflect any variation of sharecapital or any merger, takeover, reconstruction, demerger or changein listing status by any member of the peer group or upon any otherevents which the Remuneration Committee considers may materiallydistort the calculation.
2006 LTIP AwardAt 31 December 2008, the Group was ranked 15th out of the peergroup of 19 companies (including Xstrata) in terms of TSR for the 2006award. If this is the outcome at the end of the three-year performanceperiod then 0% of each executive director’s 2006 award linked to TSRwill vest.
2007 LTIP AwardAt 31 December 2008, the Group was ranked 14th out of the peergroup of 16 companies (including Xstrata) in terms of TSR for the 2007award. If this is the outcome at the end of the three-year performanceperiod then 0% of each executive director’s 2007 award linked to TSRwill vest.
2008 LTIP AwardAt 31 December 2008, the Group was ranked 15th out of the peergroup of 15 companies (including Xstrata) in terms of TSR for the 2008award. If this is the outcome at the end of the three-year performanceperiod then 0% of each executive director’s 2008 award linked to TSRwill vest.
It should be noted that these amounts are based on the Group’sresults at this provisional stage and do not necessarily reflect theeventual outcome.
Subsisting Rights under Xstrata AG Share SchemesSubsisting options held by Mick Davis pursuant to terms on whichthey were recruited are held on terms which reflect the provisions ofthe Management and Employee Share Incentive Scheme previouslyoperated by Xstrata AG, except as expressly provided otherwise. Theseoptions were converted into equivalent options over ordinary shares inthe Group at the time of the listing of the Group’s shares on the LondonStock Exchange (‘the Listing’) but otherwise continue to be subject tothe terms and conditions (as modified) of the original Xstrata AG sharescheme. It is intended that the options will as far as possible be satisfiedby the transfer of ordinary shares in the Group held by the trustees ofthe Xstrata Employee Share Ownership Trust and the Xstrata Employeeand Directors Share Ownership Trust. Whilst subsisting options continueto exist under this scheme, no future grants will be made. Subsistingoptions are not subject to performance conditions because they wereoriginally granted under arrangements (which did not provide forawards to be subject to performance) which related to Xstrata AGprior to the Group becoming a UK listed company.
Performance Graph
The performance graph set out above shows the TSR for a holdingof shares of the Group for the five years ended 31 December 2008compared with the TSR for a hypothetical holding of shares of the samekinds and number as those by reference to which the FTSE 100 index iscalculated. The Board considers that the FTSE 100 currently representsthe most appropriate of the published indices for these purposes.
TSR has been calculated assuming that an equivalent sum wasinvested in shares of the Group and in the FTSE 100 index.
Dividends are invested in additional shares and benefits receivablein the form of shares are also added to the relevant holding.
PensionsMick Davis and Trevor Reid have participated in money purchaseretirement plans from their respective dates of joining the Group. Theplans are designed having regard to the taxation and employmentstatus of each executive.
Group contributions are reassessed at regular intervals and are basedon actuarial advice with the objective of accumulating sufficient fundsover the working lifetime of each executive to provide an overalltarget pension which is currently intended to be equivalent toapproximately 60% of final salary at normal retirement age forexecutives who begin participating in the plans at the age of 40. Priorto 6 April 2006, these contributions were paid to a combination of anapproved money purchase pension plan and a Funded UnapprovedRetirement Benefits Scheme (FURBS). From 6 April 2006, contributionshave been made through a combination of payments to a registeredpension plan and cash sums to each executive, having regard to thetax limits on contributions and benefits from registered UK pension plans(with only cash payments being made after 2007). The actual benefitspayable from the pension plans will be based on the amount which has
FTSE 100 Xstrata
0
100
200
300
400
500
600
0807060504
GBP
102 Xstrata plc Annual Report 2008
Governance:Remuneration Report continued

accumulated in that member’s money purchase accounts. No employeecontributions are currently payable by Mick Davis and Trevor Reid.
As noted above, Santiago Zaldumbide receives no pension benefitsunder the terms of his professional services agreement.
External AppointmentsExecutive directors are not permitted to hold external directorshipsor offices without the approval of the Board. Santiago Zaldumbide,having gained the approval of the Board, held a directorship withThyssenKrupp SA. He was also a member of the Supervisory Boardof Air Products and Chemicals, Inc. In total, the remuneration receivedby Santiago Zaldumbide, in relation to his positions in these companies,amounted to EUR49,943.
Non-Executive DirectorsThe level of fees for non-executive directors is set at the level considerednecessary to obtain the services of individuals with the relevant skills andexperience to bring added depth and breadth to the composition ofthe Board.
Non-executive directors’ fees are reviewed annually by the Chairmanand the Chief Executive in the light of fees payable to non-executivedirectors of comparable companies and the importance attached tothe retention and attraction of high calibre individuals as non-executive directors.
Non-executive directors are eligible to forgo all or part of their Directors’fees to acquire shares in the Group, after deduction of applicableincome tax and social security contributions.
The non-executive directors do not, and will not in the future,participate in the Bonus Plan or LTIP or any other performance-relatedincentive arrangements which may be introduced from time to time.
Entitlements under Service ContractsExecutive DirectorsMick Davis and Trevor Reid have employment agreements with XstrataServices (UK) Limited (‘XSL’) effective from 1 February 2002 which arefor fixed terms of one year. However, their services as Chief Executiveand Chief Financial Officer respectively are provided to the Groupunder a secondment agreement entered into between the Groupand XSL on 19 March 2002. Each of Mick Davis and Trevor Reid isseconded to the Group for a fixed term of two years thereafterrenewable by either party for further periods of two years.
The employment of Mick Davis and Trevor Reid may be terminatedby not less than 12 months’ notice by XSL or the director concerned orby a payment in lieu of notice by XSL. On termination of employmentby XSL in breach, including on a change of control, or if Mick Davis orTrevor Reid resigns in circumstances where they cannot in good faithbe expected to continue in employment, each director is entitled to bepaid a sum equal to 100% of his annual salary plus pension and otherbenefits and his previous year’s bonus (plus any accrued basic salaryand expenses) and to have all entitlements under his retirementbenefit plans paid in accordance with the plan rules. As both MickDavis and Trevor Reid participate in defined contribution arrangementsit is not expected that any significant additional liability would arise inrespect of retirement plan entitlements beyond that already accruedin the accounts. For the purposes of calculating termination payments,annual bonus will be capped at 300% of annual salary.
In addition, each of the executive directors is eligible to participate in theBonus Plan which provides that deferred amounts up to an aggregateceiling of 200% of salary remain payable in the event of cessation ofemployment by reason of death, injury, ill health or disability (in whichcase they are payable immediately) or retirement (in which case they arepayable on the normal vesting date). No deferred amounts are payable inthe event of cessation by dismissal for cause. In the case of terminationby reason of death, injury, ill health or disability before the date the
bonus is awarded for a financial year, or if the RemunerationCommittee in its discretion so resolves, a proportion of the annualbonus pool may still be awarded subject to the normal discretionof the Remuneration Committee.
Executive directors are entitled to any outstanding LTIP awardson cessation of employment by reason of death, injury, ill healthor disability (in which case they are payable immediately in full) orretirement (in which case they are payable on the normal vestingdate to the extent they vest for performance at that time).
On termination of the professional services agreement dated 23 July2007, other than on his voluntary termination or termination for grossnegligence, Santiago Zaldumbide is entitled to be paid a sum equalto 100% of his annual salary and other benefits and his previousyear’s bonus (plus any accrued basic salary and expenses). SantiagoZaldumbide is engaged as a director of Xstrata plc on the terms of aletter of appointment dated 18 March 2002. Santiago Zaldumbide willreceive no additional remuneration for his position as director of Xstrataplc and is not entitled to any compensation in respect of the terminationof his office as a director of Xstrata plc.
Non-Executive DirectorsWilly Strothotte is engaged by the Group as a non-executivedirector and Chairman on the terms of a letter of appointment.The appointment was for an initial fixed term of 36 months whichcommenced on 25 February 2002 and is now terminable by sixmonths’ notice by Willy Strothotte.
The Group may terminate Willy Strothotte’s appointment at any timeand on such termination Willy Strothotte will not be entitled to anycompensation for loss of office. The term may be renewed by the Board.
David Rough is engaged by the Group as the senior independent non-executive director and deputy Chairman on the terms of a letter ofappointment. The appointment was for an initial fixed term of 36months which commenced on 1 April 2002 and is now terminableby six months’ notice by David Rough.
The Group may terminate David Rough’s appointment at any timeand on such termination David Rough will not be entitled to anycompensation for loss of office. The term may be renewed by the Board.
Ivan Glasenberg, Paul Hazen, Robert MacDonnell and Sir Steve Robsonare each engaged by the Group as a non-executive director on theterms of a letter of appointment. Each appointment was for an initialfixed term of 36 months which commenced on 25 February 2002 andis now terminable by six months’ notice by the non-executive director.
Ian Strachan is engaged by the Group as a non-executive director onthe terms of a letter of appointment. The appointment was for aninitial fixed term of 36 months which commenced on 8 May 2003and is now terminable by six months’ notice by Ian Strachan.
Claude Lamoureux is engaged by the Group as a non-executivedirector on the terms of a letter of appointment commencing on6 May 2008. The appointment is terminable by six months’ noticeby Claude Lamoureux.
The Group may terminate each non-executive director’s appointmentat any time and on such termination the non-executive director willnot be entitled to any compensation for loss of office. Each term maybe renewed by the Board.
There is no arrangement under which a director has agreed to waivefuture emoluments nor have there been any such waivers during thefinancial year.
There are no outstanding loans or guarantees granted or provided byany member of the Group to or for the benefit of any of the directors.
No significant awards have been made in the financial year to anypast director.
Xstrata plc Annual Report 2008 103

Emoluments and compensation – amounts in $The emoluments and compensation in respect of qualifying services of each person who served as a director during the year were as follows:
Health, life Year endedand private 31 December
Salary Deferred555 Housing medical Other 2007and fees1 Bonus5a bonus555 allowances insurance benefits Total Total
Director US$ US$5a US$555 US$ US$ US$ US$ US$
Executives
Mick Davis 2,315,0002 0 2,701,5305a* 183,0006a 197,9167 108,1119 5,505,557 9,154,577
Trevor Reid 1,157,5002 0 1,348,9775a* 141,6606b 25,5768 2,673,713 4,297,029
Santiago Zaldumbide 1,370,9723 0 1,796,5225b* 3,167,494 5,156,1683
Non-executives
Willy Strothotte 448,1844 448,184 440,440
Paul Hazen 162,9764 162,976 160,160
Robert MacDonnell 162,9764 162,976 160,160
Claude Lamoureux 162,9764 162,976 0
Ivan Glasenberg 162,9764 162,976 160,160
Sir Steve Robson CB 201,6834 201,683 198,198
David Rough 315,7664 315,766 310,310
Ian Strachan 203,7204 203,720 200,200
6,664,7294 055a 5,847,02955a 324,660 223,4927 7108,111 13,168,021 20,237,402
Notes1. Salary and fees includes non-executive directors’ fees which may be paid in shares.2. In 2008, Mick Davis’s and Trevor Reid’s salaries were set and paid in UK pounds sterling. The salary figures above have been converted to US dollars based on
the average pound/dollar exchange rate for the year of 1.852 (2007: 2.002) and therefore reflect the impact of the exchange rate fluctuations during the year.3. In 2008, Santiago Zaldumbide’s basic salary and benefits were set and paid in Euros. The figures above have been converted to US dollars based on the average
euro/dollar exchange rate for the year of 1.471 (2007: 1.371) and therefore reflect the impact of the exchange rate fluctuations during the year.4. All non-executive director fees except those for Ian Strachan, Claude Lamoureux and Steve Robson were set in UK pounds sterling. Ian Strachan’s fees were set in UK
pounds sterling, and paid in US dollars. Steve Robson’s fees were set in UK pounds sterling and paid in Euros except for the 2nd quarter fees which were paid in UKpounds sterling. Claude Lamoureux’s fees were set in UK pounds sterling and paid in Canadian dollars. The figures above have been converted to US dollars basedon the average pound/dollar exchange rate for the year of 1.852 (2007: 2.002) and therefore reflect the impact of the exchange rate fluctuations during the year.
5. Entitlement to participate in Xstrata’s Executive Bonus Plan is dependent on a bonus pool determined by the achievement of annual objectives measured by return onequity and net profit. While these financial measures were highly creditable in 2008, the Remuneration Committee has decided that bonus levels normally awardedbased on the 2008 pool would not be appropriate given the current economic situation. Bonus amounts have therefore been substantially reduced from the amountsthat would normally be payable based on the Group’s performance in 2008. Further, management has recommended to the Remuneration Committee that no cashpayments be made in respect of the 2008 executive bonuses and the total award be deferred in shares for one year.
5a. These bonuses are those awarded in March 2009 in relation to the 2008 performance year. Bonuses were awarded in UK pounds sterling and converted at a rate of1.411, the exchange rate prevailing at the on the date of the award. These amounts also include $56,093 and $26,258 in respect of dividend equivalents awardedduring the year in respect of prior years’ deferred bonus awards which vest on the date of the underlying award for Mick Davis and Trevor Reid respectively.
5b. This bonus relates to that awarded in March 2009 in relation to the 2008 performance year. The bonus was awarded in Euros and converted at a rate of 1.262, theexchange rate prevailing on the date of the award. The amount also includes $32,805 in respect of dividend equivalents awarded during the year in respect of prioryears’ deferred bonus awards which vest on the date of the underlying award for Santiago Zaldumbide.
6a. In 2008, Mick Davis’s housing allowance was awarded and paid in US dollars.6b. In 2008, Trevor Reid’s housing allowance was awarded in US dollars and paid in UK pounds sterling.7. In 2008, Mick Davis’s benefits were set and paid in UK pounds sterling. The benefits been converted to US dollars based on the average pound/dollar exchange rate for
the year of 1.852 (2007: 2.002) and therefore reflects the impact of the exchange rate fluctuations during the year. This includes an amount for life insurance of GBP89,958.8. In 2008, Trevor Reid’s benefits were set and paid in UK pounds sterling. The benefits have been converted to US dollars based on the average pound/dollar exchange rate
for the year of 1.852 (2007: 2.002) and therefore reflects the impact of the exchange rate fluctuations during the year. This includes an amount for life insurance of GBP10,796.9. In order to facilitate travel to the Group’s operations, many of which are located in remote locations not served by commercial flight routes, Xstrata leases private aircraft
to be used from time to time for business travel by Xstrata executives. During the year, the Remuneration Committee approved the private use of leased aircraft forMick Davis, subject to any private usage not coinciding with company requirements, for a limited number of hours per annum, not all of which were utilised in 2008.The benefit shown above has been calculated based on marginal flight costs for the hours used and converted to US dollars at the average pound/dollar exchange rate.
10. No consideration has been paid to or is receivable by third parties for making available the qualifying services of any directors during the year or in connection with themanagement affairs of Xstrata.
Deferred BonusesDeferred bonus payable in shares and deferred for one year. The number of shares awarded pursuant to deferred bonuses payable in shares is determined by reference tothe market value of the shares at the date concurrent awards under the LTIP are made. The amount also includes $56,093, $26,258 and $32,805 in respect of dividendequivalents accrued during the year in respect of prior years’ deferred bonus awards which will vest on the date of the underlying award for Mick Davis, Trevor Reid andSantiago Zaldumbide respectively.
Information subject to audit – year ended 31 December 2008
104 Xstrata plc Annual Report 2008
Governance:Remuneration Report continued

Share optionsDetails of share options of those directors who served during the year are as follows:
Lapsed/expired At 31 Dec Exercise Earliest date ExpiryAt 1 Jan 2008 Awarded unexercised Exercised 2008 price of exercise date
Mick Davis
Service Contract Arrangements 496,997 496,997 £3.84 1 Oct 05 1 Oct 12
Service Contract Arrangements 496,997 496,997 £4.22 1 Oct 06 1 Oct 13
LTIP Options 374,516 374,516 £3.22 10 Feb 06 10 Feb 13
LTIP Options 770,482 770,482 £6.58 5 Mar 07 5 Mar 14
Trevor Reid
Service Contract Arrangements 148,498 148,498 0 £5.68 15 Jan 07 15 Jan 14
LTIP Options 327,454 151,502 175,952 £6.58 5 Mar 07 5 Mar 14
LTIP Options 214,647 214,647 £9.49 11 Mar 08 11 Mar 15
LTIP Options 133,357 133,357 £15.37 10 Mar 09 10 Mar 16
LTIP Options 104,413 104,413 £24.00 15 Mar 10 15 Mar 17
LTIP Options 0 106,058 106,058 £35.36 4 Apr 11 4 Apr 18
Santiago Zaldumbide
LTIP Options 247,112 247,112 0 £9.49 11 Mar 08 11 Mar 15
LTIP Options 132,614 132,614 £15.37 10 Mar 09 10 Mar 16
LTIP Options 102,424 102,424 £24.00 15 Mar 10 15 Mar 17
LTIP Options 0 100,871 100,871 £35.36 4 Apr 11 4 Apr 18
3,549,511 206,929 0 547,112 3,209,328
Notes1. No options, other than the LTIP options, are subject to performance conditions as explained above. Details of the LTIP performance conditions are described above.2. Mick Davis’s and Trevor Reid’s LTIP options may be settled in cash at the discretion of the Remuneration Committee.3. The highest and lowest prices of the Company’s shares during the year were GBP44.20 and GBP5.75 respectively (2007: GBP37.38 and GBP22.43).
The price at the year end was GBP6.40 (2007: GBP35.50).4. On 9 June 2008, Trevor Reid exercised his option over 148,498 shares. The market value of an Xstrata share on the date of exercise was GBP41.57, and a gain
of GBP5,329,593 was realised.5. On 9 June 2008, Trevor Reid exercised his option over 51,502 shares. The market value of an Xstrata share on the date of exercise was GBP41.57, and a gain
of GBP1,802,055 was realised.6. On 10 June 2008, Trevor Reid exercised his option over 100,000 shares. The market value of an Xstrata share on the date of exercise was GBP42.02, and a gain
of GBP3,544,000 was realised.7. On 23 April 2008, Santiago Zaldumbide exercised his option over 100,000 shares. The market value of an Xstrata share on the date of exercise was GBP40.73,
and a gain of GBP3,124,000 was realised.8. On 16 May 2008, Santiago Zaldumbide exercised his option over 147,112 shares. The market value of an Xstrata share on the date of exercise was GBP43.43,
and a gain of GBP4,992,981 was realised.
Xstrata plc Annual Report 2008 105

SharesDetails of the Company’s ordinary shares over which those directors who served during the year have conditional rights under the LTIP are as follows:
End ofthe periodfor interimqualifying
Scheme interest conditions to Lapsed/ At 31 DecDirector at 1 Jan 2008 Awarded be fulfilled expired Vested 2008
Mick Davis
Added Value Plan – 2005 Cycle Phase 1 – 1 year deferral 641,273 * 9-May-08 641,273
Added Value Plan – 2005 Cycle Phase 1 – 2 year deferral 641,273 * 9-May-08 641,273
Added Value Plan – 2005 Cycle Phase 2 *
Added Value Plan – 2006 Cycle * 10-Mar-09
Added Value Plan – 2007 Cycle * 15-Mar-10
Added Value Plan – 2008 Cycle * 26-Mar-11
Deferred Bonus 46,348 23-Feb-08 † 46,348 3 0
Deferred Bonus 41,664 26-Feb-08 † 41,664 4 0
Deferred Bonus 41,664 26-Feb-09 41,664
Deferred Bonus 0 31,109 26-Feb-09 31,109
Deferred Bonus 0 31,109 26-Feb-10 31,109
Trevor Reid
LTIP 64,394 11-Mar-08 † 64,394 5 0
LTIP 40,006 10-Mar-09 40,006
LTIP 31,324 15-Mar-10 31,324
LTIP 0 31,817 4-Apr-11 31,817
Deferred Bonus 7,279 23-Feb-08 † 7,279 3 0
Deferred Bonus 19,611 26-Feb-08 † 19,611 4 0
Deferred Bonus 19,611 26-Feb-09 19,611
Deferred Bonus 0 14,509 26-Feb-09 14,509
Deferred Bonus 0 14,509 26-Feb-10 14,509
Santiago Zaldumbide
LTIP 74,134 11-Mar-08 † 74,134 5 0
LTIP 39,784 10-Mar-09 39,784
LTIP 30,727 15-Mar-10 30,727
LTIP 0 30,261 4-Apr-11 30,261
Deferred Bonus 8,663 23-Feb-08 † 8,663 3 0
Deferred Bonus 23,185 26-Feb-08 † 23,185 4 0
Deferred Bonus 23,185 26-Feb-09 23,185
Deferred Bonus 0 18,762 26-Feb-09 18,762
Deferred Bonus 0 18,762 26-Feb-10 18,762
511,579 1,473,384 0 285,278 1,699,685
† The actual date of vesting was 26 March 2008Notes1. Details of performance conditions are described above.2. The market value of a share on the date of award under the LTIP and the Deferred Bonus on 4 April 2008 was GBP35.36.3. These shares were awarded on 23 February 2006 when the closing market price was GBP15.44. The closing market price on the date of vesting was GBP35.22.4. These shares were awarded on 26 February 2007 when the closing market price was GBP26.56. The closing market price on the date of vesting was GBP35.22.5. These shares were awarded on 11 March 2005 when the closing market price was GBP9.38. The closing market price on the date of vesting was GBP35.22.
*2005-2008 Added Value PlanDeferred elements of the Xstrata AVP may be settled in cash or shares on vesting. For the performance period from 9 May 2005 to 9 May 2008, Xstrata’s total shareholderreturn (TSR) was 404.26%, representing outperformance of 166.1% over TSR performance of 238.16% for Xstrata TSR Index of global mining companies. On 9 May 2008,an award was made in respect of the cash settlement of Phase 1 of the Xstrata AVP 2005 Plan Cycle of GBP53,489,537. For the AVP 2005 cycle the participation percentagewas 0.5% and the market capitalisation on date of award was GBP6,026,084,544.
Subsequent periodsFor the AVP 2006 cycle the participation percentage was 0.3% and the market capitalisation on date of award was GBP10,692,600,350. For the AVP 2007 cycle, theparticipation percentage was 0.3% and the market capitalisation on date of award was GBP23,442,174,802. For the AVP 2008 cycle, the participation percentage was 0.5%and the market capitalisation on the date of award was GBP38,029,287,854.
106 Xstrata plc Annual Report 2008
Governance:Remuneration Report continued

PensionsMick Davis and Trevor Reid have participated in defined contribution retirement benefit plans.
During the year, pension related payments of pension plan, FURBS, and non-pensionable salary supplement payments were made as follows:
2008 2007 2008 2007 2008 2007Mick Davis Mick Davis Trevor Reid Trevor Reid Total Total
US$ US$ US$ US$ US$ US$
Pension-related payments 3,976,157 3,294,113 2,644,608 1,442,173 6,620,765 4,736,286
Notes1. Further details of the pension arrangements are explained above.2. Santiago Zaldumbide received no pension benefits under the terms of his fixed cost remuneration arrangement which is detailed above.3. Based on the average UK pound/US dollar exchange rate for the year of 1.852 (2007: 2.002). Payments to Mick Davis and Trevor Reid in both years were made in UK
pounds sterling.
Approved by the Board and signed on its behalf by
Willy StrothotteChairman2 March 2009
Xstrata plc Annual Report 2008 107

108 Xstrata plc Annual Report 2008

Xstrata plc Annual Report 2008 109
5
Zinc balls produced at San Juan de Nievain Spain, which operates in the firstquartile of the industry cost curve andis the world’s largest zinc smelter
<
110 Group Financial Statements110 Statement of Directors’
Responsibilities111 Independent Auditors’ Report112 Consolidated Income Statement113 Consolidated Balance Sheet115 Consolidated Cash Flow Statement116 Consolidated Statement of
Recognised Income and Expense117 Notes to the Financial Statements199 Parent Company Financial
Statements and Related Information199 Statement of Directors’
Responsibilities200 Independent Auditors’ Report201 Balance Sheet202 Notes to the Financial Statements208 Shareholder InformationIBC Cautionary Note
Financialstatements

Statement of Directors’ Responsibilities in Relation to the Group Financial Statements
110 Xstrata plc Annual Report 2008
The directors are responsible for preparing the Annual Report andthe Group financial statements in accordance with applicable UnitedKingdom law and those International Financial Reporting Standardsas adopted by the European Union.
The directors are required to prepare Group financial statements foreach financial year which present fairly the financial position of theGroup and the financial performance and cash flows of the Groupfor that period. In preparing those Group financial statements thedirectors are required to:
> select suitable accounting policies in accordance with IAS 8:‘Accounting Policies, Changes in Accounting Estimates and Errors’and then apply them consistently;
> present information, including accounting policies, in a mannerthat provides relevant, reliable, comparable and understandableinformation;
> provide additional disclosures when compliance with the specificrequirements in IFRS is insufficient to enable users to understandthe impact of particular transactions, other events and conditionson the Group’s financial position and financial performance;
> state that the Group has complied with IFRSs, subject to anymaterial departures disclosed and explained in the financialstatements; and
> prepare the accounts on a going concern basis unless, havingassessed the ability of the Group to continue as a going concern,management either intends to liquidate the entity or to ceasetrading, or have no realistic alternative but to do so.
The directors are responsible for keeping proper accounting recordswhich disclose with reasonable accuracy at any time the financialposition of the Group and enable them to ensure that the Groupfinancial statements comply with the Companies Act 1985 and Article 4of the IAS Regulation. They are also responsible for safeguardingthe assets of the Group and hence for taking reasonable steps forthe prevention and detection of fraud and other irregularities.
Under applicable United Kingdom law and regulations the directorsare responsible for the preparation of a Directors’ Report, Directors’Remuneration Report and Corporate Governance Report that complywith that law and regulations. In addition, the directors are responsiblefor the maintenance and integrity of the corporate and financialinformation included on the Company’s website. Legislation in theUK governing the preparation and dissemination of financialstatements may differ from legislation in other jurisdictions.
Under the requirements of Chapter 4 of the Disclosure and TransparencyRules, the directors are responsible for including a fair review of thedevelopment and performance of the business and the position of theGroup taken as a whole, together with a description of the principalrisks and uncertainties that they face.
We have audited the Group financial statements of Xstrata plc forthe year ended 31 December 2008 which comprise the Group IncomeStatement, the Group Balance Sheet, the Group Cash Flow Statement,the Group Statement of Recognised Income and Expense and therelated notes 1 to 38. These Group financial statements have beenprepared under the accounting policies set out therein.
We have reported separately on the parent company financialstatements of Xstrata plc for the year ended 31 December 2008and on the information in the Directors’ Remuneration Report thatis described as having been audited.
This report is made solely to the Company’s members, as a body, inaccordance with Section 235 of the Companies Act 1985. Our auditwork has been undertaken so that we might state to the Company’smembers those matters we are required to state to them in anauditors’ report and for no other purpose. To the fullest extentpermitted by law, we do not accept or assume responsibility to anyone,other than the Company and the Company’s members as a body, forour audit work, for this report, or for the opinions we have formed.
Respective responsibilities of directors and auditorsThe directors’ responsibilities for preparing the Annual Report andthe Group financial statements in accordance with applicable UnitedKingdom law and International Financial Reporting Standards (IFRSs)as adopted by the European Union are set out in the Statement ofDirectors’ Responsibilities.
Our responsibility is to audit the Group financial statements inaccordance with relevant legal and regulatory requirements andInternational Standards on Auditing (UK and Ireland).
We report to you our opinion as to whether the Group financialstatements give a true and fair view and whether the Group financialstatements have been properly prepared in accordance with theCompanies Act 1985 and Article 4 of the IAS Regulation. We alsoreport to you whether in our opinion the information given in theDirectors’ Report is consistent with the financial statements. Theinformation given in the Directors’ Report includes that specificinformation presented in the Operating Review and FinancialReview that is cross referred from the Directors’ Report.
In addition we report to you if, in our opinion, we have not receivedall the information and explanations we require for our audit, or ifinformation specified by law regarding directors’ remuneration andother transactions is not disclosed.
We review whether the Corporate Governance Statement reflects theCompany’s compliance with the nine provisions of the 2006 CombinedCode specified for our review by the Listing Rules of the FinancialServices Authority, and we report if it does not. We are not requiredto consider whether the Board’s statements on internal control cover allrisks and controls, or form an opinion on the effectiveness of the Group’scorporate governance procedures or its risk and control procedures.
We read other information contained in the Annual Report andconsider whether it is consistent with the audited Group financialstatements. The other information comprises only the Directors’Report, the Chairman’s Statement, the Operating and FinancialReview and the Corporate Governance Statement and that part ofthe Directors’ Remuneration Report that is unaudited. We considerthe implications for our report if we become aware of any apparentmisstatements or material inconsistencies with the Group financialstatements. Our responsibilities do not extend to any other information.
Basis of audit opinionWe conducted our audit in accordance with International Standardson Auditing (UK and Ireland) issued by the Auditing Practices Board.An audit includes examination, on a test basis, of evidence relevant tothe amounts and disclosures in the Group financial statements. It alsoincludes an assessment of the significant estimates and judgementsmade by the directors in the preparation of the Group financialstatements, and of whether the accounting policies are appropriate tothe Group’s circumstances, consistently applied and adequately disclosed.
We planned and performed our audit so as to obtain all the informationand explanations which we considered necessary in order to provide uswith sufficient evidence to give reasonable assurance that the Groupfinancial statements are free from material misstatement, whethercaused by fraud or other irregularity or error. In forming our opinion wealso evaluated the overall adequacy of the presentation of informationin the Group financial statements.
OpinionIn our opinion:
> the Group financial statements give a true and fair view, inaccordance with IFRSs as adopted by the European Union,of the state of the Group’s affairs as at 31 December 2008and of its profit for the year then ended;
> the Group financial statements have been properly preparedin accordance with the Companies Act 1985 and Article 4 ofthe IAS Regulation; and
> the information given in the Directors’ Report is consistent withthe Group financial statements.
Ernst & Young LLPRegistered auditorLondon,2 March 2009
The maintenance and integrity of the Xstrata plc website is the responsibility of thedirectors; the work carried out by the auditors does not involve consideration of thesematters and, accordingly, the auditors accept no responsibility for any changes thatmay have occurred to the financial statements since they were initially presented onthe website.
Xstrata plc Annual Report 2008 111
Independent Auditors’ Report to the Members of Xstrata plc

Consolidated Income Statement For the year ended 31 December 2008
Xstrata plc Annual Report 2008 112
US$m Notes
Beforeexceptional
itemsExceptional
items†Total2008
Before exceptional
items Exceptional
items†Total2007
Revenue 27,952 – 27,952 28,542 – 28,542Cost of sales* (16,001) – (16,001) (15,544) – (15,544)Distribution costs (1,988) – (1,988) (1,439) – (1,439)Administrative expenses* (318) – (318) (686) – (686)Share of results from associates 20 12 (34) (22) 15 – 15Income and costs of acquisition-related activities – – – – 275 275Inventory write downs – (93) (93) – – –Liability fair value adjustments – (194) (194) – (25) (25)Profit on restructure of joint venture – 213 213 – – –Restructuring and closure costs – (125) (125) – – –Profit before interest, taxation, depreciation and amortisation 10 9,657 (233) 9,424 10,888 250 11,138Depreciation and amortisation: – Cost of sales (2,372) – (2,372) (2,038) – (2,038)– Administrative expenses (24) – (24) (58) – (58)Impairment of assets: – Cost of sales – (974) (974) – – –Profit before interest and taxation 10 7,261 (1,207) 6,054 8,792 250 9,042Finance income 10 192 69 261 142 74 216Finance costs 10 (852) (295) (1,147) (935) (196) (1,131)Profit before taxation 6,601 (1,433) 5,168 7,999 128 8,127Income tax (expense)/benefit 11 (1,634) 330 (1,304) (2,301) (10) (2,311)Profit from continuing operations 4,967 (1,103) 3,864 5,698 118 5,816Profit after tax from discontinued operations 8 – – – 52 1 53Profit/(loss) for the year 4,967 (1,103) 3,864 5,750 119 5,869 Attributable to: Equity holders of the parent 4,698 (1,103) 3,595 5,424 119 5,543Minority interests 269 – 269 326 – 326 4,967 (1,103) 3,864 5,750 119 5,869 Earnings per share (US$) – basic (continuing operations) 12 4.90 (1.15) 3.75 5.60 0.12 5.72– basic 12 4.90 (1.15) 3.75 5.66 0.12 5.78– diluted (continuing operations) 12 4.82 (1.13) 3.69 5.47 0.12 5.59– diluted 12 4.82 (1.13) 3.69 5.52 0.12 5.64 Dividends (US$m) – declared and paid 13 499 443– proposed 13 – 326Dividend per share (US¢) – declared and paid 13 52.0 46.0– proposed 13 – 34.0
† Exceptional items are significant items of income and expense, presented separately due to their nature or the expected infrequency of the events giving rise to them. * Before depreciation, amortisation and impairment charges.

Consolidated Balance Sheet As at 31 December 2008
Xstrata plc Annual Report 2008 113
US$m Notes 2008 2007*
Assets Non-current assets Intangible assets 14, 15 8,898 9,329 Property, plant and equipment 16 36,141 33,242 Biological assets 17 11 19 Inventories 18 39 17 Trade and other receivables 19 77 85 Investments in associates 20 1,963 186 Available-for-sale financial assets 22 161 203 Derivative financial assets 23 774 210 Other financial assets 24 70 98 Pension asset 35 3 5 Prepayments 22 30 Deferred tax assets 11 3 7 48,162 43,431 Current assets Inventories 18 3,573 4,167 Trade and other receivables 19 2,106 2,967 Derivative financial assets 23 29 89 Other financial assets 24 – 54 Prepayments 288 265 Cash and cash equivalents 25 1,156 1,148 7,152 8,690 Total assets 55,314 52,121
* Restated for revisions to the provisional Austral, Eland and Mangoola acquisition accounting (refer to note 7).

Consolidated Balance Sheet continued As at 31 December 2008
Xstrata plc Annual Report 2008 114
US$m Notes 2008 2007*
Equity and liabilities Capital and reserves – attributable to equity holders of Xstrata plc Issued capital 26 488 485 Share premium 26 10,308 9,899 Own shares 26 (1,332) (651) Convertible borrowings – equity component 26, 29 56 56 Other reserves 26 1,454 5,055 Retained earnings 26 11,789 8,984 22,763 23,828 Minority interests 26 1,636 1,386 Total equity 24,399 25,214 Non-current liabilities Trade and other payables 27 29 54 Interest-bearing loans and borrowings 28 16,337 11,327 Convertible borrowings 29 331 327 Derivative financial liabilities 30 569 206 Other financial liabilities 31 683 351 Provisions 32 2,237 2,475 Pension deficit 35 320 231 Deferred tax liabilities 11 5,244 5,947 Other liabilities 33 105 78 25,855 20,996 Current liabilities Trade and other payables 27 3,233 3,745 Interest-bearing loans and borrowings 28 794 1,118 Derivative financial liabilities 30 202 205 Provisions 32 497 344 Income taxes payable 299 454 Other liabilities 33 35 45 5,060 5,911 Total liabilities 30,915 26,907 Total equity and liabilities 55,314 52,121
* Restated for revisions to the provisional Austral, Eland and Mangoola acquisition accounting (refer to note 7).
The financial statements on pages 112 to 198 were approved by the Board of Directors on 2 March 2009 and signed on its behalf by:
Trevor Reid Chief Financial Officer

Consolidated Cash Flow Statement For the year ended 31 December 2008
Xstrata plc Annual Report 2008 115
US$m Notes 2008 2007
Profit before taxation (continuing operations) 5,168 8,127Adjustments for: Profit before tax from discontinued operations 8 – 89Finance income 10 (261) (218)Finance cost 10 1,147 1,133Share of (profit)/loss from associates 20 22 (15)Net (profit)/loss on disposal of property, plant and equipment (9) 3Inventory write downs 10 93 –Liability fair value adjustments 10 194 25Profit on restructure of joint venture interest 10 (213) –Depreciation 10 2,286 2,025Amortisation 10 110 102Impairment of assets 10, 15 974 –Share-based compensation plans 10 6 103Decrease/(increase) in trade and other receivables 868 (348)Increase in other assets (299) (106)Decrease/(increase) in inventories 167 (652)(Decrease)/increase in trade and other payables (913) 552(Decrease)/increase in provisions (450) 224Other non-cash movements (2) 2Cash generated from operations 8,888 11,046Income tax paid (1,753) (2,965)Interest paid (612) (803)Interest received 60 132Dividends received – other 2 4Net cash flow from operating activities 6,585 7,414Purchase of property, plant and equipment (4,796) (2,848)Proceeds from sale of property, plant and equipment 101 86Purchase of intangible assets (54) (14)Purchase of available-for-sale financial assets (155) (41)Proceeds from the sale of available-for-sale assets 10 43 –Payments to black empowerment partner – (44)Acquisition of interest in associates (1,878) –Acquisition of subsidiaries, net of cash acquired (3,654) (2,130)Disposal of subsidiaries, net of disposal costs and cash disposed – 1,120Net cash flow used in investing activities (10,393) (3,871)Purchase of own shares (525) (532)Disposal of own shares 64 56Proceeds from interest-bearing loans and borrowings 7,118 6,666Interest-bearing loans and borrowings issue costs (89) (38)Repayment of interest-bearing loans and borrowings (2,220) (9,431)Payment of finance lease liabilities (14) (159)Dividends paid to equity holders of the parent (499) (443)Dividends paid to minority interests (221) (485)Capital injection from minority interests 301 180Redemption of minority interests – (22)Net cash flow from/(used in) financing activities 3,915 (4,208)Net increase/(decrease) in cash and cash equivalents 107 (665)Net foreign exchange difference (31) 17Cash and cash equivalents at 1 January 1,069 1,717Cash and cash equivalents at 31 December 25 1,145 1,069

Consolidated Statement of Recognised Income and Expense For the year ended 31 December 2008
Xstrata plc Annual Report 2008 116
US$m 2008 2007
Income and expenses recognised directly in equity: Actuarial losses on defined benefit pension and medical plans (112) (98)Gains/(losses) on available-for-sale financial assets (114) 49Revaluation of property, plant and equipment – 22Losses on cash flow hedges (157) (261)Foreign currency translation differences (3,980) 670 (4,363) 382Transfers to the income statement: Losses on cash flow hedges 360 121Recycled foreign currency translation net losses 246 28 (3,757) 531Tax on items taken directly to, or transferred from, equity 81 (7)Net (loss)/income recognised directly in equity (3,676) 524Profit for the period 3,864 5,869Total recognised income and expense for the period 188 6,393 Attributable to: Equity holders of the parent (81) 6,067Minority interests 269 326 188 6,393

Notes to the Financial Statements
Xstrata plc Annual Report 2008 117
1. Corporate Information
The consolidated financial statements were authorised for issue in accordance with a directors’ resolution on 2 March 2009. The ultimate parent entity of the Group, Xstrata plc, is a publicly traded limited company incorporated in England and Wales and domiciled in Switzerland. Its ordinary shares are traded on the London and Swiss stock exchanges.
The principal activities of the Group are described in note 9.
2. Statement of Compliance
The consolidated financial statements of Xstrata plc and its subsidiaries (the Group) are prepared in accordance with International Financial Reporting Standards (IFRS) issued by the International Accounting Standards Board (IASB) and interpretations of the International Financial Reporting Interpretations Committee (IFRIC), as adopted by the European Union, effective for the Group’s reporting for the year ended 31 December 2008.
3. Basis of Preparation
The consolidated financial statements are presented in US dollars, which is the parent’s functional and presentation currency, and all values are rounded to the nearest million except where otherwise indicated.
The accounting policies in note 6 have been applied in preparing the consolidated financial statements.
4. Significant Accounting Judgements and Estimates
Estimates The preparation of these financial statements requires management to make judgements, estimates and assumptions that affect the reported amounts of revenues, expenses, assets and liabilities, and the disclosure of contingent liabilities, at the date of the financial statements. Actual outcomes could differ from these estimates.
The below are the most critical judgements, estimates and assumptions:
Estimated recoverable reserves and resources Estimated recoverable reserves and resources are used to determine the depreciation of mine production assets, in accounting for deferred stripping costs and in performing impairment testing. Estimates are prepared by appropriately qualified persons, but will be impacted by forecast commodity prices, exchange rates, production costs and recoveries amongst other factors. Changes in assumptions will impact the carrying value of assets and depreciation and impairment charges recorded in the income statement.
Environmental rehabilitation costs The provisions for rehabilitation costs are based on estimated future costs using information available at the balance sheet date. To the extent the actual costs differ from these estimates, adjustments will be recorded and the income statement may be impacted (refer to note 32).
Impairment testing Note 15 outlines the significant assumptions made in performing impairment testing of non-current assets. Changes in these assumptions may alter the results of impairment testing, impairment charges recorded in the income statement and the resulting carrying values of assets.
Defined benefit pension plans and post-retirement medical plans Note 35 outlines the significant assumptions made when accounting for defined benefit pension plans and post-retirement medical plans. Changes to these assumptions may alter the resulting accounting and ultimately the amount charged to the income statement.
5. Changes in Accounting Policies, New Standards and Interpretations Not Applied
Changes in accounting policies The accounting policies adopted in the preparation of the consolidated financial statements are consistent with those followed in the preparation of the Group’s annual financial statements for the year ended 31 December 2007, except for the adoption of the following new standards and interpretations:
> IFRIC 11 ‘Group and Treasury Share Transactions’ The Group adopted IFRIC 11 which details the requirements of accounting for share-based payment arrangements that involve numerous entities within the same Group. The adoption of this interpretation had no impact on Group earnings or equity in the current or prior years.
> IFRIC 14 ‘The Limit on a Defined Benefit Asset, Minimum Funding Requirements and their interaction’ The Group adopted IFRIC 14 which details the requirements of accounting for post-employment and other long-term defined benefit plans when minimum funding requirements exist and when an entity may regard refunds or reductions in future contributions as available. The adoption of this interpretation had no impact on Group earnings or equity in the current or prior years.
> IAS 23 (Revised) ‘Borrowing Costs’ The Group early adopted IAS 23 (Revised) ‘Borrowing Costs’ which requires that borrowing costs that are directly attributable to the acquisition, construction or production of a qualifying asset be capitalised as a cost of that asset. The adoption of this standard had no impact on Group earnings or equity in the current or prior years.
New standards and interpretations not applied The IASB and IFRIC have issued the following standards and interpretations with an effective date after the date of these financial statements, consequently, these pronouncements will impact the Group’s financial statements in future periods.
Effective date
IFRIC 16 Hedges of a Net Investment in a Foreign Operation
1 October 2008
IFRS 2 (Revised) ‘Share-Based Payments’ 1 January 2009IAS 1 (Revised) ‘Presentation of Financial
Statements’ 1 January 2009
IFRS 8 ‘Operating Segments’ 1 January 2009IAS 27 (Amended) ‘Consolidated and
Separate Financial Statements’ 1 July 2009
IFRS 3 (Revised) ‘Business Combinations’ 1 July 2009
The directors do not anticipate that the adoption of these standards and interpretations on their effective dates will have a material impact on the Group’s financial statements in the period of initial application, notwithstanding IFRS 3 (Revised) ‘Business Combinations’ may impact the financial statements should there be an acquisition in the period.
Upon adoption of IFRS 8, the Group will be required to disclose segment information based on the information management uses for internally evaluating the performance of operating segments and allocating resources to those segments. This information may be

Notes to the Financial Statements continued
Xstrata plc Annual Report 2008 118
different from that reported in the balance sheet and income statement but the Group will provide an explanation for such differences. There will be no impact on the income, net assets or equity of the Group.
6. Principal Accounting Policies
Basis of consolidation The financial statements consolidate the financial statements of Xstrata plc (the Company) and its subsidiaries (the Group). All inter-entity balances and transactions, including unrealised profits and losses arising from intra-Group transactions, have been eliminated in full. The results of subsidiaries acquired or sold are consolidated for the periods from or to the date on which control passes. Control is achieved where the Group has the power to govern the financial and operating policy of an entity so as to obtain benefits from its activities. This occurs when the Group has more than 50% voting power through ownership or agreements, except where minority rights are such that a minority shareholder is able to prevent the Group from exercising control. In addition, control may exist without having more than 50% voting power through ownership or agreements, or in the circumstances of enhanced minority rights, as a consequence of de facto control. De facto control is control without the legal right to exercise unilateral control, and involves decision-making ability that is not shared with others and the ability to give directions with respect to the operating and financial policies of the entity concerned. Where there is a loss of control of a subsidiary, the financial statements include the results for the part of the reporting period during which Xstrata plc has control. Subsidiaries use the same reporting period and same accounting policies as Xstrata plc.
Interests in joint ventures A joint venture is a contractual arrangement whereby two or more parties undertake an economic activity that is subject to joint control. The financial statements of the joint ventures are generally prepared for the same reporting period as the Company, using consistent accounting policies. Adjustments are made to bring into line any dissimilar accounting policies that may exist in the underlying records of the joint venture.
Jointly controlled operations A jointly controlled operation involves the use of assets and other resources of the Group and other venturers rather than the establishment of a corporation, partnership or other entity.
The Group accounts for the assets it controls and the liabilities it incurs, the expenses it incurs and the share of income that it earns from the sale of goods or services by the joint venture.
Jointly controlled assets A jointly controlled asset involves joint control and ownership by the Group and other venturers of assets contributed to or acquired for the purpose of the joint venture, without the formation of a corporation, partnership or other entity.
The Group accounts for its share of the jointly controlled assets, any liabilities it has incurred, its share of any liabilities jointly incurred with other ventures, income from the sale or use of its share of the joint venture’s output, together with its share of the expenses incurred by the joint venture, and any expenses it incurs in relation to its interest in the joint venture.
Jointly controlled entities A jointly controlled entity involves the establishment of a corporation, partnership or other legal entity in which the Group has an interest along with other venturers.
The Group recognises its interest in jointly controlled entities using the proportionate method of consolidation, whereby the Group’s share of each of the assets, liabilities, income and expenses of the joint venture are combined with the similar items, line by line, in its consolidated financial statements.
When the Group contributes or sells assets to a joint venture, any gain or loss from the transaction is recognised based on the substance of the transaction. When the Group has transferred the risk and rewards of ownership to the joint venture, the Group only recognises the portion of the gain or loss attributable to the other venturers, unless the loss is reflective of an impairment, in which case the loss is recognised in full. When the Group purchases assets from the joint venture, it does not recognise its share of the profits of the joint venture from the transaction until it resells the assets to an independent party. Losses are accounted for in a similar manner unless they represent an impairment loss, in which case they are recognised immediately.
Joint ventures are accounted for in the manner outlined above, until the date on which the Group ceases to have joint control over the joint venture.
Investments in associates Entities in which the Group has significant influence and which are neither subsidiaries nor joint ventures, are associates, and are accounted for using the equity method of accounting.
Under the equity method of accounting, the investment in the associate is recognised on the balance sheet on the date of acquisition at the fair value of the purchase consideration where this is higher than the fair value of the identifiable net assets acquired, or, if the purchase consideration is less than the fair value of the identifiable net assets acquired, at the fair value of the identifiable net assets acquired. In this way goodwill is included within the associate balance when the fair value of the investment is less than the consideration paid. The carrying amount is adjusted by the Group’s share of the post-acquisition profit or loss, depreciation, amortisation or impairment arising from fair value adjustments made at date of acquisition and certain inter-entity transactions together with a reduction for any dividends received or receivable from the associate. Where there has been a change recognised directly in the equity of the associate, the Group recognises its share of such changes in equity.
The financial statements of the associates are generally prepared for the same reporting period as the Group, using consistent accounting policies. Adjustments are made to bring into line any dissimilar accounting policies that may exist in the underlying records of the associate. Where an associate prepares its financial statements using a different reporting period, an estimate of the Group’s share of the associate’s profit or loss is made based on the most reliable information available. Adjustments are made in the consolidated financial statements to eliminate the Group’s share of unrealised gains and losses on transactions between the Group and its associates.
The Group discontinues its use of the equity method from the date on which it ceases to have significant influence, and from that date, accounts for the investment in accordance with IAS 39 (with its initial cost being the carrying amount of the associate at that date), provided the investment does not then qualify as a subsidiary or joint venture.
The Group’s income statement reflects the share of associates’ results after tax and the Group’s statement of recognised income and expense includes any amounts recognised by associates outside of the income statement.
5. Changes in Accounting Policies, New Standards and Interpretations Not Appliedcontinued

Xstrata plc Annual Report 2008 119
Business combinations On the acquisition of a subsidiary, the purchase method of accounting is used, whereby the purchase consideration is allocated to the identifiable assets, liabilities and contingent liabilities (identifiable net assets) on the basis of fair value at the date of acquisition. Those mining rights, mineral reserves and resources that are able to be reliably valued are recognised in the assessment of fair values on acquisition. Other potential reserves, resources and mineral rights, for which in the directors’ opinion, values cannot be reliably determined, are not recognised.
When the cost of acquisition exceeds the fair values attributable to the Group’s share of the identifiable net assets, the difference is treated as purchased goodwill, which is not amortised but is reviewed for impairment annually or where there is an indication of impairment. If the fair value attributable to the Group’s share of the identifiable net assets exceeds the cost of acquisition, the difference is immediately recognised in the income statement.
Minority interests represent the portion of profit or loss and net assets in subsidiaries that are not held by the Group and are presented in equity in the Consolidated Balance Sheet, separately from the parent’s shareholders’ equity.
When a subsidiary is acquired in a number of stages, the cost of each stage is compared with the fair value of the identifiable net assets at the date of that purchase. Any excess is treated as goodwill, or any discount is immediately recognised in the income statement. On the date control is obtained, the identifiable net assets are recognised in the Group balance sheet at fair value and the difference between the fair value recognised and the value on the date of the purchase is recognised in the asset revaluation reserve.
Similar procedures are applied in accounting for the purchases of interests in associates. Any goodwill arising on such purchases is included within the carrying amount of the investment in the associates, but not thereafter amortised. Any excess of the Group’s share of the net fair value of the associate’s identifiable assets, liabilities and contingent liabilities over the cost of the investment is included in income in the period of the purchase.
Foreign currencies Financial statements of subsidiaries, joint ventures and associates, are maintained in their functional currencies and converted to US dollars for consolidation of the Group results. The functional currency of each entity is determined after consideration of the primary economic environment of the entity.
Transactions in foreign currencies are translated at the exchange rates ruling at the date of transaction. Monetary assets and liabilities denominated in foreign currencies are re-translated at year-end exchange rates. All differences that arise are recorded in the income statement except for differences arising on rehabilitation provisions which are capitalised for operating mines. Non-monetary assets measured at historical cost in a foreign currency are translated using the exchange rates at the date of the initial transactions. Where non-monetary assets are measured at fair value in a foreign currency, they are translated at the exchange rates when the fair value was determined. Where the exchange difference relates to an item which has been recorded in equity, the related exchange difference is also recorded in equity.
On consolidation of foreign operations into US dollars, income statement items are translated at weighted average rates of exchange where this is a reasonable approximation of the exchange rate at the dates of the transactions. Balance sheet items are translated at closing exchange rates. Exchange differences on the re-translation of the investments in foreign subsidiaries, joint ventures and associates at closing rates, together with differences between income statements translated at average and at closing rates, are recorded in a separate
component of equity. Exchange differences relating to quasi equity inter-company loan balances with the foreign operations which form part of the net investment in the foreign operation are also recognised in this component of equity. On disposal or partial disposal of a foreign entity or on repayment of loans forming part of the net investment in the foreign entity, the deferred cumulative amount recognised in equity relating to that particular foreign operation is recognised in the income statement.
Exchange differences on foreign currency borrowings to finance net investments and tax charges/credits attributable to those exchange differences are also recorded in a separate component of equity to the extent that the hedge is effective. Upon full or partial disposal or repayment of the net investment in the foreign operation (including loans that form part of the net investment), the cumulative amount of the exchange differences is recognised in the income statement when the gain or loss on disposal or the loan repayment is recognised.
The following exchange rates to the US dollar (US$) have been applied:
31 December2008
Average 12 months
2008 31 December
2007
Average12 months
2007
Argentine pesos (US$:ARS) 3.4538 3.1631 3.1500 3.1155Australian dollars (AUD:US$) 0.7048 0.8522 0.8751 0.8389Canadian dollars (US$:CAD) 1.2205 1.0670 0.9984 1.0740Chilean pesos (US$:CLP) 637.25 523.87 497.95 522.21Colombian pesos (US$:COP) 2,248.70 1,967.83 2,018.00 2,075.16Euros (EUR:US$) 1.3974 1.4712 1.4590 1.3708Great Britain pounds (GBP:US$) 1.4628 1.8525 1.9849 2.0020Peruvian nuevo sol (US$:PEN) 3.1345 2.9237 2.9980 3.1285South African rand (US$:ZAR) 9.3212 8.2695 6.8626 7.0506Swiss francs (US$:CHF) 1.0695 1.0824 1.1335 1.2000
Revenue Revenue associated with the sale of commodities is recognised when all significant risks and rewards of ownership of the asset sold are transferred to the customer, usually when insurance risk has passed to the customer and the commodity has been delivered to the shipping agent. At this point the Group retains neither continuing managerial involvement to the degree usually associated with ownership nor effective control over the commodities and the costs incurred, or to be incurred, in respect of the sale can be reliably measured. Revenue is recognised, at fair value of the consideration receivable, to the extent that it is probable that economic benefits will flow to the Group and the revenue can be reliably measured. Sales revenue is recognised at the fair value of consideration received, which in most cases is invoiced amounts, with most sales being priced free on board (FOB), free on rail (FOR) or cost, insurance and freight (CIF). Revenues from the sale of by-products are also included in sales revenue. Revenue excludes treatment and refining charges unless payment of these amounts can be enforced by the Group at the time of the sale.

Notes to the Financial Statements continued
Xstrata plc Annual Report 2008 120
For some commodities the sales price is determined provisionally at the date of sale, with the final price determined at a mutually agreed date, generally at a quoted market price at that time. This contractual feature has the character of a commodity derivative. As a result, the invoice price on these sales are marked-to-market at balance sheet date based on the forward metal prices for the relevant quotational period. This ensures that revenue is recorded at the fair value of consideration to be received. All mark-to-market adjustments are recorded in sales revenue.
Interest income Interest income is recognised as earned on an accruals basis using the effective interest method in the income statement.
Exceptional items Exceptional items represent significant items of income and expense which due to their nature or the expected infrequency of the events giving rise to them, are presented separately on the face of the income statement to give a better understanding to shareholders of the elements of financial performance in the year, so as to facilitate comparison with prior periods and to better assess trends in financial performance. Exceptional items include, but are not limited to, impairments, acquisition and integration costs which have not been capitalised, profits and losses on the sale of investments, profits and losses from the sale of operations, recycled gains and losses from the foreign currency translation reserve, foreign currency gains and losses on borrowings, restructuring and closure costs, loan issue costs written off on facility refinancing and the related tax impacts of these items.
Property, plant and equipment Land and Buildings, Plant and Equipment On initial acquisition, land and buildings, plant and equipment are valued at cost, being the purchase price and the directly attributable costs of acquisition or construction required to bring the asset to the location and condition necessary for the asset to be capable of operating in the manner intended by management.
In subsequent periods, buildings, plant and equipment are stated at cost less accumulated depreciation and any impairment in value, whilst land is stated at cost less any impairment in value and is not depreciated.
Depreciation is provided so as to write off the cost, less estimated residual values of buildings, plant and equipment (based on prices prevailing at the balance sheet date) on the following bases:
Mine production assets are depreciated using a unit of production method based on estimated economically recoverable reserves, which results in a depreciation charge proportional to the depletion of reserves. Buildings, plant and equipment unrelated to production are depreciated using the straight-line method based on estimated useful lives.
Where parts of an asset have different useful lives, depreciation is calculated on each separate part. Each asset or part’s estimated useful life has due regard to both its own physical life limitations and the present assessment of economically recoverable reserves of the mine property at which the item is located, and to possible future variations in those assessments. Estimates of remaining useful lives and residual values are reviewed annually. Changes in estimates are accounted for prospectively.
The expected useful lives are as follows:
Buildings 15 – 40 years Plant and equipment 4 – 30 years
The net carrying amounts of land, buildings, plant and equipment are reviewed for impairment either individually or at the cash-generating unit level when events and changes in circumstances indicate that the carrying amounts may not be recoverable. To the extent that these values exceed their recoverable amounts, that excess is fully provided against in the financial year in which this is determined.
Expenditure on major maintenance or repairs includes the cost of the replacement of parts of assets and overhaul costs. Where an asset or part of an asset is replaced and it is probable that future economic benefits associated with the item will be available to the Group, the expenditure is capitalised and the carrying amount of the item replaced derecognised. Similarly, overhaul costs associated with major maintenance are capitalised and depreciated over their useful lives where it is probable that future economic benefits will be available and any remaining carrying amounts of the cost of previous overhauls are derecognised. All other costs are expensed as incurred.
Where an item of property, plant and equipment is disposed of, it is derecognised and the difference between its carrying value and net sales proceeds is disclosed as a profit or loss on disposal in the income statement.
Any items of property, plant or equipment that cease to have future economic benefits are derecognised with any gain or loss included in the income statement in the financial year in which the item is derecognised.
Exploration and Evaluation Expenditure Exploration and evaluation expenditure relates to costs incurred on the exploration and evaluation of potential mineral reserves and resources and includes costs such as exploratory drilling and sample testing and the costs of pre-feasibility studies. Exploration and evaluation expenditure for each area of interest, other than that acquired from the purchase of another mining company, is carried forward as an asset provided that one of the following conditions is met:
> such costs are expected to be recouped in full through successful development and exploration of the area of interest or alternatively, by its sale; or
> exploration and evaluation activities in the area of interest have not yet reached a stage which permits a reasonable assessment of the existence or otherwise of economically recoverable reserves, and active and significant operations in relation to the area are continuing, or planned for the future.
Purchased exploration and evaluation assets are recognised as assets at their cost of acquisition or at fair value if purchased as part of a business combination.
An impairment review is performed, either individually or at the cash-generating unit level, when there are indicators that the carrying amount of the assets may exceed their recoverable amounts. To the extent that this occurs, the excess is fully provided against, in the financial year in which this is determined. Exploration and evaluation assets are reassessed on a regular basis and these costs are carried forward provided that at least one of the conditions outlined above is met.
Expenditure is transferred to mine development assets or capital work in progress once the work completed to date supports the future development of the property and such development receives appropriate approvals.
6. Principal Accounting Policies continued

Xstrata plc Annual Report 2008 121
Mineral properties and mine development expenditure The cost of acquiring mineral reserves and mineral resources is capitalised on the balance sheet as incurred. Capitalised costs (development expenditure) include costs associated with a start- up period where the asset is available for use but incapable of operating at normal levels without a commissioning period.
Mineral reserves and capitalised mine development expenditure are, upon commencement of production, depreciated using a unit of production method based on the estimated economically recoverable reserves to which they relate or are written off if the property is abandoned. The net carrying amounts of mineral reserves and resources and capitalised mine development expenditure at each mine property are reviewed for impairment either individually or at the cash-generating unit level when events and changes in circumstances indicate that the carrying amount may not be recoverable. To the extent that these values exceed their recoverable amounts, that excess is fully provided against in the financial year in which this is determined.
Capital work in progress Assets in the course of construction are capitalised in the capital work in progress account. On completion, the cost of construction is transferred to the appropriate category of property, plant and equipment.
The cost of property, plant and equipment comprises its purchase price and any costs directly attributable to bringing it into working condition for its intended use.
Costs associated with a start-up period are capitalised where the asset is available for use but incapable of operating at normal levels without a commissioning period.
Capital work in progress is not depreciated The net carrying amounts of capital work in progress at each mine property are reviewed for impairment either individually or at the cash-generating unit level when events and changes in circumstances indicate that the carrying amount may not be recoverable. To the extent that these values exceed their recoverable amounts, that excess is fully provided against in the financial year in which this is determined.
Leasing and hire purchase commitments The determination of whether an arrangement is, or contains a lease is based in the substance of the arrangement at inception date, including whether the fulfilment of the arrangement is dependent on the use of a specific asset or assets or whether the arrangement conveys a right to use the asset. A reassessment after inception is only made in specific circumstances.
Assets held under finance leases, where substantially all the risks and rewards of ownership of the asset have passed to the Group, and hire purchase contracts are capitalised in the balance sheet at the lower of the fair value of the leased property or the present value of the minimum lease payments during the lease term calculated using the interest rate implicit in the lease agreement. These amounts are determined at the inception of the lease and are depreciated over the shorter of their estimated useful lives or lease term. The capital elements of future obligations under leases and hire purchase contracts are included as liabilities in the balance sheet. The interest elements of the lease or hire purchase obligations are charged to the income statement over the periods of the leases and hire purchase contracts and represent a constant proportion of the balance of capital repayments outstanding.
Leases where substantially all the risks and rewards of ownership have not passed to the Group are classified as operating leases. Rentals payable under operating leases are charged to the income statement on a straight-line basis over the lease term.
Deferred stripping costs In open pit mining operations, it is necessary to remove overburden and other waste in order to access the ore body. During the pre-production phase, these costs are capitalised as part of the cost of the mine property and depreciated based on the mine’s strip ratio (refer below).
The costs of removal of the waste material during a mine’s production phase are deferred, where they give rise to future benefits. The deferral of these costs, and subsequent charges to the income statement are determined with reference to the mine’s strip ratio.
The mine’s strip ratio represents the ratio of the estimated total volume of waste, to the estimated total quantity of economically recoverable ore, over the life of the mine. These costs are deferred where the actual stripping ratios are higher than the average life of mine strip ratio. The costs charged to the income statement are based on application of the mine’s strip ratio to the quantity of ore mined in the period. Where the ore is expected to be evenly distributed, waste removal is expensed as incurred.
Biological assets Biological assets, being cattle, are carried at their fair value less estimated selling costs. Any changes in fair value less estimated selling costs are included in the income statement in the period in which they arise.
Intangible assets Purchased intangible assets are recorded at the cost of acquisition including expenses incidental to the acquisition, less accumulated amortisation and any impairment in value.
Intangible assets acquired as part of an acquisition of a business are capitalised separately from goodwill if the asset is separable or arises from contractual or legal rights and the fair value can be measured reliably on initial recognition.
Internally Generated Goodwill is not Recognised. Intangible assets are amortised over their estimated useful lives, except goodwill and those intangible assets which the directors regard as having indefinite useful lives, which are not amortised but are reviewed for impairment at least annually, and whenever events or circumstances indicate that the carrying amount may not be recoverable. Intangible assets are regarded as having an indefinite life when, based on an analysis of all the relevant factors, there is no foreseeable limit to the period over which the asset is expected to generate net cash flows. Such analyses are performed annually. Estimated useful lives are determined as the period over which the Group expects to use the asset or the number of production (or similar) units expected to be obtained from the asset by the Group and for which the Group retains control of access to those benefits.
For intangible assets with a finite useful life, the amortisation method and period are reviewed annually and impairment testing is undertaken when circumstances indicate the carrying amount may not be recoverable.
Where an intangible asset is disposed of, it is derecognised and the difference between its carrying value and the net sales proceeds is reported as a profit or loss on disposal in the income statement in the financial year the disposal occurs.
Coal export rights Coal export rights are carried at cost and amortised using a units-of-production method based on the reserves that exist in the location that has access to such rights.
Software and technology patents Software and technology patents are carried at cost and amortised over a period of three years and 20 years respectively.

Notes to the Financial Statements continued
Xstrata plc Annual Report 2008 122
Hydroelectricity rights Hydroelectricity rights acquired will be amortised over the expected life of the operation following the completion of construction.
Long-term feed contract A long-term feed contract is being amortised over the remaining contract term.
Impairment of assets The carrying amounts of non-current assets are reviewed for impairment whenever events or changes in circumstances indicate the carrying amounts may not be recoverable. If there are indicators of impairment, a review is undertaken to determine whether the carrying amounts are in excess of their recoverable amounts. An asset’s recoverable amount is determined as the higher of its fair value less costs to sell and its value-in-use. Such reviews are undertaken on an asset-by-asset basis, except where assets do not generate cash flows independent of other assets, in which case the review is undertaken at the cash-generating unit level.
Where a cash-generating unit, or group of cash-generating units, has goodwill allocated to it (excluding goodwill recognised as a result of the requirement to recognise deferred tax liabilities on acquisitions), or includes intangible assets which are either not available for use or which have an indefinite useful life (and which can only be tested as part of a cash-generating unit), an impairment test is performed at least annually or whenever there is an indication that the carrying amounts of such assets may be impaired.
If the carrying amount of an asset exceeds its recoverable amount, an impairment loss is recorded in the income statement to reflect the asset at the lower amount. In assessing the value-in-use, the relevant future cash flows expected to arise from the continuing use of such assets and from their disposal are discounted to their present value using a market-determined pre-tax discount rate which reflects current market assessments of the time value of money and asset-specific risks for which the cash flow estimates have not been adjusted. Fair value less costs to sell is determined as the amount that would be obtained from the sale of the asset in an arm’s-length transaction between knowledgeable and willing parties. For mining assets this would generally be determined based on the present value of the estimated future cash flows arising from the continued use and eventual disposal of the asset. In assessing these cash flows and discounting them to present value, assumptions used are those that an independent market participant would consider appropriate.
An impairment loss is reversed in the income statement if there is a change in the estimates used to determine the recoverable amount since the prior impairment loss was recognised. The carrying amount is increased to the recoverable amount but not beyond the carrying amount net of depreciation or amortisation which would have arisen if the prior impairment loss had not been recognised. After such a reversal the depreciation charge is adjusted in future periods to allocate the asset’s revised carrying amount, less any residual value, on a systematic basis over its remaining useful life. Goodwill impairments are not reversed.
Non-current assets held for sale and discontinued operations Non-current assets held for sale Non-current assets and disposal groups are classified as held for sale if their carrying amounts will be recovered through a sale transaction rather than through continuing use. This condition is regarded as met only when the sale is highly probable and the assets or disposal groups are available for immediate sale in their present condition. The Group must be committed to the sale which should be expected to qualify
for recognition as a completed sale within one year of the date of classification.
Non-current assets (or disposal groups) held for sale are carried at the lower of the carrying amount prior to being classified as held for sale, and the fair value less costs to sell. A non-current asset is not depreciated while classified as held for sale.
A non-current asset held for sale is presented separately in the balance sheet. The assets and liabilities of a disposal group classified as held for sale are presented separately as one line in the assets and liabilities sections on the face of the balance sheet.
Discontinued operations A discontinued operation is a component of an entity, whose operations and cash flows are clearly distinguished both operationally and for financial reporting purposes from the rest of the entity, that has been disposed of or classified as held for sale. To be classified as a discontinued operation, one of the following criteria must be met:
> the operation must represent a separate major line of business or geographical area of operations; or
> the operation must be part of a single coordinated plan to dispose of a separate major line of business or geographical area of operations; or
> the operation must be a subsidiary acquired exclusively with a view for resale.
Where the operation is discontinued at the balance sheet date, the results are presented in one line on the face of the income statement, and prior period results are represented as discontinued.
Financial instruments Financial assets are classified as either financial assets at fair value through profit or loss, loans and receivables, held-to-maturity investments or available-for-sale financial assets, as appropriate. The Group determines the classification of its financial assets at initial recognition. Where as a result of a change in intention or ability, it is no longer appropriate to classify an investment as held to maturity, the investment is reclassified into the available-for-sale category. When financial assets are recognised initially, they are measured at fair value on the trade date, plus, in the case of investments not at fair value through profit or loss, directly attributable transaction costs. All financial liabilities are initially recognised at their fair value. Subsequently, all financial liabilities with the exception of derivatives are carried at amortised cost.
The Group considers whether a contract contains an embedded derivative when the Group becomes a party to the contract. Embedded derivatives are separated from the host contract if it is not measured at fair value through profit and loss and when the economic characteristics and risks are not closely related to the host contract.
Financial Assets at Fair Value Through Profit or Loss Financial assets classified as held for trading are included in the category ‘financial assets at fair value through profit or loss’. Financial assets are classified as held for trading if they are acquired for the purpose of selling in the near term. Derivatives are also classified as held for trading unless they are designated as and are effective hedging instruments. Gains or losses on these items are recognised in income.
Held-to-maturity Investments Non-derivative financial assets with fixed or determinable payments and fixed maturity are classified as held-to-maturity when the Group has the positive intention and ability to hold to maturity. Investments intended to be held for an undefined period are not included in this classification. Other long-term investments that are intended to be held-to-maturity, such as bonds, are measured at amortised cost.
6. Principal Accounting Policies continued

Xstrata plc Annual Report 2008 123
This cost is computed as the amount initially recognised minus principal repayments, plus or minus the cumulative amortisation using the effective interest method of any difference between the initially recognised amount and the maturity amount. This calculation includes all fees paid or received between parties to the contract that are an integral part of the effective interest rate, transaction costs and all other premiums and discounts. For investments carried at amortised cost, gains and losses are recognised in income when the investments are derecognised or impaired, as well as through the amortisation process.
Loans and receivables Loans and receivables are non-derivative financial assets with fixed or determinable payments that are not quoted in an active market, do not qualify as trading assets and have not been designated as either fair value through profit and loss or available-for-sale. Such assets are carried at amortised cost using the effective interest method. Gains and losses are recognised in income when the loans and receivables are derecognised or impaired, as well as through the amortisation process. Trade and other receivables are recognised and carried at their original invoiced value, adjusted for, where appropriate, provisional pricing or their recoverable amount if this differs from the invoiced amount. Where the time value of money is material, receivables are discounted and are carried at their present value. A provision is made where the estimated recoverable amount is lower than the carrying amount.
Available-for-sale financial assets Available-for-sale financial assets are those non-derivative financial assets that are designated as available-for-sale or are not classified in any of the other three stated categories. After initial recognition, available-for-sale financial assets are measured at fair value with gains or losses being recognised as a separate component of equity until the investment is derecognised or until the investment is determined to be impaired at which time the cumulative gain or loss previously reported in equity is included in the income statement.
Listed share investments are carried at fair value based on stock exchange quoted prices at the balance sheet date. Unlisted shares are carried at fair value where it can be reliably obtained, otherwise they are stated at cost less any impairment.
Fair Values The fair value of quoted financial assets is determined by reference to bid prices at the close of business on the balance sheet date. Where there is no active market, fair value is determined using valuation techniques. These include recent arm’s-length market transactions; reference to current market value of another instrument which is substantially the same; discounted cash flow analysis and pricing models.
Derivative financial instruments are valued using applicable valuation techniques such as those outlined above.
Derecognition of financial assets and liabilities Financial assets A financial asset is derecognised when:
> the rights to receive cash flows from the asset have expired;
> the Group retains the right to receive cash flows from the asset, but has assumed an obligation to pay them in full without material delay to a third party under a ‘pass-through’ arrangement; or
> the Group has transferred its rights to receive cash flows from the asset and either has transferred substantially all the risks and rewards of the asset, or has neither transferred nor retained substantially all the risks and rewards of the asset, but has transferred control of the asset.
Where the Group has transferred its right to receive cash flows from an asset and has neither transferred nor retained substantially all the risks and rewards of the asset nor transferred control of the asset, it continues to recognise the financial asset to the extent of its continuing involvement in the asset.
Financial liabilities A financial liability is derecognised when the obligation under the liability is discharged or cancelled or expires.
Gains and losses on derecognition are recognised within finance income and finance costs respectively.
Where an existing financial liability is replaced by another from the same lender on substantially different terms, or the terms of an existing liability are substantially modified, such an exchange or modification is treated as a derecognition of the original liability and the recognition of a new liability, and the difference in the respective carrying amounts is recognised in the income statement.
Impairment of financial assets The Group assesses at each balance sheet date whether a financial asset is impaired.
Financial assets carried at amortised cost If there is objective evidence that an impairment loss on loans and receivables and held-to-maturity investments carried at amortised cost has been incurred, the amount of the loss is measured as the difference between the asset’s carrying amount and the present value of estimated future cash flows (excluding future credit losses that have not been incurred) discounted at the financial asset’s original effective interest rate (i.e. the effective interest rate computed at initial recognition). The carrying amount of the asset is reduced and the amount of the loss is recognised in the income statement. Objective evidence of impairment of loans and receivables exists if the counter-party is experiencing significant financial difficulty, there is a breach of contract, concessions are granted to the counterparty that would not normally be granted or it is probable that the counterparty will enter into bankruptcy or a financial reorganisation.
If, in a subsequent period, the amount of the impairment loss decreases and the decrease can be related objectively to an event occurring after the impairment was recognised, the previously recognised impairment loss is reversed. Any subsequent reversal of an impairment loss is recognised in the income statement, to the extent that the carrying value of the asset does not exceed its amortised cost at the reversal date.
Assets carried at cost If there is objective evidence that an impairment loss on an unquoted equity instrument that is not carried at fair value (because its fair value cannot be reliably measured), the amount of the loss is measured as the difference between the asset’s carrying amount and the present value of estimated future cash flows discounted at the current market rate of return for a similar financial asset.
Available-for-sale financial assets If an available-for-sale financial asset is impaired, an amount comprising the difference between its cost (net of any principal payment and amortisation) and its current fair value, less any impairment loss previously recognised in profit or loss, is transferred from equity to the income statement. Reversals in respect of equity instruments classified as available-for-sale are not recognised in profit. Reversals of impairment losses on debt instruments are reversed through profit or loss, if the increase in fair value of the instrument can be objectively related to an event occurring after the impairment loss was recognised in profit or loss.

Notes to the Financial Statements continued
Xstrata plc Annual Report 2008 124
Rehabilitation trust fund Investments in the rehabilitation trust funds are measured at fair value based on the market price of investments held by the trust. In accordance with IFRIC 5, movements in the fair value are recognised in the income statement. Such amounts relate to trusts in South Africa which receive cash contributions to accumulate funds for the Group’s rehabilitation liabilities relating to the eventual closure of the Group’s coal operations.
Derivative financial instruments and hedging The Group uses derivative financial instruments such as interest rate swaps, forward currency and commodity contracts to hedge its risks associated with interest rate, foreign currency and commodity price fluctuations. Such derivative financial instruments are initially recognised at fair value on the date on which a derivative contract is entered into and are subsequently remeasured at fair value. Derivatives are carried as assets when the fair value is positive and as liabilities when the fair value is negative.
Any gains or losses arising from changes in fair value on derivatives that do not qualify for hedge accounting are taken directly to profit or loss for the year.
The fair value of forward currency and commodity contracts is calculated by reference to current forward exchange rates and prices for contracts with similar maturity profiles. The fair value of interest rate swap contracts is determined by reference to market values for similar instruments.
For the purpose of hedge accounting, hedges are classified as:
> fair value hedges;
> cash flow hedges; or
> hedges of a net investment in a foreign operation.
At the inception of a hedge relationship, the Group formally designates and documents the hedge relationship to which the Group wishes to apply hedge accounting and the risk management objective and strategy for undertaking the hedge. The documentation includes identification of the hedging instrument, the hedged item or transaction, the nature of the risk being hedged and how the entity will assess the hedging instrument’s effectiveness in offsetting the exposure to changes in the hedged item’s fair value or cash flows attributable to the hedged risk. Hedges that are expected to be highly effective in achieving offsetting changes in fair value or cash flows and are assessed on an ongoing basis to determine that they actually have been highly effective throughout the financial reporting periods for which they were designated.
Hedges which meet the strict criteria for hedge accounting are accounted for as follows:
Fair value hedges Fair value hedges are hedges of the Group’s exposure to changes in the fair value of a recognised asset or liability that could affect profit or loss. The carrying amount of the hedged item is adjusted for gains and losses attributable to the risk being hedged, the derivative is re-measured at fair value and gains and losses from both are taken to profit or loss.
For fair value hedges relating to items carried at amortised cost, the adjustment to carrying value is amortised through profit or loss over the remaining term to maturity. Any adjustment to the carrying amount of a hedged financial instrument for which the effective interest method is used is amortised to profit or loss.
Amortisation begins when the hedged item ceases to be adjusted for changes in its fair value attributable to the risk being hedged.
The Group discontinues fair value hedge accounting if the hedging instrument expires or is sold, terminated or exercised, the hedge no longer meets the criteria for hedge accounting or the Group revokes the designation.
Cash flow hedges Cash flow hedges are a hedge of the exposure to variability in cash flows that is attributable to a particular risk associated with a recognised asset or liability or a highly probable forecast transaction that could affect profit or loss. The effective portion of the gain or loss on the hedging instrument is recognised directly in equity, while the ineffective portion is recognised in profit or loss.
Amounts taken to equity are transferred to the income statement when the hedged transaction affects profit or loss. Where the hedged item is the cost of a non-financial asset or liability, the amounts taken to equity are transferred to the initial carrying amount of the non-financial asset or liability.
If the forecast transaction is no longer expected to occur, amounts previously recognised in equity are transferred to profit or loss. If the hedging instrument expires or is sold, terminated or exercised without replacement or roll-over, or if its designation as a hedge is revoked, amounts previously recognised in equity remain in equity until the forecast transaction occurs. If the related transaction is not expected to occur, the amount is taken to profit or loss.
Hedges of a Net Investment Hedges of a net investment in a foreign operation, including a hedge of a monetary item that is accounted for as part of the net investment, are accounted for in a way similar to cash flow hedges. Gains or losses on the hedging instrument relating to the effective portion of the hedge are recognised directly in equity while any gains or losses relating to the ineffective portion are recognised in profit or loss. On disposal of the foreign operation, the cumulative value of any such gains or losses recognised directly in equity is transferred to profit or loss.
Own shares The cost of purchases of own shares held by the Employee Share Ownership Plan (ESOP) trust are deducted from equity. Where they are issued to employees or sold, no gain or loss is recognised in the income statement. Any proceeds received on disposal of the shares or transfer to employees are recognised in equity.
Own shares purchased under the Equity Capital Management Program (ECMP) are deducted from equity. No gain or loss is recognised in the income statement on the purchase, sale, issue or cancellation of such shares. Such gains and losses are recognised directly in equity.
Interest-bearing loans and borrowings Loans are recognised at inception at the fair value of proceeds received, net of directly attributable transaction costs. Subsequently, they are measured at amortised cost using the effective interest method. Finance costs are recognised in the income statement using the effective interest method.
Convertible borrowings On issue of a convertible borrowing, the fair value of the liability component is determined by discounting the contractual future cash flows using a market rate for a non-convertible instrument with similar terms. This value is carried as a liability on the amortised cost basis until extinguished on conversion or redemption. The remainder of the proceeds are allocated to a separate component of equity, net of issue costs, which remains constant in subsequent periods. Issue costs are apportioned between the liability and equity components based on their respective carrying amounts when the instrument was issued.
6. Principal Accounting Policies continued

Xstrata plc Annual Report 2008 125
On conversion, the liability is reclassified to equity and no gain or loss is recognised in the profit or loss. Where the convertible borrowing is redeemed early or repurchased in a way that does not alter the original conversion privileges, the consideration paid is allocated to the liability and equity components. The consideration relating to the equity component is recognised in equity and the amount of gain or loss relating to the liability element in profit or loss.
The finance costs recognised in respect of the convertible borrowings includes the accretion of the liability component to the amount that will be payable on redemption.
Inventories Inventories are stated at the lower of cost and net realisable value. Cost is determined on a weighted average basis or using a first-in-first-out basis and includes all costs incurred in the normal course of business including direct material and direct labour costs and an allocation of production overheads, depreciation and amortisation and other costs, based on normal production capacity, incurred in bringing each product to its present location and condition. Cost of inventories includes the transfers from equity of gains and losses on qualifying cash flow hedges in respect of the purchase of materials. Inventories are categorised as follows:
> Raw materials and consumables: materials, goods or supplies (including energy sources) to be either directly or indirectly consumed in the production process;
> Work in progress: items stored in an intermediate state that have not yet passed through all the stages of production; and
> Finished goods: products and materials that have passed all stages of the production process.
Net realisable value represents estimated selling price in the ordinary course of business less any further costs expected to be incurred to completion and disposal.
Cash and cash equivalents Cash and cash equivalents comprise cash at bank, cash in hand and short-term deposits with an original maturity of three months or less. For the cash flow statement, cash and cash equivalents include certain bank overdrafts where the facility forms part of the working capital cash management activities.
Government grants Government grants are recognised where there is reasonable assurance that the grant will be received and all the attaching conditions will be complied with. Government grants in respect of capital expenditure are credited to the carrying amount of the related asset and are released to the income statement over the expected useful lives of the relevant assets. Grants which are not associated with an asset are credited to income so as to match them with the expense to which they relate.
Environmental protection, rehabilitation and closure costs Provision is made for close down, restoration and for environmental rehabilitation costs (which include the dismantling and demolition of infrastructure, removal of residual materials and remediation of disturbed areas) in the financial period when the related environmental disturbance occurs, based on the estimated future costs using information available at the balance sheet date. The provision is discounted using a current market-based pre-tax discount rate and the unwinding of the discount is included in interest expense. At the time of establishing the provision, a corresponding asset is capitalised, where it gives rise to a future benefit, and depreciated over future production from the operations to which it relates.
The provision is reviewed on an annual basis for changes to obligations, legislation or discount rates that impact estimated costs or lives of operations. The cost of the related asset is adjusted for
changes in the provision resulting from changes in the estimated cash flows or discount rate and the adjusted cost of the asset is depreciated prospectively.
Rehabilitation trust funds holding monies committed for use in satisfying environmental obligations are included within Other financial assets on the balance sheet.
Employee entitlements Provisions are recognised for short-term employee entitlements, on an undiscounted basis, for services rendered by employees that remain unpaid at the balance sheet date.
Provisions for long-term employee entitlements are measured using the projected unit credit method and discounted at an interest rate equivalent to the current rate of return on a high quality corporate bond of equivalent currency and term to the liabilities.
In some of the Group’s Australian operations, long service leave (an employee entitlement for which a provision is recorded) is administered by an independent fund. The fund collects levies from employers throughout the industry based on the expected cost of future liabilities. When the Group makes long service leave payments to employees covered by the fund, it is reimbursed for the majority of the payment. To reflect the expected reimbursement for future long service leave payments from the fund, a receivable is recorded based on the present value of the future amounts expected to be reimbursed.
Other provisions Provisions are recognised when the Group has a present obligation (legal or constructive), as a result of past events, and it is probable that an outflow of resources that can be reliably estimated will be required to settle the obligation. Where the effect is material, the provision is discounted to net present value using an appropriate current market-based pre-tax discount rate and the unwinding of the discount is included in finance costs.
Taxation Current Tax Current tax for each taxable entity in the Group is based on the local taxable income at the local statutory tax rate enacted or substantively enacted at the balance sheet date and includes adjustments to tax payable or recoverable in respect of previous periods.
Deferred Tax Deferred tax is recognised using the balance sheet method in respect of all temporary differences between the tax bases of assets and liabilities, and their carrying amounts for financial reporting purposes, except as indicated below:
Deferred income tax liabilities are recognised for all taxable temporary differences, except:
> where the deferred income tax liability arises from the initial recognition of goodwill, or the initial recognition of an asset or liability in a transaction that is not a business combination and, at the time of the transaction, affects neither the accounting profit nor taxable profit or loss; and
> in respect of taxable temporary differences associated with investments in subsidiaries, associates and interests in joint ventures, where the timing of the reversal of the temporary differences can be controlled and it is probable that the temporary differences will not reverse in the foreseeable future.
Deferred income tax assets are recognised for all deductible temporary differences, carry-forward of unused tax assets and unused tax losses, to the extent that it is probable that taxable profit will be available against
6. Principal Accounting Policies continued

Notes to the Financial Statements continued
Xstrata plc Annual Report 2008 126
which the deductible temporary differences, and the carry-forward of unused tax assets and unused tax losses can be utilised, except:
> where the deferred income tax asset relating to the deductible temporary difference arises from the initial recognition of an asset or liability in a transaction that is not a business combination and, at the time of the transaction, affects neither the accounting profit nor taxable profit or loss; and
> in respect of deductible temporary differences associated with investments in subsidiaries, associates and interests in joint ventures, deferred tax assets are recognised only to the extent that it is probable that the temporary differences will reverse in the foreseeable future and taxable profit will be available against which the temporary differences can be utilised.
The carrying amount of deferred income tax assets is reviewed at each balance sheet date and reduced to the extent that it is no longer probable that sufficient taxable profit will be available to allow all or part of the deferred income tax asset to be utilised. To the extent that an asset not previously recognised fulfils the criteria for recognition, a deferred income tax asset is recorded.
Deferred tax is measured on an undiscounted basis at the tax rates that are expected to apply in the periods in which the asset is realised or the liability is settled, based on tax rates and tax laws enacted or substantively enacted at the balance sheet date.
Current and deferred tax relating to items recognised directly in equity are recognised in equity and not in the income statement.
Mining taxes and royalties are treated and disclosed as current and deferred taxes if they have the characteristics of an income tax.
Pensions and other post-retirement obligations The Group’s contributions to defined contribution pension plans are charged to the income statement in the year to which they relate.
The Group contributes to separately administered defined benefit pension plans.
For defined benefit funds, plan assets are measured at fair value, while plan liabilities are measured on an actuarial basis using the projected unit credit method and discounted at an interest rate equivalent to the current rate of return on a high quality corporate bond of equivalent currency and term to the plan liabilities. The expected return on plan assets is based on an assessment made at the beginning of the year of long-term market returns on scheme assets, adjusted for the effect on the fair value of plan assets of contributions received and benefits paid during the year. In measuring its defined benefit liability past service costs are recognised as an expense on a straight-line basis over the period until the benefits become vested. To the extent that the benefits vest immediately following the introduction of, or changes to, a defined benefit plan, the past service costs are recognised immediately. When a settlement (eliminating all obligations for part or all of the benefits that have already accrued) or a curtailment (reducing future obligations as a result of material reduction in the scheme membership or a reduction in future entitlement) occurs, the obligation and related plan assets are remeasured using current actuarial assumptions and the resultant gain or loss is recognised in the income statement during the period in which the settlement or curtailment occurs.
The service cost of providing pension benefits to employees for the year is determined using the projected unit method and is recognised in the income statement. The difference between the expected return on plan assets and the unwinding of the discount on plan liabilities is recognised in the income statement.
Actuarial gains or losses are recognised directly in equity through the statement of recognised income and expenses. The full pension surplus or deficit is recorded in the balance sheet, with the exception of the impact of any recognition of past service costs. Surpluses recorded are restricted to the sum of any unrecognised past service costs and present value of any amounts the Group expects to recover by way of refunds from the plan or reductions in future contributions.
The Group also provides post-retirement healthcare benefits to certain employees in Canada, the Dominican Republic, South Africa and the United States. These are accounted for in a similar manner to the defined benefit pension plans. These benefits are unfunded.
Ordinary share capital Ordinary shares issued by the Company are recorded at the net proceeds received, which is the fair value of the consideration received less costs that are incurred in connection with the share issue. The nominal par value of the shares issued is taken to the share capital account and any excess is recorded in the share premium account, including the costs that were incurred with the share issue.
Share-based compensation plans The Group makes share-based awards, including free shares and options, to certain employees.
Equity-settled awards For equity-settled awards, the fair value is charged to the income statement and credited to retained earnings, on a straight-line basis over the vesting period, after adjusting for the estimated number of awards that are expected to vest (taking into account the achievement of non-market-based performance conditions). The fair value of the equity-settled awards is determined at the date of the grant. In calculating fair value, no account is taken of any vesting conditions, other than conditions linked to the price of the shares of the Company (market conditions). The fair value is determined by external experts using option pricing models. At each balance sheet date prior to vesting, the cumulative expense representing the extent to which the vesting period has expired and management’s best estimate of the awards that are ultimately expected to vest is computed (after adjusting for non-market performance conditions). The movement in cumulative expense is recognised in the income statement with a corresponding entry within equity.
No expense is recognised for awards that do not ultimately vest, except for awards where vesting is conditional upon a market condition, which are treated as vesting irrespective of whether or not the market condition is satisfied, provided that all other performance conditions are satisfied.
Where the terms of an equity-settled award are modified, as a minimum an expense is recognised as if the terms had not been modified over the original vesting period. In addition, an expense is recognised for any modification, which increases the total fair value of the share-based payment arrangement, or is otherwise beneficial to the employee as measured at the date of modification, over the remainder of the new vesting period.
Where an equity-settled award is cancelled, it is treated as if it had vested on the date of cancellation, and any expense not yet recognised for the award is recognised immediately. Any compensation paid up to the fair value of the awards at the cancellation or settlement date is deducted from equity, with any excess over fair value being treated as an expense in the income statement. However, if a new award is substituted for the cancelled

Xstrata plc Annual Report 2008 127
award, and designated as a replacement award on the date that it is granted, the new awards are treated as if they are a modification of the original award, as described in the previous paragraph.
Cash-settled awards For cash-settled awards, the fair value is recalculated at each balance date until the awards are settled based on the estimated number of awards that are expected to vest adjusting for market and non-market-based performance conditions. During the vesting period, a liability is recognised representing the portion of the vesting period which has expired at the balance sheet date times the fair value of the awards at that date. After vesting, the full fair value of the unsettled awards at each balance date is recognised as a liability. Movements in the liability are recognised in the income statement. The fair value is recalculated using an option pricing model (refer to note 35).
Borrowing costs Borrowing costs directly attributable to the acquisition, construction or production of an asset that necessarily takes a substantial period of time to get ready for its intended use or sale are capitalised and amortised over the useful life of the asset. Borrowing costs related to the establishment of a loan facility are capitalised and amortised over the life of the facility. Other borrowing costs are recognised as an expense in the financial period incurred.
Comparatives Where applicable, comparatives have been adjusted to disclose them on the same basis as current period figures.
7. Acquisitions
Business combinations Current Year Business Combinations Jubilee Mines NL On 29 October 2007, the Group made an AUD23 per share cash offer for shares in Jubilee Mines NL (Jubilee). On 31 January 2008, the Group declared the offer free from all conditions, and obtained control of Jubilee, following the receipt of acceptances in respect of 62% of Jubilee’s share capital. By 16 February 2008, the Group held 97% of Jubilee and obtained the remaining 3% by 31 March 2008. Under IFRS 3, the acquisition has been accounted for as one transaction occurring on 31 January 2008. The total cost of the acquisition was US$2,875 million. Jubilee, which was previously listed on the Australian stock exchange, owns and operates the Cosmos Nickel operation and is developing the Sinclair Nickel Project in Western Australia.
The fair values of the identifiable assets and liabilities of Jubilee acquired were:
US$m
IFRS carrying
value
Fairvalue
adjustmentsFair value
at acquisition
Property, plant and equipment 218 2,560 2,778Available-for-sale financial assets 8 – 8Prepayments 1 – 1Inventories 8 – 8Income taxes receivable 2 (2) –Trade and other receivables 15 – 15 252 2,558 2,810Trade and other payables (44) – (44)Provisions (11) – (11)Deferred tax liabilities (39) (12) (51)Income tax payable – (7) (7)Net assets 158 2,539 2,697Goodwill arising on acquisition – 54 54 158 2,593 2,751 Consideration: Net cash acquired with the subsidiary (124)Cash paid 2,721Acquisition costs 154 2,751
The goodwill balance is the result of the requirement to recognise a deferred tax liability calculated as the difference between the tax effect of the fair value of the assets and liabilities acquired and their tax bases.
The Group’s share of Jubilee’s profit from the date of acquisition to 31 December 2008 amounted to US$16 million.

Notes to the Financial Statements continued
Xstrata plc Annual Report 2008 128
7. Acquisitions continued
Resource Pacific Holdings Limited On 5 December 2007, the Group announced an unconditional cash offer for shares in Resource Pacific Holdings Limited (Resource Pacific) of AUD2.85 per share and on 8 February 2008 the offer price was increased to AUD3.20 per share. As at 20 February 2008, the Group held 67.5% and as at 23 April 2008, the Group held 89.8% of the total issued shares of Resource Pacific. Under IFRS 3, the acquisition has been accounted for as one transaction occurring on 20 February 2008. The total cost of the acquisition was US$910 million. Resource Pacific was previously listed on the Australian stock exchange and owns the Newpac underground coal mine located in the Hunter Valley coalfields of New South Wales, Australia.
The fair values of the identifiable assets and liabilities of Resource Pacific acquired were:
US$m
IFRS carrying
value
Fairvalue
adjustmentsFair value
at acquisition
Property, plant and equipment 243 979 1,222Deferred tax assets 111 (111) –Other financial assets – 11 11Prepayments 1 – 1Inventories 4 – 4Trade and other receivables 12 – 12 371 879 1,250Trade and other payables (75) – (75)Interest-bearing loans and borrowings (14) – (14)Provisions (7) (196) (203)Deferred tax liabilities – (153) (153)Net assets 275 530 805Minority interests (29) (51) (80)Net attributable assets 246 479 725Goodwill arising on acquisition – 178 178 246 657 903 Consideration: Net cash acquired with the subsidiary (7)Cash paid 903Acquisition costs 7 903
The goodwill balance is the result of the requirement to recognise a deferred tax liability calculated as the difference between the tax effect of the fair value of the assets and liabilities acquired and their tax bases.
The Group’s share of Resource Pacific profit from the date of acquisition amounted to US$41 million.
Douglas Tavistock Joint Venture In March 2008, the Group restructured its Douglas Tavistock Joint Venture (DTJV) with BHP Billiton Energy Coal South Africa (BECSA). Under the terms of the restructuring, the Group acquired and manages the mining of reserves approximately equivalent to its 16% share of the DTJV, in an area contiguous to its 100%-owned Arthur Taylor Colliery Open-cast Mine (ATCOM) operations. The Group acquired approximately 16% of the major mobile equipment and will commence separate mining operations from 1 July 2009. The Group also entered into an interim coal off-take arrangement (export and Eskom) for 18 months with BECSA, effective from 1 January 2008 and a long-term supply arrangement for its share of the former DTJV’s Duhva LT Eskom Coal Supply Agreement. The Group will receive a final consideration payment of US$43 million on 1 July 2009.

Xstrata plc Annual Report 2008 129
Under IFRS this restructure has been accounted for in the period by recognising the net assets obtained at fair value and derecognising the Group’s interest in the DTJV. This has resulted in a gain of US$213 million, calculated as follows:
US$m Fair value
at acquisition
Fair value of net assets obtained Intangible assets 62Property, plant and equipment 260Trade and other receivables 78 400Other financial liabilities (42)Deferred tax liabilities (72)Net assets obtained 286Book value of net assets derecognised Property, plant and equipment 92Inventories 2Trade and other receivables 4Trade and other payables (17)Provisions (8)Net assets derecognised 73Gain on transaction 213
If the above combinations had taken place at the beginning of 2008, the Group’s results would have been:
US$m 2008
Revenue 27,977Profit before interest, taxation, depreciation and amortisation 9,412Profit before interest and taxation 6,035Profit for the year 3,852
Prior year business combinations Frieda River In January 2007, the Group exercised an option to obtain a 73.7% interest in the Frieda River copper-gold porphyry in Papua New Guinea for US$14 million.
Tampakan Following an announcement in late 2006, in March 2007 the Group completed the exercise of its option to acquire a 62.5% interest in Sagittarius Mines Inc (SMI) for US$47 million. SMI is the holder of Tampakan copper-gold project. The Group now has management control of the Tampakan project.
Narama In August 2007, the Group acquired the remaining 50% interest in the Narama thermal coal mine in Australia from Iluka Resources Limited (Iluka) for US$58 million.
Cumnock Coal Limited In September 2007, the Group acquired the 16% of Cumnock Coal Limited which it previously did not own for US$22 million. Cumnock Coal Limited is a coal mining company, which was listed on the Australian Stock Exchange.
Austral Coal Limited In October 2007, the Group acquired 85.85% of Austral Coal Limited (Austral) and obtained control of the company. By 21 December 2007, the Group had acquired the remaining 14.15% of the company. The total cost of these purchases was US$542 million. Austral owns the Tahmoor underground coking coal operation in the southern coalfields of New South Wales, Australia.

Notes to the Financial Statements continued
Xstrata plc Annual Report 2008 130
7. Acquisitions continued
The acquisition accounting was provisional at 31 December 2007 due to the timing and complexity of the acquisition. In 2008, the acquisition accounting was finalised as follows:
US$m
Provisional fair value as
previously reported
Fair value adjustments(a)
Fair valueat acquisition
Property, plant and equipment 729 (49) 680Prepayments 6 – 6Inventories 14 – 14Trade and other receivables 18 – 18 767 (49) 718Trade and other payables (24) – (24)Interest-bearing loans and borrowings (167) – (167)Provisions (39) (4) (43)Deferred tax liabilities (165) 91 (74)Net assets 372 38 410Goodwill arising on acquisition(b) 169 (38) 131 541 – 541 Consideration: Net cash acquired with the subsidiary (1) – (1)Cash paid 512 – 512Contingent consideration 30 – 30 541 – 541
(a) These adjustments arose due to the revisions to the valuations of property, plant and equipment, the recognition of tax losses and the resulting impact on minority interests.
(b) The goodwill balance is a result of the requirement to recognise a deferred tax liability calculated as the difference between the tax effect of the fair value of the assets and liabilities and their tax bases.
The Group’s share of Austral’s loss from the date of acquisition to 31 December 2007 amounted to US$4 million.
Mangoola In October 2007, the Group acquired the Mangoola (formerly Anvil Hill) coal project from Centennial Coal Company Limited for US$468 million. The Mangoola coal project is located in the Upper Hunter Valley, Australia.
The acquisition accounting was provisional at 31 December 2007 due to the timing of the acquisition. In 2008, the acquisition accounting was finalised as follows:
US$m
Provisional fair value as
previously reported
Fair value adjustments(a)
Fair valueat acquisition
Property, plant and equipment 502 15 517Deferred tax assets 14 6 20 516 21 537Provisions (48) (21) (69)Net assets 468 – 468 Consideration: Cash paid 445 – 445Contingent consideration 23 – 23 468 – 468
(a) These adjustments arose due to the revisions to the valuations of property, plant and equipment and provisions.
The Group’s share of Mangoola’s profit from the date of acquisition to 31 December 2007 amounted to US$nil.

Xstrata plc Annual Report 2008 131
Eland Platinum Holdings Limited In November 2007, the Group acquired 100% of Eland Platinum Holdings Limited (Eland). Eland was previously listed on the Johannesburg Stock Exchange and holds an indirect 65% interest in the Elandsfontein platinum project. The Group also acquired an additional 9% interest in the Elandsfontein platinum project increasing the Group’s interest in the project to 74%. In addition to the Elandsfontein platinum project, Eland has controlling interests in Madibeng Platinum (Pty) Ltd and Beestkraal Platinum Mines (Pty) Ltd. These companies own the rights to other platinum resources in South Africa. The total cost of the acquisition was US$1,113 million.
The acquisition accounting was provisional at 31 December 2007 due to the complexity and timing of the acquisition. In 2008, the acquisition accounting was finalised as follows:
US$m
Provisional fair value as
previously reported
Fair value adjustments(a)
Fair valueat acquisition
Property, plant and equipment 1,556 (41) 1,515Inventories 16 – 16Trade and other receivables 4 – 4 1,576 (41) 1,535Trade and other payables (13) – (13)Interest-bearing loans and borrowings (86) – (86)Provisions (5) – (5)Deferred tax liabilities (400) 12 (388)Income taxes payable (1) – (1)Net assets 1,071 (29) 1,042Minority interests (406) 44 (362)Net attributable assets 665 15 680Goodwill arising on acquisition(b) 398 (15) 383 1,063 – 1,063 Consideration: Net cash acquired with the subsidiary (50) – (50)Cash paid 1,113 – 1,113 1,063 – 1,063
(a) These adjustments arose due to the revisions to the valuations of property, plant and equipment. (b) The goodwill balance is a result of the requirement to recognise a deferred tax liability calculated as the difference between the tax effect of the fair value of the assets
and liabilities and their tax bases.
The Group’s share of Eland’s loss from the date of acquisition to 31 December 2007 amounted to US$4 million.
If the above combinations had taken place at the beginning of 2007, the Group’s results would have been:
US$m 2007
Revenue 29,256Profit before interest, taxation, depreciation and amortisation 11,314Profit before interest and taxation 9,141Profit for the year 5,866
Investment in associates Current year investment in associates Lonmin plc In August 2008, the Group acquired 16,706,481 common shares of Lonmin plc (Lonmin) representing 10.7% of the common shares for consideration of US$1,084 million or GBP33 per share. In October 2008, the Group acquired a further 22,232,940 common shares representing 14.2% of the common shares of Lonmin for a consideration of US$794 million or GBP20 per share, increasing the Group’s holding to 24.9% at a cost of US$1,878 million. This investment has been treated as an associate following the increase of the Group’s holding in Lonmin to 24.9% (refer to note 20).

Notes to the Financial Statements continued
Xstrata plc Annual Report 2008 132
7. Acquisitions continued
Consolidated information The below information provides aggregate amounts of acquired assets and liabilities for all business combinations in 2008 and 2007:
US$m 2008 2007
Intangible assets 62 –Property, plant and equipment 4,260 2,922Inventories 12 30Trade and other receivables 105 38Investments in associates – –Available-for-sale financial assets 8 –Other financial assets 11 –Deferred tax assets – 6Prepayments 2 6 4,460 3,002Trade and other payables (119) (46)Interest-bearing loans and borrowings (14) (301)Derivative financial liabilities (42) –Provisions (214) (117)Deferred tax liabilities (276) (469)Income tax payable (7) (1)Net assets 3,788 2,068Minority interests (80) (385)Net attributable assets 3,708 1,683Goodwill 232 536Net attributable assets including goodwill 3,940 2,219 Consideration: Net cash acquired with the subsidiary (131) (52)Acquisition costs 161 3Cash paid 3,624 2,179Gain on restructure of DTJV 213 –Net assets derecognised 73 –Contingent consideration – 89 3,940 2,219

Xstrata plc Annual Report 2008 133
8. Discontinued Operations and Disposals
Current year disposals Resource Pacific Holdings Limited Following the acquisition of 89.8% of Resource Pacific in February 2008, 12% of the shares were sold in October 2008 at cost for US$122 million (refer to note 7).
Douglas Tavistock Joint Venture In March 2008, the Group restructured its Douglas Tavistock Joint Venture (DTJV) with BHP Billiton Energy Coal South Africa (BECSA) resulting in the disposal of the Group’s interest in the joint venture (refer to note 7).
Prior year disposals Aluminium The Aluminium business was sold on 18 May 2007 to Apollo Management LP. The disposal proceeds amounted to US$1,150 million before disposal costs of US$24 million, resulting in the Group realising a gain of US$1 million after tax of US$12 million.
The results of the Aluminium business for the periods ended are presented below:
US$m 2007
Revenue 542Cost of sales (before depreciation and amortisation) (406)Distribution costs (9)Administrative expenses (7)Profit before interest, taxation, depreciation and amortisation 120Depreciation and amortisation – cost of sales (31)Profit before interest and taxation 89Finance income 2Finance costs (2)Profit before taxation 89Income tax expense (37)Profit for the period from discontinued operation 52Gain on disposal of the discontinued operation 1Profit after tax for the period from discontinued operations 53
The carrying value of the major classes of assets and liabilities at the date of the sale were:
US$m at 18.05.07
Intangible assets 139Property, plant and equipment 1,011Inventories 215Trade and other receivables 176Other financial assets 31Trade and other payables (92)Interest-bearing loans and borrowings (1)Provisions (37)Pension deficit (19)Deferred tax liabilities (298)Income tax payable (6)Net assets 1,119 Cash inflow on disposal: Cash disposed of with the subsidiary (6)Cash received 1,150Disposal costs (24)Net cash inflow 1,120Gain on disposal of the discontinued operation 1
Earnings per share from discontinued operations:
US$ 2007
Basic earnings per share 0.06Diluted earnings per share 0.05
The cash flows arising from the Aluminium business unit up to the date of sale were operational in nature and were materially the same as its profits.

Notes to the Financial Statements continued
Xstrata plc Annual Report 2008 134
8. Discontinued Operations and Disposals continued
Cumnock Coal Limited Following the acquisition of 100% of the assets of Cumnock Coal in September 2007 (refer above), in December 2007, 10% of the assets were sold for US$7 million.
Consolidated information The below information is provided in aggregate for the 2008 and 2007 disposals:
US$m 2008 2007
Intangible assets – 139Property, plant and equipment 92 1,018Inventories 2 216Trade and other receivables 4 176Financial assets – 31 98 1,580Trade and other payables (17) (93)Interest-bearing loans and borrowings – (1)Provisions (8) (37)Pension deficit – (19)Deferred tax liabilities 34 (298)Income tax payable – (6)Net assets 107 1,126Minority interests 94 –Net attributable assets 201 1,126 Consideration: Net cash disposed of with the subsidiary – (6)Cash received 128 1,150Disposal costs – (24)Net assets obtained 286 –Contingent consideration – 7Total consideration 414 1,127Gain on disposal of discontinued operations and restructure of DTJV 213 1
9. Segmental Analysis
The Group’s primary reporting format is business segments and its secondary format is geographical segments. The operating businesses are organised and managed separately according to the nature of the products produced, with each segment representing a strategic business unit that offers different products and serves different markets. Transfer prices between business segments are set on an arm’s-length basis in a manner similar to transactions with third parties. The Group’s geographical segments are determined by the location of the Group’s assets and operations.

Xstrata plc Annual Report 2008 135
Business segments The following tables present revenue and profit information and certain asset and liability information regarding the Group’s business segments for the years ended 31 December 2008 and 2007.
For the year ended 31 December
US$m
Beforeexceptional
itemsExceptional
items 2008
Before exceptional
items Exceptional
items 2007
Revenue External parties: Coal – Thermal 6,347 – 6,347 3,614 – 3,614Coal – Coking 1,597 – 1,597 587 – 587Coal 7,944 – 7,944 4,201 – 4,201Ferroalloys 1,733 – 1,733 1,223 – 1,223Platinum 269 – 269 129 – 129Copper 11,464 – 11,464 12,794 – 12,794Nickel 3,105 – 3,105 5,252 – 5,252Zinc Lead 3,202 – 3,202 4,726 – 4,726Technology 235 – 235 217 – 217Revenue (continuing operations) 27,952 – 27,952 28,542 – 28,542Inter-segmental: Coal 9 – 9 3 – 3Copper 76 – 76 65 – 65Nickel 152 – 152 131 – 131Zinc Lead 254 – 254 214 – 214Technology 15 – 15 – – –Eliminations (506) – (506) (413) – (413)Group revenues 27,952 – 27,952 28,542 – 28,542Discontinued operations: Aluminium – – – 542 – 542Total 27,952 – 27,952 29,084 – 29,084
US$m
Beforeexceptional
itemsExceptional
items 2008
Before exceptional
items Exceptional
items 2007
Profit before interest, taxation, depreciation and amortisation (EBITDA) Coal – Thermal 3,148 11 3,159 977 – 977Coal – Coking 1,022 – 1,022 214 – 214Coal 4,170 11 4,181 1,191 – 1,191Ferroalloys 959 – 959 382 – 382Platinum 135 8 143 66 (25) 41Copper 3,160 – 3,160 4,987 – 4,987Nickel 816 (165) 651 2,577 275 2,852Zinc Lead 435 (53) 382 1,810 – 1,810Technology 38 – 38 47 – 47Segment EBITDA (continuing operations) 9,713 (199) 9,514 11,060 250 11,310Share of results from associates (net of tax, continuing operations): Coal 3 – 3 3 – 3Platinum – (34) (34) – – –Zinc Lead 9 – 9 12 – 12EBITDA (continuing operations) 9,725 (233) 9,492 11,075 250 11,325Unallocated (68) – (68) (187) – (187) 9,657 (233) 9,424 10,888 250 11,138EBITDA (discontinuing operations): Aluminium – – – 120 13 133Total 9,657 (233) 9,424 11,008 263 11,271

Notes to the Financial Statements continued
Xstrata plc Annual Report 2008 136
9. Segmental Analysis continued
US$m
Beforeexceptional
itemsExceptional
items 2008
Before exceptional
items Exceptional
items 2007
Depreciation and amortisation Depreciation: Coal 624 – 624 504 – 504Ferroalloys 52 – 52 52 – 52Platinum 35 – 35 7 – 7Copper 863 – 863 824 – 824Nickel 475 – 475 405 – 405Zinc Lead 331 – 331 293 – 293Technology 6 – 6 4 – 4Depreciation and amortisation (continuing operations) 2,386 – 2,386 2,089 – 2,089Unallocated 10 – 10 7 – 7 2,396 – 2,396 2,096 – 2,096Discontinued operations: Aluminium – – – 31 – 31Total 2,396 – 2,396 2,127 – 2,127 Impairment of assets Ferroalloys – 18 18 – – –Copper – 463 463 – – –Nickel – 475 475 – – –Zinc Lead – 18 18 – – –Total impairment of assets (continuing operations) – 974 974 – – –
US$m
Beforeexceptional
itemsExceptional
items 2008
Before exceptional
items Exceptional
items 2007
Profit before interest and taxation (EBIT) Segment result: Coal – Thermal 2,616 11 2,627 544 – 544Coal – Coking 930 – 930 143 – 143Coal 3,546 11 3,557 687 – 687Ferroalloys 907 (18) 889 330 – 330Platinum 100 8 108 59 (25) 34Copper 2,297 (463) 1,834 4,163 – 4,163Nickel 341 (640) (299) 2,172 275 2,447Zinc Lead 104 (71) 33 1,517 – 1,517Technology 32 – 32 43 – 43Segment EBIT (continuing operations) 7,327 (1,173) 6,154 8,971 250 9,221Share of results from associates (net of tax, continuing operations): Coal 3 – 3 3 – 3Platinum – (34) (34) – – –Zinc Lead 9 – 9 12 – 12EBIT (continuing operations) 7,339 (1,207) 6,132 8,986 250 9,236Unallocated (78) – (78) (194) – (194) 7,261 (1,207) 6,054 8,792 250 9,042Finance income 192 69 261 142 74 216Finance expense (852) (295) (1,147) (935) (196) (1,131)Profit before taxation 6,601 (1,433) 5,168 7,999 128 8,127Income tax expense (1,634) 330 (1,304) (2,301) (10) (2,311)Profit from continuing operations 4,967 (1,103) 3,864 5,698 118 5,816Profit after tax from discontinued operations: Aluminium – – – 52 1 53Total 4,967 (1,103) 3,864 5,750 119 5,869

Xstrata plc Annual Report 2008 137
US$m At 31.12.08 At 31.12.07
Total assets Before deferred tax assets and investments in associates: Coal 11,950 11,293Ferroalloys 1,420 1,449Platinum 1,642 2,138Copper 18,050 19,825Nickel 12,422 9,402Zinc Lead 6,532 7,015Technology 124 140Total segmental assets (continuing operations) 52,140 51,262Unallocated* 1,208 666Total 53,348 51,928 Deferred tax assets: Coal 2 2Ferroalloys 1 2Zinc Lead – 3Total deferred tax assets (continuing operations) 3 7 Investment in associates: Coal 46 54Platinum 1,788 –Zinc Lead 129 132Total investment in associates (continuing operations) 1,963 186 Total assets Coal 11,998 11,349Ferroalloys 1,421 1,451Platinum 3,430 2,138Copper 18,050 19,825Nickel 12,422 9,402Zinc Lead 6,661 7,150Technology 124 140Total assets (from continuing operations) 54,106 51,455Unallocated* 1,208 666Total assets 55,314 52,121
* Includes corporate assets not directly attributable to business segments.

Notes to the Financial Statements continued
Xstrata plc Annual Report 2008 138
9. Segmental Analysis continued
US$m At 31.12.08 At 31.12.07
Total liabilities Before tax liabilities, interest-bearing loans and borrowings: Coal 1,807 1,329Ferroalloys 211 183Platinum 39 20Copper 1,989 2,438Nickel 1,753 1,354Zinc Lead 1,106 1,362Technology 65 108Total segmental liabilities (continuing operations) 6,970 6,794Unallocated 1,246 589Total 8,216 7,383 Tax liabilities, interest-bearing loans and borrowings*: Coal 1,943 1,775Ferroalloys 248 188Platinum 274 435Copper 1,779 3,059Nickel 1,212 1,476Zinc Lead 325 710Technology – 10Total tax liabilities, interest-bearing loans and borrowings (continuing operations) 5,781 7,653Unallocated 16,918 11,871Total 22,699 19,524 Total liabilities Coal 3,750 3,104Ferroalloys 459 371Platinum 313 455Copper 3,768 5,497Nickel 2,965 2,830Zinc Lead 1,431 2,072Technology 65 118Total liabilities (from continuing operations) 12,751 14,447Unallocated 18,164 12,460Total 30,915 26,907
* These liabilities are included in interest-bearing loans and borrowings, convertible borrowings, deferred tax liabilities and income taxes payable line items in the balance sheet.

Xstrata plc Annual Report 2008 139
US$m At 31.12.08 At 31.12.07
Net assets Before deferred tax assets and liabilities, investment in associates, interest-bearing loans and borrowings: Coal 10,143 9,964Ferroalloys 1,209 1,266Platinum 1,603 2,118Copper 16,061 17,387Nickel 10,669 8,048Zinc Lead 5,426 5,653Technology 59 32Total segmental net assets (continuing operations) 45,170 44,468Unallocated* (38) 77Total 45,132 44,545 Deferred tax assets, tax liabilities, interest-bearing loans and borrowings: Coal (1,941) (1,773)Ferroalloys (247) (186)Platinum (274) (435)Copper (1,779) (3,059)Nickel (1,212) (1,476)Zinc Lead (325) (707)Technology – (10)Total (continuing operations) (5,778) (7,646)Unallocated* (16,918) (11,871)Total (22,696) (19,517) Investment in associates: Coal 46 54Platinum 1,788 –Zinc Lead 129 132Total (continuing operations) 1,963 186 Net assets Coal 8,248 8,245Ferroalloys 962 1,080Platinum 3,117 1,683Copper 14,282 14,328Nickel 9,457 6,572Zinc Lead 5,230 5,078Technology 59 22Net assets (from continuing operations) 41,355 37,008Unallocated* (16,956) (11,794)Total 24,399 25,214
* Includes corporate assets and liabilities not directly attributable to business segments.
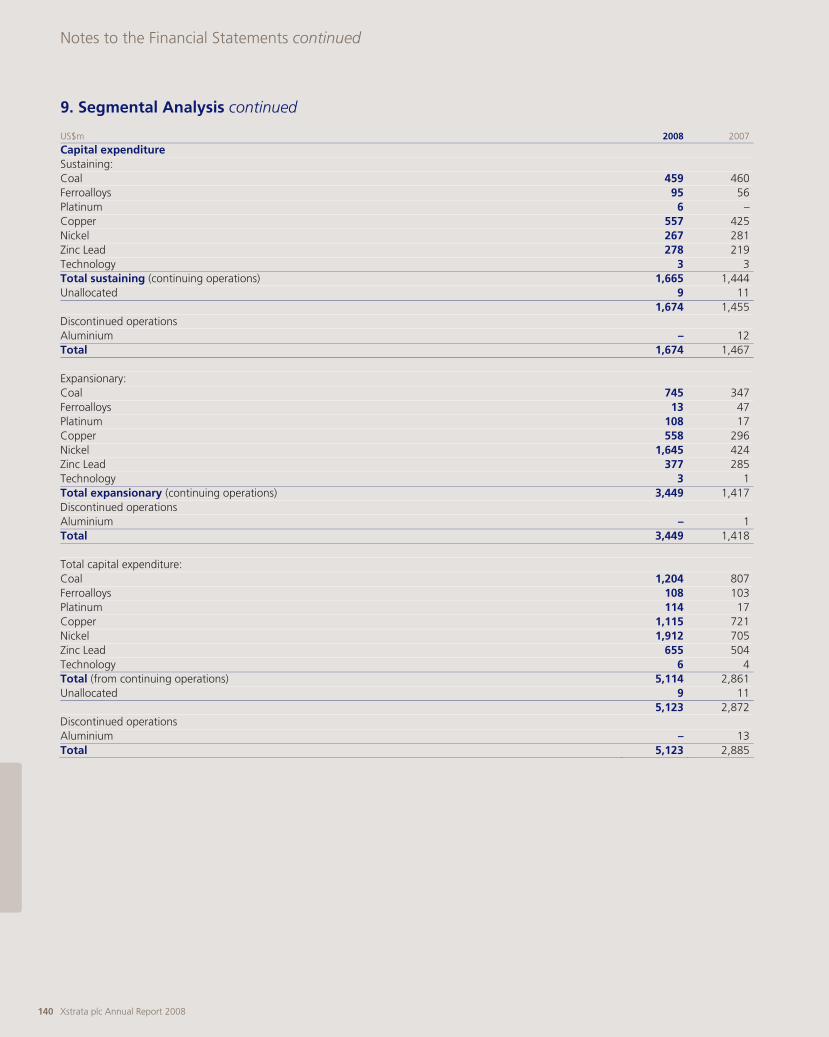
Notes to the Financial Statements continued
Xstrata plc Annual Report 2008 140
9. Segmental Analysis continued
US$m 2008 2007
Capital expenditure Sustaining: Coal 459 460Ferroalloys 95 56Platinum 6 –Copper 557 425Nickel 267 281Zinc Lead 278 219Technology 3 3Total sustaining (continuing operations) 1,665 1,444Unallocated 9 11 1,674 1,455Discontinued operations Aluminium – 12Total 1,674 1,467 Expansionary: Coal 745 347Ferroalloys 13 47Platinum 108 17Copper 558 296Nickel 1,645 424Zinc Lead 377 285Technology 3 1Total expansionary (continuing operations) 3,449 1,417Discontinued operations Aluminium – 1Total 3,449 1,418 Total capital expenditure: Coal 1,204 807Ferroalloys 108 103Platinum 114 17Copper 1,115 721Nickel 1,912 705Zinc Lead 655 504Technology 6 4Total (from continuing operations) 5,114 2,861Unallocated 9 11 5,123 2,872Discontinued operations Aluminium – 13Total 5,123 2,885

Xstrata plc Annual Report 2008 141
The average number of employees, which includes executive directors and excludes contractors, during the year was as follows:
2008 2007
Coal 9,622 9,179Ferroalloys 8,374 7,525Platinum 1,102 974Copper 11,131 10,368Nickel 4,520 4,738Zinc Lead 5,029 4,734Technology 162 137Total (continuing operations) 39,940 37,655Unallocated 109 103 40,049 37,758Discontinued operations Aluminium – 1,250Total 40,049 39,008
The average number of contractors during the year was as follows:
Coal 8,680 6,156Ferroalloys 4,869 4,261Platinum 1,398 398Copper 9,807 8,425Nickel 2,148 1,332Zinc Lead 1,316 1,684Technology 69 65Total (continuing operations) 28,287 22,321Unallocated 4 5 28,291 22,326Discontinued operations Aluminium – 178Total 28,291 22,504

Notes to the Financial Statements continued
Xstrata plc Annual Report 2008 142
9. Segmental Analysis continued
Geographical segments The following tables present revenue and profit information and certain asset and liability information regarding the Group’s geographical segments for the years ended 31 December 2008 and 2007.
For the year ended 31 December
US$m
Beforeexceptional
itemsExceptional
items 2008
Before exceptional
items Exceptional
items 2007
Revenue by origin External parties: Africa 3,109 – 3,109 2,272 – 2,272Americas North 7,394 – 7,394 10,448 – 10,448Americas South 6,200 – 6,200 7,673 – 7,673Australasia 8,512 – 8,512 5,490 – 5,490Europe 2,737 – 2,737 2,659 – 2,659Revenue (continuing operations) 27,952 – 27,952 28,542 – 28,542Discontinued operations: Americas North – – – 542 – 542Total 27,952 – 27,952 29,084 – 29,084 Revenue by destination External parties: Africa 725 – 725 449 – 449Americas North 6,516 – 6,516 7,000 – 7,000Americas South 1,415 – 1,415 1,582 – 1,582Asia 9,894 – 9,894 8,594 – 8,594Australasia 1,083 – 1,083 1,176 – 1,176Europe 8,216 – 8,216 9,662 – 9,662Middle East 103 – 103 79 – 79Revenue (continuing operations) 27,952 – 27,952 28,542 – 28,542Discontinued operations: Americas North – – – 542 – 542Total 27,952 – 27,952 29,084 – 29,084
US$m
Beforeexceptional
itemsExceptional
items 2008
Before exceptional
items Exceptional
items 2007
EBITDA Africa 1,636 19 1,655 683 (25) 658Americas North 761 (165) 596 2,799 275 3,074Americas South 2,719 – 2,719 4,614 – 4,614Australasia 4,229 (53) 4,176 2,475 – 2,475Europe 368 – 368 489 – 489Segment EBITDA (continuing operations) 9,713 (199) 9,514 11,060 250 11,310Share of results from associates (net of tax, continuing operations): Americas North 9 – 9 12 – 12Africa – (34) (34) – – –Australasia 3 – 3 3 – 3EBITDA (continuing operations) 9,725 (233) 9,492 11,075 250 11,325Unallocated (68) – (68) (187) – (187) 9,657 (233) 9,424 10,888 250 11,138EBITDA (discontinued operations) Americas North – – – 120 13 133Total 9,657 (233) 9,424 11,008 263 11,271

Xstrata plc Annual Report 2008 143
US$m
Beforeexceptional
itemsExceptional
items 2008
Before exceptional
items Exceptional
items 2007
Depreciation and amortisation Africa 219 – 219 185 – 185Americas North 508 – 508 584 – 584Americas South 723 – 723 751 – 751Australasia 789 – 789 526 – 526Europe 147 – 147 43 – 43Depreciation and amortisation 2,386 – 2,386 2,089 – 2,089(from continuing operations) Unallocated 10 – 10 7 – 7 2,396 – 2,396 2,096 – 2,096Discontinued operations: Americas North – – – 31 – 31Total 2,396 – 2,396 2,127 – 2,127 Impairment of assets Africa – 18 18 – – –Americas North – 247 247 – – –Americas South – 691 691 – – –Australasia – 18 18 – – –Total impairment of assets (continuing operations) – 974 974 – – –
US$m
Beforeexceptional
itemsExceptional
items 2008
Before exceptional
items Exceptional
items 2007
EBIT Segment result: Africa 1,417 1 1,418 498 (25) 473Americas North 253 (412) (159) 2,215 275 2,490Americas South 1,996 (691) 1,305 3,863 – 3,863Australasia 3,440 (71) 3,369 1,949 – 1,949Europe 221 – 221 446 – 446Segment EBIT (continuing operations) 7,327 (1,173) 6,154 8,971 250 9,221Share of results from associates (net of tax, continuing operations): Americas North 3 – 3 12 – 12Africa – (34) (34) – – –Australasia 9 – 9 3 – 3EBIT (continuing operations) 7,339 (1,207) 6,132 8,986 250 9,236Unallocated (78) – (78) (194) – (194) 7,261 (1,207) 6,054 8,792 250 9,042Finance income 192 69 261 142 74 216Finance expense (852) (295) (1,147) (935) (196) (1,131)Profit before taxation 6,601 (1,433) 5,168 7,999 128 8,127Income tax expense (1,634) 330 (1,304) (2,301) (10) (2,311)Profit from continuing operations 4,967 (1,103) 3,864 5,698 118 5,816Profit after tax from discontinued operations: Americas North – – – 52 1 53Total 4,967 (1,103) 3,864 5,750 119 5,869

Notes to the Financial Statements continued
Xstrata plc Annual Report 2008 144
9. Segmental Analysis continued
US$m At 31.12.08 At 31.12.07
Total assets Africa 7,850 6,330Americas North 7,344 9,835Americas South 17,785 18,023Australasia 15,529 12,398Europe 2,867 2,138Total segmental assets (continuing operations) 51,375 48,724Unallocated* 3,939 3,397Total 55,314 52,121Total liabilities Africa 2,027 1,891Americas North 2,670 3,623Americas South 3,967 4,464Australasia 3,715 3,945Europe 372 524Total (continuing operations) 12,751 14,447Unallocated* 18,164 12,460Total 30,915 26,907Net assets Africa 5,823 4,439Americas North 4,674 6,212Americas South 13,818 13,559Australasia 11,814 8,453Europe 2,495 1,614Total (continuing operations) 38,624 34,277Unallocated* (14,225) (9,063)Total 24,399 25,214
* Includes corporate assets and liabilities not directly attributable to business segments.

Xstrata plc Annual Report 2008 145
US$m 2008 2007
Capital expenditure Sustaining: Africa 228 184Americas North 348 371Americas South 415 264Australasia 600 588Europe 74 37Total sustaining (continuing operations) 1,665 1,444Unallocated 9 11 1,674 1,455Discontinued operations: Americas North – 12Total 1,674 1,467 Expansionary: Africa 392 221Americas North 568 311Americas South 460 278Australasia 1,985 585Europe 44 22Total expansionary (continuing operations) 3,449 1,417Discontinued operations: Americas North – 1Total 3,449 1,418 Total: Africa 620 405Americas North 916 682Americas South 875 542Australasia 2,585 1,173Europe 118 59Total (continuing operations) 5,114 2,861Unallocated 9 11 5,123 2,872Discontinued operations: Americas North – 13Total 5,123 2,885

Notes to the Financial Statements continued
Xstrata plc Annual Report 2008 146
9. Segmental Analysis continued
The average number of employees, which includes executive directors and excludes contractors, during the year was as follows:
2008 2007
Africa 14,095 13,372Americas North 7,635 7,250Americas South 7,852 8,048Australasia 8,301 7,462Europe 2,057 1,523Total (continuing operations) 39,940 37,655Unallocated 109 103 40,049 37,758Discontinued operations: Americas North – 1,250Total 40,049 39,008 The average number of contractors during the year was as follows: Africa 11,823 7,789Americas North 1,871 1,847Americas South 8,790 7,980Australasia 5,516 4,465Europe 287 240Total (continuing operations) 28,287 22,321Unallocated 4 5 28,291 22,326Discontinued operations: Americas North – 178Total 28,291 22,504

Xstrata plc Annual Report 2008 147
10. Revenue and Expenses
Revenue and expenses US$m 2008 2007
Continuing operations: Revenue – sales of goods 27,952 28,542Less cost of sales – after depreciation and amortisation and impairment of assets (19,347) (17,582)Gross profit 8,605 10,960Administrative expenses – after depreciation and amortisation and impairment of assets 342 744Inventory recognised as an expense 19,347 17,582Operating lease rental expense – minimum lease payments 49 27Royalties paid 724 630Research and development 6 6Discontinued operations: Revenue – sales of goods – 542Less cost of sales – after depreciation and amortisation and impairment of assets – (437)Gross profit – 105Inventory recognised as an expense – 437Operating lease rental expense – minimum lease payments – 1Royalties paid – 1
Depreciation and amortisation US$m 2008 2007
Continuing operations: Depreciation of owned assets 2,271 1,980Depreciation of assets held under finance leases and hire purchase contracts 15 14Total depreciation from continuing operations 2,286 1,994Amortisation of intangible assets 110 102Total depreciation and amortisation from continuing operations 2,396 2,096Discontinued operations: Depreciation of owned assets – 31Total depreciation 2,396 2,127
Employee costs including directors’ emoluments (refer to the Directors’ Remuneration Report on pages 104 to 107 for details) US$m 2008 2007
Continuing operations: Wages and salaries 2,573 2,164Pension and other post-retirement benefit costs (refer to note 35) 188 154Social security and other benefits 150 125Share-based compensation plans (refer to note 35) 6 106Employee costs from continuing operations 2,917 2,549Discontinued operations: Wages and salaries – 54Pension and other post-retirement benefit costs (refer to note 35) – 2Employee costs from discontinued operations – 56Total employee costs 2,917 2,605

Notes to the Financial Statements continued
Xstrata plc Annual Report 2008 148
10. Revenue and Expenses continued
Auditors’ remuneration US$m 2008 2007
Auditors’ remuneration(a): – Group auditors – UK 1 1– Group auditors – overseas 11 10 12 11Amounts paid to auditors for other work: Group auditors(b) – Corporate finance transactions(c) 3 10– Taxation(d) 3 3– Other(e) 2 1 8 14Other audit firms – Internal audit 1 2– Other(f) 4 1 5 3
(a) The Group audit fee includes US$45,000 (2007: US$42,000) in respect of the parent company. (b) Included in other fees to auditors is US$1 million (2007: US$1 million) relating to the Company and its UK subsidiaries. (c) 2008 amounts relate to the 2008 acquisitions, the ongoing integration of previous acquisitions and other transactional support. 2007 amounts relate to the 2007
acquisitions, other transactional support and the ongoing integration of 2006 integrations. (d) Includes corporate tax compliance and advisory services. (e) Primarily relates to accounting advice and non-statutory assurance services. (f) Includes tax advisory services, accounting assistance and acquisition due diligence.
The Corporate Governance Report set out on pages 91 to 97 details the Group’s policy with regard to the independence and objectivity of the external and internal auditors and the provision and approval of non-audit services provided by the external auditors.
Finance income US$m 2008 2007
Continuing operations: Bank interest 65 101Dividends 2 4Interest – other 125 37Finance income before exceptional items from continuing operations 192 142Foreign currency gains on bank loans* 20 –Recycled gains from the foreign currency translation reserve 49 74Exceptional finance income from continuing operations 69 74Total finance income from continuing operations 261 216Discontinued operations: Bank interest – 2Total finance income 261 218
* These amounts relate to foreign currency gains and losses on non-US$ borrowings, predominantly CAD borrowings.

Xstrata plc Annual Report 2008 149
Finance costs US$m 2008 2007
Continuing operations: Amortisation of loan issue costs 9 24Convertible borrowings amortised cost charge 4 3Discount unwinding 109 90Finance charges payable under finance leases and hire purchase contracts 6 11Interest on bank loans and overdrafts 307 394Interest on convertible borrowings and capital market notes 393 366Interest on minority interest loans 6 6Interest on preference shares 15 18Interest – other 3 23Finance cost before exceptional items from continuing operations 852 935Foreign currency losses on bank loans* – 34Recycled losses from the foreign currency translation reserve 295 102Loan issue costs written off on facility refinancing – 60Exceptional finance cost from continuing operations 295 196Total finance cost from continuing operations 1,147 1,131Discontinued operations: Discount unwinding – 1Interest on bank loans and overdrafts – 1Total finance cost 1,147 1,133
* These amounts relate to foreign currency gains and losses on non-US$ borrowings, predominantly CAD borrowings.
Total interest income and expense (calculated using the effective interest method) for financial assets and liabilities not at fair value through the profit and loss are US$190 million (2007: US$140 million) and US$730 million (2007: US$819 million) respectively.
Exceptional items Impairment of assets The Group completed impairment testing for all its cash-generating units at 31 December 2008 and identified that certain assets were impaired. Ferroalloys minerals reserves were impaired by US$18 million. The Falcondo ferronickel assets in the Dominican Republic were impaired by US$455 million, including goodwill of US$176 million, and the Sudbury nickel assets were impaired by US$20 million. The impairment charge relating to Falcondo follows the decision to place the operation on prolonged care and maintenance. The Kidd Creek copper operations in Canada were impaired by US$227 million following a re-evaluation of closure and rehabilitation costs. The Altonorte and Lomas Bayas copper operations in Chile recognised impairment charges against their carrying value of property, plant and equipment assets of US$92 million and US$144 million (including goodwill of US$37 million) respectively. These impairment charges have been mainly caused by weaker domestic demand for sulphuric acid and medium-term environmental capital expenditure requirements. The Lennard Shelf zinc joint venture assets were impaired by US$18 million. A net impairment charge of US$34 million was recorded in respect of the Group’s investment in Lonmin following the changes in foreign exchange rates and commodity price outlook that have occurred since the acquisition date (refer to note 15).
Inventory write downs Nickel inventory net realisable value write downs of US$93 million were recognised due to reduced prices at year end.
Liability fair value adjustment An expense of US$194 million (2007: US$25 million) has been recognised due to the impact of increasing coal prices on the fair value of the liabilities to African Rainbow Minerals Limited (ARM) and the black economic empowerment disposal to Kagiso of an interest in the Mototolo joint venture (refer note 31).
Profit on restructure of joint venture A gain of US$213 million was recognised in relation to the restructure of the Group’s interest in the Douglas Tavistock Joint Venture (refer to note 7).
Restructuring and closure costs Asset write downs and closure costs of US$125 million were recognised, including the closure of the Lennard Shelf zinc joint venture in Australia (US$53 million), corporate office downsizing (US$8 million), the suspension of operations at the Falcondo ferronickel operations in the Dominican Republic (US$12 million) and the closure of Craig and Thayer-Lindsley nickel mines (US$52 million) ahead of schedule to be replaced by the new, lower cost Nickel Rim South and Fraser Morgan mines in Canada.
Income and costs of acquisition-related activities In March 2007, the Group made a cash offer to purchase LionOre Mining International Limited (LionOre), a Canadian listed nickel and gold mining company. In May 2007, OJSC MMC Norilsk Nickel announced a higher cash offer and on 1 June 2007, the Group announced it would not increase its offer price. LionOre terminated the support agreement for the Group’s offer and made a termination payment to the Group of CAD305 million (US$284 million) in June 2007. The Group incurred acquisition costs of US$9 million in relation to the offer for LionOre.
Income tax benefit The Group realised an exceptional tax benefit of US$330 million primarily as a result of the impairment of assets, restructuring and closure costs and inventory write downs.

Notes to the Financial Statements continued
Xstrata plc Annual Report 2008 150
10. Revenues and Expenses continued
Profit on sale of operations US$m 2008 2007
Discontinued operations: Aluminium – 1 – 1
The Aluminium business was sold on 18 May 2007 to Apollo Management LP. The disposal proceeds amounted to US$1,150 million before disposal costs of US$24 million, realising a gain of US$1 million after tax (refer to note 8).
11. Income Taxes
Income Tax Charge Significant components of income tax expense for the years ended:
US$m 2008 2007
Consolidated income statement Current tax: Based on taxable income of the current year 1,702 2,183Prior year under/(over) provision 29 (14)Total current taxation charge for the year 1,731 2,169Deferred taxation: Origination and reversal of temporary differences (398) 276Change in tax rates (37) (91)Prior year under provision 8 6Total deferred taxation charge for the year (427) 191Total taxation charge 1,304 2,360 Total taxation attributable to continuing operations 1,304 2,311Income tax attributable to discontinued operations – 49Total taxation charge reported in the consolidated income statement 1,304 2,360 UK taxation included above: Current tax 3 10Deferred tax 3 4Total taxation charge 6 14 Recognised directly in equity Deferred tax: Available-for-sale financial assets (4) 16Cash flow hedges 25 (15)Other equity classified items (102) 6Total taxation charge/(credit) reported in equity (81) 7
The amounts above include the tax charge attributable to exceptional items.

Xstrata plc Annual Report 2008 151
A reconciliation of income tax expense applicable to accounting profit before income tax at the weighted average statutory income tax rate to income tax expense at the Group average effective income tax rate for the years ended is as follows:
US$m 2008 2007
Profit before taxation from continuing operations 5,168 8,127Profit before taxation from discontinued operations – 102Profit before taxation 5,168 8,229At average statutory income tax rate 25.0% (2007: 25.2%) 1,292 2,075Goodwill impairment 94 –Mining and other taxes (59) 214Foreign currency gains and losses (143) 156Non-deductible expenses 88 81Non-taxable capital gains and losses 48 (53)Rebatable dividends received (1) (3)Research and development allowances (20) (9)Change in tax rates (37) (91)Prior year under/(over) provision 37 (8)Other 5 (2)At average effective income tax rate 1,304 2,360Total taxation charge reported in consolidated income statement 1,304 2,311Income tax attributable to discontinued operations – 49At average effective income tax rate 1,304 2,360
The above reconciling items are disclosed at the tax rates that apply in the country where they have arisen.
The average statutory income tax rate is the average of the standard income tax rates applicable in the countries in which the Group operates, weighted by the profit/(loss) before tax of the subsidiaries in the respective countries as included in the consolidated accounts.
The change in the average statutory income tax rate is due to the variation in the weight of subsidiaries’ profits, by various changes in the enacted standard income tax rates and due to the acquisition of subsidiaries in countries with different tax rates.
Deferred income taxes Deferred tax assets are recognised for the carry-forward of unused tax losses and unused tax credits to the extent that it is probable that taxable profits will be available against which the unused tax losses/credits can be utilised.
Unrecognised tax losses The Group has unrecognised deferred tax assets in relation to tax losses that are available indefinitely of US$14 million (2007: US$9 million) to carry forward against future taxable income of the companies in which the losses arose. Deferred tax assets have not been recognised in respect of these losses as they may not be used to offset taxable profits elsewhere in the Group and they have arisen in subsidiaries that have been loss-making for some time. There are no other deductible temporary differences that have not been recognised at balance sheet date.
Temporary differences associated with Group investments At 31 December 2008, there was US$nil recognised deferred tax liability (2007: US$nil) for taxes that would be payable on the unremitted earnings of certain of the Group’s subsidiaries, associates or joint ventures as:
> the Group has determined that undistributed profits of its subsidiaries will not be distributed in the foreseeable future;
> the profits of the associates will not be distributed until they obtain the consent of the Group; and
> the investments are not held for resale and are expected to be recouped by continued use of these operations by the subsidiaries.
The temporary differences associated with investments in subsidiaries, associates and joint ventures, for which deferred tax liabilities have not been recognised amount to US$1,497 million (2007: US$2,218 million).
There are no income tax consequences for the Group attaching to the payment of dividends by the Company to its shareholders.

Notes to the Financial Statements continued
Xstrata plc Annual Report 2008 152
11. Income Taxes continued
The deferred tax assets/(liabilities) included in the balance sheet is as follows:
US$m 2008 2007
Tax losses 273 242Employee provisions 74 62Other provisions 201 460Rehabilitation and closure 152 139Accelerated depreciation (5,767) (6,322)Coal export rights (195) (260)Other intangibles (97) (96)Government grants (12) (14)Deferred stripping (95) (77)Trade and other payables/receivables 206 36Available-for-sale financial assets (25) (27)Other equity-related items 49 3Other (5) (86) (5,241) (5,940)Represented on the face of the balance sheet as: Deferred tax assets 3 7Deferred tax liabilities (5,244) (5,947) (5,241) (5,940)
Deferred tax assets and liabilities denominated in foreign currencies are retranslated at year-end exchange rates.
The deferred tax included in the Group income statement is as follows:
US$m 2008 2007
Tax losses (64) (185)Employee provisions (25) (11)Other provisions 323 (17)Rehabilitation and closure (37) (16)Accelerated depreciation (385) 360Deferred stripping 39 27Trade and other payables/receivables (201) (27)Other (77) 50From continuing operations (427) 181From discontinued operations – 10 (427) 191
Tax audits The Group periodically assesses its liabilities and contingencies for all tax years open to audit based upon the latest information available. For those matters where it is probable that an adjustment will be made, the Group recorded its best estimate of the tax liability, including related interest charges, in the current tax liability. Inherent uncertainties exist in estimates of tax contingencies due to changes in tax laws. Whilst management believes they have adequately provided for the probable outcome of these matters, future results may include favourable or unfavourable adjustments to these estimated tax liabilities in the period the assessments are made, or resolved, or when the status of limitation lapses. The final outcome of tax examinations may result in a materially different outcome than assumed in the tax liabilities.

Xstrata plc Annual Report 2008 153
12. Earnings Per Share
US$m 2008 2007
Continuing operations: Profit before exceptional items attributable to ordinary equity holders of the parent from continuing operations 4,698 5,372Exceptional items from continuing operations (1,103) 118Profit attributable to ordinary equity holders of the parent from continuing operations 3,595 5,490Interest in respect of convertible borrowings 19 16Profit attributable to ordinary equity holders of the parent for diluted earnings per share from continuing operations 3,614 5,506Total operations: Profit before exceptional items attributable to ordinary equity holders of the parent from continuing operations 4,698 5,372Exceptional items from continuing operations (1,103) 118Profit attributable to ordinary equity holders of the parent from continuing operations 3,595 5,490Profit attributable to ordinary equity holders of the parent from discontinued operations – 53Profit attributable to ordinary equity holders of the parent 3,595 5,543Interest in respect of convertible borrowings 19 16Profit attributable to ordinary equity holders of the parent for diluted earnings per share 3,614 5,559 Weighted average number of shares (000) excluding own shares: For basic earnings per share 958,667 959,549Effect of dilution: – Free shares and share options 6,224 9,196– Convertible borrowings 13,571 17,418For diluted earnings per share 978,462 986,163 Basic earnings per share (US$) Continuing operations: – before exceptional items 4.90 5.60– exceptional items (1.15) 0.12 3.75 5.72Discontinued operations: – before exceptional items – 0.06– exceptional items – – – 0.06Total: – before exceptional items 4.90 5.66– exceptional items (1.15) 0.12 3.75 5.78Diluted earnings per share (US$) Continuing operations: – before exceptional items 4.82 5.47– exceptional items (1.13) 0.12 3.69 5.59Discontinued operations: – before exceptional items – 0.05– exceptional items – – – 0.05Total: – before exceptional items 4.82 5.52– exceptional items (1.13) 0.12 3.69 5.64

Notes to the Financial Statements continued
Xstrata plc Annual Report 2008 154
12. Earnings Per Share continued
Basic earnings per share is calculated by dividing the net profit for the year attributable to the equity holders of the parent company by the weighted average number of ordinary shares outstanding for the year, excluding own shares. Adjustments are made for continuing and discontinued operations and before exceptional items and after exceptional items as outlined above, to present a meaningful basis for analysis.
Diluted earnings per share is based on basic earnings per share adjusted for the potential dilution if director and employee free shares and share options are exercised and the convertible bonds are converted into ordinary shares. An adjustment is also made to net profit for the interest in respect of the convertible borrowings.
13. Dividends Paid and Proposed
US$m 2008 2007
Declared and paid during the year: Final dividend for 2007 – 34¢ per ordinary share (2006: 30¢ per ordinary share) 327 290Interim dividend for 2008 – 18¢ per ordinary share (2007: 16¢ per ordinary share) 172 153 499 443 Proposed for approval at the Annual General Meeting (not recognised as a liability as at 31 December): Final dividend for 2008 – nil¢ per ordinary share (2007: 34¢ per ordinary share) – 326
The 2008 interim dividend was paid on 10 October 2008.
As stated in note 26, own shares held in the ESOP and by the ECMP have waived the right to receive dividends.
14. Intangible Assets
US$m Export rights* Goodwill*†
Technology patents*
Feed contract*
Hydro- electricity
rights* Other 2008
At 1 January 2008 974 7,336 56 359 501 103 9,329Acquisitions 62 232 – – – – 294Additions – – – – – 54 54Amortisation charge (27) – (4) (62) – (17) (110)Impairment charge – (213) – – – – (213)Translation adjustments (237) (209) (10) – – – (456)At 31 December 2008 772 7,146 42 297 501 140 8,898At 1 January 2008: Cost 1,007 9,160 72 425 501 131 11,296Accumulated amortisation (33) (1,824) (16) (66) – (28) (1,967)Net carrying amount 974 7,336 56 359 501 103 9,329At 31 December 2008: Cost 822 9,183 58 425 501 180 11,169Accumulated amortisation (50) (2,037) (16) (128) – (40) (2,271)Net carrying amount 772 7,146 42 297 501 140 8,898

Xstrata plc Annual Report 2008 155
US$m Export rights* Goodwill*†
Technology patents*
Feed contract*
Hydro- electricity
rights* Other 2007
At 1 January 2007 989 6,916 53 413 501 90 8,962Acquisitions – 536 – – – – 536Additions – – – – – 32 32Reclassifications – – – – – (5) (5)Amortisation charge (32) – (3) (54) – (13) (102)Disposals (refer to note 8) – (139) – – – – (139)Translation adjustments 17 23 6 – – (1) 45At 31 December 2007 974 7,336 56 359 501 103 9,329At 1 January 2007: Cost 989 8,740 64 425 501 105 10,824Accumulated amortisation – (1,824) (11) (12) – (15) (1,862)Net carrying amount 989 6,916 53 413 501 90 8,962At 31 December 2007: Cost 1,007 9,160 72 425 501 131 11,296Accumulated amortisation (33) (1,824) (16) (66) – (28) (1,967)Net carrying amount 974 7,336 56 359 501 103 9,329
* Purchased as part of business combinations. † Restated for revisions to the provisional Austral and Eland acquisition accounting (refer to note 7).
The Group has a 20.91% interest in the service organisation, Richards Bay Coal Terminal Company Limited, acquired in a business combination, through which the shareholders gain access to export markets enabling them to realise higher coal sales prices than in the domestic market. The export rights are amortised based on a units-of-production method.
The Group acquired the right to market to third parties various leading technologies for the mining, mineral processing and metals extraction industries, in a business combination. The technology patents are amortised over their useful economic lives of 20 years to June 2023.
The Group-acquired hydroelectricity rights will be amortised over the expected life of the operation, currently estimated as being 40 years following the completion of construction.
A long-term feed contract is being amortised over an eight-year period.
Other intangible assets mainly comprise computer software and software development that are being amortised over their useful economic lives of between three to five years.

Notes to the Financial Statements continued
Xstrata plc Annual Report 2008 156
15. Impairment Testing
Goodwill Goodwill has been allocated to a cash-generating unit (CGU) or groups of cash-generating units no larger than the reportable segment which are expected to benefit from the related acquisitions. The carrying values of goodwill by CGU are as follows:
US$m 2008 2007
Chrome – Africa 35 47Copper – Americas 1,185 1,185Zinc Lead 1,546 1,546Zinc Lead – Europe 212 222 2,978 3,000
The following goodwill balances result from the requirement on an acquisition to recognise a deferred tax liability, calculated as the difference between the tax effect of the fair value of the acquired assets and liabilities and their tax bases. For the purposes of testing this goodwill for impairment, any of the related deferred tax liabilities recognised on acquisition that remain at balance date are treated as part of the relevant CGU or group of CGUs.
US$m 2008 2007
Coal – Australia 233 125Coal – Americas South 464 464Copper – Americas South* 1,500 1,537Copper – Australasia 151 151Nickel – Americas North 856 856Nickel – Americas South* 119 295Nickel – Africa 78 78Nickel – Australasia 79 34Platinum – Africa 284 384Zinc Lead – Americas North 244 244Zinc Lead – Americas South 160 160Zinc Lead – Australasia – 8 4,168 4,336 7,146 7,336
* Net of 2008 impairment loss discussed below.
The Group performs goodwill impairment testing on an annual basis and at the reporting date if there are indicators of impairment. The most recent test was undertaken at 31 December 2008.
In assessing whether goodwill has been impaired, the carrying amount of the cash-generating unit or reportable segment is compared with its recoverable amount.
2008 testing The goodwill impairment expense recognised as an exceptional item in the income statement (refer to note 10), relates to the following:
US$m Impairment
method 2008
Copper – Americas South FVLCS 37Nickel – Americas South FVLCS 176 213
For the purpose of goodwill impairment testing, recoverable amounts have been determined based on ‘fair value less costs to sell’ (FVLCS) calculations, with the exception of Coal – Australia goodwill, Coal – Colombia goodwill, Chrome – Africa goodwill and partially as Copper Australasia which have been based on ‘value-in-use’ (VIU) calculations.
Where observable market prices are not available, FVLCS was calculated using a discounted cash flow methodology taking account of assumptions that would be made by market participants.
VIU is based on the cash flows expected to be generated from mines, smelting and refining operations included within the cash-generating units or reportable segments. Cash flows are projected for periods up to the date that mining and refining is expected to cease, based on management’s expectations at the time of completing the testing. This date depends on a number of variables, including recoverable reserves and resources, the forecast selling prices for such production and the treatment charges received from the refining operations.
Cash flows have been projected for a maximum of 32 years.

Xstrata plc Annual Report 2008 157
Key assumptions The key assumptions used in the VIU calculations and in determining the FVLCS are:
> recoverable reserves and resources;
> commodity prices;
> operating costs;
> treatment charges receivable by smelting and refining operations;
> capital expenditure;
> discount rates; and
> foreign exchange rates.
Economically recoverable reserves and resources represent management’s expectations at the time of completing the impairment testing, based on reserves and resource statements and exploration and evaluation work undertaken by appropriately qualified persons. A summary of the mineral resources and ore reserves released on 29 January 2009 is summarised as follows:
Reserves Resources
Million tonnes Proved Probable Measured Indicated Inferred
Chrome – Africa 51 21 92 112 235Vanadium – Africa 16 12 39 41 128Coal – Africa 835 27 2,248 1,008 844Coal – Australia 1,235 1,213 3,478 4,122 5,754Coal – Americas South 630 181 185 1,362 1,061Copper – Americas North 16 4 20 4 7Copper – Americas South 1,267 2,733 1,583 5,458 3,383Copper – Australasia 78 47 846 1,174 1,636Nickel – Americas North 10 16 18 35 43Nickel – Americas South 34 34 46 127 42Nickel – Africa – – – 23 28Nickel – Australasia 17 47 35 83 96Platinum – Africa 12 16 35 84 107Zinc Lead – Americas North 12 3 15 3 –Zinc Lead – Australasia 39 105 247 199 142
Long-term commodity prices and treatment charges are determined by reference to external market forecasts. Specific prices are determined using information available in the market after considering the nature of the commodity produced and long-term market expectations. Forecast prices vary in accordance with the year the sale is expected to occur. To this end, whilst prices are expected to remain depressed in the short term, they are expected to increase as world economic conditions improve in the medium term. The commodity prices used in the impairment review are management estimates and are within the range of the available analyst forecasts at 31 December 2008.
The attributable value to reserves and resources using the FVLCS method is based on management’s best estimates using market-based forecasts and information available in the market.
Operating cost assumptions are based on management’s best estimate at the date of impairment testing of the costs to be incurred. Costs are determined after considering current operating costs, future cost expectations and the nature and location of the operation.
Smelting and refining treatment charges vary in accordance with the commodity processes and time of processing.
Future capital expenditure is based on management’s best estimate of required future capital requirements. It has been determined by taking into account all committed and anticipated capital expenditure adjusted for future cost estimates.
The discount rates that have been used are outlined below. In the case of FVLCS they represent real after-tax rates, whereas the VIU discount rates represent real pre-tax rates. These rates are based on the weighted average cost of capital specific to each CGU or reportable segment and the currency of the cash flows generated. The weighted average cost of capital reflects the current market assessment of the time value of money, equity market volatility and the risks specific to the CGU or reportable segment for which cash flows have not already been adjusted. These rates were calculated with reference to market information from third-party advisors.

Notes to the Financial Statements continued
Xstrata plc Annual Report 2008 158
15. Impairment Testing continued
Impairment
method Discount
rate
Chrome VIU 10%Coal VIU 10%
Copper VIU 10%Copper FVLCS 7% – 11%Nickel FVLCS 7% – 10%Platinum FVLCS 7% – 8%Zinc Lead FVLCS 7%
In assessing the FVLCS, another key assumption that would be considered by market participants, is foreign exchange rates. The rates that have been utilised are based on external market forecasts. Specific rates are determined from information available in the market after considering long-term market expectations and the countries in which the Group operates.
Sensitivity to changes in assumptions Whilst the directors remain confident of recovery in the market in the medium term, given the current volatility in the market, adverse changes in key assumptions as described below could result in changes to impairment charges specifically in relation to Copper Americas, Zinc Lead and Zinc Lead Europe.
A summary of the mineral resources and ore reserves related to the goodwill balances, released on 29 January 2009, is summarised as follows:
Reserves Resources
Million tonnes Proved Probable Measured Indicated Inferred
Copper – Americas 1,283 2,737 1,603 5,462 3,390Zinc Lead 51 108 262 202 142
Commodity prices – commodity price forecasts were based on external market consensus information. The copper prices ranged from US$1.50 per pound to US$2.50 per pound, US$0.64 per pound to US$0.86 per pound for zinc and US$0.43 per pound to US$0.64 per pound for lead, varying in accordance with the year the sale was expected to occur.
Treatment charges received from smelting and refining – in performing the FVLCS calculation for Zinc Lead, treatment charges were estimated to be in the range of US$200 per tonne to US$231 per tonne for zinc and US$103 per tonne to US$124 per tonne for lead refining fees, based on the year of processing. As outlined above, these prices were based on external market consensus forecasts.
Foreign exchange rates – foreign exchange rates used were based on external market consensus forecasts. The US$:ARS rate ranged from 3.4 to 3.5, AUD:US$ rate ranged from 0.61 to 0.63, the US$:CAD rate ranged from 1.25 to 1.27, the US$:CLP rate from 690 to 807, the EUR:US$ rate ranged from 1.27 to 1.28 and the US$:PEN from 3.23 to 3.92 varying in accordance with the year the sale was expected to occur.
The impairment tests are particularly sensitive to changes in commodity prices, discount rates and foreign exchange rates. Changes to these assumptions could have resulted in changes to impairment charges. The below table summarises the change required to key assumptions that would result in the carrying value equalling the recoverable values:
Change in the key assumption which would result in the recoverable amount equalling
the carrying value (%)
Excess of recoverable
amount over carrying value
(US$m)Commodity
prices Discount
rate*
Foreign exchange
rate
Copper – Americas 993 9% 2% 19%Zinc Lead 989 8% 2% 12%Zinc Lead – Europe 1,057 28% 5% 36%
* Amounts relate to absolute movement in discount rate.
For the purposes of testing for impairment of goodwill using the VIU basis for Chrome, the excess of recoverable amount over the carrying value was US$5,325 million and management is of the opinion that no reasonably possible changes in the key assumptions could result in an impairment expense being recognised.
2007 testing For the purpose of goodwill impairment testing, except for the testing of US$1,546 million allocated to the Zinc Lead reportable segment, recoverable amounts were determined based on VIU calculations. VIU was based on the cash flows expected to be generated from mines, smelting and refining operations included within the CGUs or reportable segments. Cash flows were projected for periods up to the date mining and refining was expected to cease, based on management’s expectations at the time of completing the testing. This date depended on a number of variables, including recoverable reserves and resources, the forecast selling prices for such production and the treatment charges received from the refining operations. Cash flows were projected for a maximum of 26 years.

Xstrata plc Annual Report 2008 159
For the goodwill allocated to the Zinc Lead segment, recoverable amount was determined based on FVLCS. As observable market prices are not available, this was calculated using discounted cash flow methodology taking account of assumptions that would be made by market participants. Where appropriate, this value was cross checked to recent market transactions, after allowing for various factors including changes in the economic environment since the date of the transactions and differences in the location and quality of assets.
Key assumptions The key assumptions used in the VIU calculations for goodwill were consistent with those outlined above, and used in 2008. Management determined the value of the assumptions in the same manner, specifically, by considering economically recoverable reserves and resources and market consensus prices.
The discount rates that were utilised are outlined below, and represent the real pre-tax rates that reflect the current market assessments of the time value of money and the risks specific to the CGU or reportable segment for which cash flows had not been adjusted. These rates were based on the weighted average cost of capital specific to each CGU or reportable segment and the currency of the cash flows generated. These rates were calculated with reference to information from third-party advisors.
Impairment
method Discount
rate
Chrome VIU 9%
Copper – Americas VIU 11% – 17%Zinc Lead FVLCS 7%Zinc Lead – Europe VIU 10% – 11%
Sensitivity to changes in assumptions There was no impairment expense recognised in 2007 and the directors were of the view that no ‘reasonably possible change’ in any of the key assumptions would have resulted in an impairment expense being recognised.
Other non-current assets The impairment losses recognised as an exceptional item in the income statement (refer to note 10), excluding the goodwill impairment above, relate to the following:
US$m 2008
Chrome – Africa 18Copper – Americas North 227Copper – Americas South 199Nickel – Americas North 20Nickel – Americas South 279Zinc Lead – Australasia 18 761
The most significant contributors to the impairment in Copper – Americas North of US$227 million was the current pricing environment and increasing operating costs associated with increasing environmental costs. In respect of Copper Americas South, an impairment of US$199 million has been recorded due to increases in input costs including electricity and sulphuric acid, eroding margins at Lomas Bayas and reduced treatment and refining charges from the shortage of concentrate at Alto Norte.
The most significant contributors to the impairment at Nickel – Americas South Falcondo ferronickel operation was the suspension of production in August 2008 due to the combination of high oil prices and lower nickel prices. Production at this asset was suspended in August 2008.
Impairment charges of US$18 million were incurred due to the closure of the Lennard Shelf zinc operation in Western Australia in August 2008, US$20 million due to the early closure of the Craig and Thayer-Lindsley nickel mines in Canada in November 2008 and impairment charges of US$18 million in relation to chrome mineral reserves. In addition to these impairment charges, a net impairment charge of US$34 million was recorded in respect of the Group’s investment in Lonmin (refer to note 10 and 20).

Notes to the Financial Statements continued
Xstrata plc Annual Report 2008 160
16. Property, Plant and Equipment
US$m
Explorationand
evaluation
Landand
buildings
Miningpropertiesand leases
Plant and
equipment
Capital works in progress 2008
At 1 January 2008, net of accumulated depreciation 665 2,721 20,534 6,974 2,348 33,242Acquisitions 310 25 3,056 772 97 4,260Additions 291 168 548 1,179 3,126 5,312Disposal of discontinued operations – – (92) – – (92)Disposals (14) – (7) (25) (8) (54)Rehabilitation provision adjustments – – 195 – – 195Reclassifications (114) 55 614 503 (1,058) –Depreciation charge (15) (290) (985) (982) (14) (2,286)Impairment charge – (2) (427) (332) – (761)Translation adjustments (99) (216) (2,169) (1,003) (188) (3,675)At 31 December 2008, net of accumulated depreciation 1,024 2,461 21,267 7,086 4,303 36,141At 1 January 2008: Cost 677 3,160 22,879 9,303 2,349 38,368Accumulated depreciation (12) (439) (2,345) (2,329) (1) (5,126)Net carrying amount 665 2,721 20,534 6,974 2,348 33,242At 31 December 2008: Cost 1,046 3,336 24,667 10,245 4,321 43,615Accumulated depreciation (22) (875) (3,400) (3,159) (18) (7,474)Net carrying amount 1,024 2,461 21,267 7,086 4,303 36,141
US$m
Explorationand
evaluation
Landand
buildings
Miningpropertiesand leases
Plant and
equipment
Capital works in progress 2007
At 1 January 2007, net of accumulated depreciation 245 2,751 18,343 6,285 1,874 29,498Acquisitions 37 180 2,438 267 – 2,922Additions 139 227 517 1,306 829 3,018Disposal of discontinued operations – (366) (7) (623) (22) (1,018)Disposals – (4) (5) (26) (24) (59)Rehabilitation provision adjustments – – 122 – – 122Reclassifications 252 89 (206) 279 (409) 5Depreciation charge (7) (197) (1,012) (809) – (2,025)Translation adjustments (1) 41 344 295 100 779At 31 December 2007, net of accumulated depreciation 665 2,721 20,534 6,974 2,348 33,242At 1 January 2007: Cost 252 3,030 19,595 7,808 1,875 32,560Accumulated depreciation (7) (279) (1,252) (1,523) (1) (3,062)Net carrying amount 245 2,751 18,343 6,285 1,874 29,498At 31 December 2007: Cost 677 3,160 22,879 9,303 2,349 38,368Accumulated depreciation (12) (439) (2,345) (2,329) (1) (5,126)Net carrying amount 665 2,721 20,534 6,974 2,348 33,242
Land and buildings include non-depreciating freehold land amounting to US$397 million (2007: US$363 million).
Mining properties and leases at 31 December 2008 include deferred stripping costs of US$588 million (2007: US$432 million). US$243 million (2007: US$165 million) of deferred stripping costs were capitalised during the year.
The carrying value of plant and equipment held under finance leases and hire purchase contracts at 31 December 2008 is US$88 million (2007: US$125 million). Leased assets and assets under hire purchase contracts are pledged as security for the related finance leases and hire purchase liabilities. The carrying value of other property, plant and equipment pledged as security is US$nil (2007: US$nil).
US$20 million (2007: US$nil) of interest was capitalised during the year and there is US$19 million (2007: US$nil) of capitalised interest within property, plant and equipment at 31 December 2008.
The carrying value of property, plant and equipment at 31 December 2008 that is temporarily idle is US$nil (2007: US$nil).
The Group has made commitments to acquire property, plant and equipment totalling US$346 million at 31 December 2008 (2007: US$532 million).

Xstrata plc Annual Report 2008 161
17. Biological Assets
US$m 2008 2007
At 1 January 19 15Disposals (3) –Net gain/(loss) from fair value less estimated selling cost adjustments (1) 2Translation adjustments (4) 2At 31 December 11 19
Biological assets are stated at fair value less estimated selling costs, which has been determined based on independent valuations as at 31 December 2008 and 2007, on the basis of open market value, supported by market evidence. As at 31 December 2008, the Group owned 47,000 (2007: 54,000) cattle.
18. Inventories
US$m 2008 2007
Current: Raw materials and consumables 1,353 1,451Work in progress 1,350 1,763Finished goods 870 953 3,573 4,167Non-current: Work in progress 39 17 39 17
Non-current inventories comprise long-term ore stockpiles that are not planned to be processed within one year.
19. Trade and Other Receivables
US$m 2008 2007
Current: Trade debtors 1,570 2,451Advances 144 189Employee entitlement receivables (refer to note 32) 11 6Recoverable sales tax 298 290Other debtors 83 31 2,106 2,967Non-current: Employee entitlement receivables (refer to note 32) 33 38Recoverable sales tax – 5Other debtors 44 42 77 85

Notes to the Financial Statements continued
Xstrata plc Annual Report 2008 162
20. Investment in Associates
Lonmin plc In August 2008, the Group acquired 16,706,481 shares in Lonmin plc for US$1,084 million. In October 2008, the Group acquired an additional 22,232,940 shares for US$794 million, resulting in a total acquisition price of US$1,878 million. The August 2008 and October 2008 transactions have been separately accounted for under IFRS. Following the October 2008 transaction, the Group held 24.9% of Lonmin plc and determined it was an associate of the Group. Lonmin plc which is listed on the London Stock Exchange is one of the world’s largest platinum producers with operations principally in South Africa.
The share price of Lonmin as listed on the London Stock Exchange at 31 December 2008 was GBP9.11 per share. The Group believes that the recoverable amount of the investment calculated using the VIU method was higher than the value based on the listed share price at that date because this share price reflected significant uncertainty and volatility in world economic markets as opposed to the fundamental long-term value of this investment. However, the Group has determined that this recoverable amount was lower than the carrying amount of the investment. Consequently, the carrying value was written down resulting in a net exceptional impairment charge of US$34 million (refer to notes 10 and 15).
Other associates The Group’s other associates are:
> interests in coal terminals (Newcastle Coal Shippers Pty Ltd, Port Kembla Coal Terminal Limited and Richards Bay Coal Terminal Company Ltd), through which it gains access to export markets (see note 36); and
> a 25% interest in the Noranda Income Fund which owns a zinc refinery in Salaberry-de-Valleyfield, Quebec.
The Group held 12,500,000 (2007: 12,500,00) units in the Noranda Income Fund and the unit price as listed on the Toronto stock exchange at 31 December 2008 was CAD4.15 (2007: CAD9.67). The Group has determined that the recoverable amount of the investment calculated using the VIU method is higher than the value based on the listed unit price because of significant uncertainty and volatility in world economic markets in late 2008.
The companies which own the coal terminals are not listed so there is no published quoted price for the value of these investments. The carrying value is equal to fair value.
The following is a summary of the financial information of the above associates:
US$m 2008 2007
Share of associates’ balance sheet: Non-current assets 2,188 256Current assets 263 83Total assets 2,451 339Non-current liabilities (367) (113)Current liabilities (121) (40)Total liabilities (488) (153)Net assets 1,963 186 Carrying amount of the investment 1,963 186 Share of associates’ revenue and profit: Revenue 175 265EBITDA 22 23EBIT (23) 15Net interest paid 2 1Income tax expense (1) (1)Profit for the year (22) 15
All associates have a reporting date of 31 December, except for Lonmin, which has a reporting date of 30 September. The Group’s share of Lonmin’s results are included above and have been estimated based on market consensus estimates.

Xstrata plc Annual Report 2008 163
21. Interests in Joint Venture Entities
The Group has various interests in jointly controlled entities, operations and assets as outlined in note 36. These interests are accounted for in the manner outlined in note 6.
The following is a summary of the financial information of the Group’s jointly controlled entities in Africa and South America:
US$m 2008 2007
Share of joint ventures’ balance sheets:
Non-current assets 9,916 9,950
Current assets 508 690
Total assets 10,424 10,640
Non-current liabilities (2,026) (2,121)
Current liabilities (331) (336)
Total liabilities (2,357) (2,457)
Net assets 8,067 8,183 Net assets consolidated 8,067 8,183 Share of joint ventures’ revenue and profit:
Revenue 2,447 2,450
Cost of sales (before depreciation and amortisation) (498) (310)
Distribution costs (231) (129)
Administration expenses (before depreciation and amortisation) (30) (54)
EBITDA 1,688 1,957
Depreciation and amortisation (384) (370)
EBIT 1,304 1,587
Finance income 7 8
Finance costs (14) (22)
Profit before tax 1,297 1,573
Income tax expense (372) (431)
Profit for the year 925 1,142
22. Available-for-sale Financial Assets
US$m 2008 2007
At fair value: Shares – listed 68 87Shares – unlisted 3 26Royalty contract 90 90 161 203
Available-for-sale financial assets consist of a long-term royalty income contract and investments in listed and unlisted ordinary shares that have no fixed maturity date or coupon rate. These investments are held for strategic purposes.
In 2008 and 2007, the listed shares related to companies in the mining industry. The listed shares are carried at fair value.
Unlisted shares mainly comprise interests in ports in Australia used to export coal and are carried at fair value.

Notes to the Financial Statements continued
Xstrata plc Annual Report 2008 164
23. Derivative Financial Assets
US$m 2008 2007
Current: At fair value: Foreign currency cash flow hedges 6 1Fair value interest rate swap hedges – 4Other commodity derivatives 8 3Other foreign currency derivatives 15 81 29 89Non-current: At fair value: Foreign currency cash flow hedges 47 112Fair value interest rate swap hedges 715 98Other interest rate derivatives 12 – 774 210Total 803 299
24. Other Financial Assets
US$m 2008 2007
Current: At amortised cost: Loans to joint venture partners – 54 – 54Non-current: At fair value: Rehabilitation trust fund 42 43Other 28 34 70 77 At amortised cost: Loans to joint venture partners – 21 70 98Total 70 152
Loans to joint venture partners A loan to Merafe was made on establishment of the Chrome Pooling and Sharing Venture (PSV). At 31 December 2008, US$nil (2007: US$21 million) was subject to a floating interest rate based on South African prime rates. This loan was secured by the Group’s ability to acquire Merafe’s PSV assets at fair value in the event of default.
A loan was made to African Rainbow Minerals Limited (ARM) on establishment of ARM Coal. At 31 December 2008, US$nil (2007: US$54 million) was subject to a floating interest rate based on South African prime rates. This loan was secured by the Group’s ability to acquire ARM Coal assets at fair value in the event of default.
Rehabilitation trust fund The rehabilitation trust fund in South Africa receives cash contributions to accumulate funds for the Group’s rehabilitation liabilities relating to the eventual closure of the Group’s coal operations. Amounts are paid out from the trust fund following completion and approval of the rehabilitation work by the South African Department of Minerals and Energy. The contributions to the trust fund are placed with investment banks that are responsible for making investments in equity and money market instruments. The trust fund is to be used according to the terms of the trust deed and the assets are not available for the general purpose of the Group. The trust fund is carried at fair value.

Xstrata plc Annual Report 2008 165
25. Cash and Cash Equivalents
US$m 2008 2007
Cash at bank and in hand 720 487Short-term deposits 436 661 1,156 1,148
The majority of cash at bank and in hand earns interest at floating rates of interest with a limited amount at fixed rates of interest or interest free. Short-term deposits are made at call and for less than one week, dependent on the short-term cash requirements of the Group and earn interest based on the respective short-term deposit rates. The fair value of cash and cash equivalents at 31 December 2008 and 31 December 2007 approximates carrying value.
For the purposes of the Consolidated Cash Flow Statement, cash and cash equivalents comprise the following at 31 December:
US$m 2008 2007
Cash at bank and in hand 720 487Short-term deposits 436 661Bank overdrafts (refer to note 28) (11) (79) 1,145 1,069
During the year, the Group entered into new finance leases and hire purchase contracts to purchase various items of plant and equipment for US$30 million (2007: US$26 million), issued shares from the conversion of the convertible borrowings and issued shares to the ESOP for a market value of US$412 million (2007: US$185 million) which did not require the use of cash and cash equivalents and are not included in the net cash flow used in investing and financing activities in the Consolidated Cash Flow Statement.
26. Capital and Reserves
US$m
Authorised: 15,109,948,397 ordinary shares of US$0.50 each as at 1 January 2007 7,55513,609,948,397 ordinary shares of US$0.50 each cancellation (6,805)1,500,000,000 ordinary shares of US$0.50 each as at 31 December 2007 and at 31 December 2008 75050,000 deferred shares of GBP1.00 each as at 31 December 2007 and at 31 December 2008 –1 special voting share of US$0.50 as at 31 December 2007 and as at 31 December 2008 – 750Issued, called up and fully paid: 943,150,383 ordinary shares of US$0.50 each as at 1 January 2007 4714,000,000 ordinary shares issued on 31 January 2007 to the ESOP 224,516,537 ordinary shares issued on the exercise of convertible bonds to 31 December 2007 12971,666,920 ordinary shares of US$0.50 each as at 31 December 2007 4856,000,000 ordinary shares issued on 16 January 2008 to the ESOP 33,620 ordinary shares issued on the exercise of the convertible borrowings to 31 December 2008 –977,670,540 ordinary shares of US$0.50 each as at 31 December 2008 488Share premium: At 1 January 2007 9,5224,000,000 ordinary shares issued on 31 January 2007 to the ESOP 18324,516,537 ordinary shares issued on the exercise of convertible bonds to 31 December 2007 194As at 31 December 2007 9,8996,000,000 ordinary shares issued on 16 January 2008 to the ESOP 4093,620 shares issued on the exercise of the convertible borrowings to 31 December 2008 –As at 31 December 2008 10,308Own shares: 6,173,747 ordinary shares of US$0.50 each as at 1 January 2007 (154)4,000,000 ordinary shares purchased on 31 January 2007 by the ESOP (185)9,310,000 ordinary shares purchased in the ECMP during the year (518)291,585 ordinary shares purchased during the year (14)6,618,641 ordinary shares disposed during the year 22013,156,691 ordinary shares of US$0.50 each as at 31 December 2007 (651)6,000,000 ordinary shares purchased on 16 January 2008 by the ESOP (412)6,920,000 ordinary shares purchased in July 2008 by the ECMP (508)4,664,407 ordinary shares disposed during the year 256242,702 ordinary shares purchased during the year (17)21,654,986 ordinary shares of US$0.50 each as at 31 December 2008 (1,332)

Notes to the Financial Statements continued
Xstrata plc Annual Report 2008 166
26. Capital and Reserves continued
Details in respect of the various classes of shares are outlined in the Directors’ Report on pages 87 to 88.
Issue of ordinary shares On 31 January 2007, 4,000,000 shares were issued to the ESOP at a market price of GBP23.58 per share.
On 16 January 2008, 6,000,000 shares were issued to the ESOP at a market price of GBP34.90 per share.
During 2008, 0.03% of the US$375 million of convertible borrowings was converted at the option of the holders into 3,620 ordinary shares in Xstrata plc (refer to note 29).
Own shares Own shares comprise shares of Xstrata plc held in the Employee Share Option Plan (ESOP) and shares held by Batiss Investments (Batiss) for the Equity Capital Management Program (ECMP).
The shares acquired by the ESOP are either stock market purchases or share issues from the Company. The ESOP is used to coordinate the funding and manage the delivery of ordinary shares for options and free share awards under the Group’s employee award schemes. The trustee of the ESOP is permitted to place the shares back into the market and may hold up to 5% of the issued share capital of the Company at any one time. At 31 December 2008, 5,424,986 (2007: 3,846,691) shares, equivalent to 0.5% (2007: 0.4%) of the total issued share capital, were held by the trust with a cost of US$306 million (2007: US$133 million) and market value of US$51 million (2007: US$271 million). The trust has waived the right to receive dividends from the shares that it holds. Costs relating to the administration of the trust are expensed in the period in which they are incurred.
The shares acquired from the stock market by Batiss and held for the ECMP are used by the Group as a source of financing for future acquisitions, or placed back into the market. The decision as to when to place the shares in the market, use the shares to assist the Group in facilitating future transactions, or to repurchase shares for cancellation, is considered in light of the Group’s funding requirements and capital structure.
Batiss is not permitted to hold more than 10% of the issued share capital of the Company at any one time. Batiss has entered into an option agreement with Xstrata Capital Corporation A V V (Xstrata Capital), a wholly-owned subsidiary within the Xstrata Group, whereby Batiss has granted to Xstrata Capital a right to require Batiss to sell the purchased Xstrata shares to a third party (other than a subsidiary of Xstrata plc), as nominated by Xstrata Capital, at an exercise price of 1p per share. Under the option agreement, Xstrata Capital pays Batiss a premium for this right, the premium being the equivalent of the market price paid by Batiss for the shares plus associated costs less the 1p exercise price. This premium payment, together with funds from a subscription by Xstrata Capital for non-voting redeemable preference shares in Batiss, provides the funding for Batiss to acquire the shares in the market. These payments are sourced from the existing and future cash resources of Xstrata Capital. Xstrata Capital is able to exercise its right under the option agreement for a period of six years from the date of each purchase, but has not chosen to do so in either 2008 or 2007.
Batiss has waived its right to receive dividends on the shares which it holds. At 31 December 2008, 16,230,000 (2007: 9,310,000) shares, equivalent to 1.7% (2007: 1.0%) of the total issued share capital, were held by the trust with a cost of US$1,026 million (2007: US$518 million) and market value of US$152 million (2007: US$656 million). Costs relating to the administration of the trust are expensed in the period in which they are incurred.

Xstrata plc Annual Report 2008 167
Consolidated changes in equity Attributable to equity holders of the parent
US$m Issued capital
Sharepremium
Own shares
Convertibleborrowings
– equitycomponent
Otherreserves
Retained earnings Total
Minority interests
Total equity
At 1 January 2007 471 9,522 (154) 78 4,472 4,057 18,446 1,146 19,592Recognised income and expenses – – – – 595 5,472 6,067 326 6,393Issue of share capital 14 377 (185) (22) – – 184 – 184Own share purchases – – (532) – – – (532) – (532)Own share disposals – – 220 – – (164) 56 – 56Cost of IFRS 2 equity-settled share-based compensation plans – – – – – 62 62 – 62Acquisition of subsidiaries – – – – – – – 385 385Capital injection – – – – – – – 180 180Redemption of minority interests – – – – (12) – (12) (10) (22)Dividends paid – – – – – (443) (443) (485) (928)Loan reclassification – – – – – – – (156) (156)At 31 December 2007 485 9,899 (651) 56 5,055 8,984 23,828 1,386 25,214Recognised income and expenses – – – – (3,601) 3,520 (81) 269 188Issue of share capital 3 409 (412) – – – – – –Own share purchases – – (525) – – – (525) – (525)Own share disposals – – 256 – – (192) 64 – 64Cost of IFRS 2 equity-settled share-based compensation plans – – – – – 245 245 – 245Modification of share-based awards – – – – – (269) (269) – (269)Acquisition of subsidiaries – – – – – – – 80 80Capital injection – – – – – – – 122 122Dividends paid – – – – – (499) (499) (221) (720)At 31 December 2008 488 10,308 (1,332) 56 1,454 11,789 22,763 1,636 24,399
Other reserves
US$m Revaluation
reservesOther
reserves
Net unrealised
gains/ (losses)
Foreigncurrency
translation Total
At 1 January 2007 1,418 1,241 (81) 1,894 4,472Revaluation of property, plant and equipment 22 – – – 22Available-for-sale financial assets – – 49 – 49Losses on cash flow hedges – – (261) – (261)Realised losses on cash flow hedges* – – 121 – 121Recycled foreign currency translation net losses – – – 28 28Redemption of minority interests – (12) – – (12)Foreign currency translation differences – – (2) 672 670Deferred tax – – (1) (33) (34)At 31 December 2007 1,440 1,229 (175) 2,561 5,055Available-for-sale financial assets – – (114) – (114)Losses on cash flow hedges – – (157) – (157)Realised losses on cash flow hedges* – – 360 – 360Recycled foreign currency translation net losses – – – 246 246Foreign currency translation differences – – – (3,980) (3,980)Deferred tax – – (21) 65 44At 31 December 2008 1,440 1,229 (107) (1,108) 1,454
* Realised losses of US$360 million (2007: US$121 million) are included in Revenue in the Income Statement.

Notes to the Financial Statements continued
Xstrata plc Annual Report 2008 168
26. Capital and Reserves continued
Revaluation reserves This reserve principally records the ‘remeasurement’ from cost of the 19.9% interest held in Falconbridge Limited (Falconbridge) to the fair value of 19.9% of the identifiable net assets of Falconbridge on 15 August 2006, the date the Group obtained control of Falconbridge.
Other reserves This reserve principally originated during 2002 from the merger of Xstrata AG into Xstrata plc of US$279 million and the issue of shares from the acquisition of the Duiker and Enex Groups of US$935 million.
Net unrealised gains/(losses) reserve This reserve records the ‘remeasurement’ of available-for-sale financial assets to fair value (refer to note 22) and the effective portion of the gain or loss on cash flow hedging contracts (refer to note 23, 30 and 37). Deferred tax is provided on the ‘remeasurement’ at tax rates enacted or substantively enacted.
Foreign currency translation reserve This is used to record exchange differences arising from the translation of the financial statements of foreign subsidiaries. It is also used to record the exchange differences from the translation of quasi equity inter-company loans in foreign operations. On disposal or partial disposal of a foreign entity or repayment of a quasi equity loan, the deferred accumulated amount recognised in this reserve is transferred to the income statement.
Minority interest Minority interest movements in 2008 relate to the acquisition of Resource Pacific (refer note 7) and the subsequent disposal of a 12% interest in the company (refer note 8).
Minority interest movements in 2007 relate to the acquisition of Eland and the finalisation of the provisional Eland acquisition accounting in 2008 (refer note 7), a capital injection to Koniambo Nickel SAS, and the reclassification of a portion of the Koniambo Nickel SAS minority interest to liabilities in accordance with IFRS.
Capital management The capital of Xstrata plc is the total equity and long-term borrowings (refer note 28), including capital market notes and convertible borrowings (refer note 29) on the Group’s balance sheet. The objective of the Company’s capital management is to grow and manage a diversified portfolio of metals and mining businesses with the aim of delivering industry-leading returns for its shareholders. The management of the Group’s capital is performed by the Board of Directors. There are no externally imposed capital requirements.
27. Trade and Other Payables
US$m 2008 2007
Current: Trade payables 1,667 2,429Sundry payables 530 426Interest payable 145 69Accruals and other payables 891 821 3,233 3,745Non-current: Accruals and other payables 29 54 29 54Total 3,262 3,799
All current payables are expected to be settled in the next 12 months and non-current payables are expected to be settled over a weighted average life of 12 years (2007: 13 years).

Xstrata plc Annual Report 2008 169
28. Interest-bearing Loans and Borrowings
US$m 2008 2007
Current: At amortised cost: Bank overdrafts 11 79Syndicated bank loans – unsecured – 481Bank loans – other unsecured 84 41Capital market notes 593 350Minority interest loans 17 –Preference shares 64 149Obligations under finance leases and hire purchase contracts(i) 25 18 794 1,118Non-current: At amortised cost: Syndicated bank loans – unsecured 6,974 4,265Bank loans – other unsecured 221 264Capital market notes 8,913 6,338Minority interest loans 81 81Obligations under finance leases and hire purchase contracts(i) 85 114Preference shares – 199Other loans 63 66 16,337 11,327Non-current: At amortised cost: Convertible borrowings 331 327Total 17,462 12,772Less cash and cash equivalents (refer to note 25) (1,156) (1,148)Net debt* 16,306 11,624
* Net debt is defined as loans and borrowings net of cash and cash equivalents. (i) Secured over specific items of plant and equipment (refer to note 16).
Existing facilities in 2008 The Xstrata Group has entered into the bank loans as described below:
Syndicated bank loans On 25 July 2007, the Group entered into a guaranteed US$4,680 million multi-currency revolving syndicated loan facility (Syndicated Facilities Agreement). Interest is payable on drawn down amounts at a rate which is the aggregate of LIBOR or, in relation to any loan in Euro, EURIBOR and the relevant margin, which is 27.5 basis points per annum. The facility matures on 31 July 2012. As of 31 December 2008, US$195 million was available to be drawn under this facility.
On 6 October 2008, the Group entered into a US$5,000 million multi-currency revolving syndicated loan facility (Club Facility). Interest is payable on drawn down amounts at a rate which is the aggregate of LIBOR or, in relation to any loan in Euro, EURIBOR and the relevant margin, which is 150 basis points per annum. The Club Facility matures on 30 September 2011. As at 31 December 2008, US$2,452 million was available to be drawn under this facility. The Club Facility was amended on 30 December 2008 to increase the facility amount to US$5,459 million.
Repaid facilities in 2008 On 25 February 2008, the Group entered into a guaranteed US$500 million revolving loan facility that matured on 31 December 2008. Interest was payable on the loans at LIBOR plus 50.0 basis points per annum.
On 8 October 2007, the Group entered into a guaranteed US$2,000 million 364-day revolving loan facility. Draw downs had been made to partly fund the acquisitions of Anvil Hill, Austral Coal Limited and Eland Platinum Holdings Limited. Interest was payable on the loans at a rate which was the aggregate of LIBOR and the relevant margin, which was 27.5 basis points per annum. This facility was refinanced during 2008.
On 6 December 2007, the Group entered into a guaranteed US$1,500 million 364-day revolving loan facility. Interest was payable on the loans at a rate which was the aggregate of LIBOR and the relevant margin, which was 27.5 basis points per annum. This facility was refinanced during 2008.

Notes to the Financial Statements continued
Xstrata plc Annual Report 2008 170
28. Interest-bearing Loans and Borrowings continued
Repaid facilities in 2007 In connection with the Falconbridge acquisition in August 2006, Xstrata plc and certain subsidiaries of the Group entered into the Acquisition Facilities Agreement, the Debt Bridge Facility Agreement and the Equity Bridge Facility Agreement. The purpose of these agreements was to meet the financing requirements of the Falconbridge Offer and to subsequently act as the Group’s principal bank facilities following the Falconbridge acquisition.
> The Acquisition Facilities Agreement was a US$9,500 million committed multi-currency syndicated loan with facilities which consisted of: (i) a 36-month term loan facility for US$3,353 million; (ii) a 60-month-and-one-day term loan facility for US$1,117 million; (iii) a 60-month revolving loan facility for US$3,353 million; and (iv) a 364-day term loan facility for US$1,677 million with the ability to extend by 364 days. Interest was payable on the loans at a rate which was based on LIBOR plus the relevant margins, which were initially between 50 and 70 basis points per annum. The Group was liable to pay a commitment fee on the undrawn portion of the syndicated loan facility at a rate per annum equal to 35% of the applicable margin payable on the three- and five-year tranches and 30% of the applicable margin on the 364-day tranche. This facility was fully repaid in July 2007 using the US$4,680 million syndicated loan described and defined above.
Capital market notes As at 31 December 2008, other unsecured private placements included:
Facility Denomination
At 31 Dec 08
US$m
Fixed orfloatinginterest
rate
Effectiveinterestrate %in 2008 Maturity
At 31 Dec 07
US$m
Effectiveinterestrate %
in 2007
Series A senior unsecured notes(a) US$ – Fixed 5.90 Jun 08 152 5.90Series B senior unsecured notes(a) US$ 39 Fixed 6.75 Jun 11 53 6.75Series B senior unsecured notes(a) US$ 52 Fixed 7.00 Jun 11 53 7.00Unsecured notes(b) US$ 499 Floating 3.41 Nov 09 499 5.75Unsecured notes(b) US$ 810 Fixed 5.50 Nov 11 771 5.50Unsecured notes(b) US$ 1,187 Fixed 5.80 Nov 16 1,024 5.80Unsecured notes(c) EUR 754 Fixed 4.88 Jun 12 741 4.88Unsecured notes(c) EUR 774 Fixed 5.25 Jun 17 738 5.25Unsecured notes(d) US$ 494 Fixed 6.90 Nov 37 495 6.90Unsecured notes(e) EUR 1,096 Fixed 5.88 May 11 – –Unsecured notes(e) EUR 881 Fixed 6.25 May 15 – –Unsecured notes(e) GBP 774 Fixed 7.38 May 20 – –Senior debentures(f) (h) CAD – Fixed 4.89 Dec 08 184 4.89Senior debentures(f) US$ 337 Fixed 6.03 Feb 11 329 6.03Senior debentures(f) US$ 277 Fixed 5.88 Jun 12 270 5.88Senior debentures(f) US$ 311 Fixed 6.06 Jul 12 314 6.06Senior debentures(f) US$ 406 Fixed 6.34 Oct 15 348 6.34Senior debentures(f) US$ 265 Fixed 6.16 Jun 15 248 6.16Senior debentures(f) US$ 237 Fixed 6.39 Jun 17 236 6.39Senior debentures(f) US$ 233 Fixed 6.77 Jun 35 233 6.77Commercial paper(g) US$ 80 Fixed 2.75 April 13 – – 9,506 6,688
(a) An Australian subsidiary has designated the series A and B senior unsecured notes as a fair value hedge of an investment in South America (refer to note 37). The hedge is being used to reduce exposure to foreign currency risk.
(b) In November 2006, the Group issued US$2,250 million of guaranteed capital market notes to refinance existing debt facilities. The notes are comprised of three tranches, a US$1,000 million 10-year note at a fixed interest rate of 5.8%, a US$750 million five-year note at a fixed interest rate of 5.5% and a US$500 million three-year note that bears interest at a rate based on LIBOR plus 35 basis points.
(c) In June 2007, the Group issued a two-tranche EUR1,000 million guaranteed bond offering, comprising EUR500 million 4.875% fixed guaranteed notes due 2012 and EUR500 million 5.25% fixed guaranteed notes due 2017. These bonds have been swapped to US dollars. The swaps have been accounted for as cash flow hedges with an unrealised gain of US$47 million (2007: US$112 million) at 31 December 2008 (refer to note 37).
(d) In November 2007, the Group issued guaranteed 30-year notes of US$500 million bearing interest at a fixed rate of 6.9%. (e) In May 2008, the Group issued a two-tranche EUR1,350 million guaranteed bond offering, comprising EUR750 million 5.875% fixed guaranteed notes due 2011 and
EUR600 million 6.25% fixed guaranteed notes due 2015. In May 2008, the Group issued a guaranteed bond offering of GBP500 million 7.375% fixed guaranteed notes due 2020. These bonds have been swapped to US dollars. The swaps have been accounted for as cash flow hedges with an unrealised loss of US$482 million at 31 December 2008 (refer to note 37).
(f) The guaranteed senior debentures were assumed by the Group through the acquisition of Falconbridge in 2006. Pursuant to the terms of the note indentures as amended by supplemental indentures, Xstrata plc has fully and unconditionally guaranteed in favour of the holders of the senior debentures the payment, within 15 days of when due, of all financial liabilities and obligations of Xstrata Canada Incorporated to such holders under the terms of the senior debentures.
(g) In February 2008, the Group entered into a US$1,000 million commercial paper programme facility, with maturities of up to 12 months. Interest is payable on the notes at a rate which is based on LIBOR.
(h) Repaid with proceeds of a drawing from the Syndicated Facility.
A portion of the fixed interest rate of the Unsecured notes and Senior debentures has been swapped to a floating rate. The swaps have been accounted for as fair value hedges with an unrealised gain of US$671 million (2007: US$102 million gain) at 31 December 2008 (refer to note 37). Hedging ineffectiveness during 2008 resulted in other financial income of US$45 million. There has been no significant impact on income in 2007 as a result of hedge ineffectiveness.

Xstrata plc Annual Report 2008 171
Preference shares As at 31 December 2008, unsecured preference shares included:
Facility Denomination
At 31 Dec 08
US$m
Fixed orfloatinginterest
rateInterestrate % Maturity
At 31 Dec 07US$m
Effectiveinterestrate %
in 2007
Preference shares series 2* CAD – Floating Jun 12 120 5.88Preference shares series 3 CAD 64 Fixed 4.58 Mar 09 79 4.58Preference shares series H CAD – Fixed 6.50 Mar 08 149 6.50 64 348
* Holders of Preference shares series 2 had the right to convert their shares into Preference shares series 3 in March 2009, subject to certain conditions.
The preference shares were assumed by the Group through the acquisition of Falconbridge in 2006. The Group completed the redemption of all of the outstanding preferred shares, series H for a cash consideration of CAD150 million (US$148 million) in June 2008. The Group completed the redemption of all of the outstanding preferred shares, series 2 for a cash consideration of CAD122 million (US$120 million) in July 2008. Pursuant to the terms of a guarantee indenture, Xstrata plc has fully and unconditionally guaranteed in favour of the holders of the preference shares the payment, within 15 days of when due, of all financial liabilities and obligations of Xstrata Canada Incorporated to such holders under the terms of the preference shares. The preference shares are classified within interest-bearing loans and borrowings because in the majority of cases the cumulative dividends must be paid for an indefinite period and/or the shares are transferable into a variable number of equity instruments.
Bank loans – other unsecured Other bank loans include: > Debts of proportionally consolidated joint ventures of US$139 million (2007: US$139 million) which bear interest at a rate based on LIBOR
plus 175 basis points, repayable in September 2012 and US$122 million (2007: US$163 million) which bear interest at a rate based on LIBOR plus 31 basis points, repayable by December 2011;
> US$ denominated borrowings of US$43 million (2007: US$nil) that are subject to floating interest rates based on Canadian Deposit Offering Rate (CDOR) plus 110 basis points, repayable by January 2009; and
> ZAR denominated borrowings of US$1 million (2007: US$3 million) that are subject to floating interest rates based on Johannesburg inter-bank acceptance rate (JIBAR), repayable by December 2010.
Bank overdrafts – unsecured The Group has bank overdrafts that are subject to local and US$ prime floating interest rates in which they have been drawn down. The majority of the bank overdrafts are denominated in Canadian and US dollars.
Minority interest loans Minority interest loans include US$81 million (2007: US$81 million) advanced to Minera Alumbrera Limited to fund operations that are subject to a fixed rate of 7.2% per annum (2007: 7.2% per annum), repayable by May 2012.
Minority interest loan of US$17 million advanced to Resource Pacific that is subject to a floating rate based on the Reserve Bank of Australia cash rate plus 2.0% per annum, no fixed repayment date but expected to be repaid within the next 12 months.
Other loans Other loans include: > AUD denominated loans of US$57 million (2007: US$54 million) payable to Western Mining Corporation Resources International Limited
and Indophil Resources Limited for the Tampakan copper project (refer note 7). The loan is subject to a fixed rate of interest of 4%, payable quarterly with no fixed repayment date and is not payable within 12 months; and
> Loan of US$6 million from Cantabria Government and Spanish Ministry of Industry & Energy, unsecured and interest free.
29. Convertible Borrowings
US$m 2008 2007
Convertible bond 331 327
331 327
Convertible bonds On 15 August 2003, Xstrata Capital Corporation AVV issued US$600 million of Convertible bonds, due 15 August 2010, convertible at the option of the holder into fully paid Xstrata plc ordinary shares. The Convertible bonds were guaranteed by the Company and were issued at par and bore a coupon of 3.95% per annum. On issue, they were convertible at any time after 26 September 2003 at the option of the holder into 61,180,977 ordinary shares in Xstrata plc based on a conversion price of GBP6.10 (US$9.81 converted into GBP at a fixed exchange rate) per ordinary share, a 39.6% premium to the closing price of Xstrata plc’s ordinary shares on 1 August 2003. During 2006, 64.3% of the US$600 million of convertible bonds was converted by the holders. Following the conversions that occurred during 2006 and rights issue in October 2006, the remaining number of ordinary shares that could be issued under the bond at 31 December 2006 was 24,516,537 and as a result of the rights issue the conversion price was adjusted to GBP5.44 (US$8.75 converted into GBP at a fixed exchange rate).
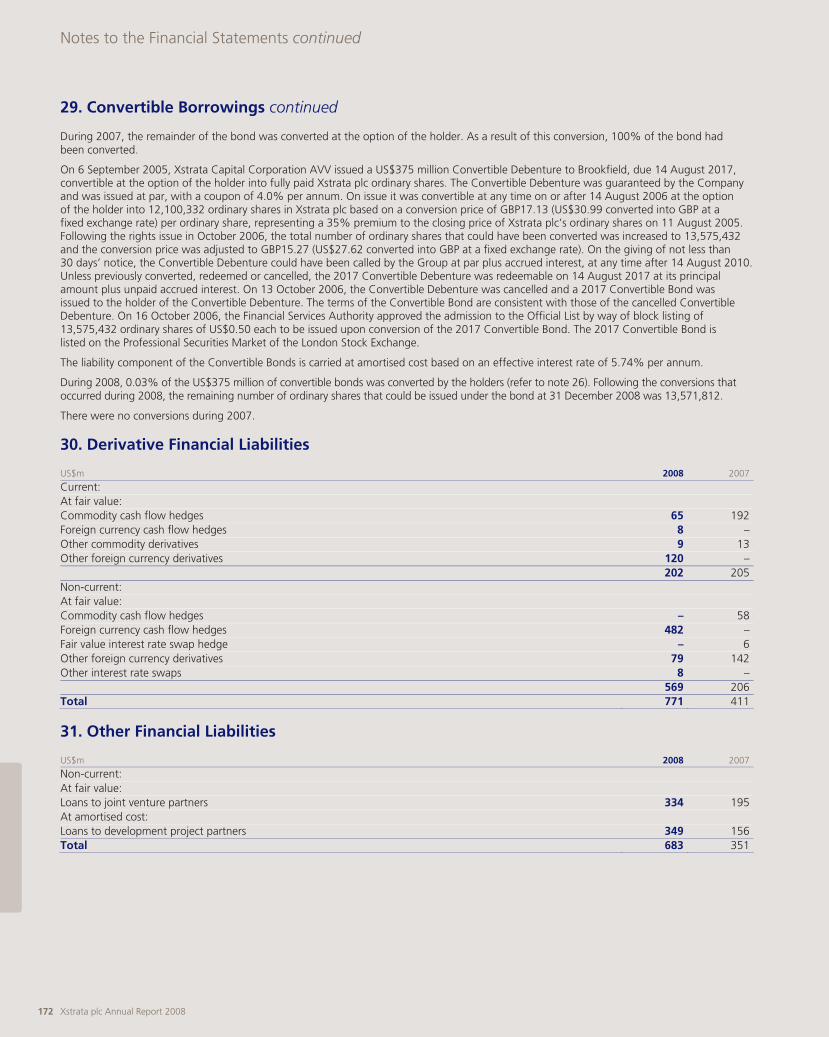
Notes to the Financial Statements continued
Xstrata plc Annual Report 2008 172
29. Convertible Borrowings continued
During 2007, the remainder of the bond was converted at the option of the holder. As a result of this conversion, 100% of the bond had been converted.
On 6 September 2005, Xstrata Capital Corporation AVV issued a US$375 million Convertible Debenture to Brookfield, due 14 August 2017, convertible at the option of the holder into fully paid Xstrata plc ordinary shares. The Convertible Debenture was guaranteed by the Company and was issued at par, with a coupon of 4.0% per annum. On issue it was convertible at any time on or after 14 August 2006 at the option of the holder into 12,100,332 ordinary shares in Xstrata plc based on a conversion price of GBP17.13 (US$30.99 converted into GBP at a fixed exchange rate) per ordinary share, representing a 35% premium to the closing price of Xstrata plc’s ordinary shares on 11 August 2005. Following the rights issue in October 2006, the total number of ordinary shares that could have been converted was increased to 13,575,432 and the conversion price was adjusted to GBP15.27 (US$27.62 converted into GBP at a fixed exchange rate). On the giving of not less than 30 days’ notice, the Convertible Debenture could have been called by the Group at par plus accrued interest, at any time after 14 August 2010. Unless previously converted, redeemed or cancelled, the 2017 Convertible Debenture was redeemable on 14 August 2017 at its principal amount plus unpaid accrued interest. On 13 October 2006, the Convertible Debenture was cancelled and a 2017 Convertible Bond was issued to the holder of the Convertible Debenture. The terms of the Convertible Bond are consistent with those of the cancelled Convertible Debenture. On 16 October 2006, the Financial Services Authority approved the admission to the Official List by way of block listing of 13,575,432 ordinary shares of US$0.50 each to be issued upon conversion of the 2017 Convertible Bond. The 2017 Convertible Bond is listed on the Professional Securities Market of the London Stock Exchange.
The liability component of the Convertible Bonds is carried at amortised cost based on an effective interest rate of 5.74% per annum.
During 2008, 0.03% of the US$375 million of convertible bonds was converted by the holders (refer to note 26). Following the conversions that occurred during 2008, the remaining number of ordinary shares that could be issued under the bond at 31 December 2008 was 13,571,812.
There were no conversions during 2007.
30. Derivative Financial Liabilities
US$m 2008 2007
Current: At fair value: Commodity cash flow hedges 65 192Foreign currency cash flow hedges 8 –Other commodity derivatives 9 13Other foreign currency derivatives 120 – 202 205Non-current: At fair value: Commodity cash flow hedges – 58Foreign currency cash flow hedges 482 –Fair value interest rate swap hedge – 6Other foreign currency derivatives 79 142Other interest rate swaps 8 – 569 206Total 771 411
31. Other Financial Liabilities
US$m 2008 2007
Non-current: At fair value: Loans to joint venture partners 334 195At amortised cost: Loans to development project partners 349 156Total 683 351
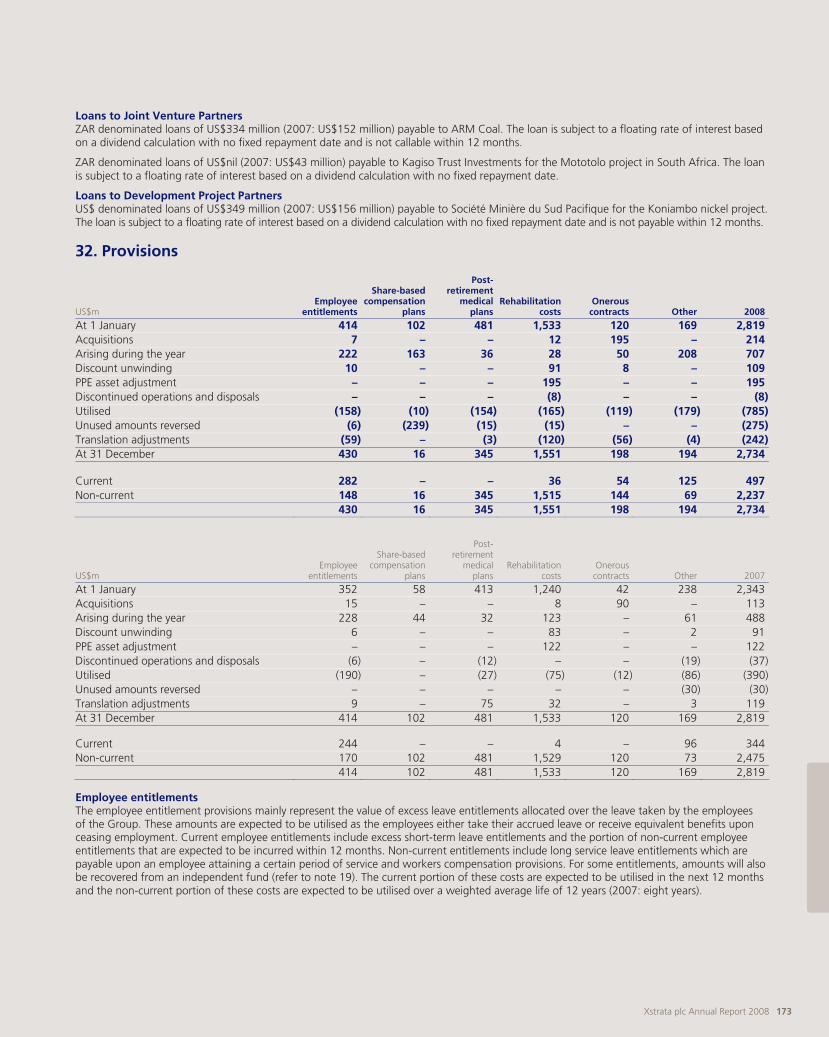
Xstrata plc Annual Report 2008 173
Loans to Joint Venture Partners ZAR denominated loans of US$334 million (2007: US$152 million) payable to ARM Coal. The loan is subject to a floating rate of interest based on a dividend calculation with no fixed repayment date and is not callable within 12 months.
ZAR denominated loans of US$nil (2007: US$43 million) payable to Kagiso Trust Investments for the Mototolo project in South Africa. The loan is subject to a floating rate of interest based on a dividend calculation with no fixed repayment date.
Loans to Development Project Partners US$ denominated loans of US$349 million (2007: US$156 million) payable to Société Minière du Sud Pacifique for the Koniambo nickel project. The loan is subject to a floating rate of interest based on a dividend calculation with no fixed repayment date and is not payable within 12 months.
32. Provisions
US$m Employee
entitlements
Share-basedcompensation
plans
Post-retirement
medicalplans
Rehabilitationcosts
Onerous contracts Other 2008
At 1 January 414 102 481 1,533 120 169 2,819Acquisitions 7 – – 12 195 – 214Arising during the year 222 163 36 28 50 208 707Discount unwinding 10 – – 91 8 – 109PPE asset adjustment – – – 195 – – 195Discontinued operations and disposals – – – (8) – – (8)Utilised (158) (10) (154) (165) (119) (179) (785)Unused amounts reversed (6) (239) (15) (15) – – (275)Translation adjustments (59) – (3) (120) (56) (4) (242)At 31 December 430 16 345 1,551 198 194 2,734 Current 282 – – 36 54 125 497Non-current 148 16 345 1,515 144 69 2,237 430 16 345 1,551 198 194 2,734
US$m Employee
entitlements
Share-basedcompensation
plans
Post-retirement
medicalplans
Rehabilitationcosts
Onerous contracts Other 2007
At 1 January 352 58 413 1,240 42 238 2,343Acquisitions 15 – – 8 90 – 113Arising during the year 228 44 32 123 – 61 488Discount unwinding 6 – – 83 – 2 91PPE asset adjustment – – – 122 – – 122Discontinued operations and disposals (6) – (12) – – (19) (37)Utilised (190) – (27) (75) (12) (86) (390)Unused amounts reversed – – – – – (30) (30)Translation adjustments 9 – 75 32 – 3 119At 31 December 414 102 481 1,533 120 169 2,819 Current 244 – – 4 – 96 344Non-current 170 102 481 1,529 120 73 2,475 414 102 481 1,533 120 169 2,819
Employee entitlements The employee entitlement provisions mainly represent the value of excess leave entitlements allocated over the leave taken by the employees of the Group. These amounts are expected to be utilised as the employees either take their accrued leave or receive equivalent benefits upon ceasing employment. Current employee entitlements include excess short-term leave entitlements and the portion of non-current employee entitlements that are expected to be incurred within 12 months. Non-current entitlements include long service leave entitlements which are payable upon an employee attaining a certain period of service and workers compensation provisions. For some entitlements, amounts will also be recovered from an independent fund (refer to note 19). The current portion of these costs are expected to be utilised in the next 12 months and the non-current portion of these costs are expected to be utilised over a weighted average life of 12 years (2007: eight years).
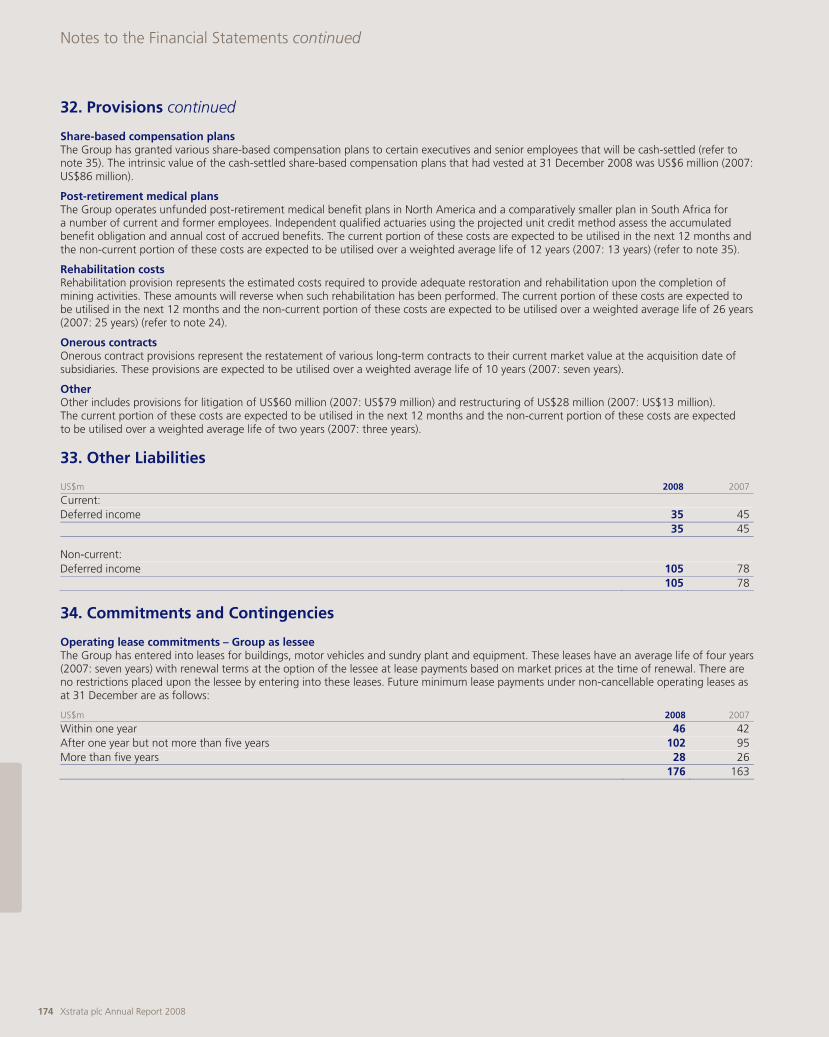
Notes to the Financial Statements continued
Xstrata plc Annual Report 2008 174
32. Provisions continued
Share-based compensation plans The Group has granted various share-based compensation plans to certain executives and senior employees that will be cash-settled (refer to note 35). The intrinsic value of the cash-settled share-based compensation plans that had vested at 31 December 2008 was US$6 million (2007: US$86 million).
Post-retirement medical plans The Group operates unfunded post-retirement medical benefit plans in North America and a comparatively smaller plan in South Africa for a number of current and former employees. Independent qualified actuaries using the projected unit credit method assess the accumulated benefit obligation and annual cost of accrued benefits. The current portion of these costs are expected to be utilised in the next 12 months and the non-current portion of these costs are expected to be utilised over a weighted average life of 12 years (2007: 13 years) (refer to note 35).
Rehabilitation costs Rehabilitation provision represents the estimated costs required to provide adequate restoration and rehabilitation upon the completion of mining activities. These amounts will reverse when such rehabilitation has been performed. The current portion of these costs are expected to be utilised in the next 12 months and the non-current portion of these costs are expected to be utilised over a weighted average life of 26 years (2007: 25 years) (refer to note 24).
Onerous contracts Onerous contract provisions represent the restatement of various long-term contracts to their current market value at the acquisition date of subsidiaries. These provisions are expected to be utilised over a weighted average life of 10 years (2007: seven years).
Other Other includes provisions for litigation of US$60 million (2007: US$79 million) and restructuring of US$28 million (2007: US$13 million). The current portion of these costs are expected to be utilised in the next 12 months and the non-current portion of these costs are expected to be utilised over a weighted average life of two years (2007: three years).
33. Other Liabilities
US$m 2008 2007
Current: Deferred income 35 45 35 45 Non-current: Deferred income 105 78 105 78
34. Commitments and Contingencies
Operating lease commitments – Group as lessee The Group has entered into leases for buildings, motor vehicles and sundry plant and equipment. These leases have an average life of four years (2007: seven years) with renewal terms at the option of the lessee at lease payments based on market prices at the time of renewal. There are no restrictions placed upon the lessee by entering into these leases. Future minimum lease payments under non-cancellable operating leases as at 31 December are as follows:
US$m 2008 2007
Within one year 46 42After one year but not more than five years 102 95More than five years 28 26 176 163

Xstrata plc Annual Report 2008 175
Finance lease and hire purchase commitments The Group has entered into finance leases and hire purchase contracts for various items of plant and machinery. The majority of these leases include a residual balloon payment at the end of the lease term and title passing to the Group. Future minimum lease payments under finance leases and hire purchase contracts together with the future finance charges as at 31 December are as follows:
US$m
Undiscountedminimumpayments
2008
Present value of
minimum payments
2008
Undiscountedminimumpayments
2007
Presentvalue of
minimumpayments
2007
Within one year 31 25 27 18After one year but not more than five years 65 49 100 74More than five years 54 36 56 40Total minimum lease payments 150 110 183 132Less amounts representing finance lease charges (40) – (51) –Present value of minimum lease payments 110 110 132 132
Capital commitments Amounts contracted for but not provided in the financial statements amounted to US$1,701 million (2007: US$1,455 million), including:
> Xstrata Coal US$52 million for longwall equipment at Oaky, US$34 million for five electric shovels at Cerrejón, US$1 million (2007: US$170 million) for the development of the Goedgevonden open cut coal mine, US$6 million (2007: US$53 million) for a dragline at the Wondoan project, US$nil (2007: US$53 million) for the Wollombi development and US$nil (2007: US$51 million) for a coal-handling preparation plant upgrade at Liddell;
> Xstrata Nickel US$839 million (2007: US$320 million) for the Koniambo project and US$5 million (2007: US$78 million) for the Nickel Rim South project; and
> Xstrata Zinc US$27 million (2007: US$109 million) for the development of an open cut mine at Mount Isa.
The balance of the other amounts contracted for but not provided relates to various minor commitments around the Group, mainly for the purchase of new property, plant and equipment.
Included in the above is US$195 million (2007: US$350 million) representing the Group’s share of the capital commitments that have been incurred jointly with other venturers.
Finance leases entered into after 31 December 2008 amounted to US$nil (2007: US$nil).
Guarantees Xstrata Coal Australia has contracted US$492 million (2007: US$588 million) for rail take or pay commitments, US$341 million (2007: US$450 million) for port take or pay commitments, performance guarantees to customers and suppliers under contracts for supply of coal and services for US$34 million (2007: US$24 million) and guarantees to the New South Wales and Queensland Departments for Mineral Resources in respect of various mining leases and the performance thereof US$203 million (2007: US$215 million).
Xstrata Coal South Africa has issued guarantees to the Department of Minerals and Energy to obtain certain prospecting permits of US$52 million (2007: US$70 million) and performance guarantees to suppliers of US$6 million (2007: US$8 million).
Xstrata Alloys has issued guarantees to Eskom for power usage and early termination of power usage of US$18million (2007: US$17 million) and to the Department of Mineral and Energy Mineral Resources, municipalities and governmental boards in respect of various mining leases and the performance thereof for US$21 million (2007: US$19 million).
Xstrata Copper, Xstrata Zinc and Xstrata Technology Australia have issued performance guarantees to customers for US$27 million (2007: US$53 million) and guarantees to the Queensland Departments for Mineral Resources and other government agencies in respect of various mining leases and the performance thereof, environmental bonds and self insurance licences US$161 million (2007: US$105 million).
Xstrata Nickel has issued guarantees for energy contracts of US$95 million (2007: US$153 million).
Xstrata Zinc has issued performance guarantees to the Northern Territory government for an electricity supply and pipeline agreement of US$22 million (2007: US$32 million), and to suppliers of US$17 million (2007: US$nil). It has provided bank guarantees to the Northern Territory government for rehabilitation costs of US$54 million (2007: US$49 million).
Xstrata Zinc has issued bank guarantees in Spain of US$54 million (2007: US$107 million).
Northfleet has issued bank guarantees to H M Customs and Excise in respect of the transport of Lead Slag for US$1 million (2007: US$nil).
A letter of credit of US$166 million (2007: US$205 million) has been given for the pension liabilities of the Group’s Canadian operations.
Letters of credit have been issued to the Canadian government for rehabilitation costs of US$40 million (2007: US$38 million).
Included in the above is US$1,097 million (2007: US$1,730 million) representing the Group’s share of guarantees that have been incurred jointly with other venturers.

Notes to the Financial Statements continued
Xstrata plc Annual Report 2008 176
35. Employee Benefits
Share-based payments The expense recognised for share-based payments during the year is shown in the following table:
US$m 2008 2007
Expense arising from equity-settled transactions 245 62Expense arising from cash-settled transactions (239) 44Total expense arising from share-based payment transactions 6 106
The Group operates a number of share-based payment plans which are outlined below. With the exception of the AVP that was modified in May 2008 as discussed below, there have been no cancellations or modifications to any of the plans during 2008 or 2007.
Xstrata plc Long-Term Incentive Plan (LTIP) The LTIP has two elements:
(i) A contingent award of free ordinary shares that vests after three years, subject to, and to the extent that, performance criteria determined at the time of grant have been satisfied; and
(ii) An option to acquire ordinary shares at a specified exercise price after the third anniversary of grant, subject to, and to the extent that, performance criteria determined at the time of grant have been satisfied.
All LTIP awards that vest are subject to the satisfaction of certain performance criteria being met over a three-year performance period. The 2003 LTIP awards are only subject to the Total Shareholder Return (TSR) performance criteria. Half of the options and free share awards granted in 2004 and 2005 are conditional on TSR relative to a peer group, with the remainder conditional on the Group’s real cost savings relative to targets set on a stretching scale over the three-year period. The allocation of performance criteria pertaining to the options and free share awards granted in 2006, 2007 and 2008 is summarised in the following table:
Award Employees Number % TSR % cost savings TSR Cost savings
2008: Options Corporate 986,035 50% 50% 493,017 493,018 Business units 2,154,539 25% 75% 538,635 1,615,904 3,140,574 1,031,652 2,108,922Free shares Corporate 295,810 50% 50% 147,905 147,905 Business units 646,367 25% 75% 161,592 484,775 942,177 309,497 632,6802007: Options Corporate 1,140,952 50% 50% 570,476 570,476 Business units 2,117,638 25% 75% 529,410 1,588,228 3,258,590 1,099,886 2,158,704Free shares Corporate 342,286 50% 50% 171,143 171,143 Business units 635,287 25% 75% 158,822 476,465 977,573 329,965 647,6082006: Options Corporate 1,048,144 50% 50% 524,072 524,072 Business units 1,764,060 25% 75% 441,015 1,323,045 2,812,204 965,087 1,847,117Free shares Corporate 314,444 50% 50% 157,222 157,222 Business units 538,092 25% 75% 134,523 403,569 852,536 291,745 560,791
For the awards conditional on TSR, one-half of the award will vest if TSR growth is at the median of the specified peer group, the full award will vest for performance at or above the second decile with straight-line vesting between these points. No vesting will occur for below median performance. For the awards where vesting is conditional on the Group’s real cost savings relative to targets set on a stretching scale: 10% of the award will vest for 1% cost savings, 70% for 2% cost savings and all awards for 3% or more cost savings, with straight-line vesting between these points. No vesting will occur if cost savings are less than 1%. Real cost savings are measured in relation to operating costs after adjusting for the effects of inflation, excluding depreciation, commodity price-linked costs, effects of currencies on translation of local currency costs and planned life of mine adjustments. No other features of the LTIP awards are incorporated into the measurement of fair value.
No consideration will be payable on the vesting of an LTIP award of free ordinary shares. On exercise of an option, a participant will be required to pay an exercise price which is based on the closing market price of an ordinary share seven trading days prior to the date of grant.
Of the below options, 1.9 million (2007: 2.0 million) are accounted for as cash-settled share-based awards whilst the remainder of the LTIP awards are equity-settled (refer to note 32).

Xstrata plc Annual Report 2008 177
The movement in the number of free ordinary shares and share options is as follows:
Free shares 2008
No 2008
WAEP 2007
No 2007
WAEP
Outstanding as at 1 January 3,247,7471 N/A 4,129,3651 N/AGranted during the year 942,177 N/A 977,573 N/AForfeited during the year (48,835) N/A (54,491) N/AExercised during the year (1,375,891)3 N/A (1,804,700)2 N/AOutstanding as at 31 December 2,765,198 N/A 3,247,747 N/AExercisable 31 December – N/A – N/A
1 All shares included in this balance have been accounted for in accordance with IFRS 2 Share-based Payments. 2 The weighted average share price at the date of exercise of these awards was GBP23.63. 3 The weighted average share price at the date of exercise of these awards was GBP36.98.
The weighted average remaining contractual life for the free shares outstanding as at 31 December 2008 is 8.2 years (2007: 8.1 years).
The weighted average fair value of free shares granted during the year was US$60.46 (2007: US$38.23).
Share options 2008
No 2008
WAEP 2007
No 2007
WAEP
Outstanding as at 1 January 13,194,997 GBP13.73 14,450,730 GBP9.26Granted during the year 3,140,574 GBP35.36 3,258,590 GBP24.00Forfeited during the year (129,724) GBP24.52 (182,323) GBP13.21Exercised during the year (2,877,142)2 GBP9.18 (4,332,000)1 GBP6.49Outstanding as at 31 December 13,328,7053 GBP19.70 13,194,9973 GBP13.73Exercisable at 31 December 4,069,712 GBP7.58 2,402,460 GBP5.89
1 The weighted average share price at the date of exercise of these options was GBP25.58. 2 The weighted average share price at the date of exercise of these options was GBP39.67. 3 All the share options included in this balance have been accounted for in accordance with IFRS 2 Share-based Payments, except for 65,708 options issued in 2002.
The weighted average remaining contractual life for the share options outstanding as at 31 December 2008: 7.4 years (2007: 7.7 years).
The weighted average fair value of options granted during the year was US$21.39 (2007: US$13.93).
The range of exercise prices for options outstanding at the end of the year was GBP3.22 to GBP35.36 (2007: GBP3.22 to GBP24.00).
The following table lists the inputs to the models used to measure the fair value of equity-settled awards granted:
Date ofgrant2008
Date ofgrant2007
Dividend yield (%) 0.8 1.5Expected volatility (%) 36 35Risk-free interest rate (%) 4.1 5.1Earliest exercise date 04 Apr 11 15 Mar 10Latest exercise date 03 Apr 18 14 Mar 17Expected exercise date 19 Jan 12 27 Nov 10Share price at date of grant (GBP) 37.06 24.25Exercise price (GBP) 35.36 24.00Free share fair value at date of grant (GBP) 30.33 19.73Option fair value at date of grant (GBP) 11.07 6.74
The expected life of the options is based on historical data and is not necessarily indicative of exercise patterns that may occur. The expected volatility reflects the assumption that the historic volatility is indicative of future trends, which may also not necessarily be the actual outcome.
Both the free shares and the equity-settled options are equity-settled plans and the fair value is measured at the date of grant.
The fair value of the cash-settled options is measured at the date of grant and at each reporting date until the liability is settled, using binomial models, taking into account the terms and conditions of the award.

Notes to the Financial Statements continued
Xstrata plc Annual Report 2008 178
35. Employee Benefits continued
Xstrata AG incentive plan With the merger of Xstrata AG into Xstrata plc, Xstrata plc assumed the obligations of Xstrata AG under the scheme with the number of options and exercise price adjusted accordingly. The share options had a two-year vesting period followed by a three-year exercise period. The exercise price was the share price at the date of granting of the share options. There were no other conditions attaching to these options and they could be cash-settled by the holder. No further options were granted under this incentive plan. All of the options below were accounted for as cash-settled share-based awards. The movement in the number of share options are as follows:
2008
No2008
WAEP 2007
No 2007
WAEP
Outstanding as at 1 January – – 14,3201 CHF13.41Exercised during the year – – (14,320)2 CHF13.41Outstanding as at 31 December – – – –Exercisable at 31 December – – – –
1 All shares included in this balance have been accounted for in accordance with IFRS 2 Share-based Payments. 2 The weighted average share price at the date of exercise of these options was CHF56.96.
The weighted average remaining contractual life for the share options outstanding as at 1 January 2007 was 0.1 years.
No new shares were granted during the year.
Directors’ service contracts Options were granted to two executive directors pursuant to the terms on which they were recruited. The options are to be equity-settled. The exercise price is the share price at the date of granting of the share options. The final scheme vested in January 2007 and each scheme has an exercise period of seven years. If the holder ceases to be employed by the Group for any reason, they may exercise any vested options within six months of such cessation, after which the options lapse. Any unvested options will lapse if the holder is dismissed lawfully under the terms of their contract or if they voluntarily resign except where they have a valid reason to terminate their employment as defined in their employment contract, in which case all unvested options shall immediately vest and become exercisable for a period of six months. In all other cases, they will remain exercisable for a period of six months.
The movement in the number of share options are as follows:
2008 No
2008 WAEP
2007 No
2007WAEP
Outstanding as at 1 January 1,142,492 GBP4.25 1,242,492 GBP4.36Exercised during the year (148,498)1 GBP5.68 (100,000)2 GBP5.68Outstanding as at 31 December 993,994 GBP4.03 1,142,492 GBP4.25Exercisable at 31 December 993,994 GBP4.03 1,142,492 GBP4.25
1 The weighted average share price at the date of exercise of these options was GBP41.57. 2 The weighted average share price at the date of exercise of these options was GBP27.62.
The above share options have not been accounted for in accordance with IFRS 2 Share-based Payments as the options were granted on or before 7 November 2002 and have not been subsequently modified.
The weighted average remaining contractual life for the share options outstanding as at 31 December 2008 is 4.2 years (2007: 5.4 years).
No new shares were granted during the year.
The range of exercise prices for options outstanding at the end of the year was GBP3.84 to GBP4.22 (2007: GBP3.84 to GBP5.68).
Deferred bonus As detailed in the Directors’ Remuneration Report on pages 98 to 107, the maximum bonus payable under the Bonus Plan for executive directors and the members of the Executive Committee is 300% of salary. Bonuses are payable in three tranches as follows:
> the maximum bonus, which any one participant is eligible to receive in cash, will be limited to 100% of the individual’s base salary;
> any additional bonus up to a further 100% of base salary will be deferred for a period of one year; and
> any remaining bonus will be deferred for a period of two years.
The deferred elements will take the form of awards of Xstrata shares conditional on the participant remaining in employment throughout the deferral period. The number of shares awarded will be determined by reference to the market value of the shares at the date concurrent awards under the LTIP are made. The deferred elements have been treated as an equity-settled share-based payment in accordance with IFRS 2.
In 2005 the Xstrata Remuneration Committee resolved that during the bonus deferral period dividend equivalents would accrue in relation to the deferral, to be delivered at the end of the deferral period and subject to the deferral award vesting.
As dividend equivalents are receivable on the deferred amounts, the fair value of the deferral is technically equal to the value of the bonuses deferred.

Xstrata plc Annual Report 2008 179
The following deferred bonus awards have been made:
2008 2007 2006
Market value of deferred bonus award (US$m) 10 16 13Number of shares purchased –* 242,702 291,585
* At the date of signing the financial statements, the shares were yet to be purchased in the market.
Directors’ Added Value Plan (AVP) The AVP is a long-term incentive and retention plan for the Chief Executive which rewards outperformance in creating additional long-term shareholder value over the value created by Xstrata plc’s peer companies and aligns interests with shareholders by means of share ownership. Performance is assessed over periods of three years and five years from the date of award of each cycle and is based upon the growth in the Company’s TSR over the relevant performance period relative to an index of global mining companies, which form the Xstrata TSR Index. A description of the performance requirements and the vesting schedule of the plan are detailed within the Directors’ Remuneration Report on pages 98 to 107. The first cycle of the AVP began on 9 May 2005, the second began on 10 March 2006, the third began on 15 March 2007 and the fourth began on 26 March 2008. The AVP will terminate on 9 May 2010, after which no further awards will be granted.
For the 2008 plan cycle, the market capitalisation on 26 March 2008 was US$76.4 billion, the Participation Percentage was equal to 0.5% and the share price at the measurement date was US$70.50. For the 2007 plan cycle, the market capitalisation on 15 March 2007 was US$45.2 billion, the Participation Percentage was equal to 0.3% and the share price at the measurement date was US$46.77. For the 2006 plan cycle, the market capitalisation on 10 March 2006 was US$18.6 billion, the Participation Percentage was equal to 0.3% and the share price at the measurement date was US$29.39. For the 2005 plan cycle, the market capitalisation on 9 May 2005 was US$11.4 billion, the Participation Percentage was equal to 0.5% and the share price at the measurement date was US$18.00. On 6 May 2008, amendments to the rules of the AVP, as outlined in the Directors’ Remuneration Report in the 2007 Annual Report on page 126, were approved at the Xstrata Annual General Meeting. In May 2008, 50% of the interim award of the 2005 AVP cycle was cash-settled as detailed in the Directors’ Remuneration Report on pages 98 to 107. The remaining 50% of the interim award of the 2005 AVP cycle is deferred in equal portions for one and two years and its value moves in accordance with the Company’s share price. At 31 December 2008, the fair value of this deferred award was US$13 million.
Under IFRS 2, at the grant date of 9 May 2005, the fair value of any potential award for the 2005 plan was US$7 million, using a Monte Carlo simulation model to incorporate the market-based features of the plan. At the grant date of 10 March 2006, the fair value of any potential award for the 2006 plan was US$7 million; at the grant date of 15 March 2007, the fair value of any potential award for the 2007 plan was US$19 million; and the fair value of any potential award of the 2008 share-based payment was US$120 million, estimated at the grant date of 26 March 2008, using a Monte Carlo simulation model. At current performance, no payment would be made under the 2006, 2007 or 2008 AVP plans. During the year, it was determined that the AVP should be accounted for as a cash-settled share-based payment to reflect the expected form of settlement. Accordingly, a provision was recognised based on the fair value of each award adjusted for the vesting period yet to lapse using a Monte Carlo simulation model. At 31 December 2008, the fair value of all unvested AVP awards was US$14 million and the total provision held at 31 December 2008 for the AVP was US$10 million (refer to note 32).
The following table lists the inputs to the models used to measure the fair value of the AVP award granted:
2008 2007
Xstrata plcXstrata Share
Indices1 Xstrata plc Xstrata Share
Indices1
Dividend yield (%) N/A N/A2 N/A N/A2
Expected volatility to interim vesting (%) 40 31 N/A N/A Expected volatility to final vesting (%) 37 28 38 25 Risk-free interest rate to interim vesting (%) 4.1 4.1 N/A N/A Risk-free interest rate to final vesting (%) 4.2 4.2 5.2 5.2 Third anniversary of start of cycle 26 March 2011 26 March 2011 15 March 2010 15 March 2010 Fourth anniversary of start of cycle 26 March 2012 26 March 2012 15 March 2011 15 March 2011 Fifth anniversary of start of cycle 26 March 2013 26 March 2013 15 March 2012 15 March 2012 Sixth anniversary of start of cycle 26 March 2014 26 March 2014 N/A N/A
1 There are two Xstrata Share Indices used within the valuation model; one is a market capitalisation weighted TSR index comprising 14 global mining firms (2007: 15 global mining firms) considered to be Xstrata’s key competitors for both financial and human capital. The other is a market capitalisation price index comprising the same global mining firm constituents.
2 When simulating the Xstrata Price Index, a dividend yield is included to account for the suppressing impact that a dividend payment has on the constituent share prices. A yield of 2.3% (2007: 2.5%) has been used. For the simulation of Xstrata’s TSR and the Index TSR a dividend yield is not required.

Notes to the Financial Statements continued
Xstrata plc Annual Report 2008 180
35. Employee Benefits continued
The following table lists the ranges of inputs to the models used to measure the fair value of each unvested cycle of the AVP awards amended on 6 May 2008:
Xstrata plcXstrata Share
Indices1
Dividend yield (%) N/A N/A2
Expected volatility to interim vesting (%) 42 – 49 33 – 38 Expected volatility to final vesting (%) 38 – 44 29 – 34 Risk-free interest rate to interim vesting (%) 4.4 – 4.5 4.4 – 4.5 Risk-free interest rate to final vesting (%) 4.4 – 4.5 4.4 – 4.5
1 There are two Xstrata Share Indices used within the valuation model; one is a market capitalisation weighted TSR index comprising relevant global mining firms who are considered to be Xstrata’s key competitors for both financial and human capital at the commencement of each cycle. The other is a market capitalisation price index comprising the same global mining firm constituents.
2 When simulating the Xstrata Price Index, a dividend yield is included to account for the suppressing impact that a dividend payment has on the constituent share prices. A yield of 1.9% has been used. For the simulation of Xstrata’s TSR and the TSR Index a dividend yield is not required.
The expected volatility reflects the assumption that the historic volatility is indicative of future trends, which may also not necessarily be the actual outcome. The AVP is not an award over a fixed number of shares.
Pensions and Other Post-employment Benefit Plans The net expense recognised in the income statement for the year ended 31 December:
US$m 2008 2007
Defined benefit pension plans 39 14Defined contribution pension plans 109 110Post-retirement medical plans 40 32 188 156
Defined Contribution Pension Plans The Group participates in a number of defined contribution pension plans and industry-wide schemes covering the majority of its employees. The assets are held separately from those of the Group and are generally invested with insurance companies and regulated by local legislation.
Post-retirement Medical Plans The Group participates in a number of post-retirement medical benefits. All material post-retirement medical benefit liabilities are in North America with smaller exposures in South Africa. Independent qualified actuaries assess the accumulated benefit obligation and annual cost of accrued benefits using the projected unit credit method. The actuaries have updated the valuations to 31 December 2008.
Defined Benefit Pension Plans The Group contributes to defined benefit pension plans for a number of its employees. Independent professionally qualified actuaries assess the pension costs and funding of these plans using the projected unit method. The actuaries have updated the valuations to 31 December 2008. All significant pension assets and liabilities are in North America.
The following tables summarise the components of the net expense recognised in cost of sales in the income statement and the funded status and amounts recognised in the balance sheet for the defined benefit pension plans and post-retirement medical plans.
The weighted average principal economic assumptions used to determine the actuarial values are as follows:
Pensionplans2008
Post- retirement
medical plans 2008
Pensionplans2007
Post-retirement
medical plans2007
Rate of salary increases 3.1% – 3.8% –Rate of pension increases 2.7% – 3.2% –Expected rate of return on plan assets: Equities 9.1% – 9.1% –Bonds 5.2% – 4.6% –Total 6.5% – 6.9% –Discount rate 7.3% 7.4% 5.6% 5.7%Inflation rate 2.6% 2.6% 2.5% 2.6%Rate of medical cost increases – 8.0% – 9.0%
A one percentage point change in the assumed rate of increase in healthcare costs would have the following impact:
US$m Increase
2008Decrease
2008 Increase
2007 Decrease
2007
Effect on the current service cost and interest cost 5 4 6 5Effect on the defined benefit obligation 38 31 57 47

Xstrata plc Annual Report 2008 181
The pension plan mortality rate used at 31 December 2008 and 31 December 2007 was UP-94 for North American pension and post-retirement medical plans. These rates refer to published projected mortality tables by actuarial bodies in North America and take into account the assumed increases in the life expectancy and are calculated for both current and future pensioners. There are no significant differences in these rates between schemes. The average life expectancy in the pension plans was 85 years (2007: 85 years) and in the medical plans was 82 years (2007: 82 years) as at 31 December 2008.
The assets and liabilities of the schemes and the amounts recognised in the Group balance sheet at 31 December are as follows:
US$m
Pensionplans2008
Post- retirement
medical plans 2008
Pensionplans 2007
Post-retirement
medical plans 2007
Present value of benefit obligations 1,994 345 2,721 481Assets at fair value (1,677) – (2,495) –Net liability 317 345 226 481 Net liability as at 31 December represented by: Pension deficits/provisions 320 345 231 481Pension assets (3) – (5) –Net liability 317 345 226 481
Historical adjustments are as follows:
US$m 2008 2007 2006 2005 2004
Defined benefit obligation 1,994 2,721 2,604 106 110Plan assets (1,677) (2,495) (2,393) (85) (85)Net deficit 317 226 211 21 25Experience (gain)/loss adjustments on plan liabilities 74 69 (4) (8) (1)Experience (gain)/loss adjustments on plan assets 480 126 (96) (4) 1
The reconciliation of the net liability movement during the year in the net pension and post-retirement medical plan liability (before allowance of deferred tax) are as follows:
US$m
Pensionplans2008
Post- retirement
medical plans 2008
Pensionplans 2007
Post-retirement
medical plans 2007
Net liability as at 1 January 226 481 211 413Discontinued operations and disposals – – (19) (12)Total benefit expense 39 40 14 32Actuarial (gains)/losses 188 (76) 104 (6)Employer contributions (75) (22) (116) (21)Translation adjustments (61) (78) 32 75Net liability as at 31 December 317 345 226 481
Contributions of US$52 million in 2009, US$58 million in 2010, US$52 million in 2011 and US$50 million in 2012 and US$38 million in 2013 are being made in order to eliminate the deficiency in the North America plans. The total contributions to the defined benefit pension plans in 2009 including these further contributions are US$74 million.
The components of benefit (income)/expense recognised in the income statement during the year are as follows:
US$m
Pensionplans2008
Post- retirement
medical plans 2008
Pensionplans 2007
Post-retirement
medical plans 2007
Service cost 53 14 43 9Interest cost 139 26 133 23Expected return on plan assets (net of expected expenses) (153) – (162) – 39 40 14 32

Notes to the Financial Statements continued
Xstrata plc Annual Report 2008 182
35. Employee Benefits continued
The components of actuarial (gains)/losses recognised in the Consolidated Statement of Recognised Income and Expenses during the year are as follows:
US$m
Pensionplans2008
Post- retirement
medical plans 2008
Pensionplans 2007
Post-retirement
medical plans 2007
Expected return on plan assets (net of expected expenses) 153 – 162 –Actual return on plan assets 327 – (36) –Actual return less expected return on plan assets 480 – 126 –Actuarial (gain)/loss on obligations 74 – 69 (12)Change of assumptions (366) (76) (91) 6 188 (76) 104 (6)
The cumulative amount of net actuarial losses recognised in the statement of recognised income and expenses is US$150 million (2007: loss US$38 million).
The reconciliation of the present value of benefit obligations and fair value of plan asset movements during the year are as follows:
US$m
Pensionplans2008
Post- retirement
medical plans 2008
Pensionplans 2007
Post-retirement
medical plans 2007
Benefit obligation present value as at 1 January 2,721 481 2,604 413Discontinued operations and disposals – – (255) (12)Current service cost 53 14 43 9Interest cost 139 26 133 23Employee contributions 1 – 1 –Actuarial (gains)/losses 74 – 69 (12)Actual benefit payments (162) (22) (165) (21)Change of assumptions (366) (76) (91) 6Translation adjustments (466) (78) 382 75Benefit obligation present value as at 31 December 1,994 345 2,721 481Plan assets fair value as at 1 January 2,495 – 2,393 –Discontinued operations and disposals – – (236) –Actual return on plan assets (327) – 36 –Company contributions 75 – 116 –Employee contributions 1 – 1 –Benefits paid from fund (162) – (165) –Translation adjustments (405) – 350 –Plan assets fair value as at 31 December 1,677 – 2,495 –Net liability as at 31 December 317 345 226 481Net liability as at 1 January 226 481 211 413
The defined benefit obligation present value included above for unfunded pension plans at 31 December 2008 was US$6 million (2007: US$5 million).
The major categories of plan assets as a percentage of the fair value of total plan assets are as follows:
Pensionplans2008
Pensionplans2007
Equities 35% 49%Bonds 62% 49%Other 3% 2%
Included in equities is US$nil (2007: US$nil) of Xstrata plc shares.
The overall expected rate of return on assets is determined based on the market value weighted expected return applicable to the underlying asset category.

Xstrata plc Annual Report 2008 183
36. Related Parties
Name Country of incorporation Principal activities
% of ordinary shares held & voting rights
Principal Subsidiaries Xstrata Coal Abelshore Pty Limited Australia Coal operations 100%AZSA Holdings Pty Limited Australia Holding company 100%Coalex Holdings Pty Limited Australia Coal operations 78%Cook Resources Mining Pty Limited Australia Coal operations 100%Cumnock No. 1 Colliery Pty Limited Australia Coal operations 100%Enex Foydell Limited Australia Coal operations 100%Enex Liddell Pty Limited Australia Coal operations 100%Enex Oakbridge Pty Limited Australia Coal operations 100%Enex Togara Pty Limited Australia Coal project 100%Jonsha Pty Limited Australia Coal operations 100%Oakbridge Pty Limited Australia Coal operations 78%Oceanic Coal Australia Limited Australia Coal operations 100%Ravensworth Operations Pty Limited Australia Coal operations 100%Resource Pacific Pty Limited Australia Coal operations 77.8%Saxonvale Coal Pty Limited Australia Coal operations 78%Tahmoor Coal Pty Limited Australia Coal operations 100%The Wallerawang Collieries Limited Australia Coal operations 74.1%Ulan Coal Mines Limited Australia Coal operations 90%Ulan Power Company Pty Limited Australia Feasibility projects 100%United Collieries Pty Limited Australia Coal operations 95%Xstrata Coal Pty Limited Australia Holding company 100%Xstrata Coal Corporate Pty Limited Australia Management company 100%Xstrata Coal Holdings Pty Limited Australia Holding company 100%Xstrata Coal Investments Australia Pty Limited Australia Holding company 100%Xstrata Coal Queensland Pty Limited Australia Coal operations 100%Xstrata Mangoola Pty Limited Australia Coal Project 100%Xstrata Newpac Pty Limited Australia Investment company 100%Xstrata Coal Canada Limited Canada Holding company 100%Xstrata Coal Donkin Limited Canada Coal project 100%Xstrata Cerrejón Limited Bermuda Coal operations 100%Xstrata Coal South America Limited Bermuda Holding company 100%Tavistock Collieries (Pty) Limited South Africa Coal operations 100%Tironimus AG Switzerland Holding company 100%Xstrata Coal Marketing AG Switzerland Marketing & Trading 100%Xstrata Alloys Xstrata South Africa (Pty) Limited South Africa Holding company, Coal, Chrome, 100% Platinum & Vanadium operations Eland Platinum Holdings Limited South Africa Platinum operation 74%Char Technology (Pty) Limited South Africa Char operation 100%African Fine Carbon (Pty) Limited South Africa Char operation 100%African Carbon Producers (Pty) Limited South Africa Char operation 100%Xstrata Copper Ernest Henry Mining Pty Limited Australia Copper operation 100%Minera Alumbrera Limited* Antigua Copper operation 50%Mount Isa Mines Limited Australia Copper, Lead and Zinc operations 100%Xstrata South America Limited Cayman Holding company 100%Xstrata Tintaya S.A. Peru Holding company 100%Compania Minera Xstrata Lomas Bayas Chile Copper operations 100%Xstrata Inversiones Chile Limitada Chile Holding company 100%Xstrata Copper Chile S.A. Chile Copper smelter 100%Xstrata Commodities Middle East DMCC†† UAE Marketing 100%Xstrata Recycling Inc. USA Copper recycling 100%

Notes to the Financial Statements continued
Xstrata plc Annual Report 2008 184
36. Related Parties continued
Name Country of incorporation Principal activities
% of ordinary shares held & voting rights
Xstrata Nickel Xstrata International (Investments) Limited Bermuda Holding company 100%Xstrata Nickel International Limited Barbados Nickel feeds acquisition 100%Falconbridge Dominicana C por A Dom. Republic Ferronickel operation 85%Xstrata Nickel Marketing S.A. Belgium Nickel marketing 100%Xstrata Nikkelverk Aktieselskap AS Norway Nickel refinery 100%Xstrata Nickel International S.A. Belgium Nickel procurement agent 100%Xstrata Nickel Australasia Pty Ltd Australia Nickel operation 100%Xstrata Brasil Exploracao Mineral Ltda Brazil Exploration 100%Koniambo Nickel SAS** New Caledonia Ferronickel Project 49%Xstrata Zinc Asturiana de Zinc SA Spain Zinc smelter 100%Britannia Refined Metals Limited UK Lead smelter 100%McArthur River Mining Pty Limited Australia Zinc operations 100%Xstrata Zinc GmbH Germany Zinc smelter 100%Xstrata Technology Xstrata Technology Pty Limited Australia Technology operations 100%MIM Process Technology South Africa (Pty) Limited South Africa Technology operations 100%Other Xstrata (Schweiz) AG*** Switzerland Holding company 100%Xstrata Capital Corporation AVV† Aruba Finance company 100%Xstrata Finance (Dubai) Limited†† UAE Finance company 100%Xstrata Holdings Pty Limited Australia Holding company 100%Xstrata Queensland Limited Australia Holding company 100%Xstrata Canada Corporation Canada Copper, Nickel and Zinc operations 100%Xstrata Finance (Canada) Limited Canada Finance company 100%Noranda Finance Inc. USA Finance company 100%Xstrata Canada Inc. Canada Holding company 100%Alberta Limited Canada Holding Company 100%

Xstrata plc Annual Report 2008 185
Name
Principal place of operations/country of incorporation Principal activities
Effectiveinterest held
Principal Joint Ventures Xstrata Coal Bulga Joint Venture Australia Coal operations 68.25%Cerrejón Joint Venture Colombia Coal operations 33.33%Cumnock Joint Venture Australia Coal operations 90%Donkin Joint Venture Canada Coal project 75%Goedgevonden Joint Venture South Africa Coal operations 73.99%Foybrook Joint Venture Australia Coal operations 67.5%Liddell Joint Venture Australia Coal operations 67.5%Macquarie Coal Joint Venture Australia Coal operations 80%Newlands, Collinsville, Abbot Point Joint Venture Australia Coal operations 55%Newpac Coal Joint Venture Australia Coal operations 70%Oaky Creek Coal Joint Venture Australia Coal operations 55%Rolleston Pentland Wandoan Joint Venture Australia Coal operations 75%Togara North Joint Venture Australia Coal project 33.3%Ulan Coal Mines Joint Venture Australia Coal operations 90%United Joint Venture Australia Coal operations 95%Xstrata Alloys Merafe Pooling and Sharing Venture South Africa Chrome operations 79.5%Mototolo Joint Venture South Africa Platinum operations 37%Ngazana Consortium Pooling and Sharing Venture South Africa Platinum operations 74%Xstrata Copper Antamina Joint Venture Peru Copper & Zinc operations 33.75%Collahuasi Joint Venture Chile Copper operations 44%Xstrata Nickel Kabanga Joint Venture Tanzania Nickel project 50% Principal Associates Xstrata Alloys Lonmin plc UK Platinum operations 24.9%Xstrata Coal ARM Coal (Pty) Limited South Africa Coal operations 49%Newcastle Coal Shippers Pty Limited Australia Coal terminal 31%Port Kembla Coal Terminal Limited Australia Coal terminal 35.6%Richards Bay Coal Terminal Company Limited South Africa Coal terminal 20.9%Xstrata Zinc Noranda Income Fund Canada Zinc refinery 25%
* This investment is treated as a subsidiary as the Group is entitled to two of the four Board positions of Minera Alumbrera Limited, including the Chairman as it is the manager of the copper operation. The Chairman has the casting vote where any vote is split equally between the four Board positions, however, in a limited number of situations the vote must be unanimous, including transactions with related parties.
** The Group has de facto control of Koniambo Nickel SAS as a result of its industry expertise and the ability to control the operating and financing decisions of the Joint Venture.
*** Directly held by the parent company. † 40% held by the parent company. †† 90% held by the parent company.
The Group comprises a large number of companies and it is not practical to include all of these in the above list. All entities operate mainly in the country of incorporation and these interests are held indirectly by the parent company unless otherwise indicated.

Notes to the Financial Statements continued
Xstrata plc Annual Report 2008 186
36. Related Parties continued
During the year, the Group entered into the following transactions, in the ordinary course of business, with related parties:
US$m Sales** Purchases
Treatment & refining
charges
Treatment & refining
revenue
Agency &other
charges
Interest & other
revenue Amounts payable
Amountsreceivable
Glencore International AG* 2008 9,282 809 218 1 99 – 147 2472007 8,713 1,217 90 26 79 2 240 467 Joint venture entities 2008 – 334 – – – 6 125 –2007 – 427 – – – 8 360 329 Associates 2008 436 – 201 – 11 3 1 232007 792 – 202 – 12 3 2 20
* Includes share of joint ventures. ** No provision for doubtful debts has been raised in respect of transactions with related parties.
Included in the transactions with Glencore International AG (Glencore) are US$1,136 million (2007: US$484 million) of back-to-back sales whereby the title to the goods has passed to Glencore but they are then on-sold to customers at the same sales price that the Group received.
Amounts payable and receivable, are included in Trade and other receivables (refer to note 19) and in Trade and other payables (refer to note 27), are unsecured and will be settled in cash.
Glencore International AG – Substantial shareholder As at 31 December 2008, Glencore owned 34.4% (2007: 34.7%) of the issued share capital of the Company representing 336,801,333 ordinary shares (2007: 336,801,333 ordinary shares).
Chrome Xstrata Alloys entered into a ferrochrome marketing agreement with Glencore on 21 April 1995, appointing Glencore as its exclusive world-wide marketing agent for the sale of Xstrata Alloys entire production of ferrochrome other than ferrochrome sold into the US, Canada and certain Asian countries. The agreement continues for as long as Xstrata Alloys produces ferrochrome. Glencore is obliged to use its best endeavours to arrange sales at prevailing market rates subject to initial agreement and approval by Xstrata Alloys prior to effecting the sale. Glencore assists Xstrata Alloys in negotiating sales contracts with third parties. Glencore is entitled to receive an agency fee of 3.5% on FOB sales revenues and an additional fee of 0.75% on FOB sales revenues for assuming the risk of non-payment by customers on this material. Glencore assumes 60% of the risk of non-payment by customers in relation to ferrochrome sales.
If at any time Xstrata Alloys notifies Glencore that it is able to find purchasers for its production at prices higher than those generally obtainable by Glencore, Xstrata Alloys may, unless Glencore is able to obtain similar prices, sell its products in the market. Glencore is nevertheless entitled to an agency fee of 3.5% of FOB sales revenue in respect of such sales. Glencore is also entitled to receive a US$50,000 monthly fee in connection with market analysis and certain administrative tasks it performs for Xstrata Alloys.
Ferrochrome sold into the US and Canada is distributed by Glencore Ltd and Glencore Canada Inc respectively, under two distribution agreements. These agreements continue indefinitely, with both parties having the right to terminate the agreement at 12 months’ notice. The percentage of distribution fees payable by the Group in respect of ferrochrome sold under the distribution agreement is substantially the same as the commission paid in respect of ferrochrome sold under the marketing agreement.
Mitsui & Co. Ltd is the appointed distributing agent for ferrochrome sales into China, Japan and South Korea up to a maximum of 105,000 tonnes per annum. A change in distributing agent for sales into these countries must be done with the consent of Glencore.
Vanadium In December 1997, the Group, entered into a 20-year marketing agreement with Glencore in respect of Rhovan’s and Vantech’s (closed in 2004) entire production of vanadium other than vanadium sold into the US and Canada.
Glencore is obliged to use its best endeavours to arrange sales of vanadium pentoxide and ferrovanadium to customers at prevailing market rates subject to initial agreement and approval by Xstrata Alloys prior to affecting the sale. Xstrata Alloys is obliged to pay to Glencore an agency fee of 3.5% on FOB sales revenues and an additional fee of 1.5% on FOB sales revenues for assuming the risk of non-payment by customers on this material. Glencore assumes 100% of the risk of non-payment by customers in relation to vanadium sales.
If at any time Xstrata Alloys notifies Glencore that it is able to find purchasers for its production at prices higher than those generally obtainable by Glencore, Xstrata Alloys may, unless Glencore is able to obtain similar prices, sell its products in the market. Glencore is nevertheless entitled to the 3.5% agency fees described above in respect of such sales.
Vanadium pentoxide and ferrovanadium sold into the US and Canada is distributed by Glencore Ltd and Glencore Canada Inc respectively, under two distribution agreements. The distribution agreements have the same term as the marketing agreement and consequently, the percentage of distribution fees payable by the Group in respect of vanadium pentoxide and ferrovanadium is substantially the same as the commission paid in respect of vanadium pentoxide and ferrovanadium sold under the marketing agreement.

Xstrata plc Annual Report 2008 187
Coal In 2002, the Group entered into a 20-year market advisory agreement with Glencore with fee reviews at the end of every fifth year of the agreement. Pursuant to this agreement, Glencore acts as the Group’s market advisor with respect to its export production of coal (other than for Xstrata Coal’s share of production from the Cerrejón thermal coal operation in Colombia). The fee payable to Glencore is US$0.50 per attributable tonne of coal exported by the Group from Australia or South Africa. The first five-year fee review has not yet been finalised and both parties are currently operating under the original terms of the agreement. In January 1995, Cumnock entered into a sales and marketing agreement with Glencore, for a commission of US$0.75 per tonne for all coal sold by Cumnock. Pursuant to this agreement, Glencore provides sales and marketing services to Cumnock and Cumnock appoints Glencore as its agent to market coal. On 7 May 2008, Cumnock gave six months’ notice that it wished to terminate this agreement. Cumnock export tonnes now fall within the MAA for the remainder of the coal Group.
In 2008, the Group entered into market standard forward commodity price derivatives for 1,965,000 tonnes (2007: 60,000 tonnes) with Glencore as counterparty. During the year ended 31 December 2008, 105,000 tonnes at an average FOB price of US$64.59 per tonne were delivered (2007: nil). At 31 December 2008, 1,920,000 tonnes (2007: 60,000 tonnes) were contracted with Glencore for delivery in 2009. These derivatives are on arm’s-length terms and conditions and are included within derivative financial assets and liabilities (refer to notes 23, 30 and 37).
During the year ended 31 December 2008, 142,414 tonnes were borrowed from Glencore (2007: 256,733 tonnes) and 342,620 tonnes were transferred back to Glencore (2007: 281,328 tonnes) with nil tonnes owed to Glencore at 31 December 2008 (2007: 200,206 tonnes) on arm’s length terms and conditions.
In 2006, the Group entered into a three-year fuel supply agreement with Glencore to supply diesel fuels to coal mines in New South Wales and Queensland. Under this supply agreement, US$116 million (2007: US$69 million) worth of fuel was delivered during the year ended 31 December 2008. The supply agreement is on arm’s-length terms and prices change monthly according to the world market price per barrel (US$/BBL). The contract expires March 2009 and Xstrata Coal is in current negotiations with Glencore to determine if the contract will be renegotiated or put forward for tender.
In 2005, Cerrejón entered into a five-year fuel supply agreement which expires in February 2010 with Glencore to supply diesel fuels. The Group’s share of the fuel purchases for the year ended 31 December 2008 was US$92 million (2007: US$48 million). The supply agreement is on arm’s-length terms and prices change for each shipment according to the world market price per barrel (US$/BBL).
All coal purchases and sales with Glencore are on arm’s-length terms and conditions.
Zinc On 1 January 2007, Xstrata Zinc renewed a service agreement for a period of three years with Glencore (the Xstrata Zinc Service Agreement), under the terms of which Glencore provides advice and assistance with respect to pricing and structural issues regarding hedging and the optimisation of internal flows of raw materials. The fees to be paid by Asturiana under the Asturiana Service Agreement are US$2 million per annum.
Xstrata Zinc entered into an ‘evergreen’ agreement with Glencore in 2004 to purchase 380,000 dmt (2007: 380,000 dmt) per annum of zinc concentrate. Treatment charges in respect of such purchases are negotiated annually on arm’s-length terms and conditions. This agreement has been terminated in 2008.
In 2008, Xstrata Zinc (San Juan de Nieva and Nordenham) agreed to supply Glencore with 210,000 tonnes (2007: 217,500 tonnes) of SHG zinc slabs or CGG ingots based on market FOB/CPT prices plus the respective market premium.
In 2008, Xstrata Zinc (McArthur River) supplied Glencore with 281,600 wmt of zinc concentrate and has an agreement to supply this amount each year until 31 December 2009, after which it will become ‘evergreen’ in nature. Treatment charges are negotiated annually on arm’s-length terms and conditions.
In 2008, Xstrata Zinc (Mount Isa) had three agreements with Glencore for the supply of zinc concentrate. Two agreements have an initial term until 31 December 2008 after which they will become ‘evergreen’ in nature. The first agreement is to supply 90,000 wmt per annum. The second agreement is to supply 80,000 wmt to 100,000 wmt per annum for the purpose of swapping Mount Isa concentrate in exchange for the same volume to be delivered to Xstrata’s European smelters at equivalent terms. Treatment charges are negotiated annually on arm’s-length terms and conditions. A third agreement was established to supply an additional 30,000 wmt in 2008 only for the purpose of swapping Mount Isa concentrate in exchange for the same volume to be delivered to Xstrata’s European smelters at equivalent terms. Further to the aforementioned three agreements, an additional 64,000 wmt have been sold to Glencore on a spot basis at terms ruling in the market.
Xstrata Zinc Canada has agreements to supply Glencore with 12,510 tonnes of SHG zinc slabs. In addition to this, Xstrata Zinc Canada has agreements to supply Glencore with 14,000 tonnes of SHG zinc slabs and Jumbos. All agreements are based on market delivery duty paid plus the respective market premium during 2008. During 2008, there have been spot sales of SHG and HG zinc slabs, and Jumbos for 28,635 tonnes (2007: 12,159 tonnes).
Xstrata Zinc has a frame contract to sell Glencore surplus Brunswick lead concentrate amounting 14,000 wmt for 2008. Xstrata Zinc Canada has also sold to Glencore on a spot basis 200,000 wmt of zinc concentrates of its various sources at terms prevailing in the market.
All purchase and sales transactions with Glencore are on arm’s-length terms and conditions.
Copper Xstrata Copper has entered into a service agreement with Glencore for a three-year period effective from 1 January 2007 and ‘evergreen’ thereafter with a 12-month cancellation notice for the supply of advice, support and assistance with regard to its marketing and hedging activities.

Notes to the Financial Statements continued
Xstrata plc Annual Report 2008 188
36. Related Parties continued
Xstrata Copper North Queensland has entered into a sales agreement with Glencore in respect of the total available export allocation of copper cathode. The sales terms for the copper cathode are the LME price plus a range of premiums based on Codelco North Asian CIF Liner Terms plus applicable freight parity by destination. This agreement was terminated effective 31 December 2008.
Copper cathode sales agreements were entered into between Xstrata Copper Canada/Xstrata Copper North Chile/Xstrata Commodities Middle East and Glencore for the period 1 January to 31 December 2008. All sales are based on either spot or benchmark terms in accordance with prevailing market conditions.
Xstrata Copper (Minera Alumbrera Limited) has entered into a five-year frame contract with Glencore on an ‘evergreen’ basis. The sales terms for the copper concentrate are negotiated annually on arm’s-length terms and conditions. Minera Alumbrera Limited on occasion sells concentrate to Glencore at prevailing spot market prices.
Copper concentrate purchase and sales agreements were entered into between Xstrata Copper Canada and Glencore for the period 1 January to 31 December 2008, at prevailing market terms.
Copper concentrate purchase agreements were entered into between Xstrata Copper North Chile and Glencore for a four-year frame contract commencing 1 January 2007. All purchases are based on benchmark terms in accordance with prevailing market conditions.
Copper concentrate sales agreements were entered into between Xstrata Copper Tintaya and Glencore for the period 1 January to 31 December 2008. All sales are based on either spot or benchmark terms in accordance with prevailing market conditions.
Sales agreements were also entered into between Xstrata Commodities Middle East and Glencore on copper concentrates, for a three-year frame contract starting 1 January 2007 based on either spot or benchmark terms in accordance with prevailing market conditions.
Xstrata Copper North Queensland has entered into a sales agreement with Glencore for copper concentrate for a three-year period effective from 1 June 2008 and ‘evergreen’ thereafter. The sales terms for the copper concentrate are based on market prices less agreed metal content deductions, treatment and refining charges. The treatment and refining charges comprise both an annual benchmark and spot component.
All sales transactions with Glencore are on arm’s-length terms and conditions.
Nickel In 2004, Xstrata Nickel entered into two agreements with Glencore for the treatment of approximately 2,000 tonnes per annum of white alloy raw material feed to the Nikkelverk refinery in Norway and the Sudbury smelter in Canada. The contracts include both a metal purchase and a metal return component. The term of the contracts is to the end of 2009, continuing indefinitely thereafter unless terminated by either party with six months’ notice given not earlier than 1 July 2009. Treatment and refining charges to Glencore are subject to price participation adjustments based on prevailing market prices.
Xstrata Nickel has a purchase agreement with Glencore for a one-time delivery in early 2009 of approximately 200 wmt of nickel cobalt mixed sulphide feed to the Nikkelverk refinery. Pricing terms are based on prevailing market rates.
In March 2007, Xstrata Nickel entered into sole distributorship agreements with Glencore, for its nickel, cobalt and ferronickel production. These agreements continue until 31 December 2012 and are automatically renewed for successive three-year periods unless terminated by either party with not less than 12 months’ notice prior to the end of the original term or any renewal terms, or unless Xstrata Nickel permanently ceases production of these metals. Xstrata Nickel, at its sole discretion, may cease, suspend or reduce production at any time. Glencore is obliged to distribute the products with all due care and diligence and shall cultivate and maintain good relations with purchasers and potential purchasers in accordance with sound commercial principles and taking into account Xstrata Nickel’s business principles. All sales terms and conditions are set on an arm’s-length basis. For nickel and cobalt sales, the price basis is the month following the month of delivery. For ferronickel sales, the price basis is the quotational period provided for in customer contracts. Accordingly, provisionally priced nickel, cobalt and ferronickel revenues are subject to final price adjustments due to future price changes. During 2008, Xstrata Nickel sold to Glencore 89,567 tonnes of nickel (2007: 71,150 tonnes), 3,137 tonnes of cobalt (2007: 2,708 tonnes) and 19,847 tonnes of ferronickel (2007: 24,212 tonnes). Included in 2007 was a one-off sale of approximately 5,300 tonnes of nickel, 400 tonnes of cobalt and 1,300 tonnes of ferronickel to Glencore at the inception of the agreement, resulting in a contribution to revenue of US$354 million. In addition, Glencore prepays monthly to Xstrata Nickel in two equal instalments 100% of the value of the month’s planned production. The prepayment balance as at 31 December 2008 amounted to US$54 million (2007: US$166 million).
Technology In 2006, Xstrata Technology was contracted to install a copper ISASMELT furnace, a lead ISASMELT furnace and an IsaProcess copper refinery at Kazzinc, a Glencore subsidiary for US$99 million. The project commenced in May 2006 and is due to be commissioned by December 2009. This transaction with Kazzinc is on arm’s-length terms and conditions.
Associates Platinum The Group acquired 24.9% of Lonmin PLC shares on 6 Oct 2008 and equity accounts this investment as an associate. During 2008, a net impairment of US$34 million was taken on this investment directly to the income statement.
Coal Xstrata Coal has a number of investments in export coal terminals allowing it to export coal into overseas markets.
Xstrata Coal South Africa holds a 20.9% (2007: 20.9%) interest in Richards Bay Coal Terminal Company Ltd (RBCT), a company that operates the coal terminal in Richards Bay, South Africa. Xstrata Coal South Africa reimburses RBCT for its share of operating and capital expenditure.
Xstrata Coal Australia has a 35.6% (2007: 35.6%) interest in Port Kembla Coal Terminal Limited and a 31% (2007: 31%) interest in Newcastle Coal Shippers Pty Limited. Xstrata Coal Australia reimburses these coal terminals for its share of coal loading and handling charges.

Xstrata plc Annual Report 2008 189
Zinc The Group has a 25% economic and voting interest in the Noranda Income Fund (NIF), which owns a zinc refinery in Salaberry-de-Valleyfield, Quebec. The Group’s interest in the NIF are held as ordinary units of the partnership, which are subordinate to the priority units in respect of cash distributions in any month until 3 May 2017. In addition, the Group has entered into a supply and processing agreement that continues until 2 May 2017 and is obligated to sell to the NIF up to 550,000 tonnes of zinc concentrate per year. The NIF pays the Group a concentrate price, based on the price of zinc metal on the London Metal Exchange, for the payable zinc metal contained in the concentrate less a processing fee of US$0.35205 per pound (2007: US$0.3446 per pound) of such payable zinc metal at 31 December 2008.
Joint venture entities Coal Xstrata Coal has a 33 1/3% interest in the Cerrejón thermal coal operation in Colombia. All purchase terms and conditions are set on an arm’s-length basis.
Copper Xstrata Copper has a 44% interest in the Collahuasi joint venture in Chile. The Collahuasi joint venture has fixed term contracts for the sale of copper concentrate to Xstrata Copper for 160,000 dmt per year expiring in 2009 and for 120,000 dmt per year expiring in 2014. The treatment and refining charges are based on benchmark terms in accordance with the prevailing market.
Xstrata Copper has a 33.75% interest in the Antamina joint venture in Peru. The Antamina joint venture has fixed term contracts for the sale of copper concentrate to Xstrata Copper for 170,000 dmt per year expiring in 2013. The treatment and refining charges are based on benchmark terms in accordance with the prevailing market.
All other purchases between the joint venture entities and the Group are set on an arm’s-length basis based on either spot or benchmark terms in accordance with prevailing market conditions.
Remuneration of key management personnel of the Group US$m 2008 2007
Wages and salaries* 10 24Pension and other post-retirement benefit costs* 7 6Share-based compensation plans** (48) 68 (31) 98
* Includes amounts paid to directors disclosed in the Directors’ Remuneration Report on pages 104 to 107. ** Amounts are based on the income statement expense/(credit) for the year calculated in accordance with IFRS 2.
37. Financial Instruments
Principles of risk management The main risks arising from the Group’s financial instruments are credit risk, interest rate risk, liquidity risk, foreign currency risk and commodity price risk. These risks arise from exposures that occur in the normal course of business and are managed by the Treasury Committee, which operates as a sub-committee of the Executive Committee. The responsibilities of the Treasury Committee include the recommendation of policies to manage financial instrument risks. These recommendations are reviewed and approved by the Board of Directors and implemented by the Group’s Treasury Department.
The overall objective of the Treasury Committee is to effectively manage credit risk, liquidity risk and other market risks in accordance with the Group’s strategy. Other responsibilities of the Treasury Committee include management of the Group’s cash resources and debt funding programmes, approval of counterparties and relevant transaction limits and the monitoring of all significant treasury activities undertaken by the Group. The Group uses both conventional financial instruments and derivative financial instruments to manage these risks.
The Group’s Treasury Department prepares monthly treasury reports which monitor all significant treasury activities undertaken by Group companies. The report also benchmarks significant treasury activities and monitors key banking loan covenants to ensure continued compliance. The Treasury Committee and Executive Committee reviews these reports to monitor the financial instrument risks of the Group and to ensure compliance with established Group policies and procedures.
The Group’s significant financial instruments, other than derivatives, comprise bank loans and overdrafts, convertible borrowings, capital market notes, finance leases, hire purchase contracts, cash and short-term deposits. The main purpose of these financial instruments is to finance the Group’s acquisitions and ongoing operations. The Group has various other financial assets and liabilities such as trade receivables and trade payables, which arise directly from its operations.
Derivative transactions are entered into solely to hedge risks and hedge accounting under IAS 39 is only applied when certain criteria have been met. Market fluctuations in derivative financial instruments designated as hedges are used to offset the fluctuations in the underlying exposure. The Group does not hold derivatives for trading or speculative purposes. The Group’s accounting policies in relation to derivatives are set out in note 6.
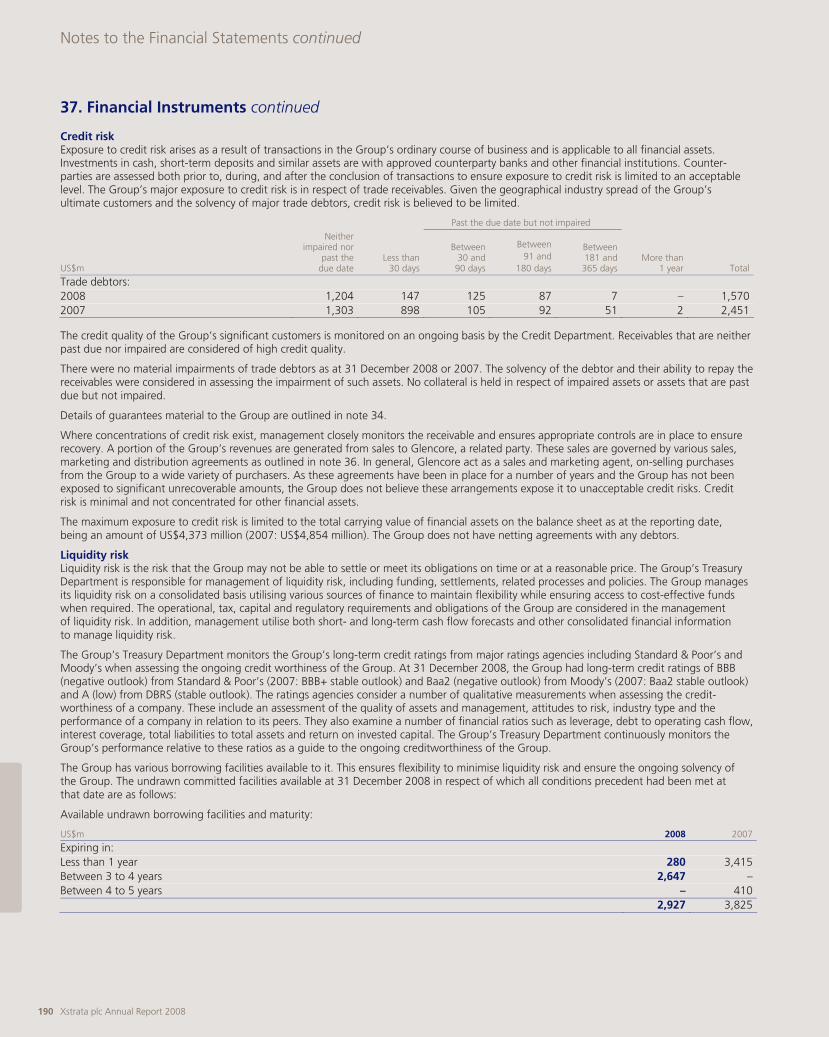
Notes to the Financial Statements continued
Xstrata plc Annual Report 2008 190
37. Financial Instruments continued
Credit risk Exposure to credit risk arises as a result of transactions in the Group’s ordinary course of business and is applicable to all financial assets. Investments in cash, short-term deposits and similar assets are with approved counterparty banks and other financial institutions. Counter-parties are assessed both prior to, during, and after the conclusion of transactions to ensure exposure to credit risk is limited to an acceptable level. The Group’s major exposure to credit risk is in respect of trade receivables. Given the geographical industry spread of the Group’s ultimate customers and the solvency of major trade debtors, credit risk is believed to be limited.
Past the due date but not impaired
US$m
Neitherimpaired nor
past thedue date
Less than30 days
Between30 and
90 days
Between 91 and
180 days
Between 181 and 365 days
More than1 year Total
Trade debtors: 2008 1,204 147 125 87 7 – 1,5702007 1,303 898 105 92 51 2 2,451
The credit quality of the Group’s significant customers is monitored on an ongoing basis by the Credit Department. Receivables that are neither past due nor impaired are considered of high credit quality.
There were no material impairments of trade debtors as at 31 December 2008 or 2007. The solvency of the debtor and their ability to repay the receivables were considered in assessing the impairment of such assets. No collateral is held in respect of impaired assets or assets that are past due but not impaired.
Details of guarantees material to the Group are outlined in note 34.
Where concentrations of credit risk exist, management closely monitors the receivable and ensures appropriate controls are in place to ensure recovery. A portion of the Group’s revenues are generated from sales to Glencore, a related party. These sales are governed by various sales, marketing and distribution agreements as outlined in note 36. In general, Glencore act as a sales and marketing agent, on-selling purchases from the Group to a wide variety of purchasers. As these agreements have been in place for a number of years and the Group has not been exposed to significant unrecoverable amounts, the Group does not believe these arrangements expose it to unacceptable credit risks. Credit risk is minimal and not concentrated for other financial assets.
The maximum exposure to credit risk is limited to the total carrying value of financial assets on the balance sheet as at the reporting date, being an amount of US$4,373 million (2007: US$4,854 million). The Group does not have netting agreements with any debtors.
Liquidity risk Liquidity risk is the risk that the Group may not be able to settle or meet its obligations on time or at a reasonable price. The Group’s Treasury Department is responsible for management of liquidity risk, including funding, settlements, related processes and policies. The Group manages its liquidity risk on a consolidated basis utilising various sources of finance to maintain flexibility while ensuring access to cost-effective funds when required. The operational, tax, capital and regulatory requirements and obligations of the Group are considered in the management of liquidity risk. In addition, management utilise both short- and long-term cash flow forecasts and other consolidated financial information to manage liquidity risk.
The Group’s Treasury Department monitors the Group’s long-term credit ratings from major ratings agencies including Standard & Poor’s and Moody’s when assessing the ongoing credit worthiness of the Group. At 31 December 2008, the Group had long-term credit ratings of BBB (negative outlook) from Standard & Poor’s (2007: BBB+ stable outlook) and Baa2 (negative outlook) from Moody’s (2007: Baa2 stable outlook) and A (low) from DBRS (stable outlook). The ratings agencies consider a number of qualitative measurements when assessing the credit-worthiness of a company. These include an assessment of the quality of assets and management, attitudes to risk, industry type and the performance of a company in relation to its peers. They also examine a number of financial ratios such as leverage, debt to operating cash flow, interest coverage, total liabilities to total assets and return on invested capital. The Group’s Treasury Department continuously monitors the Group’s performance relative to these ratios as a guide to the ongoing creditworthiness of the Group.
The Group has various borrowing facilities available to it. This ensures flexibility to minimise liquidity risk and ensure the ongoing solvency of the Group. The undrawn committed facilities available at 31 December 2008 in respect of which all conditions precedent had been met at that date are as follows:
Available undrawn borrowing facilities and maturity:
US$m 2008 2007
Expiring in: Less than 1 year 280 3,415Between 3 to 4 years 2,647 –Between 4 to 5 years – 410 2,927 3,825

Xstrata plc Annual Report 2008 191
The following tables show the Group’s contractually agreed undiscounted forecast cash flows from interest payments and the repayments of financial liabilities, including derivative financial liabilities.
US$m Due within
1 yearDue between
1-2 yearsDue between
2-3 yearsDue between
3-4 yearsDue between
4-5 years Due after
5 years Total
At 31 December 2008 Non-derivative financial liabilities: Interest-bearing loans and borrowings 794 69 4,169 6,747 4 5,679 17,462Convertible borrowings – – – – – 331 331Interest payments on loans and borrowings 975 946 928 493 334 2,098 5,774Other non-interest-bearing liabilities 3,233 – – – – 712 3,945 Derivative financial liabilities: Derivatives contracts – net payments 202 – 213 24 – 332 771
US$m Due within
1 yearDue between
1-2 yearsDue between
2-3 yearsDue between
3-4 yearsDue between
4-5 years Due after
5 years Total
At 31 December 2007 Non-derivative financial liabilities: Interest-bearing loans and borrowings 1,118 781 68 1,378 5,701 3,750 12,796Convertible borrowings – – – – – 375 375Interest payments on loans and borrowings 644 569 498 458 319 2,219 4,707Other non-interest-bearing liabilities 3,745 – – – – 54 3,799 Derivative financial liabilities: Derivatives contracts – net payments 205 58 – 142 6 – 411
All instruments held at 31 December 2008 and 31 December 2007 and for which payments were already contractually agreed are included. Amounts in foreign currency are each translated at the closing rate at the reporting date. The variable interest payments arising from the financial instruments were calculated using interest rates as at reporting date. Financial liabilities that can be repaid at any time are always assigned to the earliest possible time period. Future forecast transactions or transactions subsequent to year end are not included.
Market risk analysis IFRS 7 requires sensitivity analyses that show the effects of hypothetical changes of relevant market risk variables on the Group’s profit and shareholders’ equity. The periodic effects are determined by relating the hypothetical changes in the risk variables to the balance of financial instruments at the reporting date. The Group’s primary market exposures are to interest rate risk, foreign currency risk and commodity price risk.
Interest rate risk The Group is exposed to interest rate risk primarily as a result of exposures to movements in the LIBOR. It is the Group’s preference to borrow and invest at floating rates of interest, notwithstanding that some borrowings are at fixed rates. In addition, a limited amount of fixed rate hedging may be undertaken during periods where the Group’s exposure to movements in short-term interest rates is more significant. In keeping with the Group’s preference to borrow at floating rates of interest, the following interest rate swap contracts were outstanding at 31 December 2008 and 2007:
US$m
Principal amount
2008
Average rate %
2008
Fair value
2008
Principal amount
2007
Average rate %
2007
Fair value2007
At fair value: Interest rate swap from US$ fixed rates: Maturing in less than 1 year* – – – 111 8.09 4Maturing between 1 to 2 years* – – – – – –Maturing between 2 to 3 years* 2,224 2.80 147 – – –Maturing between 3 to 4 years* 925 3.04 85 1,050 5.17 29Maturing between 4 to 5 years* – – – 925 5.60 32Maturing greater than 5 years* 4,099 3.66 495 2,175 5.64 37Interest rate swap to US$ fixed rates: – – – – – –Maturing in less than 1 year – – – 25 5.00 –Maturing between 1 to 2 years – – – – – –Maturing between 2 to 3 years 100 4.54 (8) – – –Maturing between 4 to 5 years – – – 100 4.54 (6)Maturing greater than 5 years – – – – – – 7,348 3.33 719 4,386 5.55 96
* Relates to the Unsecured notes and Senior debentures (refer to note 28).
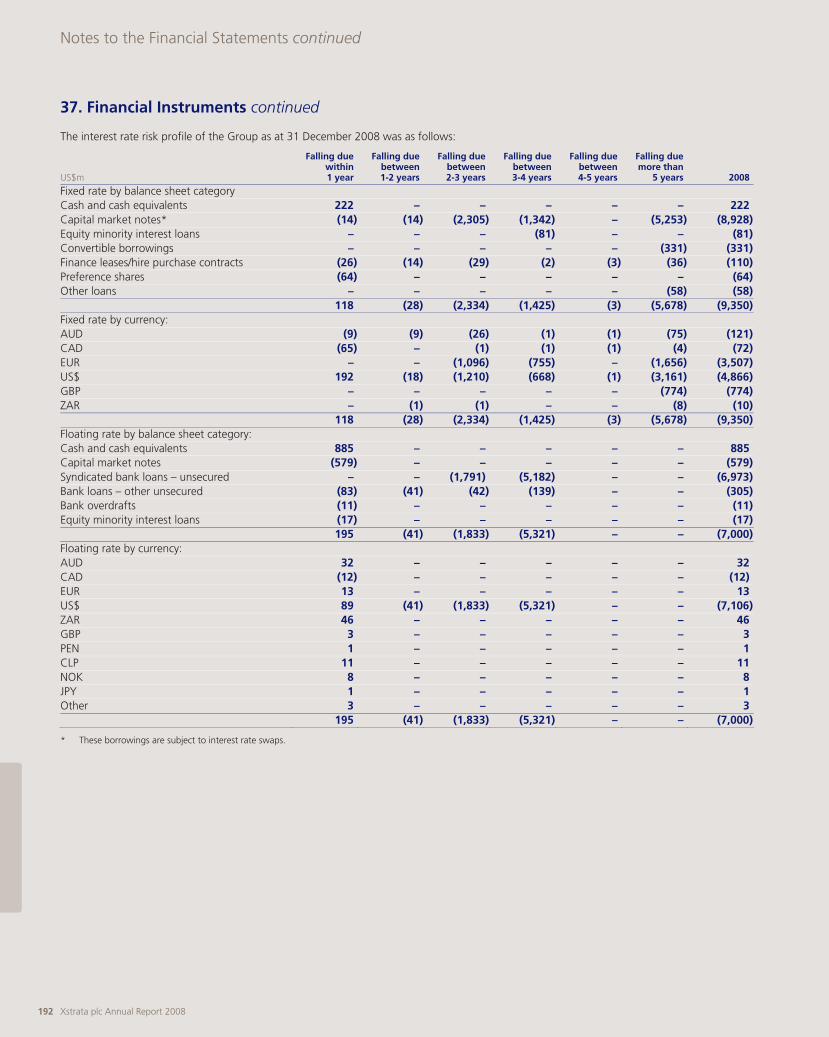
Notes to the Financial Statements continued
Xstrata plc Annual Report 2008 192
37. Financial Instruments continued
The interest rate risk profile of the Group as at 31 December 2008 was as follows:
US$m
Falling due within 1 year
Falling due between 1-2 years
Falling due between 2-3 years
Falling due between 3-4 years
Falling due between 4-5 years
Falling due more than
5 years 2008
Fixed rate by balance sheet category Cash and cash equivalents 222 – – – – – 222Capital market notes* (14) (14) (2,305) (1,342) – (5,253) (8,928)Equity minority interest loans – – – (81) – – (81)Convertible borrowings – – – – – (331) (331)Finance leases/hire purchase contracts (26) (14) (29) (2) (3) (36) (110)Preference shares (64) – – – – – (64)Other loans – – – – – (58) (58) 118 (28) (2,334) (1,425) (3) (5,678) (9,350)Fixed rate by currency: AUD (9) (9) (26) (1) (1) (75) (121)CAD (65) – (1) (1) (1) (4) (72)EUR – – (1,096) (755) – (1,656) (3,507)US$ 192 (18) (1,210) (668) (1) (3,161) (4,866)GBP – – – – – (774) (774)ZAR – (1) (1) – – (8) (10) 118 (28) (2,334) (1,425) (3) (5,678) (9,350)Floating rate by balance sheet category: Cash and cash equivalents 885 – – – – – 885Capital market notes (579) – – – – – (579)Syndicated bank loans – unsecured – – (1,791) (5,182) – – (6,973)Bank loans – other unsecured (83) (41) (42) (139) – – (305)Bank overdrafts (11) – – – – – (11)Equity minority interest loans (17) – – – – – (17) 195 (41) (1,833) (5,321) – – (7,000)Floating rate by currency: AUD 32 – – – – – 32CAD (12) – – – – – (12)EUR 13 – – – – – 13US$ 89 (41) (1,833) (5,321) – – (7,106)ZAR 46 – – – – – 46GBP 3 – – – – – 3PEN 1 – – – – – 1CLP 11 – – – – – 11NOK 8 – – – – – 8JPY 1 – – – – – 1Other 3 – – – – – 3 195 (41) (1,833) (5,321) – – (7,000)
* These borrowings are subject to interest rate swaps.
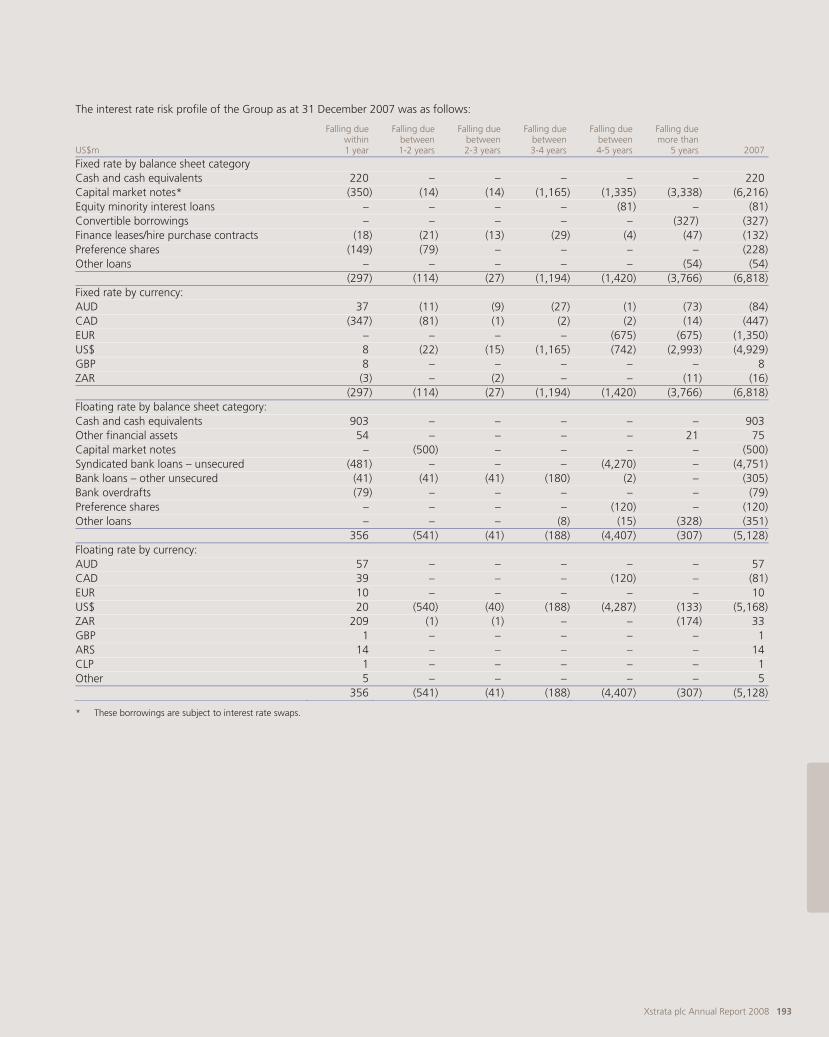
Xstrata plc Annual Report 2008 193
The interest rate risk profile of the Group as at 31 December 2007 was as follows:
US$m
Falling due within 1 year
Falling due between 1-2 years
Falling due between 2-3 years
Falling due between 3-4 years
Falling due between 4-5 years
Falling due more than
5 years 2007
Fixed rate by balance sheet category Cash and cash equivalents 220 – – – – – 220Capital market notes* (350) (14) (14) (1,165) (1,335) (3,338) (6,216)Equity minority interest loans – – – – (81) – (81)Convertible borrowings – – – – – (327) (327)Finance leases/hire purchase contracts (18) (21) (13) (29) (4) (47) (132)Preference shares (149) (79) – – – – (228)Other loans – – – – – (54) (54) (297) (114) (27) (1,194) (1,420) (3,766) (6,818)Fixed rate by currency: AUD 37 (11) (9) (27) (1) (73) (84)CAD (347) (81) (1) (2) (2) (14) (447)EUR – – – – (675) (675) (1,350)US$ 8 (22) (15) (1,165) (742) (2,993) (4,929)GBP 8 – – – – – 8 ZAR (3) – (2) – – (11) (16) (297) (114) (27) (1,194) (1,420) (3,766) (6,818)Floating rate by balance sheet category: Cash and cash equivalents 903 – – – – – 903Other financial assets 54 – – – – 21 75Capital market notes – (500) – – – – (500)Syndicated bank loans – unsecured (481) – – – (4,270) – (4,751)Bank loans – other unsecured (41) (41) (41) (180) (2) – (305)Bank overdrafts (79) – – – – – (79)Preference shares – – – – (120) – (120)Other loans – – – (8) (15) (328) (351) 356 (541) (41) (188) (4,407) (307) (5,128)Floating rate by currency: AUD 57 – – – – – 57 CAD 39 – – – (120) – (81)EUR 10 – – – – – 10 US$ 20 (540) (40) (188) (4,287) (133) (5,168)ZAR 209 (1) (1) – – (174) 33GBP 1 – – – – – 1 ARS 14 – – – – – 14 CLP 1 – – – – – 1 Other 5 – – – – – 5 356 (541) (41) (188) (4,407) (307) (5,128)
* These borrowings are subject to interest rate swaps.

Notes to the Financial Statements continued
Xstrata plc Annual Report 2008 194
37. Financial Instruments continued
The interest charged on floating rate financial liabilities is based on the relevant national inter-bank rates and repriced at least annually. Interest on financial instruments classified as fixed rate is fixed until maturity of the instrument. The other financial instruments of the Group that are not included in the above tables are non-interest-bearing and are therefore not subject to interest rate risk.
IFRS 7 requires interest rate sensitivity analysis that shows the effects of changes in market interest rates on the income statement and, if appropriate, shareholders’ equity. The interest rate sensitivity analyses are based on the following assumptions:
> For non-derivative financial instruments with fixed interest rate terms, a change in market interest rates only affects income if these are measured at their fair value. Consequently, all non-derivative financial instruments with fixed interest rate terms that are carried at amortised cost are excluded from this analysis (with the exception of those subject to a fixed to floating rate swap – refer below);
> Items subject to an effective fixed to floating interest rate swap hedge are assumed to be floating instruments for the purpose of this analysis;
> For floating rate instruments, income statement impacts assume adjustments to interest income and expense for a 12-month period;
> The Group does not have significant cash flow hedges related to interest rate risk. As such, movements that would occur in equity as a result of a hypothetical change in interest rates at reporting date have been excluded from this analysis;
> Changes in the carrying value of derivative financial instruments designated as fair value hedges are assumed to be fully effective with no impact on the income statement or equity;
> Changes in the carrying value of derivative financial instruments not in hedging relationships are assumed to impact the income statement;
> The Group does not have material exposure to interest rate risk from available-for-sale financial instruments. As such, these financial instruments have been excluded from this analysis;
> The balance of interest-bearing financial instruments at reporting date is representative of the balance for the year as a whole and hypothetical interest rate movements are deemed to apply for the entire reporting period; and
> The impact of interest rate movements on the carrying value of pension obligations has been excluded.
If the market interest rates had been 100 basis points higher (lower) at 31 December 2008 income would have been US$140 million (2007: US$71 million) lower (higher). There would be no material effect on equity reserves other than those relating directly to movements in the income statement.
Foreign currency risk Owing to the Group’s significant operations in Australia, North America, South America, South Africa and Europe, the balance sheet and results can be affected significantly by movements in exchange rates. The long-term relationship between commodity prices and the currencies of most of the countries where the Group operates provides a degree of natural protection, however, in the short term it can be quite volatile. The presentation currency of the Group is the US$.
Foreign currency hedges Group subsidiaries located in Australia and Canada have entered into AUD/US$ and CAD/US$ exchange contracts to hedge a portion of their US$ denominated revenue and third-party loans. The Group also enters into forward contracts to hedge specific one-off foreign currency transactions. The open foreign currency exchange contracts as at 31 December 2008 are as follows:
Classified as cash flow hedges:**
US$m
Contract amount
2008
Average forward
rate2008
Fairvalue2008
Contract amount
2007
Average forward
rate2007
Fairvalue2007
Forward contracts – sell US$/buy AUD: Maturing in less than 1 year 123 0.7351 (2) 125 0.8544 1 123 0.7351 (2) 125 0.8544 1Forward contracts – sell US$/buy EUR: Maturing between 2 to 3 years 1,174 1.5650 (126) – – –Maturing between 3 to 4 years 675 1.3500 24 – – –Maturing between 4 to 5 years* – – – 675 1.35 56Maturing after 5 years* 2,599 1.6578 (333) 675 1.35 56 4,448 1.5866 (435) 1,350 1.35 112Forward contracts – sell US$/buy JPY: Maturing in less than 1 year – – – 2 103.85 – – – – 2 103.85 –
* Relates to the Unsecured notes (refer to note 28). ** The timing of hedged cash flows is expected to coincide with the maturities of the hedging instruments to which they relate.
An Australian subsidiary has designated its US$ denominated capital market notes as a fair value hedge of an investment in a US$ denominated South American operation (refer to note 28). The hedge is being used to reduce exposure to foreign currency risk.

Xstrata plc Annual Report 2008 195
Classified as other derivatives:
US$m
Contract amount
2008
Average forward
rate2008
Fairvalue2008
Contract amount
2007
Average forward
rate2007
Fairvalue2007
Forward contracts – sell US$/buy AUD: Maturing in less than 1 year – – – 931 0.8664 15 – – – 931 0.8664 15Forward contracts – sell CAD/buy US$: Maturing in less than 1 year – – – 18 0.983 –Maturing between 2 to 3 years 300 1.5350 (79) – – –Maturing between 3 to 4 years – – – 300 1.535 (142) 300 1.5350 (79) 318 1.504 (142)Forward contracts – sell US$/buy CAD: Maturing in less than 1 year 1,291 1.0387 (113) 1,330 1.0452 65Maturing between 1 to 2 years – – – – – – 1,291 1.0387 (113) 1,330 1.0452 65Forward contracts – sell US$/buy EUR: Maturing in less than 1 year – – – 12 1.3429 1 – – – 12 1.3429 1Forward contracts – sell US$/buy ZAR: Maturing in less than 1 year 116 10.50 8 – – –Maturing between 1 to 2 years 11 10.80 – – – – 127 10.53 8 – – –
For the purpose of IFRS 7 sensitivity analysis currency risks arises because financial instruments are denominated in a currency that is not the functional currency of the subsidiary or joint venture. The movements shown below largely result from trade payables and receivables that are not denominated in the local entity’s functional currency. Trade payable and receivables generally arise as a result of the operations of the Group in the ordinary course of business.
The currency sensitivity analysis is based on the following assumptions:
> Differences resulting from the translation of financial statements of subsidiaries or joint ventures into the Group’s presentation currency, US dollar, are not taken into consideration;
> The major currency exposures for the Group relate to the US dollar and local currencies of subsidiaries and joint ventures. Foreign currency exposures between two currencies where one is not the US dollar are deemed insignificant to the Group and have therefore been excluded from the sensitivity analysis;
> Derivative financial instruments designated as cash flow hedges are assumed to be fully effective hedges and therefore any movements in carrying value are captured within equity and have no impact on the income statement analysis;
> Changes in the carrying value of derivative financial instruments designated as fair value hedges are assumed to be fully effective with no impact on the income statement or equity;
> Changes in the carrying value of derivative financial instruments not in hedging relationships are assumed to impact the income statement; and
> The impact of foreign currency movements on the carrying value of pension obligations has been excluded.
In accordance with IFRS 7, the impact of foreign currencies has been determined based on the balances of financial assets and liabilities at 31 December 2008. This sensitivity does not represent the income statement impact that would be expected from a movement in foreign currency exchange rates over the course of a period of time.
If the US dollar had gained (lost) 5% against all currencies significant to the Group the impact would have been:
Functional currency
Closing exchange rate
2008
Effect on net earnings
of a 5% change 2008
Effect on equity of a 5% change
2008
Closing exchange rate
2007
Effect on net earnings
of a 5% change 2007
Effect on equity of a 5% change
2007
Argentinean peso 3.4538 (3) – 3.1500 (2) –Australian dollar 0.7048 (25) 6 0.8751 (15) 5Canadian dollar 1.2205 22 – 0.9984 (32) –Chilean peso 637.25 (3) – 497.95 10 –Colombian peso 2,248.70 – – 2,018.00 1 –Euro 1.3974 6 – 1.4590 – –Peruvian neuvo 3.1345 1 – 2.9980 – –South African rand 9.3212 (45) – 6.8626 9 –Total (47) 6 (29) 5

Notes to the Financial Statements continued
Xstrata plc Annual Report 2008 196
37. Financial Instruments continued
Commodity price risk The Group is exposed to fluctuations in commodity prices, with the commodity mix spread between those which are priced by reference to prevailing market prices on terminal markets and those that are set on a contract basis with customers, generally on an annual basis. Commodity price risks arise in all major commodities that the Group produces. Commodity price risk is managed by maintaining a diversified portfolio of commodities and typically does not involve large-scale strategic hedging or price management initiatives.
Due to the volatile nature of commodity prices and the historical relationship between prices and the currencies of most of the countries where the Group operates, hedging may be entered into only in limited circumstances and subject to strict limits laid down by the Board of Directors.
Commodity hedging The Australian and Americas operations have gold forwards and collars to hedge prices of future sales. The Australian and South African operations have entered into coal forwards to hedge prices of future sales of coal. The open forwards and collars commodity contracts as at 31 December 2008 are as follows:
Classified as cash flow hedges:
Ounces
2008
Average price US$2008
FairvalueUS$m2008
Ounces 2007
Average price US$2007
Fairvalue
US$m2007
Cash flow hedges: Gold forwards – AUD denominated contracts: Maturing in less than 1 year 76,600 743.53 (27) 61,700 740.12 (13)Maturing between 1 to 2 years – – – 87,800 747.47 (22) 76,600 743.53 (27) 149,500 744.44 (35)Gold collars – US$ denominated contracts: Maturing in less than 1 year 125,000 495-640 (32) 94,500 475-594 (24)Maturing between 1 to 2 years – – – 150,000 495-640 (36) 125,000 495-640 (32) 244,500 475-640 (60)
Tonnes2008
Averageprice US$2008
FairvalueUS$m2008
Tonnes 2007
Averageprice US$2007
Fairvalue
US$m2007
Coal forwards – US$ denominated contracts: FOB Maturing in less than 1 year 2,200,000 74.62 (6) 4,040,000 58.30 (128) 2,200,000 74.62 (6) 4,040,000 58.30 (128)CIF Maturing in less than 1 year – – – 600,000 68.72 (27) – – – 600,000 68.72 (27)
The maturities of these hedges reflect the expected timing of cash flows related to these instruments.

Xstrata plc Annual Report 2008 197
Classified as other Commodity Derivatives:
Tonnes 2008
Average price US$
2008
Fair value US$m 2008
Tonnes 2007
Average price US$
2007
Fair value US$m 2007
Copper forwards – US$ denominated contracts: Maturing in less than 1 year 21,775 3,397.31 8 4,914 6,671.28 3 21,775 3,397.31 8 4,914 6,671.28 3
Ounces 2008
Average price US$
2008
Fair value US$m 2008
Ounces 2007
Average price US$
2007
Fair value US$m 2007
Gold forwards – AUD denominated contracts: Maturing in less than 1 year 11,200 774.42 (3) 22,500 721.00 (5) 11,200 774.42 (3) 22,500 721.00 (5)Gold options – US$ denominated contracts: Maturing in less than 1 year 25,000 495-640 (6) 31,500 475-594 (8) 25,000 495-640 (6) 31,500 475-594 (8)
Ounces 2008
Average price US$
2008
Fair value US$m 2008
Ounces 2007
Average price US$
2007
Fair value US$m 2007
Gold swaps – AUD denominated contracts: Maturing in less than 1 year 10,600 1.5 – 40,600 1.5 –Maturing between 1 to 2 years – – – 10,600 1.5 – 10,600 1.5 – 51,200 1.5 –
The IFRS 7 sensitivity analysis below has been prepared using the following assumptions:
> This analysis only takes into account commodities for which the Group has significant exposure;
> Fixed price sale and purchases contracts will not fluctuate with movements in commodity prices and are therefore excluded from this analysis;
> Derivative financial instruments designated as cash flow hedges are assumed to be fully effective hedges and therefore any movements in carrying value are captured within equity and have no impact on the income statement analysis;
> Changes in the carrying value of derivative financial instruments designated as fair value hedges are assumed to be fully effective with no impact on the income statement or equity; and
> Changes in the carrying value of derivative financial instruments not in hedging relationships are assumed to impact the income statement.
In accordance with IFRS 7, the impact of commodity prices has been determined based on the balances of financial assets and liabilities at 31 December 2008. This sensitivity does not represent the income statement impact that would be expected from a movement in commodity prices over the course of a period of time.
If prices for all commodities for which the Group has significant exposure had been 10% higher (lower) at 31 December 2008, income would have been US$89 million higher (lower) (2007: US$105 million higher (lower)) and equity reserves would have been US$26 million lower (higher) (2007: US$77 million lower (higher)) as a result of changes to reserves for commodity cash flow hedges. There would be no other material changes in reserves of the Group as at 31 December 2008 or 2007 other than those relating directly to income statement movements.

Notes to the Financial Statements continued
Xstrata plc Annual Report 2008 198
37. Financial Instruments continued
Fair values Set out below is a comparison by category of carrying value and fair values of the Group’s financial instruments that are not carried at fair value in the financial statements at 31 December:
US$m
Carryingvalue2008
Fair value 2008
Carryingvalue2007
Fairvalue2007
Financial liabilities: Capital market notes 9,426 9,439 6,216 6,001Convertible borrowings 331 327 327 305Equity minority interest loans 98 99 81 83Finance leases 110 110 132 132Preference shares 64 64 348 348Other loans 63 63 54 54
Market rates at 31 December 2008 have been used to determine the fair value of fixed interest loans. The fair value of the liability portion of the convertible bonds are estimated using an equivalent market interest rate of a similar liability that does not have a conversion option as at the origination of the bond (refer to note 28).
The following table shows the carrying amounts as at 31 December for each category of financial assets and liabilities as required by IFRS 7:
US$m 2008 2007
Financial assets: Cash and cash equivalents 1,156 1,148Financial assets designated at fair value through profit and loss 42 54Loans and receivables 2,211 3,150Available-for-sale financial assets 161 203Derivative financial assets 803 299 Financial liabilities: Financial liabilities measured at amortised cost 21,073 16,922Financial liabilities designated at fair value through profit and loss 334 –Derivative financial liabilities 771 411
The following table shows the gains/(losses) for each category of financial assets and liabilities as required by IFRS 7:
US$m 2008 2007
Financial assets: Available-for-sale financial assets gain/(loss) recognised in equity (114) 49Available-for-sale financial assets loss recognised in the income statement (1) –Derivative financial instruments loss recognised in equity (157) (261)Derivative financial instruments loss recognised in the income statement (321) (115)
Interest revenues and expenses are not included in the calculation of the gains/(losses) of financial assets and liabilities.
38. Events After Balance Sheet Date
Rights issue On 29 January 2009, the Company announced a proposed 2 for 1 rights issue to raise approximately US$5.9 billion. The proceeds of the rights issue will be used to repay existing debt, including debt facilities used to acquire Glencore International AG’s coal operations in Colombia for a total consideration of US$2 billion. The rights issue and acquisition were approved by shareholders at an EGM on 2 March 2009. No further information is presented on this acquisition due to the short time period between the acquisition and the approval of these financial statements.
Restructure of Sudbury nickel operations On 9 February 2009, the Group announced plans to restructure its Sudbury nickel operations in response to ongoing challenging market conditions. As a result of the restructuring, the Fraser Mine Complex will be placed on care and maintenance and associated support and administrative functions will be reorganised.

Statement of Directors’ Responsibilities in Relation to the Parent Company Financial Statements
Xstrata plc Annual Report 2008 199
The directors are responsible for preparing the Annual Report and the financial statements in accordance with applicable law and regulations.
Company law requires the directors to prepare financial statements for each financial year. Under that law the directors have elected to prepare the financial statements in accordance with United Kingdom Generally Accepted Accounting Practice (United Kingdom Accounting Standards and applicable law). The financial statements are required by law to give a true and fair view of the state of affairs of the Company and of the profit or loss of the Company for that period. In preparing those financial statements, the directors are required to:
> select suitable accounting policies and then apply them consistently;
> make judgements and estimates that are reasonable and prudent;
> state whether applicable UK Accounting Standards have been followed, subject to any material departures disclosed and explained in the financial statements; and
> prepare the financial statements on the going concern basis unless it is inappropriate to presume that the Company will continue in business.
The directors are responsible for keeping proper accounting records that disclose with reasonable accuracy at any time the financial position of the Company and enable them to ensure that the financial statements comply with the Companies Act 1985. They are also responsible for safeguarding the assets of the Company and hence for taking reasonable steps for the prevention and detection of fraud and other irregularities.
The directors are responsible for the maintenance and integrity of the corporate and financial information included on Xstrata’s website. Legislation in the UK governing the preparation and dissemination of financial statements may differ from legislation in other jurisdictions.

Independent Auditors’ Report to the Members of Xstrata plc
Xstrata plc Annual Report 2008 200
We have audited the parent company financial statements of Xstrata plc for the year ended 31 December 2008 which comprise the Balance Sheet and the related notes 1 to 10. These parent company financial statements have been prepared under the accounting policies set out therein. We have also audited the information in the Directors’ Remuneration Report that is described as having been audited.
We have reported separately on the Group financial statements of Xstrata plc for the year ended 31 December 2008.
This report is made solely to the Company’s members, as a body, in accordance with Section 235 of the Companies Act 1985. Our audit work has been undertaken so that we might state to the Company’s members those matters we are required to state to them in an auditors’ report and for no other purpose. To the fullest extent permitted by law, we do not accept or assume responsibility to anyone other than the Company and the Company’s members as a body, for our audit work, for this report, or for the opinions we have formed.
Respective responsibilities of directors and auditors The directors’ responsibilities for preparing the Annual Report, the Directors’ Remuneration Report and the parent company financial statements in accordance with applicable United Kingdom law and Accounting Standards (United Kingdom Generally Accepted Accounting Practice) are set out in the Statement of Directors’ Responsibilities.
Our responsibility is to audit the parent company financial statements and the part of the Directors’ Remuneration Report to be audited in accordance with relevant legal and regulatory requirements and International Standards on Auditing (UK and Ireland).
We report to you our opinion as to whether the parent company financial statements give a true and fair view and whether the parent company financial statements and the part of the Directors’ Remuneration Report to be audited have been properly prepared in accordance with the Companies Act 1985. We also report to you whether in our opinion the information given in the Directors’ Report is consistent with the parent company financial statements. The information given in the Directors’ Report includes that specific information presented in the Operating Review and Financial Review that is cross referred from the Directors’ Report.
In addition we report to you if, in our opinion, the Company has not kept proper accounting records, if we have not received all the information and explanations we require for our audit, or if information specified by law regarding directors’ remuneration and other transactions is not disclosed.
We read other information contained in the Annual Report and consider whether it is consistent with the audited parent company financial statements. The other information comprises only the Directors’ Report, the unaudited part of the Directors’ Remuneration Report, the Chairman’s Statement, the Operating and Financial Review and the Corporate Governance Statement. We consider the implications for our report if we become aware of any apparent misstatements or material inconsistencies with the parent company financial statements. Our responsibilities do not extend to any other information.
Basis of audit opinion We conducted our audit in accordance with International Standards on Auditing (UK and Ireland) issued by the Auditing Practices Board. An audit includes examination, on a test basis, of evidence relevant to the amounts and disclosures in the parent company financial statements and the part of the Directors’ Remuneration Report to be audited. It also includes an assessment of the significant estimates and judgements made by the directors in the preparation of the parent company financial statements, and of whether the accounting policies are appropriate to the Company’s circumstances, consistently applied and adequately disclosed.
We planned and performed our audit so as to obtain all the information and explanations which we considered necessary in order to provide us with sufficient evidence to give reasonable assurance that the parent company financial statements and the part of the Directors’ Remuneration Report to be audited are free from material misstatement, whether caused by fraud or other irregularity or error. In forming our opinion we also evaluated the overall adequacy of the presentation of information in the parent company financial statements and the part of the Directors’ Remuneration Report to be audited.
Opinion In our opinion:
> the parent company financial statements give a true and fair view, in accordance with United Kingdom Generally Accepted Accounting Practice, of the state of the Company’s affairs as at 31 December 2008;
> the parent company financial statements and the part of the Directors’ Remuneration Report to be audited have been properly prepared in accordance with the Companies Act 1985; and
> the information given in the Directors’ Report is consistent with the parent company financial statements.
Ernst & Young LLP Registered auditor London 2 March 2009
The maintenance and integrity of the Xstrata plc website is the responsibility of the directors; the work carried out by the auditors does not involve consideration of these matters and, accordingly, the auditors accept no responsibility for any changes that may have occurred to the financial statements since they were initially presented on the website.
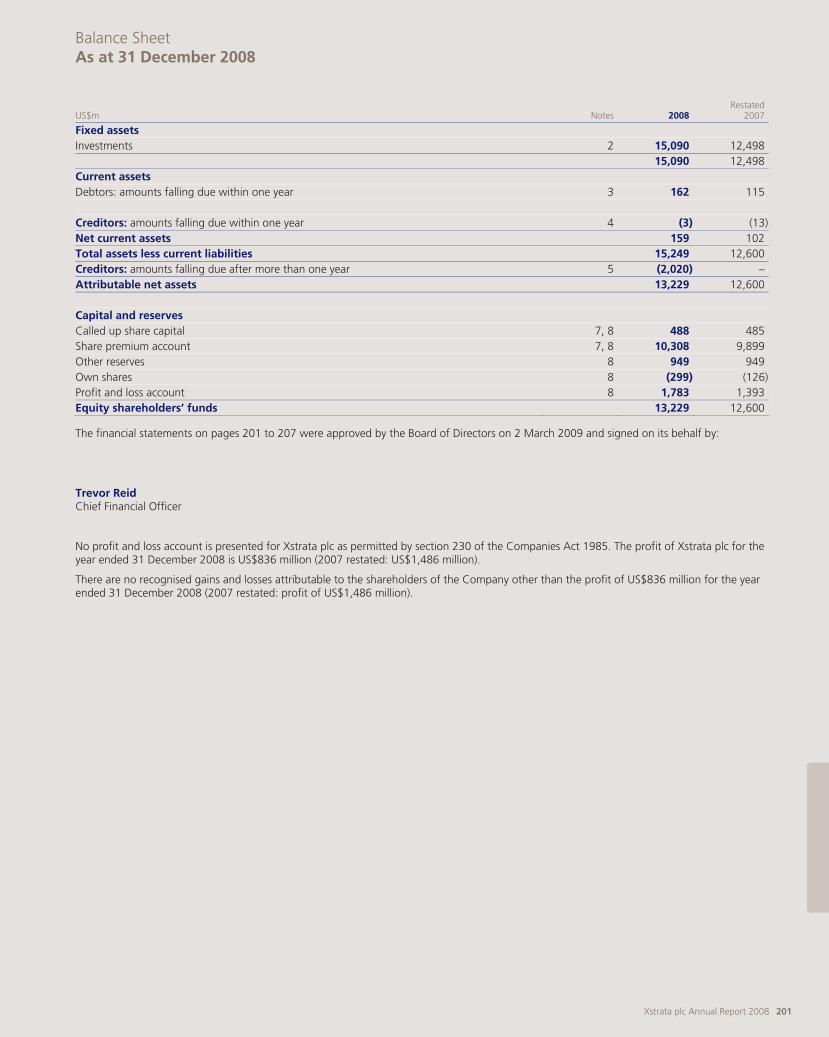
Balance Sheet As at 31 December 2008
Xstrata plc Annual Report 2008 201
US$m Notes 2008Restated
2007
Fixed assets Investments 2 15,090 12,498 15,090 12,498Current assets Debtors: amounts falling due within one year 3 162 115 Creditors: amounts falling due within one year 4 (3) (13)Net current assets 159 102Total assets less current liabilities 15,249 12,600Creditors: amounts falling due after more than one year 5 (2,020) –Attributable net assets 13,229 12,600 Capital and reserves Called up share capital 7, 8 488 485Share premium account 7, 8 10,308 9,899Other reserves 8 949 949Own shares 8 (299) (126)Profit and loss account 8 1,783 1,393Equity shareholders’ funds 13,229 12,600
The financial statements on pages 201 to 207 were approved by the Board of Directors on 2 March 2009 and signed on its behalf by:
Trevor Reid Chief Financial Officer
No profit and loss account is presented for Xstrata plc as permitted by section 230 of the Companies Act 1985. The profit of Xstrata plc for the year ended 31 December 2008 is US$836 million (2007 restated: US$1,486 million).
There are no recognised gains and losses attributable to the shareholders of the Company other than the profit of US$836 million for the year ended 31 December 2008 (2007 restated: profit of US$1,486 million).

Notes to the Financial Statements
Xstrata plc Annual Report 2008 202
1. Accounting policies
Basis of preparation These financial statements have been prepared in accordance with applicable UK accounting standards.
The accounting policies are consistent with the prior year except for the current year adoption of UITF Abstract 44 (IFRIC 11) ‘Group and Treasury Share Transactions’. The Company has granted share-based payments to employees of its subsidiaries and as a result of the adoption of the UITF it has allocated the share-based payment expenses to relevant Group companies. Comparative amounts have been restated.
The effect of this change in accounting policy has resulted in an increase in the share-based payment expense in the current year of US$65 million (2007: US$53 million decrease), representing amounts allocated to Group companies. Consequently, Xstrata plc (the Company) has recorded an expense in relation to share-based payments of US$1 million (2007: restated US$13 million).
The Company’s accounting policy in respect of share-based payments is discussed in more detail below.
Xstrata plc (the Company) has adopted the following principal accounting policies:
Investments Equity investments in subsidiaries are carried at cost less any provision for impairments.
Financial assets Financial assets are classified as either financial assets at fair value through profit or loss, loans and receivables, held-to-maturity investments or available-for-sale financial assets, as appropriate. The Company determines the classification of its financial assets at initial recognition. When financial assets are recognised initially, they are measured at fair value on the trade date, plus, in the case of investments not at fair value through profit or loss, directly attributable transaction costs.
Loans and receivables Loans and receivables are non-derivative financial assets with fixed or determinable payments that are not quoted in an active market, do not qualify as trading assets and have not been designated as either fair value through profit and loss or available for sale. Such assets are carried at amortised cost using the effective interest method. This cost is computed as the amount initially recognised minus principal repayments, plus or minus the cumulative amortisation using the effective interest method of any difference between the initially recognised amount and the maturity amount.
Gains and losses are recognised in the profit and loss account when the loans and receivables are derecognised or impaired, as well as through the amortisation process. Loans and receivables are derecognised when the Company no longer has a right to receive cash flows from the asset.
If there is objective evidence that an impairment loss on loans and receivables has been incurred, the amount of the loss is measured as the difference between the asset’s carrying amount and the present value of estimated future cash flows (excluding future credit losses that have not been incurred) discounted at the financial asset’s original effective interest rate (i.e. the effective interest rate computed at initial recognition). The carrying amount of the asset is reduced and the amount of the loss is recognised in the profit and loss account. If, in a subsequent period, the amount of the impairment loss decreases and the decrease can be related objectively to an event occurring after the impairment was recognised, the previously recognised impairment loss is reversed. Any subsequent reversal of an impairment loss is recognised in the profit and loss account, to the extent that the carrying value of the asset does not exceed its amortised cost (that would have been measured if there had been no impairment) at the reversal date.
Impairment The carrying values of fixed assets are reviewed for impairment if events or changes in circumstances indicate the carrying value may not be recoverable. If there are indicators of impairment, an exercise is undertaken to determine whether the carrying values are in excess of their recoverable amounts. Such review is undertaken on income-generating units.
If the carrying value of a fixed asset exceeds the recoverable amount, a provision is recorded to reflect the asset at the lower amount. In assessing the recoverable amounts of fixed assets, the relevant future cash flows expected to arise from the continuing use of and disposal of the assets have been discounted to their present value using a market-determined discount rate.
Provisions for liabilities Provisions are recognised when the Company has a present obligation, as a result of past events, and it is probable that an outflow of resources that can be reliably estimated will be required to settle the obligation.
Deferred taxation Deferred tax is recognised in respect of all timing differences that have originated but not reversed at the balance sheet date that will result in an obligation to pay more, or a right to pay less, tax in the future. In particular:
> provision is made for tax on gains arising from the disposal of fixed assets, only to the extent that, at the balance sheet date, there is a binding agreement to dispose of the assets concerned. However, no provision is made where, on the basis of all available evidence at the balance sheet date, it is more likely than not that the taxable gain will be rolled over into replacement assets and charged to tax only when the replacement assets are sold;
> provision is made for deferred tax that would arise on remittance of the retained earnings of overseas entities only to the extent that, at the balance sheet date, dividends have been accrued as receivable; and
> deferred tax assets are recognised only to the extent that, it is considered more likely than not that there will be suitable taxable profits from which the future reversal of the underlying timing differences can be deducted.

Xstrata plc Annual Report 2008 203
Deferred tax is measured on an undiscounted basis at the tax rates that are expected to apply in the periods in which timing differences reverse, based on tax rates and laws enacted or substantively enacted at the balance sheet date.
Own shares The cost of purchases of own shares held by the Employee Share Ownership Plan (ESOP) trust are deducted from equity. Where they are issued to employees or sold, no gain or loss is recognised in the profit and loss account. Any proceeds received on the disposal of the shares or on the transfer of shares to employees are recognised in equity.
Share-based payments The Company makes share-based awards, including free shares and options in the Company, to certain employees and directors of the Group. The expense recognised in the financial statements relates only to those share-based awards that are granted by the Company, to its employees and directors. Expenses relating to awards granted to employees and directors of other Group companies are allocated to those companies in accordance with UITF Abstract 44.
Equity-settled awards For equity-settled awards, the fair value is charged to the profit and loss account and credited to retained earnings, on a straight-line basis over the vesting period, after adjusting for the estimated number of awards that are expected to vest (taking into account the achievement of non-market-based performance conditions). The fair value of the equity-settled awards is determined at the date of the grant by external experts using the models outlined in note 35 of the Group consolidated financial statements.
At each balance sheet date prior to vesting, the cumulative expense representing the extent to which the vesting period has expired and management’s best estimate of the awards that are ultimately expected to vest is computed (after adjusting for non-market performance conditions). The movement in cumulative expense is recognised in the profit and loss account with a corresponding entry within equity.
Cash-settled awards For cash-settled awards, the fair value is recalculated at each balance date until the awards are settled based on the estimated number of awards that are expected to vest adjusting for market and non-market-based performance conditions. During the vesting period, a liability is recognised representing the portion of the vesting period which has expired at the balance sheet date times the fair value of the awards at that date. After vesting, the full fair value of the unsettled awards at each balance date is recognised as a liability. Movements in the liability are recognised in the profit and loss account. The fair value is recalculated using an option pricing model (refer to note 35 of the Group consolidated financial statements).
Refer to the accounting policies and note 35 of the Group consolidated financial statements for a full explanation of the valuation of and accounting for the share-based awards.
Loans from subsidiaries Loans from subsidiaries are recognised at inception at the fair value of the proceeds received net of issue costs. Subsequently, they are measured at amortised cost using the effective interest method. Finance costs are recognised in the profit and loss account using the effective interest rate method.
Foreign currency transactions Foreign currency transactions are booked in the functional currency (US$) at the exchange rate ruling on the date of the transaction. Foreign currency monetary assets and liabilities are translated into the functional currency at rates of exchange ruling at the balance sheet date. Exchange differences are recorded in the profit and loss account. Foreign currency non-monetary assets and liabilities are not restated at balance sheet date.
Revenue Interest income is recognised as earned on an accruals basis using the effective interest method.
Dividend income is recognised as earned when the Company’s right to receive payment is established.
Income for other services is recognised when the service has been rendered, when the amount of revenue (and associated costs) can be reliably measured and it is probable that economic benefits will flow to the Company.
Comparatives Where applicable, comparatives have been adjusted to disclose them on the same basis as current period figures, and have been adjusted for the adoption of UITF Abstract 44 (IFRIC 11) ‘Group and Treasury Share Transactions’.
Use of estimates The preparation of these financial statements is in conformity with generally accepted accounting practice and requires management to make estimates and assumptions that affect the reported amounts of assets and liabilities at the date of the financial statements and reported amounts of revenues and expenses during the reporting period. Actual outcomes could differ from these estimates.

Notes to the Financial Statements continued
Xstrata plc Annual Report 2008 204
2. Investments
US$m Investment in
subsidiaries Loans to
subsidiaries Total
Cost: At 1 January 2008 12,035 463 12,498Additions – existing investments 2,639 – 2,639Reductions – existing investments (39) (8) (47)At 31 December 2008 14,635 455 15,090
The subsidiary undertakings of the Company as at 31 December and the percentage holding of ordinary share capital are set out below:
Name Country of incorporation Principal activities
% of ordinaryshares held &voting rights
Principal subsidiaries Xstrata (Schweiz) AG Switzerland Holding company 100%Xstrata Finance (Dubai) LLC UAE Finance company 90%
Xstrata Commodities Middle East DMCC UAE Marketing company 90%
Xstrata Capital Corporation AVV* Aruba Finance company 40%Xstrata Zinc BV Holland Finance Company 75%
* The voting rights are 51%.
The principal country of operation is the country of incorporation, and all subsidiaries are unlisted. Refer to note 36 of the Group consolidated financial statements for a list of significant subsidiaries, associates and joint ventures.
3. Debtors – amounts falling due within one year
US$m 2008Restated
2007
Receivables – subsidiaries 161 112Other debtors 1 3 162 115
4. Creditors – amounts falling due within one year
US$m 2008 2007
Loans from subsidiaries – 7Other creditors 3 6 3 13
5. Creditors – amounts falling due after more than one year
US$m 2008 2007
Loans from subsidiaries 2,020 – 2,020 –
6. Dividends paid and proposed
US$m 2008 2007
Declared and paid during the year: Final dividend for 2007 – 34 cents per ordinary share (2006 – 30 cents per ordinary share) 327 290Interim dividend for 2008 – 18 cents per ordinary share (2007 – 16 cents per ordinary share) 172 153 499 443 Proposed for approval at the Annual General Meeting (not recognised as a liability as at 31 December): Final dividend for 2008 – nil cents per ordinary share (2007 – 34 cents per ordinary share) – 326

Xstrata plc Annual Report 2008 205
7. Capital
US$m
Authorised:
15,109,948,397 ordinary shares of US$0.50 each as at 1 January 2007 7,555
13,609,948,397 ordinary shares of US$0.50 each cancellation (6,805)
1,500,000,000 ordinary shares of US$0.50 each as at 31 December 2007 and at 31 December 2008 750
50,000 deferred shares of GBP1.00 each as at 31 December 2007 and at 31 December 2008 –
1 special voting share of US$0.50 as at 31 December 2007 and as at 31 December 2008 –
750
Issued, called up and fully paid:
943,150,383 ordinary shares of US$0.50 each as at 1 January 2007 471
4,000,000 ordinary shares issued on 31 January 2007 to the ESOP 2
24,516,537 ordinary shares issued on the exercise of convertible bonds to 31 December 2007 12
971,666,920 ordinary shares of US$0.50 each as at 31 December 2007 485
6,000,000 ordinary shares issued on 16 January 2008 to the ESOP 3
3,620 ordinary shares issued on the exercise of the convertible borrowings to 31 December 2008 –
977,670,540 ordinary shares of US$0.50 each as at 31 December 2008 488
Share premium:
As at 1 January 2007 9,522
4,000,000 ordinary shares issued on 31 January 2007 to the ESOP 183
24,516,537 ordinary shares issued on the exercise of convertible bonds to 31 December 2007 194
As at 31 December 2007 9,899
6,000,000 ordinary shares issued on 16 January 2008 to the ESOP 409
3,620 shares issued on the exercise of the convertible borrowings to 31 December 2008 –
As at 31 December 2008 10,308
Issue of ordinary shares On 31 January 2007, 4,000,000 shares were issued to the ESOP at a market price of GBP23.58 per share. On 16 January 2008, 6,000,000 shares were issued to the ESOP at a market price of GBP34.90 per share.
During 2007, the remainder of the US$600 million convertible bonds issued by Xstrata Capital Corporation AVV were converted at the option of the holders into 24,516,537 ordinary shares in Xstrata plc. As a result of this conversion, 100% of the bond has been now converted. During 2008, 0.03% of the US$375 million of convertible borrowings was converted at the option of the holders into 3,620 ordinary shares in Xstrata plc.
Details in respect of the various classes of shares are outlined in the Directors’ Report on pages 87 to 88.

Notes to the Financial Statements continued
Xstrata plc Annual Report 2008 206
8. Capital and reserves
US$m Share
capital
Sharepremium
account Other
reserves Own
shares
Profit and loss account 2008
Capital and reserves At 1 January 2008 485 9,899 949 (126) 1,393 12,600 Attributable profit for the year – – – – 836 836Issue of share capital 3 409 – (412) – –Own shares purchased – – – (17) – (17)Own shares sold – – – 256 (192) 64Equity-settled share-based payments – – – – 245 245Dividends – – – – (499) (499)At 31 December 2008 488 10,308 949 (299) 1,783 13,229
US$m Share
capital
Sharepremiumaccount
Other reserves
Own shares
Profit and loss account 2007
Capital and reserves At 1 January 2007 – restated 471 9,522 949 (147) 452 11,247Attributable profit for the year – – – – 1,486 1,486Issue of share capital 14 377 – (185) – 206Own shares purchased – – – (14) – (14)Own shares sold – – – 220 (164) 56Equity-settled share-based payments – – – – 62 62Dividends – – – – (443) (443)At 31 December 2007 – restated 485 9,899 949 (126) 1,393 12,600
Own shares Own shares comprise shares of Xstrata plc held in the ESOP.
The shares acquired by the ESOP are either stock market purchases or from share issues from the Company. The ESOP is used to coordinate the funding and manage the delivery of ordinary shares for options and free share awards under the Group’s employee award schemes. The trustee of the ESOP is permitted to place the shares back into the market and may hold up to 5% of the issued share capital of the Company at any one time. At 31 December 2008, 5,424,986 (2007: 3,846,691) shares, equivalent to 0.5% (2007: 0.4%) of the total issued share capital, were held by the trust with a cost of US$299 million (2007: US$126 million) and market value of US$51 million (2007: US$271 million). The trust has waived the right to receive dividends from the shares that it holds. Costs relating to the administration of the trust are expensed in the period in which they are incurred.
9. Other Income and Expenses
The audit fee is US$45,000 (2007 US$42,000) in respect of the Company. Refer to note 10 of the Group consolidated financial statements for further information of Auditors’ remuneration.
Refer to the Directors’ Remuneration Report on pages 104 to 107 for the remuneration of directors.
10. Guarantees
The Company has provided guarantees to a number of Group companies.
Specifically, the Company has provided:
To Xstrata Capital Corporation AVV in respect of the convertible bonds it has issued:
> unconditional and irrevocable guarantees to the holders of the convertible bond in respect of the payment of all amounts due and payable under the convertible bond. The amount due and payable under the convertible bonds at 31 December 2008 is US$391 million (2007 US$390 million); and
> guarantees to provide, in exchange for 374,900 (2007: 375,000) preference shares of Xstrata Capital Corporation AVV, ordinary share capital in the Company on the conversion of the bonds. The number of shares to be issued under these guarantees at 31 December 2008 totals 13,571,812 (2007: 13,575,432). These shares will be issued to the holder of the bonds in exchange for the preference shares in Xstrata Capital Corporation AVV they receive on conversion of the bonds.
Refer to note 29 of the Group consolidated financial statements for further details.

Xstrata plc Annual Report 2008 207
In November 2006, the Group issued US$2,250 million of capital market notes to refinance existing debt facilities. The notes are comprised of three tranches, a US$1,000 million 10-year facility at a fixed interest rate of 5.8%, a US$750 million five-year facility at a fixed interest rate of 5.5% and a US$500 million three-year facility that bears interest at a rate based on LIBOR plus 35 basis points. The fixed interest facilities were issued by Xstrata Finance (Canada) Limited and the floating rate facility was issued by Xstrata Finance (Dubai) Limited. The Xstrata Finance (Dubai) Limited issue was guaranteed by the Company, Xstrata (Schweiz) AG and Xstrata Finance (Canada) Limited. The Xstrata Finance (Canada) Limited issues were guaranteed by the Company, Xstrata (Schweiz) AG and Xstrata Finance (Dubai) Limited.
The Group assumed a number of senior debentures on the acquisition of Falconbridge Limited (refer to note 28 of the Group consolidated financial statements). Pursuant to the terms of the note indentures as amended by supplemental indentures, the Company has fully and unconditionally guaranteed in favour of the holders of the senior debentures the payment, within 15 days of when due, of all financial liabilities and obligations of Falconbridge Limited to such holders under the terms of the senior debentures.
The Group assumed preference shares on the acquisition of Falconbridge Limited (refer to note 28 of the Group consolidated financial statements). Pursuant to the terms of a guarantee indenture, the Company has fully and unconditionally guaranteed in favour of the holders of the preference shares the payment, within 15 days of when due, of all financial liabilities and obligations of Falconbridge Limited to such holders under the terms of the preference shares.
In June 2007, the Group completed the pricing of two EUR500 million note issues by Xstrata Finance (Canada) Limited under its Euro Medium Term Note Programme. These comprised 500,000,000 guaranteed 4.875% notes due 14 June 2012 and 500,000,000 guaranteed 5.250% notes due 13 June 2017. The notes are fully and unconditionally guaranteed on a senior, unsecured and joint and several basis by the Company, Xstrata (Schweiz) AG and Xstrata Finance (Dubai) Limited.
In July 2007, the Group entered into a US$4,680 million revolving Syndicated Loan. Interest is payable on the loans at a rate which is based on LIBOR and the relevant margin, which is 27.5 basis points per annum. US$2,160 million of the loan was entered into by Xstrata Finance (Canada) Limited and is guaranteed by the Company, Xstrata (Schweiz) AG and Xstrata Finance (Dubai) Limited. US$2,520 million of the loan was entered into by Xstrata (Schweiz) AG and is guaranteed by the Company, Xstrata Finance (Canada) Limited and Xstrata Finance (Dubai) Limited. In October 2007, the Group entered into a US$2,000 million 364-day revolving loan facility. Interest was payable on the loans at a rate which was the aggregate of LIBOR and the relevant margin, which was 27.5 basis points per annum. The loan was entered into by Xstrata (Schweiz) AG and was guaranteed by the Company, Xstrata Finance (Canada) Limited and Xstrata Finance (Dubai) Limited. This facility was refinanced during 2008.
In November 2007, Xstrata Finance (Canada) Limited completed a US$500 million 30-year bond issue bearing interest at 6.90% per annum. The bond is fully and unconditionally guaranteed on a senior, unsecured and joint and several basis by the Company, Xstrata (Schweiz) AG and Xstrata Finance (Dubai) Limited.
In December 2007, the Group entered into a guaranteed US$1,500 million 364-day revolving loan facility. Interest was payable on the loans at a rate which was the aggregate of LIBOR and the relevant margin, which was 27.5 basis points per annum. The loan was entered into by Xstrata (Schweiz) AG and was guaranteed by the Company, Xstrata Finance (Canada) Limited and Xstrata Finance (Dubai) Limited. This facility was refinanced during 2008.
On 25 February 2008, the Group entered into a guaranteed US$500 million revolving loan facility that matured on 31 December 2008. Interest was payable on the loans at LIBOR plus 50.0 basis points per annum. The loan was entered into by Xstrata (Schweiz) AG and was guaranteed by the Company, Xstrata Finance (Canada) Limited and Xstrata Finance (Dubai) Limited.
On 6 October 2008, the Group entered into US$5,000 million multi-currency revolving syndicated loan facility (Club Facility). Interest is payable on drawn down amounts at a rate which is the aggregate of LIBOR or, in relation to any loan in Euro, EURIBOR and the relevant margin, which is 150 basis points per annum. The Club Facility matures on 30 September 2011. As at 31 December 2008, US$2,452 million was available to be draw under this facility. The loan was entered into by Xstrata (Schweiz) AG, Xstrata Finance (Dubai) Limited and Xstrata Canada Financial Corporation and is guaranteed by the Company, Xstrata (Schweiz) AG, Xstrata Finance (Dubai) Limited, Xstrata Finance (Canada) Limited and Xstrata Canada Financial Corporation. The Club Facility was amended on 30 December 2008 to increase the facility amount to US$5,459 million.
In May 2008, the Group issued a two-tranche EUR1,350 million guaranteed bond offering, comprising EUR750 million 5.875% fixed guaranteed notes due 2011 and EUR600 million 6.25% fixed guaranteed notes due 2015. In May 2008, the Group issued a guaranteed bond offering of GBP500 million 7.375% fixed guaranteed notes due 2020. The notes were issued by Xstrata Canada Financial Corporation and were guaranteed by the Company, Xstrata (Schweiz) AG, Xstrata Finance (Dubai) Limited and Xstrata Finance (Canada) Limited.

Shareholder Information
208 Xstrata plc Annual Report 2008
Head OfficeBahnhofstrasse 2PO Box 1026301 ZugSwitzerlandTel: +41 41 726 6070Fax: +41 41 726 6089
Registered Office4th floor Panton House25/27 HaymarketLondon SW1Y 4ENUnited Kingdom
Registered Number4345939
Registrars and Transfer OfficeComputershare Investor Services plcPO Box 82The PavilionsBridgwater RoadBristol BS99 7NHTel: +44 (0) 870 707 1417Fax: +44 (0) 870 703 6101Telephone helpline: +44 (0) 870 707 1417
Shareholder calendar 2009Financial year-end 31 DecemberAnnual General Meeting 5 May 2009Half-Yearly Results 4 August 2009
Contacts
Xstrata plcBahnhofstrasse 2PO Box 1026301 ZugSwitzerlandTel: +41 41 726 6070Fax: +41 41 726 6089
EnquiriesClaire DivverTel: +44 20 7968 [email protected]
Pamela BellTel: +44 20 7968 [email protected]
Brigitte [email protected]+41 41 726 6071
www.xstrata.com

Xstrata is a global diversified mining group,listed on the London and Swiss StockExchanges, with its headquarters in Zug,Switzerland. Xstrata’s businesses maintaina meaningful position in seven majorinternational commodity markets: copper,coking coal, thermal coal, ferrochrome,nickel, vanadium and zinc, with a growingplatinum group metals business, additionalexposures to gold, cobalt, lead and silver,recycling facilities and a suite of globaltechnology products, many of which areindustry leaders. The Group’s operationsand projects span 19 countries.
For more information visitwww.xstrata.com
Design and production: Black Sun Plc, London, UK
This report has been printed on Heaven 42 paper. This paper is made from virgin wood fibre fromwell-managed forests independently certified according to the rules of the Forest Stewardship Council (FSC).
Printed at St Ives Westerham Press Ltd, ISO14001, FSC certified and CarbonNeutral®
SGS-COC-1732
Cover picture: Tintayacopper mine, southern Peru
The Business Review section of this report, comprising the Business,Strategy, Financial and Operating Reviews, has been prepared inaccordance with the Accounting Standards Board Reporting Statementon Operating and Financial Review (January 2006), as applicable bestpractice guidance for UK companies required to prepare a businessreview. The Chairman’s Statement, CEO’s Report and Business Reviewchapters, in particular the Strategy section, include an analysis ofthe main trends and factors likely to affect the future development,performance and position of the business. This includes statementsthat are, or may be deemed to be, ‘forward-looking statements’.We may also make written and oral forward-looking statements in:
> our interim reports, our summary financial statements to shareholders,our offering circulars and our prospectuses;
> our press releases and other written materials; and
> oral statements made by our officers, directors or employeesto third parties, including to financial analysts.
These forward-looking statements can be identified by the useof forward-looking terminology, including the words: ‘believes’,‘estimates’, ‘anticipates’, ‘expects’, ‘intends’, ‘plans’, ‘goal’, ‘target’,‘aim’, ‘may’, ‘will’, ‘would’, ‘could’ or ‘should’ or, in each case, theirnegative or other variations or comparable terminology and include allmatters that are not historical facts. They appear in a number of placesthroughout this Annual Report and include statements regarding ourintentions, beliefs or current expectations and those of our officers,directors and employees concerning, amongst other things, our resultsof operations, financial condition, liquidity, prospects, growth, strategiesand dividend policy and the industries in which we operate.
By their nature, forward-looking statements involve risks anduncertainties because they relate to events and depend on circumstancesthat may or may not occur in the future and may be beyond our abilityto control or predict. Forward-looking statements are not guarantees
of future performance. Our actual results of operations, financialcondition, liquidity, dividend policy and the development of theindustries in which we operate may differ materially from the impressioncreated by the forward-looking statements contained in this AnnualReport. Important factors that could cause these differences include, butare not limited to, general economic and business conditions, commodityprice volatility, industry trends, competition, changes in government andother regulation, including in relation to the environment, health andsafety and taxation, labour relations and work stoppages, changes inpolitical and economic stability, currency fluctuations, our ability tointegrate new businesses and recover our reserves or develop newreserves and changes in business strategy or development plans andother risks, including those described in the Business Review section ofthis Annual Report. Even if the results of operations, financial condition,liquidity and dividend policy and the development of the industries inwhich we operate are consistent with the forward-looking statementscontained in this Annual Report, those results or developments may notbe indicative of our results or developments in subsequent periods.
Forward-looking statements speak only as of the date they are made.Other than in accordance with our legal or regulatory obligations(including under the Listing Rules and the Disclosure and TransparencyRules), we do not undertake any obligation to update or revise publiclyany forward-looking statement, whether as a result of new information,future events or otherwise.
The Directors’ Report in this Annual Report has been prepared for themembers of the Company and its purpose is to assist shareholders toassess the Company’s strategies and the potential for those strategiesto succeed and for no other purpose. The Company, its directors,employees, agents and advisers do not accept or assume responsibilityfor any other purpose or to any other person to whom this AnnualReport is shown or into whose access it may come and any suchresponsibility or liability is expressly disclaimed.
Cautionary Note Regarding Forward-Looking Statements

Xstrata
AnnualReport2008
Annual Report 2008
Xstrata plcBahnhofstrasse 2PO Box 1026301 ZugSwitzerlandTel: +41 41 726 6070Fax: +41 41 726 6089
www.xstrata.com