Embed Size (px)
Citation preview
1
XPS protocol for the characterization of pristine and functionalized single wall carbon
nanotubes.
E. D. Sosa1,*, R. Allada1, C.B. Huffman2 and S. Arepalli1
1 ERC Inc., NASA Johnson Space Center, Houston, TX 77058
2 Department of Chemistry, Marshall University, Huntington, WV 25755
*corresponding author: [email protected]
Abstract:
Recent interest in developing new applications for carbon nanotubes (CNT) has fueled
the need to use accurate macroscopic and nanoscopic techniques to characterize and understand
their chemistry. X-ray photoelectron spectroscopy (XPS) has proved to be a useful analytical tool
for nanoscale surface characterization of materials including carbon nanotubes. Recent
nanotechnology research at NASA Johnson Space Center (NASA-JSC) helped to establish a
characterization protocol for quality assessment for single wall carbon nanotubes (SWCNTs).
Here, a review of some of the major factors of the XPS technique that can influence the quality
of analytical data, suggestions for methods to maximize the quality of data obtained by XPS, and
the development of a protocol for XPS characterization as a complementary technique for
analyzing the purity and surface characteristics of SWCNTs is presented. The XPS protocol is
then applied to a number of experiments including impurity analysis and the study of chemical
modifications for SWCNTs.
https://ntrs.nasa.gov/search.jsp?R=20090038728 2018-06-23T02:28:55+00:00Z
2
Introduction:
The unique properties of single-walled carbon nanotubes may enable the development of
materials with vastly improved properties for a variety of applications for human spaceflight [1-
3]. Often, these carbon nanotubes must be chemically modified in order to tailor them for
specific applications. Characterization of the raw and modified SWCNTs is the important first
step in monitoring the processes for purification as well as designing and developing new
materials. At present, the NASA-JSC protocol [4] provides one first step in SWCNT
characterization data and additional techniques are needed to supplement this information. X-ray
Photoelectron Spectroscopy (XPS) can provide information complementary to that generated by
the existing NASA-JSC protocol.
XPS has proved to be a useful analytical tool for monitoring the processing steps by
providing information on the relative amounts of different elements with respect to carbon and
their valence states. Since other analytical techniques cannot distinguish between the sp2 and sp3
carbons very well, XPS can be useful in the semi-quantitative analysis of carbon species in
SWCNT materials. However, because XPS is a primarily a surface sensitive technique, it is not
suitable for bulk analysis of materials. As a result, XPS has not been as widely used as other
techniques to characterize carbon nanotubes. XPS may however be used to monitor the
presence of other elemental species within the material or their influence on the carbon atoms.
In fact, many of the investigations on carbon nanotubes that utilize XPS have been focused on
chemical modifications of SWCNTs [5-7]. In some cases, XPS has been used to identify the
type of bonds that attach functional groups to SWCNTs [8]. It would therefore be helpful to
understand the advantages and limitations of XPS in order to successfully apply it toward the
characterization of SWCNTs.
3
1.1 General Description:
XPS is an analytical technique that can be used not only for elemental identification
within a sample but also for identifying the oxidation state of the element [9, 10]. It can be
used to investigate such areas as corrosion, oxidation, surface contamination and modification,
absorption and deposition of chemical species, catalysis and many other nanoscale surface
processes. The general principle of XPS is the measurement of the energy of inner-shell
electrons that have been emitted from atoms by a photo-ionization process. Because of its
sensitivity and its reliance on the photo-ionization effect, XPS requires ultra high vacuum
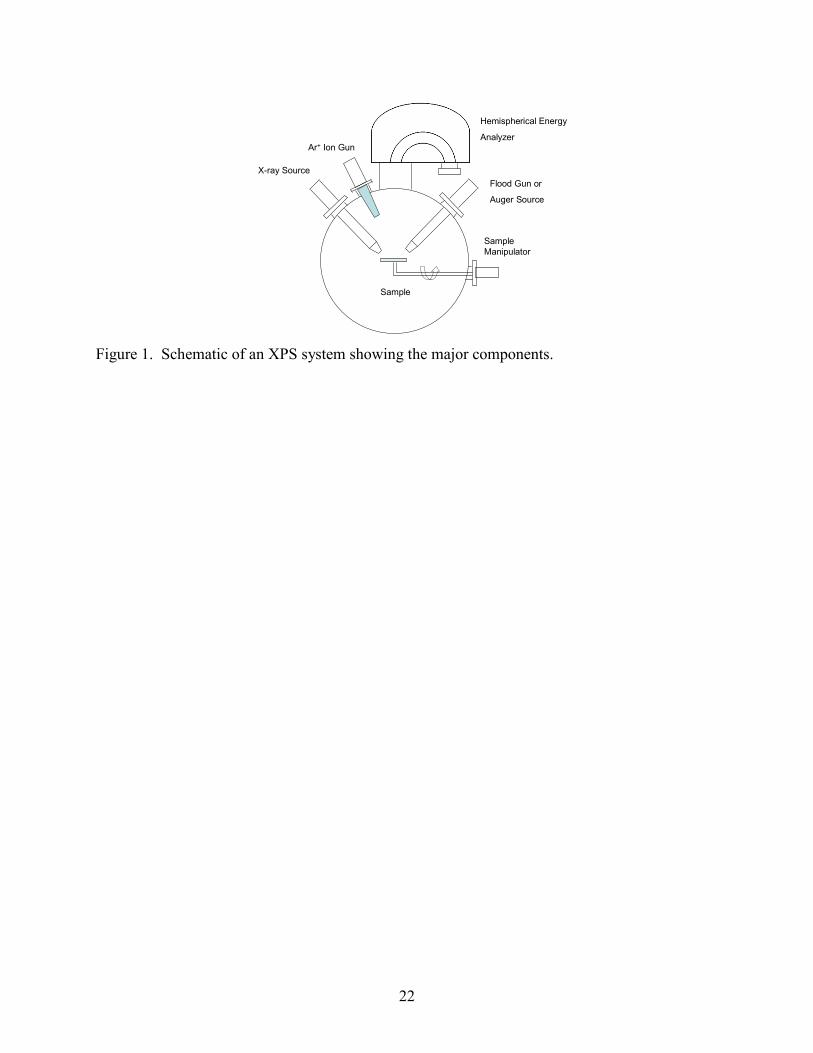
conditions. The major components of XPS are an ionization source and an energy analyzer,
although other components are generally implemented to provide additional capabilities. A
general schematic of an XPS system and its primary components is shown in figure 1.
1.1.1. Instrumental Components and Operating Principles:
XPS uses low energy x-ray photons to eject core-shell electrons from the atoms within a
solid and these electrons are subsequently characterized by their energies. The energy of the
emitted electron is characteristic of the atom from which it was emitted. The chemical
environment surrounding an atom can cause deviations in the energy of the emitted electron due
to changes in the binding energy of the emitted electrons. These deviations allow for chemical
state identification. In order to reliably interpret XPS data of carbon nanotubes, knowledge of
the influence of instrument components as well as operating conditions on XPS spectra is
beneficial.
1.1.2 Ionization Sources and Beam Sizes:
X-ray sources used in XPS can be single or dual ionization sources as well as
monochromatic depending on the system. Dual X-ray sources generally consist of an aluminum
4
and magnesium anode and are not monochromatic. The advantage of a dual X-ray source is that
it allows differentiation between Auger and photoelectron peaks in XPS spectra. In a multi-
element system, Auger signals may overlap or interfere with photoelectron peaks, resulting in the
misinterpretation of XPS spectra [10]. On the other hand, monochromatic X-ray sources can be
advantageous because they provide greater energy resolution along with reduced background
signal [10], since they provide a narrower line width and the elimination of satellites as well as
Bremstralung emissions from the X-ray source. This increased energy resolution can be
particularly favorable for evaluating carbon peak in SWCNTs, in particular, for differentiating
between the sp2 and sp3 hybridized carbon that can be present. Furthermore, greater energy
resolution is important for identifying the chemical states of elements associated with the
SWCNTs (i.e. functionalization). This is especially true if the binding energy difference
between the chemical species is on the order of the energy separation between the Kα,1 and Kα,2
component of the primary X-ray emission line. The use of a monochromatic source is
recommended for SWCNT characterization because of greater reliability in spectral
interpretation.
Regardless of the type of X-ray source, spatial resolution is limited due to the difficulty in
focusing the ionization beam to a small area. Modern advancements in X-ray optical lenses
allow the focusing of X-rays to beam sizes down to several microns, thus increasing the spatial
resolution. For systems not equipped with focusing lenses, the typical spot size of the X-ray
beam is on the order of 3-5mm2 depending on how close the X-ray source can be moved towards
the sample. The increased spatial resolution allows for better line scan and area profiling
analysis. For systems where the X-ray source cannot be focused to the micron scale, an
alternative approach is to lower the acceptance angle of the entrance aperture to the energy
5
analyzer, which essentially increases the spatial resolution by decreasing the analysis area [7,
11]. However, decreasing the acceptance angle will consequently reduce the signal intensity.
Although this technique is incapable of characterizing individual SWCNTs (because the
dimension of a single SWCNT is far below the capable spatial resolution of XPS) the spatial
resolution may be adequate for examining particle dispersion, pattern deposition or bulk
functionalization in materials. Auger spectroscopy should be considered when higher spatial
resolution is required.
1.1.3 Energy Analyzers and Pass Energy
Electron energy analyzers are used to measure the electrons that are photoemitted from
the surface upon X-ray bombardment. Energy analyzers are defined by their collection
efficiency and their energy resolution. The collection efficiency is a measure of the
photoelectrons detected to those emitted, while the energy resolution is the ability to distinguish
between electrons with closely separated energies. The energy resolution is defined as a constant
determined by the geometric configuration of analyzer and can further be related to the pass
energy as ∆E/E = constant, where E is the pass energy and ∆E is the energy resolution. The pass
energy controls which electrons reach the detector, by defining the kinetic energy which
electrons must possess in order to pass through the analyzer. Electrons within this range will
pass through the analyzer while all others will be deflected. Large pass energies are desirable for
weak signals so that the energy analyzer can accept more electrons thereby increasing the signal
intensity. Conversely, decreasing the pass energy effectively reduces the signal intensity, but
increases the resolution. Thus when detection of a chemical species is the major interest large
pass energies should be used so as to maximize the signal. On the other hand when identifying
the chemical state of analytes, smaller pass energies are suggested for increased reliability. In
6
SWCNT characterization the type of information desired determines the choice of pass energy.
For example, large pass energies would be recommended to monitor the degree of
functionalization so that small degrees of functionalization may be detected. For impurity
analysis or particle deposition, small pass energy should be used to correctly evaluate the
oxidation states of the moieties.
The two common types of energy analyzers that are used in XPS are the cylindrical
mirror analyzer (CMA) and the hemispherical energy analyzer (HEA). Both have a transmission
efficiency, which is inversely related to the kinetic energy of the emitted electrons and will
influence the signal intensities [9]. In addition, each element has an ionization cross section
which also contributes to the sensitivity of XPS to a particular element. This sensitivity factor is
important when using XPS for quantitative analysis. CMA has the advantage of better collection
efficiency because it can be positioned in closer proximity to the sample, while HEAs provide
better energy resolution but are located further from the sample, resulting in lower collection
efficiency. The advantage of the HEA in SWCNT characterization is the enhanced resolution,
which is better suited for resolving the different species of carbon. Although CMA has lower
energy resolution than the HEA, the resolution of the CMA can be increased by use of a double
pass configuration [9]. A CMA may be advantageous in situations where the species of interest
is in low concentration, thereby producing a weak signal.
1.1.4 Neutralizer and Sputter Guns
Surfaces of materials are inherently covered with contaminants, primarily oxygen and
nitrogen due to exposure to atmosphere, which may lead to miscalculated atomic percentages or
obstruction of spectral peaks if not removed or accounted for during analyses. These
contaminants can easily be removed through ion sputtering or annealing [12-16]. Sputtering is

7
accomplished by bombarding the surface with energetic (5-10 keV) argon ions. In addition to
contaminant removal, ion sputtering also provides the ability to do depth profiling and can be
used to assess any differences in chemical or elemental changes between surface and bulk [5,
17]. All XPS systems are equipped with an ion sputter gun for contaminant removal.
Some of the factors that should be considered with ion sputtering are etch rates, sputter
area, preferential sputtering, and ion implantation [10]. The etch rate depends on several factors
including the mass of the element, the bond strength, the beam current, the energy of the
sputtering ion (Ar) and the area over which the beam is rastered [18]. Since the rate is
dependent on atomic mass and bond strength, preferential sputtering can occur. This becomes
more significant for very short duration sputter times. Another consideration in ion sputtering is
that the minimum beam size is on the order of 1-2mm2. The sputtering area will possess some
curvature which can be more significant if the sample surface is not truly perpendicular to the ion
beam trajectory. This is important to consider when the beam size of the X-ray source is on the
order of the ion beam sputter area. Finally, sputtering ions can be implanted into the surface of
the material, thus contributing to the XPS signal. All of these factors should be accounted for
when calculating atomic percentages or in doing depth profiling.
With SWCNT characterization, thoughtful consideration into the effects of sputtering
should be addressed before performing the experiment, since species of interest may be removed,
producing inaccurate elemental evaluations. Sputtering, for example, could significantly
influence the determination of the degree of functionalization of the carbon atoms of SWCNTs.
A good rule of thumb is to always obtain spectra prior to any ion sputtering.
When electrons are removed from a solid surface, non-conductive samples can develop
an electron deficiency producing a positive charge build-up at the surface. Sample charging can
8
often be eliminated by an electron neutralizer gun [9, 19-21], which uses a beam of low energy
electrons to compensate the positive charge. The only requirement is that enough current is
supplied to the sample to balance the charge build up. Charge referencing [22, 23] is
recommended to ensure proper charging compensation. In charge referencing, a particular
element such as Au or adventitious carbon are used as the reference to determine the extent of
peak shifting associated with charging. For systems that are not equipped with a neutralizer gun,
a thin film of conductive material [24, 25] can be deposited on the surface, which provides a
pathway for electrons to the surface thus reducing the charging effect. When samples are coated
ex-situ, the coating is removed from the analysis area by ion sputtering. A neutralizer gun
should be used for SWCNT samples which are grown on nonconductive substrates, have
nonconductive impurities which are of interest, or whose processing has made them non-
conductive.
1.1.5 Sample Mounting and Sample Stages
The main criterion for samples being analyzed by XPS is that the sample should be
compatible with high vacuum conditions. They can be conductive or non-conductive but should
not decompose under irradiation. The sample holder limits sample size, while the focusing
distance limits the sample height. Samples can be mounted using a variety of methods such as
binding clips, adhesive tape or paint, or foils. Mounting clips may not be properly suited for all
SWCNT material, in particular powders or as-produced material. Carbon tape may be used but it
is not advisable when analyzing the carbon peak, not to mention the difficulty in differentiating
between the tape and the SWCNT material during imaging. Copper tape is preferable since the
SWCNTs are clearly imaged and no erroneous data stems from the carbon tape background. In
both cases, it is crucial to ensure that powder samples completely cover the surface of the area of
9
interest to avoid any extraneous signals due to adhesives from the tape. Indium foil can be used
for powder samples but some SWCNT materials do not readily embed themselves well into the
foil. Foils and clips are the recommended form of sample mounting when possible since there
will be no contribution to the carbon peak from any adhesive binders. For SWCNTs grown on
non-conductive substrates such as silicon dioxide or alumina, the sample can be secured with
adhesive tape and either sputter coated or silver paint can be applied along the edge of the
sample to provide electrical conductivity. Such coatings, which can also be used for charge
referencing, can then be removed by sputtering. Any of these mounting methods can be used so
long as adequate electrical contact to the surface is ensured.
Sample stages in XPS, depending upon their design, allow mounting of multiple or
individual samples. The sample stage is generally grounded but some stages allow placing a
potential on the sample. The stage is generally transferred onto a variable translator which
allows motion in all directions as well as rotation. This rotational ability allows angle resolved
spectroscopy, which increases the surface sensitivity of the technique. Angle resolved
spectroscopy is useful for assignments of carbon atoms associated with small functional groups.
Finally some stage systems can also be equipped with cooling and heating capability for in-situ
observation of surface changes with temperature. Such experiments are useful in SWCNT
characterization for functional group stability or impurity removal determination.
1.2 Sources of Error
As with all analytical techniques, there are several sources of error that can lead to
misinterpretation of XPS data. A brief discussion on the type of errors that can be encountered
in XPS, along with examples of how they can influence SWCNT characterization, is provided
below.
10
1.2.1 Surface Charging
Surface charging can have substantial effects on XPS spectra, such as broadening that
increases the noise level, and shifting of photoelectron peaks [9, 19, 26]. The degree of shifting
or broadening may not be the same for every element contained in the sample. This shifting and
broadening can result in the inappropriate labeling of spectral features, or even falsely indicate
peaks that appear to consist of species with more than one oxidation state. Although SWCNTs
are conductive, charging may occur in samples that are produced or deposited on non-conductive
substrates or whose surface modifications have reduced their electrical conductivity. Using an
electron neutralizer gun easily compensates such charging effects. If the system is not equipped
with a neutralizer gun, a thin film of gold can be deposited that can be etched away. This gold
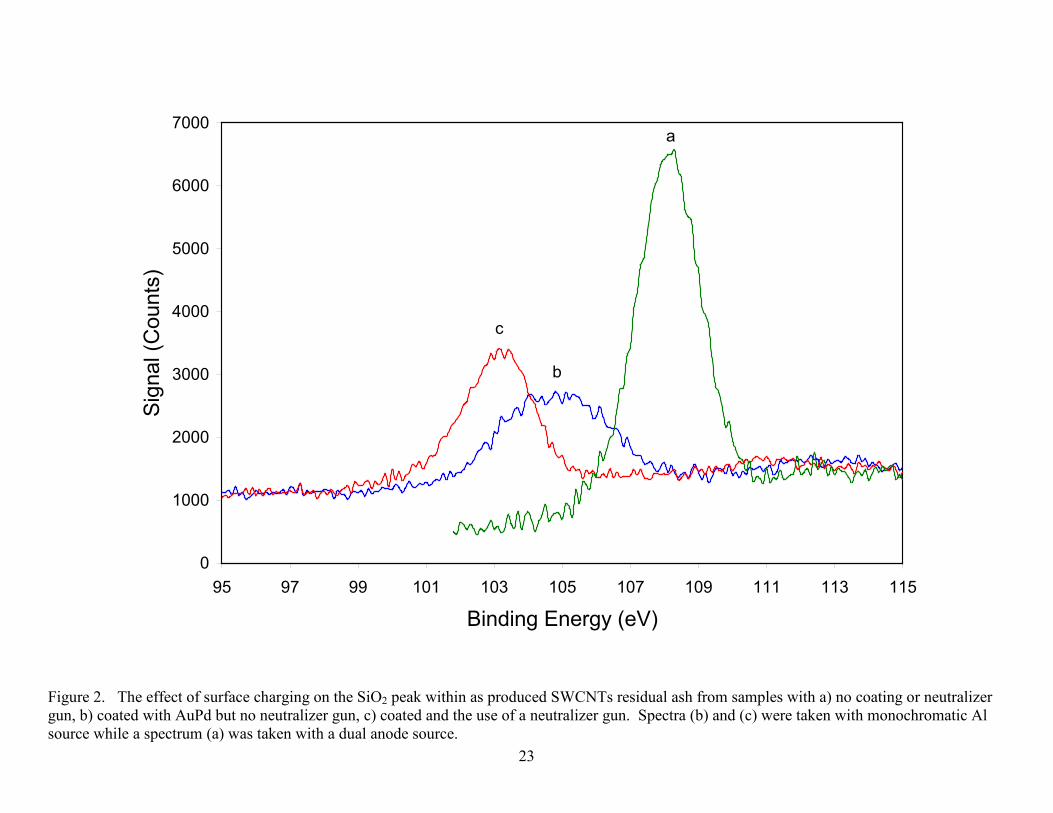
film can also be used for charge referencing to compensate for shifting effects. Figure 2.
contrasts the use of coating and the neutralizer for examining SiO2 within impurities found in the
TGA ash of SWCNTs. Surface charging can be relatively straight forward to monitor with
SWCNTs since the carbon peak position for graphitic type carbon is well established. However
the position may shift when SWCNTs are highly doped, functionalized, or damaged. It is a good
practice to acquire XPS spectra with and without a neutralizer gun to confirm that no charging
has occurred.
1.2.2 Surface Contamination and Absorption
XPS is surface sensitive to probing approximately 50-100 Å of the outer surface. Thus
surface contamination can produce significant errors in data analysis. Surface contaminants are
inherently present in all samples that have been exposed to air. Samples should never be handled
without gloves since the oil from bare hands can contaminate both the sample and the vacuum
chamber. Surface contaminants can give rise to foreign species or lead to incorrect atomic
11
percentages by reducing the signal intensities. To reduce this error, sputtering or annealing
should always be performed. Care should be taken however when sputtering since excessive
sputtering can result in the removal or damage of the element of interest. In addition, ion
implantation can lead to incorrect values of atomic percentages if not adjusted for in the analysis.
Sputtering should be gradually performed until no change in the peak intensities is observed.
Even when a sample is sputtered, absorption of gases within the chamber, likely to occur under
poor vacuum conditions or during long duration data acquisition, may still influence the XPS
data. Surface contamination and adsorption can be influential in SWCNT analysis particularly if
one of these contains the same element as species of interest (i.e. if a functional group contains
an oxygen atom which is also present in H2O or CO2, both typical contaminants). Absorbed
gases can make it difficult to evaluate the carbon peak in SWCNTs, in particular where oxygen
bound carbon species are being examined. The porous nature of the SWCNTs may allow for CO
and CO2 to be absorbed within the tubes and this can contribute to carbonyl structure of the
carbon peak. Caution should be taken when quantifying carbon components. Both surface
contamination and absorption should be minimized or accounted for to prevent erroneous
conclusion of chemical species.
1.2.3 Resolution
The resolution of the energy analyzer can reflect on the reliability of both qualitative and
quantitative analysis. If the resolution is set to low both peak assignments and quantitative
determination may be inaccurate. Low resolution will reflect in a larger full width at half
maximum of the photoelectron peak, and the peak width may be large enough to allow poor
discrimination between possible chemical states and their quantities. On the other hand high
resolution may obscure the detection of a weak signal. In SWCNT characterization, the type of
12
information desired will determine the choice of resolution. Low resolution will suffice for
species identification, while lower pass energy is required when selective determination of the
carbon components within the same sample is required. It is good practice to obtain initial
spectra with lower resolution followed by spectra centered about the species of interest with
higher resolution. Regardless of the resolution selected, the signal to noise ratio (general rule is
noise = square root of signal) should be maximized for proper analysis.
1.2.4 Overlapping Signals
Signal overlapping can occur in materials with multiple elements, since each element
generally has more than one spectral feature associated with it. With XPS the primary emission
peak is used for analysis but at times these may lie in the vicinity of secondary peaks from other
elements. This can complicate the assignment of peaks to specific chemical compounds.
Furthermore, overlapping can contribute to the intensity of a peak that is used in quantitative
analysis thereby resulting in erroneously high atomic percentages. The experimental section
discusses the effect of peak overlap errors in the analysis of impurities in SWCNTs produced by
pulsed laser vaporization.
1.2.5 Ghost and Satellite Peaks
Ghost peaks usually arise from contamination of the X-ray source or from oxidation of
the anode. Depending on the extent of the oxidation, photoelectron emissions can lead to
shoulders on the higher binding energy side of a peak. This can be important when analyzing the
C1s peak in SWCNTs. Another source of ghost peaks is cross contamination in dual anode
systems, which occurs when one anode becomes contaminated from the metal of the other anode.
This will produce additional peaks in the spectra. In order to avoid ghost peaks the X-ray anode
should be frequently degassed.
13
Satellite peaks result from multiple emission lines produced during X-ray fluorescence
from the anode. Satellite peaks are usually located on the lower binding energy edge of the
photoelectron peaks. They originate from electrons of the same orbital energy but have kinetic
energies that are higher because their emission is caused by higher energy photons. Because of
their higher kinetic energy, they appear to have lower binding energy. Using a monochromatic
X-ray source can eliminate these satellites. Satellite peaks can be problematic when different
elements have primary peaks that are located very close to each other.
2. Suggested protocol for XPS characterization of SWCNTs:
The following protocol is proposed, taking into consideration the individual components
and factors involved in the XPS characterization of SWCNTs. The exact methods, left to the
discretion of the analyst, will vary depending on the type of information desired. This procedure
provides a basic guideline for characterizing SWCNT material and may be extended to Auger
and ultra-violet photoelectron spectroscopy.
1. Mounting clips or indium foil are the ideal methods for mounting samples. However, if the
nature of the material or the sample holder restricts their use, then conductive tape can be
used, with copper preferred. When using tape, the sample should completely and uniformly
cover the tape surface to avoid erroneous signal arising from the background.
2. Use of a monochromatic X-ray source is suggested for high-resolution work in particularly
when analyzing the carbon 1s peak. A dual anode should be used for multi-element samples
where mixing of photoelectron and Auger peaks is expected, in order to maximize accuracy of
quantitative chemical data. Calibrate system using the Au 4f peak from a sputtered Au sample
with using high energy resolution. If errors in the calibration are found, then be sure to degas
the anode.

14
3. For elemental analysis a large beam size and pass energy are suggested so that very low
concentrations can be detected. For chemical state analysis a large beam size with a small
pass energy and step increments on the order of the resolution should be used. Also for
chemical state analysis localized scans of the peak of interest should be used instead of survey
scans. For line scanning use a beam size on the order of the step increment.
4. Normal incident angle of 90º with respect to the analyzer entrance should be used in order to
maximize signals. To characterize functionalized or modified SWCNTs, angle resolved
acquisition is encouraged to obtain more reliable assessment of the degree of modification.
Take off angle can be varied between 0-45º until the substrate no longer appears to contribute
to the spectrum.
5. Always acquire XPS spectra prior to ion sputtering. Calculate the amount of time required to
remove 1-2 monolayers of carbon, oxygen and nitrogen. For quantitative analysis continue
sputtering until no variations in intensity are observed or until all undesirable species are no
longer present.
6. Check for charging of samples by acquiring spectra with and without a neutralizer gun and
monitor shifting of the carbon peak. If the system is not equipped with a neutralizer gun,
sputter coating with Au is recommended for charge referencing. The Au can be removed by
sputtering while monitoring signals until they are maximized. It is recommended that samples
be analyzed with and without the neutralizer to confirm charging within samples.
7. With beam sizes of the micron scale a minimum of three locations should be analyzed to
confirm that the analysis is representative of the sample. With non-focused sources where the
beam size is millimeters in diameter, two scans are recommended to check for variations
resulting from non-uniform coverage.
15
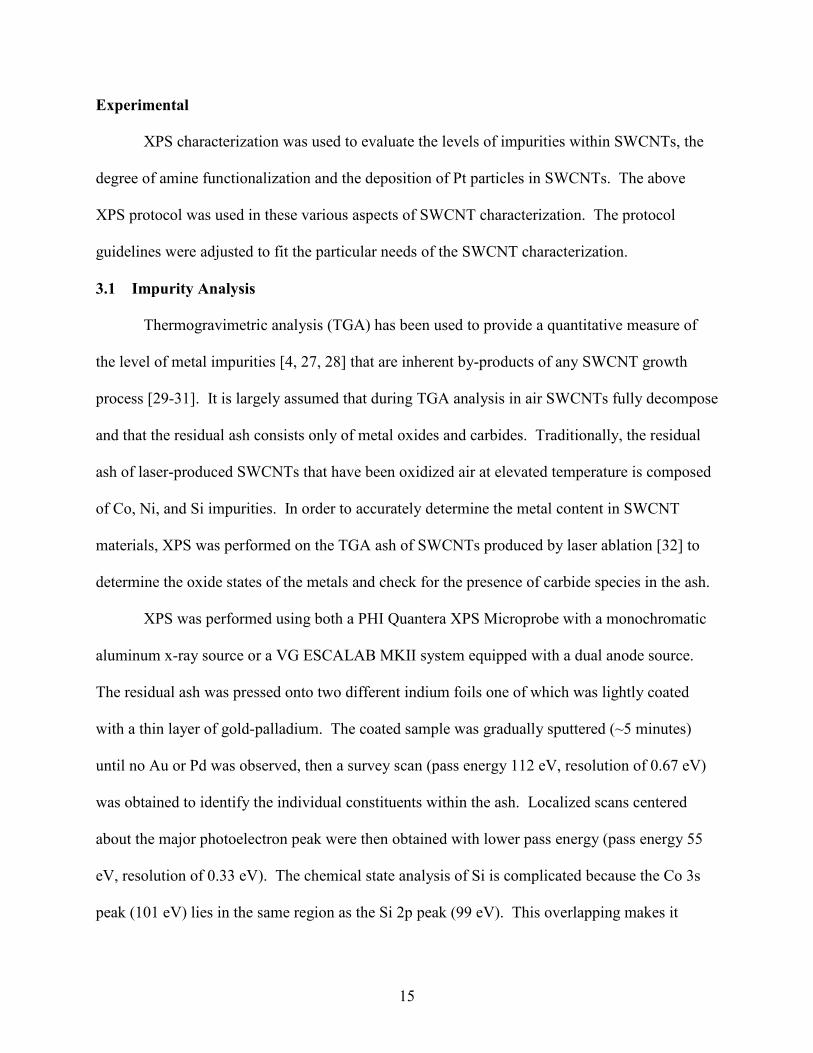
Experimental
XPS characterization was used to evaluate the levels of impurities within SWCNTs, the
degree of amine functionalization and the deposition of Pt particles in SWCNTs. The above
XPS protocol was used in these various aspects of SWCNT characterization. The protocol
guidelines were adjusted to fit the particular needs of the SWCNT characterization.
3.1 Impurity Analysis
Thermogravimetric analysis (TGA) has been used to provide a quantitative measure of
the level of metal impurities [4, 27, 28] that are inherent by-products of any SWCNT growth
process [29-31]. It is largely assumed that during TGA analysis in air SWCNTs fully decompose
and that the residual ash consists only of metal oxides and carbides. Traditionally, the residual
ash of laser-produced SWCNTs that have been oxidized air at elevated temperature is composed
of Co, Ni, and Si impurities. In order to accurately determine the metal content in SWCNT
materials, XPS was performed on the TGA ash of SWCNTs produced by laser ablation [32] to
determine the oxide states of the metals and check for the presence of carbide species in the ash.
XPS was performed using both a PHI Quantera XPS Microprobe with a monochromatic
aluminum x-ray source or a VG ESCALAB MKII system equipped with a dual anode source.
The residual ash was pressed onto two different indium foils one of which was lightly coated
with a thin layer of gold-palladium. The coated sample was gradually sputtered (~5 minutes)
until no Au or Pd was observed, then a survey scan (pass energy 112 eV, resolution of 0.67 eV)
was obtained to identify the individual constituents within the ash. Localized scans centered
about the major photoelectron peak were then obtained with lower pass energy (pass energy 55
eV, resolution of 0.33 eV). The chemical state analysis of Si is complicated because the Co 3s
peak (101 eV) lies in the same region as the Si 2p peak (99 eV). This overlapping makes it
16
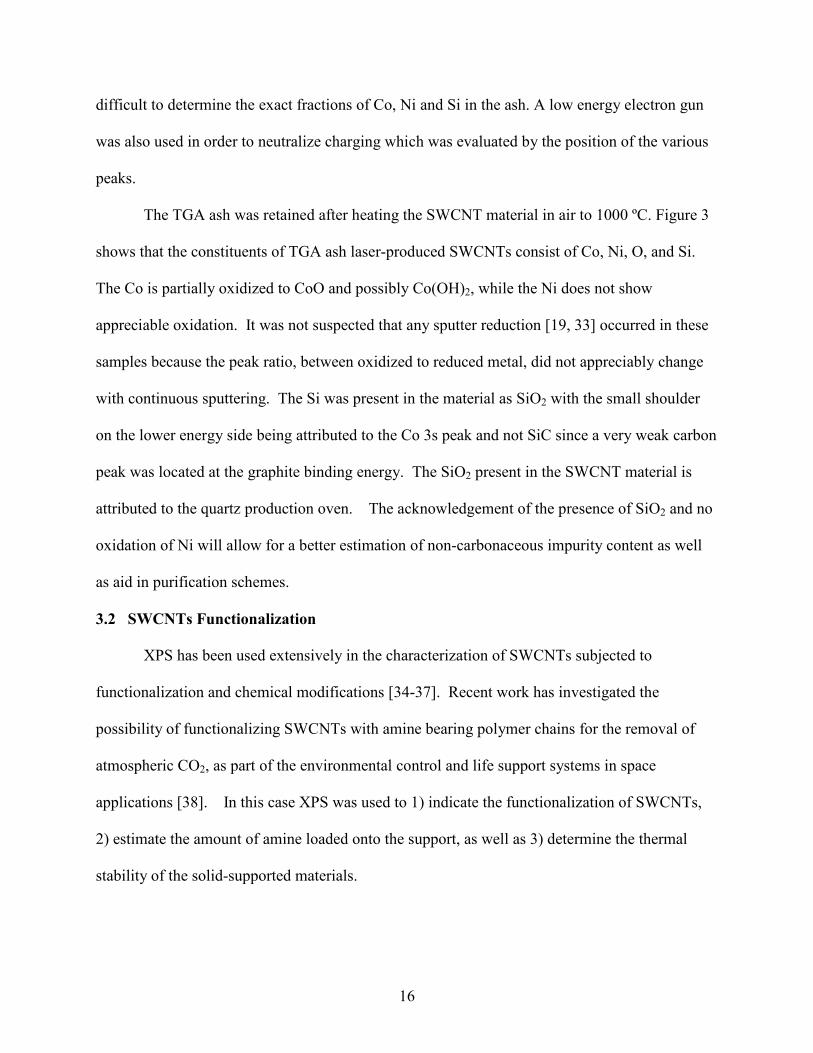
difficult to determine the exact fractions of Co, Ni and Si in the ash. A low energy electron gun
was also used in order to neutralize charging which was evaluated by the position of the various
peaks.
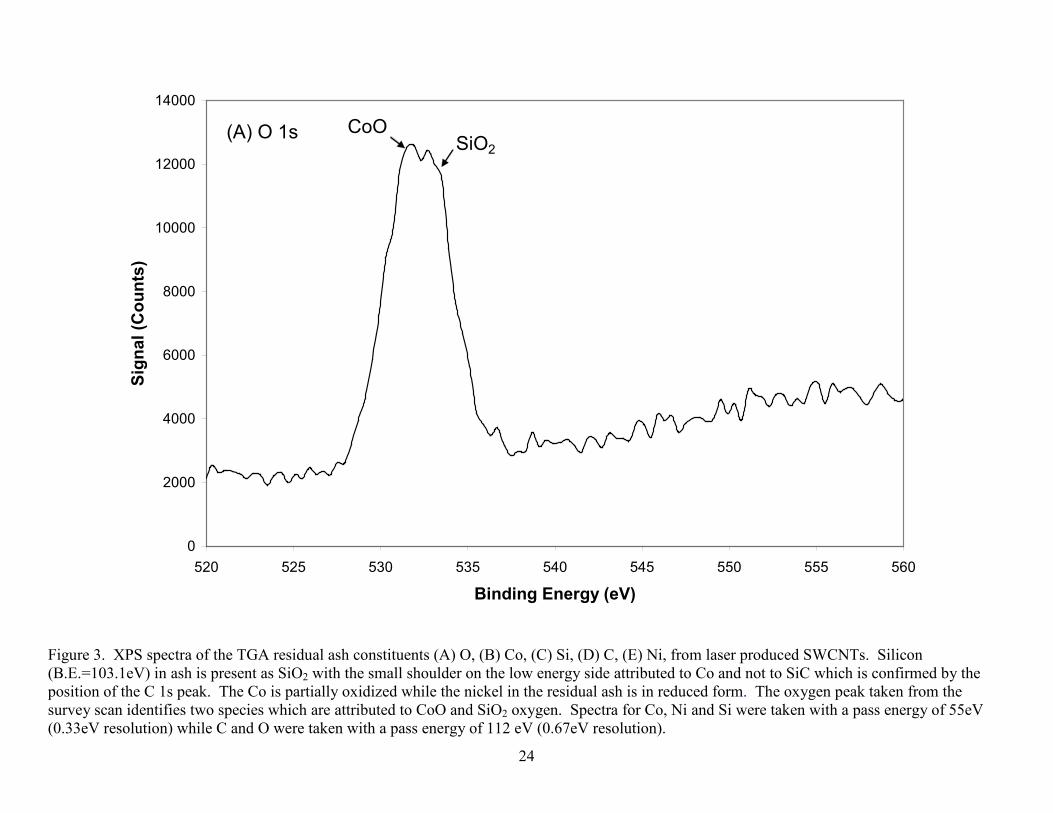
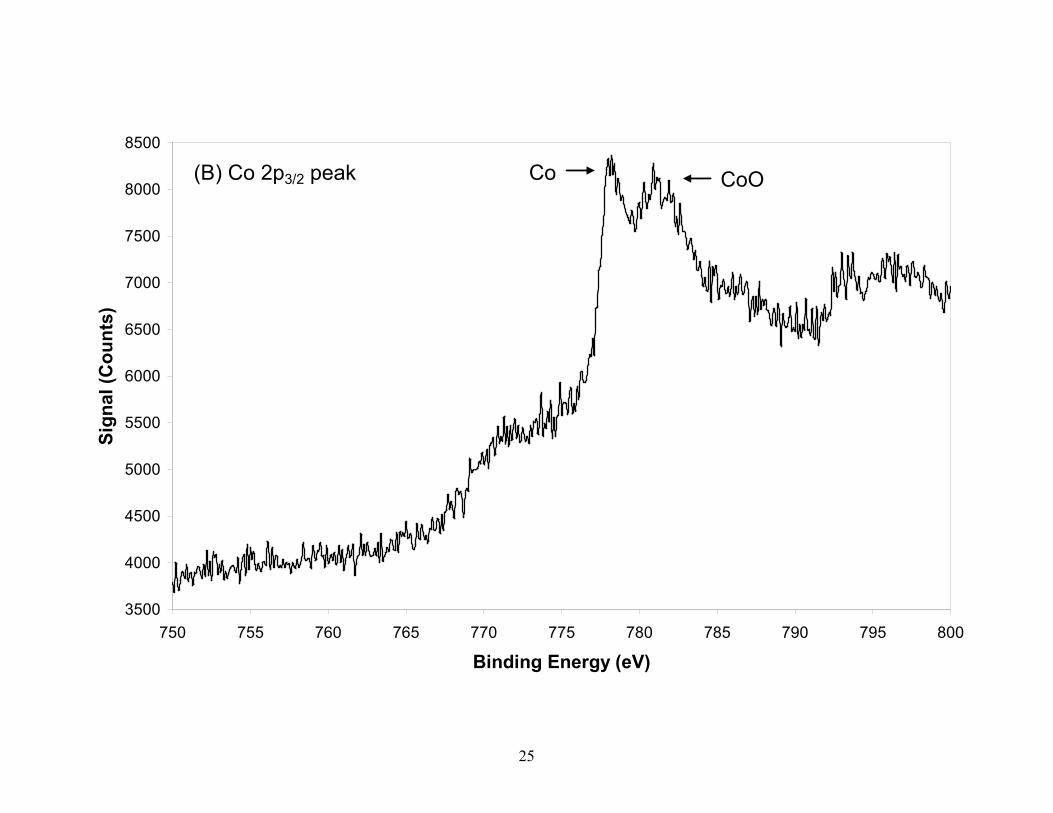
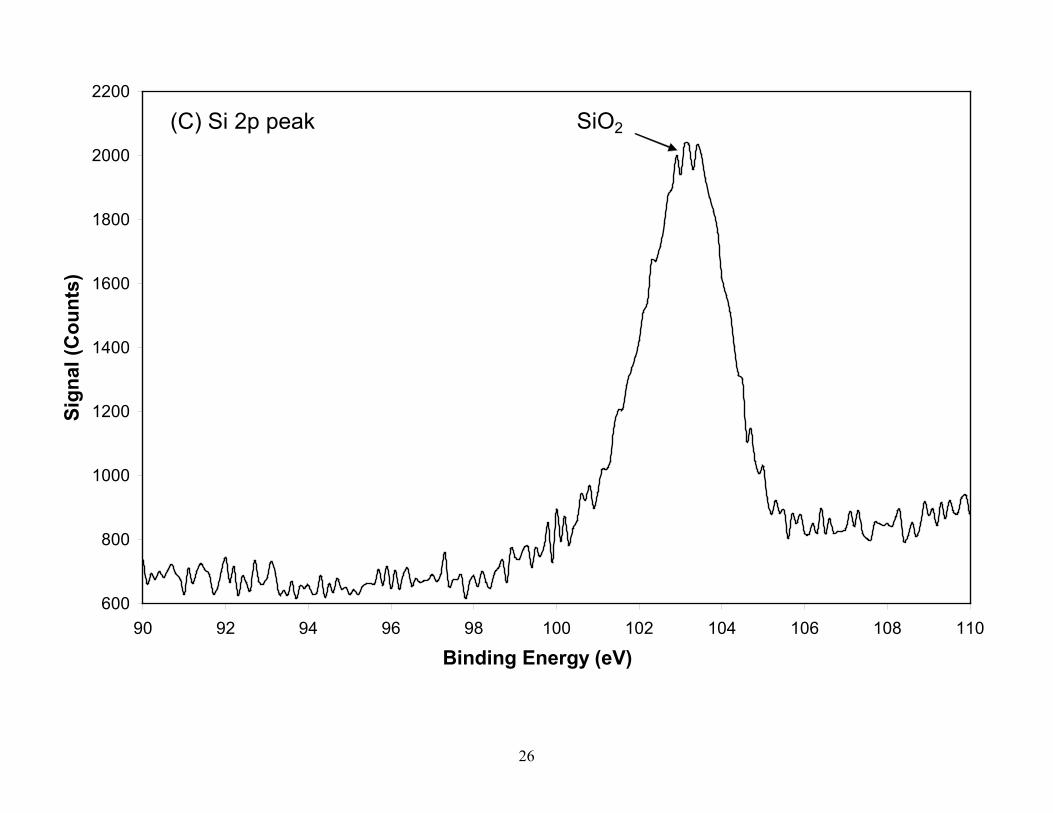
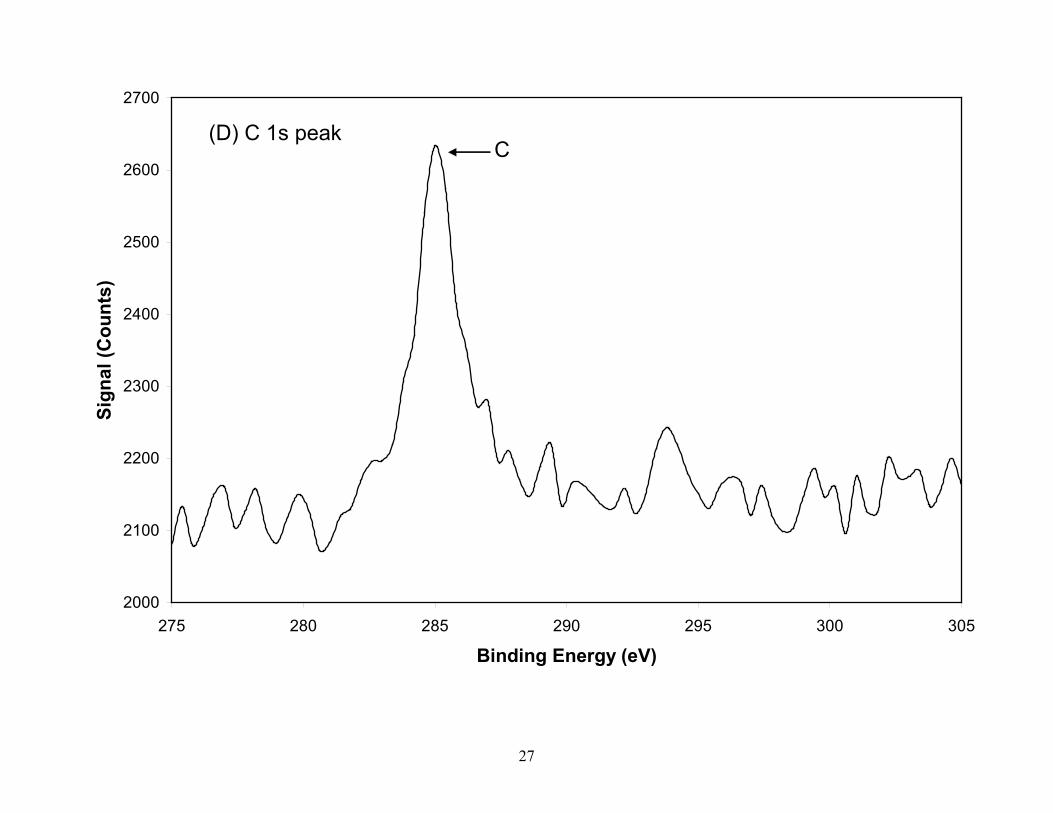
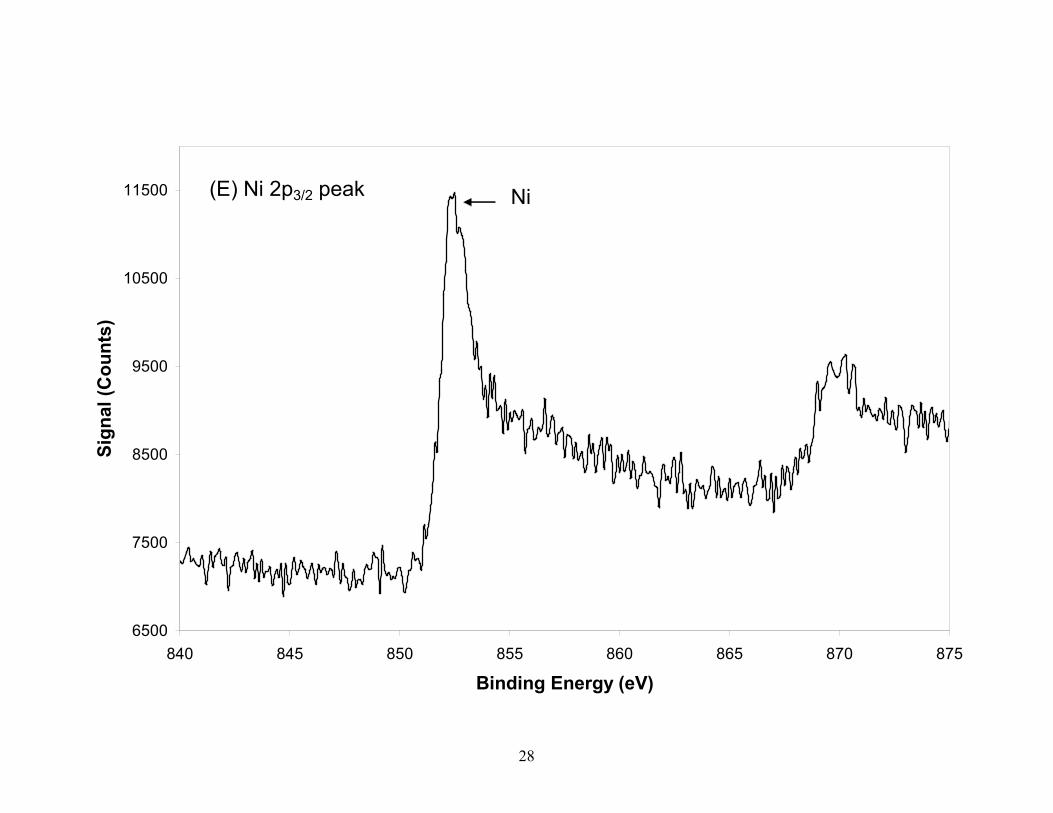
The TGA ash was retained after heating the SWCNT material in air to 1000 ºC. Figure 3
shows that the constituents of TGA ash laser-produced SWCNTs consist of Co, Ni, O, and Si.
The Co is partially oxidized to CoO and possibly Co(OH)2, while the Ni does not show
appreciable oxidation. It was not suspected that any sputter reduction [19, 33] occurred in these
samples because the peak ratio, between oxidized to reduced metal, did not appreciably change
with continuous sputtering. The Si was present in the material as SiO2 with the small shoulder
on the lower energy side being attributed to the Co 3s peak and not SiC since a very weak carbon
peak was located at the graphite binding energy. The SiO2 present in the SWCNT material is
attributed to the quartz production oven. The acknowledgement of the presence of SiO2 and no
oxidation of Ni will allow for a better estimation of non-carbonaceous impurity content as well
as aid in purification schemes.
3.2 SWCNTs Functionalization
XPS has been used extensively in the characterization of SWCNTs subjected to
functionalization and chemical modifications [34-37]. Recent work has investigated the
possibility of functionalizing SWCNTs with amine bearing polymer chains for the removal of
atmospheric CO2, as part of the environmental control and life support systems in space
applications [38]. In this case XPS was used to 1) indicate the functionalization of SWCNTs,
2) estimate the amount of amine loaded onto the support, as well as 3) determine the thermal
stability of the solid-supported materials.
17
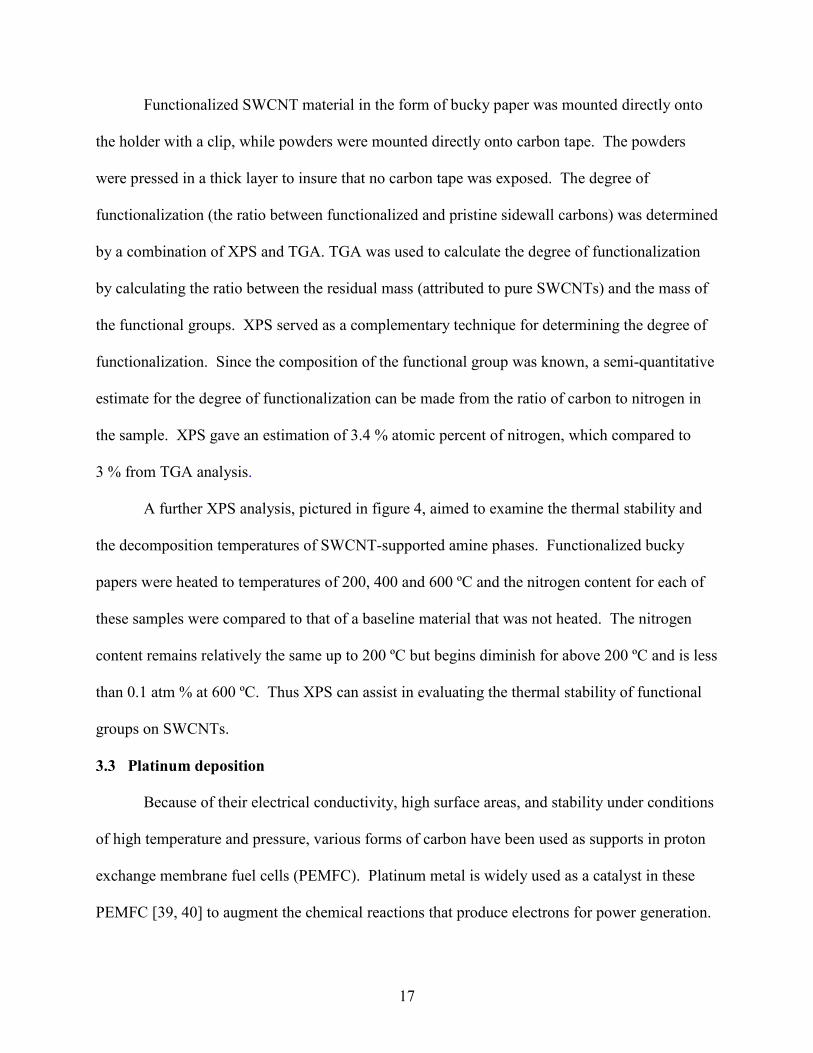
Functionalized SWCNT material in the form of bucky paper was mounted directly onto
the holder with a clip, while powders were mounted directly onto carbon tape. The powders
were pressed in a thick layer to insure that no carbon tape was exposed. The degree of
functionalization (the ratio between functionalized and pristine sidewall carbons) was determined
by a combination of XPS and TGA. TGA was used to calculate the degree of functionalization
by calculating the ratio between the residual mass (attributed to pure SWCNTs) and the mass of
the functional groups. XPS served as a complementary technique for determining the degree of
functionalization. Since the composition of the functional group was known, a semi-quantitative
estimate for the degree of functionalization can be made from the ratio of carbon to nitrogen in
the sample. XPS gave an estimation of 3.4 % atomic percent of nitrogen, which compared to
3 % from TGA analysis.
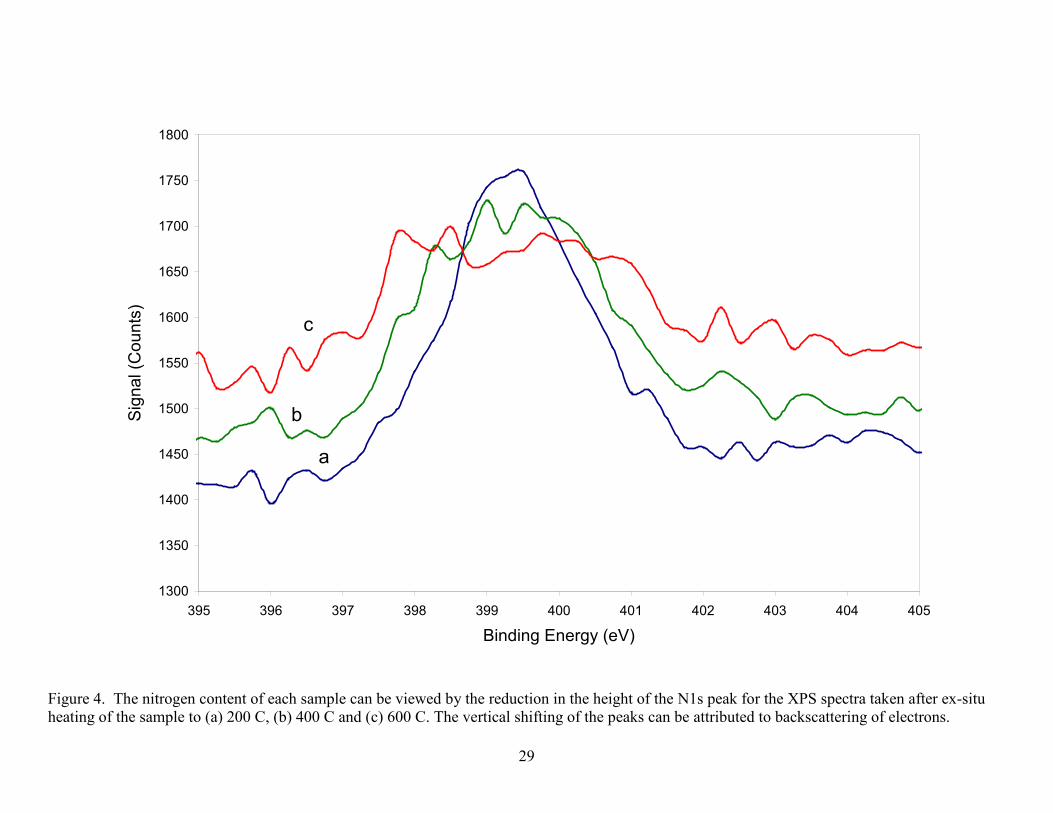
A further XPS analysis, pictured in figure 4, aimed to examine the thermal stability and
the decomposition temperatures of SWCNT-supported amine phases. Functionalized bucky
papers were heated to temperatures of 200, 400 and 600 ºC and the nitrogen content for each of
these samples were compared to that of a baseline material that was not heated. The nitrogen
content remains relatively the same up to 200 ºC but begins diminish for above 200 ºC and is less
than 0.1 atm % at 600 ºC. Thus XPS can assist in evaluating the thermal stability of functional
groups on SWCNTs.
3.3 Platinum deposition
Because of their electrical conductivity, high surface areas, and stability under conditions
of high temperature and pressure, various forms of carbon have been used as supports in proton
exchange membrane fuel cells (PEMFC). Platinum metal is widely used as a catalyst in these
PEMFC [39, 40] to augment the chemical reactions that produce electrons for power generation.
18
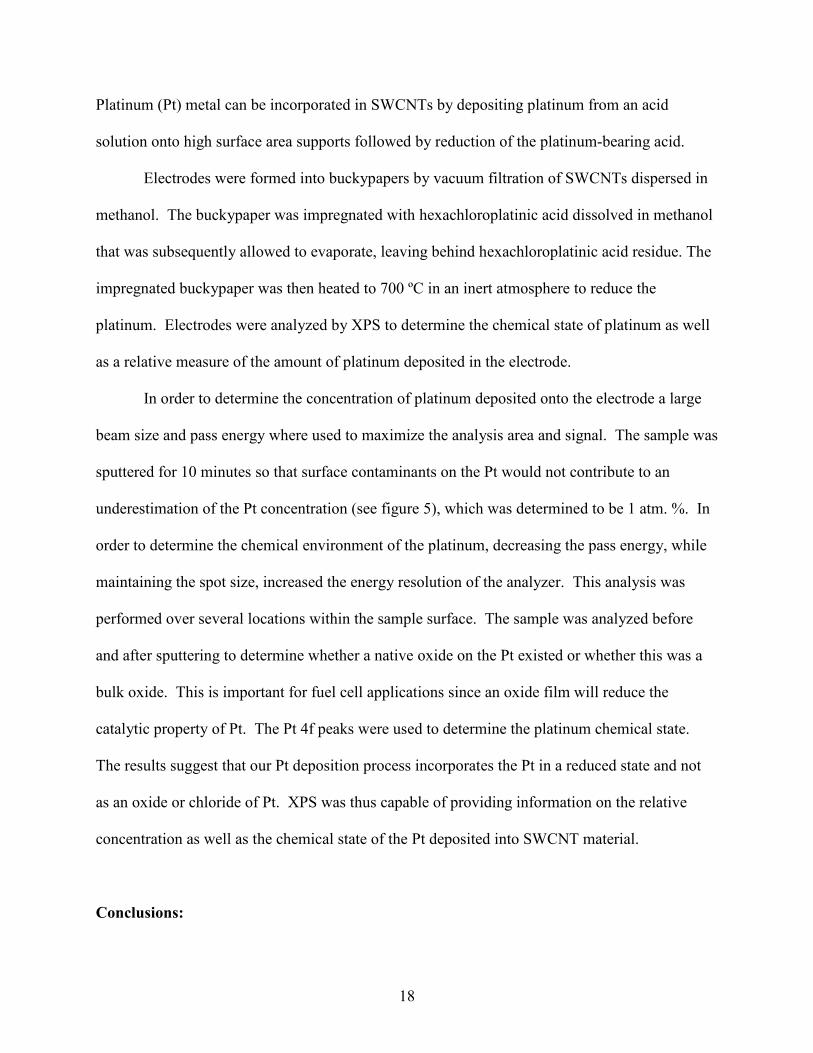
Platinum (Pt) metal can be incorporated in SWCNTs by depositing platinum from an acid
solution onto high surface area supports followed by reduction of the platinum-bearing acid.
Electrodes were formed into buckypapers by vacuum filtration of SWCNTs dispersed in
methanol. The buckypaper was impregnated with hexachloroplatinic acid dissolved in methanol
that was subsequently allowed to evaporate, leaving behind hexachloroplatinic acid residue. The
impregnated buckypaper was then heated to 700 ºC in an inert atmosphere to reduce the
platinum. Electrodes were analyzed by XPS to determine the chemical state of platinum as well
as a relative measure of the amount of platinum deposited in the electrode.
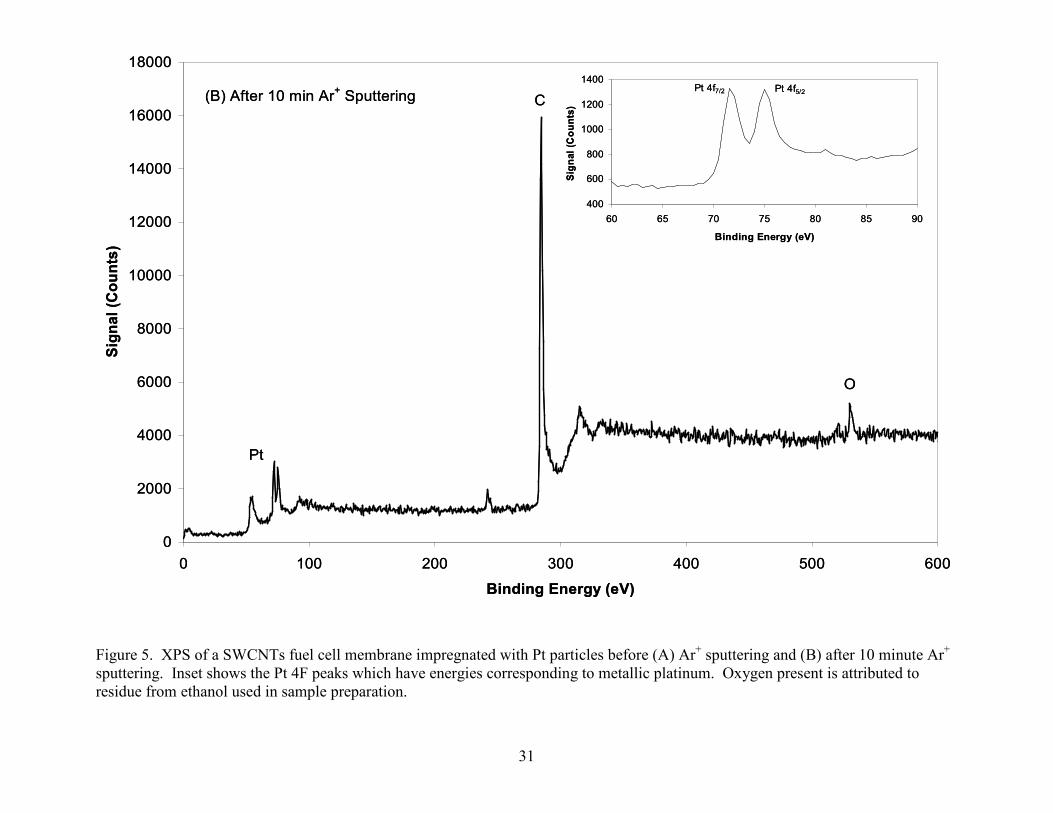
In order to determine the concentration of platinum deposited onto the electrode a large
beam size and pass energy where used to maximize the analysis area and signal. The sample was
sputtered for 10 minutes so that surface contaminants on the Pt would not contribute to an
underestimation of the Pt concentration (see figure 5), which was determined to be 1 atm. %. In
order to determine the chemical environment of the platinum, decreasing the pass energy, while
maintaining the spot size, increased the energy resolution of the analyzer. This analysis was
performed over several locations within the sample surface. The sample was analyzed before
and after sputtering to determine whether a native oxide on the Pt existed or whether this was a
bulk oxide. This is important for fuel cell applications since an oxide film will reduce the
catalytic property of Pt. The Pt 4f peaks were used to determine the platinum chemical state.
The results suggest that our Pt deposition process incorporates the Pt in a reduced state and not
as an oxide or chloride of Pt. XPS was thus capable of providing information on the relative
concentration as well as the chemical state of the Pt deposited into SWCNT material.
Conclusions:
19
A protocol for characterizing carbon nanotube materials by XPS has been developed that
takes into consideration all of the factors that can influence the XPS data of carbon nanotubes.
This protocol is a suggestive guideline to aid in maximizing the results obtained from XPS and
variables should be selected in accordance to particular characterization needs. This protocol
could conceivably be extended to both Auger and ultra-violet photoelectron spectroscopy.
Acknowledgements:
This work is funded by NASA grant NNJ05HI05C, along with support from the National
Research Council Research Associateship Program (to R. Allada). The authors would like to
thank both Rice University and the University of North Texas for their use of instrumentation. In
addition, the authors would like to thank Dr. Daniel Resasco of the University of Oklahoma for
helpful discussion.
20
References:
1. “Carbon Nanotubes: Synthesis, Structure, Properties and Applications” (Dresselhaus M. S., Dresselhaus G., Avouris P.) Topics in Applied Physics, vol. 80, Springer- Verlag, Heidelberg (2001). 2. Baughman R.H., Zakhidov A.A., de Heer W.A., Science 29, 787 (2002). 3. L. Yowell, B. Mayeaux, B. Files, E. Sullivan, Proceedings of the Second World Space
Congress, Houston, TX, USA, October 10-19, 2002, 4. Arepalli S., Nikolaev P., Gorelik O., Hadjiev V. G., Holmes W., Files B., Yowell L., Carbon 42, 1783 (2004). 5. Lee W. H., Kim S.J., Lee W. J., Haddon R. C., Reucroft P. J., Appl. Surf. Sci. 181, 121 (2001). 6. An K. H., et al, Appl. Phys. Lett. 80, 4235 (2002). 7. Chen Y., et al, J. Mater. Res. 13, 2423 (1998). 8. Sugala, Y.M., et al., J. El. Spec., 160, 22 (2007). 9. Briggs and Seah, Practical Surface Analysis by Auger and X-ray Photoelectron Spectroscopy John Wiley and Sons, New York 1983. 10. Feldman L. C. and Mayer J.W., Fundamentals of Surface and Thin Film Analysis Elsevier Science 1989. 11. C. D. Wagner, W. M. Riggs, L. E. Davis, and J. Moulder, Handbook of X-ray Photoelectron Spectroscopy Perkin Elmer Corporation (Physical Electronics), 1979 (1st edition). 12. Zhang G. Y., Ma X. C., Zhong D. Y., Wang E. G., J. Appl. Phys., 91, 9324 (2002). 13. Cao C., Huang F., Cao C., Li J., Zhu H., Chem.Mater., 16, 5213 (2004). 14. Barr T.L., Appl. Surf. Sci. 15, 1 (1983). 15. Goldoni A., Larciprete R., Gregoratti L., Kaulich B., Kiskinova M., Zhang Y., Dai H., Sangaletti L., Parmigiani F., Appl. Phys. Lett., 80, 2165 (2002). 16. Taylor J.Ashley, J.Vac. Sci. Technol., 20(3) 751 (1982). 17. Kim J.Y., Reucroft P.J., Pradhan V.R., Wender I., Fuel Process. 34, 207 (1993). 18. Seah M. P., Thin Solid Films, 81, 179 (1981). 19. Barr T. L., J. Vac. Sci. Technol., 14(1) 660 (1977). 20. Huchital D. A., McKeon R.T. Appl. Phys. Lett., 20 158 (1972). 21. Windawi H., J. Electron Spectrosc., 22, 373 (1981). 22. Gross T., Ramm M., Sonntag H., Unger W., Weijers H. M., Adem E. H., Surf. Interface Anal. 18, 59 (1992). 23. Do T., McIntyre N.S., Surf. Interface Anal. 27, 1037 (1999). 24. Hnatowich D.J., Hudis J., Perlman M. L., Ragnini R. C., J. Appl. Phys., 42 4883 (1971). 25. Uwamino Y., Ishizuka T., Yamatera H., J. Electron Spectrosc. Rel. Phenom., 23, 55 (1981). 26. Wagner C.D., Passoja D. E., Hillery H. F., Kinisky T. G., Six H. A., Jansen W. T., Taylor J. A., J. Vac. Sci. Technol. 21, 933 (1982). 27. Arepalli S., Nikolaev P., Gorelik O., Enclyclop. Nanosci. Nanotech., 1, 51 (2004). 28. Hennrich F., Lebedkin S., Malik S., Tracy J., Barczewski M., Rösner H., Kappes M., Phys. Chem. Chem. Phys. 4, 2273 (2002). 29. M. S. Dresselhaus, G. Dresselhaus, Eklund P., Science of Fullerenes and Carbon Nanotubes Acedemic Press, New York , 1996.
21
30. Ando Y., Zhao X., Sugai T., Kumar M., Materials Today p.22 (2004). 31. Moisala A., Nasibulin A. G., Kauppanin E. I., J. Phys. Condens. Matter, 15, s3011 (2003). 32. Guo T., Nikolaev P., Thess A., Colbert D. A., Smalley R. E., Chem. Phys. Lett. 24 (1995) 33. Kim K.S., Baitinger W.E., Amy J.W., Winograd N., J. Electron Spectroscop. Relat. Phenom. 5, 351 (1974). 34. Dyke C.A., Stewart M. P., Tour J. M., J. Am. Chem. Soc., 127, 4497 (2005). 35. Lee Y. S., Cho T. H., Lee B. Y., Rho J. S., An K. H., Lee Y. H., J. Fluorine Chem. 120, 99 (2003). 36. Detlaff-Weglikowska U. et. al. J. Am. Chem. Soc. 127, 5125 (2005). 37. Holzinger M., Hirsch A., Hennrich F., Kappes M. M., Dziakova A, Ley L., Graupner R., AIP Conf. Proc. 633, 96 (2002). 38. Allada R.K, Chattopadhyay J., Moloney P., Shah K., Anderson M., Filburn T., Smith F,
Billups W. E., Arepalli S., Yowell L., Proceedings of 36th International Conference on Environmental Systems, Norfolk, VA, USA July 17-20, 2006
39. Verde Y., Alonso G., Ramos V., Zhang H., Jacobson A. J., Keer A., Applied Catalyst A: General, 277, 201 (2004). 40. Maruyama J., Abe I., Journal of the Electrochemical Society, 151, (3), A447, (2004).
22
Flood Gun or
Auger Source
Ar+ Ion Gun
X-ray Source
Hemispherical Energy
Analyzer
Sample
Sample Manipulator
Figure 1. Schematic of an XPS system showing the major components.
23
0
1000
2000
3000
4000
5000
6000
7000
95 97 99 101 103 105 107 109 111 113 115
Binding Energy (eV)
Sig
nal (
Cou
nts)
a
b
c
Figure 2. The effect of surface charging on the SiO2 peak within as produced SWCNTs residual ash from samples with a) no coating or neutralizer gun, b) coated with AuPd but no neutralizer gun, c) coated and the use of a neutralizer gun. Spectra (b) and (c) were taken with monochromatic Al source while a spectrum (a) was taken with a dual anode source.
24
Figure 3. XPS spectra of the TGA residual ash constituents (A) O, (B) Co, (C) Si, (D) C, (E) Ni, from laser produced SWCNTs. Silicon (B.E.=103.1eV) in ash is present as SiO2 with the small shoulder on the low energy side attributed to Co and not to SiC which is confirmed by the position of the C 1s peak. The Co is partially oxidized while the nickel in the residual ash is in reduced form. The oxygen peak taken from the survey scan identifies two species which are attributed to CoO and SiO2 oxygen. Spectra for Co, Ni and Si were taken with a pass energy of 55eV (0.33eV resolution) while C and O were taken with a pass energy of 112 eV (0.67eV resolution).
0
2000
4000
6000
8000
10000
12000
14000
520 525 530 535 540 545 550 555 560
Binding Energy (eV)
Sign
al (C
ount
s)CoO
SiO2(A) O 1s
25
3500
4000
4500
5000
5500
6000
6500
7000
7500
8000
8500
750 755 760 765 770 775 780 785 790 795 800
Binding Energy (eV)
Sign
al (C
ount
s)
(B) Co 2p3/2 peak Co CoO
26
600
800
1000
1200
1400
1600
1800
2000
2200
90 92 94 96 98 100 102 104 106 108 110
Binding Energy (eV)
Sign
al (C
ount
s)
(C) Si 2p peak SiO2
27
2000
2100
2200
2300
2400
2500
2600
2700
275 280 285 290 295 300 305
Binding Energy (eV)
Sign
al (C
ount
s)(D) C 1s peak
C
28
6500
7500
8500
9500
10500
11500
840 845 850 855 860 865 870 875
Binding Energy (eV)
Sign
al (C
ount
s)
(E) Ni 2p3/2 peak Ni
29
1300
1350
1400
1450
1500
1550
1600
1650
1700
1750
1800
395 396 397 398 399 400 401 402 403 404 405
Binding Energy (eV)
Sig
nal (
Cou
nts)
a
b
c
Figure 4. The nitrogen content of each sample can be viewed by the reduction in the height of the N1s peak for the XPS spectra taken after ex-situ heating of the sample to (a) 200 C, (b) 400 C and (c) 600 C. The vertical shifting of the peaks can be attributed to backscattering of electrons.

30
0
500
1000
1500
2000
2500
3000
3500
0 100 200 300 400 500 600
Binding Energy (eV)
Sign
al (C
ount
s)
(A) Before Ar+ Sputtering
Pt
O
C
31
Figure 5. XPS of a SWCNTs fuel cell membrane impregnated with Pt particles before (A) Ar+ sputtering and (B) after 10 minute Ar+ sputtering. Inset shows the Pt 4F peaks which have energies corresponding to metallic platinum. Oxygen present is attributed to residue from ethanol used in sample preparation.
400
600
800
1000
1200
1400
60 65 70 75 80 85 90
Binding Energy (eV)
Sign
al (C
ount
s)
Pt 4f7/2 Pt 4f5/2
0
2000
4000
6000
8000
10000
12000
14000
16000
18000
0 100 200 300 400 500 600
Binding Energy (eV)
Sign
al (C
ount
s)(B) After 10 min Ar+ Sputtering
Pt
C
O
400
600
800
1000
1200
1400
60 65 70 75 80 85 90
Binding Energy (eV)
Sign
al (C
ount
s)
Pt 4f7/2 Pt 4f5/2
0
2000
4000
6000
8000
10000
12000
14000
16000
18000
0 100 200 300 400 500 600
Binding Energy (eV)
Sign
al (C
ount
s)(B) After 10 min Ar+ Sputtering
Pt
C
O