Embed Size (px)
Citation preview

May 2021
Overview materials
2
Disclaimer
IMPORTANT NOTICE
This presentation includes forward-looking statements. All statements other than statements of historical facts contained in this presentation, including statements regarding our future
results of operations and financial position, industry dynamics, business strategy and plans and our objectives for future operations, are forward-looking statements. These statements
represent our opinions, expectations, beliefs, intentions, estimates or strategies regarding the future, which may not be realized. In some cases, you can identify forward-looking
statements by terms such as “may,” “will,” “should,” “expects,” “plans,” “anticipates,” “could,” “intends,” “targets,” “projects,” “believes,” “estimates”, “potential” or “continue” or the
negative of these terms or other similar expressions that are intended to identify forward-looking statements. Forward-looking statements are based largely on our current expectations
and projections about future events and financial trends that we believe may affect our financial condition, results of operations, business strategy, short-term and long-term business
operations and objectives, and financial needs. These forward-looking statements involve known and unknown risks, uncertainties, changes in circumstances that are difficult to predict
and other important factors that may cause our actual results, performance or achievements to be materially different from any future results, performance or achievements expressed
or implied by the forward-looking statement. Moreover, new risks emerge from time to time. It is not possible for our management to predict all risks, nor can we assess the impact of all
factors on our business or the extent to which any factor, or combination of factors, may cause actual results to differ materially from those contained in any forward-looking statements
we may make. In light of these risks, uncertainties and assumptions, the forward-looking events and circumstances discussed in this presentation may not occur and actual results
could differ materially and adversely from those anticipated or implied in the forward-looking statements. We caution you therefore against relying on these forward-looking statements,
and we qualify all of our forward-looking statements by these cautionary statements.
The forward-looking statements included in this presentation are made only as of the date hereof. Although we believe that the expectations reflected in the forward-looking statements
are reasonable, we cannot guarantee that the future results, levels of activity, performance or events and circumstances reflected in the forward-looking statements will be achieved or
occur. Moreover, neither we nor our advisors nor any other person assumes responsibility for the accuracy and completeness of the forward-looking statements. Neither we nor our
advisors undertake any obligation to update any forward-looking statements for any reason after the date of this presentation to conform these statements to actual results or to
changes in our expectations, except as may be required by law. You should read this presentation with the understanding that our actual future results, levels of activity, performance
and events and circumstances may be materially different from what we expect.
This presentation includes certain financial measures not presented in accordance with IFRS including but not limited to Adjusted EBITDA. These financial measures are not measures
of financial performance in accordance with IFRS and may exclude items that are significant in understanding and assessing the Company’s financial results. Therefore, these
measures should not be considered in isolation or as an alternative to loss for the period or other measures of profitability, liquidity or performance under IFRS. You should be aware
that the Company’s presentation of these measures may not be comparable to similarly titled measures used by other companies, which may be defined and calculated differently. See
the appendix for a reconciliation of certain of these non-IFRS measures to the most directly comparable IFRS measure. The trademarks included herein are the property of the owners
thereof and are used for reference purposes only. Such use should not be construed as an endorsement of the products or services of the Company.

3
Jumia overview
Q1.21 financial highlights
Appendix
Financials overview
4
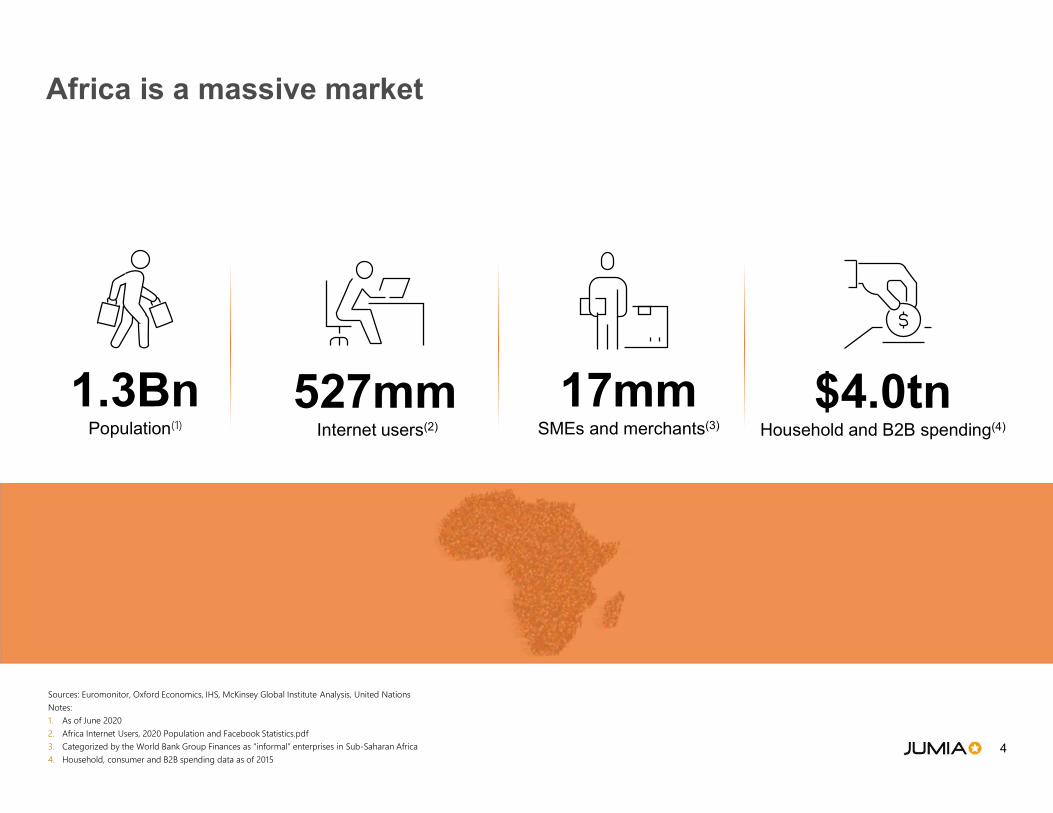
Africa is a massive market
1.3BnPopulation(1)
17mmSMEs and merchants(3)
527mmInternet users(2)
$4.0tnHousehold and B2B spending(4)
Sources: Euromonitor, Oxford Economics, IHS, McKinsey Global Institute Analysis, United Nations Notes:1. As of June 20202. Africa Internet Users, 2020 Population and Facebook Statistics.pdf3. Categorized by the World Bank Group Finances as “informal” enterprises in Sub-Saharan Africa4. Household, consumer and B2B spending data as of 2015
5
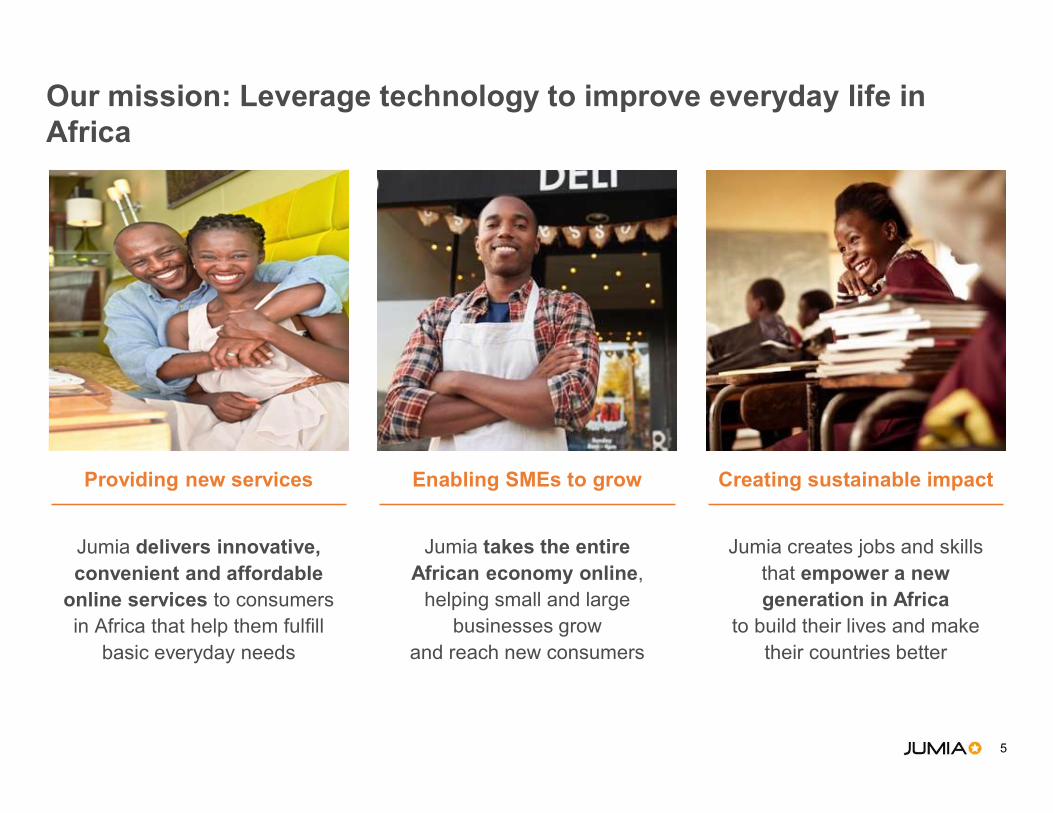
Our mission: Leverage technology to improve everyday life in Africa
Jumia delivers innovative, convenient and affordable
online services to consumersin Africa that help them fulfill
basic everyday needs
Jumia takes the entire African economy online,
helping small and large businesses grow
and reach new consumers
Jumia creates jobs and skills that empower a new generation in Africa
to build their lives and make their countries better
Providing new services Enabling SMEs to grow Creating sustainable impact

6
We are the leading pan-African e-commerce platform
One brand, single sign-on, full integration
Jumia Marketplace JumiaPayJumia Logistics
Annual Active Consumers1
6.9mmTransactions via
JumiaPay4
37%GMV3
c.€840m Active
Sellers2
>110K
Notes:
1. For the 12-month period ending March 31, 2021
2. As of December 2019, Active Sellers defined as unique sellers who received an order on our marketplace within the 12-month period preceding the relevant date, irrespective of cancellations or returns
3. For the 12-month period ending December, 31 2020
4. % Orders completed using JumiaPay in Q1 2021, at group level, irrespective of cancellations or returns
Orders3
28mm
Order a pizza
Buy a smartphone
Pay your bills
Buy your groceries
Recharge your data plan
Buy shoes
…And many more
7
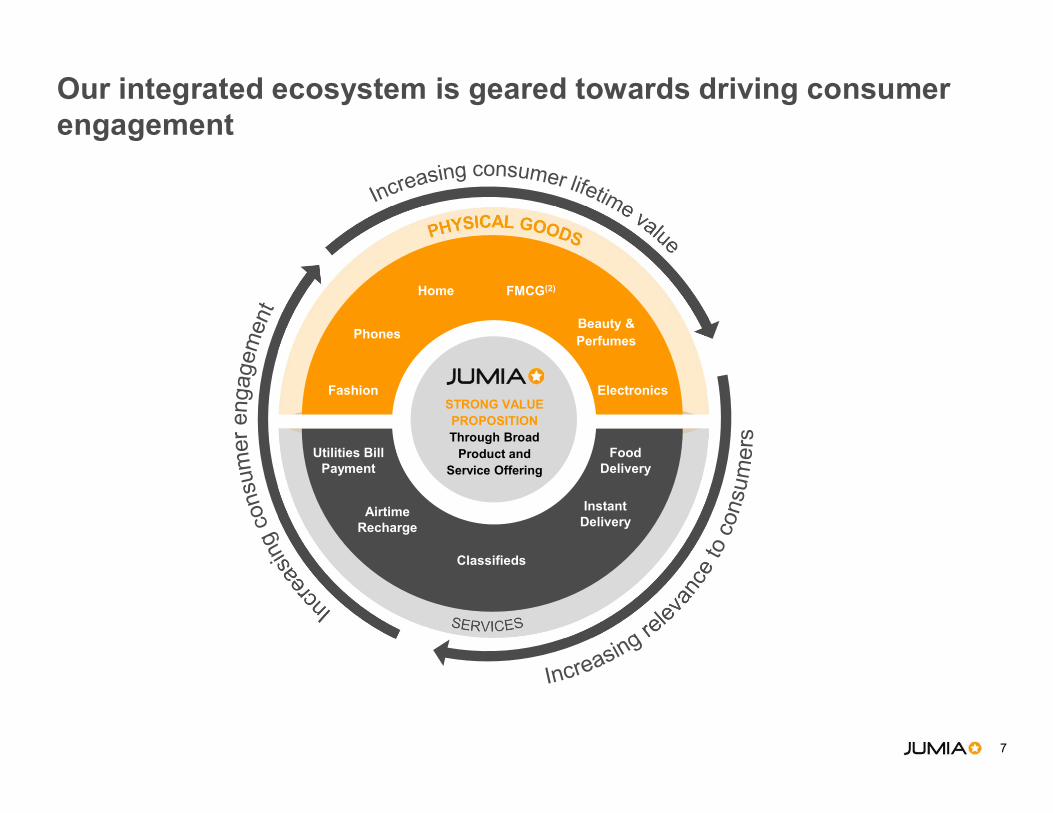
Our integrated ecosystem is geared towards driving consumer engagement
Fashion
Phones
FMCG(2)
Electronics
Beauty &Perfumes
Utilities BillPayment
Home
Classifieds
STRONG VALUE PROPOSITIONThrough Broad
Product and Service Offering
FoodDelivery
AirtimeRecharge
InstantDelivery
8
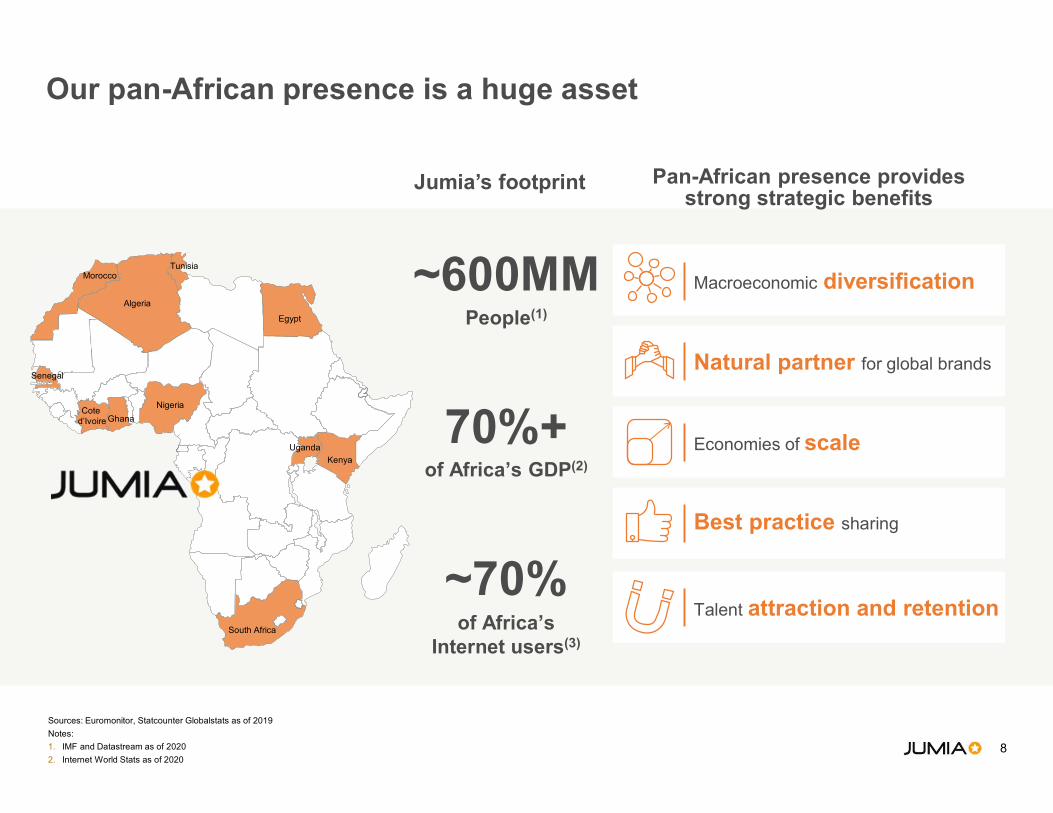
of Africa’s Internet users(3)
~70%
Our pan-African presence is a huge asset
Jumia’s footprint
of Africa’s GDP(2)
70%+
People(1)
~600MM
Sources: Euromonitor, Statcounter Globalstats as of 2019
Notes:
1. IMF and Datastream as of 2020
2. Internet World Stats as of 2020
Best practice sharing
Natural partner for global brands
Pan-African presence provides strong strategic benefits
Talent attraction and retention
Macroeconomic diversification
Economies of scale
Nigeria
South Africa
Kenya
Uganda
Egypt
Morocco
Algeria
GhanaCote
d’Ivoire
Tunisia
Senegal
9
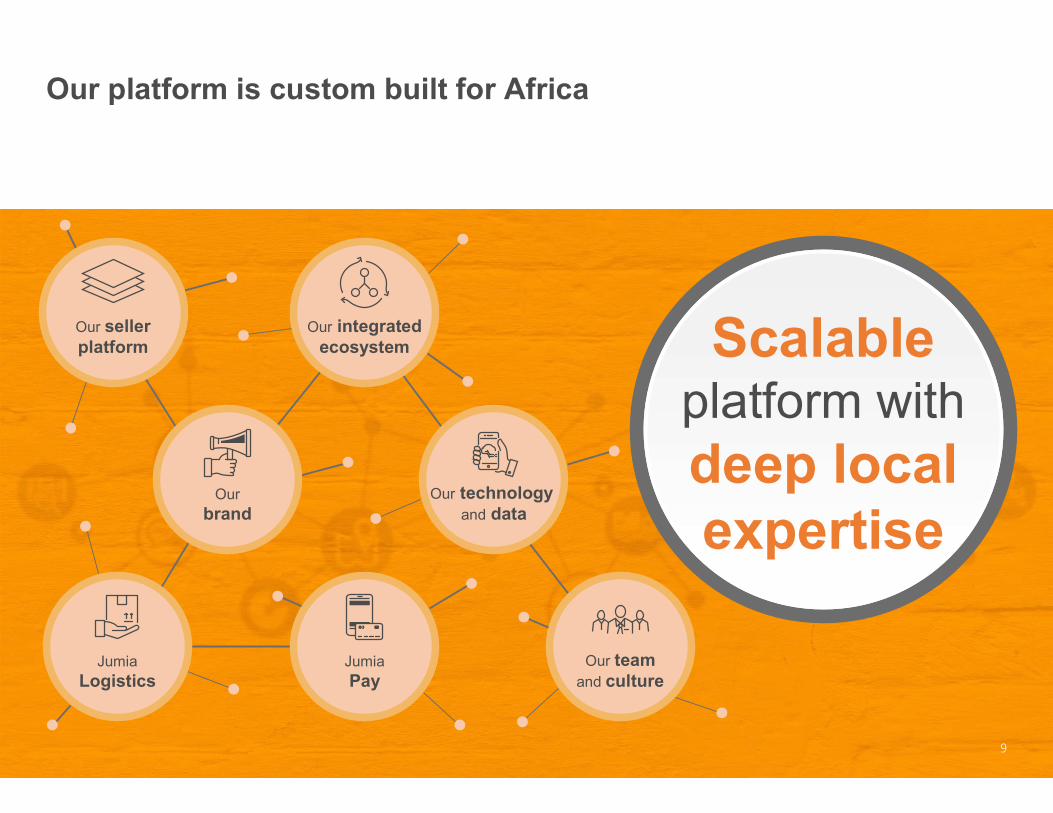
Our platform is custom built for Africa
9
Our sellerplatform
Ourbrand
JumiaLogistics
JumiaPay
Our teamand culture
Our technology and data
Our integratedecosystem Scalable
platform with deep local expertise
10
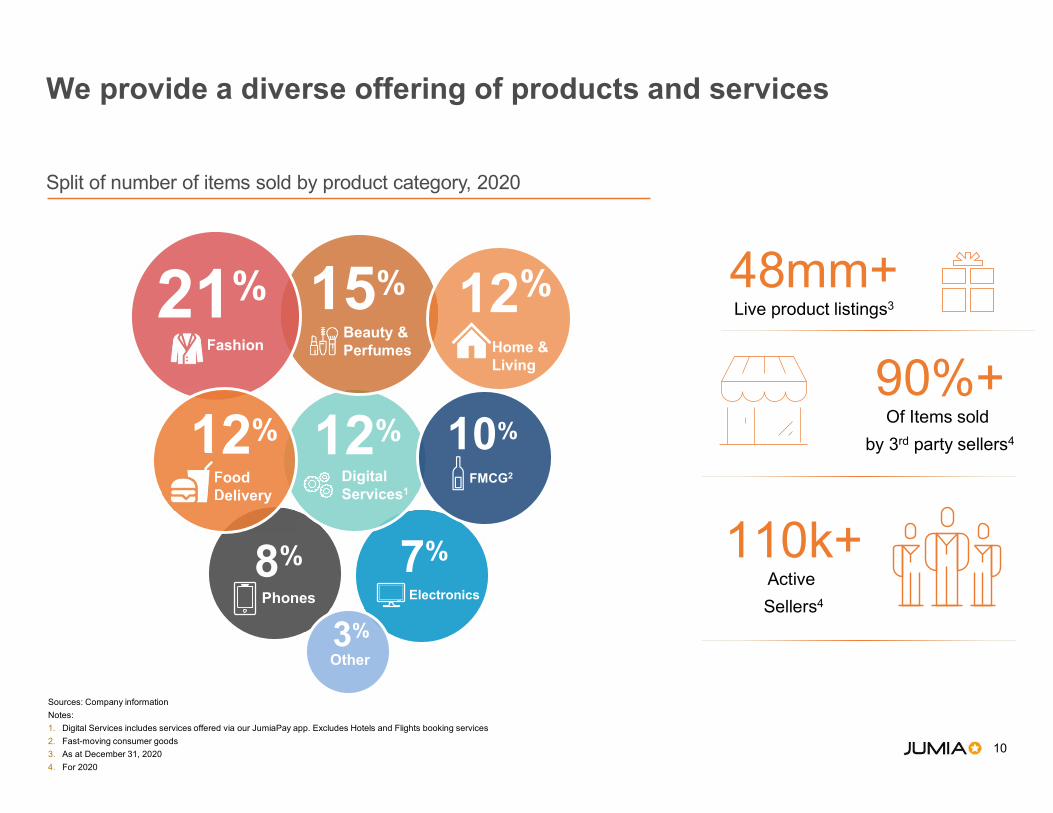
We provide a diverse offering of products and services
Split of number of items sold by product category, 2020
Sources: Company information
Notes:
1. Digital Services includes services offered via our JumiaPay app. Excludes Hotels and Flights booking services
2. Fast-moving consumer goods
3. As at December 31, 2020
4. For 2020
7%
Electronics
12%Digital Services1
Other3%
8%
Phones
10%
FMCG2
Beauty & Perfumes
15%21%Fashion
12%
Home & Living
12%
Food Delivery
110k+Active
Sellers4
48mm+Live product listings3
90%+Of Items sold
by 3rd party sellers4
11
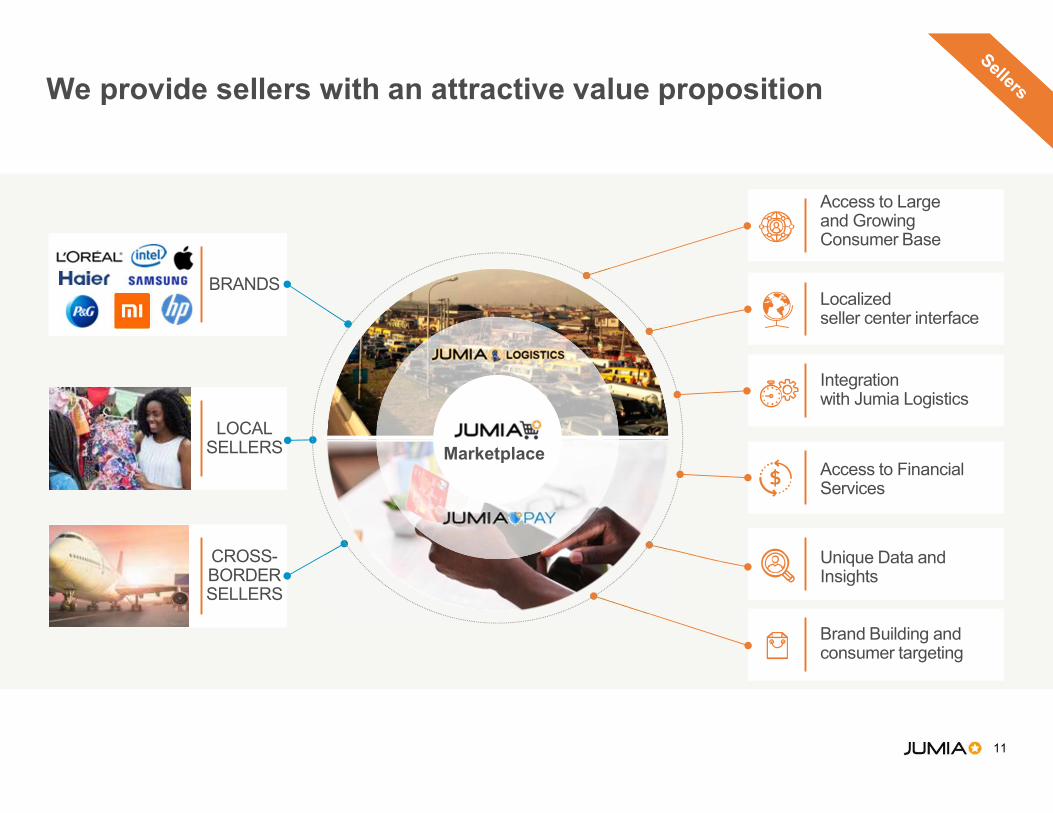
We provide sellers with an attractive value proposition
Local Language
Access to Large and Growing Consumer Base
Localized seller center interface
Integration with Jumia Logistics
Access to Financial Services
Unique Data and Insights
Brand Building and consumer targeting
Local Language
BRANDS
LOCAL SELLERS
CROSS-BORDER SELLERS
Marketplace
12
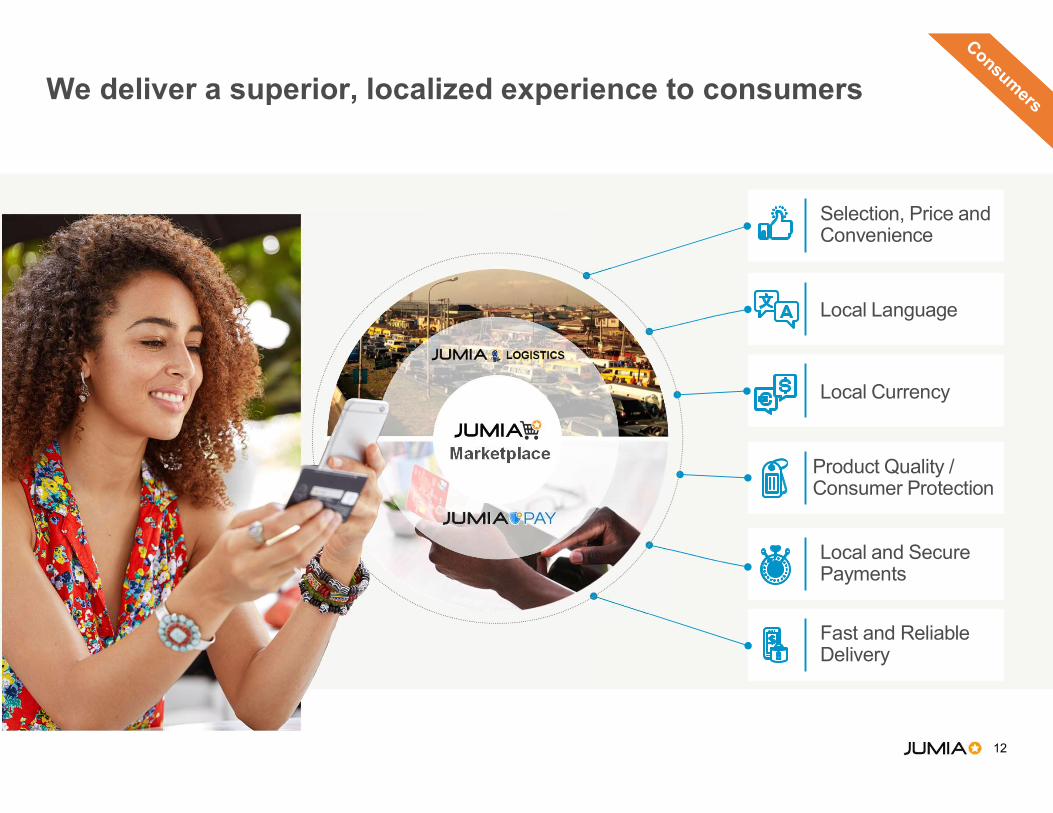
We deliver a superior, localized experience to consumers
Local Language
Selection, Price and Convenience
Local Language
Local Currency
Product Quality / Consumer Protection
Local and Secure Payments
Fast and Reliable Delivery
Marketplace

13
Our well-recognized and highly-trusted brand wins over African online shoppers
HIGH LOYALTYPREFERRED ONLINE
DESTINATIONTRUSTED BRAND
89% of Jumia shoppers would recommend
it to a friend
Sources: Sagaci Research Jumia brand surveys in Nigeria, Kenya, Morocco and Ivory Coast, February 2019. Company calculations based on an average of the total amount of respondents from each country
Notes:
1. % of online shoppers who bought on Jumia within the last 12 months prior to the survey date
78%of online shoppers
bought on Jumia over the last twelve months (1)
88% of Jumia shoppers over the last twelve months said they repurchased on Jumia over
the same period
14
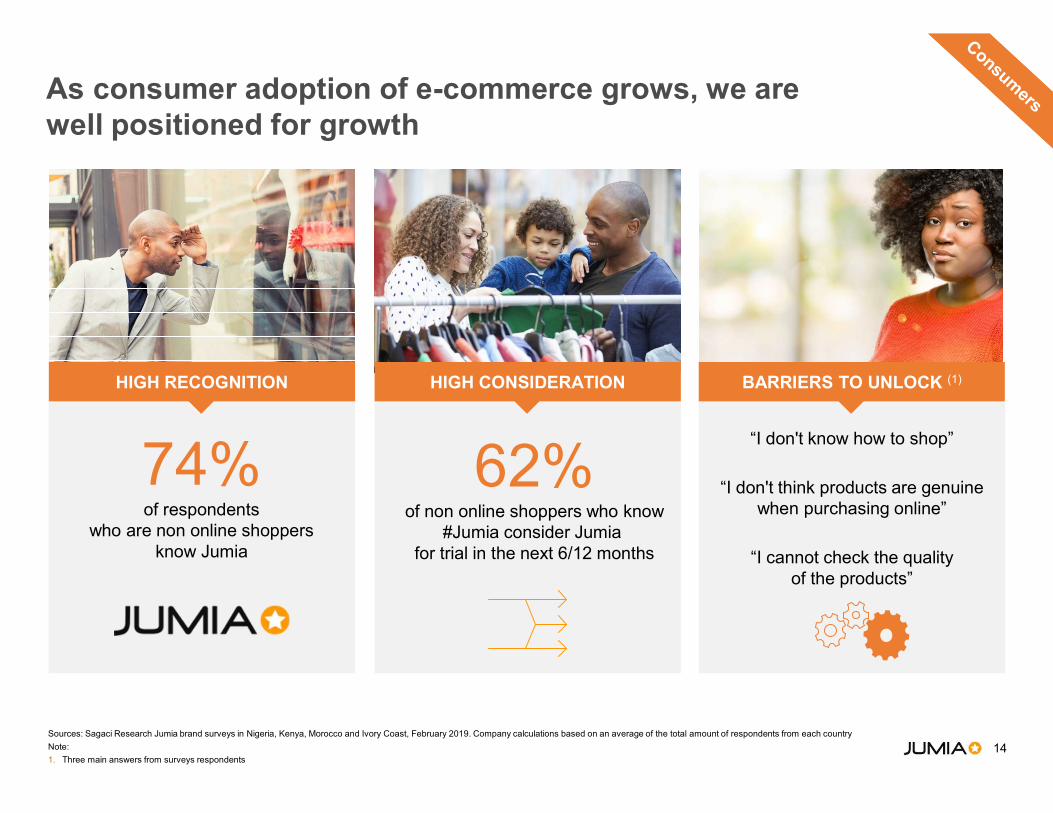
As consumer adoption of e-commerce grows, we are well positioned for growth
BARRIERS TO UNLOCK (1)
“I don't know how to shop”
“I don't think products are genuine when purchasing online”
“I cannot check the quality of the products”
Sources: Sagaci Research Jumia brand surveys in Nigeria, Kenya, Morocco and Ivory Coast, February 2019. Company calculations based on an average of the total amount of respondents from each country
Note:
1. Three main answers from surveys respondents
HIGH RECOGNITION
74%of respondents
who are non online shoppers know Jumia
HIGH CONSIDERATION
62%of non online shoppers who know
#Jumia consider Jumia for trial in the next 6/12 months

15
Jumia Logistics is a technology and data-driven answer to Africa’s logistics challenges
EXTENSIVE PARTNER NETWORK
POWERED BY JUMIA TECHNOLOGY
WIDE PHYSICAL PRESENCE
Logistics partners ranging from individual entrepreneurs to large companies
Broad set of proprietary data and technology tools
Seller drop-off network + warehousing facilities
+ consumer pick-up-stations

16
51%
27%
22%
Jumia Logistics is scalable, asset-light, and a key competitive barrier
WAREHOUSING INBOUND DELIVERIES PICKING & PACKING LAST-MILE & PAYMENT TRACKING RETURN HANDLING
SCALE
~24MMpackages1
5x peak volume
ASSET-LIGHT
4.7%PP&E of total
assets2
RuralAreas
PrimaryCities
Secondary Cities
3rd party monetization
potential
MONETIZATION
for 2020
Packages delivered per
region
OMNIPRESENCECONTROL
99.8%
of deliveries are controlled
by Jumia
Sources: Company information
Notes:
1. For the full year 2020
2. Calculated based on property, plant and equipment over Total assets as of December 31, 2020
3. For Jumia’s 5 biggest markets: Nigeria, Egypt, Kenya, Morocco and the Ivory Coast
17
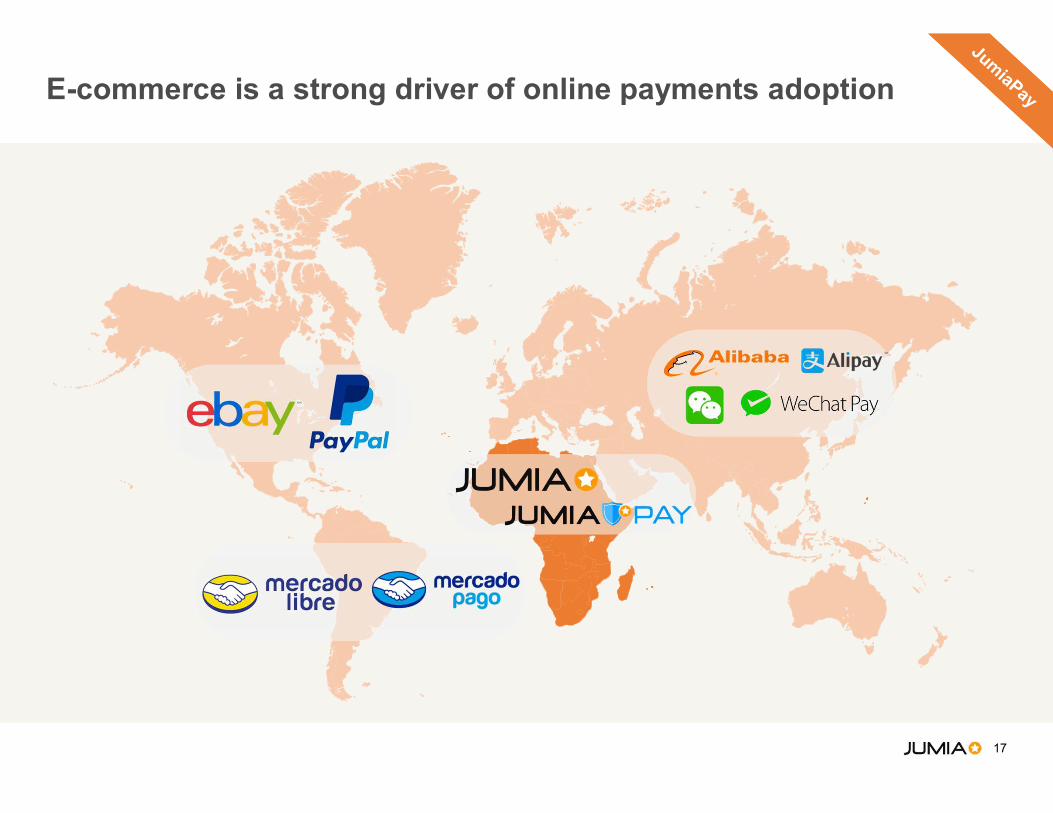
E-commerce is a strong driver of online payments adoption

18
Banks Cards
Mobile Money Money Transfers / Cash
JumiaPay is a uniquely-tailored payment solution for Africa
Sources: Company information
Multiple local payment methods Seamlessly integrated in the shopping experience
Dedicated payment app
“One-click” payment
High security
Preferred payment method at checkout
Cash back and promotions
JumiaPay Account
Access more digital services
Payment services
Access Jumia Services
19
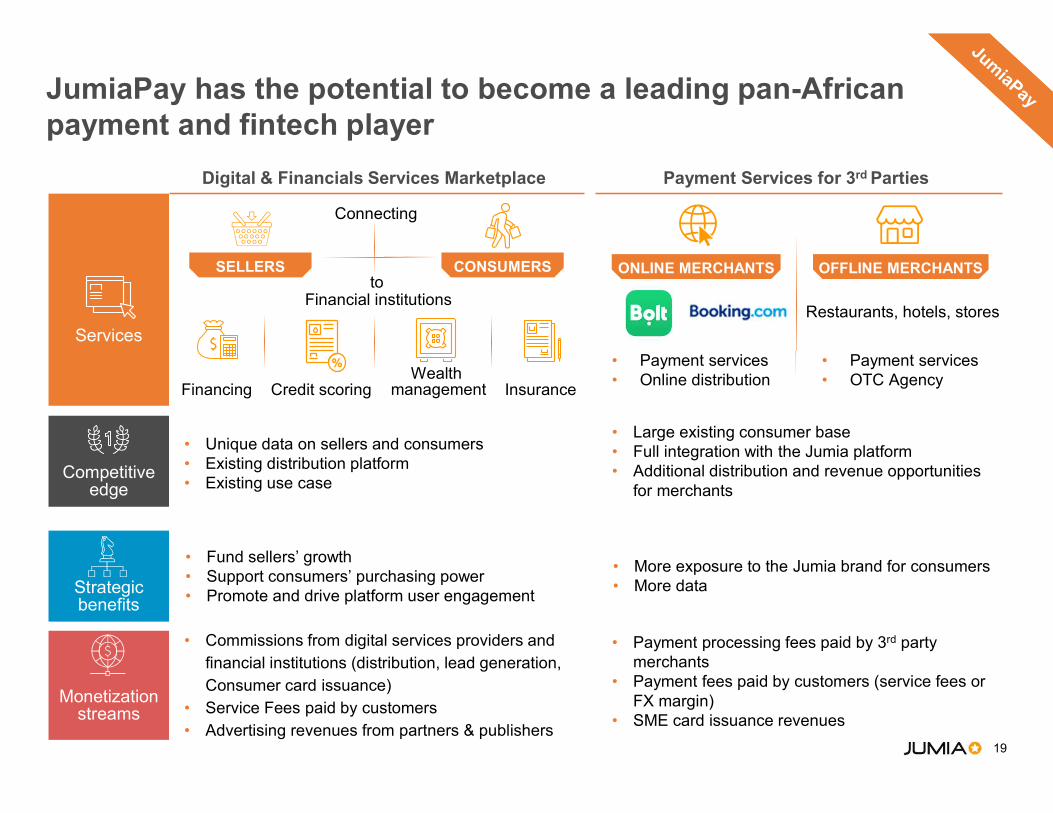
JumiaPay has the potential to become a leading pan-Africanpayment and fintech player
Services
Competitive edge
Strategic benefits
Monetization streams
Financial institutions
Credit scoringFinancingWealth
management Insurance
• Unique data on sellers and consumers• Existing distribution platform• Existing use case
• Fund sellers’ growth• Support consumers’ purchasing power• Promote and drive platform user engagement
• Commissions from digital services providers and financial institutions (distribution, lead generation, Consumer card issuance)
• Service Fees paid by customers • Advertising revenues from partners & publishers
Restaurants, hotels, stores
• Payment services• Online distribution
• Payment services• OTC Agency
• Large existing consumer base• Full integration with the Jumia platform• Additional distribution and revenue opportunities
for merchants
• More exposure to the Jumia brand for consumers• More data
• Payment processing fees paid by 3rd party merchants
• Payment fees paid by customers (service fees or FX margin)
• SME card issuance revenues
Digital & Financials Services Marketplace Payment Services for 3rd Parties
ONLINE MERCHANTS OFFLINE MERCHANTSto
Connecting
CONSUMERSSELLERS

20
A scalable and proprietary technology platform – custom-built for the needs of e-commerce in Africa
TECHNOLOGY PLATFORM
LogisticsPayments &
LendingConsumer
GrowthConsumer
EngagementShop
ManagementInfrastructure
Business Intelligence
Fleet Management Mobile Account Web & Native
Apps CRM System Merchandising System Single Sign-On Real-time
Reporting
3PL Integrations Payment Integration
Marketing Automation Loyalty Program Automated
PersonalizationJoint Consumer
Database Demand
Forecasting
Carrier Optimization Credit Scoring Attribution
Modeling Onsite Search Merchant Platform ERP Integration Data Science
platform
… … … … … … …
21
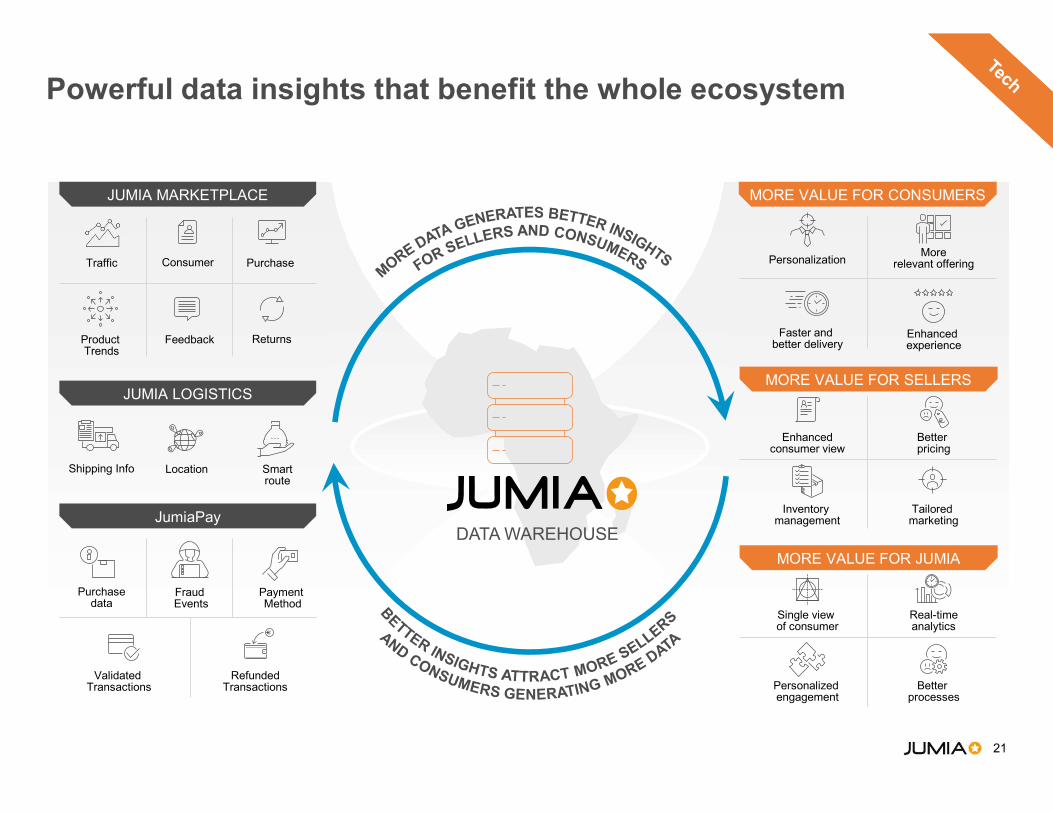
Powerful data insights that benefit the whole ecosystem
Better processes
Enhanced consumer view
Better pricing
Personalized engagement
JUMIA LOGISTICS
JumiaPay
Traffic Purchase
Product Trends
Feedback
Shipping Info Location Smartroute
Purchasedata
Fraud Events
Validated Transactions
RefundedTransactions
Payment Method
Consumer
Returns
JUMIA MARKETPLACE
MORE VALUE FOR JUMIA
MORE VALUE FOR CONSUMERS
MORE VALUE FOR SELLERS
Real-timeanalytics
Single view of consumer
PersonalizationMore
relevant offering
Faster and better delivery
Enhanced experience
Inventory management
Tailored marketing
DATA WAREHOUSE

22
Jumia overview
Q1.21 financial highlights
Appendix
Financials overview
23
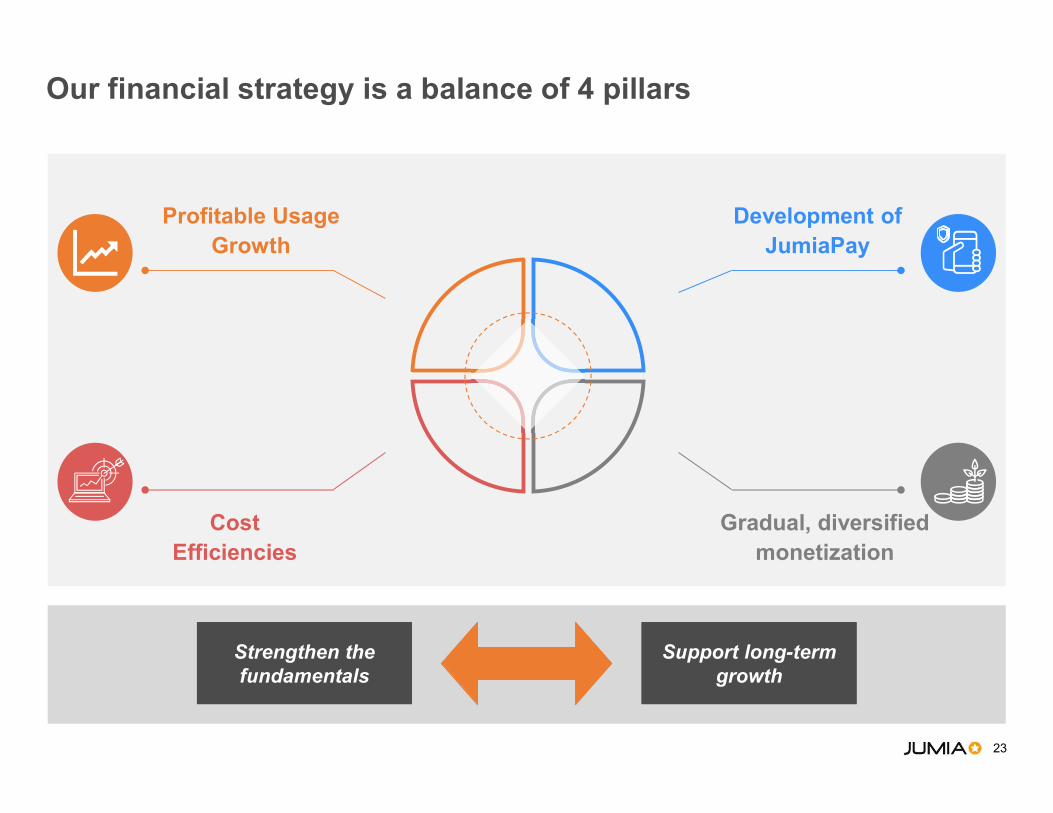
Our financial strategy is a balance of 4 pillars
Strengthen the fundamentals
Strengthen the fundamentals
Support long-term growth
Support long-term growth
Gradual, diversified monetization
Cost Efficiencies
Profitable Usage Growth
Development of JumiaPay

24
• Selective and disciplined usage growth
• Business mix rebalancing towards everyday product categories
• Strong growth of JumiaPay, now 26% of GMV and 37% of Orders
Our execution over the past 18 months has been focused on setting the business on a clear path towards breakeven
UsageGrowthUsageGrowth
• 6 consecutive quarters of positive Gross Profit after Fufillment expense
• 5 consecutive quarters of reducing Adjusted EBITDA loss year-over-year
• Multiple countries breakeven before G&A expenses1 for a number of quarters
ProfitabilityProfitability
Balance sheet
Balance sheet
• Successfully completed 2 offerings, raising $570mm+ of net proceeds
Notes:
1. Excluding share-based compensation
25
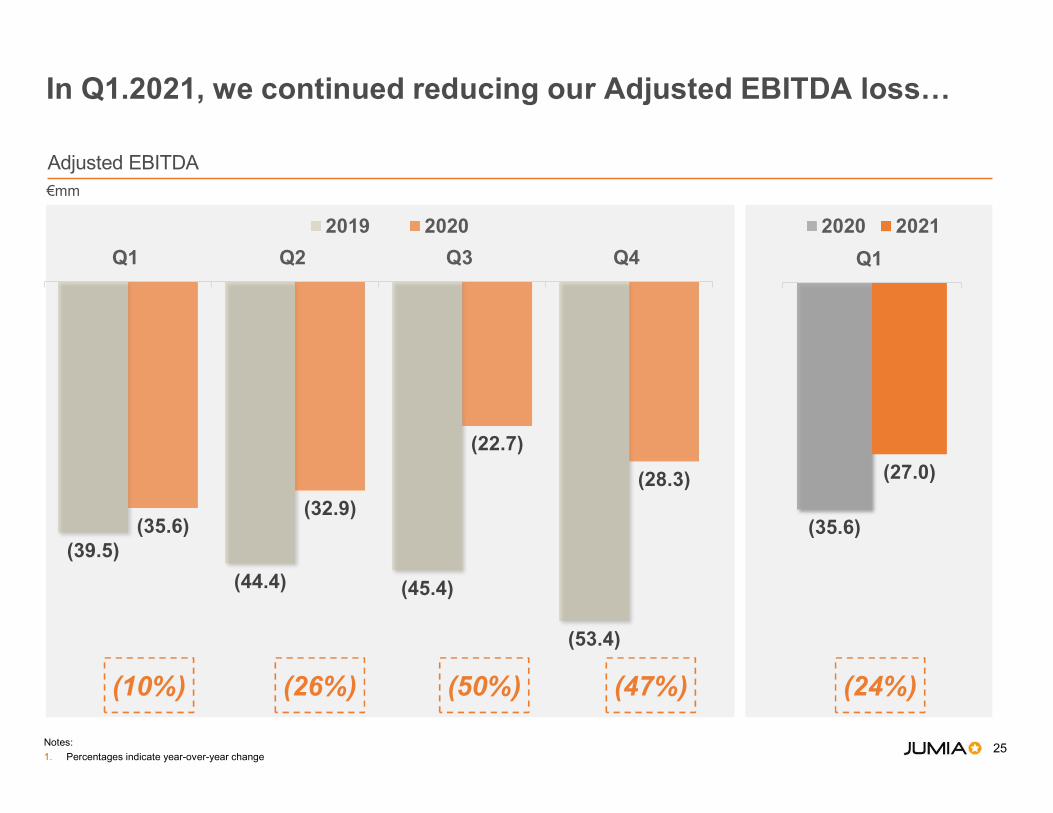
(39.5)
(44.4) (45.4)
(53.4)
(35.6)(32.9)
(22.7)
(28.3)
Q1 Q2 Q3 Q4
2019 2020
In Q1.2021, we continued reducing our Adjusted EBITDA loss…
Adjusted EBITDA€mm
(26%)(10%)
Notes:
1. Percentages indicate year-over-year change
(47%)(50%)
(35.6)
(27.0)
Q1
2020 2021
(24%)

26
…and our unit economics continued to improve as we drove smaller sized, more profitable orders
Q1 2019 Q1 2020 Q1 2021Q1 2021 vs
Q1 2020
Average Order Value (AOV1) €42.5 €29.5 €24.9 (16%)
Gross Profit / Order €3.0 €2.9 €3.1 +7%
As % of AOV 7.1% 9.7% 12.4% +266bps
Fulfilment expense / Order (€3.0) (€2.5) (€2.1) (13%)
Gross Profit after Fulfillment expense / Order €0.0 €0.4 €0.9 142%
S&A2 per Order (€2.4) (€1.4) (€1.2) (12%)
Gross Profit after Fulfillment and S&A expenses / Order
(€2.4) (€1.0) (€0.3) n.m.
Tech, G&A3 per Order (€5.8) (€4.9) (€4.1) (17%)
Adjusted EBITDA loss / Order (€7.9) (€5.6) (€4.1) (27%)
Notes:
1. Average Order Value calculated as GMV divided by number of Orders
2. Sales & Advertising expense
3. G&A, excluding SBC
27
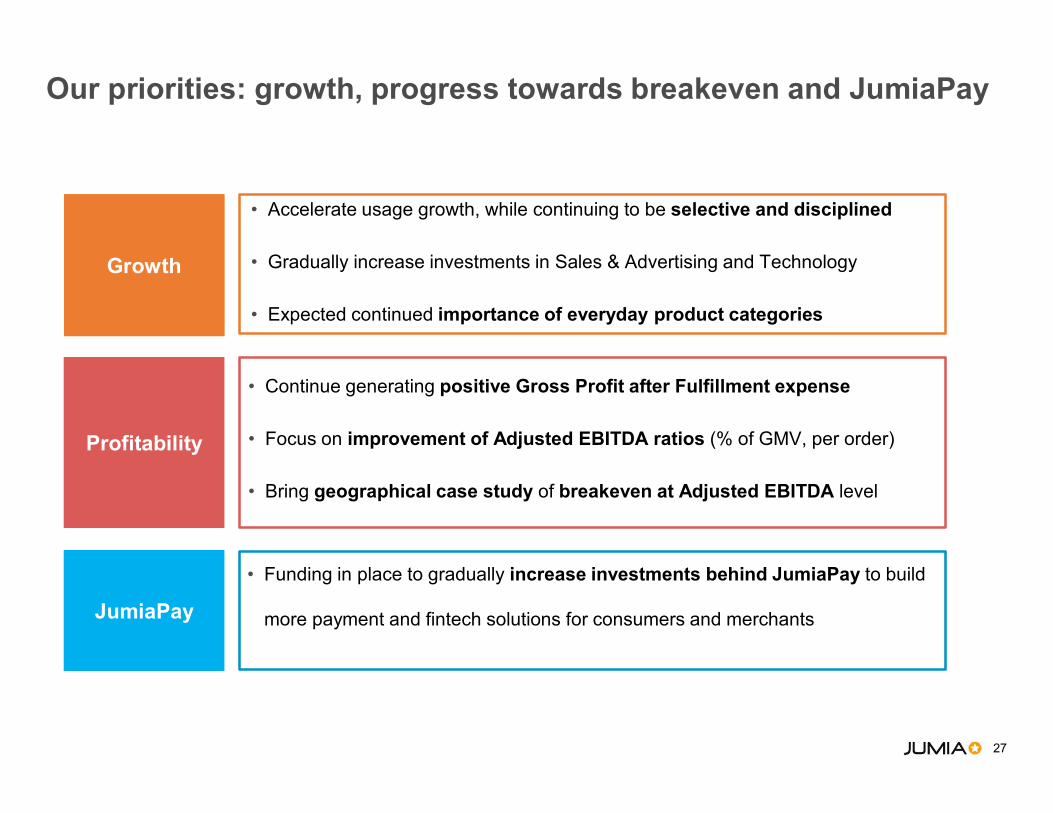
Our priorities: growth, progress towards breakeven and JumiaPay
GrowthGrowth
• Accelerate usage growth, while continuing to be selective and disciplined
• Gradually increase investments in Sales & Advertising and Technology
• Expected continued importance of everyday product categories
• Continue generating positive Gross Profit after Fulfillment expense
• Focus on improvement of Adjusted EBITDA ratios (% of GMV, per order)
• Bring geographical case study of breakeven at Adjusted EBITDA level
ProfitabilityProfitability
JumiaPayJumiaPay
• Funding in place to gradually increase investments behind JumiaPay to build
more payment and fintech solutions for consumers and merchants
28
Jumia overview
Q1.21 financial highlights
Appendix
Financials overview

29
8.2 4.6
(44)%
6.4 6.6
Q1 2020 Q1 2021
(13)%
GMV
€mm
Orders
€mm
189.6165.0
Q1 2020 Q1 2021
3%
Annual Active Consumers
€mm
6.4 6.9
Q1 2020 Q1 2021
7%
Sales & Advertising (“S&A”) expense
8.9 8.1
(9)%
1.4 1.2
(12)%
Annual S&A per Annual Active consumerS&A per Order
€mm € €
We are driving usage and consumer adoption at high levels of marketing efficiency
(5)%1
Notes:
1. On a constant currency basis, Q1 2021, GMV was down 5% year-over-year and Sales & Advertising expense down 1% on a year-over-year basis
(1)%1
30
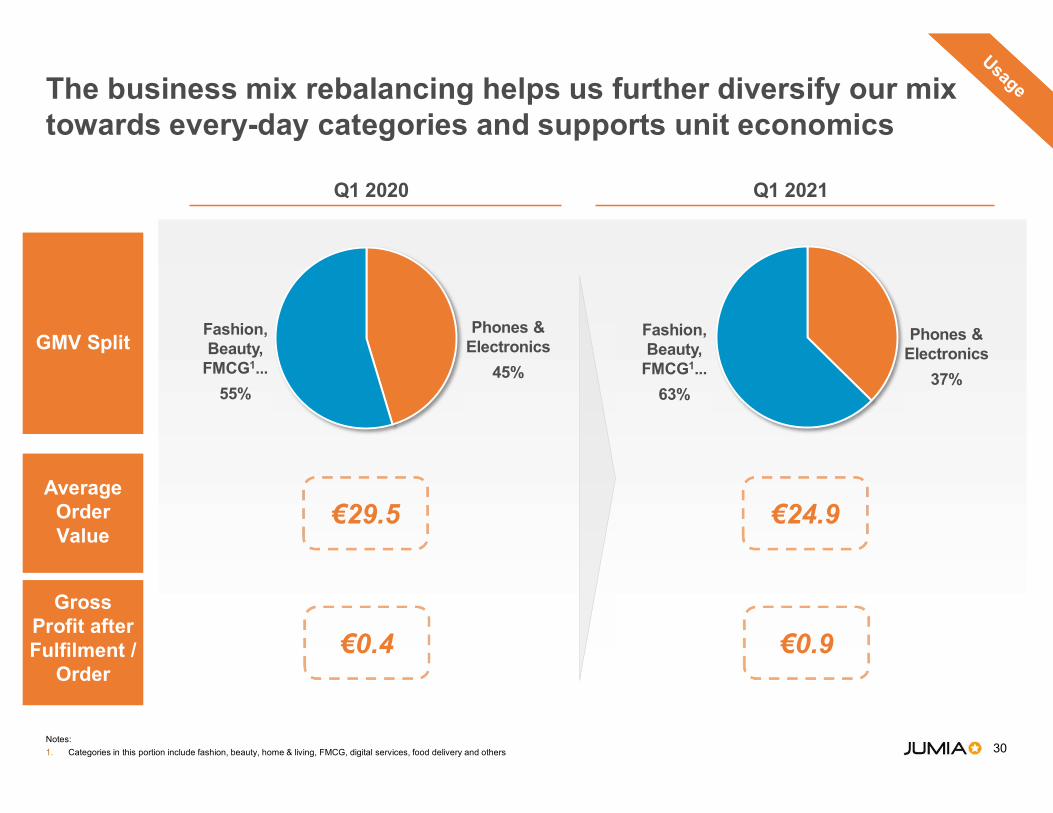
The business mix rebalancing helps us further diversify our mix towards every-day categories and supports unit economics
Q1 2020 Q1 2021
Notes:
1. Categories in this portion include fashion, beauty, home & living, FMCG, digital services, food delivery and others
Phones & Electronics
45%
Fashion, Beauty,
FMCG1...
55%
Phones & Electronics
37%
Fashion, Beauty,
FMCG1...
63%
€29.5 €24.9
€0.4 €0.9
GMV SplitGMV Split
Average Order Value
Average Order Value
Gross Profit after Fulfilment /
Order
Gross Profit after Fulfilment /
Order
31
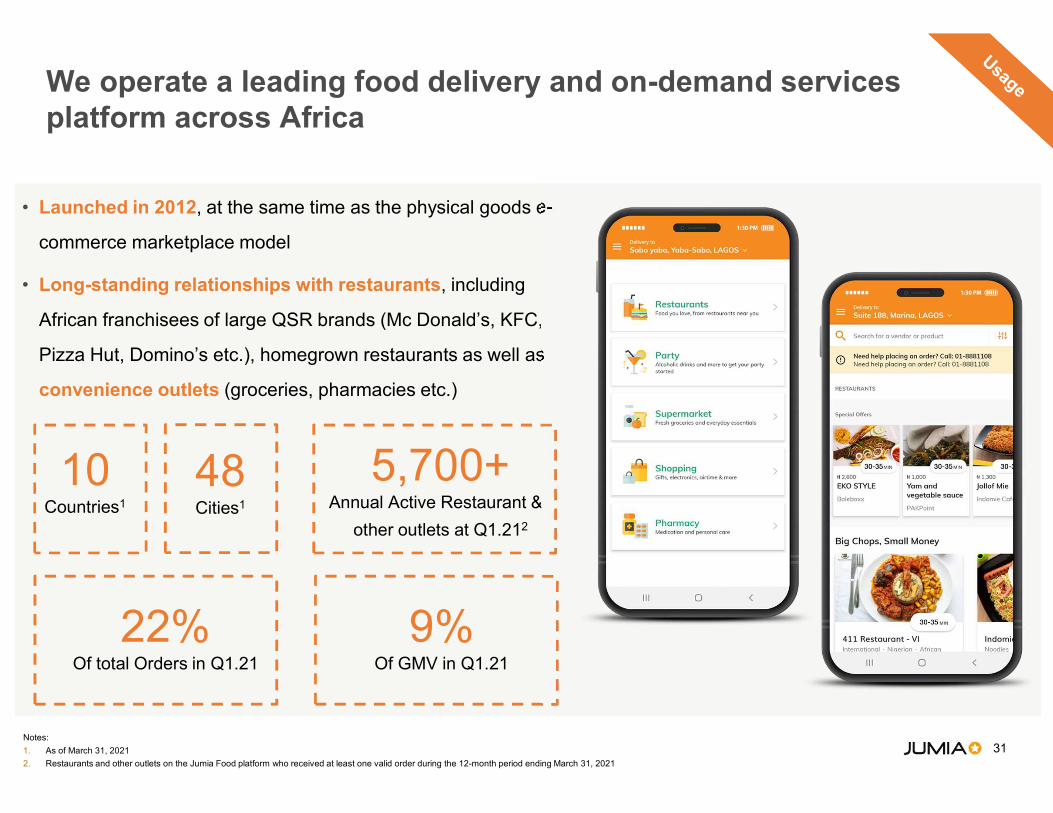
We operate a leading food delivery and on-demand services platform across Africa
• Launched in 2012, at the same time as the physical goods e-
commerce marketplace model
• Long-standing relationships with restaurants, including
African franchisees of large QSR brands (Mc Donald’s, KFC,
Pizza Hut, Domino’s etc.), homegrown restaurants as well as
convenience outlets (groceries, pharmacies etc.)
22%Of total Orders in Q1.21
10Countries1
5,700+Annual Active Restaurant &
other outlets at Q1.212
9%Of GMV in Q1.21
Notes:
1. As of March 31, 2021
2. Restaurants and other outlets on the Jumia Food platform who received at least one valid order during the 12-month period ending March 31, 2021
48Cities1
32
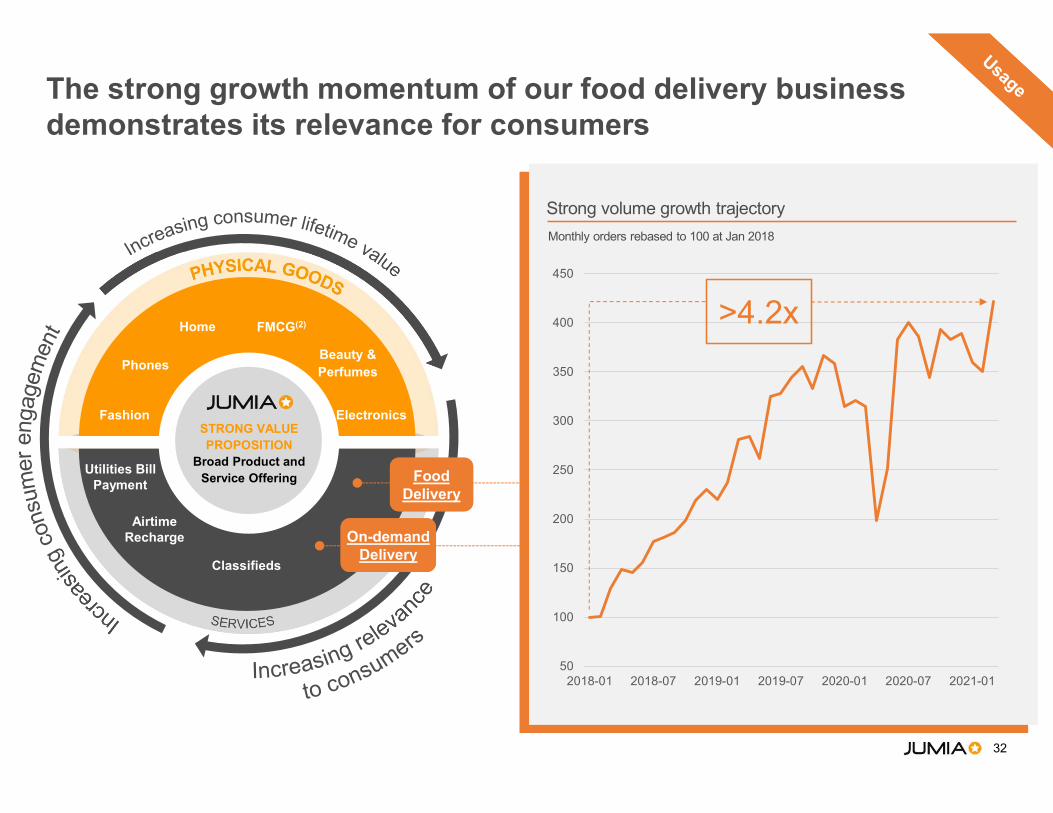
The strong growth momentum of our food delivery business demonstrates its relevance for consumers
Fashion
Phones
FMCG(2)
Electronics
Beauty &Perfumes
Utilities BillPayment
Home
Classifieds
STRONG VALUE PROPOSITION
Broad Product and Service Offering
AirtimeRecharge
50
100
150
200
250
300
350
400
450
2018-01 2018-07 2019-01 2019-07 2020-01 2020-07 2021-01
Strong volume growth trajectory
Monthly orders rebased to 100 at Jan 2018
>4.2x
FoodDelivery
FoodDelivery
On-demandDelivery
On-demandDelivery
FoodDelivery
On-demandDelivery

33
Our food delivery business is supported by dedicated on-demand logistics infrastructure
GROCERIES
FASHION
CORNER SHOP
PHARMACY
RESTAURANTS
DRINKS
• Delivery-enabled marketplace model – Food
delivery orders fulfilled using Jumia‘s on-demand logistics
infrastructure
• Asset light logistics – leveraging the fleet and
drivers of c. 140 third-party logistics partners
• Dedicated tech stack – suporting all on-demand
logistics workflows: restaurant/point-of-sale module for
order management, smart order assignment and delivery
associate scheduling, customer interface etc.
• Strong focus on customer experience and
convenience – average delivery time of 40.5
minutes in in the first quarter of 2021
• Synergies with the broader e-commerce
platform – developing a Q-commerce proposition to
deliver a broader range of everyday products in less than
60 minutes
34
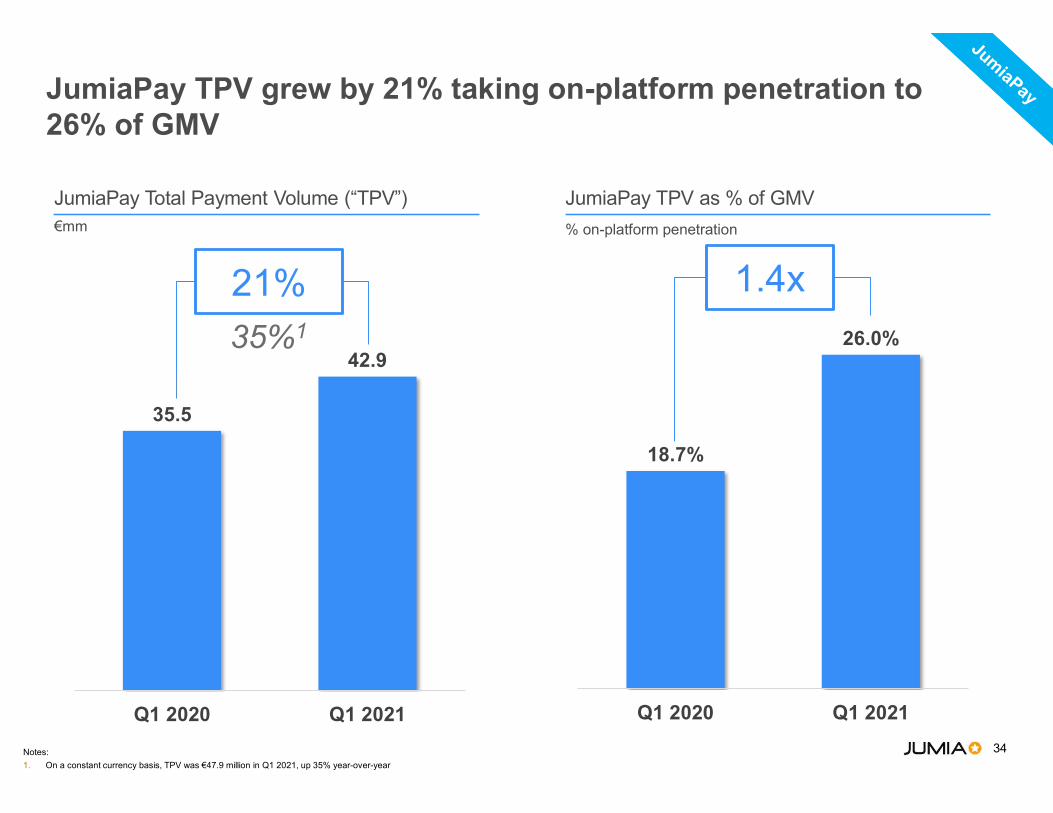
JumiaPay Total Payment Volume (“TPV”)€mm
JumiaPay TPV as % of GMV
21%
% on-platform penetration
1.4x
JumiaPay TPV grew by 21% taking on-platform penetration to 26% of GMV
35.5
42.9
Q1 2020 Q1 2021
18.7%
26.0%
Q1 2020 Q1 2021
35%1
Notes:
1. On a constant currency basis, TPV was €47.9 million in Q1 2021, up 35% year-over-year
35
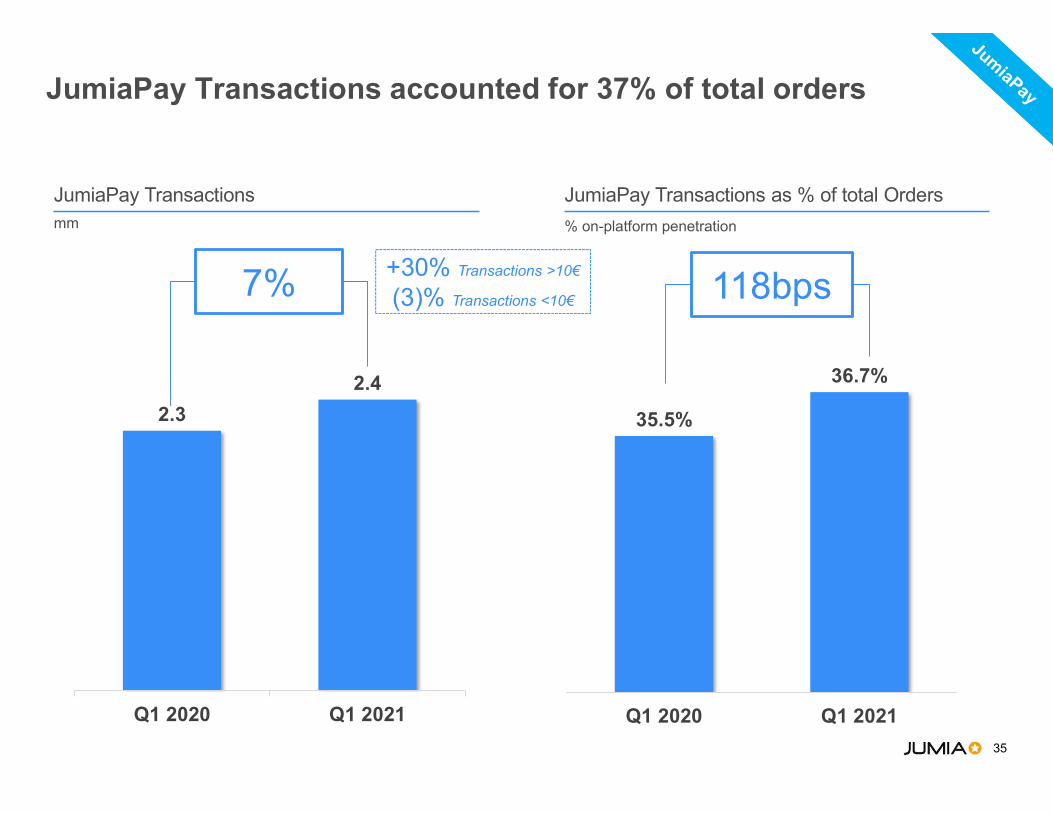
7%
JumiaPay Transactions accounted for 37% of total orders
2.3
2.4
Q1 2020 Q1 2021
118bps
JumiaPay Transactionsmm
JumiaPay Transactions as % of total Orders
% on-platform penetration
+30% Transactions >10€
(3)% Transactions <10€
35.5%
36.7%
Q1 2020 Q1 2021
36
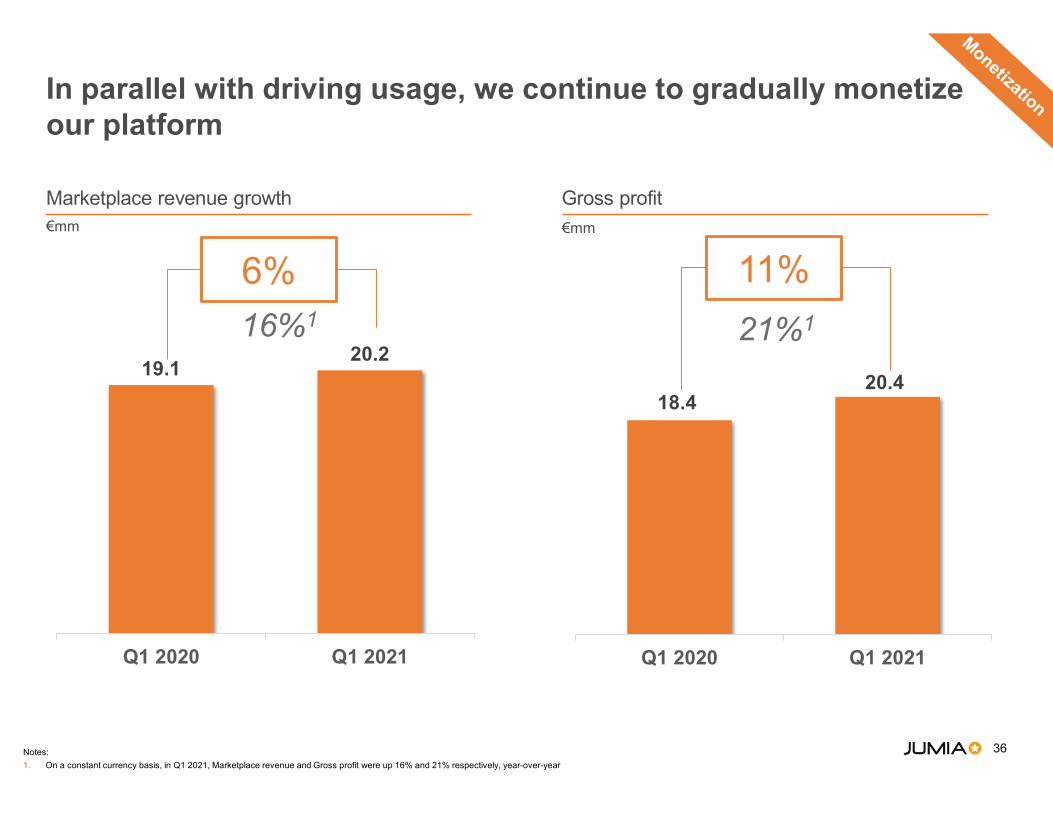
Marketplace revenue growth €mm
Gross profit
6%€mm
11%
In parallel with driving usage, we continue to gradually monetize our platform
19.120.2
Q1 2020 Q1 2021
18.4 20.4
Q1 2020 Q1 2021
21%116%1
Notes:
1. On a constant currency basis, in Q1 2021, Marketplace revenue and Gross profit were up 16% and 21% respectively, year-over-year
37
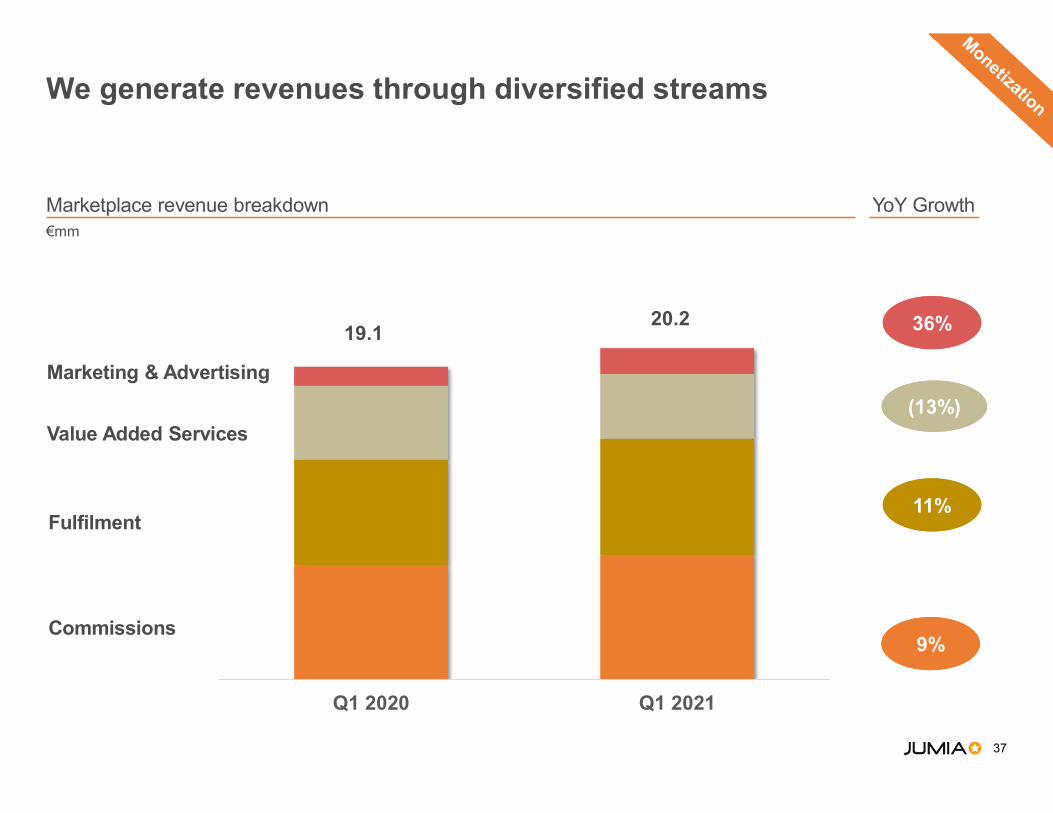
We generate revenues through diversified streams
Marketplace revenue breakdown€mm
YoY Growth
(13%)(13%)
36%36%
11%11%
9%9%
Marketing & Advertising
Value Added Services
Fulfilment
Commissions
Q1 2020 Q1 2021
19.120.2
38
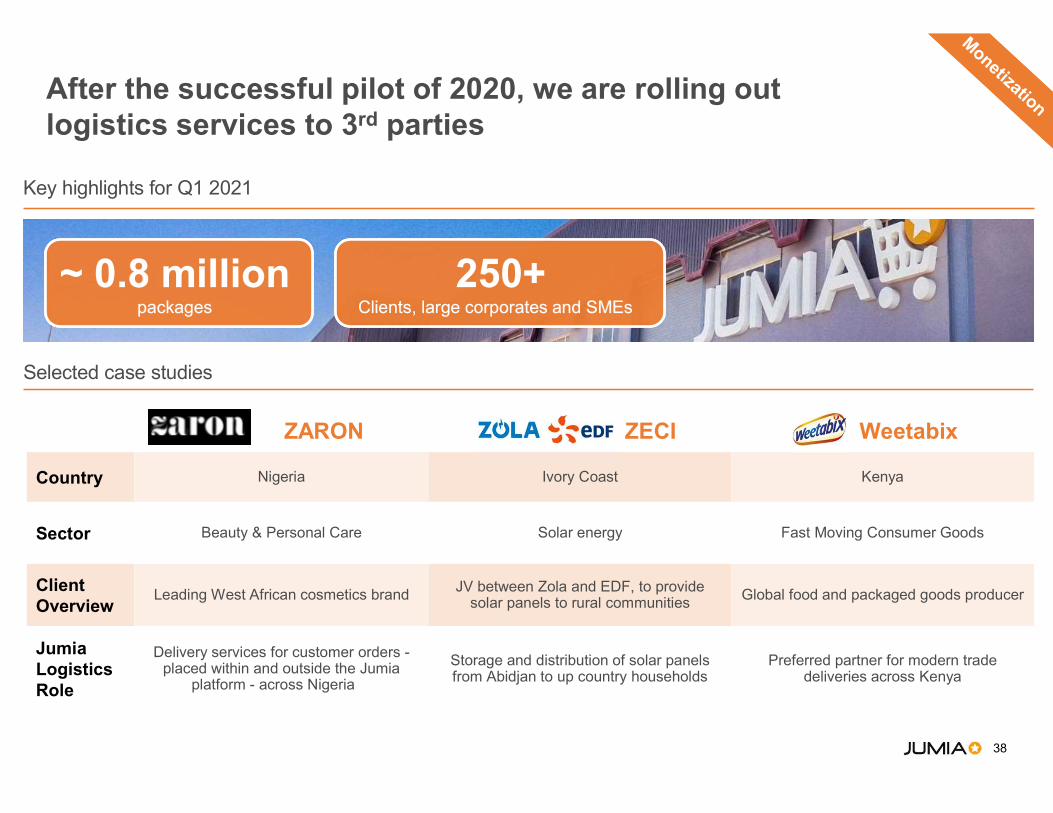
After the successful pilot of 2020, we are rolling out logistics services to 3rd parties
~ 0.8 million packages
~ 0.8 million packages
Key highlights for Q1 2021
250+Clients, large corporates and SMEs
250+Clients, large corporates and SMEs
Selected case studies
ZARON ZECI Weetabix
Country Nigeria Ivory Coast Kenya
Sector Beauty & Personal Care Solar energy Fast Moving Consumer Goods
Client Overview
Leading West African cosmetics brand JV between Zola and EDF, to provide solar panels to rural communities Global food and packaged goods producer
Jumia Logistics Role
Delivery services for customer orders -placed within and outside the Jumia
platform - across Nigeria
Storage and distribution of solar panels from Abidjan to up country households
Preferred partner for modern trade deliveries across Kenya

39
20.418.4
Gross Profit after Fulfillment expense increased by a factor of 2.5x
Q1 2020 Q1 2021
Gross Profit
Fulfillment expense
Gross Profit after Fulfillment expense
(14.2)(15.9)
€mm
6.2
€mm
2.5
We have now been generating positive Gross Profit after Fulfillment expense for 6 consecutive quarters
40
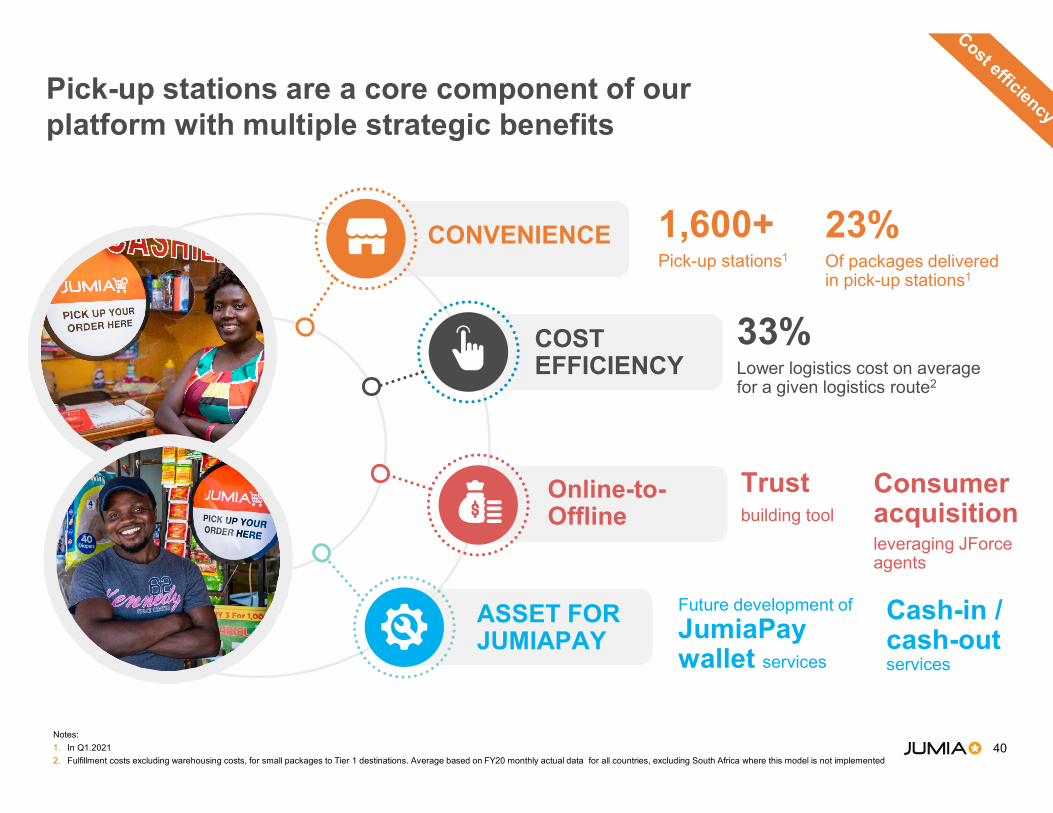
Pick-up stations are a core component of our platform with multiple strategic benefits
Notes:
1. In Q1.2021
2. Fulfillment costs excluding warehousing costs, for small packages to Tier 1 destinations. Average based on FY20 monthly actual data for all countries, excluding South Africa where this model is not implemented
CONVENIENCE
COST EFFICIENCY
Online-to-Offline
ASSET FOR JUMIAPAY
1,600+Pick-up stations1
23%Of packages delivered in pick-up stations1
Trustbuilding tool
Consumer acquisition leveraging JForceagents
33%Lower logistics cost on average for a given logistics route2
Future development of
JumiaPay wallet services
Cash-in / cash-out services
41
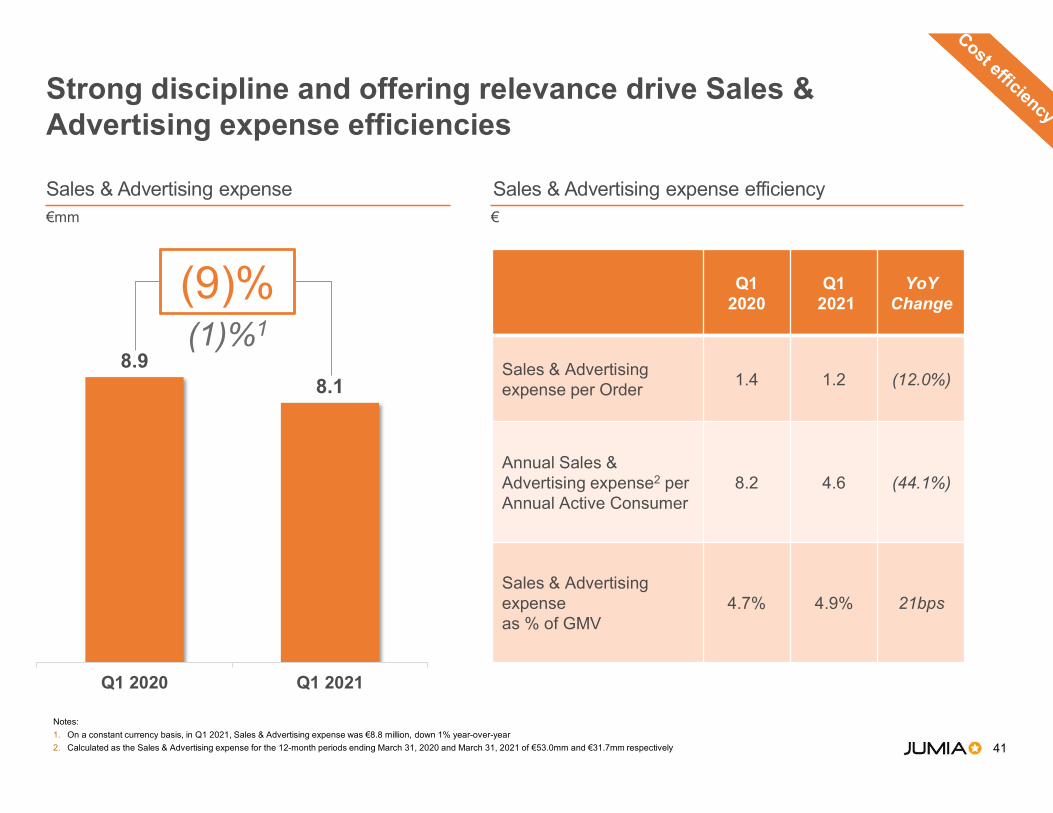
Sales & Advertising expense€mm
Sales & Advertising expense efficiency
(9)%
Strong discipline and offering relevance drive Sales & Advertising expense efficiencies
8.98.1
Q1 2020 Q1 2021
Q1 2020
Q12021
YoY Change
Sales & Advertising expense per Order
1.4 1.2 (12.0%)
Annual Sales & Advertising expense2 per Annual Active Consumer
8.2 4.6 (44.1%)
Sales & Advertising expense as % of GMV
4.7% 4.9% 21bps
Notes:
1. On a constant currency basis, in Q1 2021, Sales & Advertising expense was €8.8 million, down 1% year-over-year
2. Calculated as the Sales & Advertising expense for the 12-month periods ending March 31, 2020 and March 31, 2021 of €53.0mm and €31.7mm respectively
€
(1)%1
42
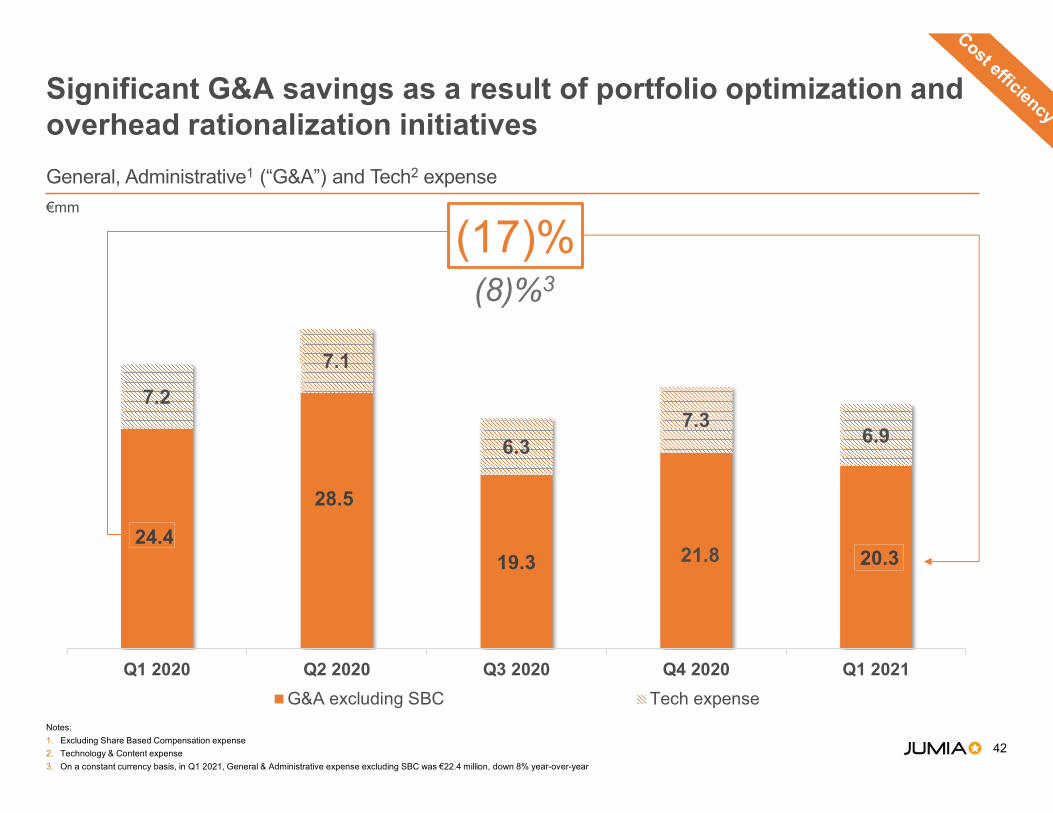
Significant G&A savings as a result of portfolio optimization and overhead rationalization initiatives
General, Administrative1 (“G&A”) and Tech2 expense
€mm
(17)%
24.4
28.5
19.3 20.3
7.2
7.1
6.37.3
6.9
Q1 2020 Q2 2020 Q3 2020 Q4 2020 Q1 2021
G&A excluding SBC Tech expense
Notes:
1. Excluding Share Based Compensation expense
2. Technology & Content expense
3. On a constant currency basis, in Q1 2021, General & Administrative expense excluding SBC was €22.4 million, down 8% year-over-year
21.8
(8)%3

43
We continue to pursue an asset-light strategy and had a cash balance of €486mm at the end of Q1 2021
ASSET-LIGHT AND CAPEX
LIGHT
CAPEX1 Q1 2021
€0.4mm€0.4mm
CASH UTILIZATION3
Cash used in operating and investing activities in Q1 2021€29.7mm€29.7mm
NEUTRAL WORKING CAPITAL DYNAMICS
Net change in Working Capital2
Q1 2021
€(5.1)mm€(5.1)mm CASH AVAILABLE4€485.6mm€485.6mm
Notes
1. Corresponds to Purchase of Property and Equipment and Intangible assets, as presented on the Cash Flow Statement
2. Corresponds to a cash outflow of € (5.1) mm
3. Net cash used in operating and investing activities. Excludes cash from financing activities and effects of exchange rate changes on cash and cash equivalents
4. Includes €205mm of gross proceeds from the offering completed in March 2021, with a remaining €88 million of cash booked in April 2021

44
Our priorities: growth, progress towards breakeven and JumiaPay
GrowthGrowth
• Accelerate usage growth, while continuing to be selective and disciplined
• Gradually increase investments in Sales & Advertising and Technology
• Expected continued importance of everyday product categories
• Continue generating positive Gross Profit after Fulfillment expense
• Focus on improvement of Adjusted EBITDA ratios (% of GMV, per order)
• Bring geographical case study of breakeven at Adjusted EBITDA level
ProfitabilityProfitability
JumiaPayJumiaPay
• Funding in place to gradually increase investments behind JumiaPay to build
more payment and fintech solutions for consumers and merchants

45
Jumia overview
Q1.21 financial highlights
Appendix
Financials overview
46
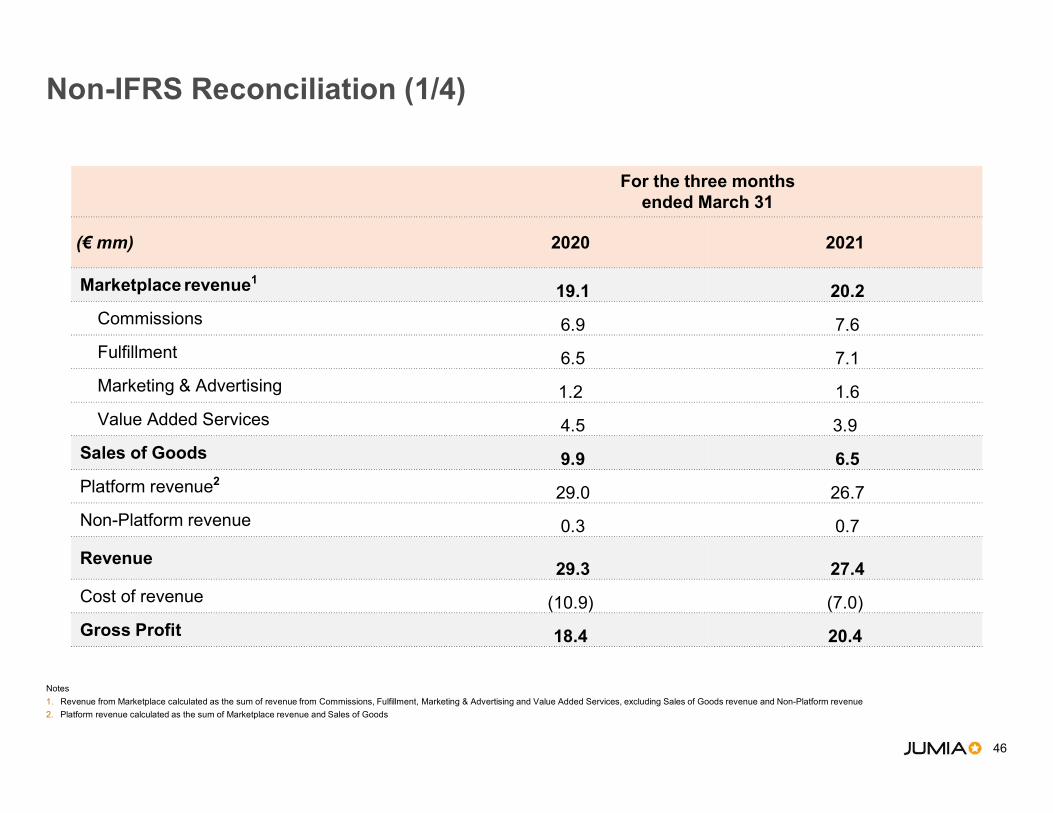
Non-IFRS Reconciliation (1/4)
For the three months ended March 31
(€ mm) 2020 2021
Marketplace revenue119.1 20.2
Commissions 6.9 7.6
Fulfillment 6.5 7.1
Marketing & Advertising 1.2 1.6
Value Added Services 4.5 3.9
Sales of Goods 9.9 6.5
Platform revenue229.0 26.7
Non-Platform revenue 0.3 0.7
Revenue 29.3 27.4
Cost of revenue (10.9) (7.0)
Gross Profit 18.4 20.4
Notes
1. Revenue from Marketplace calculated as the sum of revenue from Commissions, Fulfillment, Marketing & Advertising and Value Added Services, excluding Sales of Goods revenue and Non-Platform revenue
2. Platform revenue calculated as the sum of Marketplace revenue and Sales of Goods
47
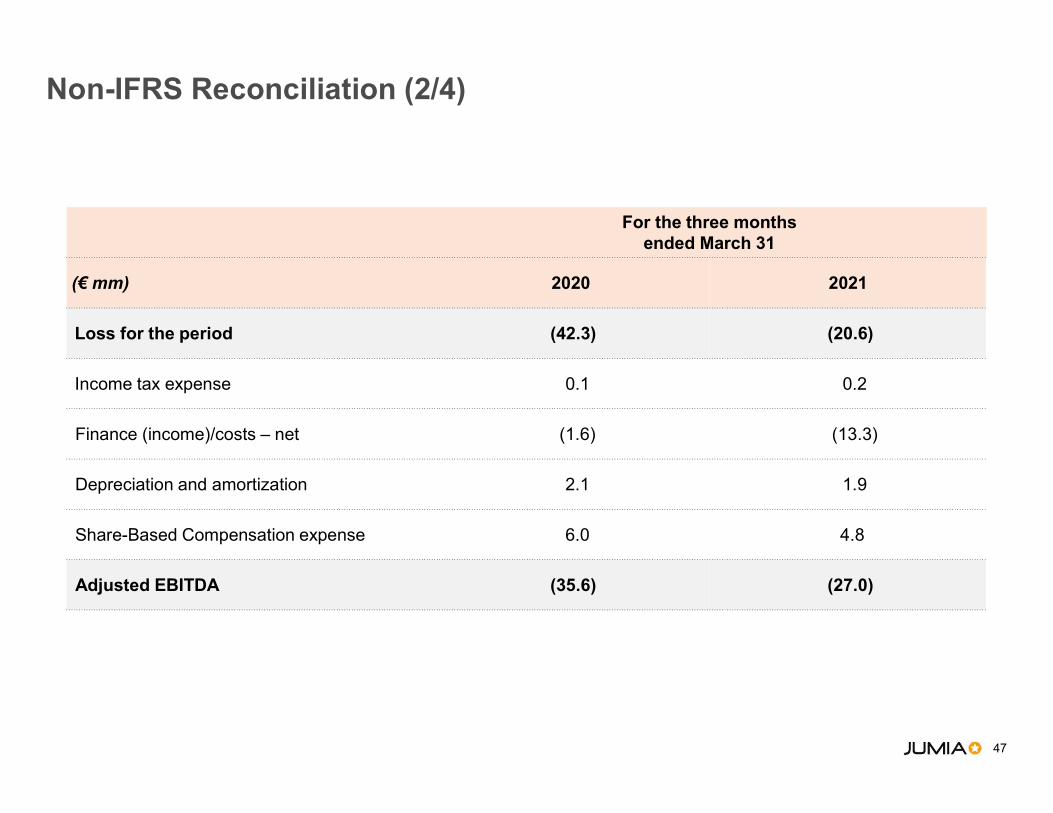
Non-IFRS Reconciliation (2/4)
For the three months ended March 31
(€ mm) 2020 2021
Loss for the period (42.3) (20.6)
Income tax expense 0.1 0.2
Finance (income)/costs – net (1.6) (13.3)
Depreciation and amortization 2.1 1.9
Share-Based Compensation expense 6.0 4.8
Adjusted EBITDA (35.6) (27.0)
48
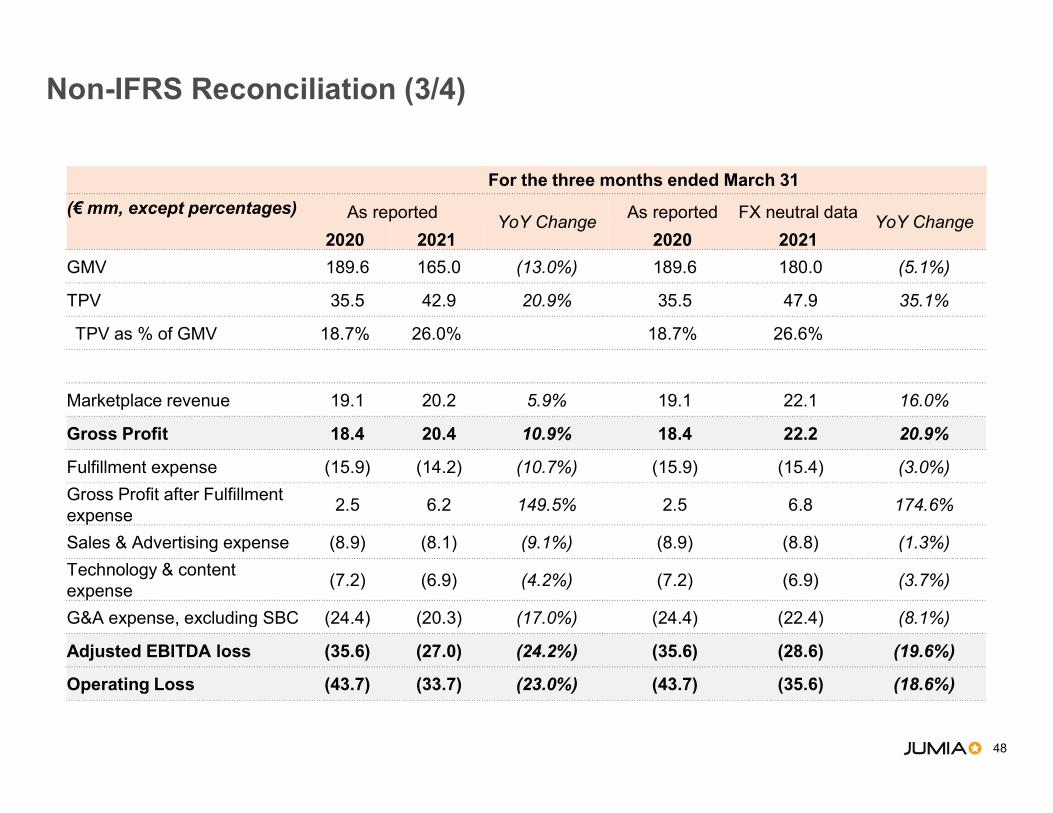
Non-IFRS Reconciliation (3/4)
For the three months ended March 31
(€ mm, except percentages) As reported YoY Change
As reported FX neutral data YoY Change
2020 2021 2020 2021
GMV 189.6 165.0 (13.0%) 189.6 180.0 (5.1%)
TPV 35.5 42.9 20.9% 35.5 47.9 35.1%
TPV as % of GMV 18.7% 26.0% 18.7% 26.6%
Marketplace revenue 19.1 20.2 5.9% 19.1 22.1 16.0%
Gross Profit 18.4 20.4 10.9% 18.4 22.2 20.9%
Fulfillment expense (15.9) (14.2) (10.7%) (15.9) (15.4) (3.0%)
Gross Profit after Fulfillment expense
2.5 6.2 149.5% 2.5 6.8 174.6%
Sales & Advertising expense (8.9) (8.1) (9.1%) (8.9) (8.8) (1.3%)
Technology & content expense
(7.2) (6.9) (4.2%) (7.2) (6.9) (3.7%)
G&A expense, excluding SBC (24.4) (20.3) (17.0%) (24.4) (22.4) (8.1%)
Adjusted EBITDA loss (35.6) (27.0) (24.2%) (35.6) (28.6) (19.6%)
Operating Loss (43.7) (33.7) (23.0%) (43.7) (35.6) (18.6%)

49
Non-IFRS Reconciliation (4/4)
For the full year ended December 31
(€ mm, except percentages) As reported YoY Change
As reported FX neutral data YoY Change
2019 2020 2019 2020
GMV 1,030.9 836.5 (18.9)% 1,030.9 861.5 (16.4)%
TPV 124.3 196.4 58.0% 124.3 203.6 63.8%
TPV as % of GMV 12.1% 23.5% 12.1% 23.6%
Gross Profit 75.9 92.8 22.3% 75.9 96.3 26.9%
Fulfillment expense (77.4) (69.3) (10.4)% (77.4) (71.6) (7.5)%
Sales & Advertising expense (56.0) (32.5) (42.0)% (56.0) (33.0) (41.2)%
G&A expense, excluding SBC (107.3) (94.0) (12.3)% (107.3) (97.9) (8.7)%
Adjusted EBITDA loss (182.7) (119.5) (34.6)% (182.7) (122.5) (32.9)%
Operating Loss (227.9) (149.2) (34.5)% (227.9) (152.5) (33.1)%

50
2020 Overview
1. Adjusted for perimeter changes and improper sales practices
Eur mm unless stated otherwiseFY 2018 FY 2019 FY 2020
Marketplace KPIs
GMV 749.51 1,030.91 836.5
Annual Active Consumers (mm) 4.0 6.1 6.8
Orders (mm) 14.4 26.5 27.9
JumiaPay KPIs
JumiaPay TPV 54.8 124.3 196.4
% on-platform penetration 7.3% 12.1% 23.5%
JumiaPay Transactions 2.0 7.6 9.6
% on-platform penetration 13.9% 28.7% 34.5%
Selected Financials
Gross profit 44.2 75.9 92.8
Fulfillment expense (50.5) (77.4) (69.3)
Gross profit after fulfillment expense (6.3) (1.5) 23.5
Sales & Advertising expense (46.0) (56.0) (32.5)
Technology & Content expense (22.4) (27.3) (27.8)
G&A ex SBC (77.5) (107.3) (94.0)
Adjusted EBITDA loss (150.2) (182.7) (119.5)
Operating loss (169.7) (227.9) (149.2)

51
Metrics definitions
• “Gross Merchandise Value”, or “GMV”, corresponds to the total value of orders for products and services including shipping fees, value-
added tax, and before deductions of any discounts or vouchers, irrespective of cancellations or returns
• “Orders” corresponds to the total number of orders for products and services on our platform, irrespective of cancellations or returns
• “Annual Active Consumers” corresponds to unique consumers who placed an order for a product or a service on our platform, within the
12-month period preceding the relevant date, irrespective of cancellations or returns
• “Total Payment Volume”, or “TPV” corresponds to the total value of orders for products and services for which JumiaPay was used
including shipping fees, value-added tax, and before deductions of any discounts or vouchers, irrespective of cancellations or returns, for
the relevant period
• “JumiaPay Transactions” corresponds to the total number of orders for products and services on our marketplace for which JumiaPay
was used, irrespective of cancellations or returns, for the relevant period
• “Adjusted EBITDA” corresponds to loss for the period, adjusted for income tax expense, finance income, finance costs, depreciation and
amortization and further adjusted for Share Based Compensation expense

![Grundlagenstudie Credit-Research Financials 6.2.2020 · :lfkwlj %lwwh ohvhq 6lh glh +lqzhlvh ]x p|jolfkhq ,qwhuhvvhqnrqiolnwhq xqg glh uhfkwolfkhq +lqzhlvh dp (qgh glhvhu 6wxglh )lqdqfldov](https://img.pdfslide.us/doc/110x75/605b42ba6f779d468477d02c/grundlagenstudie-credit-research-financials-622020-lfkwlj-lwwh-ohvhq-6lh-glh.jpg)


![EUTI Raportointikoulutus 6.5.2020 Final.pptx [Vain luku] · 977 ±eh\rqg wkh reylrxv )lqdqfldo uhsruw d µvxppdu\ ilqdqfldo vwdwhphqw¶ fuhdwhg dxwrpdwlfdoo\ e\ wkh hohfwurqlf h[fkdqjh](https://img.pdfslide.us/doc/110x75/5ff88289efdec674e4044763/euti-raportointikoulutus-652020-finalpptx-vain-luku-977-ehrqg-wkh-reylrxv.jpg)


![MT3620 M4 User Manual - d86o2zu8ugzlg.cloudfront.netkwwsv grfv plfurvriw frp hq fd d]xuh vskhuh txlfnvwduwv tv ryhuylhz 6: 'hyhorsphqw o $]xuh 6skhuh dssolfdwlrqv ryhuylhz kwwsv grfv](https://img.pdfslide.us/doc/110x75/5e5215b9165fa163fb288642/mt3620-m4-user-manual-kwwsv-grfv-plfurvriw-frp-hq-fd-dxuh-vskhuh-txlfnvwduwv.jpg)