Embed Size (px)
Citation preview
Why Aren’t the Prices of the Same Item the Same at Me.com and You.com?:
Drivers of Price Dispersion Among e-Tailers
Xing Pan Brian T. Ratchford
Venkatesh Shankar*
* Xing Pan ([email protected]) is a doctoral student, Brian T. Ratchford ([email protected]) is the PepsiCo Chaired Professor of Marketing and Venkatesh Shankar ([email protected]) is Visiting Scholar, eBusiness@MIT , Sloan School of Management, MIT and Ralph J. Tyser Fellow and Associate Professor of Marketing and Entrepreneurship at the Robert. H. Smith School of Business, University of Maryland, College Park, MD 20742.
1
Why Aren’t the Prices of the Same Item the Same at Me.com and You.com?: Drivers of Price Dispersion Among e-Tailers
Abstract
Frictionless e-commerce implies that price dispersion for identical products sold by various e-
tailers should be smaller than it is offline, but some recent empirical evidence reveals the opposite. A study by Smith et al. (2000) suggests that such a phenomenon may be due to heterogeneity among e-tailers in such factors as shopping convenience, consumer awareness, and trust. These hypotheses, however, remain untested.
In this paper, we extend previous research by developing a comprehensive framework of the
drivers of online price dispersion that includes market characteristics in addition to e-tailer characteristics and product category uniqueness. We also empirically test our propositions in a more comprehensive manner than prior research by using a range of price dispersion measures covering over 6,739 price quotes for 581 products from 105 e-tailers in a variety of product categories including books, CDs, DVDs, desktop computers, laptop computers, PDAs, computer software, and consumer electronics. Specifically, we (1) identify the key dimensions of e-tailer heterogeneity using factor analysis; (2) identify clusters of e-tailers on these dimensions using cluster analysis; (3) analyze how market factors such as number of competitors in a market, consumer involvement, and product popularity affect price dispersion using regression analyses; and (4) examine how heterogeneity among e-tailers is related to their prices using hedonic regressions.
Our results show that e-tailer services can be characterized by five underlying factors, namely,
shopping convenience, reliability in fulfillment, product information, shipping and handling, and pricing policy. There are three clusters of e-tailers who target different consumer groups and position themselves differently along these five factors. Even after controlling for e-tailer characteristics, online price dispersion is large. Market characteristics drive a large portion of e-tailer price dispersion. e-tailers charge prices in line with their characteristics. E-taliers, however, do not command higher prices for better services. The models explain over 92% of the variance in price dispersion. Keywords : Pricing, e-Commerce, Internet marketing, e-tailing
Introduction
The failure of the “law of one price” or price dispersion has been widely observed, even for
homogeneous products in environments conducive to perfect competition (e.g., Pratt et al. 1979;
Dahlby and West 1986; Sorensen 2000). Price dispersion, defined as the distribution of prices of an
item with the same measured characteristics across providers of the item at a given point in time, has
generally been found to be substantial (e.g., Stigler 1961; Dahlby and West 1986; Sorenson 2000).
Since price dispersion has significant implications for modeling consumer and producer behavior, and
has potentially key policy implications, it is an important topic to study. In particular, price dispersion
is indicative of potential gains to search by consumers. A large amount of price dispersion would
suggest that the market in question is informationally inefficient (Ratchford et al. 1996). For an online
market, this would call into question the hypothesis that e-commerce or online market reduces search
costs and leads to increased market efficiency (Bakos 1997). To determine whether any online
markets are likely to be inefficient and to explain why they may be inefficient, it would be useful to
study price dispersion and its drivers across a number of different items sold by e-tailers. That is the
major purpose of this study.
The earliest theoretical explanation of price dispersion is generally credited to Stigler (1961).
In a seminal paper on the economics of information, Stigler attributed price dispersion to incomplete
information. Subsequent studies have modeled price dispersion as an equilibrium outcome when some
consumers find it too costly to locate the lowest price offered in a market (Salop and Stiglitz 1982;
Burdett and Judd 1983; Carlson and McAfee 1983; Burdett and Coles 1997).1 A prediction that
follows from this research stream is that price dispersion will be reduced when information is more
readily available to consumers and/or consumer search is less costly.
Although they have received less attention, other explanations of price dispersion have also
been proposed. First, staggered price setting due to menu cost has been suggested as a source of price
2
dispersion (Fishman 1992). Second, demand uncertainty, costly capacity and presetting of price,
together, may drive price dispersion (Dana 1999). According to this explanation, prices get more
dispersed when the market becomes more competitive--a phenomenon witnessed in the airline
industry. Third, firms may charge different consumers different prices according to their willingness
to pay—a practice commonly known as “price discrimination.” Although typically, price
discrimination has been discussed in the context of a monopoly market, Clemons, Hann, and Hill
(1998) found that it also exists in the online travel agent market. Giulietti (1999) also found evidence
for price discrimination in an Italian grocery market where consumers’ switching costs are high.
Fourth, consistent with the information based explanation in the economics literature, Wernerfelt
(1991) found that inertial brand loyalty, resulting from time lags in awareness, leads to market
equilibrium with price dispersion. Fifth, unmeasured heterogeneity in seller attributes including
differential services could result in price dispersion for a homogeneous product (e.g., Brynjolfsson and
Smith 2000; Sorensen 2000).
Despite the large amount of theoretical discussion on the potential drivers of price dispersion,
there exist only a few empirical studies on price dispersion. These studies focused on a few specific
source(s) of price dispersion (e.g., Pratt, Wise, and Zeckhauser 1979; Dahlby and West 1986;
Clemons, Hann, and Hill 1998; Giulietti 1999; Sorensen 2000). A comprehensive investigation that
would allow an assessment of the theoretical explanations, has not been undertaken. Moreover, most
existing empirical studies investigated price dispersion for similar or comparable products rather than
exactly identical products (e.g., Dahlby and West 1986; Clemons et al 1998; Sorensen 2000), so
unmeasured product heterogeneity could be a potential threat to the validity of their results (Smith,
Bailey, and Brynjolfsson 2000). Furthermore, many studies did not examine price dispersion in the
online context.
1 Arnold (2000) points out that price dispersion is also possible when firms have capacity constraints, even though consumers all have the same search cost and valuation for the item and prices charged by all firms are common knowledge.

3
The emergence and explosive growth of online retailing allows a thorough examination of the
drivers of price dispersion. First, as a technology designed to facilitate information exchange, the
Internet promises a new age of perfectly competitive markets and potentially offers large amounts of
information to consumers. Thus, the lower search cost due to technology revolution (Bakos 1997),
leads us to expect reduced price dispersion among e-tailers. Online markets also involve significantly
easier entry than offline markets, because the storefront is simplified as a web site (Brynjolfsson and
Smith 2000). Consequently, online markets should be more competitive and witness less price
dispersion than a conventional market. Moreover, by discarding some traditional retailing
characteristics, such as high menu cost and thus staggered price setting, online retailing is expected to
have smaller price dispersion. For example, e-tailers have been found to have significantly more
frequent but smaller price changes than conventional retailers (Brynjolfsson and Smith 2000).
Unfortunately, despite these theoretical arguments, the prediction of narrower price dispersion
online is not supported by all existing empirical evidence. In studies of books, CDs, software, and
airline tickets sold online, Bailey (1998), Clemons et al (1998), and Brynjolfsson and Smith (2000), all
found that online price dispersion is no narrower than that in conventional markets. Moreover, such
pattern is surprisingly persistent over time (Brynjolfsson and Smith 2000; Smith, Bailey, and
Brynjolfsson 2000). Greater information online may lead to lower price sensitivity and wider range of
prices (Shankar, Rangaswamy and Pusateri 2001). Although Smith and his colleagues proposed some
drivers of such large and persistent online price dispersion, their hypotheses about the determinants of
online price dispersion have not been tested empirically.
The emergence and growth of online retailing has also provided a great opportunity for
empirical price dispersion research. First, conventional retailers are usually unwilling to provide many
price quotes when they are contacted (Sorenson 2000), whereas, all price quotes of e-tailers can be
found easily and unobtrusively through some well known price comparison engines such as
BizRate.com, Shopper.com, MySimon.com, PriceScan.com, and PriceWatch.com. Second, since
prices are available at the same time across e-tailers, they provide a stronger validity for research on
4
price dispersion (Smith, Bailey, and Brynjolfsson 2000). Third, because of the convenience of price
comparison for a large number of products, we can focus on entirely identical products, such as books,
CDs, DVDs, electronics, computer hardware and software. By examining the prices of identical
products across different e-tailers, we can avoid potential problems related to “comparable” but
somewhat differentiated products. Fourth, through a cross-sectional study of multiple product
categories whose average price levels may range from two dollars to thousands of dollars, we can also
examine price dispersion at different consumer involvement levels.
In summary, different explanations for price dispersion have been proposed and the
information-based explanation seems at most only partially successful. There is a lack of a relatively
comprehensive conceptual and empirical work that could make a substantial contribution to the
understanding of the online price dispersion phenomenon. The rapid growth of electronic commerce
has provided a good opportunity for such a task. The research objective of this study is thus to extend
prior research (e.g., Brynjolfsson and Smith 2000; Smith et al. 2000) by focusing on a comprehensive
set of drivers of price dispersion across e-tailers with an effort to test potential theoretical
explanations. Our incremental contributions over previous research on online price dispersion are
shown in Table 1.
(Table 1 about here)
In the next section, we review and discuss the potential drivers of online price dispersion. In
section 3, we explain the data and the measurement. In section 4, we present the model formulation.
In the subsequent section, we present and discuss the results. We close by discussing the limitations
and directions for future research and offer our conclusions.
Conceptual Framework
In their review of competition in digital markets, Smith, Bailey, and Brynjolfsson (2000)
summarize the possible drivers of price dispersion in online markets as product heterogeneity resulting
from unmeasured features, convenience of shopping, consumer awareness of the seller’s existence, e-
tailer’s branding and trust which reduces consumer risks, lock-in due to consumer switching costs, and
5
price discrimination. Broadly speaking, we can classify these sources and other additional drivers of
online price dispersion into two sets of factors, namely, (1) e-tailer characteristics and (2) market
characteristics, after controlling for product category uniqueness. In the following paragraphs, we
discuss how each of these factors might affect price dispersion in a given market.
e-tailer Characteristics
Shopping convenience (+). Shopping convenience may influence price dispersion. Ease of
finding and evaluating products through better search tools, product reviews and faster checkout could
reduce consumer search and switching costs. Therefore, e-tailers who offer a high level of
convenience may be able to charge higher prices (Smith, Bailey, and Brynjolfsson 2000). The type of
shopping convenience and experience is likely to affect price competition in online markets (Novak,
Hoffman, and Yung 2000). Thus, we expect variance in shopping convenience to be positively related
to price dispersion.
Reliability in fulf illment (+). Differences in perceived reliability among e-tailers may
influence the range of prices for a product. Reliability is associated with aspects such as delivery time,
whether the product was delivered as promised, and consistency of customer service. Because of the
spatial and temporal separation between buyers and sellers in online markets, exchanges between
money and goods are not simultaneous, so the delivery risk is a particular concern of the consumers
(Smith, Bailey, and Brynjolfsson 2000). A more reliable e-tailer may command higher prices than a
less reliable retailer for the same item, leading to greater price dispersion.
Product information (+). Depth of product information on a web site reduces online price
sensitivity (Shankar, Rangaswamy and Pusateri 2001). E-tailers with deep product information may
have lower price sensitivity and higher price than those with shallow product information. Therefore,
product information is expected to be positively related to price dispersion.
Shipping and handling (+/-). Shipping and handling service could be another dimension that
could affect e-tailers’ prices. Intuitively, e-tailers are in a position to charge higher prices for better
shipping and handling services because such services may be valuable to some consumers. Whether
6
consumers are charged higher prices for superior shipping services is an empirical question that is
unclear. Brynjolfsson and Smith (2000) found some of the e-tailers’ superior services to be negatively
correlated with price. For example, some e-tailers with better return policies have lower prices.
Therefore, the relationship between an e-tailer’s services and prices needs a more detailed
investigation.
Pricing policy (+). Overall pricing policy is one aspect of e-tailer heterogeneity that needs to
be controlled. In the real world, retailers have different financial abilities, thus sellers with deep
pockets are able to focus on long run profits and may strategically price close to or even below
marginal cost and take an early operation loss in order to build their businesses (Burdett and Coles
1997). Other sellers, however, may be forced to focus on short run profits and need to price no lower
than marginal cost. Therefore, changes in pricing policies of e-tailers should be positively related to
price dispersion.
Time of online market entry (+). First mover advantage has been extensively discussed in the
context of conventional markets. Although first mover advantage in online markets have received little
attention, the rationale for such an advantage in the offline market can be applied to the online market
as well. For example, Schmalensee (1982) pointed out that the perceived risks of early market
entrants are lower than those of late entrants and that consumers may be willing to pay more for early
entrants. Extending this reasoning to online markets, we can hypothesize that the greater the time
interval between sequential online market entries, the greater the price dispersion.
e-tailer Trust and Branding (+). An e-tailer’s trust and brand equity can reduce consumers’
perceived risks. Evidence from online markets also reveals that some consumers are willing to pay a
price premium for trusted e-tailers (Urban, Sultan and Qualls 2000). e-tailers can build consumer trust
and brand by providing a satisfying experience and through third party certification or
recommendation. Therefore, variance in trust and brand equity should positively affect price
dispersion.

7
Consumer awareness (-). In conventional markets, because of information scarcity, some
consumers are not informed about the lowest price. In contrast, in online markets, online price
comparison engines such as Bizrate.com, Shopper.com, and MySimon.com can facilitate consumers to
process information and thus locate the lowest price. The use of these engines, however, also depends
on consumer awareness of these engines. As a result, e-tailers who enjoy large consumer awareness
could charge prices higher than their competitors who are “needles in the haystack.” Burdett and
Coles (1997) proposed a noisy search model and pointed out that “each store changes its price as its
stock of regular customers change through time”, and “smaller (younger) stores [who have less
consumer awareness] announce lower prices …” Brynjolfsson and Smith (2000) found that e-tailers
with high consumer awareness, like Amazon.com and CDnow, charge 7-12% higher than those who
are less famous, like Books.com and CD Universe. Adamic and Huberman (1999) show that AOL
enjoyed high loyalty due to high awareness, suggesting an ability to command more prices. Thus, if
consumer awareness is high, we expect less price dispersion. Consumer awareness itself is not an
aspect of e-tailers’ service, but it is an aspect of the e-tailer characteristics that can be leveraged to
command higher prices.
Market Characteristics
Number of competitors in a market (+/-). The number of competitors in a market reflects its
competitiveness and is a factor that has been examined in models of offline price dispersion (Carlson
and McAfee 1983; Dahlby and West 1986; Cohen 2000). Based on their search model, Carlson and
McAfee (1983) proposed that price dispersion would be less when there are more players competing
in a market. However, when Dahlby and West (1986) empirically applied Carlson and McAfee’s
model in the car insurance market, they found that more players in a market is associated with
increased price dispersion. This conflict remains unexplained. A recent study by Cohen (2000) points
out that the number of alternatives in a market functions as “a double -edged sword.” On the one hand,
the rivalry increases with a greater number of alternatives, so that price dispersion is reduced. On the
other hand, the “DIF-ness” (distortion in information function) also increases and causes consumers to
8
be poorly informed, hence the price dispersion is enlarged. A small survey of household beverage
alternatives supported that “DIF-ness” does increase with more number of alternatives. Thus, we
propose that a nonlinear relationship between number of players and price dispersion could exist.
When not many players are in a market, more players would significantly increase the price
competition. For example, at the early stage of online book selling, Amazon.com significantly dropped
its prices when Barnes&Noble entered the market (Bailey 1998). However, when many players are in
a market (for example there are 6,219 unique book retailer sites listed by Yahoo!), consumers become
poorly informed and sellers have the opportunity to charge different prices. So, we expect that price
dispersion will decrease with a diminishing rate with the increase of the number of competitors in
market.
Consumer involvement (+/-). Consumer search behavior has been found to be related to the
involvement level (e.g., Kujala and Johnson 1993), because consumers with high involvement may
exert more search efforts than consumers with low involvement due to the differences in perceived
benefits from search. In the marketing literature, the psychological term "involvement” is regarded as
equivalent to the economic term “utility level,” that is, “price level” or “financial outlay” (Moorthy,
Ratchford, and Talukdar 1997; Cohen 1998), so consumers search more intensively in expensive
product categories, as documented by quite a few studies (see review by Miller 1993). Consequently,
we should expect less price dispersion in expensive product categories as the search models predict.
However, the evidence is equivocal. While Cohen’s (1998) findings are consistent with this prediction,
those of Pratt, Wise, and Zeckhauser (1979) are the opposite. Thus, further research is required on the
effect of involvement on price dispersion. In addition, all the existing studies of online price dispersion
have only investigated the low price items such as books and CDs, little is known about more
expensive items like laptop computers.
Popularity of the product among consumers (-). Popular products are those well accepted and
purchased by many consumers. In online markets, communication with consumers is particularly high.
Online consumers exchange information quickly through many electronic channels such as news
9
group, bulletin board service (BBS), and chat room. For strategic needs, many e-tailers have created
review board on their web sites for consumers to easily communicate. Popular products draw more
consumers’ attention and thus have more information conveyed to consumers relative to other
products, so we expect that price dispersion for popular products should be narrower than that for non-
popular products.
Other Variables
Product category uniqueness. Differences among product categories may affect the extent of
dispersion in prices. Previous empirical studies have tried to control for product heterogeneity using
the hedonic price regression method. For example, Clemons, Hann, and Hitt (1998) studied variation
in airline ticket prices, by controlling for several observed sources of product heterogeneity such as
arrival and departure times, number of connections, and Saturday night stays. They found that price
dispersion is still significant even after controlling these sources of heterogeneity. Other aspects of
product heterogeneity such as meal offering and refund policy that could potentially drive price
dispersion, however, were not included in their model. Therefore, investigation of entirely
homogeneous products, such as books, CDs, DVDs, electronics, computer hardware and software, is
strongly desired to eliminate potential contamination by unmeasured product heterogeneity. By
deliberately selecting these entirely homogeneous products in this study, we can eliminate one
potential source of unmeasured heterogeneity from our analysis. We allow for price dispersion to be
different for different product categories.
Different product categories might have their inherent natures that lead to different levels of
price dispersion, even after controlling their price levels. For example, price dispersion may be less for
those products whose consumer familiarity and knowledge are high. However, such cross category
effects are beyond the focus of this study. Thus, we control for the potential category differences using
dummy variables.
Data and Methodology
Data
10
The data for this study are primarily drawn from one of the well-known price comparison web
site, namely, BizRate.com. Product, price, and deal information for a large number of e-tailers are
searched and updated by BizRate.com daily. BizRate.com also lists the products that are popular in a
market, so we can compare price dispersion between popular and non-popular products.
We purposely focus on identical products to avoid the potential problem of unmeasured
product heterogeneity. Such products are found in the following categories: books, CDs, DVDs,
computer software and hardware, and consumer electronics. For example, the Toshiba Satellite
2775XDVD laptop computer with the part number of PS277U-6M9J0K and features of PIII 650 MHz
processor, 64 MB memory, 12 GB hard disk, 8x DVD, 56 Kbps modem, and 14.1" TFT screen, sold
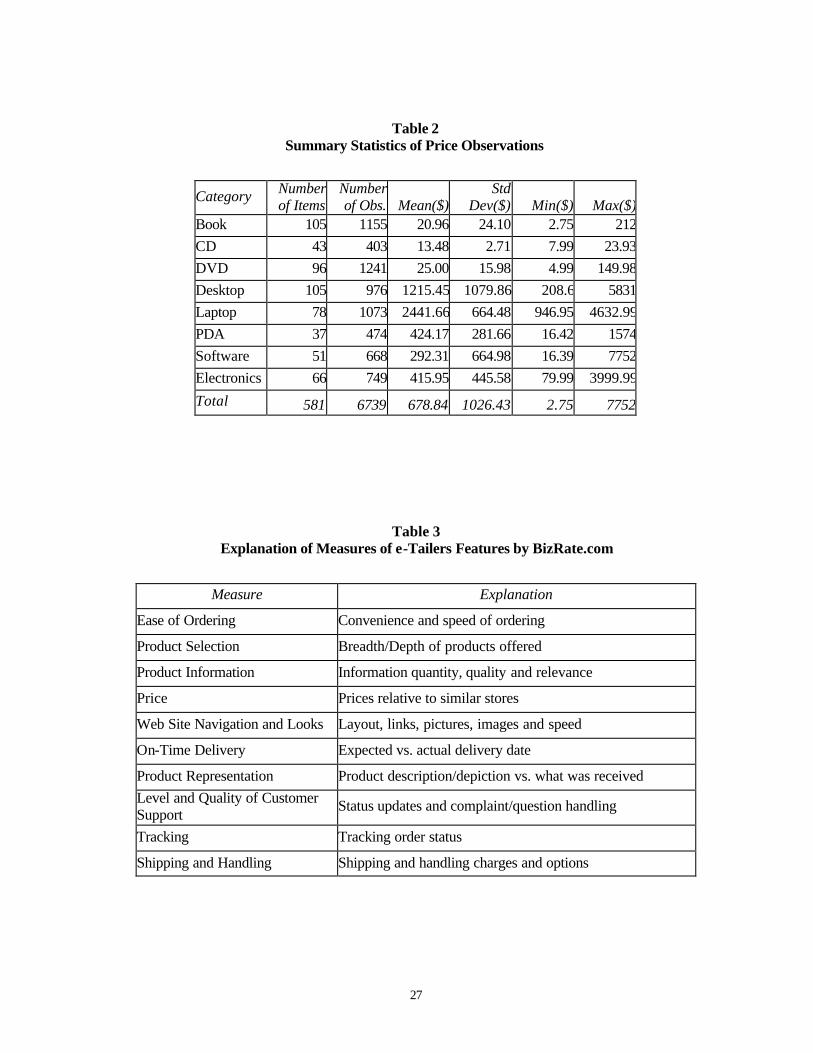
by one e-tailer is the same as that sold by another. We collected 6739 price quotes for 581 identical
products from 105 e-tailers during November 2000. Summary statistics of the data appear in Table 2.
(Table 2 about here)
BizRate.com also surveys e-tailers’ customers and asks them to evaluate the e-tailers’
services. The survey results are published on BizRate.com’s web site, so we can use them to measure
e-tailer heterogeneity. Ten aspects of e-tailers’ services are evaluated using a ten-point scale and an
overall measure of the average of the ten measures is also provided. Table 3 lists and explains the ten
measures used by BizRate.com. The ratings of the retailers by Bizrate.com are widely used in online
markets. For example, shopper.com, shopping.com, and price.com, all cite BizRate.com’s ratings. In
addition, many e-tailers who are BizRate.com’s certified sellers, also indicate this on their own
websites (e.g., CircuitCity.com, Mercata.com, Motorola, CD Universe, Euclid Computers), which
reflects the acceptance of BizRate.com’s authority. Thus, data from BizRate.com have high validity.
(Table 3 about here)
A second source of our data is Alexa.com. From Alexa.com, we obtained information on each
web site’s traffic, external links, and online market entry date2. An advantage of Alexa.com’s measure
2 If online date for an e-tailer was not available from Alexa.com, we collected the information from Allwhois .com.

11
of web traffic is that it provides data on the number of unique visitors to each web site, which is more
detailed than just the ranking of sites based on web traffic 3. We use web traffic and the number of
external links (how many other web sites have links to a particular web site) as measures of consumer
awareness in our study.
Furthermore, we collected data on trust through third party certification for each of the e-tailer
we study. There are a few third party certifications in electronic markets. We select the five most
frequently adopted certifications, which are from BBB Online, BizRate.com, Gomez.com, Truste.com,
and Verisign.com. We create a variable named “third party certification” based on how many
certifications a web site receives from the five sources. This variable measure ranges from 0 to 5.
Methodology
Our main objective is to isolate the factors that are associated with variation in price
dispersion across the product markets that we study. First, to construct measures of variability in retail
services across the products that we employ in this analysis, we use the BizRate.com ratings of
services provided by e-tailers. We factor analyze these ratings to identify the major underlying
dimensions of e-tail services; factor scores based on these ratings provide the service measures used as
independent variables in our analysis of price dispersion. Second, we do a cluster analysis of these
factor scores to identify the competitive positioning of e-tailers on these service dimensions. Third, we
use a set of regressions linking price dispersion measures to e-tailer and market characteristics to
investigate the drivers of price dispersion. Finally, through hedonic regression analyses, we
investigate the relationship between prices charged by e-tailers for specific product categories and the
services that they provide. Table 4 lists BizRate.com’s ten measures of services provided by e-tailers.
Results and Discussion
Factor Analysis
3 For details on the methodology used, please see at http://www.alexa.com.

12
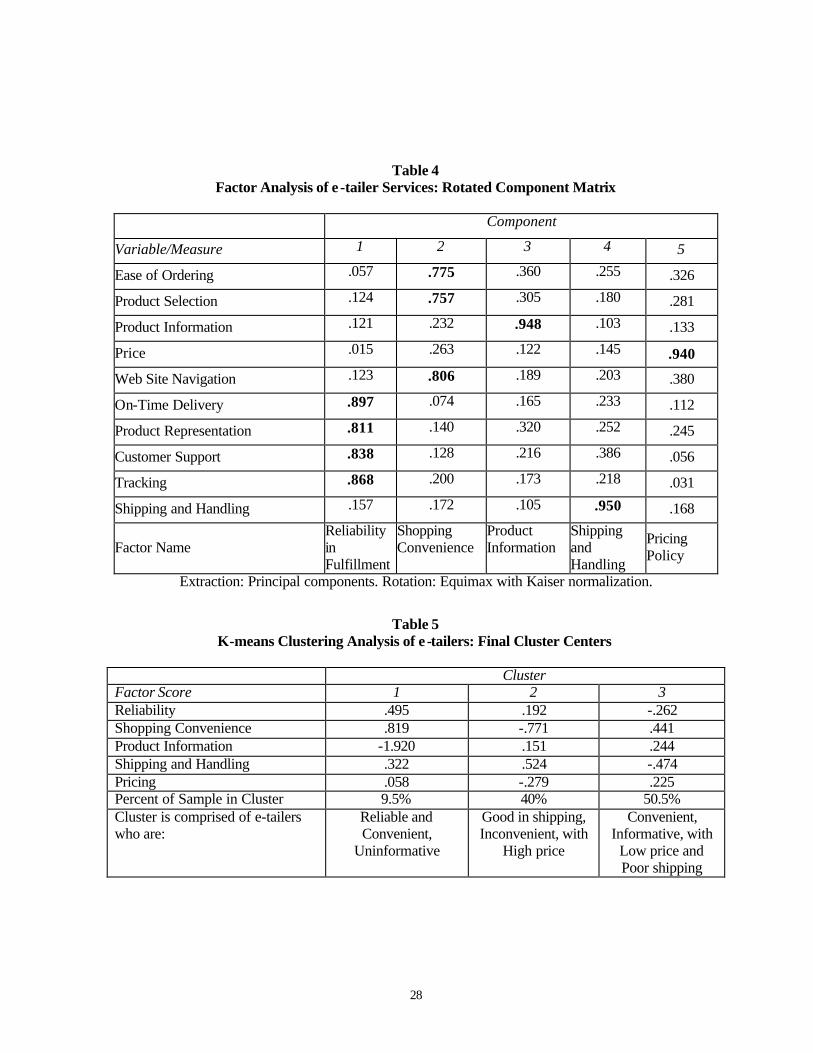
The results of the factor analysis of the ten measures for 105 e-tailers shows the existence of
five underlying factors. These five factors explain 91.5% of the variance in the original data. Table 4
provides the component matrix obtained using Equimax rotation4.
(Table 4 about here)
The measures, on-time product delivery, product representation, customer support, and
tracking of shipping status loads on Factor 1. Since one of the consumers’ primary concerns of online
shopping is the actual receipt of products after making payment (Smith, Bailey, and Brynjolfsson
2000), this factor seems to reflect the reliability of the e-tailers. Consumers will feel confident to buy
from e-tailers with high scores on this factor. Factor 2 is highly related to ease of ordering, product
selection, and the e-tailer’s web site navigation. All these factors reflect the dimension of shopping
convenience. Factor 3 is highly related to the quantity, quality and relevance of product information
that the e-tailers provide. Factor 4 is highly related to the options and charges of shipping and
handling. This is another tool that can be used by e-tailers to attract patronage by matching various
consumers’ delivery needs. For example, Outpost.com offers free overnight delivery for any purchase.
Factor 5 is highly related to e-tailers’ relative prices, and may reflect the pricing policy of the e-tailers.
In summary, e-tailers’ heterogeneity in services can be described along five dimensions or
factors, namely, shopping convenience, reliability, product information, shipping and handling, and
pricing policy.
Cluster Analysis
We then cluster the 105 e-tailers based on their scores on the five factors. We obtained three
clusters using a K-means cluster analysis. Table 5 shows the final cluster centers. The results of
ANOVA indicate that the means of all the five factors are significantly different (p < 0.05) across the
three clusters5.
4 To verify if the results are similar in a smaller sample of e-tailers, we did a factor analysis in a subset of 60 randomly selected e-tailers. The results were similar. 5 The F tests are used only for descriptive purposes only and strictly speaking, cannot be interpreted as tests of the hypothesis that the cluster means are equal.

13
(Table 5 about here)
Cluster 1 is the smallest group with 9.5% of the members. The e-tailers in this cluster are the
ones who are most reliable and are most convenient for shopping. However, the provision of product
information is poor. Their price and shipping and handling charges are moderate. Presumably, these e-
tailers target these consumers who already clearly know what they will buy, and focus on fulfilling
customer orders. Notice that these most reliable e-tailers perceived by consumers are not the leading
players such as Amazon.com and Barnes&Noble.com. Instead, they tend to be sellers who have
moderate to small web traffic. Examples of e-tailers in this cluster are CDUniverse.com and
CompUSA.com.
Clusters 2 comprises 40% of the e-tailers. The e-tailers in this cluster are characterized by
highest prices and least shopping convenience. They compensate for these drawbacks by providing the
most economical and flexible shipping and handling. The reliability of these e-tailers and the
information provided by them are at a moderate level compared with those of the other two clusters. It
seems that these e-tailers target price insensitive shoppers whose search costs are high. These etailers
try to attract and retain the customers through superior shipping and handing service. Outpost.com is
an e-tailer from this cluster. It has free overnight delivery for any purchase, which greatly attracts
those consumers who need the products quickly (e.g., birthday gift). Although they have the highest
prices, these e-tailers can still have sizable sales. For example, Powell’s.com, another e-tailer in this
cluster, has higher average prices than Amazon.com, but enjoys a significant sales volume in online
bookselling (Brynjolfsson and Smith 2000).
Cluster 3 is the largest cluster comprising 50.5% of the 105 e-tailers. These e-tailers provide
the lowest prices and offer deep product information. Their reliability and their shipping and handling
services, however, are perceived to be the poorest. Shopping convenience with these e-tailers is
perceived to be moderate. It is likely that these e-tailers target the price sensitive consumers. In
addition to low price, they also offer superior product information to attract web traffic and induce
14
purchase. Interestingly, several big e-tailer names, such as Amazom.com, Barnes&Noble,
Egghead.com, and eToys.com, are all members of this cluster.
Comparison of the three clusters reveals that, in general, e-tailers are not positioned to be
excellent in every dimension. Instead, they seem to have focus on different dimensions to differentiate
themselves from competition.
Price Dispersion Regression
Although the cluster analysis results are insightful, they do not offer insights into the drivers
of price dispersion among the e-tailers. For example, we want to know why e-tailers in the same
cluster, who are supposed to have similar strategies, charge different prices for identical products. We
also want to know the relative strength of the associations between the service factors and price
dispersion. To accomplish this, we conduct a regression analysis of the drivers of price dispersion.
To understand why prices charged by various e-tailers for the identical product are different,
we first need to create measures of price dispersion at the individual product level. Similar to the study
of Sorensen (2000), we consider the following price dispersion measures: (1) price range for the same
product; (2) percentage of price difference for the same product (price range divided by the average
price charged for that product); (3) standard deviation of prices charged for the same product; (4)
variance of prices charged for the same product; and (5) coefficient of variation of prices charged for
the same product (standard deviation of prices divided by the average price charged for that product).
Thus, we use these five measures of price dispersion with 581 observations for each product category
as the dependent variables in our regressions6. The summary statistics of the five price dispersion
measures are shown in Table 6. In Table 7, we also report the summary statistics of the percentage of
price difference in each product category.
(Tables 6 and 7 about here)
6 Some of the five measures are highly related. When linear regression with the same independent variables are used, results from these different dependent measures could be quite different. However, for log linear models, results from these dependent measures will be very similar. We address the issue of functional form selection later.
15
Table 7 shows that books and CDs, the two categories investigated by Brynjolfsson and
Smith (2000) and Bailey (1998), have the widest price differences (average price differences in these
two categories of 49% and 51% respectively), which are somewhat larger than those reported by
Brynjolfsson and Smith (2000) (33% for books and 25% for CDs). One possible reason for this
difference is that the number of e-tailers in our study is greater than that in Brynjolfsson and Smith
study, allowing for greater variance in prices. The average percentages of price difference in the other
six categories range from 25.7% to 43.7%, which are also significantly large7. The maximums of
percentage of price difference are larger than 47%, the number reported by Brynjolfsson and Smith,
which again confirms that large price dispersion in online markets is a persistent phenomenon. It
should be noted that price differences for certain items are more than 100%.
Our framework suggests that price dispersion arises from variations in e-tailer characteristics
and market characteristics. Specifically, our independent variables include the following factors:
e-tailer characteristics. We include the following e-tailer variables in the regression analyses.
(1) shopping convenience, (2) reliability, (3) product information, (4) shipping and handling, (5)
pricing policy, (6) time of online market entry, (7) trust (third party certification), and (8) consumer
awareness (web traffic and number of referral links)8. We run two sets of regressions, each set using
ranges or standard deviations in these characteristics respectively.
Market characteristics. We examine the following market characteristics in the regression
analyses: (1) number of competitors in market, measured by the number of e-tailers selling an item, (2)
consumer involvement, measured by the average price level of the item, and (3) popularity with
consumers, measured by a dummy variable indicating the best-selling products. We control for
product category uniqueness using dummy variables.
7 Due to lack of previous research of price dispersion on these categories, we are unable to compare the results, for both online and offline marketplace. 8 The variable of web traffic is highly correlated with the variable of referral links, so only one of them can be used the regression. We report the regression results obtained by using the web traffic variable. We obtained very similar results when we used the number of referral links as the consumer awareness measure.

16
We regress each of the five measures of price dispersion on these two classes of independent
variables. For each dependent measure, we ran linear, semi logarithm and double logarithm models,
compared them, and selected the double log functional form based on the goodness of model fits.
Since the regression results for the double logarithm model were very similar across measures, we
report the results of only two dependent measures, price range and price standard deviation, in Table 8.
The diagnostics statistics did not reveal any problems of multicollinearity. Both the White test and
Breusch-Pagan test, however, detected the existence of heteroskedasticity. So we use the GMM
(Generalized Method of Moment) method to obtain valid estimates of the variance and covariance
matrix. The estimated coefficients with their significance levels and model goodness of fit appear in
Table 8.
(Table 8 about here)
Price dispersion among e-tailers is well explained by our regression models. All the models
are significant (p < 0.001) and the adjusted R squares of each of them is greater than 92%. In addition,
they provide consistent results.
e-tailer characteristics. Most dimensions of e-tailer service heterogeneity relate to price
dispersion. Thus variation in shopping convenience, product information provision, shipping and
handling, and pricing policy are positively related to price dispersion. The variation of e-tailers’
reliability is also positively related to price dispersion in one of the models (the estimated coefficients
in the other three models are also positive, but not significant). These results indicate that
heterogeneity in e-tailers’ service leads to price dispersion. Consumer awareness, however, has no
relationship with price dispersion, which suggests that a dominant awareness position may not be
easily leveraged by e-tailers to command higher prices. Finally, time of online market entry and
variation in trust or third party certification are negatively related to price dispersion. These effects,
however, are only marginally significant in two models and insignificant in the other two models.
Market characteristics. Consistent with our expectation, the increase in number of competitors
reduces price dispersion but at a diminishing rate. This result suggests that consumers absorb and
17
process information less effectively when the number of sellers increases. The price range and price
standard deviation increase less than proportionally with price level, which is a proxy measure of
consumer involvement. Thus, when these dependent measures are corrected for differences in units of
measure by dividing by price, the relationship between price dispersion and involvement has the
hypothesized negative sign. Specifically, when the percentage of price difference (price range divided
by mean price) and the coefficient of variation of price (price standard deviation divided by mean
price) are used as the dependent measures, the estimated coefficients of price are negative.9 The other
market characteristic, product popularity, does not have a significant effect on price dispersion as
expected.
A summary of the results of price dispersion regression with respect to the predicted effects of
e-tailer and market characteristics is shown in Table 9.
(Table 9 about here)
To understand the relative effects of the different sets of drivers of price dispersion, we
obtained the squares of the standardized coefficients and compare their relative sizes. The results are
shown in Table 10, which reports the percentages of variation attributable to the three types of
independent variables, and to random error. In the four models where price range and price standard
deviation are used as the dependent variables, market characteristics account for over 88% of the
variance, while the e-tailer and product characteristics have relatively much lower effects. This is
largely due to the relationship between price and the range and standard deviation of prices. However,
when the percentage of difference and coefficient of variation are used as the price dispersion
measures, that is, when price range and standard deviation are deflated by the mean price, the relative
effect size of market characteristics is significantly reduced to 7% ~ 14%, whereas the relative effect
size of e-tailer characteristics significantly increases to 21% ~ 30%. The proportion of variance due to
9 Specifically, let σ be range or standard deviation of prices, p be price level. We estimated regressions of the form ln σ = a + b ln p, where other predictors are ignored for simplicity. Had σ/p been used as the dependent measure instead, the regression would be ln σ - ln p = a + (b-1) ln p. Since b ≈ .92 in Table 9, b –1≈ -.08. Though
18
error becomes much larger in this case. This is because scaling the dispersion measure relative to pr ice
removes the variation due to involvement, one of the market characteristics, from the regression
analysis. However, the product characteristics have the smallest effect size when dispersion is
measured relative to price. Thus, we conclude that market characteristics and e-tailer characteristics,
especially the former, are most influential drivers of price dispersion among the e-tailers.
(Table 10 about here)
Hedonic Regression
Having diagnosed the drivers of the e-tailers’ price dispersion, we now turn to the questions: Which
type of e-tailer charges high prices? Which type of e-tailer charges low prices? Why? We study the
relationship between e-tailer heterogeneity and prices. We use a hedonic price approach to investigate
this question, by regressing the prices on the e-tailer characteristics. To do so, we first need to make
the prices across items comparable. Thus, we create a new price index variable by using each observed
price divided by the mean price of that item. The price index we use is a relative price measure with
the mean for every item equal to one, and it satisfies our research purpose by eliminating the cross
item differences. However, realizing that for different product categories, the effects of e-tailer
characteristics on price may be different, we run the hedonic price regression within each product
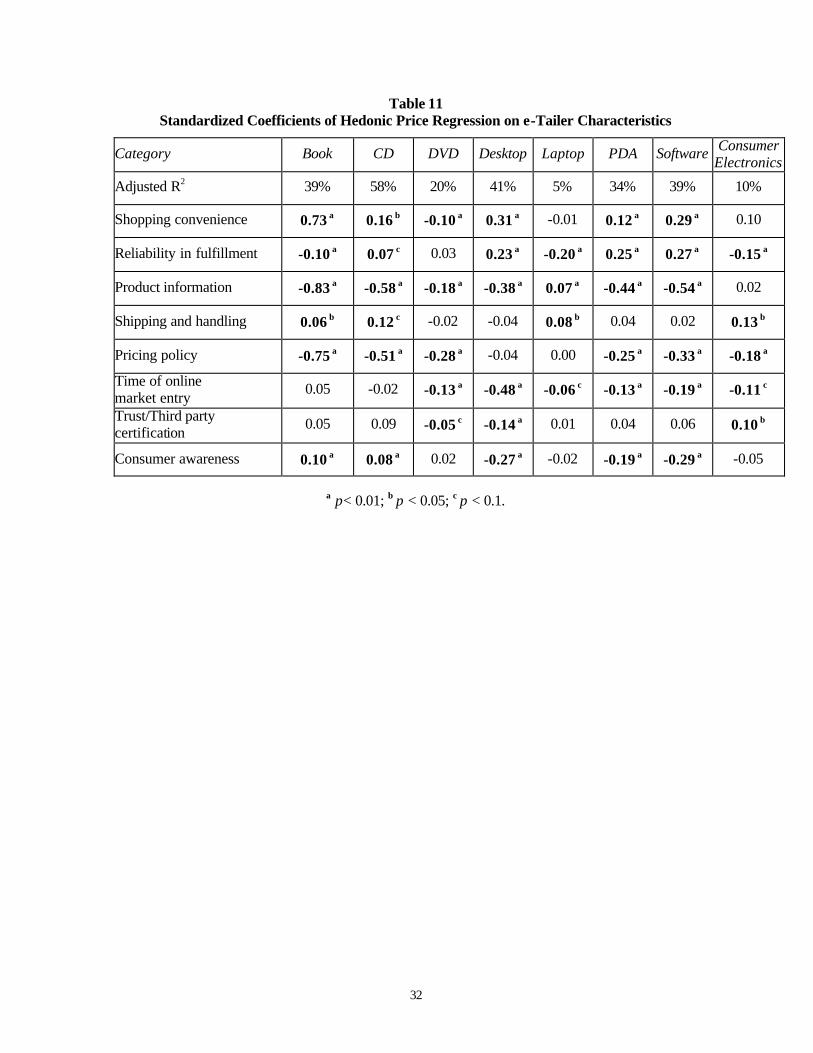
category and compare the results. The standardized coefficients estimated by linear functional form10
and GMM method11 appear in Table 11.
(Table 11 about here)
Each of the eight hedonic pr ice regression models is significant (p < 0.001). The adjusted R-
squares are generally moderate, but low for laptops (5%) and consumer electronics (10%). We now
discuss the effects of each of the e-tailer characteristics on price.
absolute price dispersion increases with price, which is not surprising, relative price dispersion declines with price. High involvement products exhibit less relative rice dispersion. 10 A semi -log model provided similar results. We could not use the double-log model because some measures of e-tailer characteristics are factor scores containing negative values. 11 We tested for heteroskedasticity using the White test and Breusch-Pagan test for all eight regressions.
19
Shopping convenience is found to have significant effects on price in six of the eight
categories. In general, higher prices are commanded by e-tailers who provide greater shopping
convenience, with the exception of DVDs. The effect size is especially large for books. This finding
suggests that consumers are more willing to pay for convenience for inexpensive items.
The reliability of e-tailers in fulfilling transactions and delivering products is one of the most
important factors consumers consider when shopping online (Smith et al. 2000). Thus, more reliable e-
tailers have the power of charging higher prices. In our regression results, e-tailer reliability has
significant effects on price in seven of the eight product categories we study, and the effect size is
larger for higher involvement products (computer products and consumer electronics), as expected.
However, the signs of these effects are mixed. For books, laptops, and consumer electronics, the more
reliable e-tailers actually charge lower prices, but in the of the rest categories, the more reliable e-
tailers do charge higher prices. Interestingly, book and CD e-tailers tend to be the same while desktop
and laptop e-tailers are usually the same merchants. However, with regard to the reliability, they price
differently for the two similar product categories. Although further research on this issue is needed,
the results show that e-tailers with superior services may actually charge either higher or lower prices.
While consumers may be willing to pay more for the services, it is also possible that e-tailers offering
superior reliability are more efficient and have lower costs, leading them to price lower than less
reliable competitors in anticipation of higher volume.
Product information provision is found to be significantly related to price in seven categories.
Contrary to Smith et al. (2000), these effects are generally negative with the exception of laptops. This
finding suggests that, rather than charging extra for product information, e-tailers generally offer both
good price and good product information to customers at the same time. It is also apparent that,
among the e-tailer characteristics, product information provision has the largest effect size on average.
Furthermore, across categories, product information provision has the largest effect for the
inexpensive items, namely, books and CDs.
20
The economy and flexibility of shipping and handling has a consistent positive effect on
product price in four categories, which confirms the intuition that better shipping and handling service
commands a higher product price.
Time of online market entry has a negative effect on price in six categories. This suggests the
existence of earlier mover advantage in the e-marketplace, that is, the early entrants are able to
command higher price than late movers.
Trust as measured by third party certification or recommendation may allow e-tailers to charge
higher prices. However, the effect of third party certification on price is significant in three product
categories and the effect sizes are small for all categories. Moreover, although most of the coefficients
have positive signs, we do find negative and significant effects for DVDs and desktop computers. The
reason for this finding is unclear.
Interestingly, the results show that the e-tailers who sell books and CDs charge higher price if
they have higher consumer awareness. However, the opposite is true for the e-tailers who sell
computer products. Perhaps, because of the low involvement for books and CDs, consumers do not
search their prices as intensively as they do for high involvement computer products. Therefore,
consumers are relatively price insensitive for books and CDs, while more price sensitive for the
computer products. Conversely, computer product e-tailers may need to commit to low price in order
to induce purchases. This finding suggests that consumer awareness is not necessarily an advantage
that allows e-tailers to charge higher prices, as suggested by Smith et al. (2000). In fact, the e-tailers
may have achieved high consumer awareness via their low prices, and they need to maintain the low
cost image by continuously offering low prices. An increase in price could damage the consumer trust
and threaten their sales and profits.
In summary, the hedonic price regression results support several hypothesized relationships
between prices and the characteristics of e-tailers. Specifically, higher prices are charged by e-tailers
who enter the e-marketplace earlier, who have economical and flexible shipping and handling service,
and who have higher pricing policy. Despite some conflicting findings, in general, higher prices are
21
also charged by the e-tailers who provide more shopping convenience, and who provide less product
information. However, the effects of reliability in fulfillment, trust, and consumer awareness are
ambiguous. Therefore, although the e-tailers set prices in line with their characteristics, the intuition
that better services command higher prices is not necessarily true. Future study on how e-tailers make
their price decisions should provide a better understanding of these issues.
Limitations and Future Research
We outline certain limitations of our study and offer potential avenues for future research.
First, theoretical discussions of price dispersion pay particular attention to equilibrium market
outcomes. Although the patterns of online price dispersion have been observed to be consistent in the
past few years (see Smith et al. 2000), the high price variation in online markets questions this
equilibrium. Although we have explained the drivers of such price dispersion in this study, the use of
cross sectional data may limit the generalizability of our results. Future extension of our study using
longitudinal data should produce more robust evidence.
Second, in addition to explaining the drivers of price dispersion, we examined the specific
pricing behavior of e-tailers. However, the hedonic price regression we used does not consider the
competition among the e-tailers and potential moderating effects of the market. Although a detailed
analysis of the pricing behavior among e-tailers is beyond the scope and focus of this study, it will
contribute to a better understanding of this phenomenon.
Conclusion
In this study, we extended previous research on price dispersion by empirically investigating
the drivers of online price dispersion. We propose a framework based on a review of the existing
literature on price dispersion in different product categories sold by e-tailers that comprises market and
e-tailer characteristics, after controlling for product uniqueness. Previous studies (Bailey 1998;
Brynjolfsson and Smith 2000; Smith et al. 2000) have documented large price dispersion in online
markets, but did not empirically examine the drivers of online price dispersion. With a comprehensive
data set containing 6739 price observations for 581 exactly identical products cross 8 product
22
categories from 105 e-tailers, and measures of the e-tailer and market characteristics, we believe that
our study is among the first to empirically investigate the drivers of online price dispersion.
We examined the effects of e-tailer characteristics and market characteristics on price
dispersion among e-tailers. The e-tailer characteristics we studied include service characteristics such
as shopping convenience, reliability in fulfilling transactions and delivering products, product
information provision, economy and flexibility in shipping and handling, and pricing policy, as well as
other characteristics like time of online market entry, trust, and consumer awareness. The market
characteristics we investigated are number of sellers in market, consumer involvement, and popularity
of the category among consumers,.
Our analysis comprised four steps. First, we performed a factor analysis of e-tailer features to
identify the underlying dimensions of e-tailer service. The results show that five factors, namely,
shopping experience, reliability, information provision, shipping and handling and pricing policy are
the key e-tailer factors.
Second, we did a cluster analysis of the 105 e-tailers based on consumers’ perception of their
services. Our results suggest there exist three types of e-tailers who target different consumer
segments. Cluster 1 is the smallest cluster. It includes the medium/small size e-tailers who target the
consumers who clearly know what they will buy. They are perceived to be the most reliable e-tailers
and they have moderate overall price. Cluster 2 includes the e-tailers who target the price insensitive
consumers. They have the highest overall price and try to attract and retain the consumers by
providing superior shipping and handling service. Cluster 3 contains the e-tailers who target the price
sensitive consumers. They are perceived to have the best price and product information, but the worst
shipping and handling. This cluster has more than half of the e-tailers. The cluster analysis depicts a
general image of how the e-tailers’ services are related to their overall prices.
Third, we used a set of regressions to explicitly investigate the drivers of price dispersion of
the 581 products. Our regression models consistently have adjusted R-squares of over 92% and thus
they explain the sources of price dispersion very well. The standardized coefficients demonstrate that
23
market characteristics and e-tailer characteristics are the main explanatory variables of the price
dispersion among e-tailers. Since variation in e-tailer characteristics explains less than 30 percent of
the variation in price dispersion across markets, market characteristics are primarily responsible for the
observed price dispersion. Specifically, among the e-tailer characteristics, shopping convenience,
product information provision, economy and flexibility of shipping and handling, and overall pricing,
all increase price dispersion. e-tailer reliability also increases price dispersion, but only in one of the
four regression models. Consumer awareness does not affect price dispersion, whereas time of online
market entry and variation in third party certification decrease price dispersion in two of the regression
models. Among the market characteristics, increase in number of competitors is associated with a
decrease in price dispersion, but at a diminishing rate. Price dispersion, when measured by the range
and standard deviation of price, increases with consumer involvement, but at a slower rate. Thus,
when the price dispersion is measured by the percentage difference or the coefficient of variation of
price, it decreases with consumer involvement. Product popularity does not affect price dispersion. As
for product characteristics, CDs have smaller price dispersion than books, while the price dispersions
in other categories are not different from that in books.
Fourth, using the hedonic price regression approach, we analyzed why e-tailers charged high
or low prices. We created a measure of relative price and regress it on the e-tailer characteristics
within each product category. The results show that higher prices are charged by the e-tailers who
enter the e-marketplace earlier, who have economical and flexible shipping and handling service, and
who have higher overall pricing. With some exceptions, higher prices are also charged by the e-tailers
who provide more shopping convenience, and who provide less product information. However,
consumer awareness, trust, reliability in fulfilling transaction and delivering product are all found to
have ambiguous effects on price. These findings suggest that e-tailers set prices in line with their
characteristics, however, they do not simply charge higher prices for better services. The hedonic
regression results also indicate that heterogeneity in the services offered by e-tailers is only
responsible for a limited portion of the variation in e-tailer prices.
24
References
Adamic, Lada A. and Bernando A. Huberman (1999), “The Nature of Markets in the Worldwide Web,” Proceedings of Computing in Economics and Finance, Meetings of the Society for Computational Economics, June 24-26. Arnold, Michael (2000), “Costly Search, Capacity Constraints, and Bertrand Equilibrium Price Dispersion”, International Economic Review, 41 (1): 117-131. Bailey, Joseph (1998), “Intermediation and Electronic Markets: Aggregation and Pricing in Internet Commerce”, Ph.D. Thesis, MIT. Bakos, Yannis (1997), “Reducing Buyer Search Costs: Implications for Electronic Marketplaces”, Management Science, 43 (12): 1676-1692. Burdett, Kenneth and Kenneth Judd (1983), “Equilibrium Price Dispersion”, Econometrica, 51 (July): 955-969. ______________ and Melvyn Coles (1997), “Steady State Price Distributions in a Noisy Search Equilibrium”, Journal of Economic Theory, 72 (1): 1-32. Brynjolfsson, Erik and Michael Smith (2000), “Frictionless Commerce? A Comparison of Internet and Conventional Retailers”, Management Science, 46 (4): 563-585. Carlson, John and Preston McAfee (1983), “Discrete Equilibrium Price Dispersion”, Journal of Political Economy, 91 (3): 480-493. Clemons, Eric, Il-Horn Hann, and Lorin Hitt (1998), “The Nature of Competition in Electronic Markets: An Empirical Investigation of Online Travel Agent Offerings”, Working Paper, The Wharton School of the University of Pennsylvania, June. Cohen, Marcel (1998), “Linking Price Dispersion to Product Differentiation – Incorporate Aspects of Customer Involvement”, Applied Economics, 30: 829-835. ____________ (2000), “The Impact of Brand Selection on Price Competition – a Double-Edged Sword”, Applied Economics, 32: 601-609. Dahlby, Bev and Douglas West (1986), “Price Dispersion in an Automobile Insurance Market”, Journal of Political Economy, 94 (2): 418-438. Dana, James (1999), “Equilibrium Price Dispersion Under Demand Uncertainty: The Role of Costly Capacity and Market Structure”, Rand Journal of Economics, 30 (4): 632-660. Fishman, Arthur (1992), “Search Technology, Staggered Price-Setting, and Price Dispersion”, The American Economic Review, 82 (1); 287-298. Giulietti, Monica (1999), “Price Discrimination in Grocery Trade: Evidence From Italy”, Applied Economics, 31 : 319-329. Kujala, Jouni and Michael Johnson (1993), “Price Knowledge and Search Behavior for Habitual, Low Involvement Food Purchase”, Journal of Economic Psychology, 14 (2): 249-265.
25
Miller, Harvey (1993), “Consumer Search and Retail Analysis”, Journal of Retailing, 69 (2): 160-192. Mitchell, William and Robert Sorensen (1986), “Pricing, Price Dispersion, and Information: The Discount Brokerage Industry”, Journal of Economics and Business, 38 (4): 273-282. Moorthy, Sridhar, Brian T. Ratchford, and Debabrata Talukdar (1997), “Consumer Information Search Revisited”, Journal of Consumer Research, 23 (March): 263-277. Novak, Thomas, P., Donna L. Hoffman, and Yiu-Fai Yung (1998), “Measuring the Flow Construct in Online Environments: A Structural Modeling Approach,” Working Paper, May. Pratt, John, David Wise, and Richard Zeckhauser (1979), “Price Differences in Almost Competitive Markets”, Quarterly Journal of Economics, 93 (May): 189-211. Ratchford, Brian T., Jagdish Agrawal, Pamela Grimm, Narasimhan Srinivasan (1996), "Toward Understanding the Measurement of Market Efficiency," Journal of Public Policy and Marketing, 15, 167-184. Salop, Steven and Joseph Stiglitz (1982), “The Theory of Sales: A Simple Model of Equilibrium Price Dispersion with Identical Agents”, The American Economic Review, 72 (December): 1121-1130. Schmalensee, Richard (1982), “Product Differentiation Advantages of Pioneering Brands”, American Economic Review, 72 (3): 349-365. Shankar, Venkatesh, Arvind Rangaswamy and Michael Pusateri (2001), “The Online Medium and Customer Price Sensitivity,” Working Paper, University of Maryland, College Park, MD 20742. Smith, Michael, Joseph Bailey, and Erik Brynjolfsson (2000), “Understanding Digital Markets: Review and Assessment”, Erik Brynjolfsson and Brian Kahin , eds, Understanding the Digital Economy, MIT Press, Cambridge, MA. Sorensen, Alan (2000), “Equilibrium Price Dispersion in Retail Markets for Prescription Drugs”, Journal of Political Economy, 108(4): 833-850. Stigler, George (1961), “The Economics of Information”, Journal of Political Economy, 69 (3): 213-225. Urban, Glen L., Fareena Sultan and William Qualls (2000), “Making Trust the Center of Your Internet Strategy,” Sloan Management Review, Fall (1), 39–48. Varian, Hal (1980), “A Model of Sales,” American Economic Review, 70 (4): 651-659. Wernerfelt, Birger (1991), “Brand Loyalty and Market Equilibrium,” Marketing Science, 10 (3): 229-245.

26
Table 1 Comparison of Our Study with Previous Empirical Research on Online Price Dispersion
Item Brynjolfsson and Smith (2000) Smith et al. (2000) Our Study (2001)
Drivers of online price dispersion
e-tailer heterogeneity Ø e-tailer characteristics Ø Market characteristics Ø Product category uniqueness
Focus Comparison of the magnitudes of online and offline price dispersion
Examination of drivers of online price dispersion: theoretical and empirical Ø Use different price dispersion
measures Ø Assess the drivers of online
price dispersion and their relative effects
Ø Investigate how e-tailers set prices in line with their characteristics
Prices
Inexpensive items (average price about $5)
Both inexpensive and expensive items (average price about $700; price ranges from $2.75 to $7752)
Products
20 books and 20 CDs
Large number of products (581 items from 8 categories)
e-tailers 8 e-tailers for every product Large number of e-tailers (105 in total, with 5 to 23 for each item)
27
Table 2 Summary Statistics of Price Observations
Category Number of Items
Number of Obs. Mean($)
Std Dev($) Min($) Max($)
Book 105 1155 20.96 24.10 2.75 212
CD 43 403 13.48 2.71 7.99 23.93
DVD 96 1241 25.00 15.98 4.99 149.98
Desktop 105 976 1215.45 1079.86 208.6 5831
Laptop 78 1073 2441.66 664.48 946.95 4632.99
PDA 37 474 424.17 281.66 16.42 1574
Software 51 668 292.31 664.98 16.39 7752
Electronics 66 749 415.95 445.58 79.99 3999.99
Total 581 6739 678.84 1026.43 2.75 7752
Table 3 Explanation of Measures of e-Tailers Features by BizRate.com
Measure Explanation
Ease of Ordering Convenience and speed of ordering
Product Selection Breadth/Depth of products offered
Product Information Information quantity, quality and relevance
Price Prices relative to similar stores
Web Site Navigation and Looks Layout, links, pictures, images and speed
On-Time Delivery Expected vs. actual delivery date
Product Representation Product description/depiction vs. what was received
Level and Quality of Customer Support
Status updates and complaint/question handling
Tracking Tracking order status
Shipping and Handling Shipping and handling charges and options
28
Table 4 Factor Analysis of e -tailer Services: Rotated Component Matrix
Component
Variable/Measure 1 2 3 4 5
Ease of Ordering .057 .775 .360 .255 .326
Product Selection .124 .757 .305 .180 .281
Product Information .121 .232 .948 .103 .133
Price .015 .263 .122 .145 .940
Web Site Navigation .123 .806 .189 .203 .380
On-Time Delivery .897 .074 .165 .233 .112
Product Representation .811 .140 .320 .252 .245
Customer Support .838 .128 .216 .386 .056
Tracking .868 .200 .173 .218 .031
Shipping and Handling .157 .172 .105 .950 .168
Factor Name Reliability in Fulfillment
Shopping Convenience
Product Information
Shipping and Handling
Pricing Policy
Extraction: Principal components. Rotation: Equimax with Kaiser normalization.
Table 5 K-means Clustering Analysis of e -tailers: Final Cluster Centers
Cluster
Factor Score 1 2 3 Reliability .495 .192 -.262 Shopping Convenience .819 -.771 .441 Product Information -1.920 .151 .244 Shipping and Handling .322 .524 -.474 Pricing .058 -.279 .225 Percent of Sample in Cluster 9.5% 40% 50.5% Cluster is comprised of e-tailers who are:
Reliable and Convenient,
Uninformative
Good in shipping, Inconvenient, with
High price
Convenient, Informative, with
Low price and Poor shipping

29
Table 6 Summary Statistics on Price Dispersion Measures
Variable Number of Obs. Mean Std Dev Minimum Maximum
Range ($) 581 182.45 323.90 1.40 3452.05
Percentage of Difference 581 38.50% 20.97% 0.38% 119.75%
Standard Deviation ($) 581 55.04 95.29 0.43 941.20
Variance 581 12092.89 51511.67 0.19 885864.96
Coefficient of Variation 581 11.72 6.21 0.15 36.49
Table 7 Summary Statistics of Percentage of Price Difference by Category
Category Number of Obs. Mean Std Dev Minimum Maximum
Book 105 48.9% 13.8% 16.7% 94.2%
CD 43 51.0% 18.4% 20.3% 77.7%
DVD 96 43.7% 16.7% 16.9% 96.6%
Desktop 105 34.4% 27.1% 0.4% 119.7%
Laptop 78 25.7% 13.9% 1.4% 66.9%
PDA 37 37.1% 24.4% 8.2% 104.2%
Software 51 35.6% 25.9% 11.0% 106.0%
Electronics 66 31.0% 11.7% 10.3% 66.2%

30
Table 8 GMM Regression Results of Drivers of Price Dispersion
Measure of variation in e-tailer characteristics
Range of e-tailer characteristics
Standard Deviation of e-tailer characteristics
Measure of price dispersion (dependent variable)
Price Range Price STD Price Range Price STD
Adjusted R2 92.79% 93.57% 92.60% 93.48%
Intercept 0.677 0.355 -0.383 -0.780
e-tailer characteristics
Shopping convenience 0.646 a 0.514 a 0.539 b 0.455 b
Reliability in fulfillment 0.076 0.104 c 0.064 0.086
Product information provision 0.594 a 0.520 a 0.628 a 0.550 a
Shipping and handling 0.256 a 0.196 b 0.292 a 0.215 b
Pricing policy 0.589 a 0.565 b 0.780 a 0.715 a
Timing of online market entry -0.285 c -0.249 c 0.005 -0.049
Trust/third party certification -0.189 c -0.189 c -0.066 -0.084
Consumer awareness -0.003 -0.016 0.005 -0.012
Market characteristics
Number of competitors -0.499 a -0.751 a 0.001 -0.025 a
Consumer involvement 0.920 a 0.925 a 0.911 a 0.918 a
Popularity of product with consumers 0.040 0.036 0.055 0.051
Product uniqueness CD * -0.408 a -0.496 a -0.259 c -0.346 a
DVD -0.113 -0.183 -0.060 -0.104
Laptop 0.077 -0.068 0.285 0.149
Desktop 0.006 -0.127 0.186 0.079
Personal Digital Assistant -0.008 -0.163 0.168 0.029
Consumer Electronics -0.009 -0.092 0.145 0.078
Computer Software -0.066 -0.154 0.162 0.087
Dependent and non-dummy independent variables are measured in natural logs. a p< 0.01; b p < 0.05; c p < 0.1. * The base category is book.

31
Table 9 Summary of Results on Drivers of Price Dispersion
Relationship to Price Dispersion Factors Expected Result e-tailer Characteristics Shopping convenience + +
Reliability in fulfillment + +
Product information + +
Shipping and handling + +
Pricing policy + + Time of online market entry + - Trust/third-party certification + - Consumer awareness - ns Market characteristics Number of competitorsa +/- - Consumer involvementb +/- - Popularity of product among consumers - ns
ns denotes that the regression coefficient is not significantly different from zero. a Expected relation becomes positive when number of competitors is large.
b Has the expected sign for relative price dispersion (range/price or coefficient of variation).
Table 10 The Percentage of Variance Explained by Drivers of Price Dispersion
Measure of variation in e-tailer characteristics
Range of e-tailer characteristics
Standard Deviation of e-tailer characteristics
Measure of price dispersion (dependent variable) Range Percentage
Difference Std CV Range Percentage Difference Std CV
e-Tailer Characteristics 3.62% 29.52% 2.71% 21.51% 3.06% 27.05% 2.34% 25.76%Market Characteristics 88.80% 9.55% 90.11% 13.69% 88.90% 7.71% 90.77% 10.28%Product Characteristics 0.37% 2.99% 0.75% 5.92% 0.65% 6.04% 0.37% 4.27%Error 7.21% 57.95% 6.43% 58.88% 7.40% 59.20% 6.52% 59.68%
32
Table 11 Standardized Coefficients of Hedonic Price Regression on e-Tailer Characteristics
Category Book CD DVD Desktop Laptop PDA Software Consumer Electronics
Adjusted R2 39% 58% 20% 41% 5% 34% 39% 10%
Shopping convenience 0.73 a 0.16 b -0.10 a 0.31 a -0.01 0.12 a 0.29 a 0.10
Reliability in fulfillment -0.10 a 0.07 c 0.03 0.23 a -0.20 a 0.25 a 0.27 a -0.15 a
Product information -0.83 a -0.58 a -0.18 a -0.38 a 0.07 a -0.44 a -0.54 a 0.02
Shipping and handling 0.06 b 0.12 c -0.02 -0.04 0.08 b 0.04 0.02 0.13 b
Pricing policy -0.75 a -0.51 a -0.28 a -0.04 0.00 -0.25 a -0.33 a -0.18 a
Time of online market entry
0.05 -0.02 -0.13 a -0.48 a -0.06 c -0.13 a -0.19 a -0.11 c
Trust/Third party certification
0.05 0.09 -0.05 c -0.14 a 0.01 0.04 0.06 0.10 b
Consumer awareness 0.10 a 0.08 a 0.02 -0.27 a -0.02 -0.19 a -0.29 a -0.05
a p< 0.01; b p < 0.05; c p < 0.1.