Embed Size (px)
Citation preview

-244-
XII Assessment of Investment & Financial Flows for Adaptation in the Fisheries Sector
12.1 Introduction
Capture fisheries and aquaculture supplied the world with about 110 million tonnes of food fish
in 2006, while fish provided more than 2.9 billion people with at least 15 percent of their
average per capita animal protein intake, according to the latest assessment included in The
State of the World Fisheries and Aquaculture 2008.140
Aquaculture is the fastest growing food
production industry in the world, highly diverse in cultured species in different systems, and has
been growing at a rate that is almost 3 times that of terrestrial farmed meat production
systems, increasing its relative contribution to world fish supplies and animal protein intake,
while reducing pressure on wild fisheries in both developing and industrialized countries.
In addition, fisheries play an important role in food security as approximately 70 percent of
marine production is used directly for human food, while part of the world fish production
(mainly marine) is reduced to fishmeal and oil used for raising cattle, poultry and fish, and is
therefore indirectly used as human food.
The forecasts indicate that global fish production for food is going to increase from now to
2020, but not as rapidly as world demand, while per capita fish consumption and fish prices are
expected to rise141
142
, creating new opportunities for those countries whose regulatory
framework, management practices and adaptive strategies are best suited to address the
additional challenges posed by current variability and climate change.
The ecosystems on which fisheries are based and fishing-based livelihoods have been subject to
a range of climate-related variability effects, including extreme weather events, floods and
droughts, changes in aquatic ecosystem structure, increase sea temperature and productivity,
as well as changing patterns and abundance of fish stocks. Resource users and managers face
continued challenges in responding to this variability.
140
FAO (2009). The State of World Fisheries and Aquaculture 2008. Food and Agriculture Organization of the United Nations,
Rome, 196pp. 141
Easterling, W.E., P.K. Aggarwal, P. Batima, K.M. Brander, L. Erda, S.M. Howden, A. Kirilenko, J. Morton, J.-F. Soussana, J.
Schmidhuber and F.N. Tubiello (2007). Food, fibre and forest products. Climate Change 2007: Impacts, Adaptation and
Vulnerability. Contribution of Working Group II to the Fourth Assessment Report of the Intergovernmental Panel on Climate
Change, M.L. Parry, O.F. Canziani, J.P. Palutikof, P.J. van der Linden and C.E. Hanson, Eds., Cambridge University Press,
Cambridge, UK, 273-313. 142
Delgado C.L., Wada N., Rosegrant M.W., Meijer S., Ahmed M (2003). Fish to 2020: supply and demand in a changing world.
IFPRI; Washington, DC: 2003.
-245-
In addition, the Food and Agriculture Organization (FAO) reports that just over half of the wild
fish stocks (52 percent) are fully exploited and producing catches that are close to their
maximum sustainable yields, while approximately one-quarter are overexploited, depleted or
recovering from depletion (16 percent, 7 percent and 1 percent respectively).143
Furthermore, according to FAO144
, climate change constitutes a compounding threat to the
sustainability of capture fisheries and aquaculture. Adverse effects occur as a result of gradual
global warming and associated physical changes, as well as a consequence of the increased
frequency of extreme weather events. Climate change is provoking major shifts in ocean system
productivity as well as in surface freshwater availability is going to make adaptation in the
fisheries sector more difficult and costlier.
In the case of aquaculture, the identified negative impacts of climate change include, among
others, temperature increase, eutrophication due to global warming, increased acidification,
change in weather patterns and extreme weather events, sea level rise and other physical
changes in the sea, water stress, and global decline in ocean productivity.
The general scope of the fisheries sector used in this chapter includes the activities listed below
(mainly based on FAO definitions145,146
and statistical data bases but organized in light of the
assessment of I&FF). However, the activities that are relevant to an I&FF assessment in a
particular country are entirely country-specific, as discussed below in section 12.2.
Fishery
Activity leading to catching, taking or harvesting of fish. It may involve capture of wild fish or
raising of fish through aquaculture.
Capture (inland or marine)
Sum (or range) of all activities to harvest a given fish resource. Defined by:
• location
• target resource
• the technology used
• the social characteristics (e.g. artisanal, industrial),
• the purpose (e.g. commercial, subsistence, or recreational)
• season
143
FAO (2004). The State of World Fisheries and Aquaculture (SOFIA) 2004, Food and Agriculture Organization of the United
Nations, Rome, Italy. 144
FAO (2009). The State of World Fisheries and Aquaculture 2008. Food and Agriculture Organization of the United Nations,
Rome, 196pp. 145
FAO Fisheries Glossary web link: http://www.fao.org/fi/glossary/default.asp 146
Crespi, V.; Coche, A. (comps) (2008). Glossary of aquaculture. Rome, FAO. 401pp.

-246-
Aquaculture (inland or marine)
The farming of aquatic organisms: fish, molluscs, crustaceans, aquatic plants147, crocodiles,
alligators, turtles, and amphibians. Farming implies some form of intervention in the rearing
process to enhance production, such as regular stocking, feeding, protection from predators,
etc. Farming also implies individual or corporate ownership of the stock being cultivated.
It is also possible to distinguish between capture based aquaculture (CBA), the practice of
collecting seeds from the wild and subsequent growing-out them in captivity to marketable
size, using aquaculture techniques, and hatchery based aquaculture (HBA), which is the practice
of producing and using seeds from hatcheries through manipulation of adult maturation and
reproduction and larval and juvenile rearing. The difference between capture fisheries and seed
fisheries is that the caught aquatic organisms go to market directly in the former case, and to
culture operations before entering markets in the latter.
As in all food production sectors, post-harvest activities entail stocking, packaging, transport
and post-consumption waste.
• Freshwater culture: The cultivation of aquatic organisms where the end product is raised
in freshwater, such as reservoirs, rivers, lakes, canals and groundwater, in which the
salinity does not normally exceed 0.5%.
• Mariculture: Cultivation, management and harvesting of marine organisms in the sea, in
specially constructed rearing facilities e.g. cages, pens and long-lines. The cultivation of
the end product takes place in seawater, such as fjords, inshore and open waters and
inland seas in which the salinity generally exceeds 20%.
• Brackishwater culture: The cultivation of aquatic organisms where the end product is
raised in brackishwater, such as estuaries, coves, bays, lagoons and fjords, in which the
salinity may lie or generally fluctuate between 0.5‰ and full strength seawater.
Post harvesting activities are:
Processing
The receiving and preparation of fish, including, but not limited to, cleaning, cooking, canning,
smoking, salting, drying, or freezing. Fish processing can take place aboard fishing and fish
processing vessels, and at fish processing plants.
• Fish handling: Initial processing of raw fish
• Fish products manufacturing: Includes among others production of canned, dried, cured,
and precooked fish, as well as fish oil and fish meal.
147
Aquaculture activities related to aquatic plants are not addressed in this chapter.

-247-
12.2 Application of I&FF Methodology to Adaptation in the Fisheries Sector
This section describes how the I&FF methodology presented in Chapter II would be applied to
adaptation in the fisheries sector. Some of the information provided in Chapter II that is
relevant to all sectors is not repeated here, so the reader should read Chapter II before reading
this chapter.
Step #1: Establish key parameters of assessment >>> Define detailed scope of sector
The definition of the fisheries sector and whether all possible subsectors comprised and or
related are to be examined, or only a subset within the sector, will need to be addressed here.
In this step, the precise subsectors that are to be included in the I&FF assessment must be
defined such that the specific processes, activities, entities, and geographic regions that are
encompassed by the fisheries sector as defined by the national team for the I&FF assessment
are clear. A key distinction in the fish-producing sector is between capture fisheries (usually just
called ‘fisheries’) and farming of fish, or aquaculture. Capture fisheries and aquaculture
produce both fish and supply the same processing industries, markets and consumers. It is
recommended that nationally the most important subsectors, whether they are wild fish
capture or aquaculture, are included. Which subsectors are included, and exactly how broadly
or narrowly they are defined, should depend on national circumstances —including current and
potential harvest, state of stocks, supply and demand, trade, fishing technology, contribution to
the national economy, employment and livelihoods, and potential for sustainable economic
growth, as well as their relationship to national and sectoral development plans. This choice
should also depend on data availability, the structure of national government entities in which
data reside, and the scope of related assessments that have been completed, especially analysis
of direct and indirect impacts of climate change identified as part of the national
communications, vulnerability assessments and other adaptation studies that may have been
completed.
The fishing industry includes recreational, subsistence and commercial fishing, and the
harvesting, processing, and marketing sectors.148
Fish processing is the processing of fish delivered by commercial fisheries. Aspects of fish
processing occur on fishing vessels, fish processing vessels, and at fish processing plants.
Further, the commercial activity is aimed at the delivery of fish and other seafood products for
human consumption or as input factors in other industrial processes.149
In many cases the
scope will be determined by considering the main target species the country is concentrating its
fishing activities and operations. In the case of aquaculture, the subsector is highly diverse at
the global level, with more than 440 cultured species in different regions, under different
148
FAO Fisheries Glossary web link: http://www.fao.org/fi/glossary/default.asp 149
FAO Fisheries Glossary web link: http://www.fao.org/fi/glossary/default.asp

-248-
management systems and conditions, while there are multiple impact pathways in which the
indirect impacts will be in many cases large. Manufacturing, marketing and distribution are part
of the supply chain by which the food products are made available to consumers and can be
included in the detailed scope of the assessment if they are relevant to the country. In addition,
in many countries, the shipbuilding industry is strongly related to the fishing industry and its
level of activity is correlated to the evolution of the fisheries sector while the food industry
receives the inputs provided by the processing of fish products. A country may choose to
include all or a subset of these subsectors, and may choose to disaggregate or aggregate
subsectors differently. Some subsectors and subsector components are unimportant or
irrelevant in some countries (e.g., aquaculture). In addition, it is important that the scope
avoids overlap with other sectors (e.g., water, food security).
Some adaptation measures and activities will also result in mitigation benefits in the same
sector or another sector. The focus on adaptation does not imply that mitigation opportunities
and potential for emission reductions are unimportant or irrelevant in fisheries. The world’s
marine fishing fleets burn fossil fuels so reducing fuel subsidies granted to fishing fleets could
promote energy efficiency as well as assist towards reducing overcapitalization in fisheries and
diminishing social costs. Similarly, supporting the use of static-gear – pots, traps, longlines and
gillnets, which uses less fuel than active gear such as trawls and seines –and therefore emits
less CO2, in some cases can be integrated into both mitigation and adaptation considerations. In
aquaculture, on the other hand, sea level rise, saline water intrusion and acidification could
impact on mollusc culture and reduce its contribution to carbon sequestration. Energy
efficiency opportunities and measures could be envisaged across the industry from harvesting
to processing through transport and marketing.
>>> Specify assessment period and base year
This methodology recommends a 25-year assessment period and 2005 as the base year. If
another year must be used for the base year due to data limitations or other national
circumstances, it is recommended that the assessment period should still be 25 years in length
because of the long lifetimes of capital stock and infrastructure in the sector.
>>> Identify preliminary adaptation measures
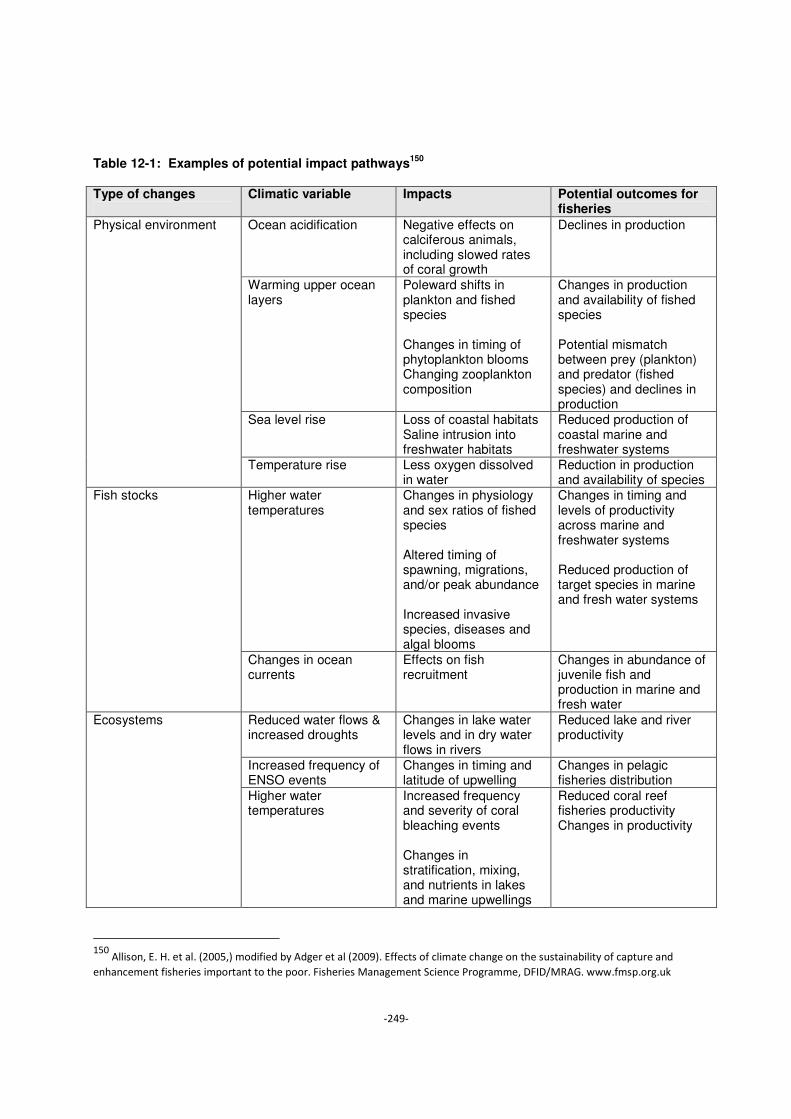
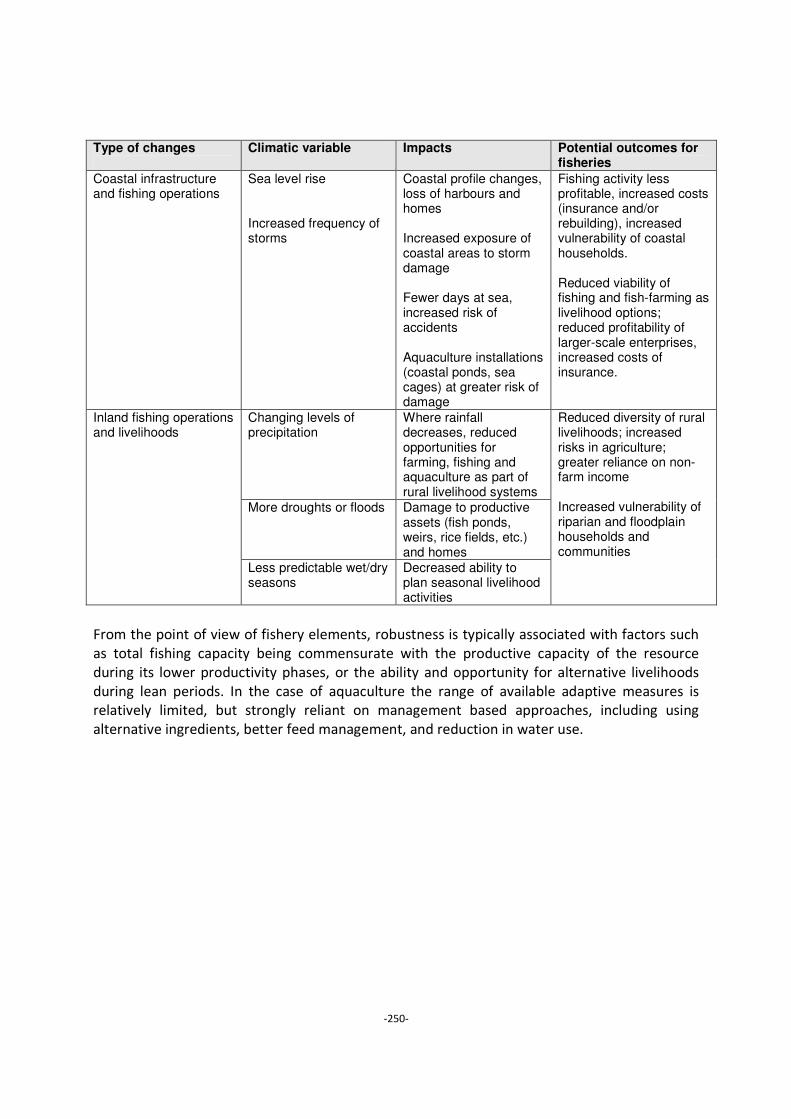
Climate change will impact on fisheries through a diversity of direct and indirect pathways
whose importance will vary depending on the type of ecosystem and fishery as shown in the
pathways identified in Table 12-1.
-249-
Table 12-1: Examples of potential impact pathways
150
Type of changes
Climatic variable Impacts Potential outcomes for fisheries
Ocean acidification Negative effects on calciferous animals, including slowed rates of coral growth
Declines in production
Warming upper ocean layers
Poleward shifts in plankton and fished species Changes in timing of phytoplankton blooms Changing zooplankton composition
Changes in production and availability of fished species Potential mismatch between prey (plankton) and predator (fished species) and declines in production
Sea level rise Loss of coastal habitats Saline intrusion into freshwater habitats
Reduced production of coastal marine and freshwater systems
Physical environment
Temperature rise Less oxygen dissolved in water
Reduction in production and availability of species
Higher water temperatures
Changes in physiology and sex ratios of fished species Altered timing of spawning, migrations, and/or peak abundance Increased invasive species, diseases and algal blooms
Changes in timing and levels of productivity across marine and freshwater systems Reduced production of target species in marine and fresh water systems
Fish stocks
Changes in ocean currents
Effects on fish recruitment
Changes in abundance of juvenile fish and production in marine and fresh water
Reduced water flows & increased droughts
Changes in lake water levels and in dry water flows in rivers
Reduced lake and river productivity
Increased frequency of ENSO events
Changes in timing and latitude of upwelling
Changes in pelagic fisheries distribution
Ecosystems
Higher water temperatures
Increased frequency and severity of coral bleaching events Changes in stratification, mixing, and nutrients in lakes and marine upwellings
Reduced coral reef fisheries productivity Changes in productivity
150
Allison, E. H. et al. (2005,) modified by Adger et al (2009). Effects of climate change on the sustainability of capture and
enhancement fisheries important to the poor. Fisheries Management Science Programme, DFID/MRAG. www.fmsp.org.uk
-250-
Type of changes
Climatic variable Impacts Potential outcomes for fisheries
Coastal infrastructure and fishing operations
Sea level rise Increased frequency of storms
Coastal profile changes, loss of harbours and homes Increased exposure of coastal areas to storm damage Fewer days at sea, increased risk of accidents Aquaculture installations (coastal ponds, sea cages) at greater risk of damage
Fishing activity less profitable, increased costs (insurance and/or rebuilding), increased vulnerability of coastal households. Reduced viability of fishing and fish-farming as livelihood options; reduced profitability of larger-scale enterprises, increased costs of insurance.
Changing levels of precipitation
Where rainfall decreases, reduced opportunities for farming, fishing and aquaculture as part of rural livelihood systems
More droughts or floods Damage to productive assets (fish ponds, weirs, rice fields, etc.) and homes
Inland fishing operations and livelihoods
Less predictable wet/dry seasons
Decreased ability to plan seasonal livelihood activities
Reduced diversity of rural livelihoods; increased risks in agriculture; greater reliance on non-farm income Increased vulnerability of riparian and floodplain households and communities
From the point of view of fishery elements, robustness is typically associated with factors such
as total fishing capacity being commensurate with the productive capacity of the resource
during its lower productivity phases, or the ability and opportunity for alternative livelihoods
during lean periods. In the case of aquaculture the range of available adaptive measures is
relatively limited, but strongly reliant on management based approaches, including using
alternative ingredients, better feed management, and reduction in water use.

-251-
Table 12-2: Climate change related impacts and potential adaptation measures in fisheries151
Impact of climate change on fisheries and aquaculture
Adaptation measures
Capture fisheries – System elements
Reduced yield • Ecosystem based fisheries management
• Access higher value markets / shifting of targeted species
• Explore the availability of alternative fishery resources
• Investments in flexible technologies and flexible processing chains
• Reduce costs to increase efficiency
• Diversify livelihoods
• Educational and training activities (job requalification)
• Exit the fishery
Increased variability of yield • Ecosystem based fisheries management
• Insurance schemes
• Diversify livelihood portfolio
Change in distribution of fisheries • Ecosystem based fisheries management
• Migration of fishing effort/strategies and processing/distribution facilities
Reduced profitability • Exit the fishery Influx of new fishers • Support for existing local management institutions
• Diversify livelihoods through microcredit
• Networking civil society
Vulnerability of infrastructure and communities to flooding, sea level and surges
• New or improved physical defenses
• Safer harbours and landings
• Relocation of facilities
• Managed retreat/accommodation
• Disaster risk management, including disaster preparedness
• Rehabilitation and disaster response
• Integrated coastal management
• Early warning systems and education
• Investment and capacity building on improved forecasting
Increased dangers of fishing • Weather warning system
• Investment in improved vessel stability / in improved safety at sea / communications
Scientific and technological system elements
Overall impacts • Assess impacts of climate change adverse effects
• Assess risks of future fish stock variation and likelihood of resource collapse
• Assess specific cross-sectoral factors which will increase or decrease impacts and adaptation potential.
Financial system elements
Overall impacts • Cluster insurance
• Emergency funding
• Pooling of risks
• Other financial instruments Policy and planning system elements
Overall impacts • Spread of sector-related risk through contingency plans
151
Modified from the Climate Change for Fisheries and Aquaculture Technical Document from the expert consultation held on 7
to 9 April, FAO, Rome. Reference: HLC/08/BAK/6
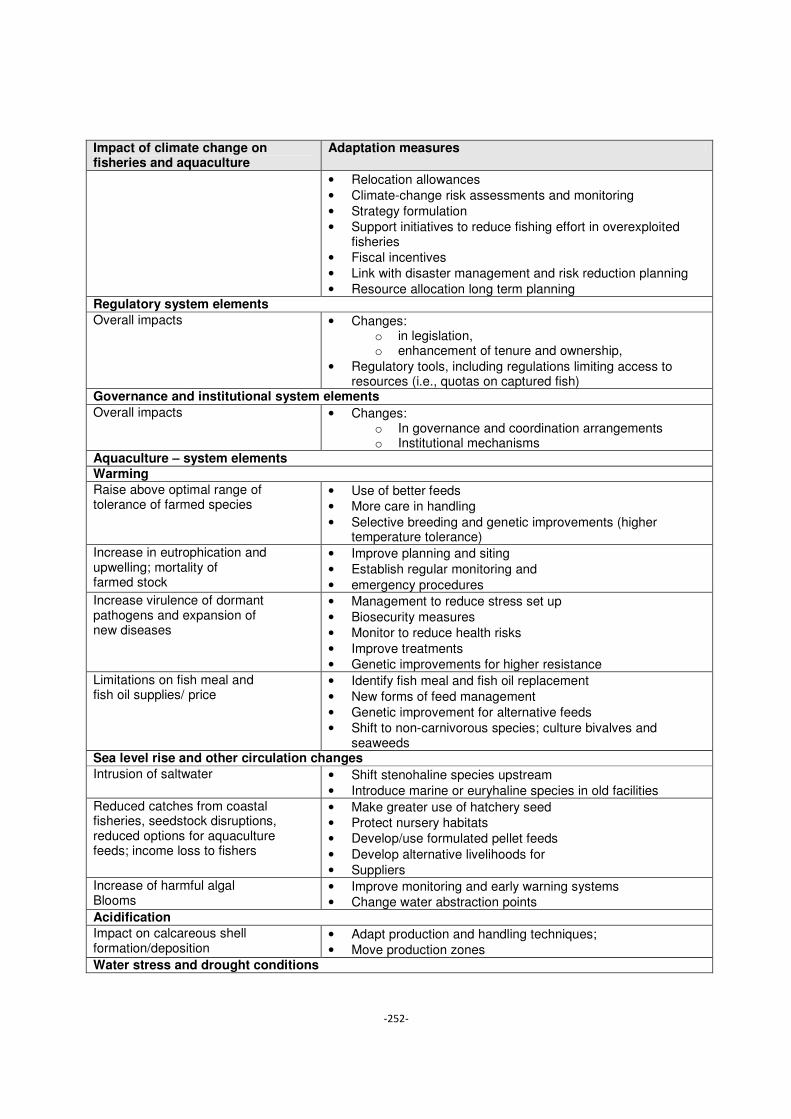
-252-
Impact of climate change on fisheries and aquaculture
Adaptation measures
• Relocation allowances
• Climate-change risk assessments and monitoring
• Strategy formulation
• Support initiatives to reduce fishing effort in overexploited fisheries
• Fiscal incentives
• Link with disaster management and risk reduction planning
• Resource allocation long term planning Regulatory system elements
Overall impacts • Changes: o in legislation, o enhancement of tenure and ownership,
• Regulatory tools, including regulations limiting access to resources (i.e., quotas on captured fish)
Governance and institutional system elements
Overall impacts • Changes: o In governance and coordination arrangements o Institutional mechanisms
Aquaculture – system elements
Warming
Raise above optimal range of tolerance of farmed species
• Use of better feeds
• More care in handling
• Selective breeding and genetic improvements (higher temperature tolerance)
Increase in eutrophication and upwelling; mortality of farmed stock
• Improve planning and siting
• Establish regular monitoring and
• emergency procedures Increase virulence of dormant pathogens and expansion of new diseases
• Management to reduce stress set up
• Biosecurity measures
• Monitor to reduce health risks
• Improve treatments
• Genetic improvements for higher resistance
Limitations on fish meal and fish oil supplies/ price
• Identify fish meal and fish oil replacement
• New forms of feed management
• Genetic improvement for alternative feeds
• Shift to non-carnivorous species; culture bivalves and seaweeds
Sea level rise and other circulation changes
Intrusion of saltwater • Shift stenohaline species upstream
• Introduce marine or euryhaline species in old facilities
Reduced catches from coastal fisheries, seedstock disruptions, reduced options for aquaculture feeds; income loss to fishers
• Make greater use of hatchery seed
• Protect nursery habitats
• Develop/use formulated pellet feeds
• Develop alternative livelihoods for
• Suppliers
Increase of harmful algal Blooms
• Improve monitoring and early warning systems
• Change water abstraction points Acidification
Impact on calcareous shell formation/deposition
• Adapt production and handling techniques;
• Move production zones Water stress and drought conditions

-253-
Impact of climate change on fisheries and aquaculture
Adaptation measures
Limitations for freshwater abstraction
• Improve efficacy of water usage Encourage non-consumptive water use in aquaculture, e.g. culture based fisheries
• Encourage development of mariculture where possible
Change in water-retention period (inland systems reduced, coastal lagoons increased)
• Use different/faster growing fish species
• Increase efficacy of water sharing with primary users, e.g. irrigation of rice paddy
• Change species in lagoons
Reduced availability and period change of wild seed stocks
• Shift to artificially propagated seed Improve seed quality and production
• Efficiency in the use of water Extreme weather events
Destruction of facilities; loss of stock; loss of business; mass scale escape with the potential to impact on biodiversity
• Encourage uptake of individual /cluster insurance
• Improve siting and design to minimize damage, loss and mass escapes
• Encourage use of indigenous species to minimize impacts on biodiversity, Use non reproducing stock in farming systems
Finally, any strategic analysis in the sector should consider the interactions between
aquaculture and capture fisheries. A group of relations comprises the market interactions
between aquaculture and traditional fisheries, and its impacts on fish prices, rate of technology
adoption, share of aquaculture in total fish supply trends, etc. Equally relevant is the
consideration of the role played by aquaculture in contributing to rebuild depleted wild fish
stocks, a problem which is met with precautionary fisheries management systems, vessel buy-
back programs, unemployment insurance projects for fishermen, and fisheries subsidy
reduction plans.
>>> Select analytical approach
The analytical approaches that could be used for an I&FF assessment of adaptation in the
fisheries sector range from simple spreadsheet models that can be built by members of the
project team to models of fishery management that identify or highlight the interactions
between economic and ecological dynamic systems. A combination of approaches, e.g. a bio-
economic model supplemented with spreadsheet analyses, however, could also be used.
With this regard two sources are especially relevant to decide on the conditions for selecting
the analytical approach for the fisheries sector in developing countries:
• The information provided in climate change studies already available at the national
level (e.g. National Communications, NAPAs, vulnerability assessments) and
• National fishery plans, whether they are short, medium or long term.
Ideally, the tasks to be completed require first to estimate production levels and make
projections of future fisheries production levels driven by medium- and long-term probabilistic
climate change predictions. Then it is necessary to forecast impact levels on specific fisheries
and/or aquaculture systems relevant to the country. Finally, adaptive tools for decision-making
under uncertainty will need to be implemented to guide the assessments.

-254-
Table 12-3: Examples of fisheries sector analytical tools and methods
Name Developer Methodology Description and website BEAM4 FAO Model The objective of the BioEconomic Analytical Model is to
predict yield, value and a series of measures of economic performance as a function of fishery management measures such as fishing effort control, closed season, closed areas and minimum mesh size regulation. Tool for the rational management of exploited living aquatic
resources.152
CLIMPROD-PLUS
ORSTOM Model Stock assessment by surplus production models incorporating an environmental variable
FISAT II FAO-ICLARM
Model Fish stock assessment Tools Management options for fisheries, especially in data-sparse,
tropical contexts.153
FishStat Plus
FAO FIES Tool The system provides users with access to Fishery Statistics of various sorts. Any data having time series structure can
potentially be stored and processed by FishStat Plus.154
SPATIAL FAO Modeling package
Space time Dynamics in Marine Fisheries: simulation package developed to model the spacetime distribution of fishing intensity using alternative approaches. Includes ALLOC, YAREA and CHART models for fisheries
management strategies.155
Ecopath with Ecosim (EwE)
A free ecological/ecosystem modelling software suite. Has three main components: Ecopath (a static, mass-balanced snapshot of the system); Ecosim (a time dynamic simulation module for policy exploration); and Ecospace (a spatial and temporal dynamic module primarily designed for exploring impact and placement of protected areas). The model can be used to study the effects of fishing on an ecosystem, evaluate ecosystem recovery after a major disturbance, determine where to locate marine protected areas, and
model the effects of changing climate.156
However, if countries do not already have extensive experience with a particular model or
models, it is recommended that other approaches be used for developing their scenarios.
Simpler approaches, like sound extrapolation of trends from historical evolution, may work,
though they need to be done based on expert knowledge in order to be reliable.
152
http://www.fao.org/fishery/topic/16069/en 153
http://www.fao.org/fi/oldsite/STATIST/FISOFT/FISAT/index.htm 154
http://www.fao.org/fishery/statistics/software/fishstat/en 155
http://www.fao.org/fishery/topic/16076/en 156
http://www.ecopath.org/

-255-
Step #2: Compile historical I&FF data and other input data for scenarios >>> Compile annual historical IF and FF data, disaggregated by investment entity and source
Countries should collect at least three years of historical I&FF data (i.e., for the base year and
two years during the previous decade). Ideally, countries would collect ten years of historical
data, i.e., for the base year and the previous nine years.
International forms for national accounts places fisheries into the category “agriculture,
hunting, forestry, and fishing”, which implies that identifying the actual investments in fisheries
alone may be difficult. The most relevant grouping of units for supply and use tables in the
System of National Accounts is the classification by economic activity. The economic activity
classification recommended by 93 SNA157
is UN’s International Standard Industrial Classification
(ISIC). ISIC is used to classify kind of activity units and establishments into industries, in which
fishing is included.
Historical data on the fisheries sector, including the sector major trends (current and potential
harvest, state of stocks, supply and demand, trade, fishing technology), as well as investment in
the sector (infrastructure, fleet and gear) and financial flows (associated with training and
research), will be available in the country. Such information is generally available through
governmental agencies, e.g. Government agencies dealing specifically with fisheries (e.g.
Fisheries Departments), or Ministries of Agriculture, Production (in some Latin America
Countries), Territorial Planning, Environment, or special governmental agencies dealing with
development related statistics.
Of particular interest towards data collection are the national statistical agencies in the
participating countries and the national research institutes specialized in fishery resources and
fishing. There are also studies including comparative analysis of investment and operational
costs for very specific investment decisions such as vessels acquisition or replacement.
To complement the national information available at the pertinent government institutions and
agencies and/or in the cases when data is not complete or partially not available to the project
team complementary data can be obtained from the following sources:
• FAO: The organization maintains a publicly available database FAOSTAT-fisheries that is
part of the FAO Statistical Database and provides statistics on fish production - on
fisheries and aquaculture - and primary products158
.
• The Fisheries and Aquaculture Department of the FAO maintains a publicly available
statistic database that provides information on the fishery sector159
which includes
global and regional statistical collections, fishery commodities and trade, global
157
International standards for compiling National Accounts statistics were laid out in the System of National Accounts 1993. 158
http://faostat.fao.org/site/629/default.aspx 159
http://www.fao.org/fishery/statistics/

-256-
production, global capture production, consumption of fish and fishery production,
among other series.
• The Fishery and Aquaculture Country Profile also made available by FAO includes very
detailed country profiles and sector information, fishery production and trade statistics,
and fishery legislation160
.
• Additional information can be obtained from the Fishery Resources Monitoring System
(FIRMS) whose primary aim is to provide access to a wide range of high-quality
information on the global monitoring and management of fishery marine resources161
.
• The World Bank provides a data base with statistical series on country information
under the Country Statistical Information Database162
.
• The International Institute of Fisheries Economics and Trade (IIFET) provides
information on marine resource economics, fisheries management, seafood trade and
markets throughout the world, aquaculture economics, and fisheries development163
.
• Fisheries global information networks:
o Aquatic Sciences and Fisheries Abstracts (ASFA), an abstracting and indexing
service164
o FishBase a relational database165
o Fisheries Library Networks166
o Ocean Biogeographic Information System (OBIS), web-based provider of global
geo-referenced information on marine species167
o United Nations Atlas of the Oceans, internet portal168
• Trade information networks:
o FISH INFO Network (FIN), consists of 7 independent intergovernmental
organisations and FAO GLOBEFISH169
There is a wealth of scientific literature that provides analysis and information that can
complement national information.
After the information on I&FF in the fisheries sector has been collected and compiled, the
national team has to decide on how to organize the available information and complete Table
2-4, which specifies the amount of I&FF per year, for each kind of investment type, according to
the policies and measures, plans, actions, programmes, activities, and projects that are being
160
http://www.fao.org/fishery/countryprofile/search/en/ 161
http://firms.fao.org/firms/en 162
http://go.worldbank.org/0EZUI59C70 163
http://oregonstate.edu/dept/iifet/ 164
http://www.fao.org/fishery/asfa/en 165
www.fishbase.org 166
http://www.fao.org/fishery/library/3/en 167
www.iobis.org 168
http://www.oceansatlas.org/index.jsp 169
http://www.infofish.org/

-257-
implemented, considering the origin of these investments according to the categories indicated
in the methodology chapter of the Guidebook.
To facilitate the task, the following table (Table 12-4) lists the different investment and financial
flows types that are being made in the fisheries sector. It is necessary to bear in mind that the
purpose of this table is to organize the information that is going to constitute the set of inputs
to complete Table 2.4., as presented in the General Methodology chapters 1 &2.
Table 12-4: Examples of investment flows and financial flows in the fisheries sector
Year 2005 List of investment flows and financial flows IF
(2005 US$) FF
(2005 US$) Equipment Wheelhouse Environment Handling
X
Management Access higher value markets Shifting of targeted species Exit fisheries
X
Aquaculture Technology Harvesting technology Feeding technology Selective breeding Genetic improvement Develop and use formulate pellet feeds Improve seed quality and production
X X
Management Feed management Hatchery seeding Fish meal and oil replacement Shifting of species alongside sites Relocation of production sites Biosecurity measures Water use efficiency Monitoring of early warning signals/ emergency procedures Develop mariculture options
X
Training Job diversification Use of new fishing technologies Management of aquaculture
X
Insurance Cluster insurance Pooling of risks Financial instruments
X
Research Forecasting Risk analysis Resource monitoring
X
X Indicates likely type of flow

-258-
>>> Compile annual historical O&M data, disaggregated by investment entity and source
The number of years for which historical O&M data are collected should be the same as is done
for historical I&FF data (i.e., for three to ten years). Information about the expected lifetimes of
the assets in operation during the historical period, and annual fluctuations in O&M costs, also
need to be collected. The O&M data that need to be collected may reside in one or more of
same locations for I&FF data (e.g., national accounts, ministry records and plans, industry
records, statistical agencies, utilities, research institutions). If such data are not available,
countries should utilize one of the following approaches to derive estimates:
• Adopt O&M cost data from similar assets in other countries, and adjust the O&M data
to in-country production and consumption rates.
• Derive estimates from proportional relationships between O&M costs and total costs, or
between O&M costs and capital costs (e.g., 10%, 25%, or 75%). Use either standard
assumptions about proportional relationships, or proportional relationships observed in
other countries.
When, for example, comparing cost structures of selected fleet of different regions, scales, and
types, the operating costs are typically divided into running, vessel and labour costs. The
general cost structure of a particular country or region and many other factors is as follows:
Table 12-5: Components of O&M in a fleet and range of variation in cost structure
Cost items Description % %
Running costs Costs of fuel, lubricants, selling fish via auction, preservation and storage of fish, packing materials, harbour dues, bait, salt, ice and food and supplies for the crew
31 – 33 29 – 30
Vessel costs Vessel insurance, vessel and gear repair, and maintenance expenses
19 - 28 18 – 24
Labour Wages and other labor charges (insurance and employers' contributions to pension funds)
25 – 44 22 – 42
Other costs 6 – 14 5 – 13 Total O&M costs
100 88 – 96
Capital costs 4 – 12
Table 2-5, as indicated in the methodology chapter, should be completed by including historical
annual O&M described in Table 12-5 associated to the investment flows types indicated in
Table 12-4, with the exclusion of financial flows corresponding to government programmes
(essentially FF in that table). If the assessment also includes aquaculture as a subsector the
same procedure applies. The major production costs that aquaculture operations require are
buying, feeding, and maintaining fish.

-259-
>>> Compile other input data for scenarios
What other input data are needed will depend on the analytical approach chosen, the sectoral
scope, and whether I&FF for mitigation or for adaptation measures are to be assessed. For
example, if a model is to be used, basic socioeconomic and technological data may be needed
for model inputs (e.g., population and economic growth projections, demand forecasts for
products and services, technology development forecasts). Also, development of appropriate
adaptation scenarios will require information about expected future impacts and sector
vulnerabilities.
Step #3: Define baseline scenario
The national team should ensure that the analysis of the evolution of the baseline scenario is
not a static one by considering the expected trends in the key variables that constitute the main
elements that define the baseline scenario. For the baseline scenario a set of assumptions on
the likely evolution of those variables should be defined on the understanding that the
historical trends will persist without additional measures other than the potential deterioration
of the conditions which determine the current situation. Marine fish stocks will continue to be
exploited. As an impact of climate change, in many countries the trend is declining capture
fisheries and growth of aquaculture. The overall evolution would show that the large-scale
climate-related changes in fisheries will likely bring either increased economic hardship or
missed opportunities for countries that depend upon them but lack capacity to adapt, or both.
If that is the case, the reference scenario should reflect those trends and should reflect
adjustment measures for the capture fisheries and stimulus for aquaculture, if any. Accordingly,
measures that would be introduced to address some of the current circumstances and conflicts,
as sustainable use regulations, improved standards, management decisions on market
approaches, codes of conduct and others, if currently being under consideration or
implemented, should also be included in the baseline scenario.
A model or a set of indicators (i.e. tons of fish caught/produced per specie, tons of fish
consumed per specie, seize and type of fishing fleet, number of fisheries, types of equipment
for fish catching, aquaculture technology, etc.) can be used in the analysis, to develop and
define the baseline scenario. Otherwise a sector plan, a projection of trends, or the current
situation (assuming no change), or some combination, can be used as the basis of the
projection. A sector development plan may have been developed by the relevant ministry or
government agency, or if sector investments are dominated by private sector entities,
investment plans may be available from those entities.
In cases in which countries have been increasingly aware of climate change adverse effects and
have already made progress in addressing climate change, these measures should be reflected
in the baseline scenario, rather than trying to separate out current action on climate change.
This is particularly important given the desired outcome of the analysis, specifically the
additional resources needed to address climate change, i.e., above and beyond resources
already invested in mitigation and adaptation.

-260-
Step #4: Derive I&FF estimates for baseline scenario >>> Derive annual IF and FF estimates, disaggregated by investment entity and source
In this step, the IF and FF for each of the options and measures identified in the previous step
will be estimated. Hence, for the identified indicators listed above (e.g., fish production, size of
fleet, technology, etc.) the associated investment and financial flows are estimated.
The source of these data, or method of derivation, will depend on the analytical approach
selected, the scope, and the types of investment entities that are relevant for the fisheries
sector.
The output of this step will be a stream of annual investment flows and/or financial flows for
each investment type in each subsector for the entire assessment period, by investment entity
and funding source. These data should be organized as in Table 2-3 in Chapter II.
>>> Derive annual O&M estimates, disaggregated by investment entity and source
Annual estimates of O&M costs for assets purchased during the assessment period, and for
assets purchased before the assessment period and that are expected to still be in operation,
need to be collected (or derived) for each component (i.e. capture, aquaculture, processing,
marketing). As mentioned in step 2 (Table 12-5), the O&M costs in the fisheries sector related
to the investment done during or before the assessment period are running costs, vessel costs,
labour costs and other operating or maintenance costs.
Step #5: Define adaptation scenario
The adaptation scenario contains the predicted climate change like the baseline scenario, but
here the policies and measures are not business-as-usual, but instead to adapt to climate
change, with options and measures as defined previously in the National Communication,
NAPA, and other national studies and strategies.
In addition, other drivers that are important in shaping fisheries production systems, such as
fishing pressure, fuel prices, future changes in trade flows and consumption patterns, are to be
taken into account when assessing and deciding on the optimal set of adaptation options. Both
adaptation research and adaptation practices are complex and the context of multiple stressors
must always be kept in mind.
If climate change is likely to lead to lower output from capture fisheries, continuing the trend of
growing aquaculture in detriment of fisheries, the adaptation scenario should have (more)
adjustment measures, possibly including shifts or policies encouraging aquaculture.
Operationally, the starting point for the definition of the adaptation scenario is to re-evaluate,
confirm or modify the preliminary set of the adaptation options that were identified in the
-261-
National Communication, NAPA, national studies etc.; thus the set should be now revised or
expanded if needed.
It is recommended that at this stage, countries also undertake a prioritization of the adaptation
measures, based on national or regional climate change concerns as well as national
development priorities, and preferred sustainability pathways. This initial prioritization will be
re-evaluated in the step #8 of the assessment of I&FF.
Step #6: Derive I&FF for adaptation >>> Derive annual IF and FF estimates, disaggregated by investment entity and source
In this step, as in step 4, the IF and FF for each of the options and measures identified in the
adaptation scenario (previous step) will be estimated. That is, annual IF for the adaptation
scenario (facilities, equipment and infrastructure investments), and annual FF for the
adaptation scenario (technology, training, insurance and research), are estimated for each
component. In consequence, for the selected indicators in the baseline and adaptation
scenarios (e.g. fish production, size of fleet, technology, etc.) the associated investment and
financial flows are estimated.
The output of this step will be a stream of annual investment flows and/or financial flows for
each investment type for the entire assessment period, by investment entity and funding
source. These data should be organized as in Table 2-3 in Chapter II.
>>> Derive annual O&M estimates, disaggregated by investment entity and source
As in step 4, the O&M are estimated but for the adaptation scenario. The output of this step
will be a stream of annual O&M costs for each investment type for the entire assessment
period, disaggregated by investment entity and source.
Step #7: Estimate changes in I&FF needed to implement adaptation
The changes in IF, FF, and O&M costs that are needed to implement the adaptation measures in
the fisheries sector are calculated according to the general methodology as outlined in Step 7 in
Chapter 2 of this Guidelines. The changes in investments and financial flows are obtained by
subtracting baseline scenario costs from climate change scenario costs. There are two primary
objectives of this step: 1) to determine how cumulative IF, FF, and O&M costs would change;
and 2) to determine how annual IF, FF, and O&M costs would change. Five separate sets of
calculations should be completed – two for estimating changes in cumulative IF, FF, and O&M,
and three for estimating changes in annual IF, FF, and O&M. In addition, if subsidy costs are
included explicitly in the assessment, the changes in subsidy costs may be calculated. The
accompanying volume on reporting (Reporting Guidelines for the Assessment of Investment
and Financial Flows to Address Climate Change) contains worksheets that can be used as
models for developing country-specific worksheets for performing these calculations.

-262-
Step #8: Evaluate policy implications
Fishery sector policies will be needed to induce the relevant entities identified in the
assessment to implement the proposed measures and incur the related I&FF. It will be
important to convene a discussion among relevant stakeholder regarding the set of regulations
and incentives necessary to influence investment decisions. When addressing policy options,
social, economic and environmental benefits should be assessed qualitatively.
The evaluation should allow the formulation and implementation of appropriate policies at the
national and also at the regional scale, considering the broader view of exposure and
vulnerability patterns in the country, and eventually facilitate comparison across natural
resource-dependent industries, potentially providing insight into and allowing for the
consideration of processes that cause and exacerbate vulnerability in countries participating of
the assessment.
In that regard there is a critical need for design and implementation of sound public policies to
minimize impacts of climate change and enhance adaptive capacity in the fisheries sector by,
inter alia:
a) Building institutional and legal frameworks that acknowledge climate change impacts
and consider them in conjunction with other existing pressures in the sector such as
overfishing and pollution as well as with other relevant sectors at the country level.
b) Analyzing the long-range perspective of tensions at a national level between fisheries
demand and production and domestic supply and international demand for use in
fisheries policy development.
c) Identify and quantifying the linkages between the demands generated by human
population growth and income level and their effects on a range of natural resources, in
particular capture fisheries and aquaculture.
d) Analyzing the specific impacts on livelihoods related to the fisheries sector, the
exposure and vulnerability of fishery communities and the direct and indirect of climate
change on food access and security.
e) Identifying, formulating and testing a range of policy options which address demand and
supply potential imbalances at the national level out to 2030, including a framework of
policy incentives, instruments and measures directed at ensuring food security while
preserving the environment.
f) Using, as appropriate, the ecosystem approach to fisheries and aquaculture, and
monitor environmental impacts of those and related activities in a context of increasing
environmental stresses, while considering the principles and standards of the code of
conduct for responsible fisheries.
g) Supporting initiatives, such as creation of property rights and other incentive
mechanisms, to reduce fishing effort in overexploited fisheries, and linking appropriate
financing instruments for change.
h) Eliminating harmful subsidies and perverse incentives, such as subsidizing fishing fleets
under stress (through direct funding, cheaper fuel, or tax cuts) that serves to allow

-263-
unprofitable fisheries to continue operating and further depresses the state of the fish
stocks.
i) Strengthening future fisheries management policies by providing comprehensive, long-
term view of the dynamics of production and demand for resources.
j) Enabling fisheries to be properly incorporated into national programs to model future
natural resource demand, demographic trends and climate change evolving scenarios.

-264-