Embed Size (px)
Citation preview
Xiang, Yetao and Gan, Guohui (2015) Optimization of building-integrated photovoltaic thermal air system combined with thermal storage. International Journal of Low-Carbon Technologies, 10 (2). pp. 146-156. ISSN 1748-1325
Access from the University of Nottingham repository: http://eprints.nottingham.ac.uk/34699/1/ijlct.ctv010_Xiang.pdf
Copyright and reuse:
The Nottingham ePrints service makes this work by researchers of the University of Nottingham available open access under the following conditions.
This article is made available under the Creative Commons Attribution licence and may be reused according to the conditions of the licence. For more details see: http://creativecommons.org/licenses/by/2.5/
A note on versions:
The version presented here may differ from the published version or from the version of record. If you wish to cite this item you are advised to consult the publisher’s version. Please see the repository url above for details on accessing the published version and note that access may require a subscription.
For more information, please contact [email protected]
. . . . . . . . . . . . . . . . . . . . . . . . . . . . . . . . . . . . . . . . . . . . . . . . . . . . . . . . . . . . . . . . . . . . . . . . . . . . . . . . . . . . . . . . . . . . . . . . . . . . . . . . . . . . . . . . . . . . . . . . . . . . . . . . . . . . . . . . . . . . . . . . . . . . . . . . . . . . . .
. . . . . . . . . . . . . . . . . . . . . . . . . . . . . . . . . . . . . . . . . . . . . . . . . . . . . . . . . . . . . . . . . . . . . . . . . . . . . . . . . . . . . . . . . . . . . . . . . . . . . . . . . . . . . . . . . . . . . . . . . . . . . . . . . . . . . . . . . . . . .
. . . . . . . . . . . . . . . . . . . . . . . . . . . . . . . . . . . . . . . . . . . . . . . . . . . . . . . . . . . . . . . . . . . . . . . . . . . . . . . . . . . . . . . . . . . . . . . . . . . . . . . . . . . . . . . . . . . . . . . . . . . . . . . . . . . . . . . . . . . . . . . . . . . . . . . . . . . . . . . . . . . . . . . . . . . . . . . .
Optimization of building-integratedphotovoltaic thermal air systemcombined with thermal storage
Yetao Xiang* and Guohui Gan
Faculty of Engineering, Energy and Sustainability Division, University of Nottingham,Nottingham, UK
*Corresponding author.
AbstractPhotovoltaic (PV) combined with phase change material (PV/PCM) system is a hybrid solar system that uses
a PCM to reduce the PV temperature and to store energy for other applications. This study aims to increase
the integrated PV efficiency of buildings by incorporating PCM while utilizing the stored heat in PCM forcontrolling indoor conditions. Experiments have been carried out on a prototype PV/PCM air system using
monocrystalline PV modules. Transient simulations of the system performance have also been performed
using a commercial computational fluid dynamics package based on the finite volume method. The resultsfrom simulation were validated by comparing it with experimental results. The results indicate that PCM is
effective in limiting temperature rise in PV device and the heat from PCM can enhance night ventilation and
decrease the building energy consumption to achieve indoor thermal comfort for certain periods of time.
Keywords: photovoltaic; phase change material; hybrid solar; BIPV
Received 13 November 2014; revised 13 March 2015; accepted 15 March 2015
1 INTRODUCTION
There are factors that can affect the efficiency of a photovoltaic
(PV) panel, among which the operating temperature of the PV
cell could be a very important one. High operating temperatureslead to a drop in the electrical conversion efficiency at a rate of
≏0.5%/8C for crystalline PV cells. In summer, the cell tempera-
ture can reach 708C which reduces the conversion efficiency by22.5% drop from the standard test conditions [1]. In recent
years, great attentions have been paid to control the PV cell tem-
perature. Researchers have tried out various techniques includ-ing active cooling and passive heat removal [2, 3]. Active cases
usually use a pump or fan to circulate water or air to cool the PV
panel. Passive methods involve the use of a duct at one or bothsides of PV for natural ventilation, or high heat capacity material
such as PCM at the back of PV for direct absorbing heat.
In a building-integrated PV (BIPV) system, passive heatremoval usually relies on buoyant flow of air through an
opening or an air channel duct at either front or back of the PV
panel [4]. Yun et al. [5] presented an investigation on a naturallyventilated wall-integrated PV system with an opening behind the
PV. The results indicated a monthly maximum temperature re-
duction of 58C due to natural ventilation leading to an annualincrease of 2.5% in an electrical output of the PV.
In residential buildings, solar energy is usually lowest when thethermal requirement is most, which makes the thermal energy
storage systems very important in solar thermal application.
Energy demands in buildings vary on daily, weekly and seasonalbases. Thermal energy storage systems can help with these
demands. The use of thermal energy storage for thermal applica-
tion such as space and water heating, cooling and air conditioningalso has recently received much attention. Phase change material
(PCM) has been proved a great thermal control material in the
building environment field [6–8]. Researches have shown that in-corporating PCM with certain designed melting temperature
similar to the PV characterizing temperature for the thermal regu-
lation of BIPV under cyclic time-dependent solar energy input isa promising approach to temperature control. At the same time,
the energy stored in the PCM can be released to provide building
heating and enhance natural ventilation at night.Huang et al. [9] presented an experimental investigation on
which the PCM was contained in an aluminum box with itsfront surface coated with a solar absorption material to represent
PV cell attached to its front. They performed a study on the tem-
perature distributions on the front surface and inside PCM withand without fins at different insolation. They also developed 2D
and 3D finite volume heat transfer simulation models to investi-
gate PCM performance for BIPV thermal regulation [10, 11].
International Journal of Low-Carbon Technologies 2015, 10, 146–156# The Author 2015. Published by Oxford University Press.This is an Open Access article distributed under the terms of the Creative Commons Attribution License (http://creativecommons.org/licenses/by/4.0/), whichpermits unrestricted reuse, distribution, and reproduction in any medium, provided the original work is properly cited.doi:10.1093/ijlct/ctv010 Advance Access Publication 20 April 2015 146
at University of N
ottingham on July 28, 2015
http://ijlct.oxfordjournals.org/D
ownloaded from
Hasan et al. [2] attached a PV module to a rectangular aluminum
box containing PCM which was irradiated at 415 W/m2. The result
showed a 108C temperature reductions for 6 h compared with aPVattached to the box without PCM.
Most of investigations on PV/PCM were focused on energy
store and release of PCM only, and less attention was paid tocombining the convection factor into the model or experiment.
In reality, the heat transfer at the back side of the PV/PCM
system varies with the ambient condition, and it will be helpfulif this heat transfer can be enhanced. This study aims to increase
the PV efficiency by incorporating PCM while utilizing the
stored heat from PCM for conditioning indoor air.
2 MATERIALS AND METHODS
The literature review indicates that modeling of phase change and
natural convection processes presents a significant challenge, due
to complexity of the involved physical phenomena [12]. On theother hand, natural air flow is always difficult to predict due to its
uncontrollable behavior. In this study, computational fluid dy-namics (CFD) was used to simulate the two processes together.
There are two main thermal characteristics during the phase
change, enthalpy temperature relationship and temperature hyster-esis. The ANSYS Fluent code was used to solve the governing equa-
tions. The default model of phase change in the software is an
enthalpy-porosity model which treats the solidified region as aporous medium. The porosity in each cell is set equal to the liquid
fraction in that cell and appropriate momentum sink terms are
added to the momentum equations to account for the pressuredrop caused by the presence of a solid material [13]. In fully solidi-
fied regions, the porosity is equal to zero, which extinguishes the
velocities in these regions. The mushy zone is a region in which theliquid fraction lies between 0 and 1. Its properties are determined
using a lever rule based on the difference between the melting and
freezing temperatures. The lever rule calculates the density, viscos-ity and heat capacity of the mushy zone based on a proportionally
weighted average of the liquid and solid properties. Susman et al.
[14] employed the enthalpy-porosity method to simulate PCMsails and found that the method produced reasonable temperature
prediction in global space temperature terms. Assis et al. [15]
carried out a numerical and an experimental investigation of themelting process of RT27 with a PCM in a spherical geometry filled
with 98.5% solid PCM as an initial condition of the simulation.
They concluded that CFD is an effective way to study the PCM.Boussinesq approximation was used for natural air flow
because the variations in temperature and density are small. At
the same time, variations in volume expansion due to tempera-ture gradients will also be small. The purpose of this study is to
optimize the design of BIPV/PCM system, so some assumptions
have been made to simplify the simulation process and reducecomputation time: (a) thermophysical properties of the material
are constant for liquid and solid. (b) Thermal expansion and
motion of the PCM due to phase change are neglected becausePCM made from hydrated salt has very small thermal expansion
factor and because the magnitude of estimated velocity in the
fully melted PCM is only about 0.0001 m/s. (c) Contact resist-
ance between the PCM and container is neglected.
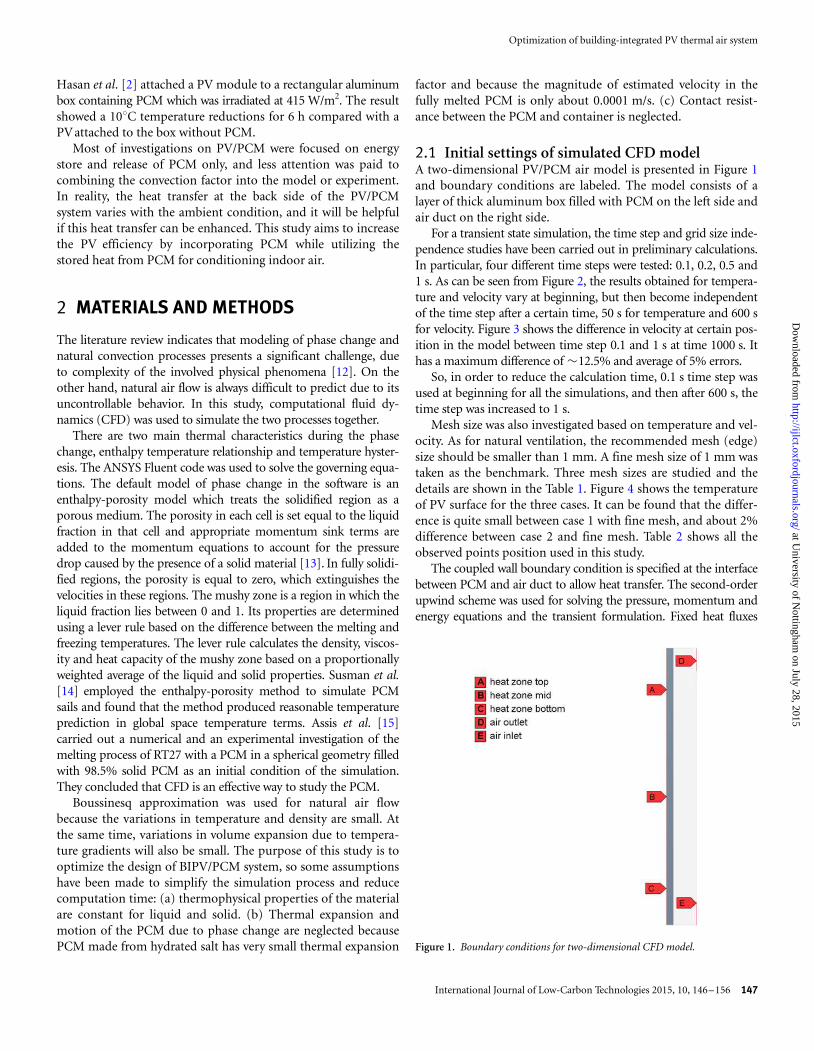
2.1 Initial settings of simulated CFD modelA two-dimensional PV/PCM air model is presented in Figure 1and boundary conditions are labeled. The model consists of a
layer of thick aluminum box filled with PCM on the left side and
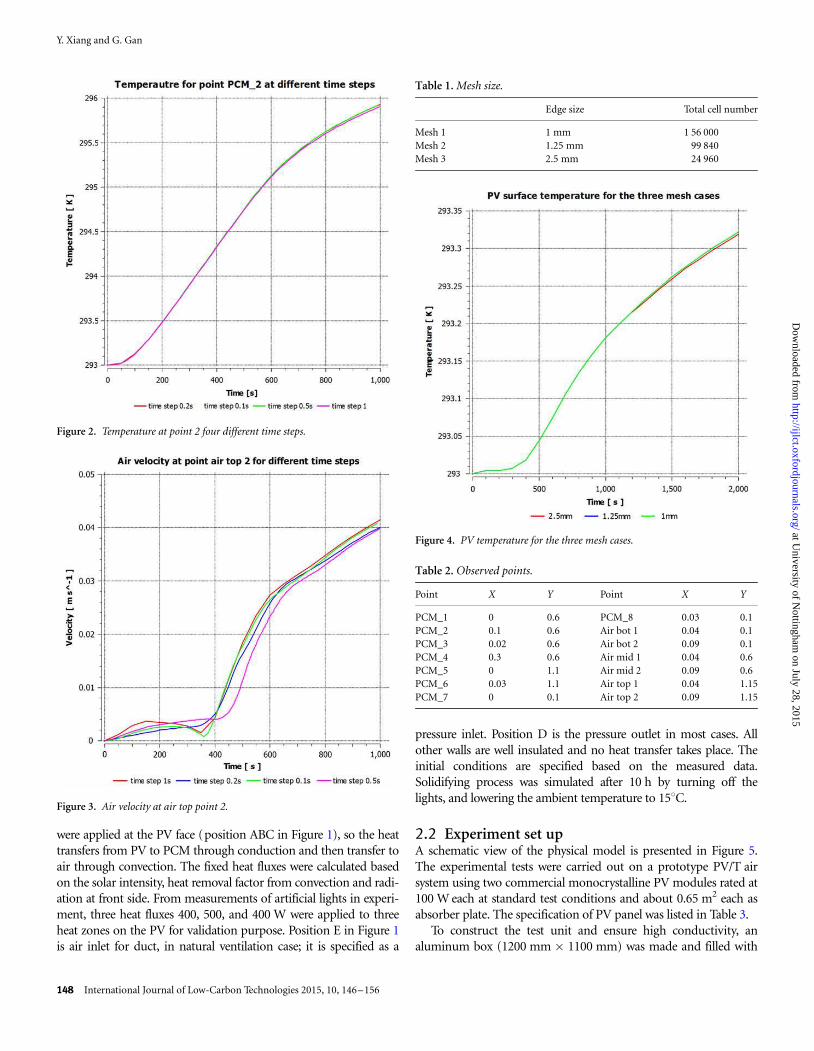
air duct on the right side.For a transient state simulation, the time step and grid size inde-
pendence studies have been carried out in preliminary calculations.
In particular, four different time steps were tested: 0.1, 0.2, 0.5 and1 s. As can be seen from Figure 2, the results obtained for tempera-
ture and velocity vary at beginning, but then become independent
of the time step after a certain time, 50 s for temperature and 600 sfor velocity. Figure 3 shows the difference in velocity at certain pos-
ition in the model between time step 0.1 and 1 s at time 1000 s. It
has a maximum difference of ≏12.5% and average of 5% errors.So, in order to reduce the calculation time, 0.1 s time step was
used at beginning for all the simulations, and then after 600 s, the
time step was increased to 1 s.Mesh size was also investigated based on temperature and vel-
ocity. As for natural ventilation, the recommended mesh (edge)
size should be smaller than 1 mm. A fine mesh size of 1 mm wastaken as the benchmark. Three mesh sizes are studied and the
details are shown in the Table 1. Figure 4 shows the temperature
of PV surface for the three cases. It can be found that the differ-ence is quite small between case 1 with fine mesh, and about 2%
difference between case 2 and fine mesh. Table 2 shows all the
observed points position used in this study.The coupled wall boundary condition is specified at the interface
between PCM and air duct to allow heat transfer. The second-order
upwind scheme was used for solving the pressure, momentum andenergy equations and the transient formulation. Fixed heat fluxes
Figure 1. Boundary conditions for two-dimensional CFD model.
Optimization of building-integrated PV thermal air system
International Journal of Low-Carbon Technologies 2015, 10, 146–156 147
at University of N
ottingham on July 28, 2015
http://ijlct.oxfordjournals.org/D
ownloaded from
were applied at the PV face (position ABC in Figure 1), so the heattransfers from PV to PCM through conduction and then transfer to
air through convection. The fixed heat fluxes were calculated based
on the solar intensity, heat removal factor from convection and radi-ation at front side. From measurements of artificial lights in experi-
ment, three heat fluxes 400, 500, and 400 W were applied to three
heat zones on the PV for validation purpose. Position E in Figure 1is air inlet for duct, in natural ventilation case; it is specified as a
pressure inlet. Position D is the pressure outlet in most cases. All
other walls are well insulated and no heat transfer takes place. The
initial conditions are specified based on the measured data.Solidifying process was simulated after 10 h by turning off the
lights, and lowering the ambient temperature to 158C.
2.2 Experiment set upA schematic view of the physical model is presented in Figure 5.
The experimental tests were carried out on a prototype PV/T air
system using two commercial monocrystalline PV modules rated at100 Weach at standard test conditions and about 0.65 m2 each as
absorber plate. The specification of PV panel was listed in Table 3.
To construct the test unit and ensure high conductivity, analuminum box (1200 mm � 1100 mm) was made and filled with
Figure 3. Air velocity at air top point 2.
Figure 2. Temperature at point 2 four different time steps.
Figure 4. PV temperature for the three mesh cases.
Table 2. Observed points.
Point X Y Point X Y
PCM_1 0 0.6 PCM_8 0.03 0.1
PCM_2 0.1 0.6 Air bot 1 0.04 0.1
PCM_3 0.02 0.6 Air bot 2 0.09 0.1
PCM_4 0.3 0.6 Air mid 1 0.04 0.6
PCM_5 0 1.1 Air mid 2 0.09 0.6
PCM_6 0.03 1.1 Air top 1 0.04 1.15
PCM_7 0 0.1 Air top 2 0.09 1.15
Table 1.Mesh size.
Edge size Total cell number
Mesh 1 1 mm 1 56 000
Mesh 2 1.25 mm 99 840
Mesh 3 2.5 mm 24 960
Y. Xiang and G. Gan
148 International Journal of Low-Carbon Technologies 2015, 10, 146–156
at University of N
ottingham on July 28, 2015
http://ijlct.oxfordjournals.org/D
ownloaded from
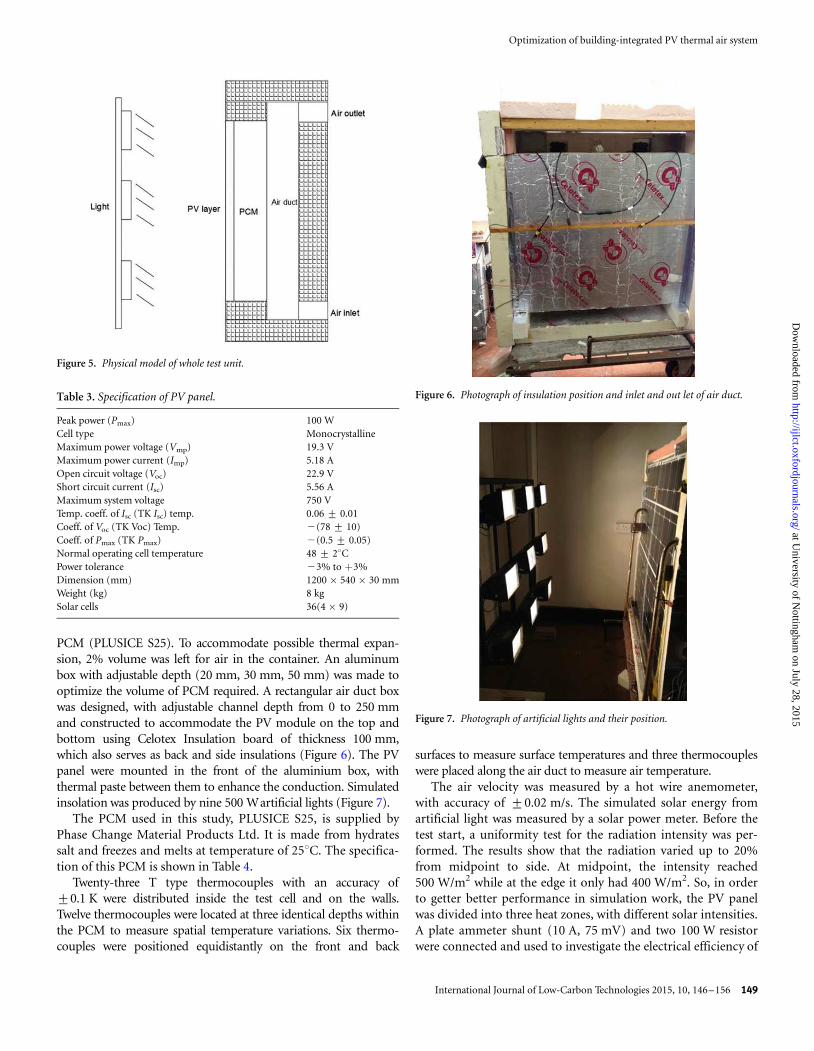
PCM (PLUSICE S25). To accommodate possible thermal expan-sion, 2% volume was left for air in the container. An aluminum
box with adjustable depth (20 mm, 30 mm, 50 mm) was made to
optimize the volume of PCM required. A rectangular air duct boxwas designed, with adjustable channel depth from 0 to 250 mm
and constructed to accommodate the PV module on the top and
bottom using Celotex Insulation board of thickness 100 mm,which also serves as back and side insulations (Figure 6). The PV
panel were mounted in the front of the aluminium box, with
thermal paste between them to enhance the conduction. Simulatedinsolation was produced by nine 500 Wartificial lights (Figure 7).
The PCM used in this study, PLUSICE S25, is supplied by
Phase Change Material Products Ltd. It is made from hydratessalt and freezes and melts at temperature of 258C. The specifica-
tion of this PCM is shown in Table 4.
Twenty-three T type thermocouples with an accuracy of+0.1 K were distributed inside the test cell and on the walls.
Twelve thermocouples were located at three identical depths within
the PCM to measure spatial temperature variations. Six thermo-couples were positioned equidistantly on the front and back
surfaces to measure surface temperatures and three thermocouples
were placed along the air duct to measure air temperature.
The air velocity was measured by a hot wire anemometer,with accuracy of +0.02 m/s. The simulated solar energy from
artificial light was measured by a solar power meter. Before the
test start, a uniformity test for the radiation intensity was per-formed. The results show that the radiation varied up to 20%
from midpoint to side. At midpoint, the intensity reached
500 W/m2 while at the edge it only had 400 W/m2. So, in orderto getter better performance in simulation work, the PV panel
was divided into three heat zones, with different solar intensities.
A plate ammeter shunt (10 A, 75 mV) and two 100 W resistorwere connected and used to investigate the electrical efficiency of
Table 3. Specification of PV panel.
Peak power (Pmax) 100 W
Cell type Monocrystalline
Maximum power voltage (Vmp) 19.3 V
Maximum power current (Imp) 5.18 A
Open circuit voltage (Voc) 22.9 V
Short circuit current (Isc) 5.56 A
Maximum system voltage 750 V
Temp. coeff. of Isc (TK Isc) temp. 0.06+ 0.01
Coeff. of Voc (TK Voc) Temp. 2(78+ 10)
Coeff. of Pmax (TK Pmax) 2(0.5+ 0.05)
Normal operating cell temperature 48+ 28C
Power tolerance 23% to þ3%
Dimension (mm) 1200 � 540 � 30 mm
Weight (kg) 8 kg
Solar cells 36(4 � 9)
Figure 5. Physical model of whole test unit.
Figure 6. Photograph of insulation position and inlet and out let of air duct.
Figure 7. Photograph of artificial lights and their position.
Optimization of building-integrated PV thermal air system
International Journal of Low-Carbon Technologies 2015, 10, 146–156 149
at University of N
ottingham on July 28, 2015
http://ijlct.oxfordjournals.org/D
ownloaded from
the PV panel. All temperature data and electrical data of PVwere recorded at an interval of 1 min by a DT800 data logger.
Before each experiment was started, it was ensured that all
temperatures in the cell were at the steady state, for the validinitialization of the CFD models. This would take about 10 h.
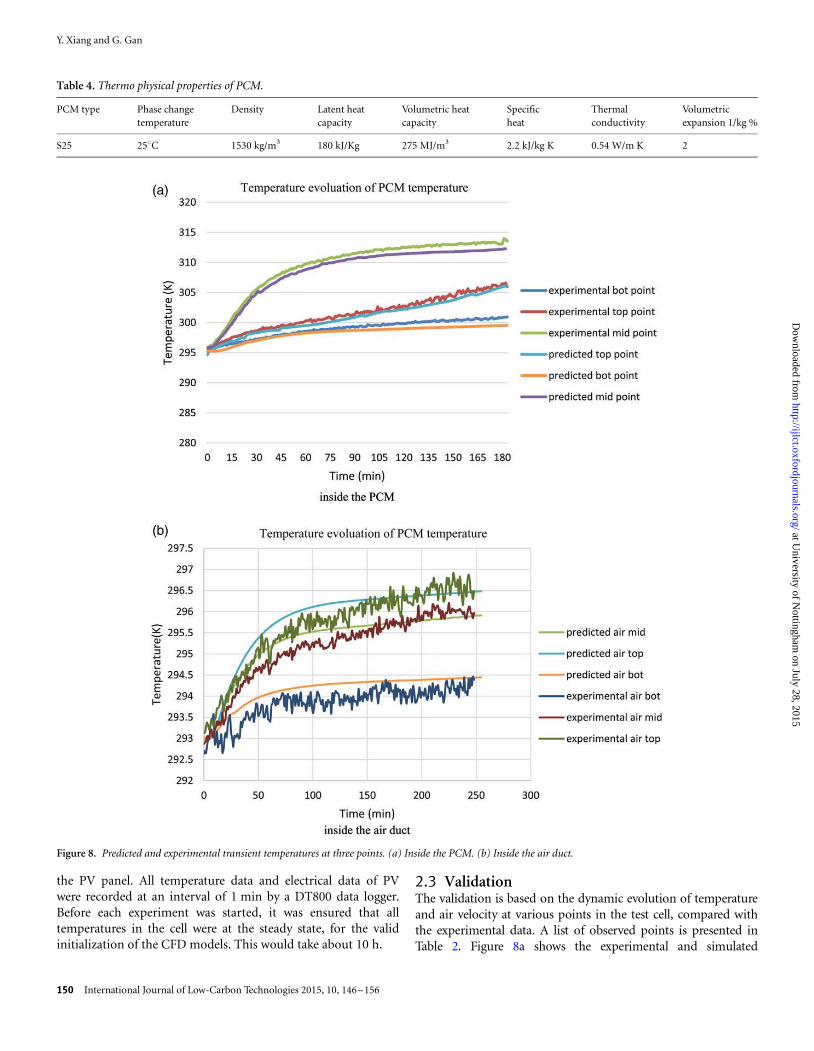
2.3 ValidationThe validation is based on the dynamic evolution of temperature
and air velocity at various points in the test cell, compared withthe experimental data. A list of observed points is presented in
Table 2. Figure 8a shows the experimental and simulated
Table 4. Thermo physical properties of PCM.
PCM type Phase change
temperature
Density Latent heat
capacity
Volumetric heat
capacity
Specific
heat
Thermal
conductivity
Volumetric
expansion 1/kg %
S25 258C 1530 kg/m3 180 kJ/Kg 275 MJ/m3 2.2 kJ/kg K 0.54 W/m K 2
Figure 8. Predicted and experimental transient temperatures at three points. (a) Inside the PCM. (b) Inside the air duct.
Y. Xiang and G. Gan
150 International Journal of Low-Carbon Technologies 2015, 10, 146–156
at University of N
ottingham on July 28, 2015
http://ijlct.oxfordjournals.org/D
ownloaded from
temperatures of three thermocouples in the PCM unit. The tem-
perature curves of experiment and simulation are very close to
each other, with a maximum difference of about 8%. However,the predicted temperature is slightly lower than the experimental
one.
Figure 8b shows the predicted transient temperature of threepoints in the air duct. The agreement between experiment and
numerical simulation is reasonable. However, the difference
between experimental and predicted results is larger than the tem-perature in PCM. For lower temperatures obtained, the difference
on average is ≏1.08C and, for the higher temperatures, the differ-
ence differs ≏3.58C between the two results. The possible sourcesof error for the simulation include neglecting the conduction
resistance of the container box, the natural convection inside the
PCM and radiation heat transfer and the uncertainty in the ther-mocouples (+0.2 K) and other instrumentation.
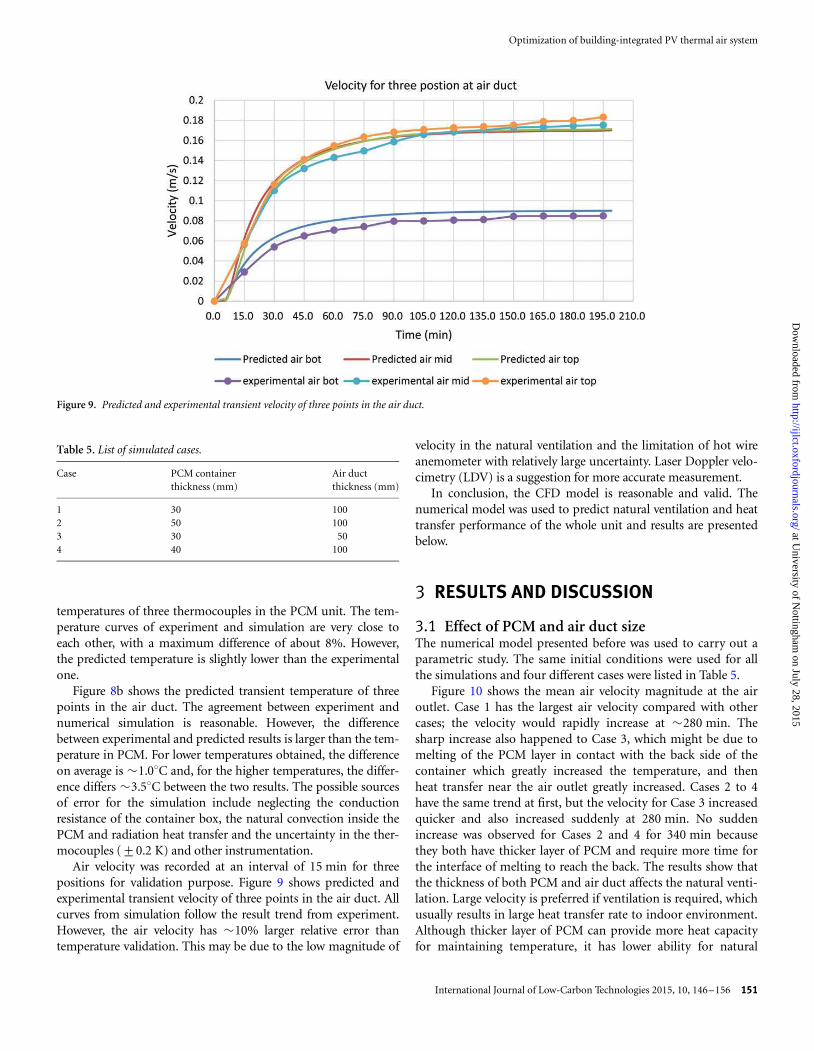
Air velocity was recorded at an interval of 15 min for three
positions for validation purpose. Figure 9 shows predicted andexperimental transient velocity of three points in the air duct. All
curves from simulation follow the result trend from experiment.
However, the air velocity has ≏10% larger relative error thantemperature validation. This may be due to the low magnitude of
velocity in the natural ventilation and the limitation of hot wire
anemometer with relatively large uncertainty. Laser Doppler velo-
cimetry (LDV) is a suggestion for more accurate measurement.In conclusion, the CFD model is reasonable and valid. The
numerical model was used to predict natural ventilation and heat
transfer performance of the whole unit and results are presentedbelow.
3 RESULTS AND DISCUSSION
3.1 Effect of PCM and air duct sizeThe numerical model presented before was used to carry out aparametric study. The same initial conditions were used for all
the simulations and four different cases were listed in Table 5.
Figure 10 shows the mean air velocity magnitude at the airoutlet. Case 1 has the largest air velocity compared with other
cases; the velocity would rapidly increase at ≏280 min. The
sharp increase also happened to Case 3, which might be due tomelting of the PCM layer in contact with the back side of the
container which greatly increased the temperature, and then
heat transfer near the air outlet greatly increased. Cases 2 to 4have the same trend at first, but the velocity for Case 3 increased
quicker and also increased suddenly at 280 min. No sudden
increase was observed for Cases 2 and 4 for 340 min becausethey both have thicker layer of PCM and require more time for
the interface of melting to reach the back. The results show that
the thickness of both PCM and air duct affects the natural venti-lation. Large velocity is preferred if ventilation is required, which
usually results in large heat transfer rate to indoor environment.
Although thicker layer of PCM can provide more heat capacityfor maintaining temperature, it has lower ability for natural
Figure 9. Predicted and experimental transient velocity of three points in the air duct.
Table 5. List of simulated cases.
Case PCM container
thickness (mm)
Air duct
thickness (mm)
1 30 100
2 50 100
3 30 50
4 40 100
Optimization of building-integrated PV thermal air system
International Journal of Low-Carbon Technologies 2015, 10, 146–156 151
at University of N
ottingham on July 28, 2015
http://ijlct.oxfordjournals.org/D
ownloaded from
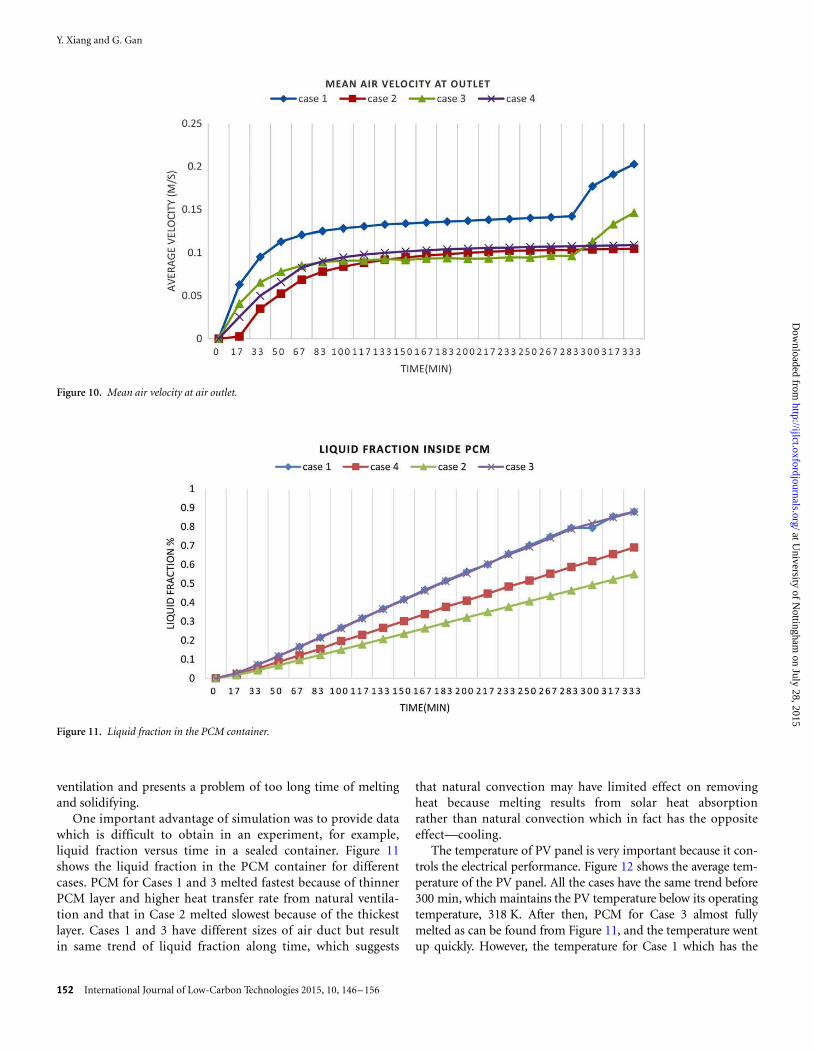
ventilation and presents a problem of too long time of meltingand solidifying.
One important advantage of simulation was to provide data
which is difficult to obtain in an experiment, for example,liquid fraction versus time in a sealed container. Figure 11
shows the liquid fraction in the PCM container for different
cases. PCM for Cases 1 and 3 melted fastest because of thinnerPCM layer and higher heat transfer rate from natural ventila-
tion and that in Case 2 melted slowest because of the thickest
layer. Cases 1 and 3 have different sizes of air duct but resultin same trend of liquid fraction along time, which suggests
that natural convection may have limited effect on removingheat because melting results from solar heat absorption
rather than natural convection which in fact has the opposite
effect—cooling.The temperature of PV panel is very important because it con-
trols the electrical performance. Figure 12 shows the average tem-
perature of the PV panel. All the cases have the same trend before300 min, which maintains the PV temperature below its operating
temperature, 318 K. After then, PCM for Case 3 almost fully
melted as can be found from Figure 11, and the temperature wentup quickly. However, the temperature for Case 1 which has the
Figure 10. Mean air velocity at air outlet.
Figure 11. Liquid fraction in the PCM container.
Y. Xiang and G. Gan
152 International Journal of Low-Carbon Technologies 2015, 10, 146–156
at University of N
ottingham on July 28, 2015
http://ijlct.oxfordjournals.org/D
ownloaded from
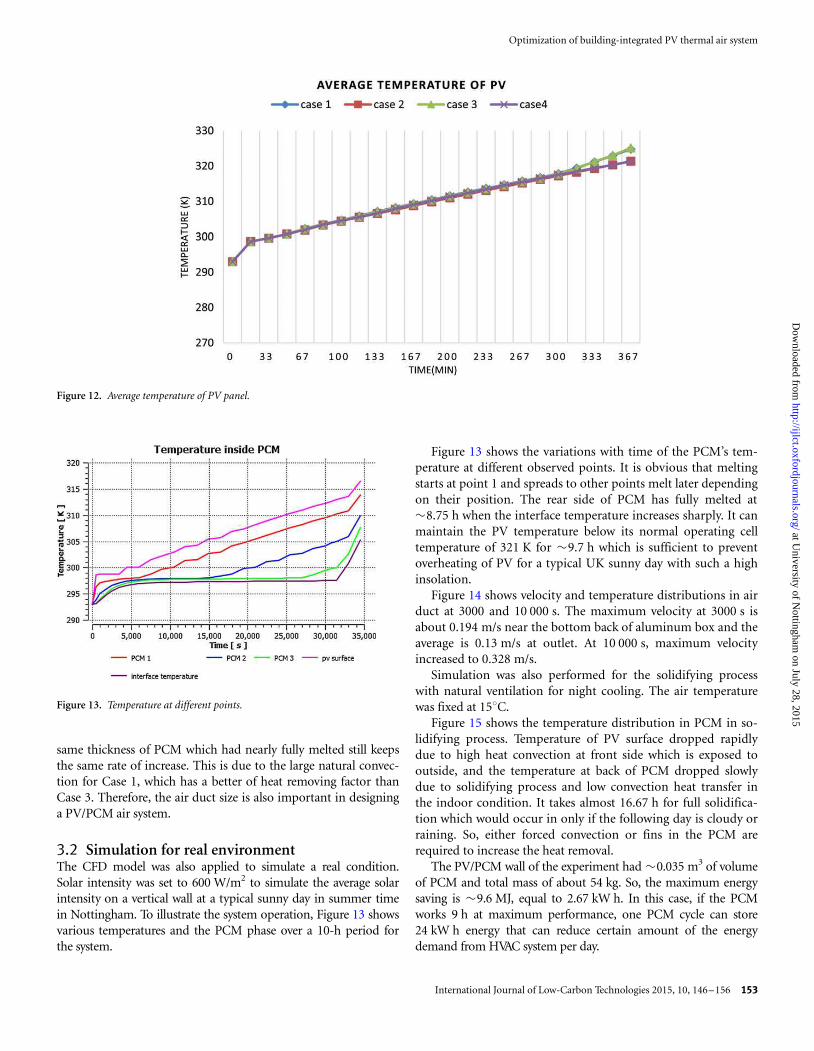
same thickness of PCM which had nearly fully melted still keeps
the same rate of increase. This is due to the large natural convec-tion for Case 1, which has a better of heat removing factor than
Case 3. Therefore, the air duct size is also important in designing
a PV/PCM air system.
3.2 Simulation for real environmentThe CFD model was also applied to simulate a real condition.
Solar intensity was set to 600 W/m2 to simulate the average solarintensity on a vertical wall at a typical sunny day in summer time
in Nottingham. To illustrate the system operation, Figure 13 shows
various temperatures and the PCM phase over a 10-h period forthe system.
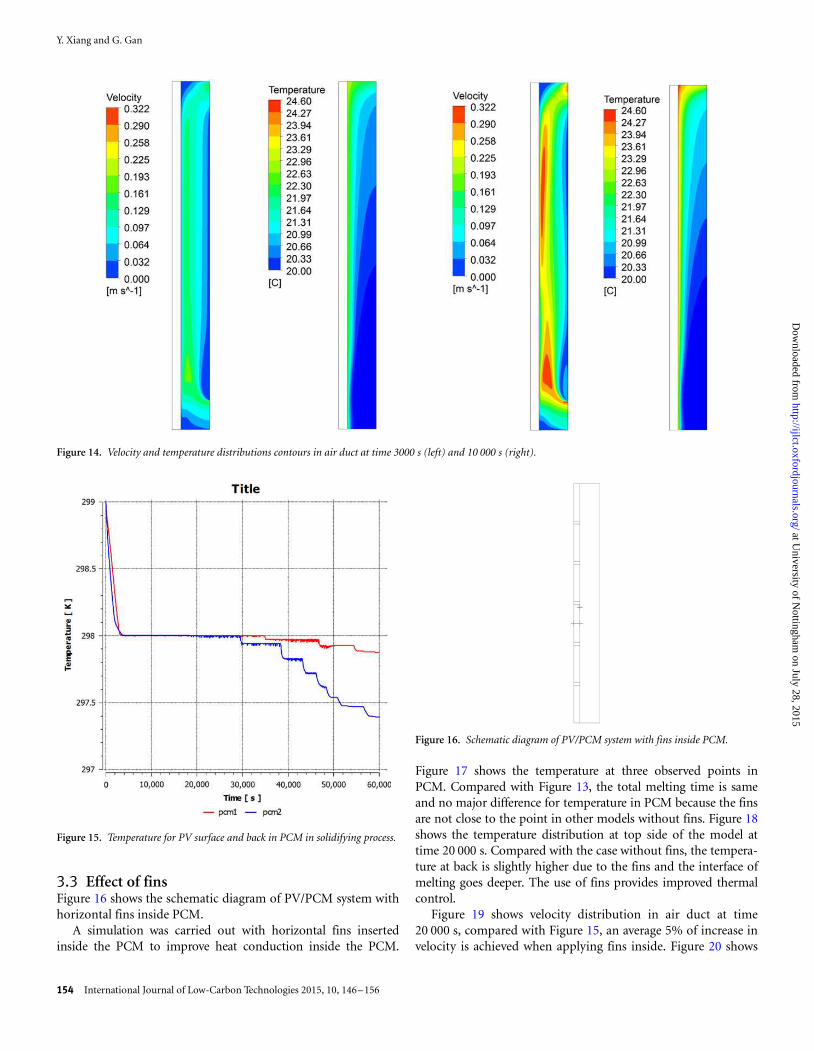
Figure 13 shows the variations with time of the PCM’s tem-perature at different observed points. It is obvious that melting
starts at point 1 and spreads to other points melt later depending
on their position. The rear side of PCM has fully melted at≏8.75 h when the interface temperature increases sharply. It can
maintain the PV temperature below its normal operating cell
temperature of 321 K for ≏9.7 h which is sufficient to preventoverheating of PV for a typical UK sunny day with such a high
insolation.
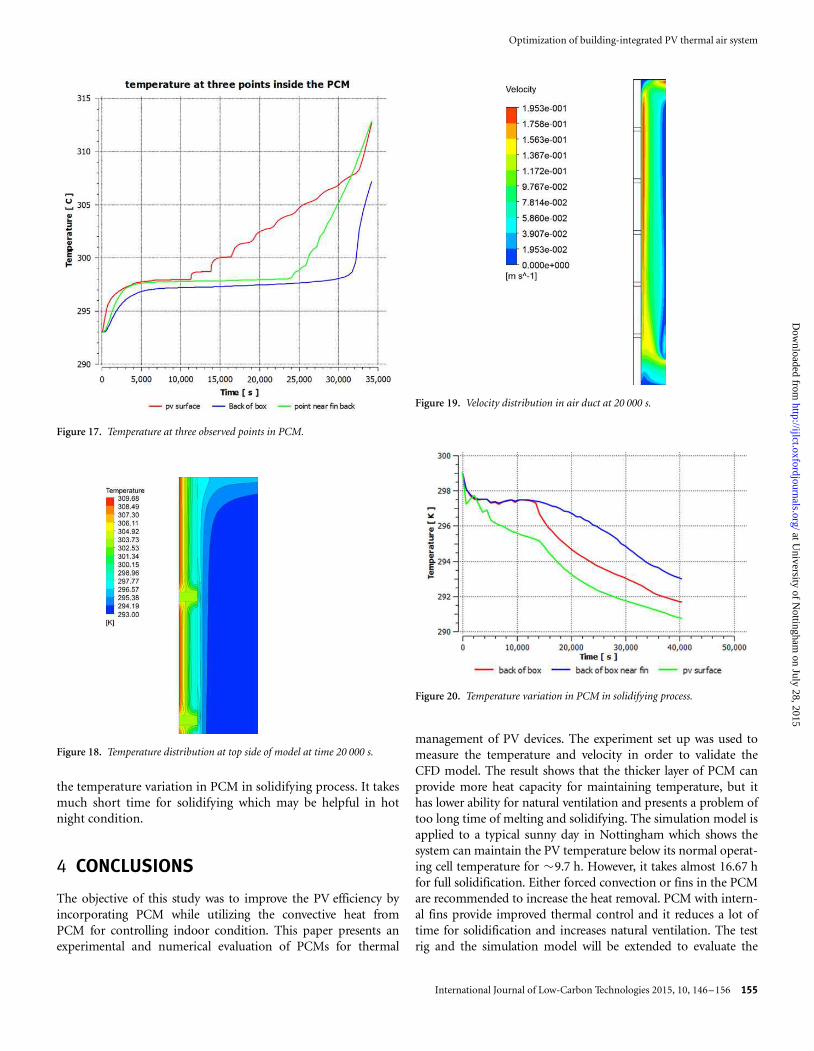
Figure 14 shows velocity and temperature distributions in airduct at 3000 and 10 000 s. The maximum velocity at 3000 s is
about 0.194 m/s near the bottom back of aluminum box and the
average is 0.13 m/s at outlet. At 10 000 s, maximum velocityincreased to 0.328 m/s.
Simulation was also performed for the solidifying process
with natural ventilation for night cooling. The air temperaturewas fixed at 158C.
Figure 15 shows the temperature distribution in PCM in so-
lidifying process. Temperature of PV surface dropped rapidlydue to high heat convection at front side which is exposed to
outside, and the temperature at back of PCM dropped slowly
due to solidifying process and low convection heat transfer inthe indoor condition. It takes almost 16.67 h for full solidifica-
tion which would occur in only if the following day is cloudy or
raining. So, either forced convection or fins in the PCM arerequired to increase the heat removal.
The PV/PCM wall of the experiment had ≏0.035 m3 of volume
of PCM and total mass of about 54 kg. So, the maximum energysaving is ≏9.6 MJ, equal to 2.67 kW h. In this case, if the PCM
works 9 h at maximum performance, one PCM cycle can store
24 kW h energy that can reduce certain amount of the energydemand from HVAC system per day.
Figure 12. Average temperature of PV panel.
Figure 13. Temperature at different points.
Optimization of building-integrated PV thermal air system
International Journal of Low-Carbon Technologies 2015, 10, 146–156 153
at University of N
ottingham on July 28, 2015
http://ijlct.oxfordjournals.org/D
ownloaded from
3.3 Effect of finsFigure 16 shows the schematic diagram of PV/PCM system with
horizontal fins inside PCM.
A simulation was carried out with horizontal fins insertedinside the PCM to improve heat conduction inside the PCM.
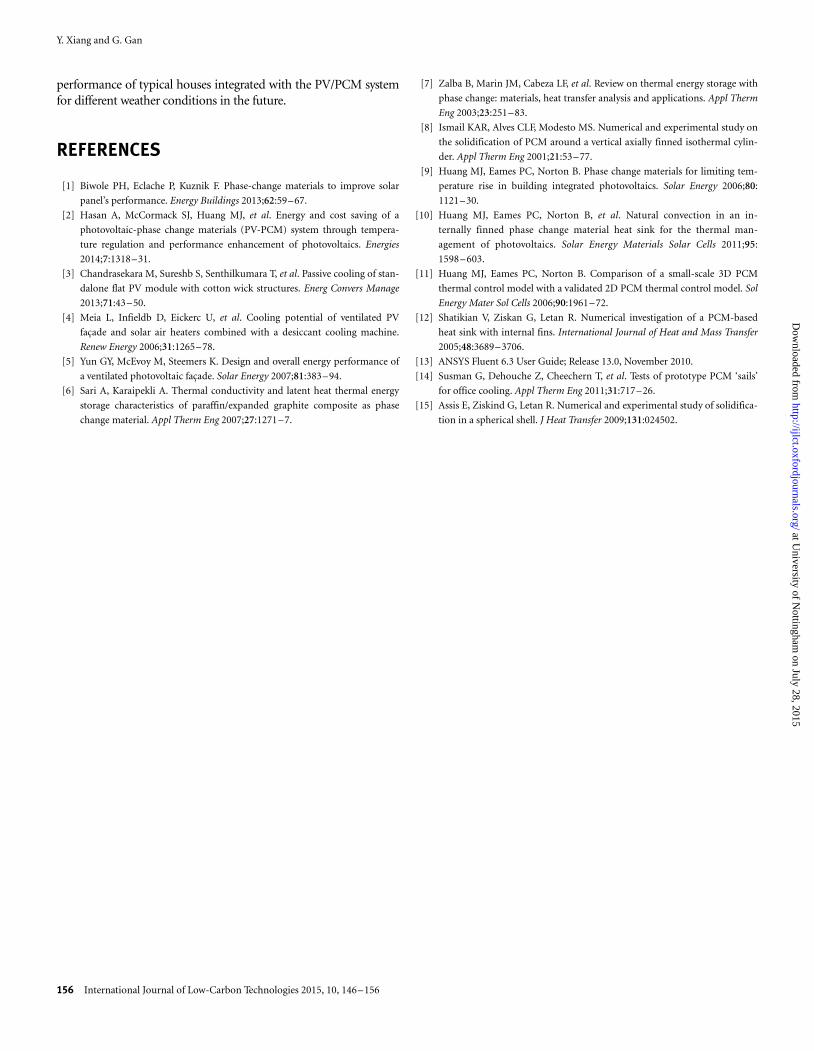
Figure 17 shows the temperature at three observed points in
PCM. Compared with Figure 13, the total melting time is sameand no major difference for temperature in PCM because the fins
are not close to the point in other models without fins. Figure 18
shows the temperature distribution at top side of the model attime 20 000 s. Compared with the case without fins, the tempera-
ture at back is slightly higher due to the fins and the interface of
melting goes deeper. The use of fins provides improved thermalcontrol.
Figure 19 shows velocity distribution in air duct at time
20 000 s, compared with Figure 15, an average 5% of increase invelocity is achieved when applying fins inside. Figure 20 shows
Figure 14. Velocity and temperature distributions contours in air duct at time 3000 s (left) and 10 000 s (right).
Figure 15. Temperature for PV surface and back in PCM in solidifying process.
Figure 16. Schematic diagram of PV/PCM system with fins inside PCM.
Y. Xiang and G. Gan
154 International Journal of Low-Carbon Technologies 2015, 10, 146–156
at University of N
ottingham on July 28, 2015
http://ijlct.oxfordjournals.org/D
ownloaded from
the temperature variation in PCM in solidifying process. It takes
much short time for solidifying which may be helpful in hotnight condition.
4 CONCLUSIONS
The objective of this study was to improve the PV efficiency by
incorporating PCM while utilizing the convective heat from
PCM for controlling indoor condition. This paper presents anexperimental and numerical evaluation of PCMs for thermal
management of PV devices. The experiment set up was used tomeasure the temperature and velocity in order to validate the
CFD model. The result shows that the thicker layer of PCM can
provide more heat capacity for maintaining temperature, but ithas lower ability for natural ventilation and presents a problem of
too long time of melting and solidifying. The simulation model is
applied to a typical sunny day in Nottingham which shows thesystem can maintain the PV temperature below its normal operat-
ing cell temperature for ≏9.7 h. However, it takes almost 16.67 h
for full solidification. Either forced convection or fins in the PCMare recommended to increase the heat removal. PCM with intern-
al fins provide improved thermal control and it reduces a lot of
time for solidification and increases natural ventilation. The testrig and the simulation model will be extended to evaluate the
Figure 17. Temperature at three observed points in PCM.
Figure 18. Temperature distribution at top side of model at time 20 000 s.
Figure 19. Velocity distribution in air duct at 20 000 s.
Figure 20. Temperature variation in PCM in solidifying process.
Optimization of building-integrated PV thermal air system
International Journal of Low-Carbon Technologies 2015, 10, 146–156 155
at University of N
ottingham on July 28, 2015
http://ijlct.oxfordjournals.org/D
ownloaded from
performance of typical houses integrated with the PV/PCM system
for different weather conditions in the future.
REFERENCES
[1] Biwole PH, Eclache P, Kuznik F. Phase-change materials to improve solar
panel’s performance. Energy Buildings 2013;62:59–67.
[2] Hasan A, McCormack SJ, Huang MJ, et al. Energy and cost saving of a
photovoltaic-phase change materials (PV-PCM) system through tempera-
ture regulation and performance enhancement of photovoltaics. Energies
2014;7:1318–31.
[3] Chandrasekara M, Sureshb S, Senthilkumara T, et al. Passive cooling of stan-
dalone flat PV module with cotton wick structures. Energ Convers Manage
2013;71:43–50.
[4] Meia L, Infieldb D, Eickerc U, et al. Cooling potential of ventilated PV
facade and solar air heaters combined with a desiccant cooling machine.
Renew Energy 2006;31:1265–78.
[5] Yun GY, McEvoy M, Steemers K. Design and overall energy performance of
a ventilated photovoltaic facade. Solar Energy 2007;81:383–94.
[6] Sari A, Karaipekli A. Thermal conductivity and latent heat thermal energy
storage characteristics of paraffin/expanded graphite composite as phase
change material. Appl Therm Eng 2007;27:1271–7.
[7] Zalba B, Marin JM, Cabeza LF, et al. Review on thermal energy storage with
phase change: materials, heat transfer analysis and applications. Appl Therm
Eng 2003;23:251–83.
[8] Ismail KAR, Alves CLF, Modesto MS. Numerical and experimental study on
the solidification of PCM around a vertical axially finned isothermal cylin-
der. Appl Therm Eng 2001;21:53–77.
[9] Huang MJ, Eames PC, Norton B. Phase change materials for limiting tem-
perature rise in building integrated photovoltaics. Solar Energy 2006;80:
1121–30.
[10] Huang MJ, Eames PC, Norton B, et al. Natural convection in an in-
ternally finned phase change material heat sink for the thermal man-
agement of photovoltaics. Solar Energy Materials Solar Cells 2011;95:
1598–603.
[11] Huang MJ, Eames PC, Norton B. Comparison of a small-scale 3D PCM
thermal control model with a validated 2D PCM thermal control model. Sol
Energy Mater Sol Cells 2006;90:1961–72.
[12] Shatikian V, Ziskan G, Letan R. Numerical investigation of a PCM-based
heat sink with internal fins. International Journal of Heat and Mass Transfer
2005;48:3689–3706.
[13] ANSYS Fluent 6.3 User Guide; Release 13.0, November 2010.
[14] Susman G, Dehouche Z, Cheechern T, et al. Tests of prototype PCM ‘sails’
for office cooling. Appl Therm Eng 2011;31:717–26.
[15] Assis E, Ziskind G, Letan R. Numerical and experimental study of solidifica-
tion in a spherical shell. J Heat Transfer 2009;131:024502.
Y. Xiang and G. Gan
156 International Journal of Low-Carbon Technologies 2015, 10, 146–156
at University of N
ottingham on July 28, 2015
http://ijlct.oxfordjournals.org/D
ownloaded from