Embed Size (px)
Citation preview


vii
edc earth science: An Overview xiedc earth science: The Full Picture xxv
introduCing EArth sCiEnCE 1
1 CoMPAring EArth to othEr Worlds 2
what’s the story? Two Travelers in a Distant World 7
activity: Survival on Earth and Mars 10
Unit 1Hydrosphere: Water in Earth’s Systems 19
2 lifE’s blood: sEEking WAtEr froM EArth 20
what’s the story? Water Running Dry 29
task 1: How Much Water Do You Use? 32
task 2: Thinking Beyond the Bathwater: Your Water Footprint 34
activity 1: Reservoir Roulette: A Journey Through the Water Cycle 39
reading: The Unique Qualities of Water 43
activity 2: Where’s the Drinking Water? 44
reading: Capturing the Good Water 52
activity 3: Water Supply Case Studies 54
activity 4: Follow the Flow: Researching Your Water Supply 56
final reading: The Most Precious Resource 60
assessment 64
3 rivErs of thE sEA: oCEAn CurrEnts 67
task: Ocean Quiz Show 75what’s the story? A Crazy Idea 76activity 1: The Effect of Wind
on Ocean Currents 79activity 2: Natural Patterns 81reading: Patterns in Surface
Ocean Currents 83activity 3: The Effect of Density
on Ocean Currents 88reading: Striving for Equillibrium:
The Forces That Drive Ocean Currents 91
reading: The Peru Current 99activity 4: An Influential Current 102assessment 104
Unit 2Atmosphere and Climate 107
4 loCAl ConnECtions: rEgionAl CliMAtE 108
what’s the story? A Scientific Explorer 118
activity 1: Looking at Climate Data 121activity 2: Observing Landscapes 128activity 3: Looking for Patterns in
a World Climates Map 130reading: Sharing the Warmth 132activity 4: Comparing the Heat
Capacity of Different Materials 135activity 5: Interactions Between
Ocean and Atmosphere 138reading: Winds and Mountains 140assessment 145
5 thE biggEr PiCturE: globAl CliMAtE 149
what’s the story? Washing Away 157reading: Following the Path of
Light Energy 160activity 1: The Greenhouse Effect 161activity 2: The Albedo Effect 165activity 3: Moving Carbon Around 169activity 4: Calling All Carbons 172reading: The Greenhouse Effect, the
Albedo Effect, the Carbon Cycle, and Feedback Loops 178
assessment 186
6 thE longEst ExPEriMEnt: CliMAtE ChAngE in EArth’s history 189
what’s the story? Journey to a Different Time 197
activity 1: Looking for Clues to the Past 201
reading: Evidence of Earth’s Past 204activity 2: Using Climate Proxies 207activity 3: Investigating How
Orbital Changes Have Affected Past Climate 210
reading: The Carbon Cycle, Cretaeous Breadfruit Trees, and the Long Slide to the Ice Age 216
reading: How Fast Can the Climate Change? 219
activity 4: What’s Happening Now and What’s Projected for the Future 220
reading: Sorting Out Natural and Human-Induced Climate Change 232
assessment 240
ContEnts

viii
EDC Earth SCiEnCE teacher edition
MID-YEAR CHALLENGE 243
7 broAdCAst froM thE futurE 244
task: Bogus or Believe It? 247
Unit 3 Earth’s Place in the Universe 251
8 stArs, PlAnEts, And EvErything in bEtWEEn: solAr systEM origins 252
what’s the story? Meteorites: “Scientific Gold” 259
activity 1: The Dating Game 261reading: The Life Cycles of Stars 264activity 2: Solar System Census 266reading: Solar Nebula
Condensation Theory 267activity 3: Model of a Spinning
Nebula 271activity 4: Explaining Patterns
of Motion with Kepler’s Laws of Motion 273
activity 5: Spectroscopy 279assessment 284
9 journEy to thE CEntEr of thE EArth: ExPloring EArth’s intErior 289
what’s the story? Burrowing to the Depths 299
task: Thinking on a Planetary Scale 300reading: A Dense Interior 303activity 1: Modeling Earth's
Interior Structure 304activity 2: See What You Can’t See 307reading: How Do Scientists
Explore Earth’s Interior 310activity 3: Body Waves 314activity 4: Locating an Earthquake
Epicenter 316reading: Energy in Earth’s Interior 319assessment 326
Unit 4Plate Tectonics 329
10 on shAky ground: EArthquAkEs And trAnsforM boundAriEs 330
what’s the story? Waves of Destruction 337
reading: Clues in the Landscape 341activity 1: Using GPS Data and
Geologic Markers to Track Plate Motion 343
activity 2: Looking for Patterns in a World Map 347
reading: What Do Tectonic Plates Have to Do with Earthquakes? 349
activity 3: What Is Happening Along the San Andreas Fault? 352
reading: Measurements and Computer Models 356
activity 4: Studying Earthquake Computer Models 358
assessment 372
11 slEEPing drAgons? subduCtion-ZonE volCAnoEs 375
what’s the story? A Hazardous Development? 385
reading: Could Mount Rainier Erupt? 388
activity 1: Detecting a Subducting Plate 392
activity 2: A Lava Flow or an Explosion? 394
activity 3: What Might an Eruption of Rainier Be Like? 397
activity 4: How Do Scientists Monitor Volcanoes? 400
reading: Has Rainier Erupted in the Past? 405
activity 5: Monitoring Mount Rainier 408
reading: How Do Convergent Boundaries Shape Earth’s Surface Features? 416
activity 6: Features Along Convergent Boundaries 418
final reading: Convergent Boundaries 421
assessment 425
12 CluEs on thE oCEAn floor: divErgEnt boundAriEs 429
what’s the story? An Explorer with Big Ideas 437
activity 1: Using Sound Waves to Map an Ocean Floor 439
reading: Into the Depths 442activity 2: Studying Maps of
Earth’s Oceans 444reading: The Missing Piece of the Plate
Tectonics Puzzle 449activity 3: Plotting a Magnetic
Map of the Ocean 451activity 4: How Are Ocean Basins
Formed by Seafloor Spreading? 453reading: Pulling It All Together—Earth’s
Machinery 460assessment 464
Unit 5 The Rock Cycle 467
13 MississiPPi bluEs: sEdiMEntAry ProCEssEs in A dEltA 468
what’s the story? Flooding the Big Easy 477
activity 1: Modeling River Deposits 480
reading: How Do Rivers Build Land? 481
activity 2: Modeling a River Delta 486activity 3: What Does a Real
Delta Look Like? 490reading: Layer by Layer 495activity 4: A View Beneath
the Surface 499reading: Why Is the Mississippi
Delta Region Sinking 503activity 5: Settling Sediments 503reading: Have People Played a
Role in the Subsidence of New Orleans? 506
final reading: Dynamic Rivers and Changing Landscapes 512
assessment 516

ix
14 A solid foundAtion: building EArth’s Crust 519
what’s the story? A Curious Mind 528task: Investigating Samples
of the Crust 530reading: Elements of
Earth’s Crust 536activity 1: Can Rocks Really
Have Different Densities? 539reading: Minerals—the Building Blocks
of Earth’s Crust 540activity 2: Identifying Minerals
by Their Physical Characteristics 543
activity 3: Clues in Rock-Forming Processes 545
reading: Piecing Together Earth’s History 556
activity 4: Timeline of Major Events in Earth History 559
final reading: A Solid Foundation 560assessment 562
Unit 6Earth Resources 567
15 hiddEn trEAsurEs in roCks: MinErAl rEsourCEs 568
what’s the story? Pikes Peak or Bust: 1859 575
task: What Makes a Metal, Rock, or Mineral Valuable? 577
activity 1: Where are the Mineral Ores? 581
activity 2: Prospecting for Mineral Ore 586
reading: From Rocks to Riches—Mining and Processing Mineral Ore 589
activity 3: Refining an Ore 594final reading: Ore from Earth 599assessment 602
16 thE MystEry of thE rub’ Al-khAli: EnErgy rEsourCEs in EArth's Crust 605
task: Energy Connections 613what’s the story? The Mystery of the
Rub’ al-Khali 618activity 1: How Do Oil Reservoirs
Form? 620reading: A Convergence of
Conditions—the Rub’ al-Khali 626reading: How Is Oil Found
and Produced? 631activity 2: Exploration and Production
Models 634final reading: The Recipe for Oil 637assessment 641
FINAL CHALLENGE 645
17 A diffErEnt EArth 646
reading: The Heartbeat of Earth 648activity: Digging for Answers 651
contents


CHAPTER SIX
The Longest Experiment: Climate Change in Earth’s History Overview Scientists use sophisticated computer models to simulate the complex interactions between components of Earth’s climate system. These models are critical to predictions about climate change that will happen in the coming decades. However, small changes in the assumptions that underlie these models can have a significant influence on what these models predict. How do scientists know how Earth will actually behave?
Earth’s climate system has been operating for billions of years, and as it turns out, the climate has changed dramatically in the past. Earth’s geologic record—in the form of ice, sediments, rocks, and fossils—is a treasure trove of information about climate change that has happened in the past and how these changes have affected the planet. Earth’s climate system is very complex, and although scientists continue to improve their understanding of the different factors
and feedbacks operating on different time and spatial scales, the information presented in this chapter is nec-essarily quite simplified. There are so many feedbacks within Earth’s climate system that the absolute causes of climate change are uncertain. However, the data from the study of Earth’s climate history are invaluable in improving the accuracy of global climate models and making better predictions about the future.
In this chapter, students explore climate change that has happened in Earth’s past and think about its relevance to climate change happening now. They study data about changes currently happening related to Earth’s climate and examine the forecasts of climate models about Earth’s future. In addition to building on their foundation of knowledge about Earth’s atmosphere and hydrosphere from previous chapters, this study con-nects them to many of the concepts covered later in the course, relating to plate tectonics and the rock cycle.
189

EDC EARTH SCIENCE TEACHER EDITION • UNIT 2 • ATMOSPHERE AND CLIMATE
190
Goals for Student Understanding This table shows alignment of Framework for K–12 Science Education (the Framework) content, practices of science and engineering, and crosscutting concepts with chapter learning objectives. This is not intended to be used as a checklist, but it shows how students’ learning experiences in EDC Earth Science map to the Framework goals.
Learning ObjectiveFramework Content, Practices, and Crosscutting Concepts Where Taught
Students understand that Earth’s climate has changed dramatically in the past.
ESS2.D.4
Asking questions Developing and using models Constructing explanations
Patterns Cause and effect Systems and system models Scale, proportion, and quantity Energy and matter Stability and change
What’s the Story?—�“Journey to a Different Time”
Activity 3—�“Investigating How Orbital Changes Have Affected Past Climate”
Reading—�“The Carbon Cycle, Cretaceous Breadfruit Trees, and the Long Slide to the Ice Age” “How Fast Can the Climate Change?
Students know that scientists investigate Earth’s climate history by studying records of past climates stored in tree rings, coral, rocks, sediment, and ice, as well as more recent human records of weather data.
ESS2.D.2
Analyzing and interpreting data Using mathematics Constructing Explanations Engaging in Argument from Evidence
Patterns Cause and effect Stability and change
Activity 2—�“Using Climate Proxies”
Activity 4—�“What’s Happening Now and What’s Predicted for the Future?”
Reading—�“�Evidence of Earth’s Past”
Students know that periodic changes in the tilt of Earth as well as its orbit have caused changes in the distribution of solar input, which has affected global climate in the past.
ESS2.D.2
Developing and using models
Patterns Cause and effect Systems and system models Energy and matter Stability and change
Activity 3—�“How Orbital Changes have Affected Past Climate”
Students know that historical fluctuations in global average temperature have corresponded with fluctuations in atmospheric CO2 levels, related to factors such as the movement of tectonic plates over millions of years.
ESS2.D.1, ESS2.D.3, ESS2.D.4
Analyzing and interpreting data Constructing explanations Engaging in argument from evidence
Patterns Cause and effect Systems and system models Energy and matter Stability and change
Readings—� “The Carbon Cycle, Cretaceous Breadfruit Trees, and the Long Slide to the Ice Age”
“How Fast Can the Climate Change?”
“Sorting Out Natural and Human-induced Climate Change”
Global climate models predict that tempera-tures will continue to rise, and that the amount of temperature change predicted is related to future CO2 emissions. These temperature increases are already causing sea level rise, the melting of glacial and polar ice, and changes in precipitation and ocean acidity.
Students know that CO2 increases over the past 100 years are largely attributable to human activities.
ESS2.D.5, ESS2.D.6
Analyzing and interpreting data Using mathematics Using Models Engaging in Argument from Evidence
Patterns Cause and effect Systems and system models Energy and matter Stability and change
Activity 4—�“What’s happening now and what’s projected for the future?”
Reading—�“What’s Happening Now and What’s Predicted for the Future?”

191
CHAPTER 6 • THE LONGEST EXPERIMENT: CLIMATE CHANGE IN EARTH’S HISTORY
Possible Misconceptions and Barriers to Learning
• The concepts covered in this chapter are sophis-ticated and will challenge students to use all the skills they have acquired during this course. Many students are likely to still have difficulties with visu-alizing Earth’s processes in three dimensions and understanding that small, incremental changes over millions of years can have dramatic effects. They also are likely to continue to struggle with con-ceptualizing complex, dynamic systems involving multiple interacting factors. Be aware of these chal-lenges as you listen to students during class discus-sions and review their work.
• Many people have the idea that during the Pleis-tocene the temperatures were constantly below freezing and don’t understand that there were periods during which the climate was as warm as today. The Ice Age was actually a period of climate instability with dramatic fluctuations in temperature. The Pleistocene has included about 20 glacial intervals and 20 interglacial intervals. Scientists think that Earth’s climate is in an interglacial interval today.
Assessment OutcomesStudents should be able to1. give examples of how Earth’s climate has changed in
the past.
2. describe how climate proxies are used by scientists to investigate Earth’s climate history.
3. model how periodic changes in Earth’s orbit, called Milankovitch cycles, triggered the advance and retreat of continental ice sheets during the Pleistocene.
4. explain and give an example of how increased rates of volcanism associated with plate tectonic movements may have caused increased levels of atmospheric CO2 and global warming in the past.
5. explain and give an example of how mountain-building associated with collisions between two plates can decrease atmospheric CO2 levels and cause global cooling.
6. describe how certain changes in Earth’s systems such as sudden changes in ocean circulation, can cause more rapid climate change.
7. relate the predictions of global climate models to CO2 emissions, and to data regarding changes in precipitation, ocean acidity, arctic ice extent, glacier volume, and sea-level rise.
8. describe evidence that human activities have increased CO2 concentrations in the atmosphere and caused the increased global temperatures mea-sured over the last century.
Assessment StrategiesStudents have a number of opportunities in this chapter to express their initial and developing understanding of concepts related to the processes that cause Earth’s climate to change. By taking note of the answers given by students completing group work or working individually, you can determine pacing, identify which concepts need more or less emphasis, and gauge students’ understanding of the content at the end of the chapter. The following table summarizes the formative and summative assessment opportunities.
The table also provides an alignment between the student assessment outcomes and the assessment items at the end of the chapter. You should determine ahead of time which of these assessment opportunities you will evaluate formally (assign a grade) and which you will evaluate more informally. In general, the Consider and Investigate sections provide opportunities for formative assessment, and the Process section provides opportu-nities for summative assessment.

EDC EARTH SCIENCE TEACHER EDITION • UNIT 2 • ATMOSPHERE AND CLIMATE
192
Opportunities Information Gathered
ConsiderBrainstorming Students’ prior understandings of Earth’s history and initial ideas about what could have caused climate
to be different in the past
What’s the Story—�“�Journey to a Different Time” Students’ initial understandings of the types of evidence used to reconstruct Earth’s climate history, and review of how changes in Earth’s energy balance can affect global temperature
Assessment Outcome 1 (Assessment items 7, 8)
InvestigateActivity 1—�“Looking for Clues to the Past” Assessment Outcome 2 (Assessment items 1–3)
Reading—�“�Evidence of Earth’s Past” Assessment Outcome 2 (Assessment items 1–3)
Activity 2—�“Using Climate Proxies” Assessment Outcome 2 (Assessment items 1–3)
Activity 3—�“Investigating How Orbital Changes Have Affected Past Climate”
Assessment Outcome 3 (Assessment items 4, 5)
Reading—�“�The Carbon Cycle, Cretaceous Breadfruit Trees, and the Long Slide to the Ice Age”
Assessment Outcomes 4, 5 (Assessment item 6)
Reading—�“�How Fast Can the Climate Change?” Assessment Outcome 6 (Assessment item 9)
Activity 4—�“What’s Happening Now and What’s Projected for the Future?”
Assessment Outcome 7 (Procedure Part A, Steps 2, 3; Part B, Steps 1–3; Analysis Questions 1–5)
Reading—�“�Sorting Out Natural and Human-induced Climate Change”
Assessment Outcome 8 (Assessment item 7)
Address the Challenge Students’ abilities to synthesize what they have learned from their study of Earth’s climate history and teach it to others through a museum exhibit
ProcessShare Students’ understandings of the key concepts covered in this chapter
Discuss Students’ ideas about how their thoughts about climate have changed since the beginning of this unit, and their abilities to synthesize what they have learned, relating phrases and terms used in this chapter to the concept of climate change
Assessment Students’ understandings of the range of concepts presented throughout the chapter; these questions can be used in class, for homework, or as a quiz at the end of the chapter.

193
CHAPTER 6 • THE LONGEST EXPERIMENT: CLIMATE CHANGE IN EARTH’S HISTORY
Scope and SequenceThe following is provided to help with your lesson planning. Adjust it according to the needs and interests of your classroom, and whether you assign readings as homework or complete them in class.
WEEK DAY PREVIEW
1
2
3
Consider
1
Introduce chapter and discuss Brainstorming questions
Students brainstorm what they know about Earth’s history—in particular, the Cretaceous Period in which dinosaurs lived and the Pleistocene Ice Age. They think about how climate could have been so much colder during the Pleistocene and about ways that studying climate change in Earth’s history could help humans bet-ter understand climate change that is happening now.
2
Read/discuss What's the Story—�“Journey to a Different Time” Introduce Challenge
Students read a story about a very warm point in Earth’s history when no polar ice caps existed and a very cold point in Earth’s history when ice covered much of North America. They think about what might have caused Earth’s climate to change so dra-matically in the past and what might cause the climate to change now and in the future.
Investigate
Gather Knowledge
3 Activity 1—�“�Looking for Clues to the Past” Students practice looking for evidence of events that have hap-pened in the past by looking for clues around the classroom.
4
Reading—� “Evidence of Earth’s Past” Students read about climate proxies—tools used by scientists to investigate Earth’s climate history. They summarize what they have learned and think about the importance of collecting climate proxy data from different locations around Earth.
5 Activity 2—�“Using Climate Proxies” Students use simulated proxy data from sediment cores to deter-mine past ocean temperatures.
6
Activity 3—�“Investigating How Orbital Changes Have Affected Past Climate”
Students use a model Earth and Sun to demonstrate the Mila-nkovitch cycles and think about how these orbital cycles affect the intensity of Earth’s seasons and in turn the advance and retreat of ice sheets during the Pleistocene.
7
Reading—�“The Carbon Cycle, Cretaceous Breadfruit Trees, and the Long Slide to the Cretaceous”
Students read about how plate tectonic movements occurring over very long periods of time have led to warm and cool periods in Earth’s history. They think about how climate change in the past is relevant to Earth’s future.
8Reading—�“How Fast Can the Climate Change?”
Students read about abrupt climate change events that have occurred in Earth’s history and the potential causes of these events.
9 Activity 4—�“What’s Happening Now and What’s Projected for the Future,” Part A
Students study the predictions of global climate models and relate them to observed changes in global temperature, sea-level rise, ice measurements, ocean acidification and precipitation.
10 Activity 4—� “What’s Happening Now and What’s Projected for the Future,” Part B
Address the Challenge
11
Reading—�“Sorting Out Natural and Human-Induced Climate Change
Students read about how scientists use their understanding of Earth’s climate history to assess whether climate change hap-pening now is due to natural processes or human activities. They summarize evidence that human activities are contributing to the current warming trend.
12 Address the Challenge: Create Museum Exhibit
Students prepare museum exhibits that explain the key concepts they studied in this chapter.
Process
13 Share exhibits Students share their museum exhibits and review the major concepts covered in this chapter.
14
Discuss concept mapping Students discuss how their ideas about climate have changed since the beginning of the unit and review the complex factors that can bring about climate change by creating a concept map that relates the various terms and phrases used in this chapter.
Review 15 Review
Assessment 16 Summative Assessment

EDC EARTH SCIENCE TEACHER EDITION • UNIT 2 • ATMOSPHERE AND CLIMATE
Materials and Preparation Note: All reproducible pages (Student Sheets, Literacy Supplements, and Resource Supplements) and many images from the student book can be found in the Teacher Resources as PDFs or slide presentations.
You may choose to use the following optional Literacy Supplements:
• Literacy Supplement 6.1: Anticipation Guide for “Journey to a Different Time”
• Literacy Supplement 6.2: Three-Level Reading Guide for “Evidence of Earth’s Past”
• Literacy Supplement 6.3: Three-Level Reading Guide for “The Carbon Cycle, Cretaceous Breadfruit Trees, and the Long Slide to the Ice Age”
• Literacy Supplement 6.4: Science Fact Triangle for “How Fast Can the Climate Change?”
• Literacy Supplement 6.5: Science Fact Triangle for “Sorting Out Natural and Human-Induced Climate Change”
You may want to place a poster with a geologic time-line on the wall to refer to during this chapter.
Prior to Activity 2—“Using Climate Proxies”
1. Gather the materials listed below. FOR THE TEACHER
• gravel, “foram” sheets, and 16 plastic “sediment core” tubes (see Step 2 below)
FOR EACH TEAM OF STUDENTS
• 1 “sediment core” (containing gravel and “forams”) (see Step 2 below)
• 1 tray (for sorting contents of “sediment core”)• 1 calculator*
FOR EACH STUDENT
• (optional) ruler • graph paper*
*not included in LAB-AIDS equipment package
2. Check the number of “forams” in each plastic “ sediment core” tube (see Foram Counts table). There should be one striped set and one solid set for each age. Sort them if they are mixed. For first-time use, remove forams from sheets and place each set in one tube, along with about 200 cm3 of gravel.
3. Create a class data table similar to the Foram Counts table. Post it so teams can record their data.
Prior to Activity 3—“Investigating How Orbital Changes Have Affected Past Climate”
1. Gather the materials listed below. FOR EACH TEAM OF STUDENTS
• 1 plastic “planet” with wooden axis (see Step 2 below)• access to a light source*• marker
*not included in LAB-AIDS equipment package
2. If needed, assemble the “plastic planets” by connecting the two halves and inserting a wooden dowel for the axis.
Prior to Activity 4—“What’s Happening Now and What’s Projected for the Future”
1. Gather the materials listed below. PART A—FOR EACH STUDENT
• (optional) ruler • graph paper*
PART B—FOR THE CLASS
• 2 sets Expert Group 1 Data Cards (Figs. 6.20, 6.21 in student book)• 2 sets Expert Group 2 Data Cards (Figs 6.22, 6.23 in student book)• 2 Expert Group 3 Data Cards (Fig. 6.24 in student book)• 2 sets Expert Group 4 Data Cards (Figs. 6.25, 6.26 in student book)• means of projecting Expert Group Data Cards* (see Step 2 below)
*not included in LAB-AIDS equipment package
2. Projectable Expert Group Data Card images are in the Chapter 6 slide presentation in Teacher Resources.
Prior to Address the Challenge
1. Gather materials for students to use to create visuals for their museum exhibits.
Prior to Process
1. Optional Resource Supplement 6.1: Climate Change Concept Map is available in Teacher Resources or the Chapter 6 slide presentation.
2. You may want to invite another class or community members to view students’ museum exhibits.
Foram Counts for Activity 2
AGE (YBP=years before present)
FORAM COLOR
FORAM TYPE
RIGHT COILING
LEFT COILING OTHER
0 ybp (today) dark blue 42 8 25
30,000 ybp yellow 10 40 25
60,000 ybp gray 16 34 25
90,000 ybp green 41 9 25
120,000 ybp orange 44 6 25
150,000 ybp light blue 11 39 25
180,000 ybp brown 13 37 25
210,000 ybp pink 23 27 25
194

chapter 6 • The longesT experimenT: climaTe change in earTh’s hisTory
207 206
less complete records show pro-cesses that affect climate over longer periods, and indicate how much climate has changed.
LITeraCy SUPPLemeNT 6.2 responses to Three-Level Reading Guide for “evidence of earth’s Past”
1. Are these statements correct? Mark Y or N for each statement. For state- ments marked “�N,” rewrite them so they are correct.
a. Natural records of past climate, such as tree rings and coral growth, can tell us what it was like hundreds and even thousands of years ago.
b. Tree rings can be used to tell what the climate was like hundreds of thousands of years ago. Tree rings can be used to tell what the climate was like for the past few hundred years. Some long-lived species (e.g., redwoods) can provide information for one or two thousand years but are unreliable past that.
c. Bubbles of trapped air in ice can be analyzed to tell us concentrations of greenhouse gases in the atmosphere at the time the ice formed.
2. Do you think these statements agree with the reading? Mark Y or N for each statement. For statements marked “�N,” rewrite them so they are correct.
a. It is possible to determine what the cli-mate was like in the past, although the further back in time we go, the more uncertain we are of our determinations.
b. If data obtained from different methods agree, for example ice core and tree ring data, then we feel more confident in our determination of what the climate was like in years past.
3. Do you agree with these statements and can you find evidence—�in the reading or elsewhere—�to support your position? Mark Y or N for each statement. For statements marked “�N,” rewrite them so they are correct.
a. Although data from analysis of rocks is less detailed than that from tree rings, it is nevertheless valuable in determining what Earth’s climate was like in the past.
b. Climate proxies, such as tree rings and ice cores are more reliable than human written records in general because people can make mistakes.
actiVitY 2Using Climate ProxiesIn this activity, students simulate using evidence from ocean sedi-ment cores to determine past climates.
Facilitating Activity 2— “Using Climate Proxies”Prior to class:
• Post a table at the front of the classroom for students to use when recording their group’s data. (See the Materials and Preparations section for the setup of this table.
During class:
• Have students work with a partner on this activity.
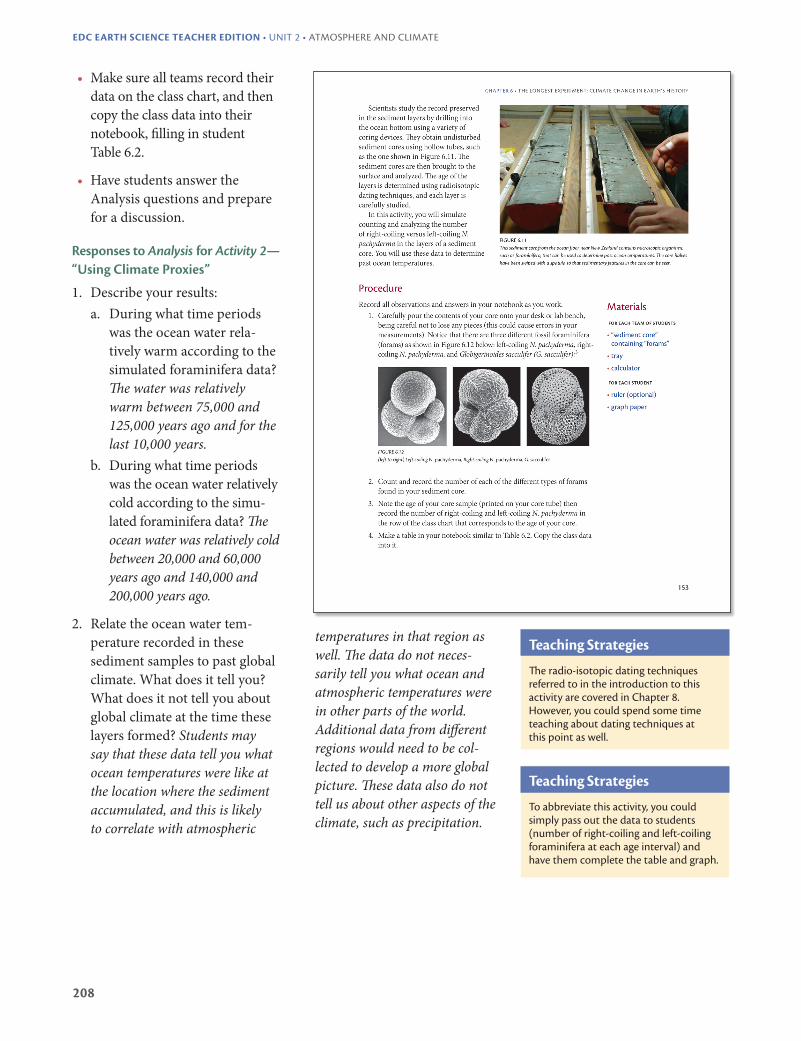
• Review the procedures with the students and discuss what the sample bags represent. Remind them that in real life these foraminifera are so small that they would need to do the counting under a microscope. Also remind them that in actual sediment cores, there would likely be a number of different types of organisms other than Neogloboquadrina pachyderma.
EDC Earth SCiEnCE tEaChEr EDition • Unit 2 • atmosphere and climate
209 208
• Make sure all teams record their data on the class chart, and then copy the class data into their notebook, filling in student Table 6.2.
• Have students answer the Analysis questions and prepare for a discussion.
responses to Analysis for Activity 2— “Using Climate Proxies”
1. Describe your results:a. During what time periods
was the ocean water rela-tively warm according to the simulated foraminifera data? The water was relatively warm between 75,000 and 125,000 years ago and for the last 10,000 years.
b. During what time periods was the ocean water relatively cold according to the simu-lated foraminifera data? The ocean water was relatively cold between 20,000 and 60,000 years ago and 140,000 and 200,000 years ago.
2. Relate the ocean water tem-perature recorded in these sediment samples to past global climate. What does it tell you? What does it not tell you about global climate at the time these layers formed? Students may say that these data tell you what ocean temperatures were like at the location where the sediment accumulated, and this is likely to correlate with atmospheric
temperatures in that region as well. The data do not neces-sarily tell you what ocean and atmospheric temperatures were in other parts of the world. Additional data from different regions would need to be col-lected to develop a more global picture. These data also do not tell us about other aspects of the climate, such as precipitation.
Teaching Strategies
The radio-isotopic dating techniques referred to in the introduction to this activity are covered in Chapter 8. However, you could spend some time teaching about dating techniques at this point as well.
Teaching Strategies
To abbreviate this activity, you could simply pass out the data to students (number of right-coiling and left-coiling foraminifera at each age interval) and have them complete the table and graph.
chapter 6 • The longesT experimenT: climaTe change in earTh’s hisTory
209 208
3. Aside from the fact that you didn't use real organisms, describe your initial ideas about how this activity might be similar to and different from the real processes scientists follow to analyze sediment cores. Answers will vary. Students may say that the actual foraminifera samples would be much smaller and would need to be counted under a microscope, there probably wouldn’t be the same number in each core sample, and/or that there are likely to be other organisms and materials within the sample as well. They might realize that it would be more difficult to distinguish differ-ences in the coiling direction of two similar foraminifera than it was for them to sort the images (and that it would have to be done very carefully to avoid errors in measure-ments). Students may propose that in an actual sample, some foraminifera would be broken into pieces, making it more difficult to count the individuals. They may also have found that counting the foraminifera was somewhat tedious. It is not the intention of this activity to convince students that scientific work is boring; however, they should realize this type of careful work is very much a part of science and provides the basic data necessary for discoveries.
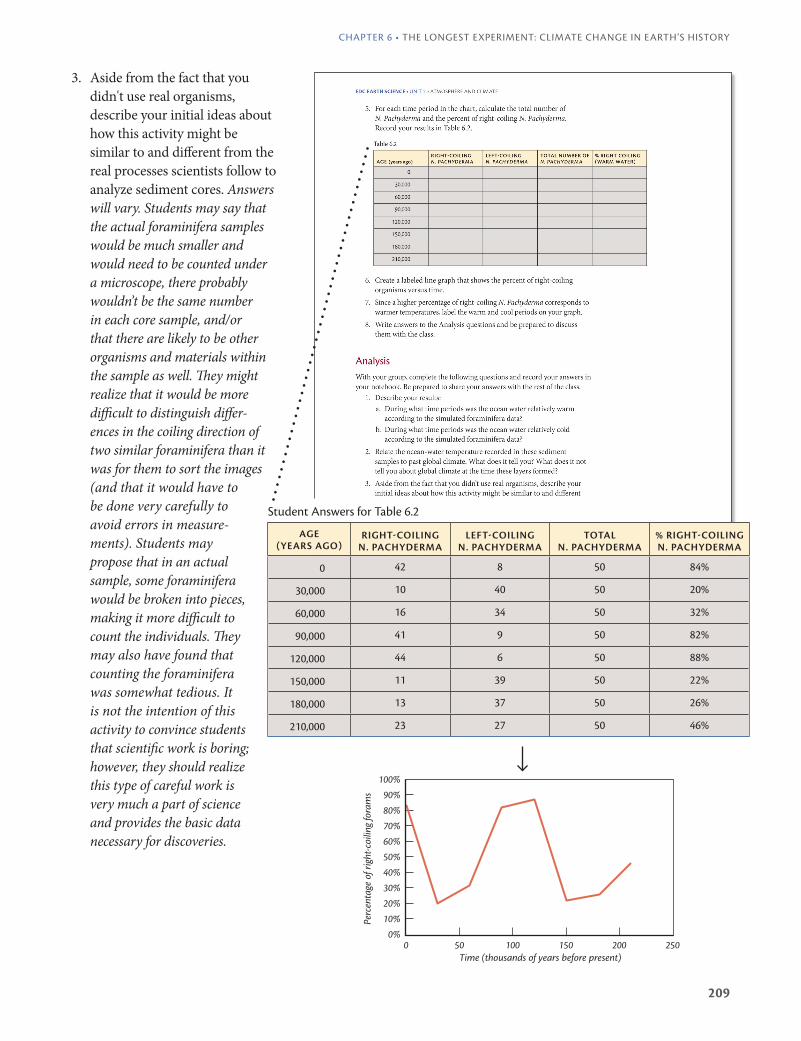
Student Answers for Table 6.2
aGe (yearS aGO)
rIGHT-COILING N. PaCHyDerma
LeFT-COILING N. PaCHyDerma
TOTaL N. PaCHyDerma
% rIGHT-COILINGN. PaCHyDerma
0 42 8 50 84%
30,000 10 40 50 20%
60,000 16 34 50 32%
90,000 41 9 50 82%
120,000 44 6 50 88%
150,000 11 39 50 22%
180,000 13 37 50 26%
210,000 23 27 50 46%
3861 EDPS Earth Science Student Book, Part 1Figure: 3861 EDPS EaSci TE06_01Cronos Pro Regular/Italic 8/9
100500 150Time (thousands of years before present)
200 250
10%Perc
enta
ge o
f rig
ht-c
oilin
g fo
ram
s
0%
30%
20%
40%
50%
60%
80%
70%
90%
100%