Embed Size (px)
Citation preview
INFORMATION TO USERS
This material was produced from a microfilm copy of the original document. While the most advanced technological means to photograph and reproduce this document have been used, the quality is heavily dependent upon the quality of the original submitted.
The following explanation of techniques is provided to help you understand markings or patterns which may appear on this reproduction.
1.The sign or "target" for pages apparently lacking from the document photographed is "Missing Page(s)". If it was possible to obtain the missing page(s) or section, they are spliced into the film along with adjacent pages. This may have necessitated cutting thru an image and duplicating adjacent pages to insure you complete continuity.
2. When an image on the film is obliterated with a large round black mark, it is an indication that the photographer suspected that the copy may have moved during exposure and thus cause a blurred image. You will find a good image of the page in the adjacent frame.
3. When a map, drawing or chart, etc., was part of the material being photographed the photographer followed a definite method in "sectioning" the material. It is customary to begin photoing at the upper left hand corner of a large sheet and to continue photoing from left to right in equal sections with a small overlap. If necessary, sectioning is continued again — beginning below the first row and continuing on until complete.
4. The majority of users indicate that the textual content is of greatest value, however, a somewhat higher quality reproduction could be made from "photographs" if essential to the understanding of the dissertation. Silver prints of "photographs" may be ordered at additional charge by writing the Order Department, giving the catalog number, title, author and specific pages you wish reproduced.
5. PLEASE NOTE: Some pages may have indistinct print. Filmed as received.
Xerox University Microfilms300 North Zeeb RoadAnn Arbor, Michigan 48106
7 5 -2 7 ,2 3 2
BARKQ, John W illiam , 1947- PRIMARY PRODUCTION AND ECOSYSTEM METABOLISM IN A LAKE MICHIGAN DUNE POND.
Michigan State U niversity , Ph.D., 1975 Ecology
Xerox University Microfilms, Ann Arbor, Michigan 48106
PRIMARY PRODUCTION AND ECOSYSTEM METABOLISM
IN A LAKE MICHIGAN DUNE POND
By
John W illiam Barko
A DISSERTATION
Submitted to Michigan State University
in p a r t ia l fu l f i l lm e n t o f the requirements fo r the degree o f
DOCTOR OF PHILOSOPHY
Department o f Botany and Plant Pathology
1975
ABSTRACT
PRIMARY PRODUCTION AND ECOSYSTEM METABOLISM
IN A LAKE MICHIGAN DUNE POND
By
John William Barko
Estimates o f the net primary productiv ity o f phytoplankton,
e p ip e lic periphyton, and macrophytes o f a small (0.25 ha.) shallow
(mean depth = 41 cm.) so ft water (mean a lk a l in i t y = 1.24 meq/1) pond
located in the sand dunes o f Lake Michigan, were independently made
14using in s itu C methods fo r algae and harvest techniques fo r
macrophytes. Estimates o f gross assim ila tion and ecosystem re sp ira
t ion were made w ithin l ig h t and dark metabolic chambers (250 1.
capacity) in which the C0£ f lu x was measured with an in fra -re d gas
analysis system. Laboratory measurements o f photosynthesis in
Juncus b a lt ic u s , the dominant macrophyte, were used in the in te rp re
ta t io n o f diurnal and annual variations in photosynthesis observed
under natural conditions.
Epipelic and planktonic algal components o f the autotro-
phic community were q u a l i ta t iv e ly s im ila r . Both components were
dominated by the desmid, Cosmarium s p ., mucilage secretions o f which
were important in maintaining a heavy a lg a l-b a c te r ia l e p ip e lic mat
th a t persisted throughout the year. The macrophyte component was
strongly emergent, submersed macrophytes contributing less than 0.5%
John W ill ia m Barko
to the biomass. Floating and f lo a t in g leaved macrophytes were
e n t ir e ly absent. F au n is t ic a lly , the pond was represented by a
v arie ty o f invertebrate organisms which were most abundant in the
f lo ccu len t sediments.
Macrophyte production was calculated on the basis of annual
changes in below ground biomass, which represented greater than 90%
of to ta l macrophyte biomass on a dry weight basis. Algal production
was calculated by in tegrating the area under annual productiv ity
curves with respect to time. Whereas production of phytoplankton
and ep ip e lic periphyton occurred throughout the year, production of
macrophytes was lim ited to the growing season.
Peak net production o f the phytoplankton temporally over
lapped peak net production of the macrophytes, both occurring during
the early summer. Net production o f the periphyton increased rap id ly
during midsummer and was maintained a t a r e la t iv e ly high ra te through
early autumn.
Total net primary productiv ity o f the pond was2
348 mg C/m /day, expressed as an annual mean d a ily ra te . Productivity
o f the macrophytes (61% o f to ta l) was greater than that o f the p e r i
phyton (26% o f to ta l ) and that o f the phytoplankton (13% of t o t a l ) .
During the study, the pond underwent seasonal transforma
tions between autotrophic (P/R > 1 .0 ) and heterotrophic (P/R < 1 .0)
metabolic modes. Gross photosynthesis exceeded resp iration during
the growing season; the reverse s itua tio n occurred during the dormant
season. Annual mean d a ily gross productiv ity (547 mg C/m /day)
exceeded the annual mean d a ily ra te o f ecosystem resp iration
John W ill ia m Barko
2(377 mg C/m /d ay ). The P/R ra t io was estimated a t 1 .45 , in d ica tive o f2
net accrual a t the rate of 169 mg C/m /d ay , the annual mean da ily
ra te o f net ecosystem production.
Gross photosynthesis was weakly correlated with day length,
e ff ic ie n c y , and solar energy, each treated independently. Annual
e ff ic ie n c ie s of assim ilation (gross assim ilation /useable solar energy)
and growth (net production/gross assim ila tion were estimated at 0.42%
and 64% respectively .
Annually, heterotrophic and autotrophic components o f eco
system resp iration were comparable, each accounting fo r approximately
h a lf o f the to ta l resp iratory a c t iv i t y . During the growing season,
autotrophic resp iration ( la rg e ly a t t r ib u ta b le to macrophyte a c t iv i t y )
represented 62% o f to ta l re s p ira t io n , whereas during the dormant
season, only 28% o f ecosystem resp ira tion was o f an autotrophic o r ig in .
Potential sources of inaccuracy involving methods used in
th is study were discussed in a general context, and more s p e c if ic a l ly
within the context o f th is in vestig ation . The importance o f dissolved
organic matter in aquatic systems was emphasized in regard to both
macrophyte productiv ity estimates based on harvest techniques, and
the in te rp re ta t io n o f P/R ra t io s .
In conclusion, the dune pond is a r e la t iv e ly unproductive
ecosystem, the net primary p roductiv ity o f which f a l l s w ith in ranges
of values c ited fo r some of the less productive ecosystems of the
world.
ACKNOWLEDGMENTS
I g ra te fu l ly acknowledge the guidance o f my major professor,
Dr. Peter G. Murphy, whose breadth o f knowledge and enthusiasm were
invaluable assets to me while conducting th is study. Dr. Robert G.
Wetzel and the Kellogg Biological Station deserve special recognition
fo r generously making specialized equipment and f a c i l i t i e s ava ilab le .
Members o f my graduate committee, Dr. Peter G. Murphy, Dr. T. Wayne
P orter, Dr. Steven N. Stephenson, and Dr. Robert G. Wetzel, a l l con
tr ib u ted valuable suggestions regarding the mechanics o f th is study
as well as the manuscript i t s e l f .
Consideration is extended Jayashree Sonnad whose technical
assistance in the processing o f a lgal samples is grea tly appreciated.
During the investigatory stages o f th is study, the patience
and encouragement o f my w ife , Jane E. Barko, who also assisted me in
the preparation of th is manuscript, deserves s ingular recognition.
Numerous in d iv id u a ls , fe llo w graduate students and others,
assisted me in the f ie ld work and th e ir help is much appreciated.
In th is regard I acknowledge Sanit Aksornkoae, Jim Coggins, John Dacy,
Eric Hansen, Dr. Glenn Kroh, Dr. Ken Mcleod, Dr. Brian Moss, P a tr ic ia
Paul us, Dr. Frank Reed, and Dave Tague. The v i l la g e o f Saugatuck,
Michigan provided access to the Saugatuck sand dune area in which the
research s i te was located.
i i
General equipment needs were provided by the Department of
Botany and Plant Pathology o f Michigan State U niversity . National
Canvas Products Corporation, Toledo, Ohio, generously provided the
Plexiglas used in constructing metabolic chambers. Recognition is
also due Mr. Leo W. Barnum and the L. E. L ighthart and Company,
Lansing, Michigan, fo r providing hardware and o f f ic e equipment
respective ly . Portions o f the study were f in a n c ia l ly supported by
AEC contract AT (1 1 -1 )-1599, COO-1599-94.
TABLE OF CONTENTS
Page
INTRODUCTION . 1
GENERAL DESCRIPTION OF THE STUDY AREA .......................................... 4
METHODS AND MATERIALS ............................................................. 7
Net Primary Productiv ity o f Phytoplankton ................................... 7Net Primary Productiv ity o f Epipelic Periphyton ......................... 10Macrophyte Biomass and Productiv ity .......................................... 15Ecosystem Metabolism .................................................................................. 18Laboratory Determination Of Light Response
Characteristics Of Juncus balticus........ .......................................... 29
RESULTS................................................................................................................. 34
Description o f the Study P o n d ................................................ 34Algal Net Primary P r o d u c t iv i t y ................................................ 42Biomass and Net Primary Productiv ity o f the Macrophytes . . 45Total Net Primary Productivity o f the Dune Pond . . . . . . 52Ecosystem Metabolism ................................................................................... 54Light Response Characteristics of Ouncus balticus ................ 67
DISCUSSION............................................................................................................. 71
Algal P r o d u c t iv i t y ....................................................................................... 71Macrophyte Biomass and Productiv ity ................................................ 74Ecosystem Metabolism ................................................................................... 79Metabolic Implications Regarding Macrophyte Productiv ity . . 83Comparisons With Other Studies ............................................................. 86
LITERATURE CITED ................................................................................................ 89
LIST OF TABLES
T a b le Page
1. Analysis o f Diurnal Varia tion in EcosystemRespiration Rates .......................................................................... 23
2. Actual and Potentia l Solar Energy At Normal IncidenceIn Southern Michigan ...................................................................... 35
3. Seasonal Variation In Depth, Water, Temperature, pH,and A l k a l i n i t y ................................................................................... 36
4. Diurnal Varia tion In A ir Temperature, WaterTemperature, and pH.......................................................................... 37
5. Chemosynthetic Rates o f Dark Fixation .................................... 45
6. Seasonal Changes In Below Ground Proportion Of TotalMacrophyte Biomass .......................................................................... 48
7. Seasonal Changes In Ash Content Of Macrophyte Biomassand L i t t e r ............................................................................................ 50
8. Net Primary Productiv ity (NPP): Comparison ofautotrophic communities in terms o f th e ir indiv idual contributions to the to ta l net primary p rod uctiv ity (TNPP) o f the dune pond .................. 53
9. In S itu Determination Of The Carbon DioxideCompensation Point For The Dune P o n d ................................... 58
10. Diurnal V a r ia b i l i t y In Rates Of Gross PhotosynthesisAnd Gross Photosynthetic E ff ic ien cy On F a ir Days . . . 59
11. Diurnal V a r ia b i l i t y In Rates Of Gross PhotosynthesisAnd Gross Photosynthetic E ff ic iency On An OvercastDay In J u l y ....................................................................................... 60
12. Seasonal In terre la t io n sh ip s Between Gross Photosynthesis, Indices Of Gross PhotosyntheticE ff ic ie n c y , Solar Energy, And Day Length . . . . . . . 61
13. Analysis Of Possible C orre lative Factors A ffectingGross P hotosynthesis ...................................................................... 62
Table Page
14. Gross Photosynthesis And Ecosystem Respiration OnHarvested And Non Harvested Plots ....................................... 63
15. Ecosystem Metabolism: Carbohydrate production anddegradation w ith in the dune p o n d ........................................... 65
16. Ecosystem Metabolic Indices: Seasonal changes inindices o f carbohydrate production and degradationin the dune p o n d .............................................................................. 66
17. Annual Carbon Budget For The Dune P o n d .................................... 80
LIST OF FIGURES
F ig u re Page
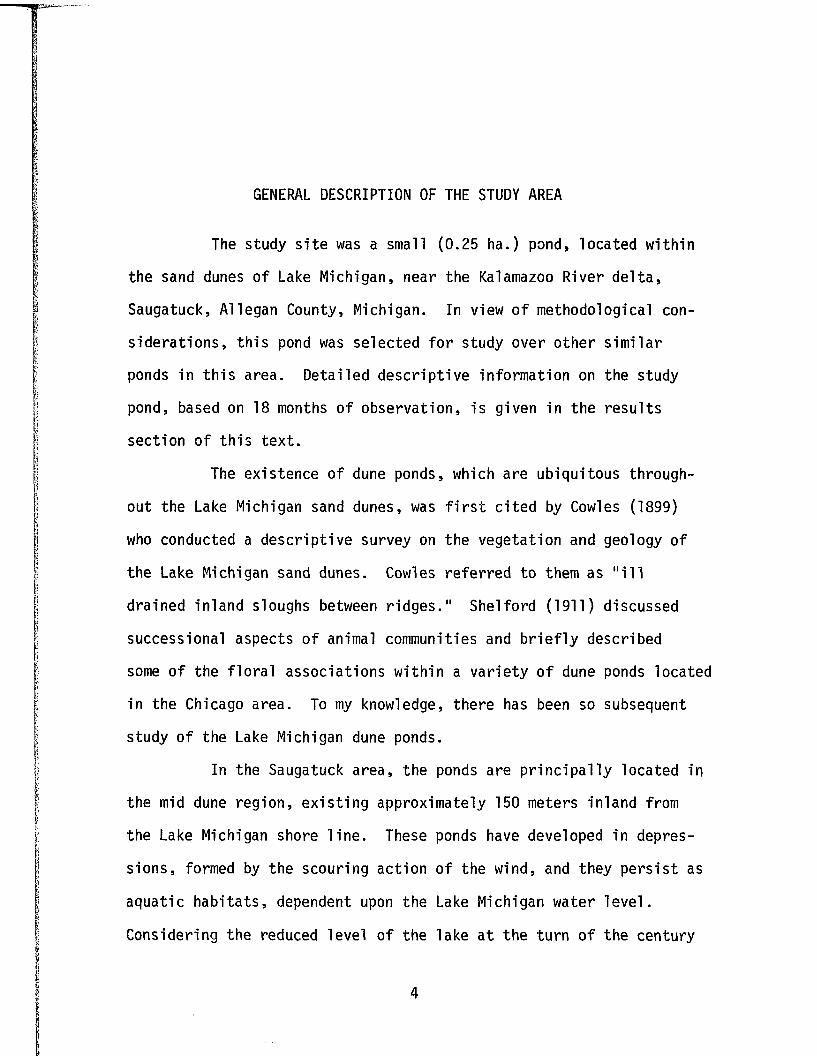
1. A r t i f i c i a l substrates used in periphyton study .................. 12
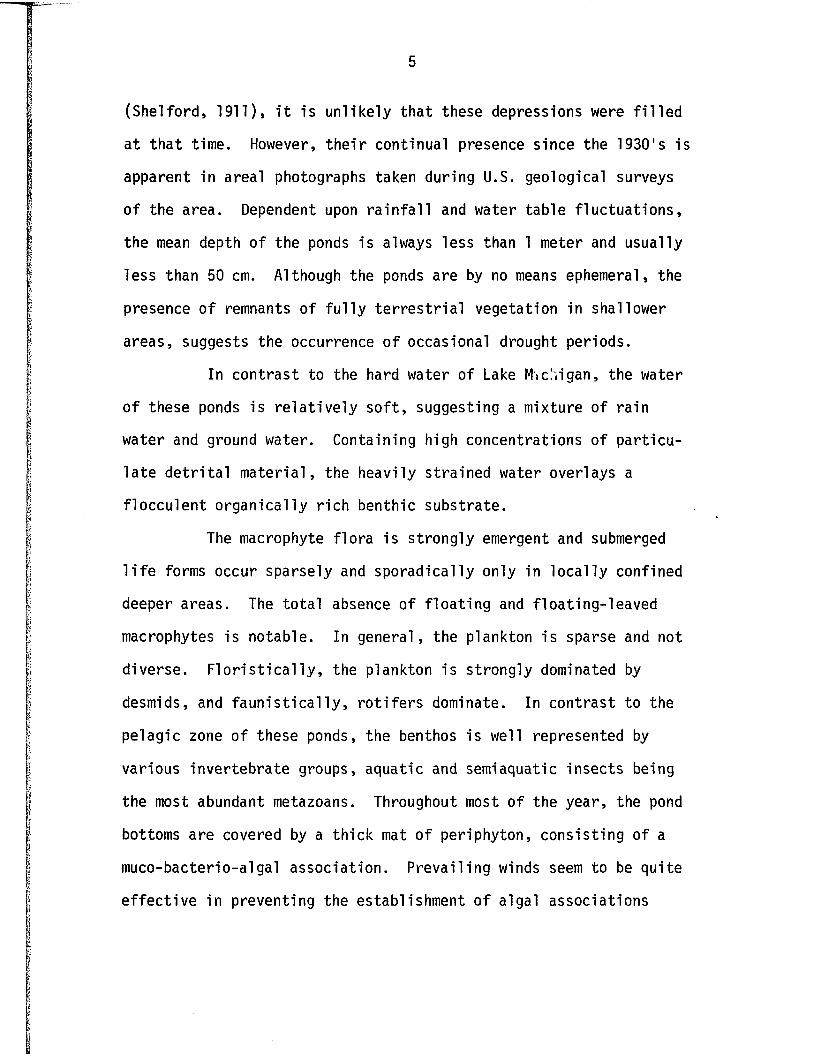
2. Metabolic chambers used in gas exchange study .................. 19
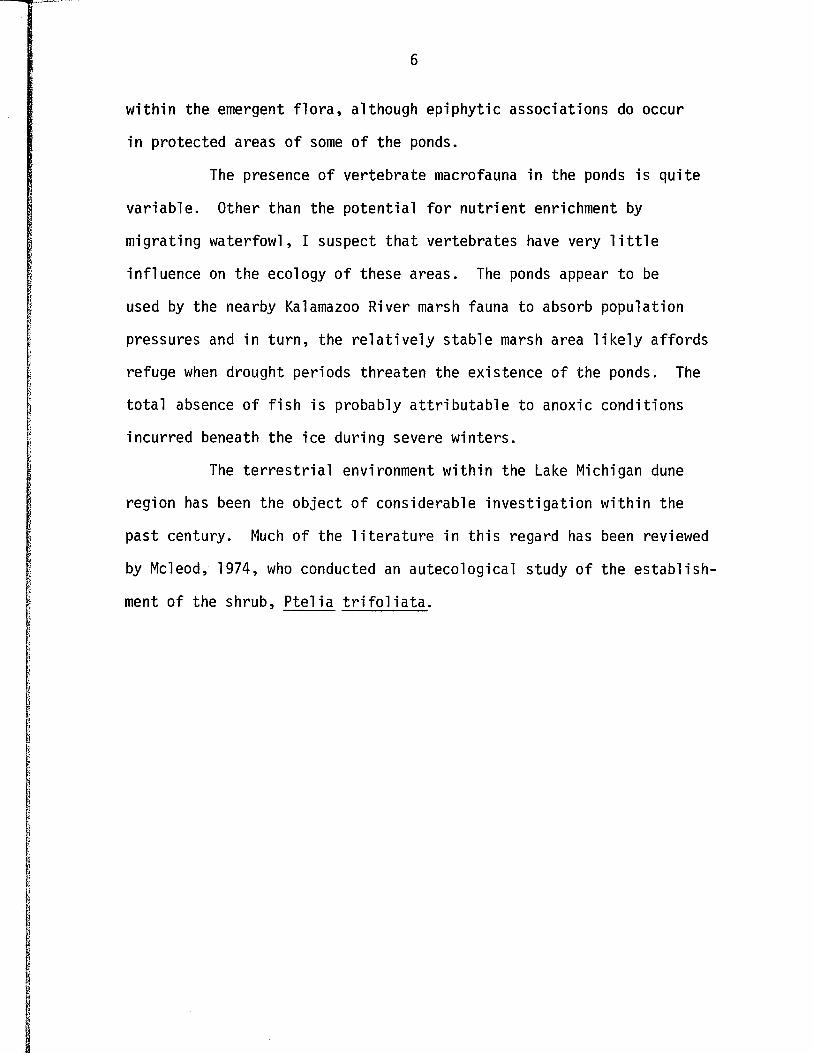
3. In fra -re d gas analysis determination of carbondioxide f lu x in l ig h t and dark c h a m b e rs .......................... 25
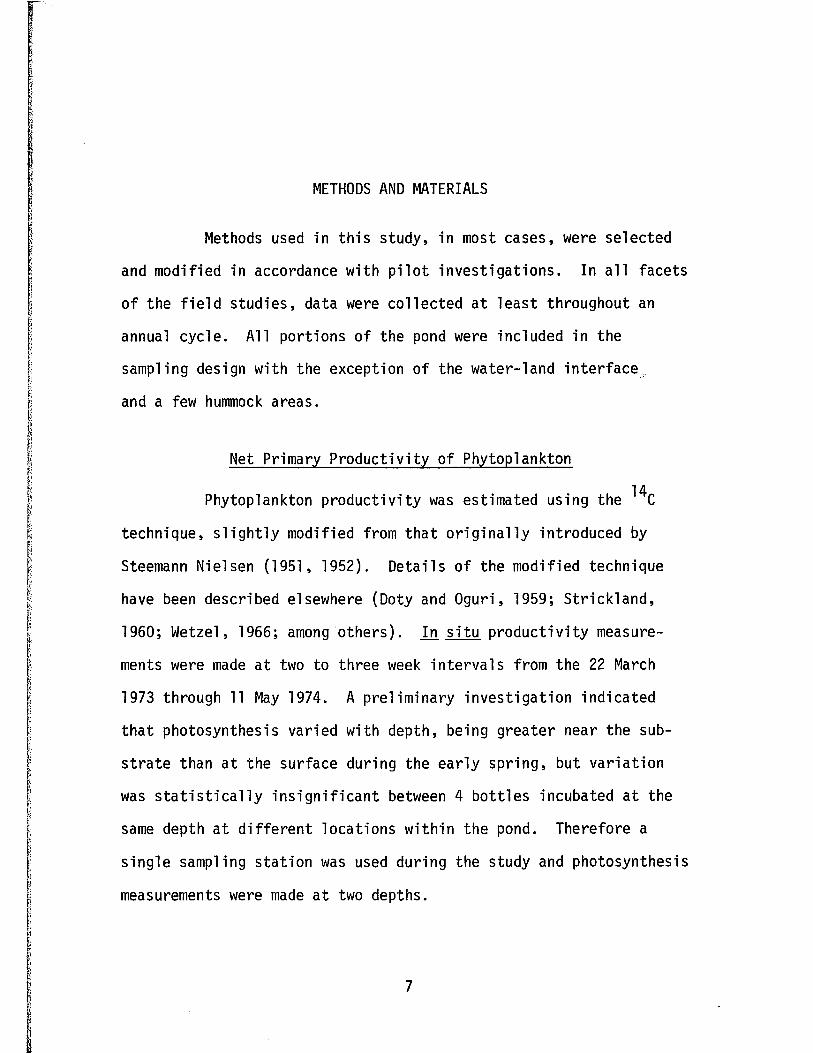
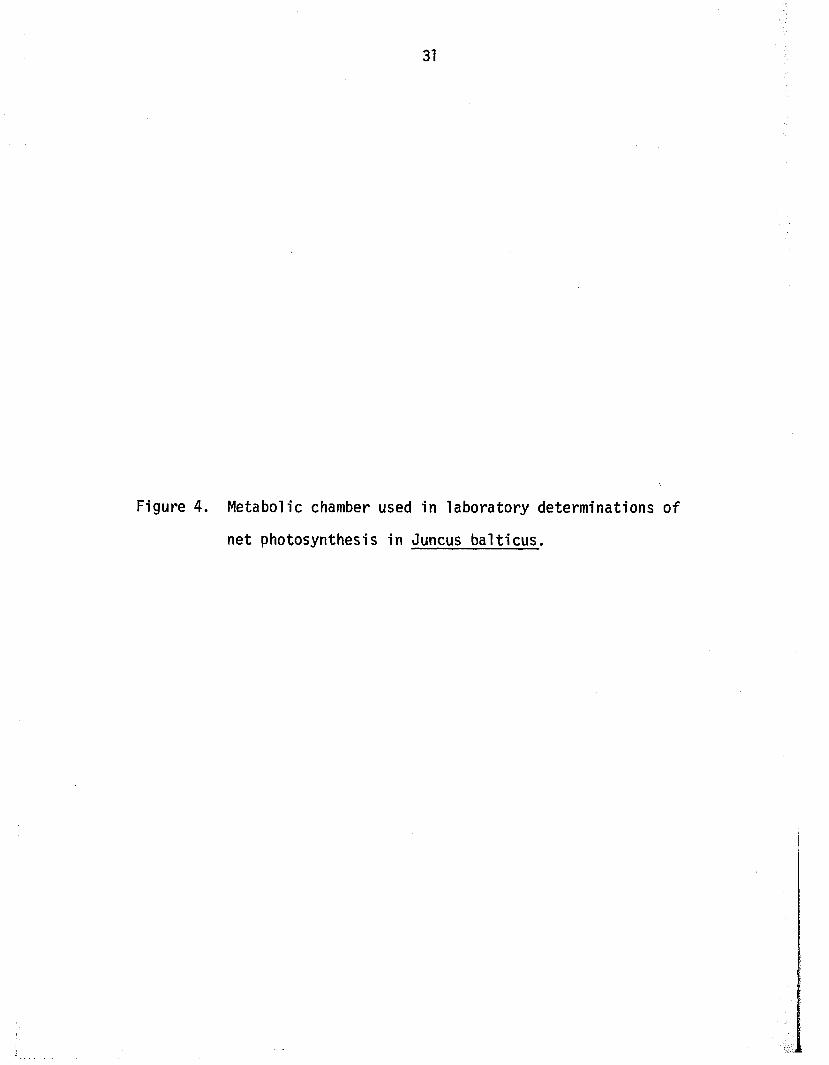
4. Metabolic chamber used in laboratory determinationso f net photosynthesis in Juncus balticus .......................... 31
5. The net primary productiv ity o f algae is presentedfo r the period of March 1973 through March 1974.Monthly designations (abscissa) id e n t ify mid month dates. Points represent the net primary product i v i t y o f phytoplankton ( 0 ) and ep ipe lic periphyton ( A ) .......................................................................... 43
6. D istributions o f macrophyte biomass and l i t t e r arepresented fo r the period o f A pril 1973 throughOctober 1974. Monthly designations (abscissa)id e n t ify mid month dates. V ertica l bars representone standard e rro r o f the mean v a l u e s ............................... 46
7. Ecosystem metabolism is presented fo r the period ofJuly 1973 through October 1974. Monthly designations (abscissa) id e n t ify mid month dates. Points represent rates o f gross photosynthesis ( $ ) and ecosystem resp ira tion ( A ) .................................................... 55
8. Net photosynthesis in Juncus balticus at l ig h tin te n s it ie s ranging between 0 and 5,500 footcandles. Points represent net photosyntheticrates in young ( $ ) and old stems ( A ) ........................ 69
INTRODUCTION
In "The Lake as a Microcosm," Forbes (1887) discussed the
interdependence o f plants and animals, and in so doing, conceptually
described an aquatic ecosystem. Subsequently, Lindeman (1942)
elucidated the functual nature o f th is interdependence, and Odum
(1962, 1963) modified the concept, more c le a r ly specifying the ro le
o f d e tr i tu s .
Concomitant with the development o f the ecosystem concept,
has been an increasing in te re s t in the process o f primary produc
t i v i t y . To date, most estimates o f aquatic primary prod uctiv ity have
been based on phytoplankton studies, re f le c t in g the high degree o f
methodological refinement in th is area. While approximating to ta l
net primary p roductiv ity o f deep lakes, p rod uctiv ity estimates based
sole ly on phytoplankton, underestimate to ta l p rod uctiv ity o f lakes
with a large ra t io o f colonizable l i t t o r a l zone to pelagic zone. Due
la rg e ly to methodological constra in ts , in s itu p rod uctiv ity estimates
of attached algae and macrophytes have been meager. The significance
o f l i t t o r a l producers has been demonstrated in a shallow basin
(Borax Lake, Wetzel, 1964) and in a r e la t iv e ly deeper lake with a
moderate l i t t o r a l zone (Lawrence Lake, Wetzel e t a l . , 1972). In the
comprehensive Lawrence Lake study, incorporating the resu lts o f
several doctoral d isse rta t io n s , net primary production of the
macrophytes, periphyton, and phytoplankton resp ective ly , accounted
fo r 51.3%, 23.3%, and 25.4% o f the to ta l net primary production of
the lake.
Community metabolism, including heterotrophic and auto
trophic processes, has been studied as an extension o f primary produc
t i v i t y investigations . Although limnologists had been measuring
planktonic metabolism fo r years using the l ig h t-d a rk b o tt le oxygen
technique (Gaarder and Gran, 1927), the notion and theoretica l ram
if ic a t io n s thereof o r ig in a l ly arose from the energy flow diagrams and
descrip tive conceptualization o f Odum (1956 and 1957), and have since
been subsequently expanded upon by Margalef (1968).
An extension o f the community metabolism concept is that
o f ecosystem metabolism which encompasses the integrated a c t iv i ty
o f indiv idual communities w ithin an ecosystem. Ecosystem metabolism
studies have been implemented in te r r e s t r ia l systems using CO2 f lu x
models (see fo r example, Woodwell and Whittaker, 1968; Lemon e t a l . ,
1970). Metabolic studies in lo t ic aquatic systems, using diurnal
oxygen techniques (Odum, 1965, M cD iffe tt et a l . , 1972, and others)
and in le n t ic systems using diurnal pH models (Verduin, 1952, 1956,
and o th ers ), have measured community metabolism but not the metabolism
o f the e n t ire ecosystem. Cummins (1974) emphasized the heterotrophic
nature o f streams as processors o f allochthonous organic inputs from
the te r r e s t r ia l watershed. As such, a stream in i t s e l f cannot be
thought o f as an ecosystem, and metabolic measurements w ithin a
stream are , fo r the most p a r t , in d ica tiv e of the metabolism of com
ponent heterotrophic communities. S im ila r ly , studies o f le n t ic
3
metabolism have generally been concerned with the a c t iv i t y o f spec ific
component communities, usually p lanktonic, and the resu lts o f these
c e r ta in ly cannot be extrapolated to the e n tire ecosystem.
Owing to conceptual and methodological advances in the areas
of primary p roductiv ity and ecosystem metabolism, I have attempted to
investigate the to ta l p roductiv ity and metabolism of an e n t ire eco
system (a dune pond). S p e c if ic a lly my objectives in th is study were
the following:
1. The description o f the dune pond ecosystem with regard
to physical, chemical, and bio logical characteris tics
relevant to other aspects o f the study.
2. The estimation of to ta l net primary productiv ity .
3. An evaluation o f the importance of the individual auto
trophic components with regard to th e ir contributions to
to ta l net primary p roductiv ity .
4. The estimation o f gross primary p roductiv ity .
5. The estimation o f ecosystem resp ira t io n .
6. An evaluation o f the r e la t iv e magnitudes of autotrophic
and heterotrophic components o f ecosystem resp ira t io n .
7. The estimation o f net ecosystem productiv ity .
8. The estimation o f gross photosynthetic and net photosynthe
t i c e f f ic ie n c y with respect to solar energy and gross
a ss im ila tio n , respective ly .
GENERAL DESCRIPTION OF THE STUDY AREA
The study s i te was a small (0 .25 ha.) pond, located within
the sand dunes o f Lake Michigan, near the Kalamazoo River d e lta ,
Saugatuck, Allegan County, Michigan. In view o f methodological con
s iderations, th is pond was selected fo r study over other s im ila r
ponds in th is area. Detailed descrip tive information on the study
pond, based on 18 months o f observation, is given in the results
section o f th is te x t .
The existence of dune ponds, which are ubiquitous through
out the Lake Michigan sand dunes, was f i r s t c ited by Cowles (1899)
who conducted a descriptive survey on the vegetation and geology o f
the Lake Michigan sand dunes. Cowles re ferred to them as " i l l
drained inland sloughs between r idges." Shelford (1911) discussed
successional aspects o f animal communities and b r ie f ly described
some o f the f lo r a l associations w ith in a v a r ie ty o f dune ponds located
in the Chicago area. To my knowledge, there has been so subsequent
study o f the Lake Michigan dune ponds.
In the Saugatuck area, the ponds are p r in c ip a l ly located in
the mid dune region, ex is ting approximately 150 meters inland from
the Lake Michigan shore l in e . These ponds have developed in depres
sions, formed by the scouring action of the wind, and they pers is t as
aquatic hab ita ts , dependent upon the Lake Michigan water le v e l .
Considering the reduced level o f the lake a t the turn o f the century
4
5
(Shelford , 1911), i t is un like ly that these depressions were f i l l e d
a t that time. However, th e ir continual presence since the 1930's is
apparent in areal photographs taken during U.S. geological surveys
o f the area. Dependent upon r a in fa l l and water table f lu c tu a tio n s ,
the mean depth o f the ponds is always less than 1 meter and usually
less than 50 cm. Although the ponds are by no means ephemeral, the
presence o f remnants o f f u l ly te r r e s t r ia l vegetation in shallower
areas, suggests the occurrence o f occasional drought periods.
In contrast to the hard water of Lake Michigan, the water
o f these ponds is r e la t iv e ly s o f t , suggesting a mixture o f ra in
water and ground water. Containing high concentrations of particu
la te d e t r i ta l m a te r ia l , the heavily strained water overlays a
f lo ccu len t o rgan ica lly r ich benthic substrate.
The macrophyte f lo ra is strongly emergent and submerged
l i f e forms occur sparsely and sporadically only in lo c a l ly confined
deeper areas. The to ta l absence of f lo a t in g and flo ating -leaved
macrophytes is notable. In general, the plankton is sparse and not
diverse. F lo r is t ic a l ly , the plankton is strongly dominated by
desmids, and fa u n is t ic a l ly , r o t i fe r s dominate. In contrast to the
pelagic zone o f these ponds, the benthos is well represented by
various invertebrate groups, aquatic and semi aquatic insects being
the most abundant metazoans. Throughout most of the year, the pond
bottoms are covered by a th ick mat o f periphyton, consisting of a
muco-bacterio-algal association. P revailing winds seem to be quite
e f fe c t iv e in preventing the establishment o f algal associations
6
w ith in the emergent f lo r a , although epiphytic associations do occur
in protected areas o f some o f the ponds.
The presence o f vertebrate macrofauna in the ponds is quite
v ariab le . Other than the potentia l fo r nu tr ien t enrichment by
migrating waterfowl, I suspect th a t vertebrates have very l i t t l e
influence on the ecology o f these areas. The ponds appear to be
used by the nearby Kalamazoo River marsh fauna to absorb population
pressures and in tu rn , the r e la t iv e ly stable marsh area l i k e ly affords
refuge when drought periods threaten the existence o f the ponds. The
to ta l absence of f is h is probably a t t r ib u ta b le to anoxic conditions
incurred beneath the ice during severe winters.
The te r r e s t r ia l environment w ith in the Lake Michigan dune
region has been the object o f considerable investigation w ith in the
past century. Much of the l i t e r a tu r e in th is regard has been reviewed
by Mcleod, 1974, who conducted an autecological study o f the es tab lish
ment o f the shrub, P te l ia t r i f o l i a t a .
METHODS AND MATERIALS
Methods used in th is study, in most cases, were selected
and modified in accordance with p i lo t investigations . In a l l facets
o f the f ie ld studies, data were collected a t leas t throughout an
annual cycle. A ll portions o f the pond were included in the
sampling design with the exception o f the water-land in terface
and a few hummock areas.
Net Primary Productiv ity o f Phytoplankton
14Phytoplankton productiv ity was estimated using the C
technique, s l ig h t ly modified from tha t o r ig in a l ly introduced by
Steemann Nielsen (1951, 1952). Details o f the modified technique
have been described elsewhere (Doty and Oguri, 1959; S tr ick land ,
1960; Wetzel, 1966; among others). _In s jtu productiv ity measure
ments were made a t two to three week in terva ls from the 22 March
1973 through 11 May 1974. A prelim inary investigation indicated
that photosynthesis varied with depth, being greater near the sub
s tra te than a t the surface during the e arly spring, but va ria t io n
was s t a t i s t ic a l ly in s ig n if ic a n t between 4 bottles incubated a t the
same depth a t d i f fe re n t locations w ith in the pond. Therefore a
single sampling station was used during the study and photosynthesis
measurements were made a t two depths.
7
Water samples collected a t approximately 10 cm. below the
water surface and a t approximately 10 cm. above the pond bottom were
placed into ground glass stoppered l ig h t and dark Pyrex bottles
(125 m l . ) . A 1.0 ml. solution of Na2HC03 containing tracer of
known radioassay, 3.5 to 4 .5 microcuries/ml. (combustion and assay
in gas phase, Goldman, 1968) was in jected in to each b o tt le which
was then sealed. Three b o tt le s , two c lear and one dark, were pre
pared and suspended a t each o f the two sampling depths. A fte r a
single midday 4 hr. incubation, the bottles were removed, placed in
a l ig h t - f r e e box and transported to the laboratory. The part ic u la te
content o f the bottles was resuspended by gentle shaking, and 25 to
50 ml. a liquots were f i l t e r e d onto membrane f i l t e r s (HA M il l ip o re
F i l t e r Corp., Bedford, Mass.) o f a porosity o f 0.45± .02 microns
a t vacuum pressures o f 25-35 cm. Hg. The pore s ize o f 0.45
microns e f fe c t iv e ly removes a l l o f the phytoplankton (Lasker and
Holmes, 1957) and furthermore molecular f i l t e r s o f comparable pore
size have been ro u tin e ly used in phytoplankton studies. The f i l t e r e d
phytoplankton was dried in a desiccator and radioassayed with a m ini
mum of 2000 counts (occasionally 1000 counts fo r dark b o tt le a c t iv i ty
during the w inter) on a gasflow Geiger Muller counter (Nuclear
Chicago, Model 6010, with micromil window). P r io r to radioassay,
a l l f i l t e r s were decontaminated by exposure to fumes of HC1 fo r
10 minutes (Wetzel, 1965a) although the necessity fo r th is procedure
is questionable in so ft waters.
Carbon assim ila tion was calculated by m ultip ly ing the
14assayed amount o f C by the ra t io between the to ta l inorganic C of
9
14the pond water and the to ta l inorganic C added to the sample bottles
before incubation (see Vollenweider, 1969 fo r deta iled ou tl ine of
calculations and parameters used th e re in ) . A ll physical and chemical
determinations, necessary fo r assim ilation calculations and subse
quently used fo r descriptive purposes, were made a t pond side. The
to ta l inorganic C o f the pond water in m g ./ I . was calculated from
the sample temperature (YSI Telethermometer, Model 46-TUC), the to ta l
a lk a l in i t y (chemical t i t r a t i o n , see American Public Health e t a l . ,
1971), the pH (e lectrom etric determination, Beckman, Model G), and
appropriate conversion factors (Saunders e t a l . , 1962). An isotope
descrimination fa c to r o f 6% was used in a l l ca lculations (Steemann
Nielsen, 1955). Non photosynthetic carbon f ix a t io n (bac te ria l chemo-
synthesis and non bacteria l heterotrophic carboxylation a c t iv i t y )
was compensated fo r in a l l ca lculations of photosynthesis by sub
trac t in g the dark b o tt le values from those o f the l ig h t . Photosyn
th e t ic assim ila tion was expanded from periods o f incubation to e n t ire
sampling days using diurnal fac to rs , calculated by planimetry o f the
solar energy curves (see Wetzel, 1964; Jassby and Goldman, 1974) from
a recording Eppley pyreheliometer, operated a t the Kellogg Biological
S ta tion , a distance o f approximately 65 km. from the research s i te .
S im ila r ly , photosynthetic assim ila tion was estimated between sampling
periods.3
Data are expressed both on a volumetric (per m ) and an o
areal (per m ) basis. Data on a volumetric basis were converted to
an areal basis, m ultip ly ing by the mean pond depth on respective
sampling days. Annual net primary production was determined by
10
in tegrating the area under an annual p rod uctiv ity curve with respect
to time.
Net Primary Productivity o f Epipelic Periphyton
14Periphyton productiv ity was estimated using the C tech
nique, s l ig h t ly modified from tha t used in estimating phytoplankton
prod uctiv ity . In s itu productiv ity measurements were made a t two
to three week in terva ls over the period from 14 April 1973 through
20 April 1974. Preliminary investigations indicated the unfeasi
b i l i t y o f sampling from the flocculent natural benthic substrate and
therefore a r t i f i c i a l substrates were employed.
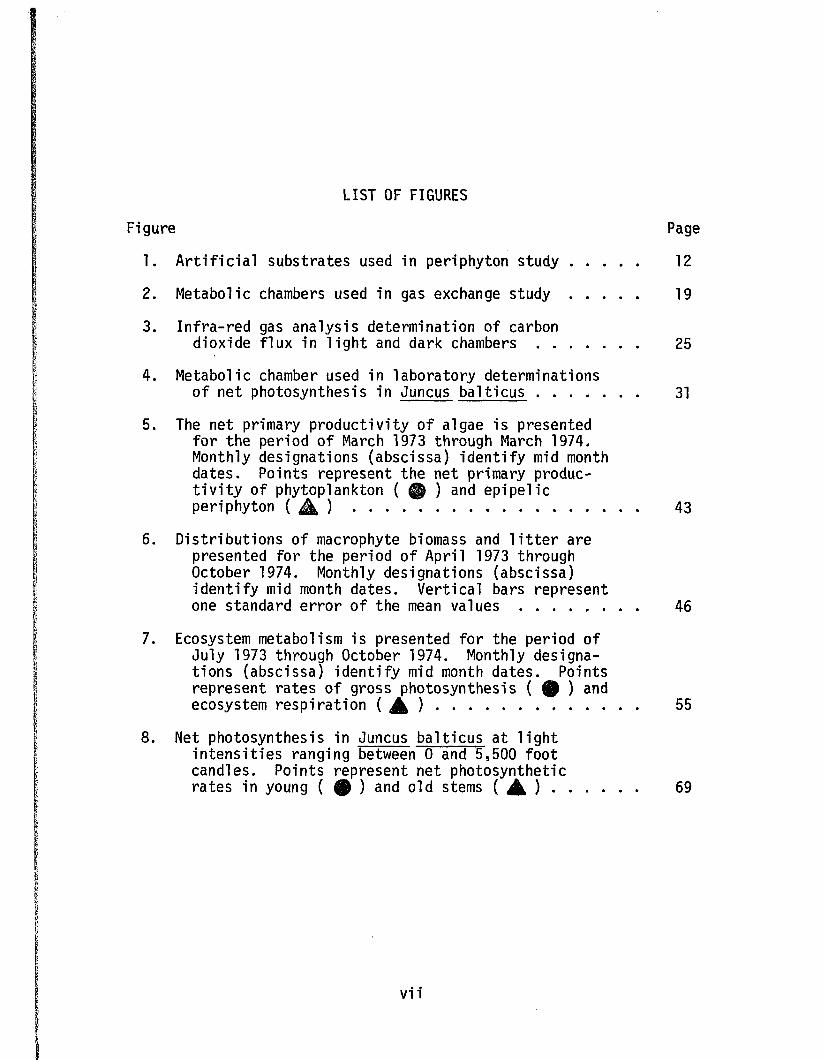
The s u i t a b i l i t y o f a r t i f i c i a l substrates fo r periphyton
studies remains controversia l. E fforts devoted to assessing q u a l i ta
t iv e and q u an tita t ive differences between a r t i f i c i a l and natural
substrates (Pieczynska and Spodniewska, 1963; T ip p e tt , 1970) have
given c o n f l ic t in g resu lts . These studies de a lt exclusive ly with
epiphytic algal communities, and conclusions drawn from them are
probably less applicable to benthic algae, which may colonize sub
s trates somewhat fo r tu ito u s ly with a lesser regard fo r substrate
type. Wetzel (1965b) reviewed various problems with the use of
a r t i f i c i a l substrates in productiv ity investigations and suggested
the placement o f a large number (enough fo r an annual study) o f
simulated substrates, allowing s u f f ic ie n t time fo r colonization
before sampling.
Microscope s lid e s , placed on the pond bottom in February
o f 1973, lacked the surface area necessary fo r buoyancy upon the
n
f lo ccu lent sediments, sank in to the organic ooze and were abandoned.
On 4 March 1973, 60 la rg e r a r t i f i c i a l substrates were positioned on
the pond bottom a t one meter in te rv a ls along two in tersecting
transects , each being 30 m. in length. These substrates worked
exceptionally w e ll , remaining flush with the natural sediments
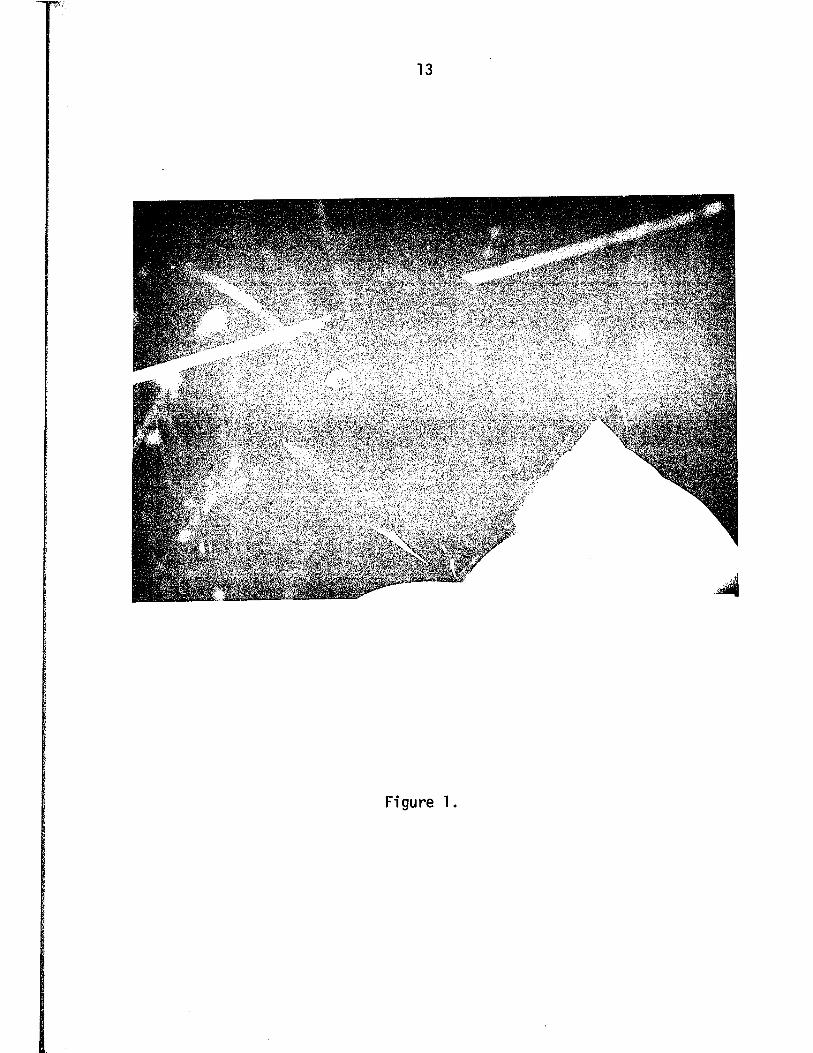
throughout the study. They were constructed o f ceramic t i l e , 120 cm.
in area, overla in with cork, and wrapped with black polyethylene f i lm
(Figure 1 ). The polyethylene f i lm f a c i l i t a te d subsampling with a
cork bore minimizing major disturbance to the rest o f the t i l e com
munity. Backhaus (1967) reported exce llent re p lic a t io n o f lo t ic
e p i l i t h i c periphyton on polyethylene f i lm .
During each sampling period, four t i l e s were randomly
selected from the transects fo r subsampling and then were quickly
replaced on the pond bottom. Polyethylene disks, 1.5 cm. in diameter,
were removed from the t i l e s and placed in to l ig h t and dark ground
glass stoppered wide mouth Pyrex bottles (125 m l . ) , previously f i l l e d
with u n f i l te re d and untreated pond water. A one ml. solution of
Na2HC0 2 containing the isotope, o f iden tica l radioassay (same
lo t ) as th a t used in the phytoplankton studies, was in jected into
the bottles which were then sealed. Four l ig h t bottles and two dark
b o tt le s , thus prepared, were immediately positioned on the pond
bottom, juxtaposed to those t i l e s from which th e ir respective sub
samples had been removed. In the laboratory the algal mass associated
with the polyethylene disks was dislodged, the disks removed from the
b o tt le s , and any residual material wiped from the disks onto f i l t e r s
designated fo r periphyton f i l t r a t i o n . The p a rt ic u la te content of
12
Figure 1. A r t i f i c i a l substrates used in periphyton study.
13
Figure 1.
14
the bottles was suspended by shaking and the e n tire contents of each
passed as 25 ml. a liquots onto a series o f f iv e 0.45 micron Mi H i pore
f i l t e r s . Vacuum pressures were maintained a t 25-35 cm. Hg. Occa
s io n a lly during the summer, i t was necessary to mechanically disrupt
the massive a lgal mat removed from the polyethylene disks in order
to uniformly a llo c a te the m a te r ia l , reducing s e l f absorption d i f
f i c u l t ie s . This was accomplished by pu lling the mat through pipettes
o f decreasing volume u n ti l the a lgal material e a s ily passed the
25 ml. p ipe tte used fo r tra n s fe r onto the f i l t e r s .
Post f i l t r a t i o n laboratory treatment, radioassay procedures,
and carbon assim ila tion calculations were s im ila r to those described
fo r the phytoplankton samples. The ra d io a c t iv ity exclusively associ
ated with carbon assim ila tion by the periphyton was determined by
subtracting the a c t iv i t y o f the phytoplankton from the sum of the
a c t iv i t ie s o f the f iv e f i l t e r s used per sample. Volumes used for
d is tr ib u t io n and d i lu t io n o f the algal c e l ls were equated with the2
o rig in a l surface area colonized and the data expressed on a per m
basis. Annual net primary production was determined by in tegrating
the area under an annual p rod uctiv ity curve with respect to time.
Considering carbon assim ila tion by both the phytoplankton
and the ep ip e lic periphyton, I have assumed that the discrepancy
14between C uptake rates and the true rates o f algal net primary
productiv ity are small as suggested by Ryther (1954), Antia e t a l .
(1963), and M cA llis te r e t a l . (1964). Due to the re la t iv e inaccessi
b i l i t y o f the research s i te and the distance (approximately 60 km.)
between i t and the f i l t r a t i o n s i te (Kellogg Biological S ta t io n ) ,
15
unavoidable resp iratory losses o f labeled substrate occurred during
transportation o f the sample bottles in a l ig h t free box. Since
the time elapsing between b o tt le re tr ie v a l and laboratory f i l t r a
tion approximated the incubation period (4 h r s . ) , I have chosen to
t r e a t resp iratory losses during transport as a correction fo r night
resp iration (which was not measured in th is study) in converting
net p roductiv ity on a daylight hour basis to a d a ily (24 h r . ) basis.
Macrophyte Biomass and Productivity
Seasonal changes in macrophyte biomass and productiv ity
were estimated by harvesting. The harvest technique has been used
extensively in aquatic systems to estimate standing crop (see review
by Wetzel, 1964). Above ground productiv ity estimates have been
previously made by expressing standing crop on a seasonal basis
(Penfound, 1956; Forsberg, 1959; among others). Less frequently ,
due to the inherent d i f f i c u l t i e s o f below ground biomass sampling
(Westlake, 1968), to ta l p lant biomass estimates have been made.
Productiv ity determinations based on to ta l plant biomass, p a r t ic
u la r ly in communities dominated by perennials with extensive rhizomal
portions (eg. Westlake, 1966; Bernard, 1974), are considered the most
meaningful.
Above ground biomass and l i t t e r were removed at two to
three week in te rv a ls over the annual period o f 14 April 1973 through
20 April 1974 with the exception of the w inter months (November to
February) and the 31 March 1974 sampling period during which the pond
was la rg e ly ice covered. Below ground biomass was sampled a t two to
16
three week in terva ls without exception over the 18 month period o f
14 A pril 1973 through 10 October 1974. A ll sampling was done
randomly from four transects, each being 30 m. in length, two of
which ran in a north-south d irec tion and two in an east-west d ire c
t io n .
Above ground l iv in g biomass and a l l l i t t e r was removed2
by c lipp ing and raking from four 0.5 m frames, one from each tra n
sect. Clipping was done as close to the substrate as possible
thereby minimizing under estimates o f contributions by the stubble.
Immersed in a water f i l l e d basin, dead and l iv in g material was
c a re fu l ly cleaned and separated in the laboratory. No attempt was
made to separate the p lant m aterial in to taxonomic groups. C ontri
bution to the above ground biomass by taxa other than the two
dominants and with very few exceptions was minimal and usually zero
(see dune pond description in resu lts section).
Below ground biomass samples were obtained with a coring2
auger, having a cross sectional area o f 50 cm. , and capable o f
removing a core, 21 cm. in length. Due to the nature o f the pond
bottom and the mode o f growth o f the rhizomal and rooted portions
o f the p lan ts , th is method was very e f fe c t iv e . Below ground plant
m aterial grew la t e r a l ly , ra re ly exceeding 15 cm. o f depth in the
t ig h t ly compacted sand s o i l . Cutting c leanly through the extensive
rhizomal mat, the auger encountered the underlying compacted layer
o f sand which e f fe c t iv e ly sealed the p lant sample w ith in the auger,2
thereby preventing losses upon r e t r ie v a l . Eight 100 cm. samples
(two from each tra n s e c t) , each consisting o f two cores, were taken
17
during each sampling period. In the laboratory , the samples,
contained w ith in a wire mesh s tra in ing seive, were vigorously cleaned
o f the sand and associated organic debris. No attempt was made to
separate dead from l iv in g below ground m ater ia l. Indeed the absence
o f metabolic a c t iv i t y in a submerged organ in no way precludes i ts
usefulness to the p lant (Westlake, 1965). Such organs may be impor
tan t as supportive structures and may also function in a storage
capacity. Therefore a l l below ground portions tha t were strong
enough to remain in ta c t a f t e r the washing process were treated as
biomass.
To obtain dry weight estimates, a l l macrophyte samples
(above and below ground) and the l i t t e r were dried fo r a minimum of
24 hours in a forced a i r oven a t 100°C and weighted on a t r ip le beam
balance. These samples were then powdered in a Wiley m i l l , sub
sampled, combusted in a muffle furnace at 550°C and reweighed on a
torsion balance to obtain ash free dry weight (organic weight)
estimates. Using appropriate areal conversion fac to rs , macrophyte2
biomass was calculated and is given as dry weight per m . Converting
from organic weight to carbon weight using the fac to r o f 0.465
(Westlake, 1965), macrophyte prod uctiv ity is expressed as mgC/m on
d a ily and annual bases so that i t may be compared to the algae in
determining r e la t iv e contributions o f indiv idual autotrophic com
ponents to the to ta l net primary prod uctiv ity o f the dune pond
ecosystem.
18
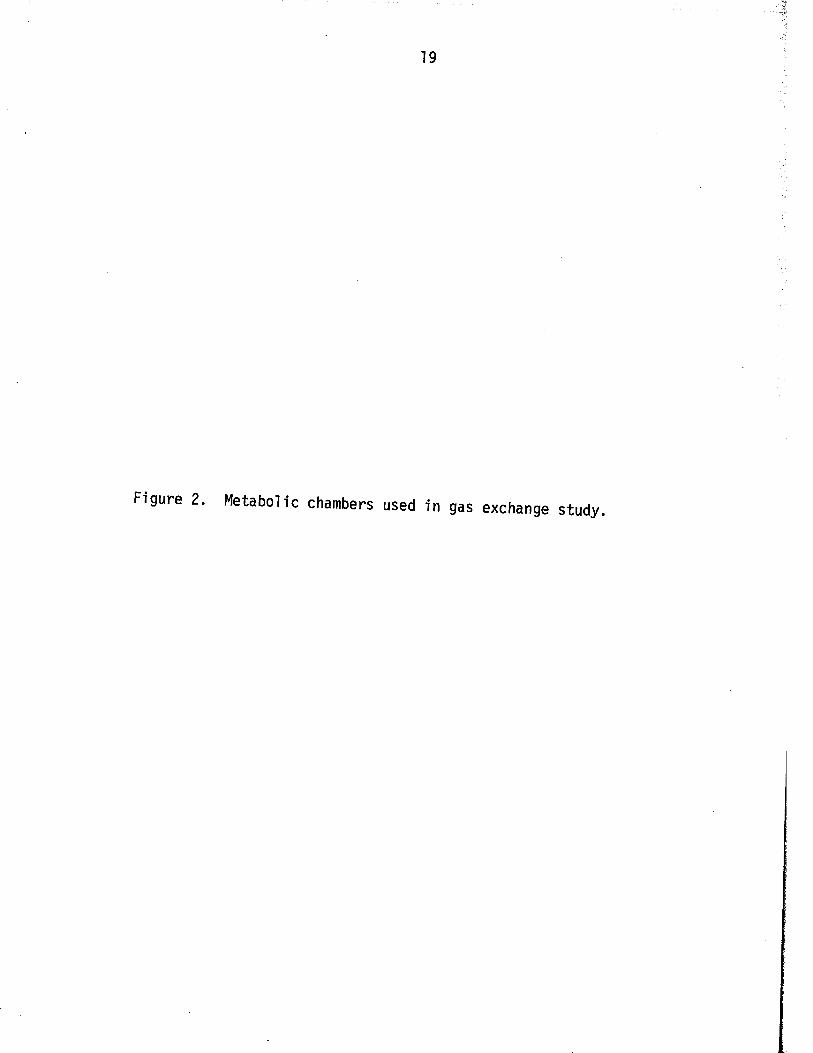
Ecosystem Metabolism
In s itu estimates of gross productiv ity and ecosystem
resp iration were made using a gas analysis technique based on carbon
dioxide exchange measured with an in fra -re d gas analyzer (Beckman,
Model 215 A). Bordeau and Woodwell (1965) have reviewed in fra -re d
absorption techniques fo r measuring rates of CC exchange. This
technique fo r measuring C02 concentrations was selected over chemical
methods because o f i t s accuracy (Heath, 1969).
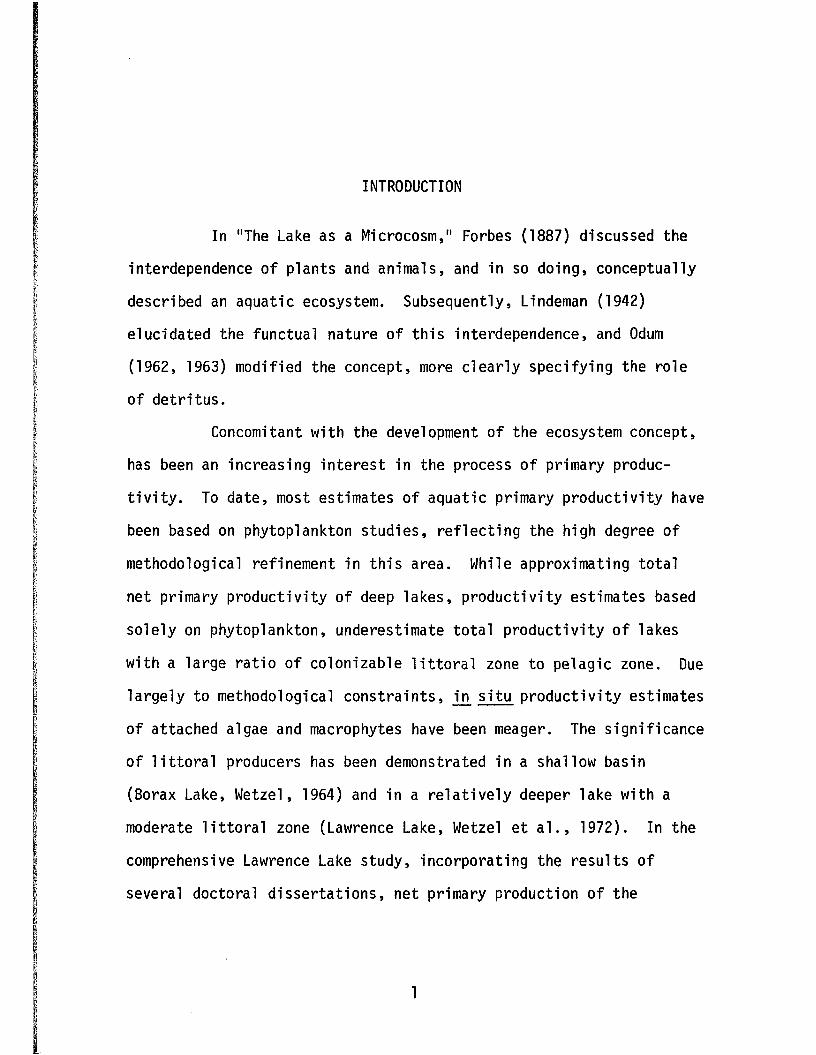
Two portable metabolic chambers, constructed o f 1 /8 inch
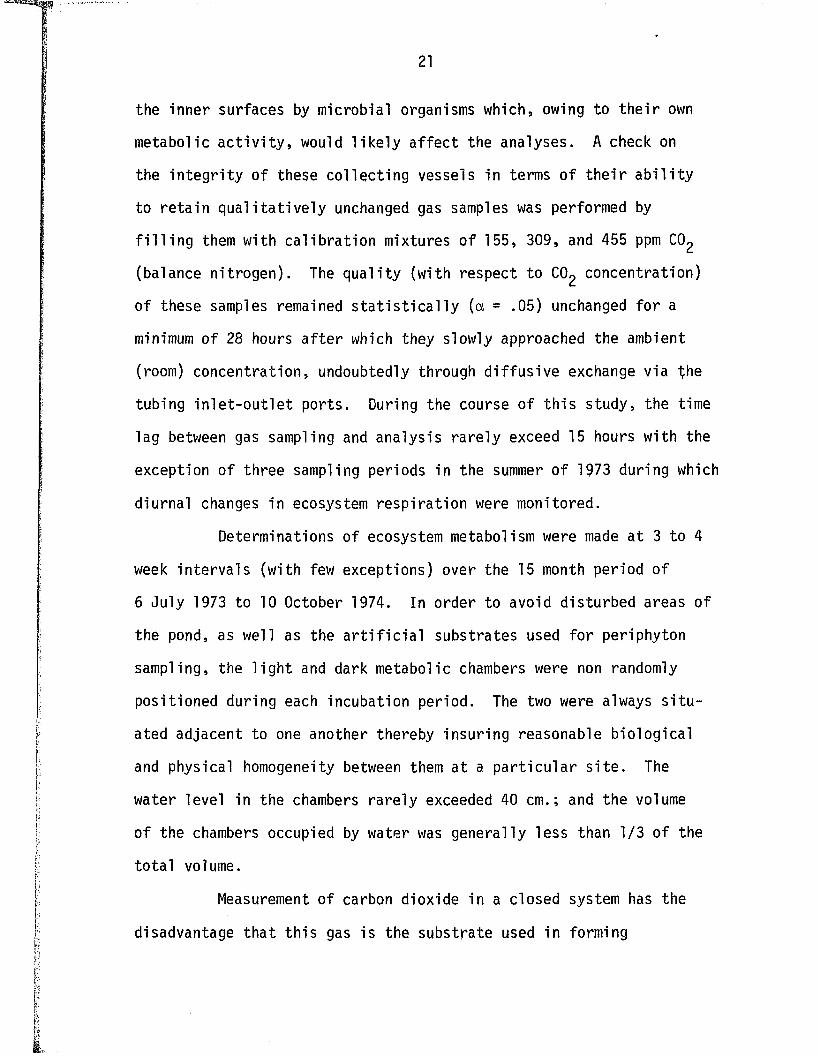
c lear Plexiglas (Figure 2) were used in the study to enclose portions
of the pond fo r analysis o f ecosystem gas exchange. These chambers?
were id en tica l in th e ir dimensions, being one meter t a l l , 1/4 m in
cross sectional area (50 cm. x 50 cm.), and each having a volume of
250 l i t e r s . One o f the chambers (hence referred to as the dark
chamber) was wrapped with f iv e layers of black polyethylene p la s t ic ,
excluding a l l l ig h t . Both were equipped with 1 /4 inch in le t and
o u tle t ports , positioned opposite each other, a t 25 and 75 cm. d is
tances from the base. The upper ports were used fo r gas withdrawal
and the lower fo r water c irc u la t io n .
Due to the technical d i f f i c u l t i e s involved in f ie ld app lica
tions of the in fra -re d analysis technique (Mooney e t a l . , 1971),
p a r t ic u la r ly in aquatic systems, gas samples were transported in gas
c o llec t in g vessels to the laboratory fo r analysis. A number o f gas
c o llec t in g vessels were constructed fo r f ie ld use from 500 ml. glass
side arm f la s k s , gum tubing, and compressor clamps. These vessels
were rou tine ly autoclaved and oven dried to prevent colonization of
19
Figure 2. Metabolic chambers used in gas exchange study.
20
Figure 2.
1
21
the inner surfaces by microbial organisms which, owing to th e ir own
metabolic a c t iv i t y , would l ik e ly a f fe c t the analyses. A check on
the in te g r i ty o f these co llecting vessels in terms of th e ir a b i l i t y
to re ta in q u a l i ta t iv e ly unchanged gas samples was performed by
f i l l i n g them with c a lib ra t io n mixtures o f 155, 309, and 455 ppm CO2
(balance n itrogen). The q u a lity (with respect to CO2 concentration)
of these samples remained s t a t i s t ic a l ly (a = .05) unchanged fo r a
minimum o f 28 hours a f te r which they slowly approached the ambient
(room) concentration, undoubtedly through d if fu s iv e exchange via the
tubing in le t -o u t le t ports. During the course o f th is study, the time
lag between gas sampling and analysis ra re ly exceed 15 hours with the
exception of three sampling periods in the summer o f 1973 during which
diurnal changes in ecosystem resp iration were monitored.
Determinations o f ecosystem metabolism were made a t 3 to 4
week in terva ls (with few exceptions) over the 15 month period of
6 July 1973 to 10 October 1974. In order to avoid disturbed areas of
the pond, as well as the a r t i f i c i a l substrates used fo r periphyton
sampling, the l ig h t and dark metabolic chambers were non randomly
positioned during each incubation period. The two were always s i tu
ated adjacent to one another thereby insuring reasonable bio logical
and physical homogeneity between them a t a p a r t ic u la r s i te . The
water level in the chambers ra re ly exceeded 40 cm.; and the volume
of the chambers occupied by water was generally less than 1/3 o f the
to ta l volume.
Measurement of carbon dioxide in a closed system has the
disadvantage tha t th is gas is the substrate used in forming
22
carbohydrates in photosynthesis. Furthermore, in reacting with
water, C02 forms a weak acid (^CO^) which in a closed system may
create a pH change inconsistant with normal b io logical function. In
attempting to minimize the potentia l in h ib ito ry e ffec ts o f very high
and very low C02 concentrations in the dark and l ig h t chambers
resp ective ly , incubation periods, ranging from 1/2 hour during the
early summer and 6 hours during the w in te r , were inversely adjusted
to the metabolic a c t iv i ty of the pond.
Normally the chambers were positioned fo r incubation pur
poses a t 3 to 5 d i f fe re n t positions throughout the pond between
08:00 and 20:00 during a sampling day. At the beginning of th is
study, incubations were performed d iu rn a lly with a t leas t one night
time measurement. Subsequent s ta t is t ic a l analysis o f ecosystem
resp ira tion rates (Table 1) fa i le d to demonstrate any differences
between day and night resp iratory a c t iv i t y ; therefore night time
metabolic measurements were discontinued fo r the remainder o f the
study.
During each incubation, a i r and water temperature w ith in
both chambers was monitored a t in terva ls o f 15 to 30 minutes using
a six channel telethermometer (Yellow Springs, Model 46-TUC). Deter
minations o f ambient a i r and water temperatures were s im ila r ly made.
Using a pressure-vacuum handpump (850 ml. c a p a c ity ), connected in
series to the lower chamber p o rta ls , the aqueous volume o f the two
chambers was p er io d ic a lly c ircu la ted to minimize a r t i f a c tu a l ly
induced s t r a t i f ic a t io n p o te n t ia l ly in h ib it in g C02 d if fu s iv e exchange
during longer incubation periods. Using another handpump, o f
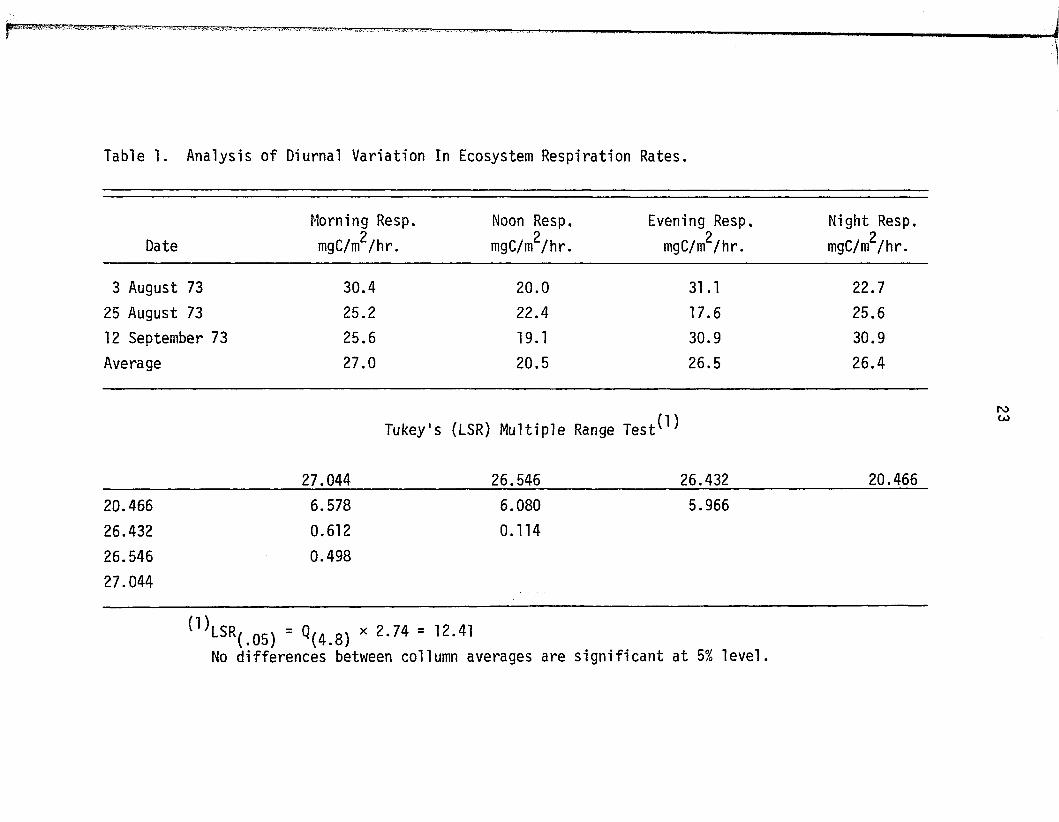
Table 1. Analysis of Diurnal Variation In Ecosystem Respiration Rates.
Morning Resp. Noon Resp. Evening Resp, Night Resp.
Date mgC/m^/hr. mgC/m^/hr.p
mgC/m /h r .2
mgC/m /h r .
3 August 73 30.4 20.0 31.1 22.7
25 August 73 25.2 22.4 17.6 25.6
12 September 73 25.6 19.1 30.9 30.9
Average 27.0 20.5 26.5 26.4
Tukey's (LSR) M ultip le Range T e s t ^
27.044 26.546 26.432 20.466
20.466 6.578 6.080 5.966
26.432 0.612 0.114
26.546 0.498
27.044
<1>LSR(.0S) - « (4 .8 ) * 2 ' 74 = , 2 - 41No differences between collumn averages are s ig n if ic a n t a t 5% le v e l.
24
identica l design, gas samples were withdrawn in duplicate from the
chambers in to gas co llec ting vessels a t the commencement and a t the
end of each incubation. To avoid the p o s s ib i l i ty o f promoting
microbial a c t iv i ty under humid conditions, gas samples were dried
by passing them through a d r ie r i t e column before introduction into
co lle c t in g vessels. Both the co llec tin g vessels and the d r ie r i t e
column were connected in series with the handpump to the upper
chamber po rta ls . Gas co llec ting vessels were not disengaged from
the series u n ti l the e n tire sampling system was brought in to q u a l i ta
t iv e equilibrium with the chamber sampled. Usually, 30 to 40 l i t e r s
of gas (50 depressions o f the handpump) were c ircu la ted through the
sampling system before sample removal. At the end of each sampling
day, the gas c o lle c t in g vessels were transported immediately to the
laboratory fo r CO2 analysis.
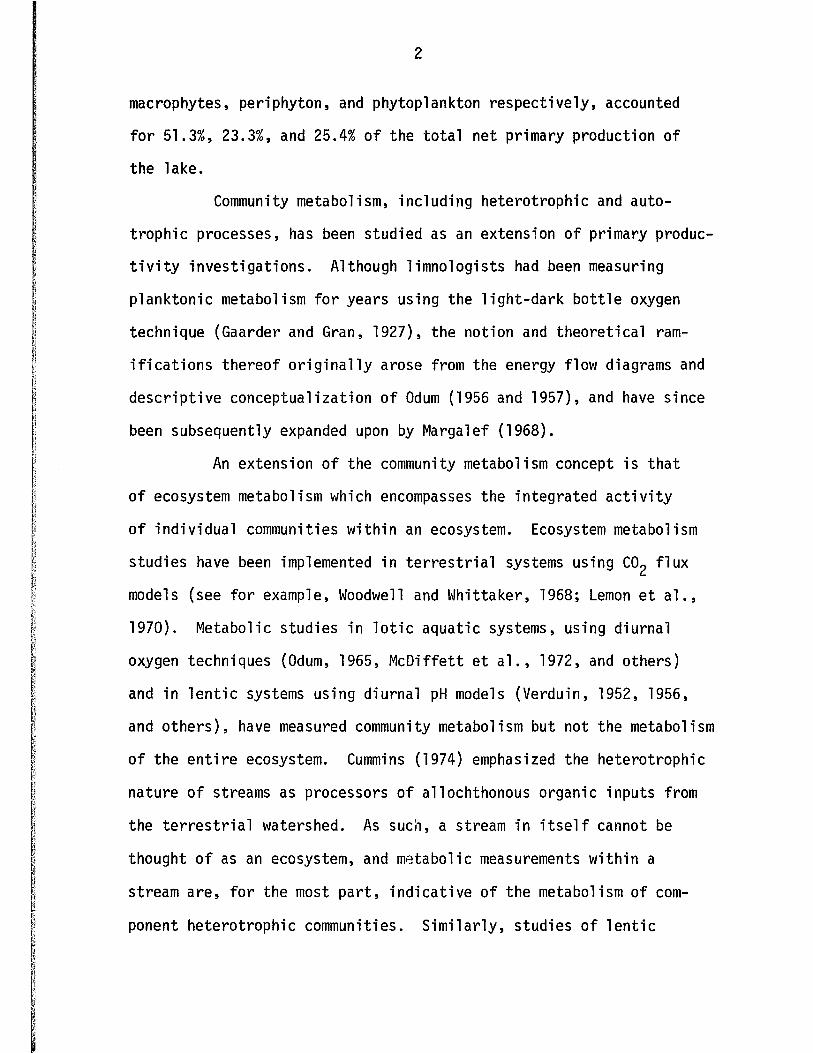
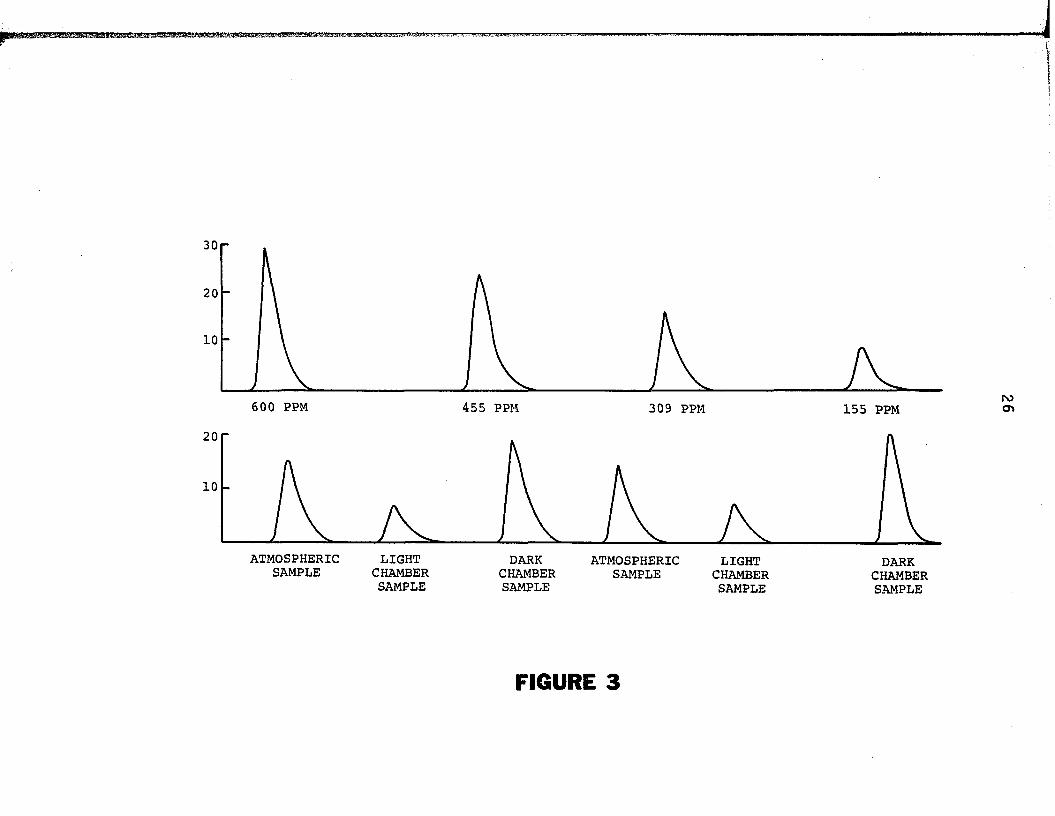
The in fra -re d gas analyzer, coupled to a s t r ip chart
recorder (Honeywell, Model 193), was ca lib ra ted using reference
gases o f 0, 155, 309, 455, and occasionally 600 ppm CO2 (balance
nitrogen). By high am plif ication o f the analysis system, great
s e n s it iv i ty (approximately 4 ppm COg) was a tta in ed . Reference and
sample gases were introduced in to the analyzer in a liquots o f 20 c c . ,
using a gas t ig h t hypodermic syringe. In response to the introduction
of these gases, a series of normal curves were generated (Figure 3 ) ,
the areas o f which were l in e a r ly proportional to the CO2 concentra
tion o f the reference gases administered. Using the recorder curves
associated with the reference gases, the areas beneath them (d e te r
mined by planimetry) were regressed on th e i r respective CO2
25
Figure 3. In fra -red gas analysis determination o f carbon dioxide
f lu x in l ig h t and dark chambers.
30
20
600 PPM 455 PPM 309 PPM 155 PPM rocr>
20
10
ATMOSPHERIC LIGHTSAMPLE CHAMBER
SAMPLEDARK
CHAMBERSAMPLE
ATMOSPHERICSAMPLE
LIGHTCHAMBERSAMPLE
DARKCHAMBERSAMPLE
FIGURE 3
27
concentrations in developing l in e a r prediction equations (y = mx + b ) ,
used to calculate the CO2 concentration ( in ppm) o f the sample gases.
CO2 f lu x w ithin the to ta l volume o f the chambers during
incubation was calculated from em p ir ica lly determined changes in the
COg p a r t ia l pressure o f the gaseous volume (VG). The C02 f lu x w ithin
VG was calculated in mgC using equation 1.
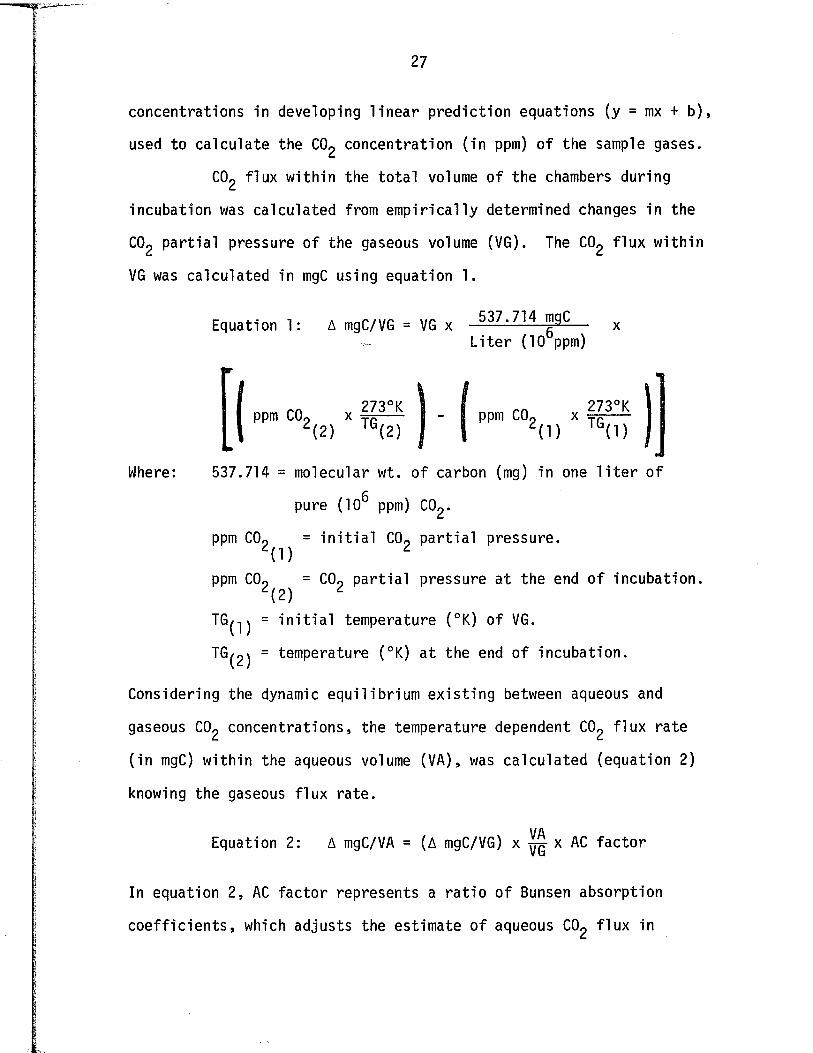
Equation 1: A mgC/VG = VG x .537.v7l l - |9-C— xL i te r (10 ppm)
ppm CO, x 1 *2 ^ - I - I ppm CO, x(2) (2) I 1 2 (1) TG(1)
Where: 537.714 = molecular wt. o f carbon (mg) in one l i t e r o fC
pure (10 ppm) CO2 .
ppm C0o = i n i t i a l C0o p a r t ia l pressure.2( 1) 2
ppm C0o = C0o p a r t ia l pressure a t the end o f incubation.(2 ) 2
TG^ij = i n i t i a l temperature (°K) o f VG.
TG ^) = temperature (°K) a t the end o f incubation.
Considering the dynamic equilibrium ex is ting between aqueous and
gaseous CO2 concentrations, the temperature dependent CO2 f lu x rate
( in mgC) w ithin the aqueous volume (VA), was calculated (equation 2)
knowing the gaseous f lu x ra te .
Equation 2: A mgC/VA = (A mgC/VG) x x AC fac to r
In equation 2 , AC fa c to r represents a r a t io o f Bunsen absorption
c o e ff ic ie n ts , which adjusts the estimate o f aqueous CO2 f lu x in
28
accordance with temperature dependent changes in the degree o f COg
s o lu b i l i ty during incubation. When resp ira tion exceeds photosyn
thesis ( i . e . , dark chamber), AC fa c to r = (AC a t incubation end/AC at
incubation i n i t i a t io n ) . When photosynthesis exceeds resp iration
( i . e . , l ig h t chamber), AC fac to r = (AC a t incubation in it ia t io n /A C
a t incubation end). CC f lu x w ithin the to ta l volume (VT) o f the
chambers was calculated in mgC using equation 3.
Equation 3: A mgC/VT = ( A mgC/VG) + ( A mgC/VA)
A fter th is summation, carbon f lu x was converted from a volumetricp
basis (per 250 L .) to an areal basis (per m ) , using appropriate
conversion facto rs . Carbon f lu x was posit ive with respect to ambient
concentration when resp ira tion exceeded photosynthesis ( i . e . , dark
chamber) and negative with respect to ambient concentration when
photosynthesis exceeded resp ira tion ( i . e . , l ig h t chamber).
Generally , th is method was used to provide a s ta t ic (2
reference points) appraisal o f the m etabolica lly mediated CO f lu x
occurring w ith in the ecosystem under natural conditions. Occasionally,
incubation periods were extended and gas samples removed in te rm it
te n t ly as well as a t the commencement and completion of incubation,
in order to determine CO compensation c h arac te r is t ics o f the eco
system. The calculations o f gross prod uctiv ity and ecosystem
resp iration were e s s e n t ia l ly the same as those commonly employed in
oxygen l ig h t and dark b o tt le determinations o f phytoplankton com
munity metabolism. D i f fe re n t ia l changes in the carbon concentration
within the l ig h t and dark chambers during incubation were treated as
29
net ecosystem productiv ity and ecosystem resp ira tion respective ly .
Gross p roductiv ity was calculated from the carbon d i f fe r e n t ia l
established between the l ig h t and dark chambers during incubation.2
Metabolic data are expressed as means in mgC/m on hourly,
d a i ly , growing season, and annual bases. No re la tionsh ip was found
between so lar energy and photosynthetic assim ila tion (see results
section o f th is t e x t ) , therefore mean hourly rates o f gross photo
synthesis were expanded to d a ily ra tes , m ultip ly ing by the number of
hours between sun-up and sun-set. Annual mean rates o f gross produc
t io n and ecosystem resp ira tion were determined by in teg ra tin g the
area under annual curves with respect to time. Annual mean net
ecosystem productiv ity was calculated as the d ifference between the
in tegrated rates o f gross production and ecosystem resp ira tio n .
Growing season means were s im ila r ly determined.
Laboratory Determination o f Light Response C haracteris tics o f Juncus balticus
Photosynthetic ra te in Juncus b a lt ic u s , the dominant emer
gent, was estimated using a closed Plexiglas gas exchange system with
a volume o f 12 l i t e r s . The CC f lu x w ith in the system was con
tinuously monitored using the same in fra -re d gas analysis and
recording equipment used in analyzing gas samples collected during
in s itu investigations . The analyzer was ca lib ra ted using gases of
309, 155, and 0 ppm C0£ (balance n itrogen).
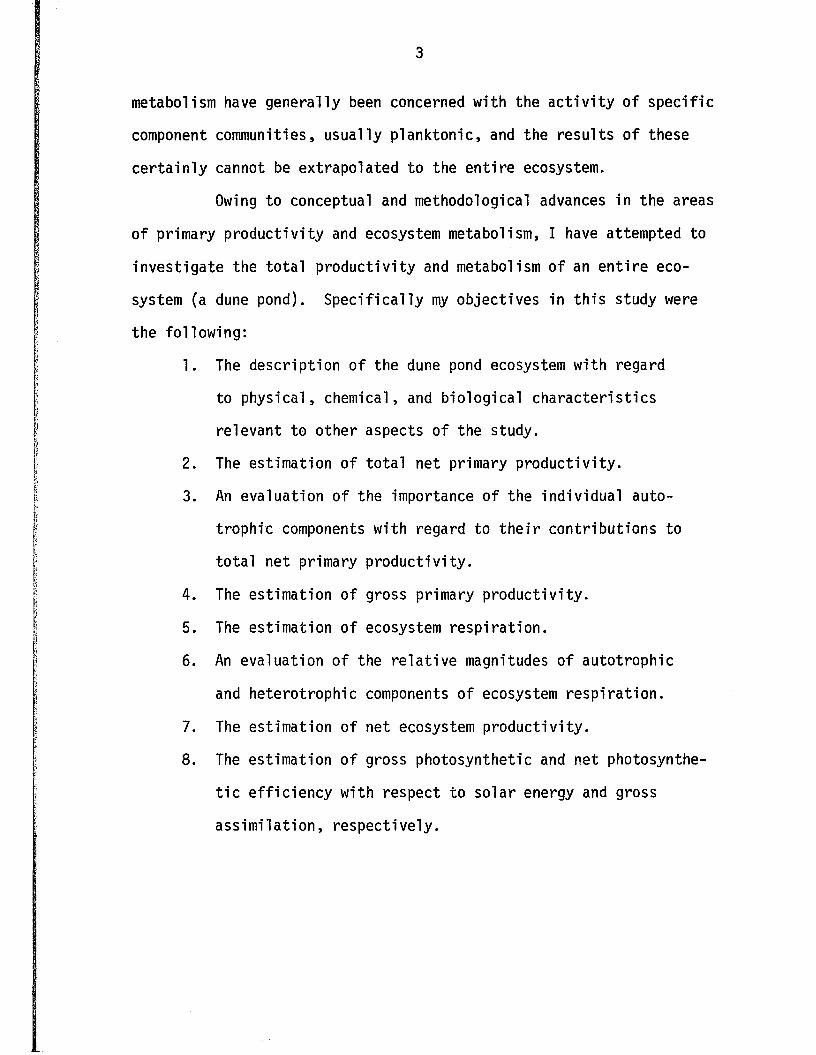
A r t i f i c i a l l ig h t was provided by a bank o f two 500 watt
metal halide f u l l spectrum bulbs and l ig h t in te n s it ie s were measured
with a Weston E le c tr ic Corp. foot candle meter a t distances o f
30
10, 20, 30, and 40 cm. w ith in a 60 cm. high c y lin d r ic a l metabolic
chamber (Figure 4 ) . Changes in il lum in ation were f a c i l i t a t e d using
a varying rheostat connected in series with a Stabline voltage reg
u la to r to the l ig h t bank. The gas exchange system was cooled by
suspending the l ig h t source in a water f i l l e d P lexig las basin through
which cold tap water was c irc u la te d . Temperature (telethermometer
determinations) w ith in the photosynthetic chamber ranged from 22.0°C
a t the lowest l ig h t in ten s ity to 26.0°C a t the highest. Gas flow
through the system was maintained a t the rate o f 20 S.C.F.H. by reg
u la ting the output o f an a i r t ig h t pressure vacuum pump.
Several clones o f Juncus balticus were removed from the
dune pond on the evening before the day of the experimentation.
These were c a re fu l ly excavated in th e ir e n t ire ty (roots and rhizomes
in ta c t ) , placed in pond water f i l l e d buckets and transported to the
laboratory. To avoid curling and breakage o f the apical t ip s in the
metabolic chamber, only the upper 60 cm. o f the stems were used in
these experiments. The excision o f the upper 60 cm. portion o f the
stems and th e ir placement in to a f las k o f d i s t i l l e d water, was done
immediately preceeding analysis . In control experiments, McNaughton
(1973) has shown tha t stem preparation as ju s t described has minimal
e f fe c t on both photosynthesis and tran s p ira t io n . Analyses a t nine
d if fe r e n t l ig h t in te n s it ie s were performed once on 30 a r b i t r a r i l y
c la s s if ie d older stems and once on 40 a r b i t r a r i l y c la s s if ie d younger
stems. Wet weights of p lant m aterial were e s s e n t ia l ly equal with
respect to age categories analyzed.
31
Figure 4. Metabolic chamber used in laboratory determinations o f
net photosynthesis in Juncus ba lt icu s .
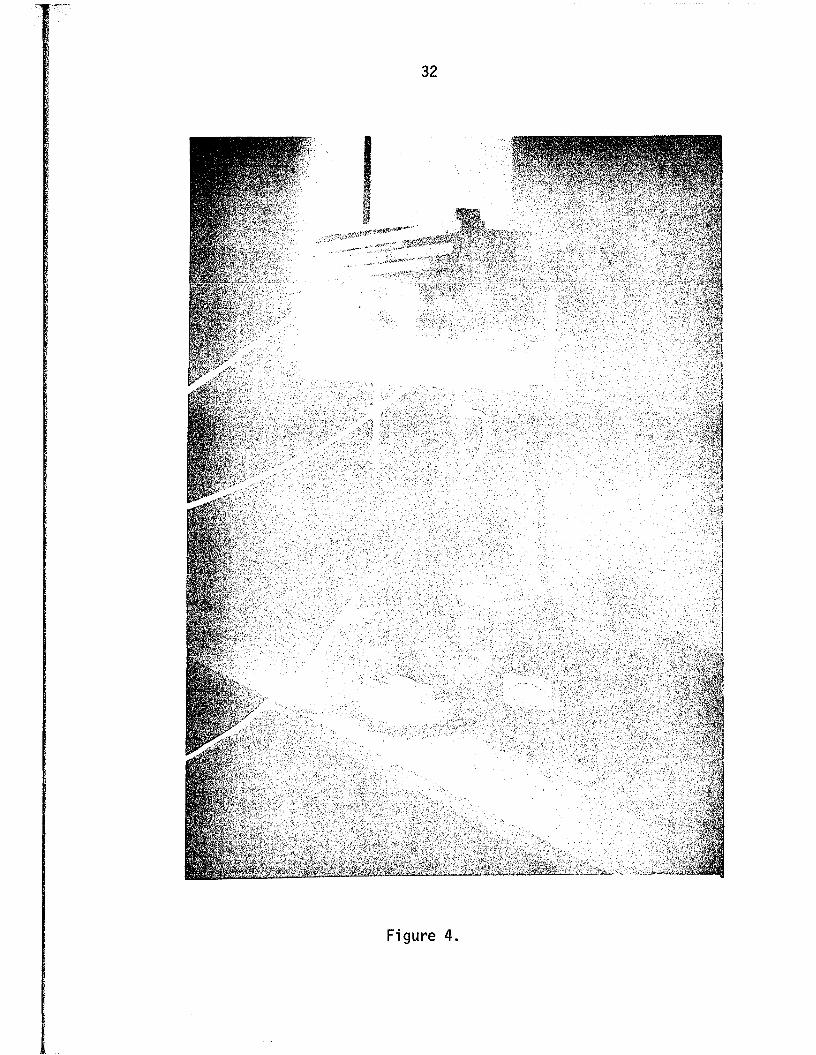
Figure 4.
33
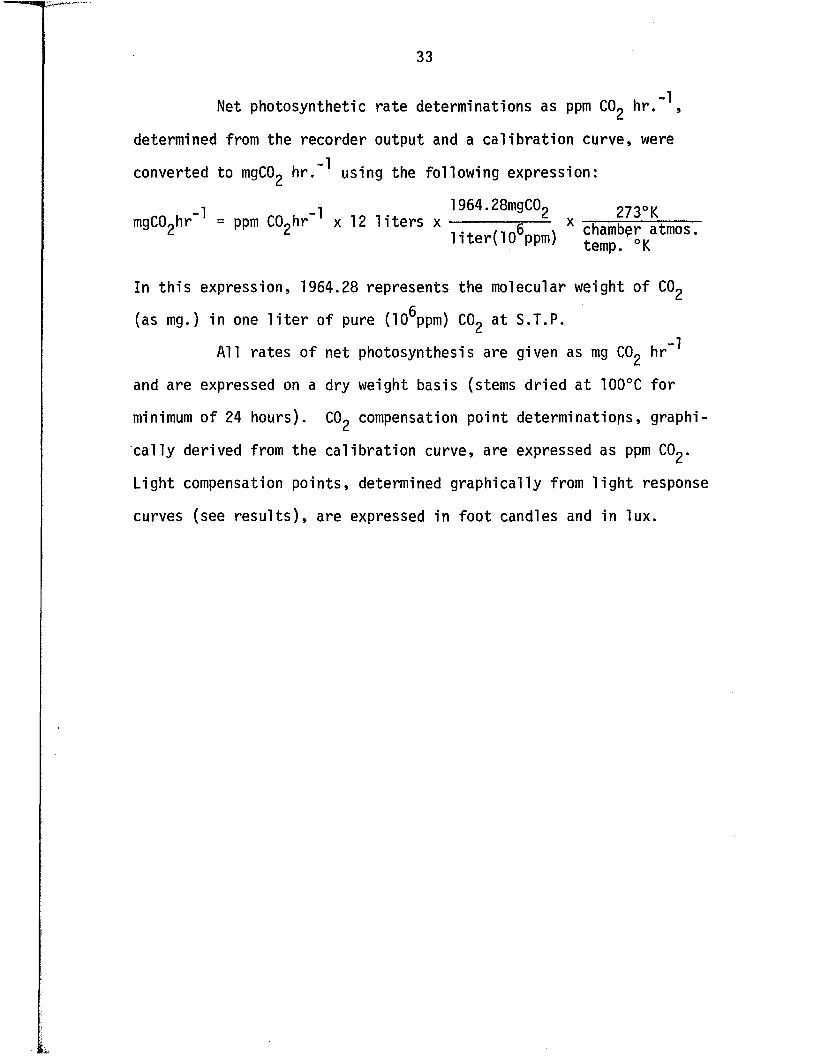
Net photosynthetic ra te determinations as ppm C02 h r . ~ \
determined from the recorder output and a c a lib ra t io n curve, were
converted to mgCO h r .” using the following expression:
, 1964.28mgC0? 273° KmgC02hr- - ppm CO^r" x 12 l i t e r s x - fe— x chambgr at mos.
l i t e r ( 1 0 ppm) temp/ o K
In th is expression, 1964.28 represents the molecular weight o f C02
(as mg.) in one l i t e r o f pure (10 ppm) C02 a t S.T.P.
A ll rates o f net photosynthesis are given as mg C02 hr”"*
and are expressed on a dry weight basis (stems dried a t 100°C fo r
minimum o f 24 hours). C02 compensation point determinations, graphi
c a l ly derived from the c a lib ra t io n curve, are expressed as ppm C02<
Light compensation points, determined graphically from l ig h t response
curves (see re s u lts ) , are expressed in foot candles and in lux.
RESULTS
Description o f the Study Pond
During the study, so lar f lu x a t normal incidence (Table 2)
was approximately 50% o f the po ten tia l so lar input (Kondratyev, 1969)
a t th is la t i tu d e . Light measurements w ith in the water column were
not taken, and the extent o f q u a l i ta t iv e and q u an tita t iv e attenua
tion o f l ig h t therein is not known. Judging from i t s stained
appearance, the pond water is probably bog-like with respect to i t s
l ig h t extinction ch arac te r is tics (See The Fate o f Solar Radiation,
in: Ruttner, 1952). Observed annual and diurnal varia tions in
measured physical and chemical parameters are shown in Tables 3 and 4.
These data as well as subsequently described b io logical features per
ta in to the study pond (h e rea fte r re ferred to as "the pond"), and
can probably be extrapolated to some o f the nearby ponds, many of
which d i f f e r only s l ig h t ly in morphometry, age, etc .
The annual mean depth o f the pond during the period of
A pril 1973 through March 1974 was 41 cm. During the summer o f 1974,
the mean depth was 11% less than tha t o f the summer, 1973. Depth
maxima and minima occurred during the summer and w inter months
respective ly , and d i re c t ly co rre la te with fluctuations in the Lake
Michigan water level (USC0MM-N0AA-DC Lake Survey, 1974).
With few exceptions, the pond was not thermally s t r a t i f i e d .
Occasionally during windless mornings, p a r t ic u la r ly on very hot
34
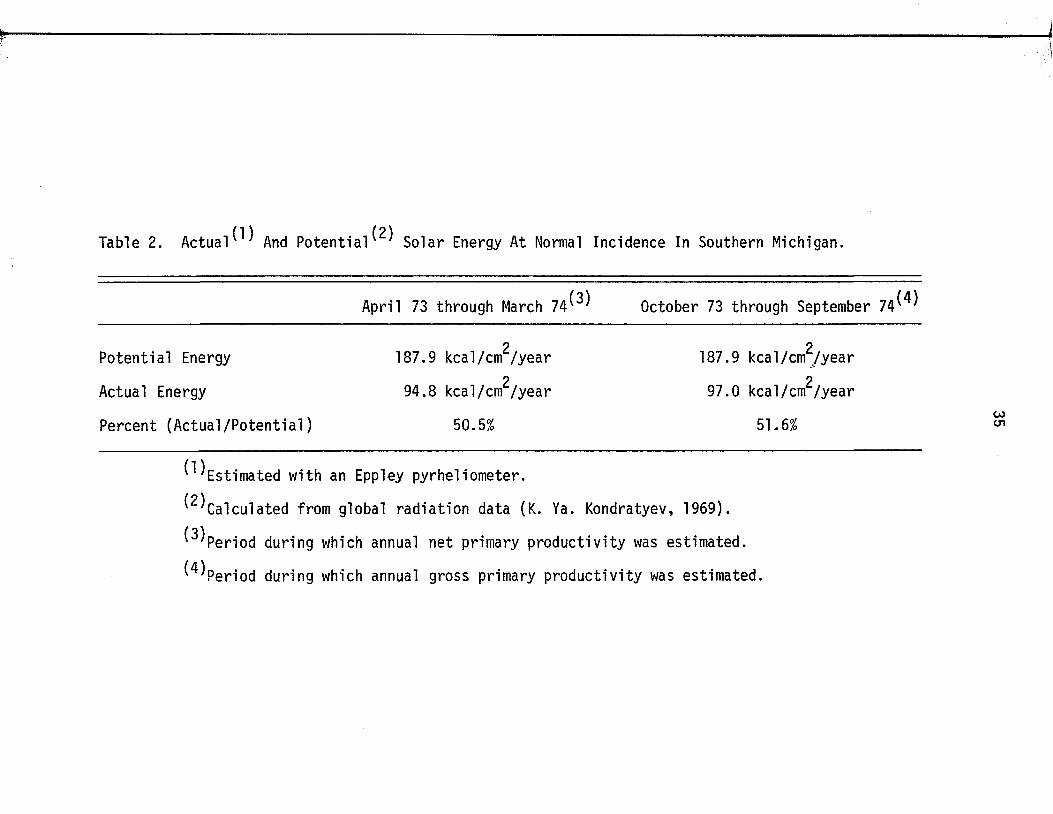
Table 2. A c t u a l ^ And P o t e n t i a l ^ Solar Energy At Normal Incidence In Southern Michigan.
April 73 through March 7 4 ^ (4)October 73 through September 74' '
Potential Energy 187.9 kcal/cm^/year 187.9 kcal/cm^/year
Actual Energy 94.8 kcal/cm^/year2
97.0 kcal/cm /year
Percent (A c tu a l/P o te n tia l) 50.5% 51.6%
^^Estimated with an Eppley pyrheliometer.
^ C a lc u la te d from global radiation data (K. Ya. Kondratyev, 1969).
(3)' 'Period during which annual net primary productivity was estimated.
^ P e r io d during which annual gross primary productiv ity was estimated.
Table 3. Seasonal V a r i a t i o n ^ In Depth, Water Temperature, pH, and A lk a l in i ty .
Date Mean D epth^)(cm .) Water Temp.(°C) pH A lk a l in i ty (meq/1.)
14 April 73 38.0 13.0 6.85 0.835 May 73 46.0 14.5 7.00 0.87
25 May 73 50.0 19.0 7.20 0.9714 June 73 47.5 23.0 7.10 1.32
3 July 73 51.5 25.0 7.50 1.4520 July 73 43.0 26.0 7.30 1.81
7 August 73 45.0 26.0 7.50 2.1221 August 73 55.0 24.0 7.55 1.7211 September 73 42.0 22.0 7.55 1.9429 September 73 43.5 19.0 7.60 1.8020 October 73 43.5 13.0 7.55 1.5410 November 73 39.0 (0 .5 ) 2.0 7.50 1.50
6 December 73 45.0 (2 .0 ) 1.0 7.50 1.023 January 74 38.0 (16.0) 0.5 7.00 1.18
24 January 74 44.0 (10 .0) 0.5 6.55 0.3314 February 74 33.0 (10.0) 0.5 6.55 0.86
7 March 74 35.0 12.0 7.30 0.5631 March 74 39.0 5.0 7.40 0.5220 April 74 39.0 12.5 7.50 0.7011 May 74 38.0 13.5 7.50 0.8630 May 74 45.0 20.0 7.10 0.9813 June 74 46.0 19.0 7.55 1.0230 June 74 46.0 24.0 7.65 1.4322 July 74 39.5 21.5 7.05 1.9912 August 74 43.5 25.0 7.60 1.82
5 September 74 34.0 19.0 7.70 2.1010 October 74 35.0 15.0 7.50 1.60
^ D eterm in a tio n s made a t approximately noon during each sampling day.
^Numbers in parentheses represent ice thickness during winter months.
37
Table 4. Diurnal V a r i a t i o n ^ In A ir Temperature, Water Temperature, and pH.
Time A ir Temperature(°C) Water Temperature(°C) pH
08:00 12.0 17.5 7.4010:00 19.0 7.5012:00 24.0 20.0 7.5014:00 22.5 7.6016:00 28.0 24.5 7.6518:00 25.0 7.9020:00 12.0 24.0 7.5522:00 22.0 7.50
^ D a t a from 12 September 73, a c le a r day exemplifying observed ranges o f diurnal temperature and pH f lu x .
summer days, the upper water stratum would warm more quickly than the
lower, creating a 2° to 3°C temperature gradient. Such gradients were
quickly dissipated by a s l ig h t breeze, and normally were no longer
detectable by 10:00. Diurnal water temperature f lu c tu a t io n s , non
e x is tan t during the w in te r, and most notable during the spring and
f a l l , were generally on the order o f 5° to 10°C. Maximum observed
ice thickness (16 .0 cm.) was observed in January during a period of
nearly continual ice cover (November 1973 through February 1974).
Temporary thawing occurred a t leas t twice during the w inter p r io r to
the spring thaw in mid March.
During the annual period o f A pril 1973 through March 1974,
the mean a lk a l in i t y o f the pond water was 1.24 meq/1. Mean a lka
l i ni t ie s during the summer o f 1973 and 1974 were comparable, being
1.48 and 1.39 meq/1. resp ective ly . Annually, the a lk a l in i t y changed
s ig n if ic a n t ly , ranging between w inter minima and summer maxima,
38
observed maximal and minimal a lk a l in i t ie s being 2.12 and 0.33 meq.l.
respectively . Varia tion in a lk a l in i t y appeared to be associated with
changes in the level o f the ground water ta b le , caused by f lu c tu a
tions in the level o f Lake Michigan.
To determine the inorganic carbon binding capacity of the
pond water r e la t iv e to tha t o f d i s t i l l e d water, a laboratory check
was made by subjecting water samples o f increasing a lk a l in i t y
(eq u ilib ra ted with the atmosphere a t a constant temperature) to a
nitrogen purge, measuring the amount o f CO2 evolved with an in f r a
red gas analysis system. Pond water samples o f a lk a l in i t ie s up to
approximately 1.60 meq/1. were not s ig n if ic a n t ly (a = .05) d i f fe re n t
from d is t i l l e d water in terms o f th e ir inorganic carbon binding
capacity.
Maxima and minima o f pH followed an annual pattern iden tica l
to tha t described fo r water depth and a lk a l in i t y . Observed midday
pH values ranged from a w inter minimum o f 6.50 to a summer maximum
o f 7.70. Diurnal f luctuations in pH generally on the order o f 0.2
to 0.5 units during the summer, were not observed during the w inter.
Both annual and diurnal varia tions in pH appeared to be strongly
re la ted to water temperature change.
Observed atmospheric COg p a r t ia l pressure during daylight
hours ranged from a minimal summer value o f 285 ppm to a w inter maxi
mum of 383 ppm. Atmospheric COg concentrations were consistantly
higher during the night than during the day. The annual mean, e s t i
mated from measurements during the day, was 336 ppm. Dissolved ( $ 2
approximations (ca lculated from to ta l a lk a l in i t y , pH, and temperature
39
data; see Ruttner, 1959) indicated annual supersaturation o f the pond
water with CO on the order o f 5 to 15 times atmospheric C0£ con
centrations , suggesting higher rates o f resp iration r e la t iv e to
photosynthesis w ith in the water o f the pond.
The bio logical structure o f the pond can be outlined as
follows:
A. Autotrophic community
1. Macrophytes
a. Emergent
b. Submerged
2. Epipelic periphyton
3. Phytoplankton
B. Heterotrophic community
1. Invertebrates
a. Benthic
b. Planktonic
2. Semiaquatic vertebrates
The emergent macrophyte f lo r a , homogeneously d is tr ib u ted
throughout the pond, was represented by Juncus balticus and Cladium
mariscoides, c o l le c t iv e ly comprising 100% of the emergent vegetation
sampled during the study. Potential contributions by Carex sp. and
Eleocharis s p ., intermixed with t e r r e s t r ia l representatives along the
shore-water in te r fa c e , were excluded by the sampling design as pre
viously discussed. Juncus balticus and Cladium mariscoides, exceed
ing ly d i f f i c u l t to d istinguish from one another v e g e ta t ive ly , are
separable by f lo r a l and subtle rhizomal differences (Fassett, 1957).
40
Prim arily on the basis o f rhizomal d iffe rences, since so few o f these
plants ever formed inflorescences during the study, I estimate that
greater than 90% of the emergent p lant biomass war J_. b a lt ic u s .
Dominance by th is species in s im ila r Lake Michigan dune ponds has
been c ited by Cowles (1899) and Shelford (1911).
The tendency of emergent plants to form pure closed com
munities in h ib it in g colonization by potentia l competitors has been
discussed by Sculthorpe (1967). In th is regard, plants which v ig
orously spread by means o f rhizomes, such as J. b a lt ic u s , may read ily
re a l iz e a dominant ro le where conditions favor th e ir existence.
The submerged macrophyte f lo ra was d im in u it ive ly represented
by 111tricularia s p . , Chara s p . , Fontina lis s p . , and Potomaqeton sp.
R e if fe r and Kleinsmith (1973), conducting a descrip tive survey o f the
pond as a class p ro jec t, estimated the contribution o f these plants
to the to ta l standing crop a t less than 0.5%. Rarely measureable in
those few samples in which they occurred, these plants contributed
very l i t t l e to the biomass in th is study, and were treated with the
emergent f lo ra as previously discussed.
Dominant algal genera appeared to be represented in both
pelagic and benthic regions o f the pond. The algal community,
strongly dominated by Desmidacean representatives, including Cosmarium
s p . , Staurastrum s p . , M icrasterias s p . , and Desmidium s p . , was subject
to la te summer invasion by Cyanophycean representatives, including
Anabaena sp. and O s c il la to r ia sp. Bacillariophycean genera, in f ra -
abundant throughout the season, assumed a very minor importance in
terms o f algal biomass and, I suspect, p ro d u c tiv ity . The
41
bacterio -a lga l periphyton association, e p ip e lic in nature fo r reasons
previously discussed, was s tru c tu ra l ly dependent upon the copius
mucilage secretion of Cosmarium s p ., the dominant alga w ith in the
pond.
Grazing and d e t r i t a l food processing pathways were com
p le te ly dominated by invertebrate organisms, as is commonly the
case. Observations on these invertebrate communities o f the pond
indicated high d iv e rs ity in stark contrast to the f lo r a l uniform ity .
Holotrich c i t i a t e s , the dominant protozoan representa
t iv e s , were complemented by the less abundant p e r i t r ic h s , both o f
which were p r in c ip a l ly associated with the r ich organic benthic
substrate. Mastigophoran and sarodinian protozoans were found rather
in frequently . R o tife rs , equally abundant both upon the pond bottom
and within the plankton, dominated the zooplankton community.
Oligochaete annelids occurred abundantly in the sediments, yet
hirudinean representatives were t o t a l l y absent from the pond, perhaps
re f le c t in g the paucic ity o f po tentia l vertebrate hosts. The phylum
Arthropoda was meagerly represented by p lan kto n ica lly occurring
cladocerans and copepods, y e t was abundantly represented by various
taxa o f aquatic and semi aquatic insects , including: Odonata,
Coleoptera, D iptera, Hemiptera.
The most frequently encountered vertebrates were frogs,
several species o f which inhabited the shoreline region. During the
spring o f 1974, a few previously unencountered mud tu r t le s established
residence in the pond. Occasionally, p a r t ic u la r ly on stormy days,
migrating ducks moved in from Lake Michigan, seeking temporary refuge
42
in the dune ponds and in the nearby Kalamazoo r iv e r marsh. Located
on the eastern shoreline , a s ingle lodge, housed a t leas t one muscrat
p a ir whose a c t iv i t ie s were la rg e ly re s tr ic te d to an adjacent much
shallower swale where they browsed on the younger shoots o f Carex
and Eleocharis. There were no f is h in the pond, and I found no
evidence ind icating that any had ever been present. Possible reasons
fo r th is have already been discussed.
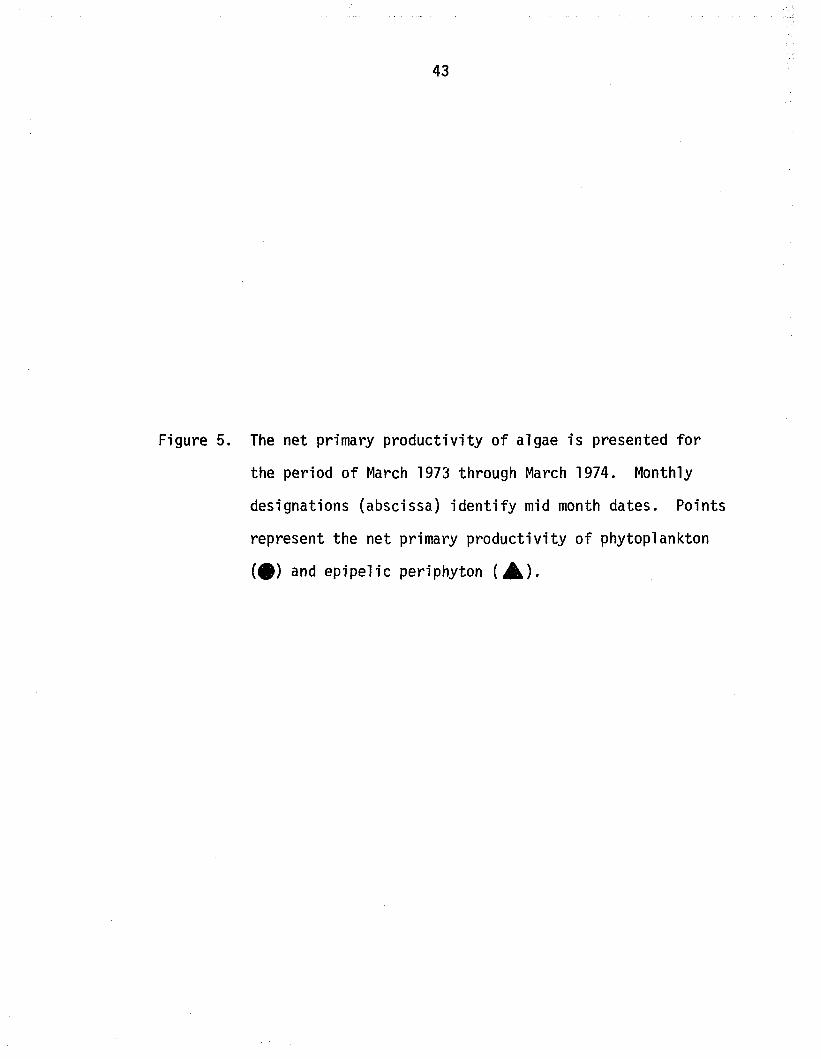
Algal Net Primary Productiv ity
Seasonal patterns o f net primary productiv ity o f phyto
plankton and e p ip e l ic periphyton are presented in Figure 5. Annual
mean d a ily rates o f net production o f phytoplankton and periphyton
2 2 were 46.6 mgC/m /day and 88.7 mgC/m /day respective ly . The produc-2
t i v i t y o f the phytoplankton ranged from 1.6 mgC/m /day in mid w inter 2
to 239.3 mgC/m /day in early summer and tha t o f the periphyton from2 2 4.3 mgC/m /day in mid w inter to 262.4 mgC/m /day in la te summer.
Although the ranges o f p roductiv ity values o f the periphyton and
phytoplankton were s im ila r , the duration o f peak periphyton produc
t i v i t y was considerably greater than tha t o f the phytoplankton,
which on an annual basis, was only 52.5% as productive as the p e r i
phyton .
Differences in rates o f carbon assim ila tion by the phyto
plankton, in s ig n if ic a n t between bo ttles incubated a t the same depth,
were s ig n if ic a n t (a = .05) between bottles incubated a t d i f fe r e n t
depths. During the period o f May through October, assim ilation
w ithin the upper water stratum averaged 48% greater than tha t w ith in
43
Figure 5. The net primary productiv ity o f algae is presented fo r
the period o f March 1973 through March 1974. Monthly
designations (abscissa) id e n t i fy mid month dates. Points
represent the net primary p roductiv ity o f phytoplankton
( 0 ) and ep ip e lic periphyton ( A ) .
Algal Net Pr im a r y Pr o d u c t iv it y
a — Ep i p e l i c Pe r ip h y t o n
• = Phytoplankton
i 1------1" i------1— i---- s— rO N D J F M A M
FIGURE 5
45
the lower. Conversely, the opposite e f fe c t occurred without
exception during the period o f October through May, when assim ila
tion by phytoplankton w ith in the lower water stratum was 74% greater
than tha t w ithin the upper. Variations in rates of carbon assim ila
tion between re p lic a te periphyton samples demonstrated no pattern .
On an annual basis, the c o e ff ic ie n t o f v a r ia b i l i t y (S .D ./x as a
percentage) averaged 27.2% ranging from 11.5% to 64.9%.
Annual patterns o f benthic and planktonic dark f ix a t io n
mimiced patterns o f l ig h t f ix a t io n by the periphyton and phytoplankton.
Chemosynthetic rates o f dark f ix a t io n (Table 5 ) , in terpreted as sec
ondary productiv ity (see Sorokin, 1965) represented 4.2% and 13.1%
of the annual mean l ig h t f ix a t io n w ith in the planktonic and benthic
communities respective ly .
Table 5. Chemosynthetic Rates o f Dark F ixation .
Annual Mean % ofmgC/m2/day Carbon F ixation in Light
Benthic 11.6 13.1
Pelagic 2 .0 4.2
Biomass and Net Primary Productiv ity o f the Macrophytes
D istributions o f above and below ground biomass and l i t t e r
are given in Figure 6. The below ground vegetation annually repre
sented between 90.4% and 96.6% o f the to ta l macrophyte biomass
46
Figure 6. D istributions o f macrophyte biomass and l i t t e r are
presented fo r the period o f A pril 1973 through October
1974. Monthly designations (abscissa) id e n t ify mid
month dates. V ertica l bars represent one standard
e rro r o f the mean values.
i
Dry
W
eig
ht
(g
m/m
^
1400
1300MACROPHYTE BIOMASS AND LITTER
1200BELOW GROUND
11001000 -
900
300
700
600
500LITTER
320
160ABOVE GROUND L IV IN G
80
FIGURE 6
48
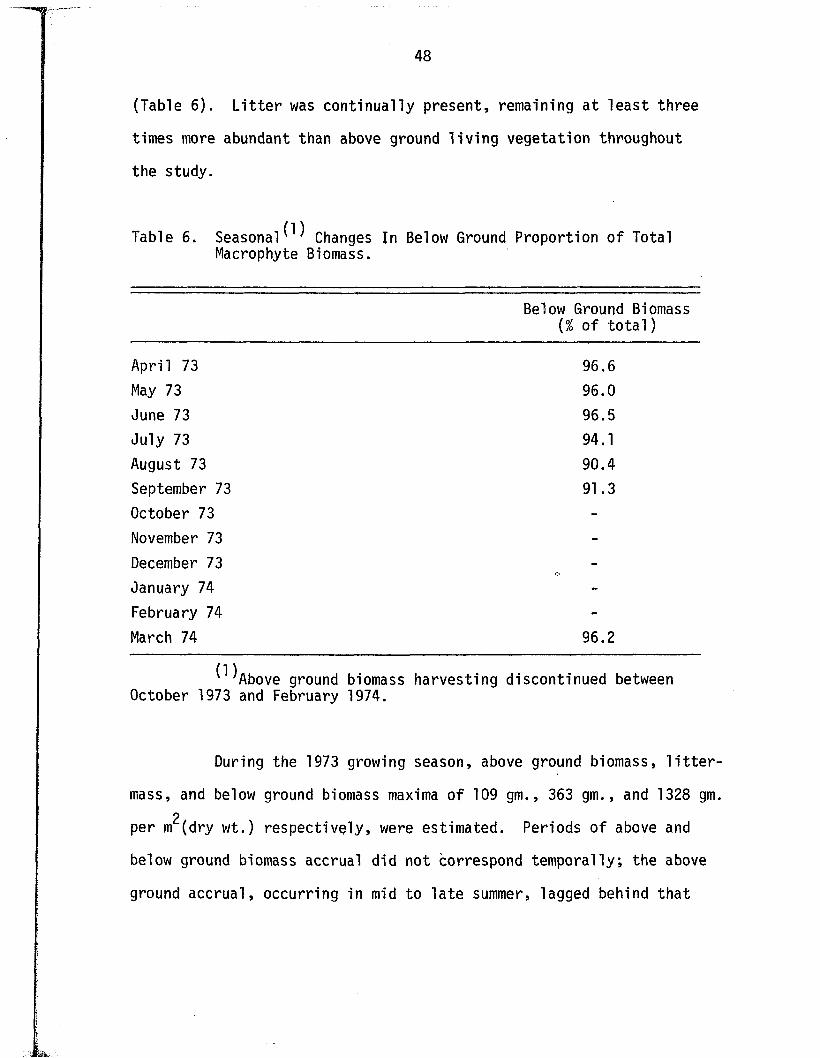
(Table 6 ) . L i t t e r was continually present, remaining a t lea s t three
times more abundant than above ground l iv in g vegetation throughout
the study.
Table 6. S e a s o n a l^ Changes In Below Ground Proportion o f Total Macrophyte Biomass.
Below Ground Biomass (% of t o t a l )
April 73 96.6May 73 96.0
June 73 96.5
July 73 94.1
August 73 90.4
September 73 91.3
October 73 -
November 73 -
December 73 -
January 74 -
February 74 -
March 74 96.2
^ A b o v e ground biomass harvesting discontinued between October 1973 and February 1974.
During the 1973 growing season, above ground biomass, l i t t e r -
mass, and below ground biomass maxima of 109 gm., 363 gm., and 1328 gm. 2
per m (dry w t . ) respective ly , were estimated. Periods o f above and
below ground biomass accrual did not correspond tem porally , the above
ground accrual, occurring in mid to la te summer, lagged behind tha t
49
of the below ground which occurred in la te spring to e arly summer.
L i t t e r mass increased s l ig h t ly during mid summer.
Pre-growing season measurements o f above ground biomass,
as well as l i t t e r , were not s t a t i s t ic a l ly (a = .05) d i f fe re n t in2
1973 and 1974. April measurements, expressed as dry wt./m , showed
40 gm. in 1973 and 38 gm. in 1974 present as above ground biomass,
and 263 gm. and 268 gm. present as l i t t e r mass during the same
periods. Below ground biomass baselines d if fe re d s ig n if ic a n t ly
however between 1973 and 1974, decreasing 35% from a mean value
(May data, 1973) o f 1139 gm. dry wt./m^ to a mean value o f 742 gm.2
dry wt./m calculated during the same period in 1974.
Coeffic ients o f v a r ia b i l i t y (S .D ./x as a percentage) were
calculated fo r biomass and l i t t e r determinations. Annually, C.V.
values per sampling period averaged 18.9% fo r below ground biomass,
ranging from 7.3% to 31.1%; 19.9% fo r above ground biomass, ranging
from 5.2% to 38.6%; 20.5% fo r l i t t e r , ranging from 12.4% to 35.3%.
D istributions o f C.V. values showed no patte rn , inasmuch as the
magnitudes of the values appeared to be seasonally independent.
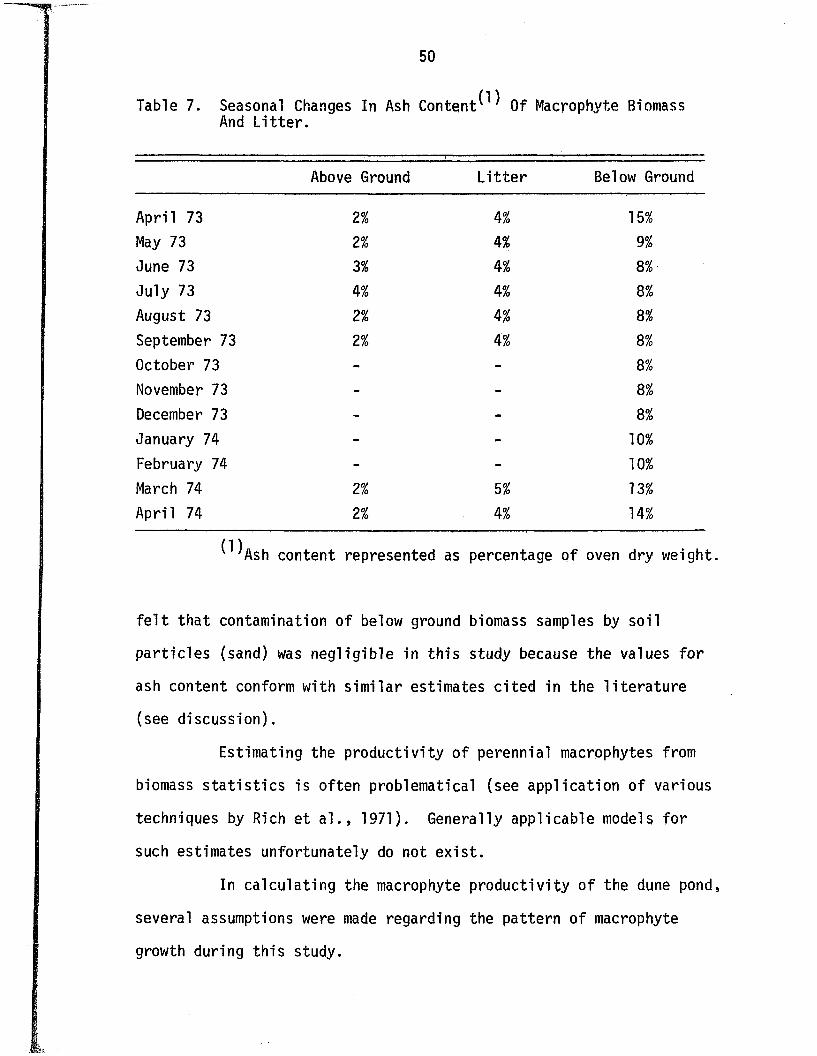
Seasonal changes in the ash content of above and below
ground biomass and l i t t e r are given in Table 7. The ash contents
of the above ground biomass and l i t t e r remained r e la t iv e ly constant
a t 2% and 4% respective ly . The ash content o f the below ground bio
mass exhibited a seasonal pattern o f change, ranging from 8% during
the summer and f a l l months to as high as 15% during the spring.
As pointed out by Westlake (1966), combustion o f plant
biomass provides a check on the adequacy o f root washing. I t is
50
Table 7. Seasonal Changes In Ash C o n te n t^ Of Macrophyte Biomass And L i t te r .
Above Ground................. . ' ' " " " « ■■
L i t t e r Below Ground
April 73 2% 4 % 15%
May 73 2% 4% 9%
June 73 3% 4% 8%
July 73 4% 4% 8%
August 73 2% 4% 8%
September 73 2% M o 8%
October 73 - - 8%
November 73 - - 8%
December 73 - - 8%
January 74 - - 10%
February 74 - - 10%
March 74 2% 5% 13%
April 74 2% M o 14%
^ A s h content represented as percentage o f oven dry weight.
f e l t tha t contamination o f below ground biomass samples by soil
p a rt ic le s (sand) was n eg lig ib le in th is study because the values fo r
ash content conform with s im ila r estimates c ite d in the l i t e r a tu r e
(see discussion).
Estimating the productiv ity o f perennial macrophytes from
biomass s ta t is t ic s is often problematical (see application o f various
techniques by Rich e t a l . , 1971). Generally applicable models fo r
such estimates unfortunately do not e x is t .
In ca lcu la ting the macrophyte productiv ity o f the dune pond,
several assumptions were made regarding the pattern o f macrophyte
growth during th is study.
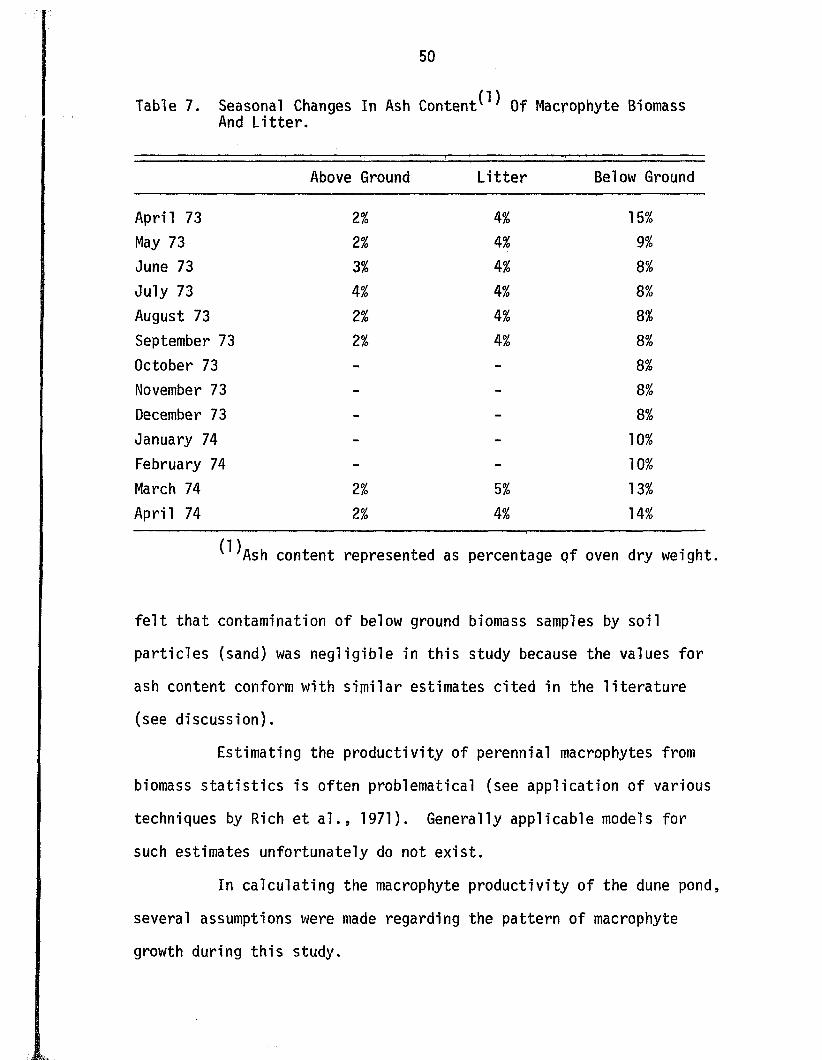
50
Table 7. Seasonal Changes In Ash C o n te n t^ Of Macrophyte Biomass And L i t t e r .
Above Ground L i t t e r Below Ground
A pril 73 2% 4% 15%
May 73 2% 4% 9%
June 73 3% 4% 8%
July 73 4% 4% 8%
August 73 2% 4# 8%
September 73 2% 4% 8%
October 73 - - 8%
November 73 - - 8%
December 73 - - 8%
January 74 - - 10%
February 74 - - 10%
March 74 2% 5% 13%
A pril 74 2% 4% 14%
^ A s h content represented as percentage o f oven dry weight.
f e l t th a t contamination o f below ground biomass samples by soil
p a rt ic le s (sand) was n e g lig ib le in th is study because the values fo r
ash content conform with s im ila r estimates c ited in the l i t e r a tu r e
(see discussion).
Estimating the productiv ity o f perennial macrophytes from
biomass s ta t is t ic s is often problematical (see application o f various
techniques by Rich e t a l . , 1971). Generally applicable models fo r
such estimates unfortunately do not e x is t .
In ca lcu la tin g the macrophyte p rod uctiv ity o f the dune pond,
several assumptions were made regarding the pattern o f macrophyte
growth during th is study.
51
1. Net photosynthetic accrual, as evidenced by the rapid and
s ig n if ic a n t increase in below ground biomass, occurs
almost exclusive ly during the early summer. This was
substantiated by in s itu and laboratory measurements o f
photosynthesis (discussed in a la t e r section o f th is
t e s t ) .
2. Losses due to grazing, damage, and m o rta l ity during th is
b r ie f period o f e a r ly summer production are n e g lig ib le .
3. The mid to la te summer increase in above ground biomass
is not an additional accumulation o f net primary produc
t io n . This accumulation, representing previously
assimilated photosynthate, re f le c ts the translocation o f
m aterials from storage organs which provide a highly
la b i le pool fo r growth and stem replacement following
damage and m o rta l ity . Furthermore, th is pool is used as
a supplementary substrate fo r the increased resp iratory
demands associated with senescence. This assumption is
supported by the mid to la te summer pattern of below ground
biomass depletion which temporally corresponds with
increased above ground biomass production and l i t t e r
accumulation. Furthermore, th is period o f depletion can
be associated with increased resp ira to ry a c t iv i t y by the
macrophytes (discussed in a la te r section ).
To check the general pattern o f below ground biomass change
observed in 1973, biomass determinations were continued through the
1974 growing season. Aside from the fa c t th a t the mid summer
52
depletion o f stored reserves from submerged organs was less pronounced
in 1974, the overall pattern repeated i t s e l f . Macrophyte net pro
d u c t iv i ty was calculated on the basis o f below ground biomass change,
incorporating factors fo r organic content (ash wt. determinations)
and organic carbon content (0.465 recommended by Westlake, 1965).
Productiv ity in 1974 was comparable to tha t in 1973, being 239.32 2 mgC/m /day and 212.1 mgC/m /day respectively .
Total Net Primary Productivity of the Dune Pond
The net primary productiv ity (NPP) o f the three autotrophic
components w ith in the pond are compared in Table 8. To be temporally
consistant with a lgal p roductiv ity estimates, macrophyte productiv ity
(as l is te d in Table 8) is based on data collected during the 1973
growing season. The to ta l annual mean d a i ly NPP of the pond was2
347.4 mgC/m /day and production by the macrophytes accounted fo r
61.1% of th a t t o t a l . Of secondary importance were the algal com
ponents, periphyton accounting fo r 25.5% and phytoplankton fo r 13.4%
o f the t o t a l . 93.1% o f to ta l annual net production occurred during
the "growing season," a period o f approximately 160 days between
mid May and mid October. The "growing season," as referred to in
th is study, corresponds with the period of net ecosystem production
(subsequently discussed). Acknowledging the continued net production
o f algae during the "dormant season," the designation of these two
seasons does not imply the contrary. Growing season mean d a ily
rates o f net primary production fo r a l l autotrophic components were
approximately twice annual mean d a i ly rates.
Table 8. Net Primary Productivity (NPP): Comparison of autotrophic communities in terms o f th e irindividual contributions to the to ta l net primary productiv ity (TNPP) o f the dune pond.
Annual Mean
Daily R a t e ^ 2
mgC/m /day % TNPP
Growing Season Mean
Daily R a t e ^2
mgC/m /day % TNPP
Growing Season Prod.
x 100
Annual Production
Macrophytes 212.4 61.1 483.9 65.6 100.0
Epipelic Peri phyton 88.7 25.5 161.5 21.9 79.8
Phytoplankton 46.6 13.4 92.3 12.5 86.9
TNPP 347.4 100.0 737.7 100.0 93.0
^ 3 6 5 day period (April 1973 through March 1974).
^ 1 6 0 day period (May 1973 through October 1973).
54
Ecosystem Metabolism
Patterns o f gross photosynthesis and ecosystem resp iration
are presented in Figure 7 fo r the 15 month period of 6 July 1973
through 10 October 1974. Annual mean d a ily rates o f gross photo-2
synthesis, and ecosystem re s p ira t io n , 546.7 mgC/m /day and 377.3 2
mgC/m /day resp ective ly , were calculated fo r the 365 day period of
mid October 1973 through mid October 1974. The annual mean d a ily
rate of net ecosystem production during the same period, calculated
as the integrated d ifference between rates o f gross photosynthesis2
and ecosystem re s p ira t io n , was 169.4 mgC/m /day. Annual net eco-O
system production (61 .8 gmC/m ) was 22.7% less than the growing2
season accrual o f 80.0 gmC/m .
During the study, the pond underwent seasonal transforma
tions between autotrophic (P/R > 1 .0 ) and heterotrophic (P/R < 1 .0 )
metabolic modes, periods o f autotrophy and heterotrophy being quite
d is t in c t . Autotrophic processes dominated between mid May and mid
October, the growing season, and heterotrophic processes between mid
October and mid May, the dormant season. The mid October conversion
from autotrophy to heterotrophy occurred w ith in approximately one
week of the same conversion in 1973. Since no gas exchange determina
tions were made during the spring and early summer o f 1973, I can
only speculate on the temporal re p e a ta b i l i ty o f the a lte rn a te con
version (heterotrophy to autotrophy) which occurred in mid May 1974.
Judging from previously discussed patterns o f net photosynthesis
however, i t is l i k e ly tha t th is conversion s im ila r ly occurred some
time during May o f 1973.
55
Figure 7. Ecosystem metabolism is presented fo r the period o f July
1973 through October 1974. Monthly designations
(abscissa) id e n t ify mid month dates. Points represent
rates o f gross photosynthesis ( 0 ) and ecosystem
resp ira tion ( A )•
ECOSYSTEM METABOLISM
• z Gross P h o to syn th e tic A s s im i la t io n
▲z Ecosystem R e s p ira t io n
F M A M0 N 0i— i— rA S 0
cno>
FIGURE 7
57
Peak photosynthetic a c t iv i t y , occurring during thq early
summer, temporally correlates with the rapid below ground biomass
accrual observed in June o f 1974. Respiration a c t iv i t y lagged
photosynthetic a c t iv i t y and peaked in mid July . Whereas ecosystem
resp iration was maintained throughout mid summer a t a somewhat
constant ra te , the rate o f gross photosynthesis was gradually
attenuated. Rapid reduction in rates of both resp iration and gross
photosynthesis were observed in mid September, as the two processes
approached equivalence in mid October. Gas exchange measurements
during the period of w inter ice cover were complicated by conditions
of reduced gaseous exchange with the atmosphere. As a re su lt o f the
ice cover, impeding equilibrium , CO2 supersaturation o f the pond
water became r e la t iv e ly extreme compared to th a t occurring during ice
free periods. The CC released in to the metabolic chambers, posi
tioned in holes chopped through the ic e , accumulated at rates on the
order o f 2 to 3 times maximal observed resp ira to ry ra tes . As a
re su lt of these conditions, resp irato ry estimates made during three
mid winter sampling periods were discarded and are not presented in
Figure 7. Assuming that th is phenomenon occurred s im ila r ly w ithin
both l ig h t and dark metabolic chambers, estimates of gross photo
synthesis, made under these conditions, were not a ffec ted .
Gas exchange measurements made during the summer o f 1973
(not used in annual or growing season metabolic rate ca lcu la tions)
are believed to be underestimates caused by the extended incubation
periods (2 to 3 hours) used at that time. I t is apparent (Table 9)
that photosynthetic rate was inversely re la ted to the duration of
58
Table 9. In Situ D e te rm in a t io n ^ Of The Carbon Dioxide Compensation Point For The Dune Pond.
Light Chamber Dark Chamber
5 N 51^Time in ppm in ppm/hr in ppm in ppm/hr
10:30 311 - 311
11:00 217 188 347 72
11:30 161 112 429 87
12:30 105 28 515 89
13:30 105 0 592 77
^Data from 30 Cune 74. Chambers placed in a single position a t 10:30. Gas removal a t h a lf hour and one hour in terva ls during a 3 hour period.
incubation, C0£ compensation achieved within 2 to 3 hours during
periods o f ac tive photosynthesis. Although resp irato ry ra te was
l i t t l e a ffec ted by the duration o f incubation, extremely high dark-
chamber CO2 concentrations, associated with extended incubation
during mid to la te summer periods of increased resp iratory a c t iv i t y ,
produced a po ten tia l fo r inaccuracy in the analysis o f subsamples,
the CO2 concentrations o f which were too high (> 600 ppm) to
accurate ly measure with the analysis system.
Diurnal patterns o f gross photosynthesis and the e ff ic ie n c y
o f gross photosynthesis in re la t io n to solar energy are presented in
Table 10 fo r selected c lear to p a r t ly cloudy sampling days during the
summer of 1973 and 1974. Gross photosynthesis and, more strongly,
the e f f ic ie n c y o f gross photosynthesis demonstrated morning and
evening maxima, the morning maxima being more pronounced than tha t
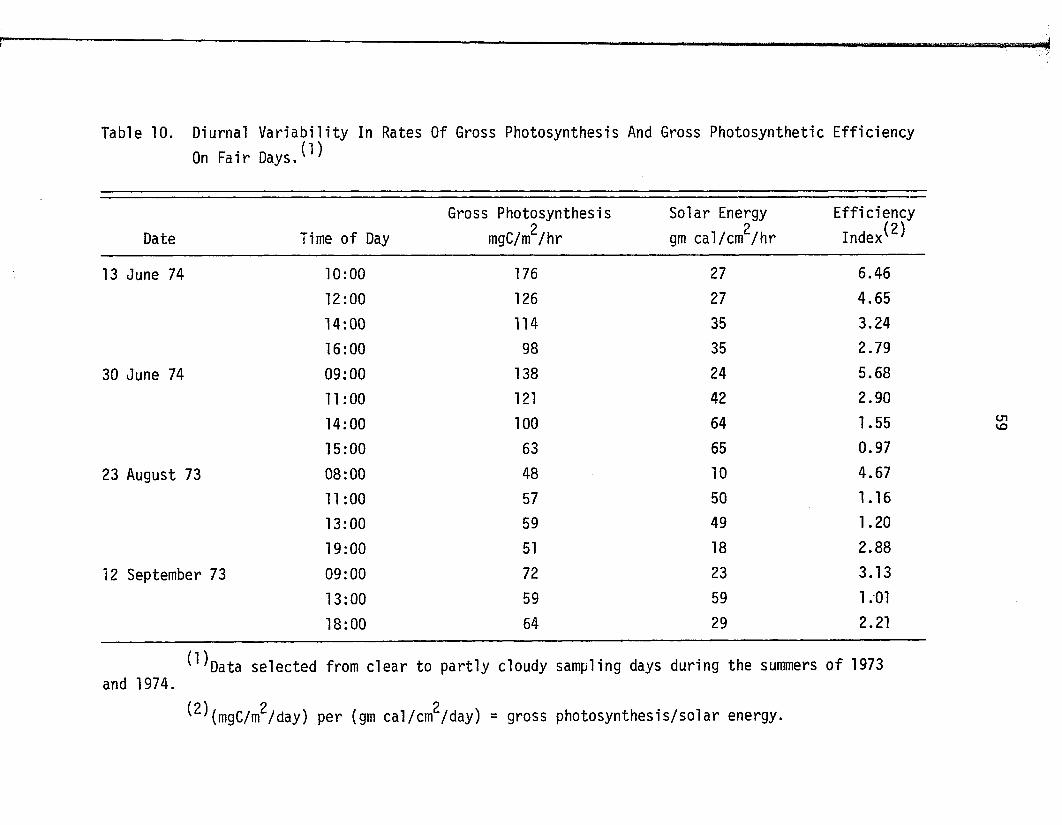
Table 10. Diurnal V ariab ility In Rates Of Gross Photosynthesis And Gross Photosynthetic EfficiencyOn Fair D a y s .^
Date Time of Day
Gross Photosynthesis 2
mgC/m /h r
Solar Energy 2
gm cal/cm /h r
Effic iency
In d e x ^
13 June 74 10:00 176 27 6.46
12:00 126 27 4.65
14:00 114 35 3.24
16:00 98 35 2.79
30 June 74 09:00 138 24 5.68
11:00 121 42 2.90
14:00 100 64 1.55
15:00 63 65 0.97
23 August 73 08:00 48 10 4.67
11:00 57 50 1.16
13:00 59 49 1.20
19:00 51 18 2.88
12 September 73 09:00 72 23 3.13
13:00 59 59 1.01
18:00 64 29 2.21
^ D a t a selected from c lear to p a rt ly cloudy sampling days during the summers o f 1973and 1974.
mgC/m2/day) per (gm cal/cm2/day) = gross photosynthesis/solar energy.
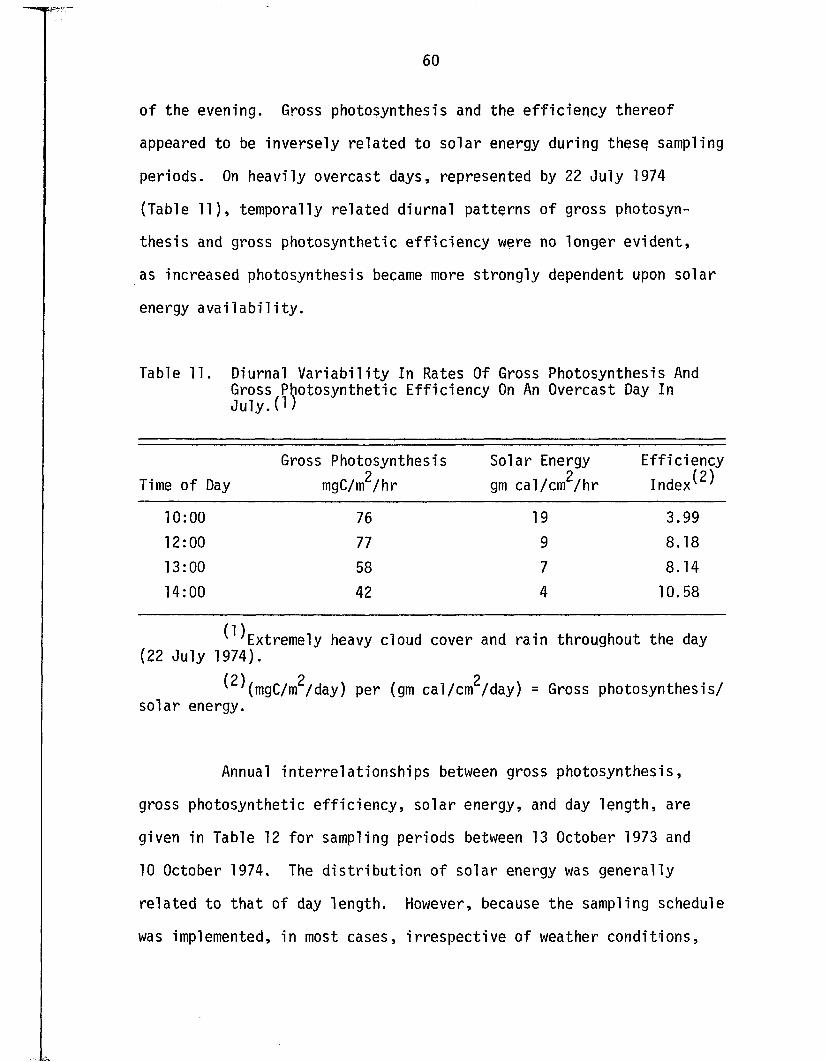
60
of the evening. Gross photosynthesis and the e ff ic ie n c y thereof
appeared to be inversely re lated to so lar energy during thes§ sampling
periods. On heavily overcast days, represented by 22 July 1974
(Table 11), temporally re la ted diurnal patterns o f gross photosyn
thesis and gross photosynthetic e f f ic ie n c y were no longer ev ident,
as increased photosynthesis became more strongly dependent upon solar
energy a v a i la b i l i t y .
Table 11. Diurnal V a r ia b i l i t y In Rates Of Gross Photosynthesis And Gross Photosynthetic E ff ic ie n cy On An Overcast Day In J u l y . )
Time o f Day
Gross Photosynthesis
mgC/n/Vhr
Solar Energy 2
gm cal/cm /h r
E ffic iency
In d e x ^
10:00 76 19 3.99
12:00 77 9 8.18
13:00 58 7 8.14
14:00 42 4 10.58
^ E x tre m e ly heavy cloud cover and ra in throughout the day (22 July 1974).
(2 ) 2 2(mgC/m /day) per (gm cal/cm /day) = Gross photosynthesis/solar energy.
Annual in te rre la tio n sh ip s between gross photosynthesis,
gross photosynthetic e f f ic ie n c y , so lar energy, and day length, are
given in Table 12 fo r sampling periods between 13 October 1973 and
10 October 1974. The d is tr ib u t io n of so lar energy was generally
re la ted to tha t o f day length. However, because the sampling schedule
was implemented, in most cases, ir resp ec tive o f weather conditions,
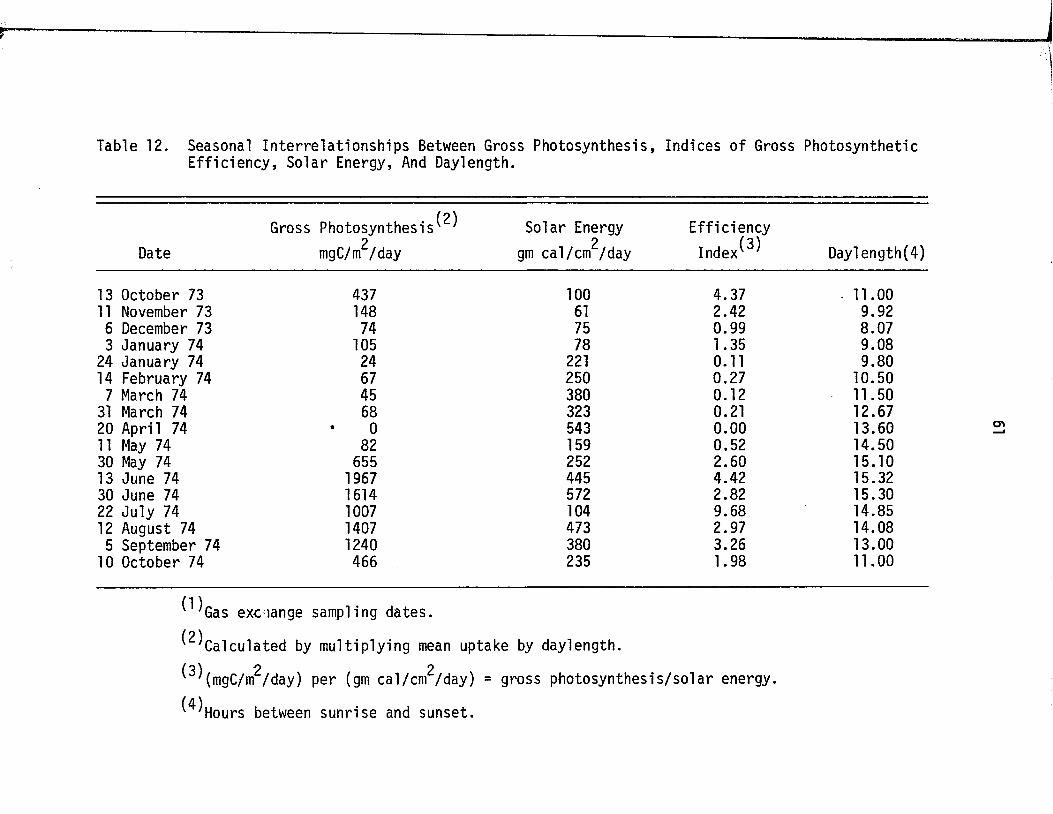
Table 12. Seasonal Interrelationships Between Gross Photosynthesis, Indices of Gross PhotosyntheticEfficiency, Solar Energy, And Daylength.
(2)Gross Photosynthesis' ' ?
Date mgC/m /day
Solar Energy 2
gm cal/cm /day
Effic iency
In d e x ^ Daylength(4)
13 October 73 437 100 4.37 • 1 1 . 0 0
11 November 73 148 61 2.42 9.926 December 73 74 75 0.99 8.073 January 74 105 78 1.35 9.08
24 January 74 24 221 0.11 9.8014 February 74 67 250 0.27 10.50
7 March 74 45 380 0.12 11.5031 March 74 68 323 0.21 12.6720 April 74 0 543 0.00 13.6011 May 74 82 159 0.52 14.5030 May 74 655 252 2.60 15.1013 June 74 1967 445 4.42 15.3230 June 74 1614 572 2.82 15.3022 July 74 1007 104 9.68 14.8512 August 74 1407 473 2.97 14.085 September 74 1240 380 3.26 13.00
10 October 74 466 235 1.98 11.00
( 1)' 'Gas exc-iange sampling dates.( 2 )' 'Calculated by multiplying mean uptake by daylength.
(11 2 2(mgC/m /day) per (gm cal/cm /day) = gross photosynthesis/solar energy.
(4)v 'Hours between sunrise and sunset.
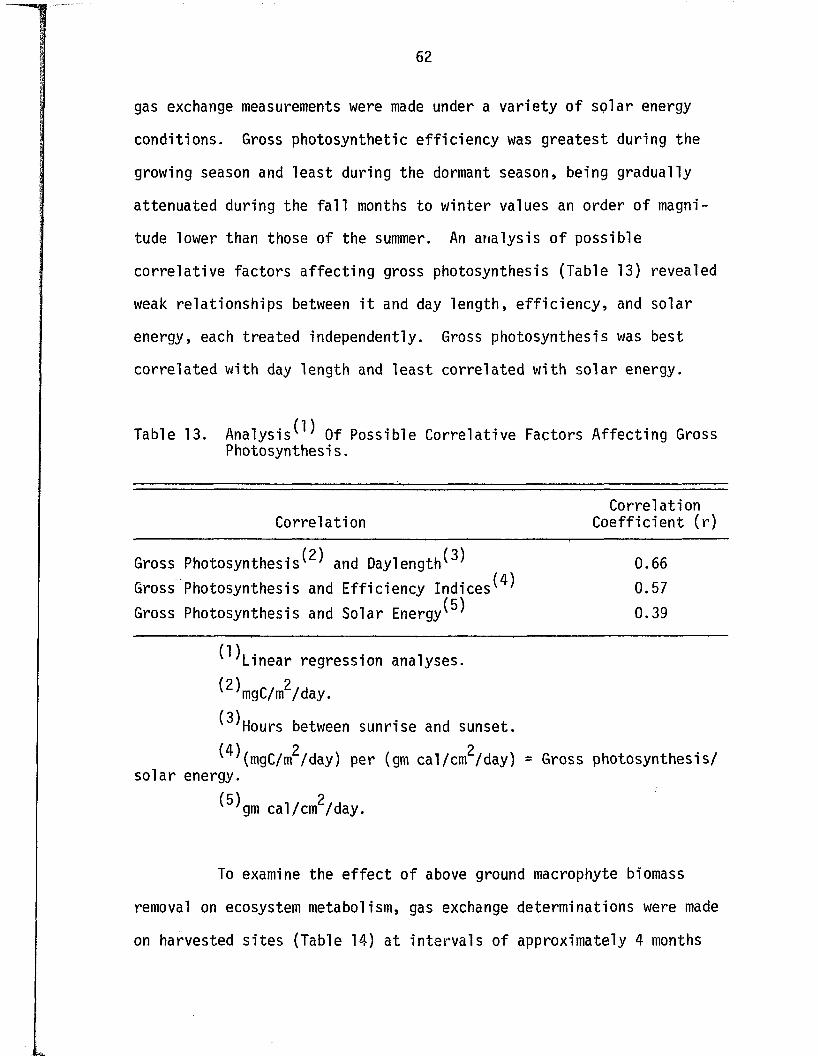
62
gas exchange measurements were made under a v a r ie ty o f so lar energy
conditions. Gross photosynthetic e f f ic ie n c y was greatest during the
growing season and leas t during the dormant season, being gradually
attenuated during the f a l l months to w inter values an order o f magni
tude lower than those of the summer. An analysis o f possible
c o rre la t ive factors a ffec t in g gross photosynthesis (Table 13) revealed
weak relationships between i t and day length, e f f ic ie n c y , and solar
energy, each treated independently. Gross photosynthesis was best
correlated with day length and leas t correlated with solar energy.
Table 13. A n a ly s is ^ Of Possible C orre lative Factors A ffecting Gross Photosynthesis.
CorrelationCorrelation C o eff ic ien t ( r )
Gross Photosynthesis^ and Daylength^ 0.66(41Gross Photosynthesis and E ffic iency Indices' ' 0.57
(51Gross Photosynthesis and Solar Energy' ' 0.39
^ L i n e a r regression analyses.
^mgC/m^/day.(31' 'Hours between sunrise and sunset.(41 2 2' '(mgC/m / day) per (gm cal/cm /day) = Gross photosynthesis/
solar energy.
(5) 2'gm cal/cm /day.
To examine the e f fe c t o f above ground macrophyte biomass
removal on ecosystem metabolism, gas exchange determinations were made
on harvested s ites (Table 14) a t in terva ls o f approximately 4 months
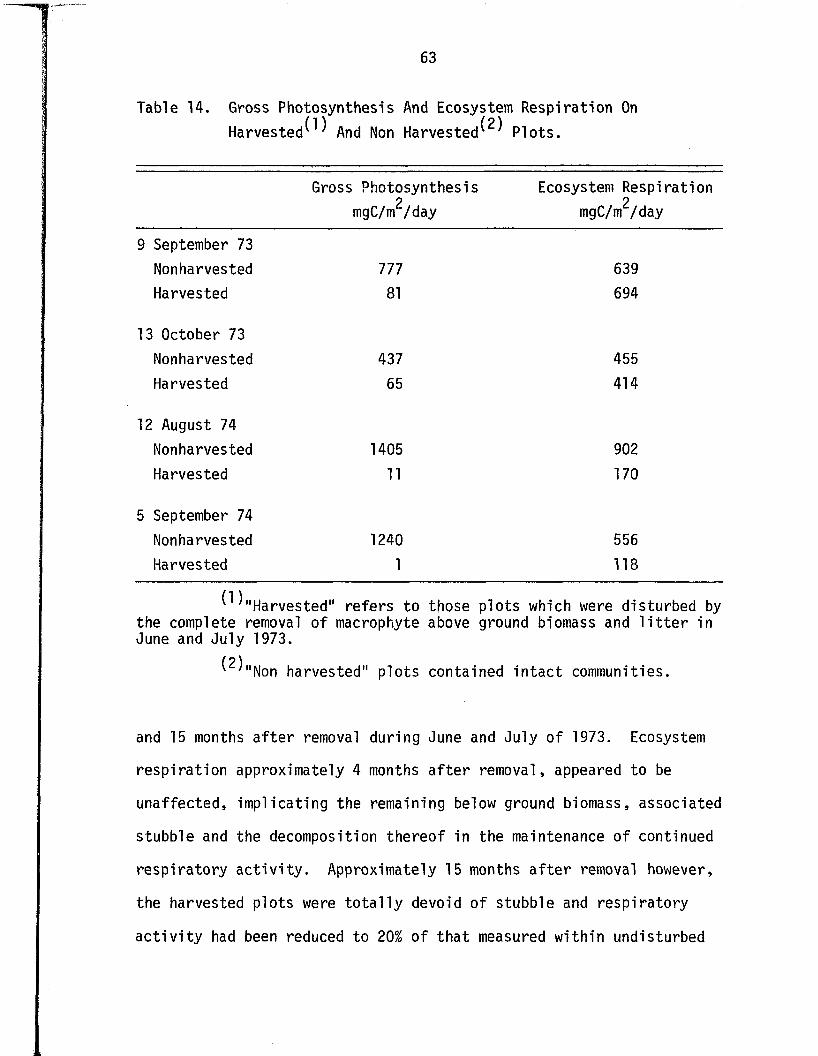
63
Table 14. Gross Photosynthesis And Ecosystem Respiration On
H a rv e s te d ^ And Non H a rv e s te d ^ P lots.
Gross Photosynthesis 2
mgC/m /day
Ecosystem Respiration 2
mgC/m /day
9 September 73
Nonharvested 777 639
Harvested 81 694
13 October 73
Nonharvested 437 455
Harvested 65 414
12 August 74
Nonharvested 1405 902
Harvested 11 170
5 September 74
Nonharvested 1240 556
Harvested 1 118
( 1 )v ' "Harvested" refers to those plots which were disturbed by the complete removal o f macrophyte above ground biomass and l i t t e r in June and July 1973.
( 2 )v '"Non harvested" plots contained in ta c t communities.
and 15 months a f te r removal during June and July o f 1973. Ecosystem
resp ira tion approximately 4 months a f te r removal, appeared to be
unaffected, im plicating the remaining below ground biomass, associated
stubble and the decomposition thereof in the maintenance o f continued
resp irato ry a c t iv i t y . Approximately 15 months a f te r removal however,
the harvested plots were t o t a l l y devoid o f stubble and resp iratory
a c t iv i t y had been reduced to 20% o f tha t measured w ith in undisturbed
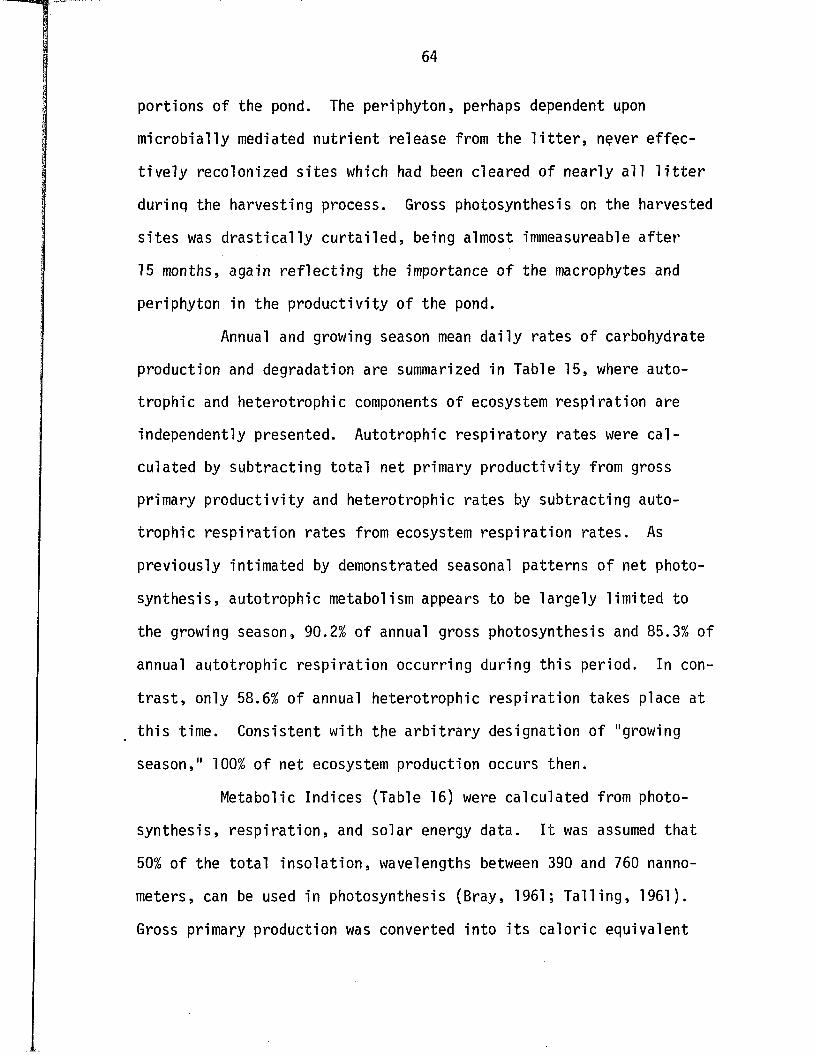
64
portions of the pond. The periphyton, perhaps dependent upon
m icrob ia lly mediated n u tr ien t release from the l i t t e r , never e f fe c
t iv e ly recolonized s ites which had been cleared o f nearly a l l l i t t e r
durinq the harvesting process. Gross photosynthesis on the harvested
s ites was d ra s t ic a l ly c u r ta i le d , being almost immeasureable a f te r
15 months, again r e f le c t in g the importance o f the macrophytes and
periphyton in the p roductiv ity o f the pond.
Annual and growing season mean d a ily rates o f carbohydrate
production and degradation are summarized in Table 15, where auto-
trophic and heterotrophic components o f ecosystem resp iration are
independently presented. Autotrophic resp ira to ry rates were c a l
culated by subtracting to ta l net primary productiv ity from gross
primary productiv ity and heterotrophic rates by subtracting auto
trophic resp ira tion rates from ecosystem resp ira tion ra tes . As
previously intimated by demonstrated seasonal patterns o f net photo
synthesis, autotrophic metabolism appears to be la rg e ly lim ited to
the growing season, 90.2% of annual gross photosynthesis and 85.3% of
annual autotrophic resp ira tion occurring during th is period. In con
t r a s t , only 58.6% of annual heterotrophic resp ira tion takes place at
th is time. Consistent with the a rb it ra ry designation of "growing
season," 100% o f net ecosystem production occurs then.
Metabolic Indices (Table 16) were calculated from photo
synthesis, re s p ira t io n , and solar energy data. I t was assumed that
50% o f the to ta l in s o la t io n , wavelengths between 390 and 760 nanno-
meters, can be used in photosynthesis (Bray, 1961; T a i l in g , 1961).
Gross primary production was converted in to i t s ca lo r ic equivalent
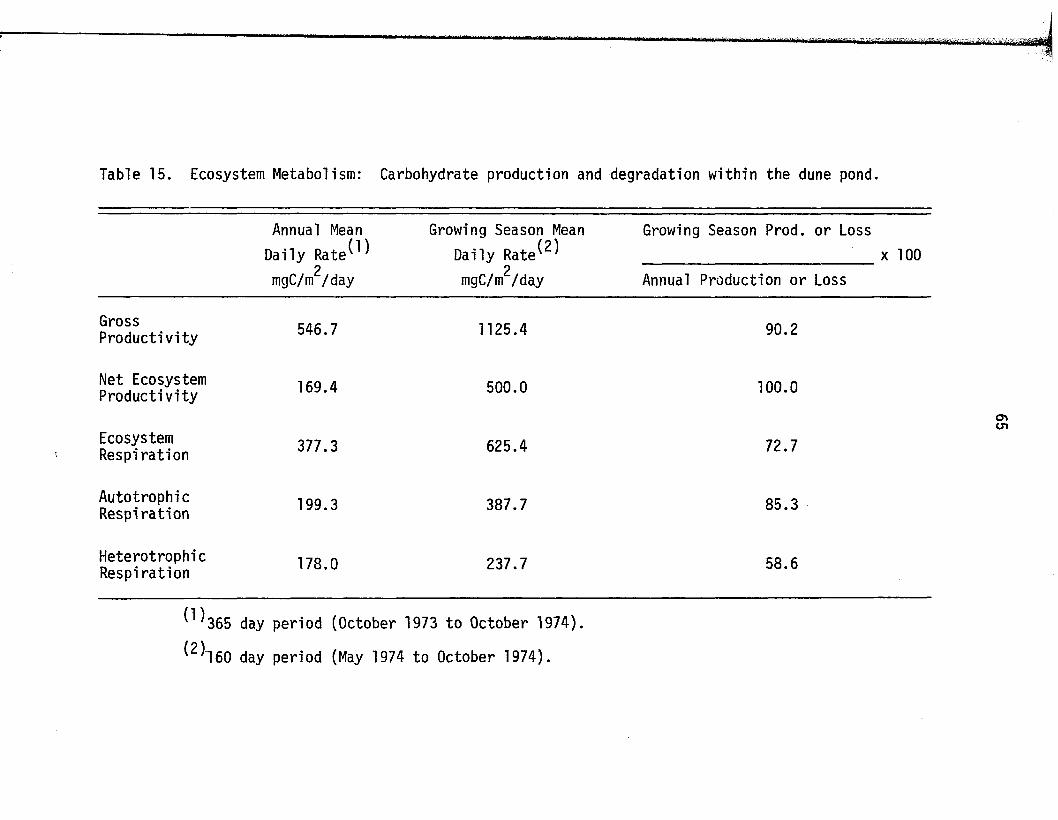
Table 15. Ecosystem Metabolism: Carbohydrate production and degradation within the dune pond.
Annual Mean
Daily R a t e ^ 2
mgC/m /day
Growing Season Mean
Daily R a t e ^2
mgC/m /day
Growing Season Prod, or Loss
x 100
Annual Production or Loss
GrossProductivity 546.7 1125.4 90.2
Net Ecosystem Productivity 169.4 500.0 100.0
EcosystemRespiration 377.3 625.4 72.7
AutotrophicRespiration 199.3 387.7 85.3
HeterotrophicRespiration 178.0 237.7 58.6
^ 3 6 5 day period (October 1973 to October 1974).
^ 1 6 0 day period (May 1974 to October 1974).
Table 16. Ecosystem Metabolic Indices: Seasonal changes in indices o f carbohydrate productionand degradation in the dune pond.L = availab le solar energy; GPP = gross primary productiv ity;NPP = net primary productiv ity ; NEP = net ecosystem productiv ity ;ER = ecosystem resp iration ; AR = autotrophic resp iration;HR = heterotrophic resp iration .
Annual B a s i s ^(2)
Growing Season Basisv ' (3 )Dormant Season Basis' '
GPP/L 0.0042 0.0147 0.0018
npp/ gpp 4 ' 0.64 0.66 0.45
GPP/ER 1.45 1.80 0.52
AR/ER 0.53 0.62 0.28
HR/ER 0.47 0.38 0.72
^ 3 6 5 day period (October 1973 through October 1974).
^ 1 6 0 day period (May 1974 through October 1974).
^ 2 0 5 day period (October 1973 through May 1974).
^ I t is assumed that NPP during the 1973 growing season approximates NPP during the 1974 growing season.
67
using 4775 cal/gm. organic w t . , a compromise between values o f 4770
and 4780 suggested by Cummins and Wuycheck (1971), fo r aquatic mono
cots and green algae respective ly . E ffic iency indices were c a l
culated re la t in g gross production to ava ilab le solar energy a t the
pond surface (6PP/L), and to ta l net primary production to gross
primary production ( NPP/GPP). Indices o f GPP/L and NPP/GPP have
been termed "assim ilation e ff ic ien cy" and "growth e ff ic iency"
respectively by Clarke (1946) and others. Assimilation e ff ic ie n c y
was 0.42% annually , varying between dormant and growing season
values o f 0.18% and 1.47% respective ly . Growth e f f ic ie n c y , 64%
annually, varied between dormant and growing season values o f 45%
and 66% respective ly . The ra t io o f gross production to ecosystem
resp ira tion (GPP/ER) is commonly termed the "P/R ra tio " (Odum, 1956).
Annually, the P/R ra t io was 1.45 varying between dormant and growing
season values o f 0.52 and 1.80 respective ly . Expressed as per
centages o f ecosystem resp ira tion (ER) autotrophic resp iration (AR)
and heterotrophic resp iration (HR) were quite s im ila r annually, being
53% and 47% respective ly . The dominant component (62%) o f ER during
the growing season was AR while HR dominated (72% o f ER) during the
dormant season.
Light Response C haracteristics o f Juncus balticus
As previously discussed, Juncus balticus was the dominant
macrophyte w ith in the dune pond. Considering the demonstrated
importance o f the macrophytes in terms of contribution to the metabo
lism o f th is ecosystem, i t is f e l t tha t photosynthetic ch aracter is tics
68
of th is species may be somewhat representative o f the ecosystem
i t s e l f during the growing season.
The response o f each of the two age categories o f stems
(young and old) to increasing il lum in ation (Figure 8) was s im ila r ,
yet the net photosynthetic ra te of the younger age category was
consistently greater than tha t o f the o lder a t a l l levels of
i l lum ination .
Unlike typ ica l l ig h t saturation curves (Ribinowitch, 1951),
which beyond a l in e a r ly ascending portion a t low l ig h t in te n s it ie s ,
gradually ascend asym ptotically , th is species demonstrated an abrupt
increase in slope between 3800 and 4500 foot candles (40.9 to 48.4
klux). Considering the i l lum in ation gradient w ith in the 60 cm. t a l l
photosynthetic chamber and the d is tr ib u t io n o f stem surface area of
J. b a lt ic u s , which increases from the apex downward, i t is l i k e ly
that l in e a r ly ascending response a t low l ig h t in ten s ity occurred
asynchronously along the stem length.
Although l ig h t saturation was not t o t a l l y achieved in th is
species a t 5500 foot candles (59 .2 k lu x ) , i t is expected that only
nominal increase in photosynthesis would be rea lized a t higher l ig h t
in te n s it ie s . Graphically extrapolated (Figure 8 ) , l ig h t compensa
tion occurred a t approximately 450 foot candles. The C02 compensation
point (determination made a t 4500 foot candles) was 80 ppm C02 ,
approximately 24% less than an in s itu compensation point determina
tion (105 ppm C02) made one week la te r (30 June 1974) under conditions
of fu l l sunlight and s im ila r temperature. The high C02 compensation
point o f J. ba lticus suggests i t s possession o f the photosynthetic
pathway (Goldsworthy, 1970).
69
Figure 8. Net photosynthesis in Juncus ba lticus a t l ig h t in ten
s i t ie s ranging between 0 and 5,500 foot candles (0 to
59.2 k lu x ). Points represent net photosynthetic rates
in young ( 0 ) and old ( A ) stems.
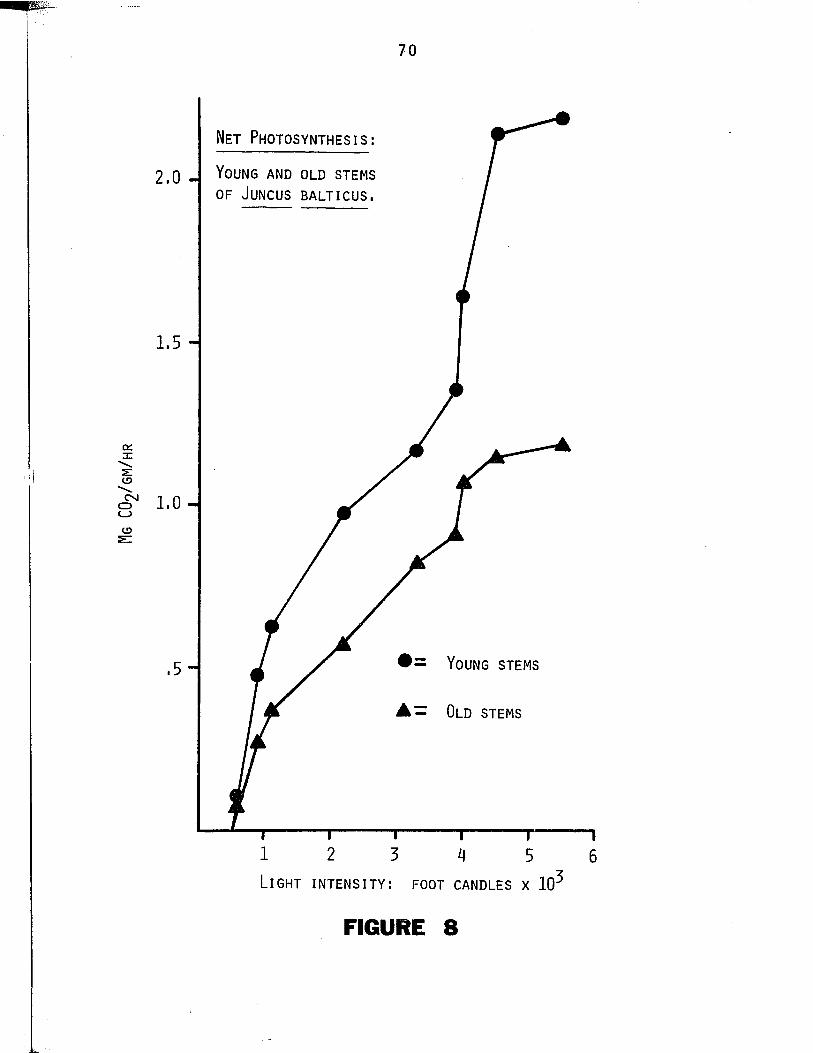
Mg
CC
^/g
m/h
r
70
Net Ph o t o s y n t h e s is :
Young and old stems of J uncus b a l t i c u s .
2.0
1.5
1.0
Young stems51
A — Old stems
1 2 3 5L ig h t i n t e n s i t y : foot candles x 10^
FIGURE 8
DISCUSSION
Algal Productiv ity
The seasonal d is tr ib u t io n of algal p roductiv ity observed
in th is study suggests a pattern o f exchange between planktonic and
e p ip e lic algal populations s im ila r to th a t reported by Brown and
Austin (1973). The taxonomic s im i la r i ty between these two com
ponents o f the autotrophic community has already been noted and
the p o s s ib i l i ty o f b io lo g ic a lly or physiochemically induced habit
transformations should not be dismissed. The phytoplankton pro
d u c t iv i ty curve, being bimodal ( la te summer peak of considerably
less importance than tha t o f e a rly summer) may indicate coloniza
tion o f the open water by algal organisms generally re s tr ic te d to
the substrate.
The seasonal d is tr ib u tio n s o f both phytoplankton and
periphyton productiv ity might be explained by changes in the status
o f ava ilab le nutrients w ith in the pond. Although d ire c t determina
tions o f the nu tr ien t status of the pond were not made, i t is f e l t
tha t autotrophic a c t iv i t y is l im ited by a general paucic ity of
nu tr ien ts . Notably, the soil o f the Lake Michigan sand dunes is
impoverished in th is regard (Olson, 1958). Algal growth in the pond,
subsequent to the early summer flush o f phytoplankton growth, is
la rg e ly l im ited to the benthic substrate where m icrob ia lly mediated
n u tr ien t release from the sediments may be stimulated by r is in g
71
72
temperature (Hutchinson, 1957). During la te summer, microbial
a c t iv i t y possibly provides a n u tr ien t supply in excess o f e p ip e lic
algal requirements, thus enabling the reestablishment o f the phyto
plankton. N utrient ( s i l i c a ) release from l iv in g macrophytes has
been c ited (J0rgensen, 1957) in the rapid growth o f diatomaceous
epiphytes follow ing th e ir co in c iden ta lly occurring exclusion from
the plankton due to s i l i c a depletion.
Surface in h ib it io n o f planktonic a lgal photosynthesis by
l ig h t o f high in te n s ity has been widely observed (T a i l in g , 1957;
Jonasson and Mathiesen, 1959; Goldman e t a l . , 1963; among others).
L ike ly unimportant in deep lakes, th is in h ib it io n may be s ig n if ic a n t
in shallow basins (Wetzel, 1964). The observed pattern o f photosyn
thesis with respect to depth in the dune pond, counters th is common
phenomena however, and is d i f f i c u l t to resolve. The greater photo
synthetic a c t iv i t y near the surface, observed during the growing
season, would seem to be p a r t ia l l y explained by increased tu r b id i ty
w ith in the lower stratum resu lt in g from the unavoidable ag ita t io n o f
the f lo ccu len t substrate while positioning the sampling bo ttles fo r
in s i tu incubation. However, the converse (grea ter photosynthesis
near the substrate) evidenced during the dormant season, occurred
under s im ila r ly disturbed conditions. The a r t i fa c tu a l s tate of
increased tu r b id i ty was normally dissipated w ith in 0.5 hour a f te r
placement o f the sampling b o tt le s , and i t is f e l t tha t th is problem
had a lesser e f fe c t on the v e r t ic a l d is tr ib u t io n o f phytoplankton
prod uctiv ity than the presence o f dissolved and p a rt ic u la te humic
73
substances, which appeared to be most concentrated in the pond water
during the growing season.
Placement o f bottles on the pond bottom fo r in s itu
incubation o f e p ip e lic periphyton samples resulted in the same condi
tions o f temporary tu r b id i ty as discussed in regard to the positioning
o f phytoplankton b o tt le s . During the study, great care was taken to
reduce the extent and duration o f such conditions however, thereby
minimizing the potentia l fo r underestimation o f photosynthesis due
to unnatural l ig h t attenuation . In regard to estimated rates of
algal photosynthesis (planktonic and benth ic ), the e f fe c t o f these
conditions on photosynthesis measurements is f e l t to be small.
P a r t ic u la r ly relevant to th is study, a p o te n t ia l ly serious
source o f e rro r in estimating the p roductiv ity o f e p ip e lic periphyton
arises from the expansion o f small experimentally measured surfaces
to la rg e r areas. P roductiv ity estimates based on small samples, may
not be e n t i re ly representative o f the whole, the potentia l fo r erro r
increasing with substrate heterogeneity. The e p ip e lic periphyton in
th is study appeared qu ite homogeneously d is tr ib u ted however, and i t
is f e l t that e rro r involved in expansion from sample area to a square
meter basis was r e la t iv e ly small.
S e lf absorption o f beta p a r t ic le s , caused by layering of
e p ip e lic algal m aterial on the membrane f i l t e r s , may have a ffected
the counting during the la te summer period o f maximum periphyton
biomass. During the remainder o f the year however, layering of the
sample material was not appreciable. This problem may re s u lt in
underestimated rates o f photosynthesis and can be circumvented by
74
combustion o f the organic m aterial fo r radioassay in gas phase
(Wetzel, 1964), but th is approach is tedious and maximum sample size
is lim ited . Because of th is and other technical d i f f i c u l t i e s involved
in benthic applications o f the technique, many investigators have
used the oxygen method (Pomeroy, 1959; Pamatmat, 1968; Hargrave,
1969; among others). In a recent paper (Hunding and Hargrave, 1973)
on the primary productiv ity o f benthic algae, the two methods (^ C
and oxygen) were shown to give s im ila r resu lts and i t was pointed out
tha t ne ither o f the two was free from experimental a r t i f a c ts and14assumptions. The C method however has the advantage that i t does
not necessitate the determination o f a photosynthetic quotient
(usually assumed), and furthermore i t may be the only su itab le method
where low production would be expected.
Macrophyte Biomass and Productiv ity
Considering the dynamics o f growth and seasonal produc
t i v i t y o f the macrophytes o f the dune pond, i t is important to
r e i te ra te tha t Juncus balticus composed greater than 90% of the
autotrophic biomass. I t is f e l t , in fa c t , tha t subsequent discussion
concerning the macrophytes is e s s e n tia l ly a treatment of the dynamics
of growth and productiv ity o f J. b a lt ic u s .
Laboratory investigations on Juncus balticus indicated a
decline in net photosynthetic potentia l with le a f age. This decline
has been described in a va r ie ty o f t e r r e s t r ia l species (Wilson and
Cooper, 1969; Osman and M ilthorpe, 1971) and also in an aquatic
emergent, Typha l a t i f o l i a (McNaughton, 1973). These observations
75
may be a ttr ib u te d to e-'ther increased resp irato ry demands or to
decreased carboxylation a c t iv i t y in the older stems. Both o f these
factors were l i k e ly important in rap id ly c u r ta i l in g macrophyte net
production by mid summer as determined using the harvest method.
Since both young and old shoots o f J. ba lticus demonstrated id e n t i
cal COg compensation points (80 ppm) in laboratory investigations ,
seasonally decreased net photosynthetic potentia l in the older
shoots was un like ly re la ted to increased resp iratory demands within
the shoots themselves. I t is important to point out however that
th is conclusion is not applicable to whole p lan ts , since the "roots"
were not included in the laboratory measurements. "Root" resp ira
tion very l i k e ly increased as the photosynthetic capacity o f the
macrophytes a ffected by shoot senescence became reduced.
The importance o f the rhizomal and rooted portions of the
macrophytes cannot be overemphasized in th is study. Below ground
portions annually represented > 90% o f the to ta l macrophyte biomass.
S im ila r ly high values have been c ited fo r Scirpus la cu s tr is and for
Phragmites communis, but the m ajority of values given fo r other
"perennial reedswamp plants" are somewhat less (Westlake, 1965, 1968).
Boyd (1971) estimated the contribution by "roots" to the to ta l
biomass o f Juncus effusus a t about 10%. This value is probably too
low however, since root removal in the J. effusus study was not
system atically accomplished. To my knowledge, no data e x is t on the
biomass o f any other species o f Juncus.
Shoot to "root" tran s location , occurring during the early
summer, undoubtedly represents the movement o f carbohydrates
76
produced in excess o f the capacity o f the leaves to u t i l i z e or store
them. Increased below ground storage in Typha spp., evidenced a t the
onset o f f a l l dormancy, has been s im ila r ly in terpreted by Jervis
(1969), who suggests tha t decreased resp irato ry a c t iv i ty in the f a l l
allows greater net production a t that time. Although some downward
translocation was evidenced during the f a l l in the dune pond study,
below ground biomass accrual was balanced by above ground biomass
loss, and I have not considered th is accumulation to be net produc
tio n .
Late season below ground biomass accumulation may represent
a strategy fo r survival whereby current above ground structure is
re s o lu b i l ize d , transported, and stored in below ground organs fo r
metabolic use during the w inter or fo r the reformation o f photosyn
th e t ic organs a t the beginning of the next year's growing season.
Such a strategy would l i k e ly be o f great value p a r t ic u la r ly following
periods o f s ig n if ic a n t loss (35%) o f macrophyte biomass as evidenced
between 1973 and 1974.
"Root" to shoot tran s location , continued production o f new
shoots, "root" re s p ira t io n , and m o rta l ity were a l l l i k e ly responsible
fo r the mid through la te summer depletion o f below ground biomass
stores. Discussion o f translocation processes in aquatic plants with
reference to the ro le of roots and other submerged organs (Sculthorpe,
1967; Bristow and Whitcombe, 1971; among others) has been la rge ly
l im ite d to the absorption and u t i l i z a t io n o f inorganic nu tr ien ts .
In a s im ila r context, the translocation o f carbohydrates has been
discussed fo r t e r r e s t r ia l grasses ( fo r example, Smith and Leinweber,
77
1971; Singh and Coleman, 1974) and crop plants (Milthorpe and
Moorby, 1974). Although the macrophyte community became increasingly
dominated by older shoots as the growing season progressed, new
shoots were continually produced, replacing losses o f the older due
to damage and m o rta l ity . As demonstrated by the harvested p lo t gas
exchange experiments, the dominant resp irato ry component o f the pond,
during the growing season, was the below ground macrophyte biomass.
High levels o f resp irato ry a c t iv i t y were l i k e ly a t t r ib u ta b le to
energetic demands imposed on the rooted organs in maintaining
meristematic, trans location , and absorption processes.
Ash content estimates, compared to published values
tabulated by Westlake (1965), are s im ila r to those presented fo r
sedges and grasses, but are somewhat lower than the content l is te d
fo r other aquatic plants. Ash content o f the l iv in g shoots, ranging
between 2 and 4% of the dry weight, compared most closely with that
o f Juncus effusus (Boyd, 1971) which contains between 3 and 5% ash
on a dry weight basis. Westlake's contention (op. c i t . ) concerning
the lack o f seasonal varia tions in the ash content o f freshwater
plants, apparently applicable to the above ground biomass, was not
ju s t i f ie d in th is study with respect to below ground m ateria l.
Seasonal varia tions in the ash content o f the below ground biomass
(7% change in 1973 and 6% change in 1974) may be re la ted to patterns
o f translocation and mineral a v a i la b i l i t y , although no data are a v a i l
able to examine these p o s s ib i l i t ie s .
The ca lcu la tion o f macrophyte p ro d u c tiv ity , based on changes
in below ground biomass (see resu lts ) seems to be unique to th is
78
study. Moreover the observed pattern o f s ig n if ic a n t below ground
biomass accrual during the early summer, counters that observed in
the few wetland studies in which below ground biomass estimates have
been made ( fo r example, see Westlake, 1966; J e rv is , 1969; Bernard,
1974a, 1974b). In the studies c ited here, below ground biomass peaks
were reported in the f a l l , minima occurring during the early summer
following a period o f rapid spring depletion. I t is not known
whether the reverse o f th is pattern (as reported fo r Juncus b a lt ic u s )
represents a species c h a ra c te r is t ic , or an adaptation fo r existence
in dune pond habitats . Perhaps an annual study o f the dynamics of
"root" growth o f th is species in a d i f fe r e n t hab ita t would resolve
th is question.
In sp ite o f various confounding factors and technical d i f
f ic u l t ie s involved, the harvest (biomass) approach used to estimate
the prod uctiv ity o f macrophytes in th is study remains the most
commonly used, and perhaps the most accurate (Wetzel and Hough,
1973). Most su itab le in estimating the prod uctiv ity of p lant popula
tions demonstrating n e g lig ib le losses between sampling periods
(Westlake, 1963, 1965), the harvest technique has also been adapted
to populations subject to high m o rta l ity (Mathews and Westlake, 1969).
As w i l l be subsequently discussed, a major drawback of th is technique
is i t s l im ita t io n to the measurement o f large p a rt ic u la te m atter,
turnover estimates being em p ir ica lly based on the accumulation o f
nondecomposed l i t t e r .
A lternate methods fo r determining productiv ity o f aquatic
macrophytes are few and these have been in frequently employed.
79
Moreover, i t appears tha t our knowledge concerning the physiology
o f submerged macrophytes, p a r t ic u la r ly in regard to in ternal gas
exchange (c f . Hartman and Brown, 1967; Hough, 1974), has lagged
methodological advances in productiv ity analyses based on in s itu
metabolic techniques. Recently Wetzel and Hough (1973) have
emphasized that estimates based on oxygen change and radio-carbon
methods may be o f questionable value or t o t a l l y erroneous.
Ecosystem Metabolism
During the annual period o f October 1973 through October
1974, a P/R ra t io o f 1.45 was estimated, re f le c t in g the annual neto
ecosystem production of approximately 61.8 gmC/m (Table 17). I f
based only on the macrophyte biomass and l i t t e r , considered c o lle c
t iv e ly , th is amount o f production would represent an annual increase
in macrophyte m aterial o f approximately 10% over estimates made in
October 1973. However, when based on to ta l ecosystem organic mass,
including the biomass o f other l iv in g components (algae and animals)
as well as dissolved and p a r t ic u la te d e t r i ta l mass in addition to2
macrophyte l i t t e r , 61.8 gmC/m accumulation undoubtedly represents
considerably less than 10% annual accrual.
Considering the q u a n tita t ive importance and rapid turnover
charac te r is tics o f dissolved organic matter (D.O.M.) in aquatic
systems (Wetzel e t a l . , 1972), an attempt to balance the carbon
budget ( i . e . , explain deviation from P/R = 1 .0 ) based on p a r t ic u la te
mass would be r e la t iv e ly meaningless. Indeed net ecosystem produc
tion in th is study cannot be accounted fo r on the basis of increased
80
Table 17. Annual Carbon B u d g e t^ For The Dune Pond.
2gmC/m /year
Gross Photosynthesis 199.5
Autotrophic Respiration 72.7
Net Photosynthesis:Macrophyte 77.4Epipelic Periphyton 32.4Phytoplankton 17.0Total 126.8
Heterotrophic Respiration 65.0
Net Ecosystem Production 61.8
^ I t is assumed tha t allochthonous inputs are n e g lig ib le .
macrophyte biomass or l i t t e r . Assuming tha t p a r t ic u la te losses ( i . e . ,
herbivory and other sources o f export) were small, D.O.M. loss (not
measured) may account fo r the 61.8 gmC/m / y r . not respired auto-
chthonously. Changes in the water tab le in response to flucuations
in the water level o f Lake Michigan (see resu lts ) may have been
important in seasonally flushing the pond.
Net ecosystem production represented a s ig n if ic a n t portion
(49%) o f annual net primary production (Table 17). Changes in the
capacity of the pond to e ith e r respire (51%) or export (49%) net
primary production, presumably in a d e t r i ta l form, would be re flec ted
in changes in both net ecosystem productiv ity and the P/R r a t io .
Non resp irato ry loss o f perennia lly maintained biomass would not
a f fe c t these characteris tics however, both o f which are calculated
on the basis o f production and not biomass. With th is point in mind,
81
the s ig n if ic a n t reduction (35%) in macrophyte biomass (below ground),
which occurred during the summer o f 1973, may have had no e f fe c t on
the P/R ra t io (undetermined) a t tha t time.
T i l l y (1968) c ites estimates o f assim ila tion e ff ic ie n c y
from a number o f aquatic studies. These range from 0.2% fo r Root
Spring (Tea l, 1957) to 8.0% fo r S i lv e r Springs, Florida (Odum, 1957).
The annual assim ilation e f f ic ie n c y calculated fo r the dune pond
(GPP/L = 0.42%, where L = one-half so lar incidence a t the pond sur
face) f a l ls w ith in th is range but is somewhat lower than most
c ited . E ff ic ien c ies greater than 10%, observed under manipulated
conditions (Thomas, 1955; M clntire and Phinney, 1965), are uncommon
and generally can be explained by the very low l ig h t in te n s it ie s
used. Low e f f ic ie n c ie s are expected under natural conditions since
l ig h t saturation usually excludes a s ig n if ic a n t amount o f incident
l ig h t from usage. Aside from physiological considerations, assim ila
tion e f f ic ie n c y , when measured on an areal basis under natural
conditions, is dependent upon the to ta l surface ava ilab le fo r photo
synthesis. This surface can loosely be considered a function of
standing crop per un it area. The r e la t iv e ly low standing crop in
the dune pond is thought to be an important fac to r in l im it in g
assim ilation e f f ic ie n c y .
The phenomenon o f photorespiration, well known in t e r
r e s t r ia l plants (Hatch e t a l . , 1971; Z e l i tc h , 1971) has recently
been examined in submerged aquatic plants (Hough and Wetzel, 1972;
Hough, 1974). Gas exchange methods fo r estimating photosynthesis
generally do not d istinguish between mitochondrial (dark) resp iration
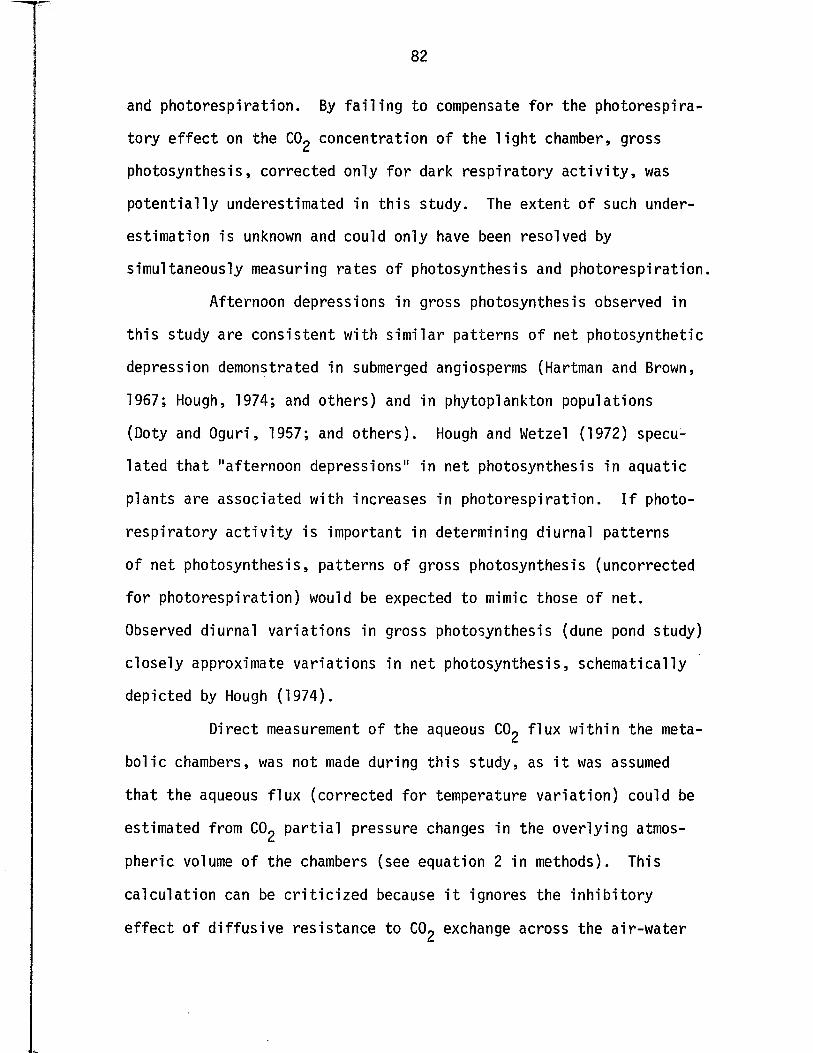
82
and photorespiration. By f a i l in g to compensate fo r the photorespira-
tory e f fe c t on the C02 concentration o f the l ig h t chamber, gross
photosynthesis, corrected only fo r dark resp irato ry a c t iv i t y , was
p o te n t ia l ly underestimated in th is study. The extent o f such under
estimation is unknown and could only have been resolved by
simultaneously measuring rates o f photosynthesis and photorespiration.
Afternoon depressions in gross photosynthesis observed in
th is study are consistent with s im ila r patterns o f net photosynthetic
depression demonstrated in submerged angiosperms (Hartman and Brown,
1967; Hough, 1974; and others) and in phytoplankton populations
(Doty and Oguri, 1957; and others). Hough and Wetzel (1972) specu
lated th a t "afternoon depressions" in net photosynthesis in aquatic
plants are associated with increases in photorespiration. I f photo-
resp irato ry a c t iv i t y is important in determining diurnal patterns
of net photosynthesis, patterns o f gross photosynthesis (uncorrected
fo r photorespiration) would be expected to mimic those of net.
Observed diurnal varia tions in gross photosynthesis (dune pond study)
closely approximate varia tions in net photosynthesis, schematically
depicted by Hough (1974).
D irect measurement o f the aqueous C02 f lu x w ith in the meta
bo lic chambers, was not made during th is study, as i t was assumed
tha t the aqueous f lu x (corrected fo r temperature v a r ia t io n ) could be
estimated from C02 p a r t ia l pressure changes in the overlying atmos
pheric volume o f the chambers (see equation 2 in methods). This
calcu la tion can be c r i t ic iz e d because i t ignores the in h ib ito ry
e f fe c t o f d i f fu s iv e resistance to C02 exchange across the a ir -w a te r
83
in te r fa c e . Theoretical aspects o f CO2 d iffus ion are complex, but
have been applied to natural systems (Emerson, e t a l . , 1973).
Respiratory ra te determinations would have been p o te n t ia l ly under
estimated in th is study during periods of incubation when the evolu
tion o f CO2 w ith in the aqueous volume o f the dark chamber exceeded
C02 evasion in to the gaseous volume. I t is f e l t however tha t C02
exchange in the pond was in most cases s u f f ic ie n t ly rapid to minimize
th is potentia l source o f e rro r and i t is assumed tha t the erro r
involved on an annual basis was small. High rates o f CC exchange
across the a ir -w a te r in terface have been reported in a eutrophic
lake , o f the Canadian Shield (Schindler e t a l . , 1972) where C02
invasion was found to equal a lgal net production (Schindler and Fee,
1973) and in an o ligo trophic a r t ic pond (Coyne and K elley , 1974)
where CO2 evasion rates were estimated. Im portantly, gross assim ila
tio n estimates in the dune pond study would not have been affected by
th is potentia l problem, since resp irato ry underestimates (dark
chamber) would have been balanced by assim ila tion overestimates
( l i g h t chamber), there being no net e f fe c t on the ca lcu lation of
gross photosynthesis (dark chamber CO2 f lu x - l ig h t chamber CC f lu x ) .
Metabolic Implications Regarding Macrophyte Productivity
As previously demonstrated, the rapid accumulation o f below
ground biomass temporally corresponded to peak assim ilatory a c t iv i ty
(metabolic measurements) by the macrophytes, both occurring during
the ea rly summer. Net below ground biomass production during th is
84
period however, is q u an t ita t iv e ly d i f f i c u l t to in te rp re t on the basis
o f observed gross assim ilatory a c t iv i t y (gas exchange d a ta ) . Calcu
la tions show tha t the magnitude of net production (including a lg a l)
could be explained on the basis of measured gross assim ila tion only
i f the ra t io o f net production to gross assim ilation approximated
1.0 during the early summer. Although macrophyte resp ira tion rates
l i k e ly were r e la t iv e ly low a t tha t time, they c e r ta in ly could not
have been zero, thus a lte rn a te explanations were sought fo r th is
phenomenon.
Evidence exists fo r CC absorption by the "roots" o f sub
merged freshwater plants (Brown, 1913; Bristow, 1969; Wium-Anderson,
1971), yet q u an tif ic a t io n o f th is process or the e luc idation o f i ts
importance in photosynthesis, has yet to be resolved. The absorption,
trans location , and photosynthetic f ix a t io n o f CC withdrawn from the
substrate, quite obviously confounding gas exchange measurements,
would re s u lt in underestimated photosynthesis determinations. CO2
uptake by the "roots" o f submerged plants may represent an adaptive
advantage in aquatic environments where free CO2 is l im i t in g ( i . e . ,
hard water lakes). Such a mechanism would also be valuable to emer
gent p lan ts, which might become lim ited by the atmospheric CO2 supply
during periods of calm a i r and active photosynthesis. I t is o f
course also possible that inadequacies o f the gas exchange method
i t s e l f were responsible fo r the d is p a r ity between gas exchange and
harvested estimates of production noted during the e arly summer.
As the magnitude of autotrophic resp ira tion becomes large
r e la t iv e to that o f heterotrophic re s p ira t io n , net primary
85
productiv ity (always greater than or equal to net ecosystem produc
t i v i t y ) can be approximated by metabolic estimates o f net ecosystem
productiv ity irresp ec tive o f export losses. Assuming tha t these two
productiv ity values approach equivalence in th is study during mid
to la te summer (the period o f maximum autotrophic re s p ira t io n ) ,
to ta l net primary p rod uctiv ity a t th a t time can be roughly estimated
on the basis o f the in tegrated d ifference between assim ilation and
resp iration curves (Figure 4 ) . Algal net primary production (^ C
estimate) during th is period explains only about 60% of to ta l net
primary production, ca lculated on the basis o f the above argument,
thus underestimated (harvest estimate) la te season net production
by the macrophytes is ind icated.
A uto ly tic release o f dissolved organic matter (D.O.M.) by
Scirpus subterminal is has been shown to represent a very s ig n if ic a n t
portion o f the net production (Otsuki and Wetzel, 1974). In that
study, estimates were made under both aerobic and anaerobic condi
t io n s , and 30 to 40% losses were reported to have occurred w ith in
5 days a f te r tissue death. Since the biomass (harvest) technique is
l im ited to the measurement o f large p a r t ic u la te matter ( l iv in g bio
mass and nondecomposed l i t t e r ) , the release and turnover o f D.O.M.,
o rig ina tin g from newly formed macrophyte l i t t e r v ia a u to ly t ic and
(o r) microbial processes, may have resulted in an underestimate of
macrophyte net production.
The excretion o f D.O.M. by l iv in g submersed macrophytes
has also been shown to be q u a n t i ta t iv e ly important to the measure
ment o f photosynthetic rates (W etzel, 1969; Wetzel and Manny, 1971).
86
I feel th a t excretory losses of D.O.M. from the l iv in g shoots were
probably unimportant in the dune pond however, since nearly 70% of
the shoot biomass was normally located above the a ir -w a te r in te r
face. Speculation on below ground D.O.M. loss lacks substantia tion ,
since data on th is p o s s ib i l i ty is nonexistant. Organic leakage from
th is very important frac t io n o f the macrophyte biomass, might a ffo rd
a c o l la te ra l explanation, in addition to those already proposed fo r
the mid through la te summer depletion o f below ground storage, as
well as resu lt ing in a p o te n t ia l ly underestimated determination of
macrophyte p rod uctiv ity .
Comparisons With Other Studies
Total net primary production estimates, based on deta iled
analysis o f the p rod uctiv ity o f component autotrophic populations,o
are r e la t iv e ly few. Total annual production (126.8 gmC/m ) fo r the
dune pond is approximately 2 .5 times less than th a t estimated fo r
eutrophic Borax Lake (W etzel, 1964), but is comparable to o ligo trophic
Lawrence Lake, the to ta l annual production o f which was estimated at
171.2 gmC/m (Wetzel e t a l . , 1972). Compared on the same basis, i t
appears tha t production w ith in a rc t ic ponds (S tanley, 1974), s im ila r
in s ize and depth to the dune pond, is approximately 5 times less
than the dune pond estimate. The production hierarchy o f autotrophic
components w ith in the dune pond (macrophytes > periphyton > phyto
plankton) is also c h a ra c te r is t ic o f a rc t ic ponds, and th is pattern
l i k e ly applies to the m ajority of shallow systems, in which macrophyte
establishment is not impeded.
87
Expressed on the basis o f dry weight using appropriate
conversion fa c to rs , to ta l net primary production in the dune pond2
can be approximated a t 300 gm/m annually. This value is comparable
to values suggested by Whittaker (1970) fo r temperate grassland and
continental s h e lf ecosystems.
A review o f plant productiv ity by Westlake (1963), sum
marizes some o f the data a va ilab le on phytoplankton production.2
Annual production o f phytoplankton in the dune pond (17.0 gmC/m )
is approximately 25% of suggested values fo r ocean and lake phyto
plankton, and only 15% of the value suggested fo r coastal phytoplank
ton. Comparisons on an areal basis can be misleading however,
p a r t ic u la r ly in shallow lakes and ponds since the volume of water
overlying a given un it o f area is often much less than the euphotic
equivalent in deeper basins. Expressed on a volumetric basis,
annual phytoplankton production in the pond can be approximated a t3
41.5 gmC/m , which probably exceeds production o f phytoplankton in
many lakes and in the open ocean.
The importance o f l i t t o r a l producers ( i . e . , macrophytes
and periphyton) in basins having a morphometry such tha t the ra t io
o f colonizable l i t t o r a l zone to pelagic zone of production is la rge ,
must be reemphasized. Contributions by the macrophytes and periphyton
c o l le c t iv e ly accounted fo r approximately 87% o f the to ta l annual
production of the dune pond. The importance o f l i t t o r a l producers
has been s im ila r ly demonstrated in other basins. Treated c o l le c t iv e ly ,
production by the macrophytes and periphyton accounted fo r greater
than 70% o f to ta l annual production in Borax Lake (Wetzel, 1964),
88
Marion Lake (Hargrave, 1969), Lawrence Lake (Wetzel e t a l . , 1972),
Char Lake (Welch and K a l f f , 1974) and an a r c t ic pond (Stanley,
1974). Since the m ajority o f the lakes o f the world are small and
have large l i t t o r a l surfaces ava ilab le fo r co lo n iza tio n , the impor
tance o f macrophyte vegetation and l i t t o r a l m icroflora cannot be
ignored in studies concerning lake ecosystem structure and function.
LITERATURE CITED
LITERATURE CITED
American
A nita , N
Backhaus
Bernard,
Bernard,
Bordeau,
Boyd, C.
Bray, J.
Bristow,
Bristow,
Public Health Association, American Water Works Association, Water Pollu tion Control Federation. 1971. Standard methods fo r the examination o f water and wastewater including bottom sediments and sludges. 13th Ed. American Public Health Association. New York. 769 pp.
J . , and others. 1963. Further measurements o f primary production using a large volume p la s t ic sphere. Limnol. Oceanogr. 8:166-183.
D. 1967. Okologische Untersuchungen an den Aufwuchsalgen der opersten Donau und ih re r Q uellflusse. I . Vorunter- suchungen. Arch. Hydrobiol. Suppl. 30:364-399.
J. M. 1974a. Seasonal changes in standing crop and primary production in a sedge wetland and an adjacent dry o ld - f ie ld in Central Minnesota. Ecol. 55:350-359.
J. M. 1974b. Primary production and l i f e history o f Carex la c u s tr is . Can. J. Bot. 52:117-123.
P. F . , and G. M. Woodwell. 1965. Measurements o f plant carbon dioxide exchange by in frared absorption under cont ro l le d conditions and in the f ie ld . In Methodology o f Plant Eco-Physiology, Proceedings o f the M ontpellier symposium, UNESCO. Paris, pp. 283-289.
E. 1971. The dynamics of dry matter and chemical substrates in a Juncus effusus population. Am. Midi. Nat. 86:28-45.
R. 1961. An estimate o f a minimum quantum y ie ld o f photosynthesis based on ecologic data. Plant Physiol. 36:371-373.
J. M. 1969. The e ffec ts o f carbon dioxide on the growth and development of amphibious plants. Can. J. Bot. 47:1803-1807.
J. M. and M. Whitcombe. 1971. The ro le o f roots in the n u tr i t io n o f aquatic vascular p lants. Amer. J. Bot.58:8-13.
89
90
Brown, W.
Brown, S.
Clarke, G
Cowles, H
Coyne, P.
Cummins,
Cummins,
Doty, M.
Doty, M.
Emerson,
Fasset, N
Forbes, S
Forsberg,
Gaarder,
Goldman,
H. 1913. The re la t io n o f the substratum to the growth o f El odea. P h ilip in e J. Sci. ser. C. 8 :1 -20 .
D. and A. P. Austin. 1973. Diatom succession and in t e r action in l i t t o r a l periphyton and plankton. Hydrobiologia 43:333-356.
. L. 1946. Dynamics o f production in a marine area.Ecol. Monogr. 16:232-335.
. C. 1899. The ecological re la tions o f the vegetation on the sand dunes o f Lake Michigan. Bot. Gaz. 27:95-117, 167-202, 281-308, 361-391.
I . and J. J. Kelley. 1974. Carbon dioxide p a r t ia l pressures in a rc t ic surface waters. Limnol. and Oceanog. 19:928-938.
K. W. and J. C. Wuycheck. 1971. Caloric equivalents fo r investigations in ecological energetics. M i t t . In te rn a t. Verein. Limnol. 18:1-158.
K. W. 1974. Structure and function o f stream ecosystems. Bio. Sci. 24:631-641.
S. and M. Oguri. 1957. Evidence fo r a photosyntheticd a ily p e r io d ic ity . Limnol. Oceanogr. 2:37-40.
S. and Oguri. 1959. The carbon-fourteen technique fo r determining primary plankton p ro d u ctiv ity . Publ. Staz.Zool. Napoli, Suppl. 31:70-94.
S . , W. Broecker, D. W. Schindler. 1973. Gas exchange rates in a small lake as determined by the radon method. J.Fish. Res. Bd. Can. 28:139-155.
. C. 1957. A manual o f Aquatic Plants. The U niversity o f Wisconsin Press. Madison, Wisconsin. 405 pp.
. A. 1887. The lake as a microcosm. Republished 1925. I l l i n o i s Nat. H is t. Surv. B u ll. 15:537-550.
C. 1959. Quantitive sampling of subaquatic vegetation. Oikos 10:233-240.
T . , and H. H. Gran. 1927. Investigations o f the production o f plankton in Oslo Fjord. J. Cons. In te rn . Explor. Mer. 42:1-48.
C. R . , D. T. Mason, and B. J. B. Wood. 1963. Light in ju ry and in h ib it io n in A ntarctic freshwater phytoplankton. Limnol. and Oceanog. 8:313-322.
91
Goldman, C. F. 1968. The use of absolute a c t iv i t y fo r e lim inating serious errors in the measurement o f primary prod uctiv ity with C-14. J. Cons. perm. in t . Explor. Mer. 32:172-179.
Goldsworthy, A. 1970. Photorespiration. Bot. Rev. 36:321-340.
Hargrave, B. T. 1969. Epibenthic algal production and communityresp iration in the sediments o f Marion Lake. J. Fish.Res. Bd. Can. 26:2003-2026.
Hartman, R. T. and D. L. Brown. 1967. Changes in the in terna latmosphere o f submersed vascular hydrophytes in re la t io n to photosynthesis. Ecology 48:252-258.
Hatch, M. D . , C. B. Osmond, and R. D. S lay ter Eds. 1971. Photosynthesis and photorespiration. Wiley. New York. 565 pp.
Heath, 0. V. S. 1969. The Physiological Aspects o f Photosynthesis.London. Heinemann. 310 pp.
Hough, R. A . , and R. G. Wetzel. 1972. A ^ C assay fo r photoresp iration in aquatic p lants. Plant Physiol. 49:987-990.
Hough, R. A. 1974. Photorespiration in aquatic p lants. Limnol. and Oceanog. 19:912-927.
Hunding, C, and B. T. Hargrave. 1973. A comparison of benthicmicroalgal production measured by the 14c and oxygen methods. J. Fish. Res. Bd. Canada. 30:309-312.
Hutchinson, G. E. 1957. A t re a t is e on limnology. Vol. I Geography, physics, and chemistry. John Wiley and Sons, Inc. New York. 1015 pp.
Jassby, A. D. and C. R. Goldman. 1974. Loss rates from a lake phytoplankton community. Limnol. Oceanog. 19:618-627.
Jonasson, P. M. and H. Mathiesen. 1959. Measurements o f primaryproduction in two Danish eutrophic lakes, Esrom S and Fures. Oikos 10:137-167.
Jorgensen, E. G. 1957. Diatom p e r io d ic ity and s il ic o n ass im ila tion . Danskbot. Ark. 18(1) 55 pp.
J e rv is , R. A. 1969. Primary production in the freshwater marsh ecosystem of Troy Meadows, New Jersey. B u ll . Torrey Bot. Club 96:209-231.
Kondratyev, K. Ya. 1969. Radiation In The Atmosphere. Academic Press. New York. 912 pp.
92
Lasker, R. and R. W. Holmes. 1957. V a r ia b i l i t y in retention of marine phytoplankton by membrane f i l t e r s . Nature 180: 1295-1296.
Lemon, E . , L. H. Allen J r . , and L. M uller. 1970. Carbon dioxide exchange of a trop ica l rain fo re s t. Part I I . Biosci. 20:1054-1059.
Lindeman, R. L. 1942. The trophic-dynamic aspect o f ecology.Ecology 23:399-418.
Margalef, Ramon. 1968. Perspectives in Ecological Theory. University of Chicago Press. Chicago. 112 pp.
Mathews, C. P. and D. F. Westlake. 1969. Estimation of production by populations o f higher plants subject to high m o rta lity . Oikos 20:156-160.
M cA llis te r , C. D ., N. Shah, J. D. H. S tr ick land . 1964. Marine phytoplankton photosynthesis as a function o f l ig h t in ten s ity : a comparison o f methods. J. Fish. Res. Bd.Can. 21:159-181.
M c D iffe tt , Wayne F . , A. E. Carr, and D. L. Young. 1972. An estimate of primary production in a Pennsylvania tro u t stream using a diurnal oxygen curve technique. Amer. Midland Nat.8 7 (2 ) :564-570.
M c ln tire , C. D. and H. K. Phinney. 1965. Laboratory studies of periphyton production and community metabolism in lo t ic environments. Ecol. Monogr. 35:237-258.
Mcleod, K. W. 1974. Survival strategy of Ptelea t r i f o l i a t a during establishment on Lake Michigan sand dunes. A Ph.D. d is se rta t io n . Michigan State University .
McNaughton, S. J. 1973. Comparative photosynthesis o f Quebec andC a lifo rn ia ecotypes o f Typha l a t i f o l i a . Ecol. 54:1260-1270.
M ilthorpe, F. L. and J. Moorby. 1974. An Introduction to CropPhysiology. Cambridge University Press. New York. 202 pp.
Mooney, H. A . , E. L. Dunn, A. T. Harrison, P. A. Morrow, B. Bartholomew, and R. L. Hays. 1971. A mobile laboratory fo r gas exchange measurements. Photosynthetica 5:128-132.
Odum, E. P. 1962. Relationships between structure and function in the ecosystem. Japan J. Ecol. 12-108-118.
Odum, E. P. 1963. Primary and secondary energy flow in re la t io n to ecosystem structure . Proc. 16th In t . Cong. Zool. 4:336-338.
93
Odum, H. T. 1956. Primary production in flowing waters. Limnol.Oceanog. 1:102-117.
Odum, H. T. 1957. Trophic structure and p roductiv ity o f S i lv e rSprings. Ecol. Monogr. 27:55-112.
Olson, J. S. 1958. Rates o f succession and soil changes on southern Lake Michigan sand dunes. Bot. Gaz. 119:125-170.
Osman, A. M ., and F. L. Milthorpe. 1971. Photosynthesis o f wheatleaves in re la t io n to age, illuminance and n u tr ien t supply.I I . Results. Photosynthetica 5:61-70.
Ots^ki, A. and R. G. Wetzel. 1974. Release o f dissolved organic matter by autolysis o f a submersed macrophyte, Scirpus subterminal i s . Limnol. Oceanogr. 19:842-845.
Pamatmat, M. M. 1968. Ecology and metabolism o f a benthic community on an in te r t id a l sandfla t. In t . Rev. Hydrobiol. 53:211-298.
Penfound, W. T. 1956. Primary production of vascular aquatic plants. Limnol. Oceanogr. 1:92-101.
Pieczynska, E. and I . Spodniewska. 1963. Occurrence and colonizat ion o f periphyton organisms in accordance with the type o f substrate. Ekologia Polska. Ser. A. 11:533-545.
Pomeroy, L. R. 1959. Algal p roductiv ity in s a lt marshes o f Georgia. Limnol. and Oceanog. 4:386-397.
Rabinowitch, E. I . 1951. Photosynthesis and re la ted processes.Vol. I . In terscience. New York. 599 pp.
Rich, P. H , , R„ G. Wetzel, and N. V. Thuy. 1971. D is tr ib u t io n ,production, and ro le o f aquatic macrophytes in a southern Michigan marl lake. Freshwat. B io l. 1 :3-21.
Ruttner, F. 1952. Fundamentals o f Limnology. U niversity o f Toronto Press. Toronto, Canada. 295 pp.
Ryther, J. H. 1954. The ra t io o f photosynthesis to resp ira tion in marine plankton algae and i ts e f fe c t upon the measurement o f p roductiv ity . Deep-Sea Res. 2:134-139.
Schindler, D. W., G. J. B ru n sk ill , S. Emerson, W. Broecker, and T. H. Peng. 1972. Atmospheric carbon dioxide: i t s ro le in maintaining phytoplankton standing crops. Science 177: 1192-1194.
Schindler, D. W. and E. J. Fee. 1973. Diurnal va ria t io n o f dissolved inorganic carbon and i ts uye in estimating primary production and CO2 invasion in lake 227. J. Fish. Res. Bd. Can. 30:1501-1510.
94
Sculthorpe, C. D. 1967. The Biology of Aquatic Vascular Plants. Edward Arnold (Publishers) Ltd. London. 610 pp.
Shelford, V. E. 1911. Ecological succession. I I . Pond fishes. B io l. B u ll. 21:127-151.
Singh, J. S. and D. C. Coleman. 1974. D is tr ib u tio n o f photoassimilated '^carbon in the root system o f a shortgrass p r a ir ie . J. o f Ecol. 62:359-366.
Smith, A. E. and C. L. Leinweber. 1971. Relationship o f carbohydrate trend and morphological development o f l i t t l e bluestem t i l l e r s . Ecol. 52:1052-1057.
Stanley, D. W. 1974. Production ecology o f ep ip e l ic algae in Alaskan tundra ponds. A Ph.D. d iss e rta t io n . North Carolina State University .
Steemann Nielsen, E. 1951. Measurement o f the production oforganic matter in the sea by means o f carbon 14. Nature167:684-685.
/ 14\Steemann Nielsen, E. 1952. The use o f rad ioactive carbon (C ) fo rmeasuring organic production in the sea. J. Cons. in t .Expl. Mer. 18:117-140.
Steemann Nielsen, E. 1955. The in te rac tio n o f photosynthesis and -j resp iration and i ts importance fo r the determination o f C discrim ination in photosynthesis. Physiol. P lant. 8:945-953.
S tr ick land , J. D. H. 1960. Measuring the production o f marinephytoplankton. B u ll. Fish. Res. Bd. Can. 122. 172 pp.
T a i l in g , J. F. 1957. Photosynthetic cha rac te r is t ic s o f some freshwater plankton diatoms in re la t io n to underwater rad ia tio n . New Phytol. 56:29-50.
T a i l in g , J. F. 1961. Photosynthesis under natural conditions. Ann. Rev. Plant Physiol. 12:133-154.
T ea l, J. M. 1957. Community metabolism in a temperate cold spring. Ecol. Monogr. 27:283-302.
Thomas, M. D. 1955. E ffect o f ecological factors on photosynthesis. Ann. Rev. Plant Physiol. 6:135-156.
T i l l y , L. J. 1968. The structure and dynamics o f cone spring. Ecol Monogr. 38:168-197.
T ip p e tt , R. 1970. A r t i f i c i a l surfaces as a method o f studyingpopulations o f benthic micro-algae in fresh water. B r i t . Phycol. J. 5:187-199.
U. S. Department o f Commerce. N0AA--National Ocean Survey, Lake Survey Center. 630 Federal Building, D e tro it , Michigan.
Verduin, J. 1952. The volume based photosynthetic rates o f aquaticplants. Amer. J. Bot. 39:157-159.
Verduin, J. 1956. Primary production in lakes. Limnol. Oceanog.1:85-91.
Vollenweider, R’. A. (E d .) . 1969. A Manual on Methods fo r MeasuringPrimary Production in Aquatic Environments. Section 3.31. Blackwell S c ie n t i f ic . Oxford and Edinburgh. 213 pp.
Welch, H. E. and J. K a l f f . 1974. Benthic photosynthesis and resp ira tion in Char Lake. J, Fish. Res. Bd. Can. 31:609-620.
Westlake, D. F. 1963. Comparisons o f p lant p rod uctiv ity . B io l. Rev. 38:385-425.
Westlake, D. F. 1965. Some basic data fo r investigations of the productiv ity o f aquatic macrophytes. Mem. 1st. I t a l . Id ro b io l . 229-248.
Westlake, D. F. 1966. The biomass and prod uctiv ity o f Glyceriamaxima I . Seasonal changes in biomass. J. Ecol. 54:745-753.
Westlake, D. F. 1968. Methods used to determine the annual production of reedswamp plants with extensive rhizomes. InMethods o f p rod uctiv ity studies in rootsystems and rh izo - spere organisms. IBP Root Symposium. Moscow. 1968. 226-234. Navka, Moscow.
R. G. 1964. A comparative study of the primary productiv ity of higher aquatic p lan ts , periphyton, and phytoplankton in a large shallow lake. In t . Rev. ges. Hydrobiol. 49:1-61.
14R. G. 1965a. Necessity fo r decontamination of f i l t e r s in C measured rates o f photosynthesis in fresh waters. Ecology 46:540-542.
R. G. 1965b. Techniques and problems o f primary product i v i t y measurements in higher aquatic plants and periphyton. Mem. Ins. Id ro b io l. Suppl. 18:147-165.
R. G. 1966. Variations in productiv ity o f Goose and hyper- eutrophic Sylvan Lakes, Indiana. Invest. Indiana Streams 7:147-184.
Wetzel,
Wetzel,
Wetzel,
Wetzel,
96
Wetzel, R. G. 1969. Factors in fluencing photosynthesis and excretion of dissolved organic matter by aquatic macrophytes in hard water lakes. In t . Ver. Angew. Limnol. Verh. 17:72-85.
Wetzel, R. G. and B. A. Manny. 1971. Secretion of dissolvedorganic carbon and nitrogen by aquatic macrophytes. In t . Ver. Theor. Angew. Limnol. Verh. 18:162-170.
Wetzel, R. G ., P. H. Rich, M. C. M i l le r , and H. L. A llen . 1972.Metabolism o f dissolved and p a r t ic u la te d e t r i t a l carbon in a temperate hard-water lake. Men. 1st. I t a l . Id ro b io l. 29: Suppl. : 185-243.
Wetzel, R. G. and R. A. Hough. 1973. Productiv ity and the ro le of aquatic macrophytes in lakes: An assessment. Pol. Arch.Hydrobiol. 20:9-19.
Whittaker, R. H. 1970. Communities and ecosystems. Macmillan Company. Toronto, Canada. 158 pp.
Wilson, D. and J. P. Cooper. 1969. Apparent photosynthesis and le a f characters in re la t io n to le a f position and age, among contrasting Lolium genotypes. New Phyto l. 68:645-655.
Wium-Anderson, S. 1971. Photosynthetic uptake o f free CO2 by the roots o f Lobelia dormanna. Physiol. P lant. 25:245-248.
Woodwell, G. M. and R. H. Whittaker. 1968. Primary production in t e r r e s t r ia l communities. Amer. Zool. 8 :19-30.
Z e l i tc h , I . 1971. Photosynthesis, photoresp iration, and plant prod u c t iv i ty . Academic press. 347 pp.