Embed Size (px)
Citation preview
04/18/23 22:02
XDAP2004-TokXra-11/15 1
K.B. Fournier, M. Finkenthal1, M.J. May, M. Mattioli2, S.B. Hansen and W.H Goldstein Lawrence Livermore National Laboratory
presented at theX-ray Diagnostics for Astrophysical Plasmas Workshop,
Cambridge, MA, 15-17 November 2004
Work performed under the auspices of the United States Department of Energy by the University of California Lawrence Livermore National Laboratory under contract number W-7405-ENG-48.
Application of Laboratory Experiments and Atomic Physics Modeling to Astrophysical Observations
1 Permanent Address: The Johns Hopkins University, Baltimore, MD 21218, USA2 Permanent Address: Consorzio RFX, Corso Stati Uniti 4, Padova, I-35127, Italy

04/18/23 22:02
XDAP2004-TokXra-11/15 2
Introduction - Motivations
• X-rays from 60 eV to 8 keV probe conditions in everything from the local
ISM to the farthest cosmic objects…• Each spectral band, and the corresponding types of ions (M-shell, L-shell
and K-shell) that emit in that band have their unique challenges:
- absorption and extinction
- differing excitation mechanisms (resonances, cascades, photopumping, …)
- computational challenges for complex atomic structure (ie. accuracy!)
• Spectral resolution and effective areas are continuously improving and increasing
for x-ray telescopes• Line blends must be quantified at a new level of precision (requires complete AND
accurate data sets) as interesting, informative weak lines come out of the noise• This is our emphasis in on going laboratory investigations: in particular,
we are starting a new multi-year program to get high-resolution composite
spectra in the 10 - 200Å range.
Nov 02 - 3.5mm defocus, converg. -> 540 um beam waist at center -> 860 um overlap region
June 03 - 5.5 to 14.2 mm defocus, converg. -> 700 - 2120 um beam waist at center -> 940 um overlap region
Nov 02 - I_total = 7.8x10^15 W/cm^2 (39*2.E14)
June 03 - I_total = 2.3x10^15 W/cm^2 (4 beam groups)
TS in Nov 02 - 2w beam pointed at edge of bag -> T_e ~ 1.6keV
TS in June 03 - 4w beam pointed at center of bag -> Te ~ 3.5keV (0.5 - 0.8ns), 2keV (1.25 - 1.3ns)

04/18/23 22:02
XDAP2004-TokXra-11/15 3
Introduction - Our goals
• Our emphasis is on furthering laboratory investigations: in particular, we
are starting a new multi-year program to get high-resolution composite
spectra in the 10 - 200Å range.
• We will get high resolution composite spectra in the 10-200Å (10-40Å)
range.• We will resolve blending problems by sophisticated atomic structure
calculations and • We plan to interpret the brightness of individual lines in terms of
measured electron temperatures and densities.
Nov 02 - 3.5mm defocus, converg. -> 540 um beam waist at center -> 860 um overlap region
June 03 - 5.5 to 14.2 mm defocus, converg. -> 700 - 2120 um beam waist at center -> 940 um overlap region
Nov 02 - I_total = 7.8x10^15 W/cm^2 (39*2.E14)
June 03 - I_total = 2.3x10^15 W/cm^2 (4 beam groups)
TS in Nov 02 - 2w beam pointed at edge of bag -> T_e ~ 1.6keV
TS in June 03 - 4w beam pointed at center of bag -> Te ~ 3.5keV (0.5 - 0.8ns), 2keV (1.25 - 1.3ns)

04/18/23 22:02
XDAP2004-TokXra-11/15 4
Introduction - Important processes in x-ray astrophysics
• Ionization• Electron/proton collisions• Photoionization• Innershell ionization
• Excitation/De-excitation• Electron/proton collisions• Photoexcitation• Radiative decay/cascades
Nov 02 - 3.5mm defocus, converg. -> 540 um beam waist at center -> 860 um overlap region
June 03 - 5.5 to 14.2 mm defocus, converg. -> 700 - 2120 um beam waist at center -> 940 um overlap region
Nov 02 - I_total = 7.8x10^15 W/cm^2 (39*2.E14)
June 03 - I_total = 2.3x10^15 W/cm^2 (4 beam groups)
TS in Nov 02 - 2w beam pointed at edge of bag -> T_e ~ 1.6keV
TS in June 03 - 4w beam pointed at center of bag -> Te ~ 3.5keV (0.5 - 0.8ns), 2keV (1.25 - 1.3ns)
•Recombination• Dielectronic• Radiative• Charge exchange• 3-body
• Laboratory observations have the capabilities to • catolog lines and study/deconvolve line blends
• benchmark Ne and Te diagnostic lines and ratios
• look at ionization-equilibria emisison spectra• look at non-thermal effects

04/18/23 22:02
XDAP2004-TokXra-11/15 5
Vacuum vessel
Position control coil
Primary coil
Tokamaks are important tools for MFE research and laboratory astrophysics
ASDEX Upgrade in Da light Tokamak magnetic geometry
Image from http://www.ipp.mpg.de/ipp/ipp.eng.html
Bp
Ip
BT
R
a
BZ
Primary current
Torriodal fieldcoil
04/18/23 22:02
XDAP2004-TokXra-11/15 6
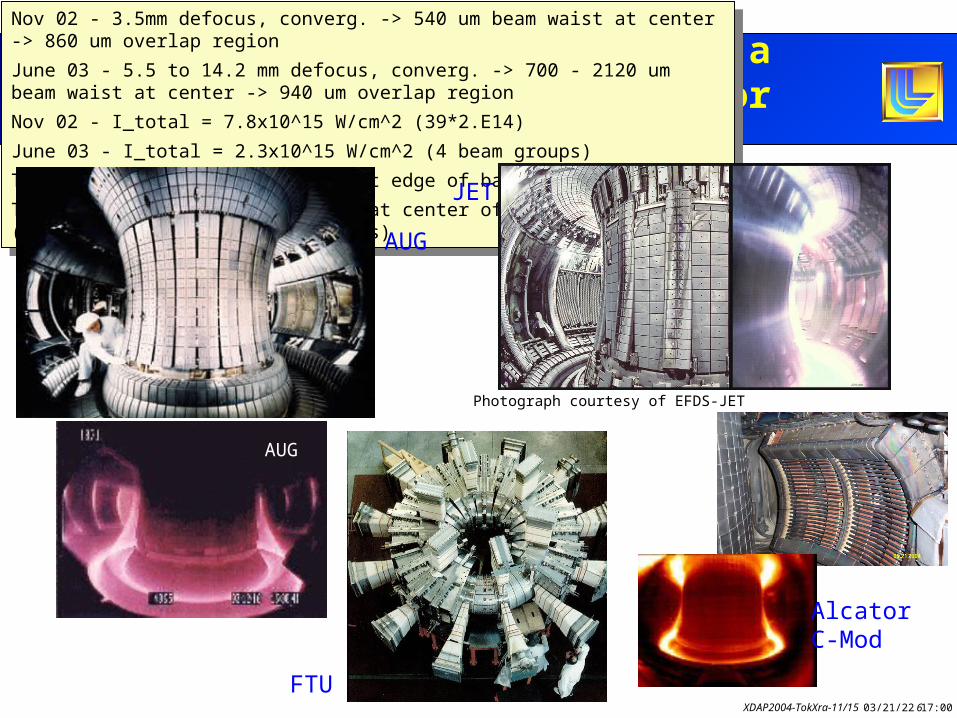
Tokamaks around the world offer a range of sizes and parameters for experiments
Nov 02 - 3.5mm defocus, converg. -> 540 um beam waist at center -> 860 um overlap region
June 03 - 5.5 to 14.2 mm defocus, converg. -> 700 - 2120 um beam waist at center -> 940 um overlap region
Nov 02 - I_total = 7.8x10^15 W/cm^2 (39*2.E14)
June 03 - I_total = 2.3x10^15 W/cm^2 (4 beam groups)
TS in Nov 02 - 2w beam pointed at edge of bag -> T_e ~ 1.6keV
TS in June 03 - 4w beam pointed at center of bag -> Te ~ 3.5keV (0.5 - 0.8ns), 2keV (1.25 - 1.3ns)
JET
AUG
FTU
Alcator C-Mod
Photograph courtesy of EFDS-JET
AUG

04/18/23 22:02
XDAP2004-TokXra-11/15 7
-1
0
1
2
3
4
0.60 0.70 0.80 0.90 1.0 1.1 1.2 1.3major radius (m)
Te (keV)
Ne (m-3)
0 100
2 1019
4 1019
6 1019
8 1019
1 1020
0.0 0.20 0.40 0.60 0.80 1.0 1.2 1.4 1.6time (s)
Te (keV)N
e (m-3)
Electron temperature and density profiles and histories for a typical FTU discharge
Temperature and density histories Temperature and density profiles
Te (keV
)de
nsity
(cm
-3)
Impurity injections can be made during stationary condition
time (s) major radius (m)
Accurate to 10% Accurate to 10%

04/18/23 22:02
XDAP2004-TokXra-11/15 8
Observed L-shell lines serve as local density diagnostics in stellar coronae
90 100 110 120 130 140
wavelength (Å)
0.0
0.5
1.0
1.5
2.0
2.5
3.0
3.5
90 100 110 120 130 140
wavelength (Å)
simulation at log(Te)=7.0
Pre-injection background signal subtracted from data
K.B. Fournier, et al., ApJ 561, 1144 (2001)
Fe L-shell n=0 spectra (absolute units) HULLAC simulation at resolution
04/18/23 22:02
XDAP2004-TokXra-11/15 9
0.0
0.1
0.2
0.3
0.4
0.5
0.6
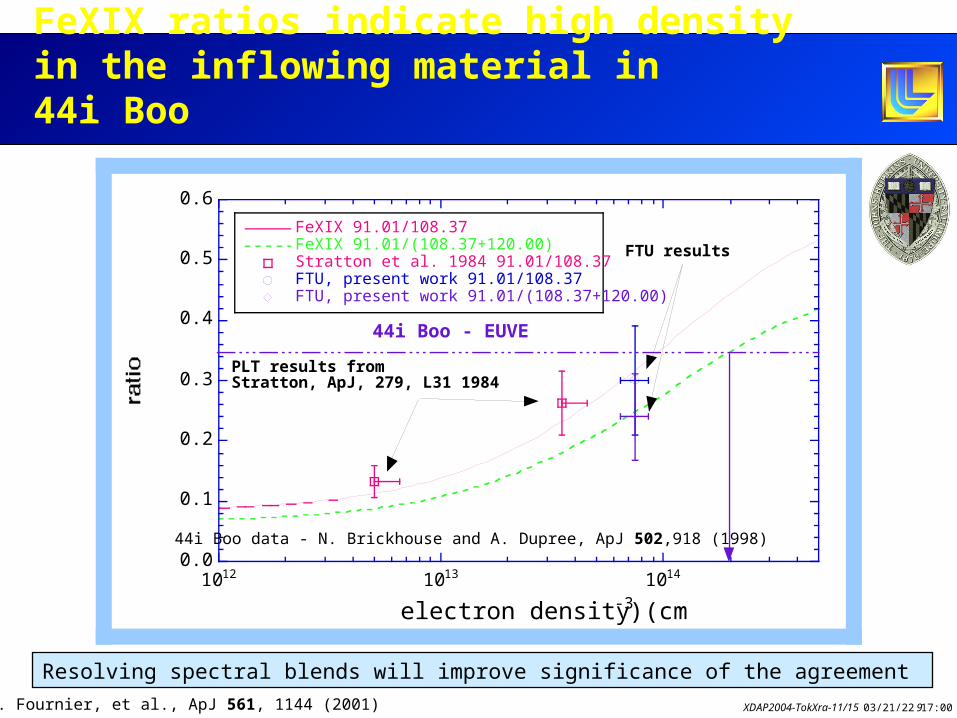
1012 1013 1014
FeXIX 91.01/108.37FeXIX 91.01/(108.37+120.00)Stratton et al. 1984 91.01/108.37FTU, present work 91.01/108.37FTU, present work 91.01/(108.37+120.00)
electron density (cm-3)
44i Boo - EUVE
PLT results from Stratton, ApJ, 279, L31 1984
FTU results
FeXIX ratios indicate high density in the inflowing material in 44i Boo
Resolving spectral blends will improve significance of the agreement
44i Boo data - N. Brickhouse and A. Dupree, ApJ 502,918 (1998)
K.B. Fournier, et al., ApJ 561, 1144 (2001)

04/18/23 22:02
XDAP2004-TokXra-11/15 10
Thermal plasmas can be used to study Fe K-shell ionization balance and spectral line strengths
Data courtesy of M. Leigheb, http://efrw01.frascati.enea.it/Documents/TaskForcesFTU/Spectroscopy/CEAENEA
Fe K-shell lines will be discussed at length by others at this meeting(from titles alone): Palmeri, Beiersdorfer, Liedahl, Jacobs, Rozanska
Bent crystal spectrometer:Spectral resolution ≥ 10000time resolution = 140 ms possible to select among eight different wavelength ranges
Ti = 12.8MKTe = 25.5MKnH:nHe:nLi ::0.02:1.0:0.6

04/18/23 22:02
XDAP2004-TokXra-11/15 11
Atomic data are tested by studies of high-n Rydberg series under controlled conditions
Ar16+ high-n x-ray lines and satellites for three satellite groups in Ar15+
J. Rice, et al., NJP 1, 19.1-19.27 (1999)

04/18/23 22:02
XDAP2004-TokXra-11/15 12
Precise fits to spectral lines are possible with complete data sets
Observed Ar16+ 1-4 spectrum plus blends
Ar16+ satellites to Ly: 1s2s 1S0 - 2p3s 1P1 and 1s2p 1P1 - 2p3p 1D2
Ar16+ intercombination line: 1s2 1S0 - 1s4p 3P1
Ar15+ W5 satellite lines: 1s22p J - 1s2p5p J’
J. Rice, et al., NJP 1, 19.1-19.27 (1999)
Blends within an element’s spectra are handled with high-resolution (and nicely with an EBIT), blends between different elements are handled by time-resolved, controlled injections

04/18/23 22:02
XDAP2004-TokXra-11/15 13
Electron temperature during rampdown is essentially gradient free over large volume
0.0 100
4.0 102
8.0 102
1.2 103
1.6 103
2.0 103
10.00 15.00 20.00 25.00 30.00
minor radius (cm)
Steady state temperature profile
ramp-down temperature profile
M.J. May, et al., Nucl. Fusion 42, 1299 (2002)
log(Te(K))=5.9

04/18/23 22:02
XDAP2004-TokXra-11/15 14
0.00.20.40.60.81.0
4 5 6 7 8 9
ion fraction
log(Te K)
FeXVIIFeXVIFeXVIII
4 5 6 7 8 9
FeIXFeVIIIFeX
Ionization equilibrium calculations are essential for interpreting spectroscopic data
Calculations must include multi-step processes (EA and DR)
M. Arnaud and J. Raymond, ApJ, 398, 394 (1992)
Ion
frac
tion

04/18/23 22:02
XDAP2004-TokXra-11/15 15
0.0
0.2
0.4
0.6
0.8
1.0
170.0 175.0 180.0 185.0 190.0 195.0 200.0 205.0
wavelength (Å)
Fe XXIV
0.0
0.2
0.4
0.6
0.8
1.0
160.0 170.0 180.0 190.0 200.0 210.0
wavelength (Å)
0.0
0.2
0.4
0.6
0.8
1.0
0.0
0.2
0.4
0.6
0.8
1.0
Measured M-shell iron spectrum is a sensitive thermometer
Log(Te)=5.9
Log(Te)=6.0
Log(Te)=6.1
• Ramp-down plasma temperature profile is measured to be nearly single valued• Ionization equilibration times are 10’s of s, much faster than changes in plasma conditions• Measured volume-averaged temp <Te> = 7530 eV (log(Te)=5.94).
K.B. Fournier, et al., ApJ 550, L117 (2001)

04/18/23 22:02
XDAP2004-TokXra-11/15 16
Measured iron M-shell CSD and best simulation using updated atomic physics
0.00
0.05
0.10
0.15
0.20
0.25
0.30
6 7 8 9 10 11 12 13
experiment (#14623) FTU simulation
ion charge Feq+
Ca K Ar Cl S P Si Al
These observations confirm modeling codes used to compute emission measures
Possible inaccuracy in atomic data
K.B. Fournier, et al., ApJ 550, L117 (2001)

04/18/23 22:02
XDAP2004-TokXra-11/15 17
FeIX (171Å) is an important temperature diagnostic of the solar chromosphere
Image from http://umbra.nascom.nasa.gov/eit/eit_full_res.html 07Dec1999 19:00:15 SOHO - Extreme Ultraviolet Imaging Telescope
EIT SOHO image of the sun at 171Å
150.0 160.0 170.0 180.0 190.0 200.0 210.0 220.0
wavelength (Å)
FeIX (171Å)
no 3p 43d 2
FeIX (171Å)
with 3p 43d 2
FeXII (195Å)
Neglect of 3p43d2 in models leads to a 20% overestimate of the 171Å/195Å ratio
A-rate affected by CI

04/18/23 22:02
XDAP2004-TokXra-11/15 18
10-3
10-2
10-1
100
101
102
5.85 5.90 5.95 6.00 6.05 6.10 6.15 6.20 6.25
R(195.12Å/171.07Å)
Ratio w/out 3p43d2
R((195.12+195.14)/171)
log(Te)
Uncertainty in atomic data leads to a 3% uncertainty in Te from FeXII(195)/FeIX (171Å)
20% change in 171Å A-rate leads to only a 3 eV (out of ~100eV) uncertainty.

04/18/23 22:02
XDAP2004-TokXra-11/15 19
Recent CHIPS observations of FeIX M-shell emission indicate local ISM is out of equilibrium
ApJ Letter preprint at http://chips.ssl.berkeley.edu/AAS1.pdf
Solid- Charged particle backgroundDashed- “Canonical” local hot bubble model
FeIX 171Å
Recent work of Hurwitz, Sasseen and Sirk:
• Canonical models have the local cavity as filled (or partly filled) with a thermal (CIE) gas at 106 K.• Diffuse soft x-ray emission observations support this picture.• Substantial counts above the background in the bins covering FeX - FeXII should be seen.
• As a result, the EUV emitting gas must be at a temperature below 105.8 K; the reduced EM could be explained by depleted iron in a thermal plasma, or significant foreground absorption towards the source .
• The emission measure derived from the shown spectrum is an order of magnitude lower than inferred from the soft x-ray observations.

04/18/23 22:02
XDAP2004-TokXra-11/15 20
0.0
0.2
0.4
0.6
0.8
1.0
0.0
0.2
0.4
0.6
0.8
1.0
160.0 165.0 170.0 175.0 180.0 185.0 190.0 195.0
wavelength (Å)
M-shell simulations support CHIPS local ISM observations of log(Te)5.8 component
log(Te K) = 5.9
log(Te K) = 5.8
0.0
0.2
0.4
0.6
0.8
1.0
160.0 165.0 170.0 175.0 180.0 185.0 190.0 195.0
wavelength (Å)
log(Te K) = 5.7

04/18/23 22:02
XDAP2004-TokXra-11/15 21
Summary/Conclusions
• There exist many robust laboratory sources for producing astrophysically relevant data: EBITs, tokamaks, Z-pinches…• Control and knowledge of plasma parameters, independently of the measured spectra, is essential to benchmarking atomic data.• Flexibility in elements studied, and in plasma conditions, requires a diverse diagnostic suite, i.e., high-energy x-ray crystal spectrometers, grating-based spectrometers, calorimeters, etc.• Observations of complex ions, especially with limited spectral resolution, must be augmented with sophisticated spectral calculations.
• This means accurate atomic data, particularly to assess blends (levels), and to get excitation physics right (resonances). • Complete sets of atomic data (for CI, cascades, line catalog, etc.)• Models that account for all relevant processes (e.g., proton excitation, photo-excitation, charge exchange reactions)
• Progress is being made on all these fronts, driven by exciting new opportunities for x-ray observations of the near and distant universe.
04/18/23 22:02
XDAP2004-TokXra-11/15 22
Extra slides
04/18/23 22:02
XDAP2004-TokXra-11/15 23
The tokamak is an axi-symmetric vessel containing the fusion plasma while thermonuclear reactions take place
Nov 02 - 3.5mm defocus, converg. -> 540 um beam waist at center -> 860 um overlap region
June 03 - 5.5 to 14.2 mm defocus, converg. -> 700 - 2120 um beam waist at center -> 940 um overlap region
Nov 02 - I_total = 7.8x10^15 W/cm^2 (39*2.E14)
June 03 - I_total = 2.3x10^15 W/cm^2 (4 beam groups)
TS in Nov 02 - 2w beam pointed at edge of bag -> T_e ~ 1.6keV
TS in June 03 - 4w beam pointed at center of bag -> Te ~ 3.5keV (0.5 - 0.8ns), 2keV (1.25 - 1.3ns)
Ev
Ev x BB�
B�
�
Ro R
R
a
—B
r�
_
+
0
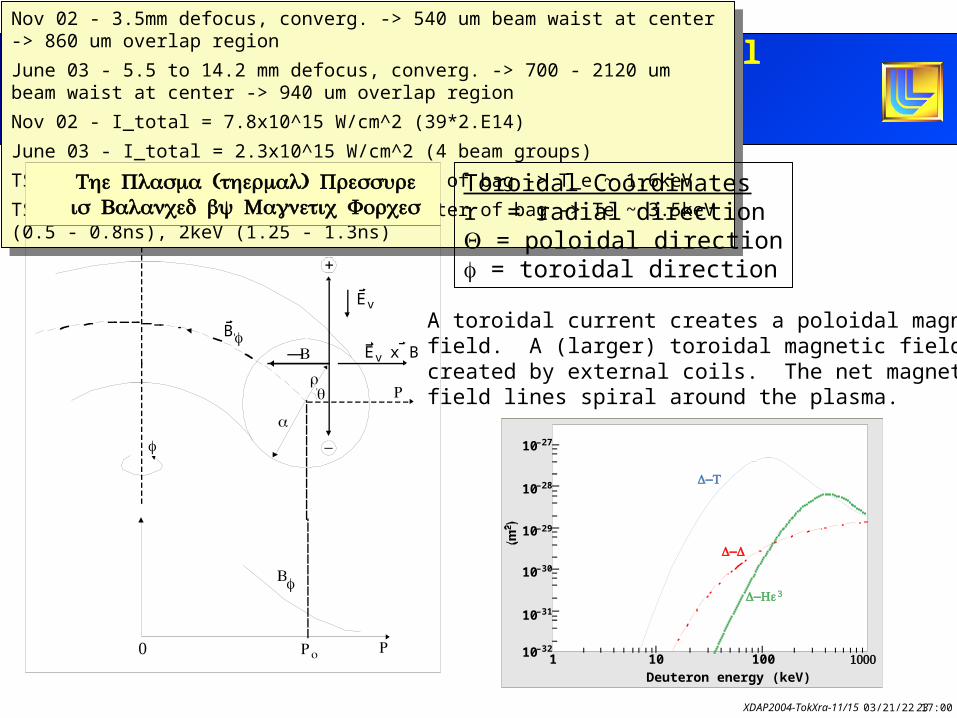
( ) The Plasma thermal Pressure is Balanced by Magnetic Forces
Toroidal Coordinatesr = radial direction = poloidal direction = toroidal direction
A toroidal current creates a poloidal magnetic field. A (larger) toroidal magnetic field is created by external coils. The net magnetic field lines spiral around the plasma.
10–27
10–28
10–29
10–30
10–31
10–321 10 100
Deuteron energy (keV)
Cross Sections For Nuclear ReactionsInvolving Hydrogen Isotopes and He3
The preferred reaction is 1D2 + 1T2 Æ 2He4 + 0n1
3.5 MeV 14.1 MeV
–D T
–D D
–D He3
1000
04/18/23 22:02
XDAP2004-TokXra-11/15 24
Cross section of a tokamak showing magnetic flux surfaces and regions of interest in the plasma
Nov 02 - 3.5mm defocus, converg. -> 540 um beam waist at center -> 860 um overlap region
June 03 - 5.5 to 14.2 mm defocus, converg. -> 700 - 2120 um beam waist at center -> 940 um overlap region
Nov 02 - I_total = 7.8x10^15 W/cm^2 (39*2.E14)
June 03 - I_total = 2.3x10^15 W/cm^2 (4 beam groups)
TS in Nov 02 - 2w beam pointed at edge of bag -> T_e ~ 1.6keV
TS in June 03 - 4w beam pointed at center of bag -> Te ~ 3.5keV (0.5 - 0.8ns), 2keV (1.25 - 1.3ns)
Target
Wall
LCFS(Separatrix)
Scrape-offlayer
Mainplasma
• Plasma-wall interactions take place in the scrape-off layer
• Plasma inside the LCFS is confined
• The majority of heating (Ohmic and auxillary) takes place on the axis
• The plasma is either shaped by an external limiter (not shown) or exhaused into a divertor strike plate
Alcator C-Mod in cross section

04/18/23 22:02
XDAP2004-TokXra-11/15 25
Measurements of radiative power losses and spectroscopy test NLTE models and contribute to the design of MFE facilities
Nov 02 - 3.5mm defocus, converg. -> 540 um beam waist at center -> 860 um overlap region
June 03 - 5.5 to 14.2 mm defocus, converg. -> 700 - 2120 um beam waist at center -> 940 um overlap region
Nov 02 - I_total = 7.8x10^15 W/cm^2 (39*2.E14)
June 03 - I_total = 2.3x10^15 W/cm^2 (4 beam groups)
TS in Nov 02 - 2w beam pointed at edge of bag -> T_e ~ 1.6keV
TS in June 03 - 4w beam pointed at center of bag -> Te ~ 3.5keV (0.5 - 0.8ns), 2keV (1.25 - 1.3ns)
Nov 02 - 3.5mm defocus, converg. -> 540 um beam waist at center -> 860 um overlap region
June 03 - 5.5 to 14.2 mm defocus, converg. -> 700 - 2120 um beam waist at center -> 940 um overlap region
Nov 02 - I_total = 7.8x10^15 W/cm^2 (39*2.E14)
June 03 - I_total = 2.3x10^15 W/cm^2 (4 beam groups)
TS in Nov 02 - 2w beam pointed at edge of bag -> T_e ~ 1.6keV
TS in June 03 - 4w beam pointed at center of bag -> Te ~ 3.5keV (0.5 - 0.8ns), 2keV (1.25 - 1.3ns) devil-gnol fo ecruos deziretcarahc lleW •
snoi Z-hgih gniniatnoc samsalp
fo stnemerusaem tnednepednI •ytisned dna erutarepmet
noituloser-hgih dna cirtemoloB • yltcerid stnemerusaem ypocsortceps
noitaticxe dna ecnalab noitazinoi tcelfersessecorp
sledoM lartcepS rof debtseT
lairetam Z-hgih fo stnenopmoc lacitirC •Fe, Mo, Au) ,.g.e(
eroc amsalp erutarepmet
nac )rK ,rA( seitirupmi fo noitcudortnI •gnidaol taeh lortnoc ot desu eb
stneiciffeoc gnilooc evitaidar rof sledoM •eerga ton od
EFM rof ecnacifingiS

04/18/23 22:02
XDAP2004-TokXra-11/15 26
Tokamak plasmas provide unique capabilities in terms of range of parameters and elements
• Controlled plasma (fueling, shaping, current profile, etc.)
• Well diagnosed conditions (105 ≤ Te(K) ≤ 108, 1012 ≤ Ne(cm-3) ≤ 1015) are known independently of impurity spectroscopy
• Controlled injections of any element

04/18/23 22:02
XDAP2004-TokXra-11/15 27
10-2
10-1
100
800.0 1600 2400 3200 4000 4800 5600
( )electron temperature eV
HULLAC
Safronova
K-shell diagnostic line ratios can be benchmarked in thermal plasmas
Ca injection in Alcator C-Mod
Data from J.E. Rice, MIT, see J. Rice, et al., Phys. Plasmas 7, 1825 (2000)
R(Te ) =a DR
CEX(Te)=
F1(Te)F2 ( j, f )CEX(Te)
DR to CX rate coefficients for Ca
The usual (j+k)/W ratio used to diagnose Te is compromised here by blending of Z and j
blend with j

04/18/23 22:02
XDAP2004-TokXra-11/15 28
High-resolution and good detection gives access to other diagnostic line ratios
Ca injection in Alcator C-Mod
Electron temperatures during solar flares are drived by looking at the n=3 to W line ratio, also observed in Alcator C-Mod spectra
Yohkoh blue shifted flare spectrum
T. Kato, et al., ApJ 492,822 (1998)
J. Rice, et al., Phys. Plasmas 7, 1825 (2000)
Te(MK)=19.1
Ti (MK)=16.2
04/18/23 22:02
XDAP2004-TokXra-11/15 29
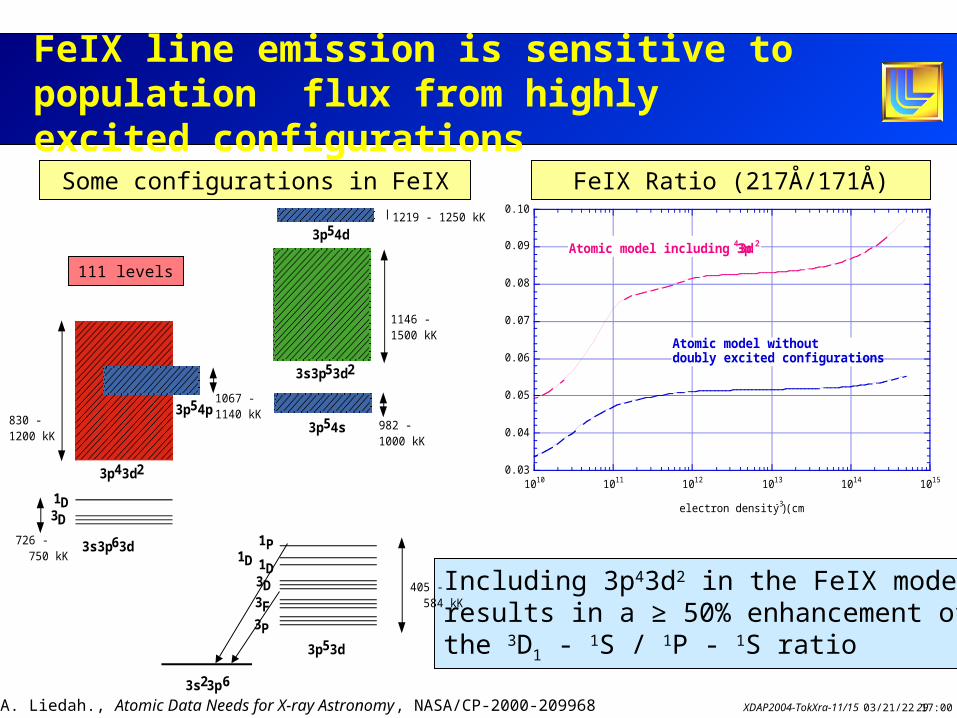
FeIX line emission is sensitive to population flux from highly excited configurations
Including 3p43d2 in the FeIX model results in a ≥ 50% enhancement of the 3D1 - 1S / 1P - 1S ratio
3P
3F
3D
1D1D
1P
405 - 584 kK
3p53d
3s3p63d
3D
1D
726 - 750 kK
830 -1200 kK
3p43d2
3s3p53d2
1146 -1500 kK
3s23p6
3p54s 982 -1000 kK
3p54d1219 - 1250 kK
3p54p1067 -1140 kK
0.03
0.04
0.05
0.06
0.07
0.08
0.09
0.10
1010 1011 1012 1013 1014 1015
electron density (cm -3)
Atomic model including 3p 43d 2
Atomic model without doubly excited configurations
FeIX Ratio (217Å/171Å)Some configurations in FeIX
111 levels
D.A. Liedah., Atomic Data Needs for X-ray Astronomy, NASA/CP-2000-209968

04/18/23 22:02
XDAP2004-TokXra-11/15 30
The universe is x-ray active

04/18/23 22:02
XDAP2004-TokXra-11/15 31
The success of thermonuclear-fusion experiments depends critically on the energy available to colliding particles
10–27
10–28
10–29
10–30
10–31
10–321 10 100
Deuteron energy (keV)
Cross Sections For Nuclear ReactionsInvolving Hydrogen Isotopes and He3
The preferred reaction is 1D2 + 1T2 Æ 2He4 + 0n1
3.5 MeV 14.1 MeV
–D T
–D D
–D He3
1000

04/18/23 22:02
XDAP2004-TokXra-11/15 32
T. Kato, et al., ApJ 492, 822 (1998)
K-shell Fe spectrum from recombination phase of a solar flare
04/18/23 22:02
XDAP2004-TokXra-11/15 33
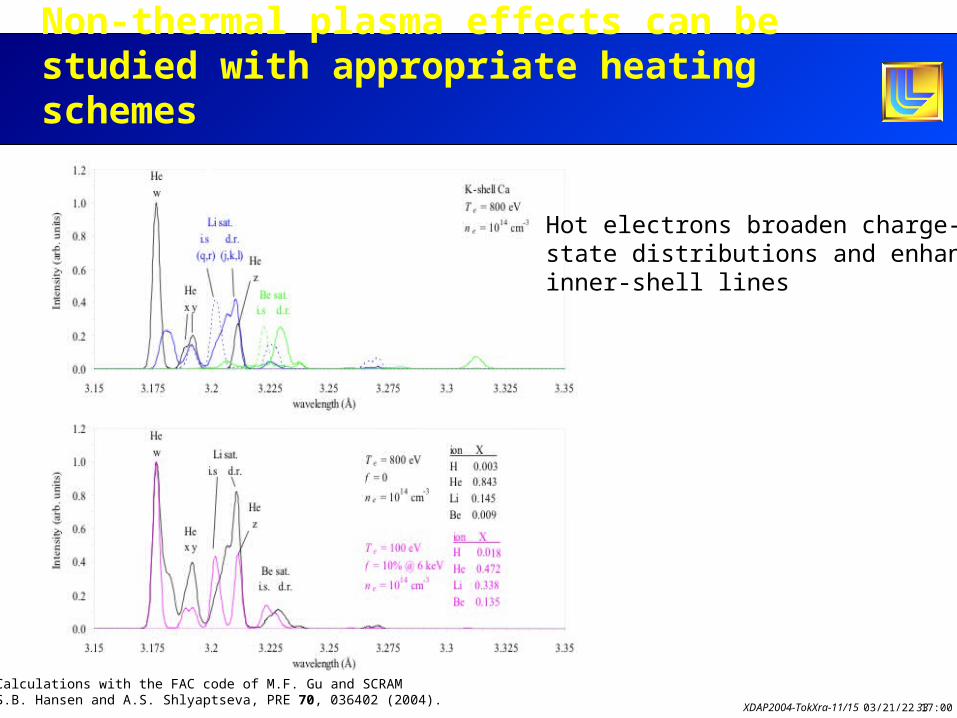
Non-thermal plasma effects can be studied with appropriate heating schemes
Calculations with the FAC code of M.F. Gu and SCRAM S.B. Hansen and A.S. Shlyaptseva, PRE 70, 036402 (2004).
Hot electrons broaden charge-state distributions and enhance inner-shell lines
04/18/23 22:02
XDAP2004-TokXra-11/15 34
Fe L-shell at PLT (and EBIT) - Beiersdorfer/brown

04/18/23 22:02
XDAP2004-TokXra-11/15 35
Fe L-shell from CXO observation (Behar)

04/18/23 22:02
XDAP2004-TokXra-11/15 36
Background subtracted M-shell iron data from a current ramp-down injection in FTU
160.0 170.0 180.0 190.0 200.0 210.0
wavelength (Å)
t=1.567 s
160.0 170.0 180.0 190.0 200.0 210.0
wavelength (Å)
t=1.590 s
160.0 170.0 180.0 190.0 200.0 210.0
wavelength (Å)
t=1.601 s
160.0 170.0 180.0 190.0 200.0 210.0
wavelength (Å)
t=1.613 s
160.0 170.0 180.0 190.0 200.0 210.0
wavelength (Å)
t=1.625 s
160.0 170.0 180.0 190.0 200.0 210.0
wavelength (Å)
t=1.636 s
We see the evolution of the iron charge state distribution during the injection
M-shell M-shell L-shell
M-shell L-shell
M-shell L-shell


![[1949] 2 K.B. 700](https://img.pdfslide.us/doc/110x75/577d24331a28ab4e1e9bdb7c/1949-2-kb-700.jpg)


![[1905] 2 K.B. 791](https://img.pdfslide.us/doc/110x75/577d20bf1a28ab4e1e93aa5a/1905-2-kb-791.jpg)