Embed Size (px)
Citation preview
Atmos. Chem. Phys., 18, 2511–2523, 2018https://doi.org/10.5194/acp-18-2511-2018© Author(s) 2018. This work is distributed underthe Creative Commons Attribution 3.0 License.
XBAER-derived aerosol optical thickness from OLCI/Sentinel-3observationLinlu Mei, Vladimir Rozanov, Marco Vountas, John P. Burrows, and Andreas RichterInstitute of Environmental Physics, University of Bremen, Bremen, Germany
Correspondence: Linlu Mei ([email protected])
Received: 10 March 2017 – Discussion started: 29 May 2017Revised: 7 November 2017 – Accepted: 24 November 2017 – Published: 20 February 2018
Abstract. A cloud identification algorithm used for cloudmasking, which is based on the spatial variability of re-flectances at the top of the atmosphere in visible wave-lengths, has been developed for the retrieval of aerosol prop-erties by MODIS. It is shown that the spatial pattern ofcloud reflectance, as observed from space, is very differentfrom that of aerosols. Clouds show a high spatial variabil-ity in the scale of a hundred metres to a few kilometres,whereas aerosols in general are homogeneous. The conceptof spatial variability of reflectances at the top of the atmo-sphere is mainly applicable over the ocean, where the sur-face background is sufficiently homogeneous for the separa-tion between aerosols and clouds. Aerosol retrievals requirea sufficiently accurate cloud identification to be able to maskthese ground scenes. However, a conservative mask will ex-clude strong aerosol episodes and a less conservative maskcould introduce cloud contamination that biases the retrievedaerosol optical properties (e.g. aerosol optical depth and ef-fective radii). A detailed study on the effect of cloud con-tamination on aerosol retrievals has been performed and pa-rameters are established determining the threshold value forthe MODIS aerosol cloud mask (3× 3-STD) over the ocean.The 3×3-STD algorithm discussed in this paper is the oper-ational cloud mask used for MODIS aerosol retrievals overthe ocean.
A prolonged pollution haze event occurred in the north-east part of China during the period 16–21 December 2016.To assess the impact of such events, the amounts and dis-tribution of aerosol particles, formed in such events, needto be quantified. The newly launched Ocean Land ColourInstrument (OLCI) onboard Sentinel-3 is the successor ofthe MEdium Resolution Imaging Spectrometer (MERIS). Itprovides measurements of the radiance and reflectance at
the top of the atmosphere, which can be used to retrievethe aerosol optical thickness (AOT) from synoptic to globalscales. In this study, the recently developed AOT retrievalalgorithm eXtensible Bremen AErosol Retrieval (XBAER)has been applied to data from the OLCI instrument for thefirst time to illustrate the feasibility of applying XBAER tothe data from this new instrument. The first global retrievalresults show similar patterns of aerosol optical thickness,AOT, to those from MODIS and MISR aerosol products.The AOT retrieved from OLCI is validated by comparisonwith AERONET observations and a correlation coefficientof 0.819 and bias (root mean square) of 0.115 is obtained.The haze episode is well captured by the OLCI-derived AOTproduct. XBAER is shown to retrieve AOT well from the ob-servations of MERIS and OLCI.
1 Introduction
Haze is an atmospheric phenomenon which is associatedwith horizontal visibilities of less than l0 km and atmosphericrelative humidity (RH) less than 90 % (Liu et al., 2013). It iswell known that haze occurs as a result of pollution. For ex-ample, the release of sulfur dioxide (SO2), nitrogen oxides(NOx), and volatile organic compounds/hydrocarbons cou-pled with sunlight leads to aerosol formation, particles or thephotochemical production of atmospheric particles (Sezeret al., 2005; Pudasainee et al., 2006). These particles arecalled aerosol. Aerosol has a variety of effects on climateand environment both directly and indirectly. The direct ef-fect is through scattering, which cools the atmosphere andsurface system or by absorption of incoming solar radiation,which also cools the surface but warms the atmosphere. In-
Published by Copernicus Publications on behalf of the European Geosciences Union.
2512 L. Mei et al.: XBAER-derived aerosol optical thickness
directly, aerosol impacts on cloud formation and the micro-physical properties of clouds, which in turn influence cloudalbedo and precipitation (Li et al., 2011) adding to their neg-ative health impacts. Aerosols are also the carriers of toxicsubstances such as heavy metals and polycyclic aromatic hy-drocarbons (Wilkomirski et al., 2011). In Beijing, under highpollution conditions, the concentrations of sulfate and nitratehave been shown to account for one-third of the particle mat-ter (PM10) mass and two-thirds of the PM2.5 mass, a part ofwhich is attributed to the additional secondary conversion ofSO−2
4 from SO2 and NO−3 from NOx (Ji et al., 2012). Hazehas a significant effect on regional climatic phenomena, suchas monsoon (Chung et al., 2002; Evan et al., 2011), and onthe environment, e.g. air quality (Lin et al., 2012) and visibil-ity (Zhao et al., 2011). Aerosol can adversely affects humanhealth (Evan et al., 2011), especially for the elderly, children(American Academy of Pediatrics Committee on Environ-mental Health, 1993), and even newborn children (Dadvandet al., 2013).
A thick smoke haze enveloped the eastern and northernpart of China in December 2016. Pictures taken by camerasonboard the satellite TERRA/AQUA show that the area ofChina affected by haze exceeded about 1.5 million squarekilometres. The poor visibility resulted in several highwaysand regional airports being closed for extended periods. Thesituation deteriorated significantly during the haze event andbecame a matter of public concern.
Satellite observations of the reflectance of solar radiationat the top of the atmosphere are used to determine aerosoloptical thickness (AOT), which is used as an indicator of airquality (Kaufman et al., 2002). There are numerous attemptsfor the retrieval of aerosol properties from satellite obser-vations. AOT retrieval algorithms have been developed foruse with the measurements of Moderate Resolution ImagingSpectroradiometer (MODIS) (e.g. Dark-Target (Levy et al.,2013), DeepBlue (Hsu et al., 2013), the Multiangle imple-mentation of atmospheric correction (MAIAC) (Lyapustinet al., 2011)), Advanced Along-Track Scanning Radiome-ter (AATSR) (e.g. AATSR Dual-Viewing (ADV) (Kolmonenet al., 2016; Sogacheva et al., 2017), Oxford-RAL Aerosoland Cloud (ORAC) (Thomas et al., 2009), and SwanseaUniversity (SU) (North et al., 1999) algorithms). AOT isalso derived from observations of the Multi-angle ImagingSpectroRadiometer (MISR) (Diner et al., 2005), PARASOL’sPolarization and Directionality of the Earth’s Reflectances(POLDER) (Dubovik et al., 2014), Sea-Viewing Wide Field-of-View Sensor (SeaWiFS) (Sayer et al., 2012) etc.
One challenge for the derivation of AOT long-termdatasets from satellite observation is to generate compara-ble AOT data products from the different instruments, whichhave limited lifetimes. Consequently, mature aerosol algo-rithms, which can be applied to data from instruments on dif-ferent platforms, are required. For example, the three MODISaerosol algorithms have been applied to the Visible InfraredImaging Radiometer Suite (VIIRS) instrument and the three
AATSR algorithms have been proposed to be applied to theobservations of the Sea and Land Surface Temperature Ra-diometer (SLSTR) instrument (Popp et al., 2016).
The MERIS instrument onboard Environmental Satellite(Envisat) provided valuable information for different appli-cations (Verstraete et al., 1999). There are several previousattempts to develop AOT retrieval algorithms for MERIS,e.g. the Bremen AErosol Retrieval (BAER; von Hoyningen-Huene et al., 2003, 2011), and the European Space Agency(ESA) standard aerosol retrieval (Santer et al., 2007). Thesehad mixed success (Mei et al., 2017a). BAER has limitedaccuracy away from dark-vegetated surfaces and primarilyfor non-absorbing aerosols (de Leeuw et al., 2015; Holzer-Popp et al., 2013), while the ESA standard AOT retrievaltends to overestimate AOT (de Leeuw et al., 2015). The re-cently developed eXtensible Bremen AErosol (XBAER) al-gorithm (Mei et al., 2017a, b) has been internally validated inthe Aerosol-Climate Change Initiative (Aerosol-CCI) project(Popp et al., 2016), and shows very promising results.
The newly launched (on 16 February, 2016) instrumentOcean Land Colour Instrument (OLCI) continues the workof MERIS as it contains all MERIS channels. Theoretically itis possible to transfer the mature MERIS retrieval algorithmsto the OLCI instrument. In this paper, the XBAER algorithmhas been applied to OLCI instrument for the first time. Toour best knowledge, this is the first publication of AOT re-trieved from OLCI. Although Sentinel-3 has only recentlybeen launched, applying XBAER to OLCI data we haveidentified a haze event over Beijing, China, during Decem-ber 2016. We use observations by OLCI during this episodeto test our retrieval of AOT. This study is a necessary firststep to observing the aerosol in the Arctic, which is an over-arching long-term objective.
In this paper, the characteristics of OLCI and MERISinstruments are presented and compared in Sect. 2. TheXBAER algorithm is briefly explained in Sect. 3. Section 4shows the comparison between OLCI and MERIS instru-ments – first XBAER OLCI-derived AOT results and a com-parison with AOT from MODIS/MISR and AERONET ob-servations is shown and discussed from a global point ofview. The AOT retrieved during the regional haze event isalso presented and discussed in Sect. 4. Conclusions aregiven in Sect. 5.
2 OLCI instrument
The European Space Agency Sentinel-3 satellite wassuccessfully launched on 16 February 2016. It is oneelement of the EU Copernicus system previously knownas the Global Monitoring for Environment and Security(GMES) system (https://sentinel.esa.int/web/sentinel/user-guides/sentinel-3-olci). The aim of the Sentinel-3mission is to provide data continuity of observation anddata products for two of the instruments aboard ENVISAT,
Atmos. Chem. Phys., 18, 2511–2523, 2018 www.atmos-chem-phys.net/18/2511/2018/
L. Mei et al.: XBAER-derived aerosol optical thickness 2513
namely MERIS (https://earth.esa.int/web/guest/missions/esa-operational-eo-missions/envisat/instruments/meris)and AATSR (https://earth.esa.int/web/guest/missions/esa-operational-eo-missions/envisat/instruments/aatsr).There is no overlap of observations because ENVISATwas lost unexpectedly and suddenly in April 2012. Theoutstanding performance of ENVISAT over the last decadeled both scientists and engineers to believe that it is valuableto make use of multiple sensing instruments to accomplishits operational mission for oceanography and global landapplications. The instruments onboard Sentinel-3 includeSLSTR (Sea and Land Surface Temperature Radiometer),OLCI, SRAL (SAR Altimeter), DORIS (Doppler Orbitogra-phy and Radiopositioning Integrated by Satellite), and MWR(Microwave Radiometer), which can deliver additional in-formation for sea/land colour data (at least MERIS quality),sea/land surface temperature (at least AATSR quality), andsea surface topography data (at least Envisat RA quality)(https://earth.esa.int/web/guest/missions/esa-eo-missions/sentinel-3).
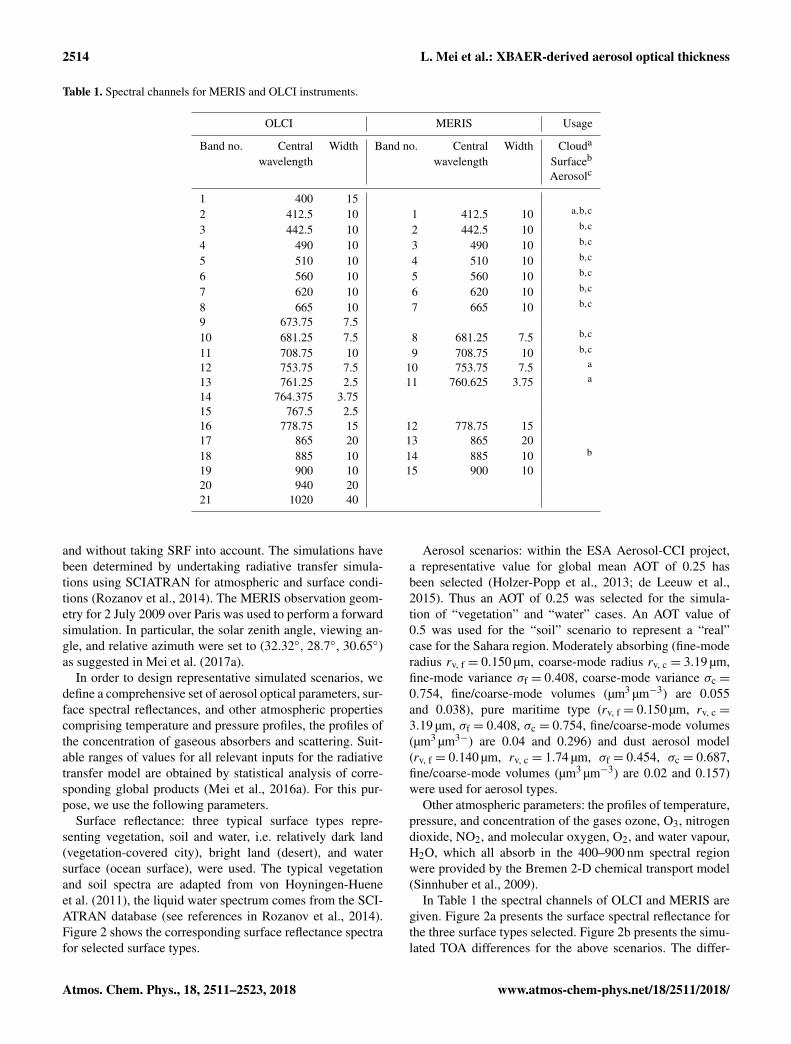
The primary objective of OLCI is to observe the ocean andland surface in the solar spectral region and thereby to har-vest information related to biology. OLCI also provides in-formation on the atmosphere and contributes to climate stud-ies. OLCI is a push-broom imaging spectrometer that mea-sures solar radiation reflected by the Earth, at a ground spa-tial resolution of 300 m, in 21 spectral bands between 0.4 and1.02 µm, with a swath width of 1270 km. A comparison be-tween the MERIS and OLCI instruments has been includedin Table 1.
3 XBAER algorithm
The XBAER algorithm was designed for the retrieval of AOTfrom MERIS and similar observations. It has its own cloud-screening approach, aerosol type selection and surface pa-rameterization (Mei et al., 2017a, b). The cloud-screening al-gorithm minimizes cloud contamination for aerosol retrievalin XBAER. The XBAER cloud-masking algorithm deter-mines the presence of cloud by using (i) the brightness ofthe scene, (ii) the homogeneity or variability of the top ofthe atmosphere reflectance, and (iii) cloud height informa-tion (Mei et al., 2017b). The threshold values in the XBAERcloud-masking algorithm are selected by a two-step process.The ranges for the thresholds were determined by using ac-curate radiative transfer modelling with different surface andatmospheric scenarios. A histogram analysis has been usedfor different cloud, aerosol, and surface scenarios to estimatethe optimal threshold values for each criterion.
The XBAER algorithm uses a generic one-parametric sur-face parameterization for both land and ocean. XBAER usesa set of space–time-dependent spectral coefficients to de-scribe surface properties. The spatial and temporal resolu-tions are 10 km and monthly, respectively. The surface spec-
tral reflectance can be determined simultaneously with AOTin an iterative procedure (Mei et al., 2017a). This approachassumes that the wavelength-dependent properties of sur-face spectral reflectance are constrained by space- and time-dependent spectral coefficients. The wavelength-independentsingle parameters (soil-adjusted vegetation index (SAVI)for land retrieval and normalized differential pigment index(NDPI) for ocean retrieval) have been used as the “tuning”parameters. The definitions of SAVI and NDPI are
SAVI=R(λ14)−R(λ7)
R(λ14)+R(λ7)+L(1+L), (1)
L= 1−
2R(λ14)+ 1−√(2R(λ14)+ 1)2− 8(R(λ14)−R(λ7))
2, (2)
where R is the SSR and the subscript for the wavelength de-notes the MERIS channel numbers defined in Table 1, and
NDPI=R(λ2)−R(λ5)
R(λ3). (3)
In this manner, XBAER is not limited to dark surfaces(ocean, vegetation) and also retrieves AOT over bright sur-faces (e.g. desert, semiarid, and urban areas).
XBAER uses MODIS Dark-Target aerosol type assump-tions and the expected aerosol type for a given region andseason is taken from an analysis of Aerosol Robotic Network(AERONET) and Maritime Aerosol Network (MAN) obser-vations for both land and ocean. AOT and surface reflectanceare retrieved by minimizing the difference between simulatedand measured top-of-the-atmosphere (TOA) reflectance us-ing a look-up table (LUT), created by the radiative transfersoftware package SCIATRAN (Rozanov et al., 2014). Detailsof the XBAER algorithm can be found in Mei et al. (2017a,b). A post-processing technique used in Aerosol-CCI projectand the MODIS monthly snow fraction dataset have beenadditionally applied to avoid unresolved clouds/snow (Poppet al., 2016).
4 Results
4.1 Verification
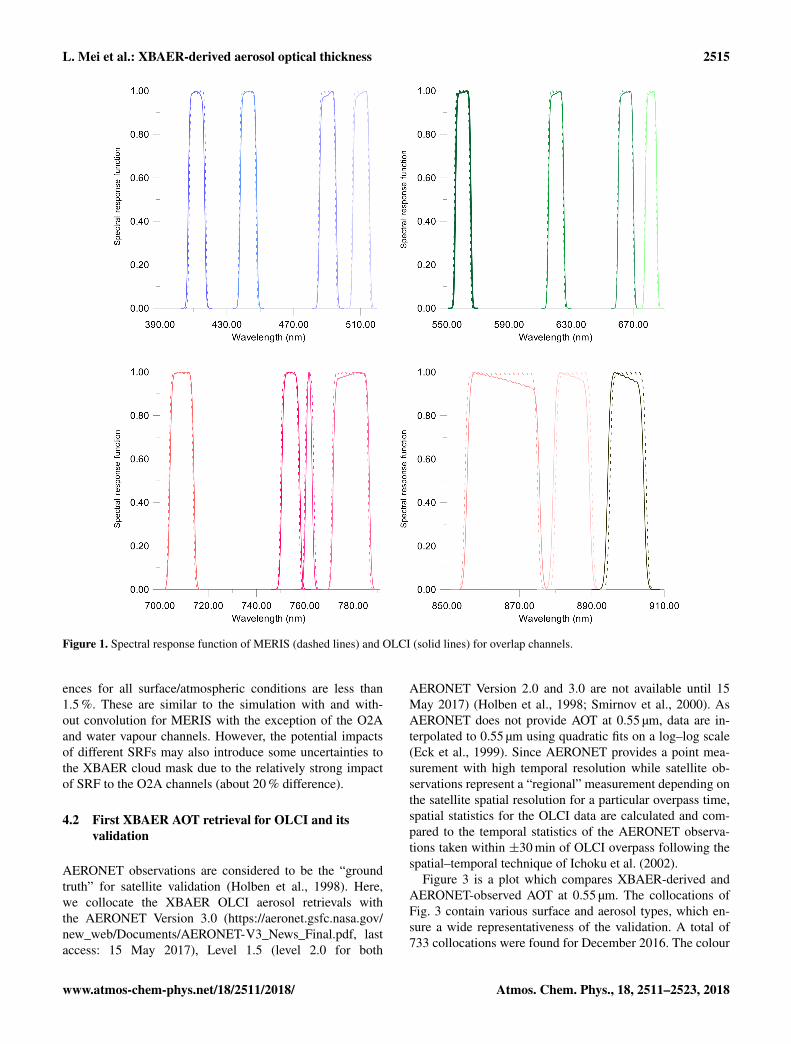
One important characteristic investigated is the instrumentspectral response function (SRF) because it is the majordifference between MERIS and OLCI for overlap channels.Figure 1 shows the SRF for the MERIS and OLCI overlapchannels. The OLCI SRF mean dataset (https://sentinel.esa.int/web/sentinel/technical-guides/sentinel-3-olci/olci-instrument/spectral-response-function-data) has beenused. Differences between MERIS and OLCI SRF areidentified but have negligible impact on the retrieved AOT.
In order to quantitatively investigate the impact of differ-ent SRFs, the TOA reflectances have been simulated with
www.atmos-chem-phys.net/18/2511/2018/ Atmos. Chem. Phys., 18, 2511–2523, 2018
2514 L. Mei et al.: XBAER-derived aerosol optical thickness
Table 1. Spectral channels for MERIS and OLCI instruments.
OLCI MERIS Usage
Band no. Central Width Band no. Central Width Clouda
wavelength wavelength Surfaceb
Aerosolc
1 400 152 412.5 10 1 412.5 10 a,b,c
3 442.5 10 2 442.5 10 b,c
4 490 10 3 490 10 b,c
5 510 10 4 510 10 b,c
6 560 10 5 560 10 b,c
7 620 10 6 620 10 b,c
8 665 10 7 665 10 b,c
9 673.75 7.510 681.25 7.5 8 681.25 7.5 b,c
11 708.75 10 9 708.75 10 b,c
12 753.75 7.5 10 753.75 7.5 a
13 761.25 2.5 11 760.625 3.75 a
14 764.375 3.7515 767.5 2.516 778.75 15 12 778.75 1517 865 20 13 865 2018 885 10 14 885 10 b
19 900 10 15 900 1020 940 2021 1020 40
and without taking SRF into account. The simulations havebeen determined by undertaking radiative transfer simula-tions using SCIATRAN for atmospheric and surface condi-tions (Rozanov et al., 2014). The MERIS observation geom-etry for 2 July 2009 over Paris was used to perform a forwardsimulation. In particular, the solar zenith angle, viewing an-gle, and relative azimuth were set to (32.32◦, 28.7◦, 30.65◦)as suggested in Mei et al. (2017a).
In order to design representative simulated scenarios, wedefine a comprehensive set of aerosol optical parameters, sur-face spectral reflectances, and other atmospheric propertiescomprising temperature and pressure profiles, the profiles ofthe concentration of gaseous absorbers and scattering. Suit-able ranges of values for all relevant inputs for the radiativetransfer model are obtained by statistical analysis of corre-sponding global products (Mei et al., 2016a). For this pur-pose, we use the following parameters.
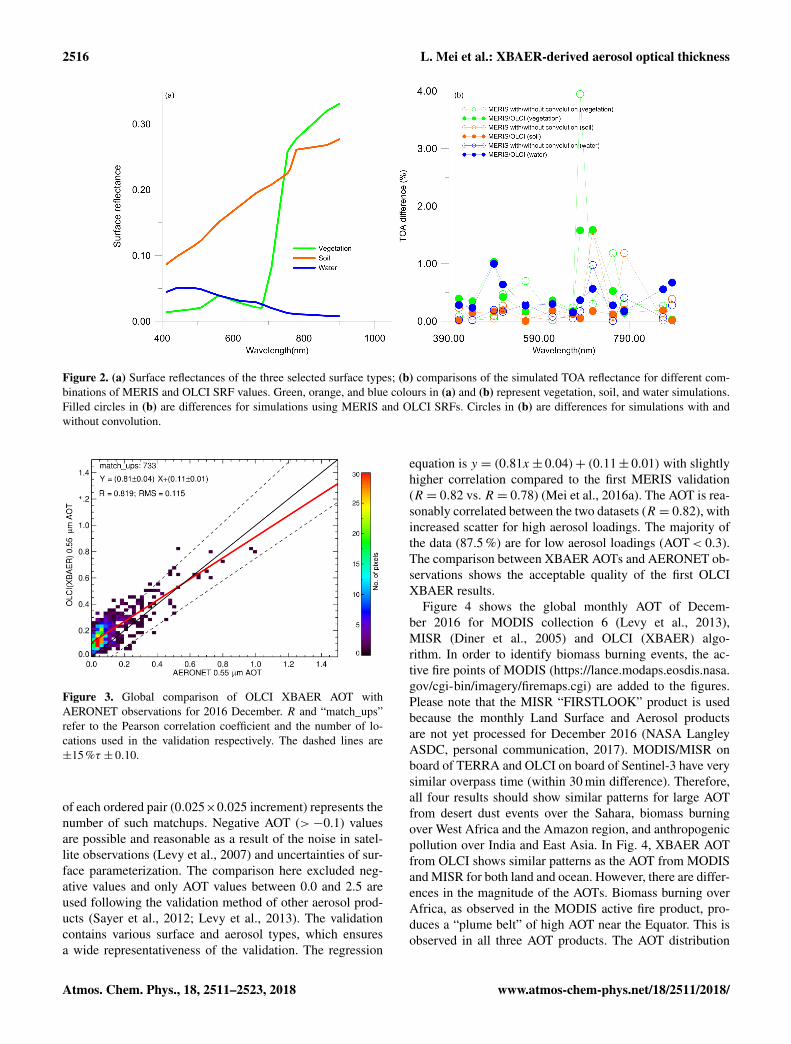
Surface reflectance: three typical surface types repre-senting vegetation, soil and water, i.e. relatively dark land(vegetation-covered city), bright land (desert), and watersurface (ocean surface), were used. The typical vegetationand soil spectra are adapted from von Hoyningen-Hueneet al. (2011), the liquid water spectrum comes from the SCI-ATRAN database (see references in Rozanov et al., 2014).Figure 2 shows the corresponding surface reflectance spectrafor selected surface types.
Aerosol scenarios: within the ESA Aerosol-CCI project,a representative value for global mean AOT of 0.25 hasbeen selected (Holzer-Popp et al., 2013; de Leeuw et al.,2015). Thus an AOT of 0.25 was selected for the simula-tion of “vegetation” and “water” cases. An AOT value of0.5 was used for the “soil” scenario to represent a “real”case for the Sahara region. Moderately absorbing (fine-moderadius rv, f = 0.150 µm, coarse-mode radius rv, c = 3.19 µm,fine-mode variance σf = 0.408, coarse-mode variance σc =
0.754, fine/coarse-mode volumes (µm3 µm−3) are 0.055and 0.038), pure maritime type (rv, f = 0.150 µm, rv, c =
3.19 µm, σf = 0.408, σc = 0.754, fine/coarse-mode volumes(µm3 µm3−) are 0.04 and 0.296) and dust aerosol model(rv, f = 0.140 µm, rv, c = 1.74 µm, σf = 0.454, σc = 0.687,fine/coarse-mode volumes (µm3 µm−3) are 0.02 and 0.157)were used for aerosol types.
Other atmospheric parameters: the profiles of temperature,pressure, and concentration of the gases ozone, O3, nitrogendioxide, NO2, and molecular oxygen, O2, and water vapour,H2O, which all absorb in the 400–900 nm spectral regionwere provided by the Bremen 2-D chemical transport model(Sinnhuber et al., 2009).
In Table 1 the spectral channels of OLCI and MERIS aregiven. Figure 2a presents the surface spectral reflectance forthe three surface types selected. Figure 2b presents the simu-lated TOA differences for the above scenarios. The differ-
Atmos. Chem. Phys., 18, 2511–2523, 2018 www.atmos-chem-phys.net/18/2511/2018/
L. Mei et al.: XBAER-derived aerosol optical thickness 2515
Figure 1. Spectral response function of MERIS (dashed lines) and OLCI (solid lines) for overlap channels.
ences for all surface/atmospheric conditions are less than1.5 %. These are similar to the simulation with and with-out convolution for MERIS with the exception of the O2Aand water vapour channels. However, the potential impactsof different SRFs may also introduce some uncertainties tothe XBAER cloud mask due to the relatively strong impactof SRF to the O2A channels (about 20 % difference).
4.2 First XBAER AOT retrieval for OLCI and itsvalidation
AERONET observations are considered to be the “groundtruth” for satellite validation (Holben et al., 1998). Here,we collocate the XBAER OLCI aerosol retrievals withthe AERONET Version 3.0 (https://aeronet.gsfc.nasa.gov/new_web/Documents/AERONET-V3_News_Final.pdf, lastaccess: 15 May 2017), Level 1.5 (level 2.0 for both
AERONET Version 2.0 and 3.0 are not available until 15May 2017) (Holben et al., 1998; Smirnov et al., 2000). AsAERONET does not provide AOT at 0.55 µm, data are in-terpolated to 0.55 µm using quadratic fits on a log–log scale(Eck et al., 1999). Since AERONET provides a point mea-surement with high temporal resolution while satellite ob-servations represent a “regional” measurement depending onthe satellite spatial resolution for a particular overpass time,spatial statistics for the OLCI data are calculated and com-pared to the temporal statistics of the AERONET observa-tions taken within ±30 min of OLCI overpass following thespatial–temporal technique of Ichoku et al. (2002).
Figure 3 is a plot which compares XBAER-derived andAERONET-observed AOT at 0.55 µm. The collocations ofFig. 3 contain various surface and aerosol types, which en-sure a wide representativeness of the validation. A total of733 collocations were found for December 2016. The colour
www.atmos-chem-phys.net/18/2511/2018/ Atmos. Chem. Phys., 18, 2511–2523, 2018
2516 L. Mei et al.: XBAER-derived aerosol optical thickness
Figure 2. (a) Surface reflectances of the three selected surface types; (b) comparisons of the simulated TOA reflectance for different com-binations of MERIS and OLCI SRF values. Green, orange, and blue colours in (a) and (b) represent vegetation, soil, and water simulations.Filled circles in (b) are differences for simulations using MERIS and OLCI SRFs. Circles in (b) are differences for simulations with andwithout convolution.
Figure 3. Global comparison of OLCI XBAER AOT withAERONET observations for 2016 December. R and “match_ups”refer to the Pearson correlation coefficient and the number of lo-cations used in the validation respectively. The dashed lines are±15 %τ ± 0.10.
of each ordered pair (0.025×0.025 increment) represents thenumber of such matchups. Negative AOT (>−0.1) valuesare possible and reasonable as a result of the noise in satel-lite observations (Levy et al., 2007) and uncertainties of sur-face parameterization. The comparison here excluded neg-ative values and only AOT values between 0.0 and 2.5 areused following the validation method of other aerosol prod-ucts (Sayer et al., 2012; Levy et al., 2013). The validationcontains various surface and aerosol types, which ensuresa wide representativeness of the validation. The regression
equation is y = (0.81x± 0.04)+ (0.11± 0.01) with slightlyhigher correlation compared to the first MERIS validation(R = 0.82 vs. R = 0.78) (Mei et al., 2016a). The AOT is rea-sonably correlated between the two datasets (R = 0.82), withincreased scatter for high aerosol loadings. The majority ofthe data (87.5 %) are for low aerosol loadings (AOT< 0.3).The comparison between XBAER AOTs and AERONET ob-servations shows the acceptable quality of the first OLCIXBAER results.
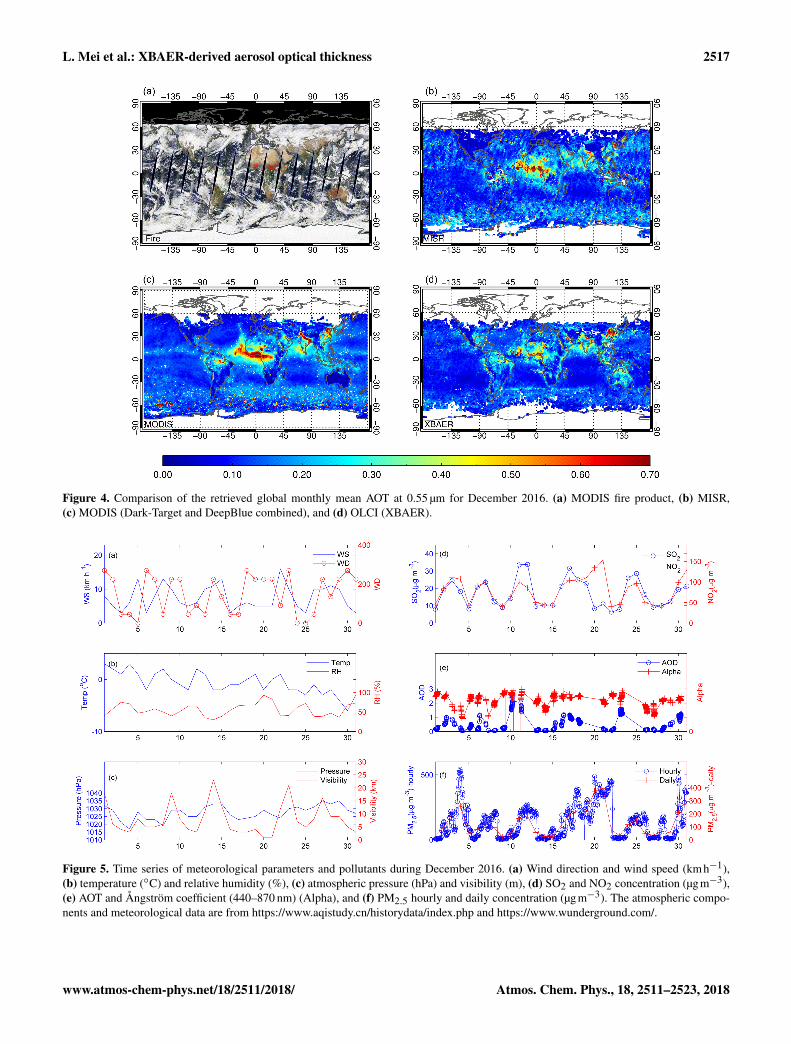
Figure 4 shows the global monthly AOT of Decem-ber 2016 for MODIS collection 6 (Levy et al., 2013),MISR (Diner et al., 2005) and OLCI (XBAER) algo-rithm. In order to identify biomass burning events, the ac-tive fire points of MODIS (https://lance.modaps.eosdis.nasa.gov/cgi-bin/imagery/firemaps.cgi) are added to the figures.Please note that the MISR “FIRSTLOOK” product is usedbecause the monthly Land Surface and Aerosol productsare not yet processed for December 2016 (NASA LangleyASDC, personal communication, 2017). MODIS/MISR onboard of TERRA and OLCI on board of Sentinel-3 have verysimilar overpass time (within 30 min difference). Therefore,all four results should show similar patterns for large AOTfrom desert dust events over the Sahara, biomass burningover West Africa and the Amazon region, and anthropogenicpollution over India and East Asia. In Fig. 4, XBAER AOTfrom OLCI shows similar patterns as the AOT from MODISand MISR for both land and ocean. However, there are differ-ences in the magnitude of the AOTs. Biomass burning overAfrica, as observed in the MODIS active fire product, pro-duces a “plume belt” of high AOT near the Equator. This isobserved in all three AOT products. The AOT distribution
Atmos. Chem. Phys., 18, 2511–2523, 2018 www.atmos-chem-phys.net/18/2511/2018/
L. Mei et al.: XBAER-derived aerosol optical thickness 2517
Figure 4. Comparison of the retrieved global monthly mean AOT at 0.55 µm for December 2016. (a) MODIS fire product, (b) MISR,(c) MODIS (Dark-Target and DeepBlue combined), and (d) OLCI (XBAER).
Figure 5. Time series of meteorological parameters and pollutants during December 2016. (a) Wind direction and wind speed (kmh−1),(b) temperature (◦C) and relative humidity (%), (c) atmospheric pressure (hPa) and visibility (m), (d) SO2 and NO2 concentration (µgm−3),(e) AOT and Ångström coefficient (440–870 nm) (Alpha), and (f) PM2.5 hourly and daily concentration (µgm−3). The atmospheric compo-nents and meteorological data are from https://www.aqistudy.cn/historydata/index.php and https://www.wunderground.com/.
www.atmos-chem-phys.net/18/2511/2018/ Atmos. Chem. Phys., 18, 2511–2523, 2018
2518 L. Mei et al.: XBAER-derived aerosol optical thickness
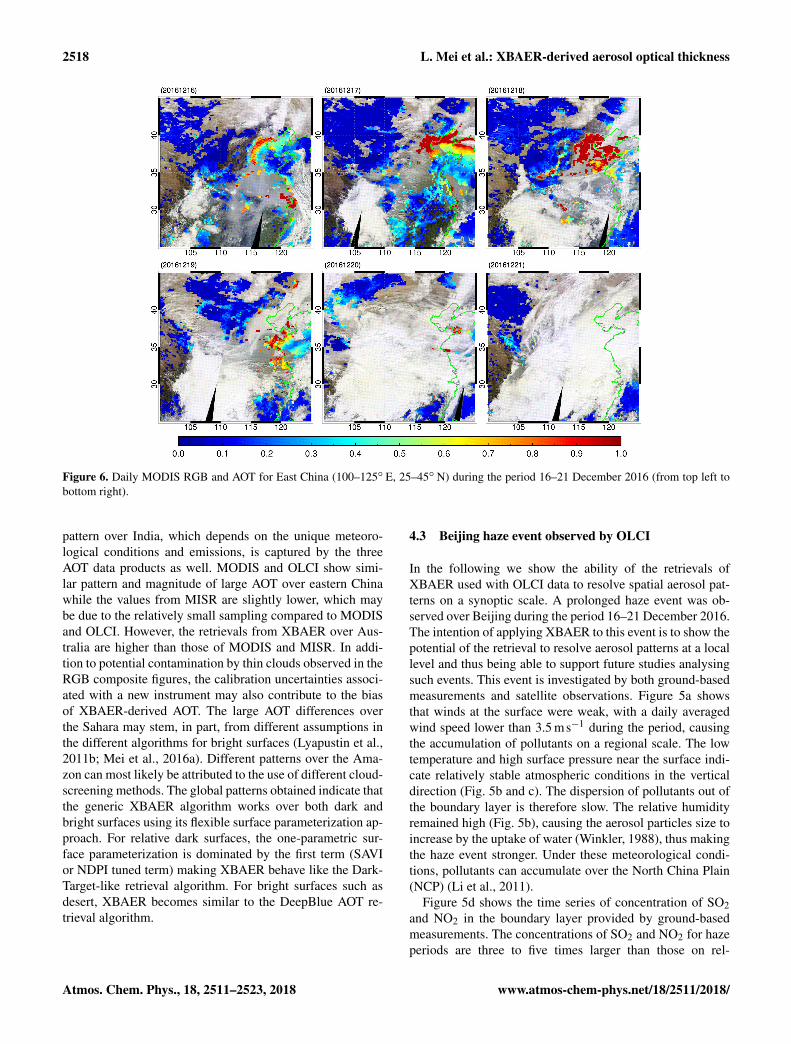
Figure 6. Daily MODIS RGB and AOT for East China (100–125◦ E, 25–45◦ N) during the period 16–21 December 2016 (from top left tobottom right).
pattern over India, which depends on the unique meteoro-logical conditions and emissions, is captured by the threeAOT data products as well. MODIS and OLCI show simi-lar pattern and magnitude of large AOT over eastern Chinawhile the values from MISR are slightly lower, which maybe due to the relatively small sampling compared to MODISand OLCI. However, the retrievals from XBAER over Aus-tralia are higher than those of MODIS and MISR. In addi-tion to potential contamination by thin clouds observed in theRGB composite figures, the calibration uncertainties associ-ated with a new instrument may also contribute to the biasof XBAER-derived AOT. The large AOT differences overthe Sahara may stem, in part, from different assumptions inthe different algorithms for bright surfaces (Lyapustin et al.,2011b; Mei et al., 2016a). Different patterns over the Ama-zon can most likely be attributed to the use of different cloud-screening methods. The global patterns obtained indicate thatthe generic XBAER algorithm works over both dark andbright surfaces using its flexible surface parameterization ap-proach. For relative dark surfaces, the one-parametric sur-face parameterization is dominated by the first term (SAVIor NDPI tuned term) making XBAER behave like the Dark-Target-like retrieval algorithm. For bright surfaces such asdesert, XBAER becomes similar to the DeepBlue AOT re-trieval algorithm.
4.3 Beijing haze event observed by OLCI
In the following we show the ability of the retrievals ofXBAER used with OLCI data to resolve spatial aerosol pat-terns on a synoptic scale. A prolonged haze event was ob-served over Beijing during the period 16–21 December 2016.The intention of applying XBAER to this event is to show thepotential of the retrieval to resolve aerosol patterns at a locallevel and thus being able to support future studies analysingsuch events. This event is investigated by both ground-basedmeasurements and satellite observations. Figure 5a showsthat winds at the surface were weak, with a daily averagedwind speed lower than 3.5 ms−1 during the period, causingthe accumulation of pollutants on a regional scale. The lowtemperature and high surface pressure near the surface indi-cate relatively stable atmospheric conditions in the verticaldirection (Fig. 5b and c). The dispersion of pollutants out ofthe boundary layer is therefore slow. The relative humidityremained high (Fig. 5b), causing the aerosol particles size toincrease by the uptake of water (Winkler, 1988), thus makingthe haze event stronger. Under these meteorological condi-tions, pollutants can accumulate over the North China Plain(NCP) (Li et al., 2011).
Figure 5d shows the time series of concentration of SO2and NO2 in the boundary layer provided by ground-basedmeasurements. The concentrations of SO2 and NO2 for hazeperiods are three to five times larger than those on rel-
Atmos. Chem. Phys., 18, 2511–2523, 2018 www.atmos-chem-phys.net/18/2511/2018/
L. Mei et al.: XBAER-derived aerosol optical thickness 2519
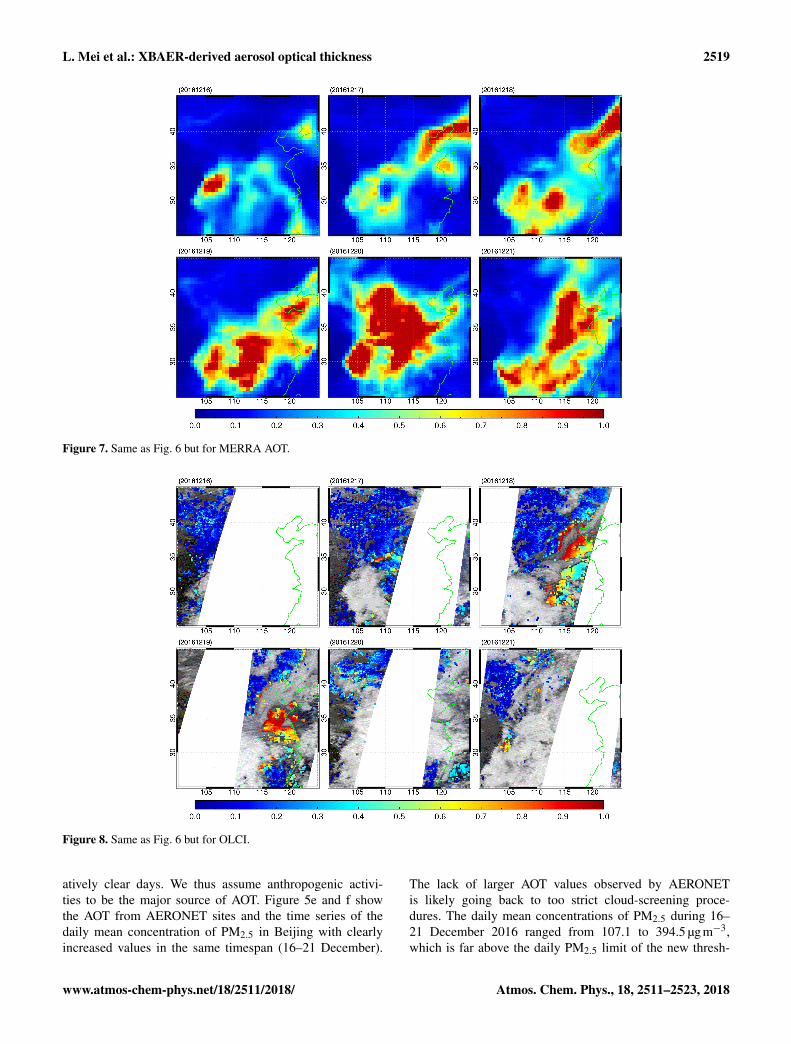
Figure 7. Same as Fig. 6 but for MERRA AOT.
Figure 8. Same as Fig. 6 but for OLCI.
atively clear days. We thus assume anthropogenic activi-ties to be the major source of AOT. Figure 5e and f showthe AOT from AERONET sites and the time series of thedaily mean concentration of PM2.5 in Beijing with clearlyincreased values in the same timespan (16–21 December).
The lack of larger AOT values observed by AERONETis likely going back to too strict cloud-screening proce-dures. The daily mean concentrations of PM2.5 during 16–21 December 2016 ranged from 107.1 to 394.5 µgm−3,which is far above the daily PM2.5 limit of the new thresh-
www.atmos-chem-phys.net/18/2511/2018/ Atmos. Chem. Phys., 18, 2511–2523, 2018
2520 L. Mei et al.: XBAER-derived aerosol optical thickness
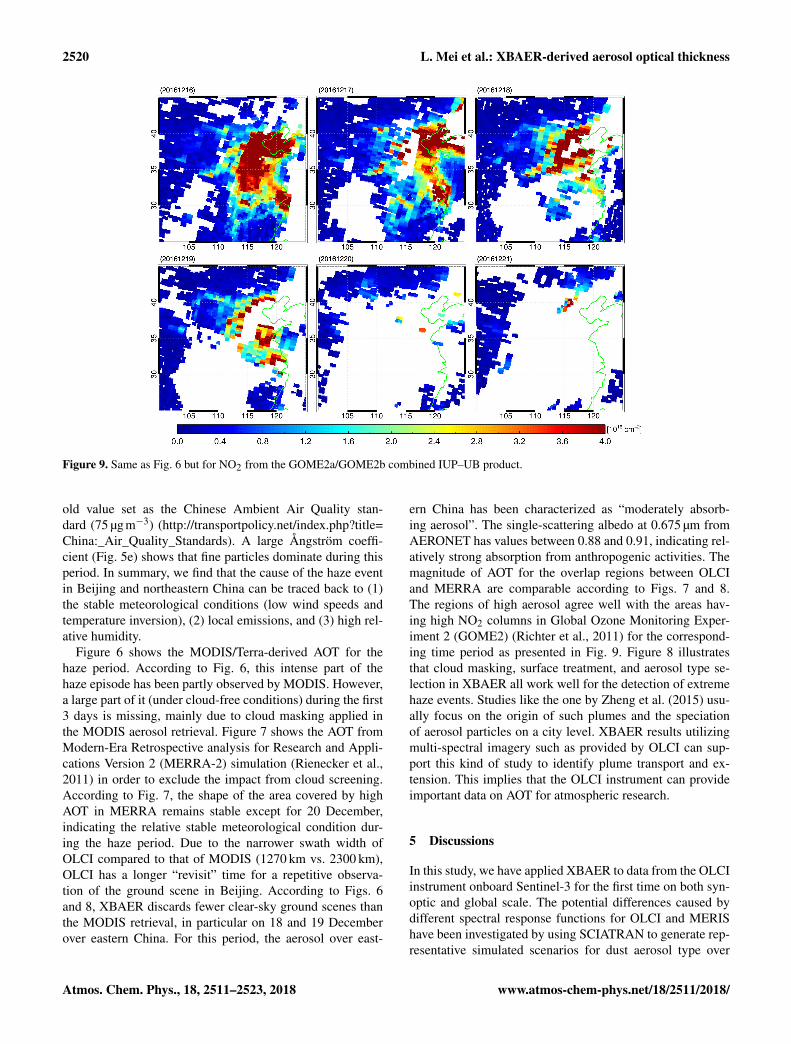
Figure 9. Same as Fig. 6 but for NO2 from the GOME2a/GOME2b combined IUP–UB product.
old value set as the Chinese Ambient Air Quality stan-dard (75 µgm−3) (http://transportpolicy.net/index.php?title=China:_Air_Quality_Standards). A large Ångström coeffi-cient (Fig. 5e) shows that fine particles dominate during thisperiod. In summary, we find that the cause of the haze eventin Beijing and northeastern China can be traced back to (1)the stable meteorological conditions (low wind speeds andtemperature inversion), (2) local emissions, and (3) high rel-ative humidity.
Figure 6 shows the MODIS/Terra-derived AOT for thehaze period. According to Fig. 6, this intense part of thehaze episode has been partly observed by MODIS. However,a large part of it (under cloud-free conditions) during the first3 days is missing, mainly due to cloud masking applied inthe MODIS aerosol retrieval. Figure 7 shows the AOT fromModern-Era Retrospective analysis for Research and Appli-cations Version 2 (MERRA-2) simulation (Rienecker et al.,2011) in order to exclude the impact from cloud screening.According to Fig. 7, the shape of the area covered by highAOT in MERRA remains stable except for 20 December,indicating the relative stable meteorological condition dur-ing the haze period. Due to the narrower swath width ofOLCI compared to that of MODIS (1270 km vs. 2300 km),OLCI has a longer “revisit” time for a repetitive observa-tion of the ground scene in Beijing. According to Figs. 6and 8, XBAER discards fewer clear-sky ground scenes thanthe MODIS retrieval, in particular on 18 and 19 Decemberover eastern China. For this period, the aerosol over east-
ern China has been characterized as “moderately absorb-ing aerosol”. The single-scattering albedo at 0.675 µm fromAERONET has values between 0.88 and 0.91, indicating rel-atively strong absorption from anthropogenic activities. Themagnitude of AOT for the overlap regions between OLCIand MERRA are comparable according to Figs. 7 and 8.The regions of high aerosol agree well with the areas hav-ing high NO2 columns in Global Ozone Monitoring Exper-iment 2 (GOME2) (Richter et al., 2011) for the correspond-ing time period as presented in Fig. 9. Figure 8 illustratesthat cloud masking, surface treatment, and aerosol type se-lection in XBAER all work well for the detection of extremehaze events. Studies like the one by Zheng et al. (2015) usu-ally focus on the origin of such plumes and the speciationof aerosol particles on a city level. XBAER results utilizingmulti-spectral imagery such as provided by OLCI can sup-port this kind of study to identify plume transport and ex-tension. This implies that the OLCI instrument can provideimportant data on AOT for atmospheric research.
5 Discussions
In this study, we have applied XBAER to data from the OLCIinstrument onboard Sentinel-3 for the first time on both syn-optic and global scale. The potential differences caused bydifferent spectral response functions for OLCI and MERIShave been investigated by using SCIATRAN to generate rep-resentative simulated scenarios for dust aerosol type over
Atmos. Chem. Phys., 18, 2511–2523, 2018 www.atmos-chem-phys.net/18/2511/2018/
L. Mei et al.: XBAER-derived aerosol optical thickness 2521
desert, moderately absorbing aerosol over vegetation regions,and maritime aerosol over water. The overall differences forall selected channels for XBAER are smaller than 1.5 %. Thisimplies that XBAER can be used to retrieve AOT from OLCI.Although relatively large differences caused by SRFs (ap-proximately 20 %) have been found for the O2A channels,the global retrieval of OLCI shows that the original MERIScloud masking, which includes the use of O2A channels,works well for OLCI and can potentially even be improvedas only MERIS-heritage channels have been used so far withOLCI.
The global monthly mean XBAER AOT maps for De-cember 2016 show good agreement with those by MODISand MISR. The comparison with AERONET measurementsreveals that XBAER can provide promising results overboth dark and bright surface. The first comparison withAERONET shows acceptable agreement between the twodata sets, with a regression yielding y = (0.81x± 0.04)+(0.11± 0.01) and correlation of R = 0.82. The global re-trievals confirm that XBAER is valid for both dark and brightsurfaces because of its use of an optimized monthly globalSSR spectral coefficients dataset.
A significant haze event during December 2016 over Bei-jing has been analysed in this paper based on ground-basedand satellite observations to show the potential of the re-trieval to resolve aerosol patterns at a local level and thus be-ing able to support future studies analysing such events. Thislarge haze event has been attributed to the large local emis-sions under unfavourable meteorological conditions (temper-ature inversion in vertical direction and no advection). TheMODIS/Terra- and OLCI-derived AOT both detect the hazeevent. However, due to cloud screening, the MODIS AOTpartly misses it while the OLCI AOT is able to detect themain pattern of haze for clear conditions. The overlap re-trieval for both MODIS and OLCI has similar values, indi-cating that OLCI provides another useful data source for airpollution monitoring.
Although the study shows that XBAER can be applied toOLCI observations for synoptic to global applications, sev-eral important issues need to be addressed in the future work.Potential cloud contamination due to both the relative largecalibration uncertainty of OLCI compared to MERIS as wellas the impact of SRF on O2A channel need to be investigatedwith the new version of level 1 TOA reflectance dataset.Modification or improvement for OLCI cloud screeningwill be included, besides the criteria of brightness, textur-ing/variability, and cloud altitude of the scenes (Mei et al.,2017b). The underestimation of AOT over regions like theSahara could be explained by the spheroid dust modeladapted from MODIS-DT algorithm due to the impact ofnon-sphericity of dust particles on the aerosol phase func-tion (Mei et al., 2016a) – a new spheroid model accountingfor aerosol particle non-sphericity will be included in the newversion (Dubovik et al., 2006). The cloud-screening evalua-tion shows that approximately 5–10 % clouds may be mis-
classified as retrievable clear cases for MERIS (Mei et al.,2016b), which introduces both bias and potential patchinessof XBAER-derived AOT for OLCI. Thus a new cloud post-processing, following the AATSR dual-view (ADV) algo-rithm (Sogacheva et al., 2017), will be applied to discardthe pixels that might potentially be affected by cloud (cloudedge, very thin cloud, and so on).
Data availability. The XBAER-derived OLCI product is availableupon request to the corresponding author.
Competing interests. The authors declare that they have no conflictof interest.
Acknowledgements. The authors would like to express theirappreciation to Andreas Heckel from Swansea University, BahjatAlhammoud/Manuel Arias from ARGANS Ltd, and DebbieRichards from EUMETSAT for very valuable and detailed dis-cussion about the OLCI instrument. The discussion of modelsimulations with Anne Blechschmidt and Abram Sanders fromthe University of Bremen is highly appreciated. We would alsolike to express our gratitude to the AERONET PIs for establishingand maintaining the long-term AERONET stations used for thevalidation. The atmospheric components and meteorologicaldata are from https://www.aqistudy.cn/historydata/index.php andhttps://www.wunderground.com/. The MODIS fire point productis available from https://worldview.earthdata.nasa.gov/. We wouldalso like to thank the anonymous reviewers for their valuablecomments, which greatly improved the quality of this paper. Theproject is partly funded by the University and State of Bremenand the German Science Foundation (DFG) Trans Regio SFB“Arctic Amplification TR 172”. This work was partly supported bythe European Space Agency as part of the Aerosol_CCI project.This research is in part a contribution by IUP/UB to MARUMa DFG-Research Center/Cluster of Excellence “The Ocean in theEarth System” (OC-CCP1).
The article processing charges for this open-accesspublication were covered by the University of Bremen.
Edited by: Alma HodzicReviewed by: three anonymous referees
References
American Academy of Pediatrics Committee on EnvironmentalHealth: Ambient air pollution: respiratory hazards to children,Pediatrics, 91, 1210–1213, 1993.
Chung, C. E., Ramanathan, V., and Kiehl, J. T.: Ef-fect of the South Asian absorbing haze on the north-east monsoon and surface–air heat exchange, J. Cli-mate, 15, 2462–2476, https://doi.org/10.1175/1520-0442(2002)015<2462:EOTSAA>2.0.CO;2, 2002.
www.atmos-chem-phys.net/18/2511/2018/ Atmos. Chem. Phys., 18, 2511–2523, 2018
2522 L. Mei et al.: XBAER-derived aerosol optical thickness
Dadvand, P., Parker, J., Bell, M. L., Bonzini, M., Brauer, M., Dar-row, L. A., Gehring, U., Glinianaia, S. V., Gouveia, N., Ha, E.-H.,Leem, J. H., van den Hooven, E. H., Jalaludin, B., Jesdale, B. M.,Lepeule, J., Morello-Frosch, R., Morgan, G. G., Pesatori, A. C.,Pierik, F. H., Pless-Mulloli, T., Rich, D. Q., Sathyanarayana, S.,Seo, J., Slama, R., Strickland, M., Tamburic, L., Wartenberg, D.,Nieuwenhuijsen, M. J., and Woodruff, T. J.: Maternal exposureto particulate air pollution and term birth weight: a multi-countryevaluation of effect and heterogeneity, Environ. Health Persp.,121, 367–373, https://doi.org/10.1289/ehp.1205575, 2013.
de Leeuw, G., Holzer-Popp, T., Bevan, S., Davies, W., Descloitres,J., Grainger, R. G., Griesfeller, J., Heckel, A., Kinne, S., Klüser,L., Kolmonen, P., Litvinov, P., Martynenko, D., North, P. J. R.,Ovigneur, B., Pascal, N., Poulsen, C., Ramon, D., Schulz, M.,Siddans, R., Sogacheva, L., Tanré, D., Thomas, G. E., Virtanen,T. H., von Hoyningen Huene, W., Vountas, M., and Pinnock, S.: Evaluation of seven European aerosol optical depth retrievalalgorithms for climate analysis, Remote Sensing Environment,162, 295–315, 2015.
Diner, D. J., Martonchik, J. V., Kahn, R. A., Pinty, B., Gobron, N.,Nelson, B. N., and Holben, B. N.: Using angular and spectralshape similarity constraints to improve MISR aerosol and surfaceretrievals over land, Remote Sens. Environ., 94, 155–171, 2005.
Dubovik, O., Sinyuk, A., Lapyonok, T., Holben, B. N.,Mishchenko, M., Yang, P., Eck. T. F., Volten, H., Munoz, O.,Veihelmann, B., van der Zande, W. J., Leon, J.-F., Sorokin, M.,and Slutsker, I.: Application of spheroid models to ac-count for aerosol particle nonsphericity in the remote sens-ing of desert dust, J. Geophys. Res.-Atmos., 111, D11208,https://doi.org/10.1029/2005JD006619, 2006.
Dubovik, O., Lapyonok, T., Litvinov, P., Herman, M., Fuertes, D.,Ducos, F., Torres, B., Derimian, Y., Huang, X., Lopain, A.,Chaikovsky, A., Aspetsberger, M., and Federspiel, C.: GRASP:a versatile algorithm for characterizing the atmosphere, SPIENewsroom, 1–4, https://doi.org/10.1117/2.1201408.005558,2014.
Eck, T. F., Holben, B. N., Reid, J. S., Dubovik, O., Smirnov,A., O’Neill, N. T., Slutsker, I., and Kinne, S.: Wavelength de-pendence of the optical depth of biomass burning, urban, anddesert dust aerosols, J. Geophys. Res.-Atmos., 104, 31333–31349, 1999.
Evan, A. T., Kossin, J. P., Chung, C. E., and Ramanathan, V.:Arabian Sea tropical cyclones intensified by emissionsof black carbon and other aerosols, Nature, 479, 94–97,https://doi.org/10.1038/nature10552, 2011.
Holzer-Popp, T., de Leeuw, G., Griesfeller, J., Martynenko, D.,Klüser, L., Bevan, S., Davies, W., Ducos, F., Deuzé, J. L.,Graigner, R. G., Heckel, A., von Hoyningen-Hüne, W., Kol-monen, P., Litvinov, P., North, P., Poulsen, C. A., Ramon,D., Siddans, R., Sogacheva, L., Tanre, D., Thomas, G. E.,Vountas, M., Descloitres, J., Griesfeller, J., Kinne, S., Schulz,M., and Pinnock, S.: Aerosol retrieval experiments in theESA Aerosol_cci project, Atmos. Meas. Tech., 6, 1919–1957,https://doi.org/10.5194/amt-6-1919-2013, 2013.
Holben, B. N., Eck, T. F., Slutsker, I., Tanre, D., Buis, J. P., Set-zer, A., Vermote, E., Reagan, J. A., Kaufman, Y. J., Nakajima, T.,Lavenu, F., Jankowiak, I., and Smirnov, A.: AERONET – a fed-erated instrument network and data archive for aerosol character-ization, Remote Sensing Environment, 66, 1–16, 1998.
Hsu, N. C., Jeong, M.-J., Bettenhausen, C., Sayer, A. M.,Hansell, R., Seftor, C. S., Huang, J., and Tsay, S.-C.: En-hanced Deep Blue aerosol retrieval algorithm: The sec-ond generation, J. Geophys. Res.-Atmos., 118, 9296–9315,https://doi.org/10.1002/jgrd.50712, 2013.
Ichoku, C., Chu, D., Mattoo, S., Kaufman, Y. J., Remer,L., Tanre, D., Slutsker, I., and Holben, N. B.: A spatio-temporal approach for global validation and analysis ofMODIS aerosol products, Geophys. Res. Lett., 29, 1616,https://doi.org/10.1029/2001GL013206, 2002.
Ji, D. S., Wang, Y. S., Wang, L. L., Chen, L. F., Hu, B.,Tang, G. Q., Xin, J. Y., Song, T., Wen, T. X., Sun, Y., Pan, Y. P.,and Liu, Z. R.: Analysisi of heavy pollution episodes in se-lected cities of northern China, Atmos. Res., 50, 338–348,https://doi.org/10.1016/j.atmosenv.2011.11.053, 2012.
Kaufman, Y. J., Tanre, D., and Boucher, O.: A satelite viewof aerosols in the climate system, Nature, 419, 215–223,https://doi.org/10.1038/nature01091, 2002.
Kolmonen, P., Sogacheva, L., Virtanen, T. H., de Leeuw, G.,and Kulmala, M.: The ADV/ASV AATSR aerosol re-trieval algorithm: current status and presentation of a full-mission AOD dataset, Int. J. Digit. Earth, 9, 545–561,https://doi.org/10.1080/17538947.2015.1111450, 2016.
Levy, R., Remer, L., Mattoo, S., Vermote, E., and Kauf-man, Y. J. : Second-generation operational algorithm:Retrieval of aerosol properties over land from inversionof Moderate Resolution Imaging Spectroradiometer spec-tral reflectance, J. Geophys. Res.-Atmos., 112, D13211,https://doi.org/10.1029/2006JD007811, 2007.
Levy, R. C., Mattoo, S., Munchak, L. A., Remer, L. A., Sayer, A.M., Patadia, F., and Hsu, N. C.: The Collection 6 MODIS aerosolproducts over land and ocean, Atmos. Meas. Tech., 6, 2989–3034, https://doi.org/10.5194/amt-6-2989-2013, 2013.
Li, Z. Q., Li, C., Chen, H., Tsay, S.-C., Holben, B., Huang, J.,Li, B., Maring, H., Qian, Y., Shi, G., Xia, X., Yin, Y.,Zheng, Y., and Zhuang, G.: East Asian studies of tropo-spheric aerosols and their impact on regional climate (EAST-AIRC): an overview, J. Geophys. Res.-Atmos., 116, D00K34,https://doi.org/10.1029/2010JD015257, 2011.
Lin, M., Tao, J., Chan, C. Y., Cao, J. J, Zhang, Z. S., Zhu, L. H.,and Zhang, R. J.: Regression analyses between recent airquality and visibility changes in megacities at four haze re-gions in China, Aerosol Air Qual. Res., 12, 1049–1061,https://doi.org/10.4209/aaqr.2011.11.0220, 2012.
Liu, X. G., Li, J., Qu, Y., Han, T., Hou, L., Gu, J., Chen, C., Yang,Y., Liu, X., Yang, T., Zhang, Y., Tian, H., and Hu, M.: Formationand evolution mechanism of regional haze: a case study in themegacity Beijing, China, Atmos. Chem. Phys., 13, 4501–4514,https://doi.org/10.5194/acp-13-4501-2013, 2013.
Lyapustin, A., Wang, Y., Laszlo, I., Kahn, R., Korkin, S.,Remer, L., Levy, R., and Reid, J. S.: Multiangle im-plementation of atmospheric correction (MAIAC): 2.Aerosol algorithm, J. Geophys. Res.-Atmos., 116, D03211,https://doi.org/10.1029/2010JD014986, 2011.
Mei, L., Rozanov, V. V., Vountas, M., Burrows, J. P.,Levy, R. C., and Lotz, W. A.: Retrieval of aerosol opticalproperties using MERIS observations: algorithm and somefirst results, Remote Sensing Environment, 197, 125–141,https://doi.org/10.1016/j.rse.2016.11.015, 2017a.
Atmos. Chem. Phys., 18, 2511–2523, 2018 www.atmos-chem-phys.net/18/2511/2018/
L. Mei et al.: XBAER-derived aerosol optical thickness 2523
Mei, L. L., Vountas, M., Gómez-Chova, L., Rozanov, V.,Jäger, M., Lotz, W., Burrows, J. P., and Hollmann, R.: A Cloudmasking algorithm for the XBAER aerosol retrieval usingMERIS data, Remote Sensing Environment, 197, 141–160,https://doi.org/10.1016/j.rse.2016.11.016, 2017b.
North, P., Briggs, S., Plummer, S., and Settle, J.: Retrieval of landsurface bidirectional reflectance and aerosol opacity from ATSR-2 multiangle imagery, IEEE T. Geosci. Remote, 37, 526–537,1999.
Pudasainee, D., Sapkota, B., Shrestha, M. L., Kaga, A., Kondo, A.,and Inoue, Y.: Ground level ozone concentrations and itsassociation with NOx and meteorological parameters inKathmandu valley, Nepal, Atmos. Environ., 40, 8081–8087,https://doi.org/10.1016/j.atmosenv.2006.07.011, 2006.
Popp, T., deLeeuw, G., Bingen, C., Brühl, C., Capelle, V., Chedin,A., Clarisse, L., Dubovik, O., Grainger, R., Griesfeller, J.,Heckel, A., Kinne, S., Klüser, L., Kosmale, M., Kolmonen,P., Lelli,L., Litvinov, P., Mei, L., North, P., Pinnock,S., Povey,A., Robert, C., Schulz, M., Sogacheva, L., Stebel, K., Zweers,D. S., Thomas, G., Gijsbert Tilstra, L., Vandenbussche, S.,Veefkind, P., Vountas, M., and Xue, Y.: : Development, pro-duction and evaluation of aerosol climate data records from eu-ropean satellite observations (Aerosol_cci), Remote Sensing, 8,421, https://doi.org/10.3390/rs8050421, 2016.
Richter, A., Begoin, M., Hilboll, A., and Burrows, J. P.: An im-proved NO2 retrieval for the GOME-2 satellite instrument, At-mos. Meas. Tech., 4, 1147–1159, https://doi.org/10.5194/amt-4-1147-2011, 2011.
Rienecker, M. M., Suarez, M. J., Gelaro, R., Todling, R., Bacmeis-ter, J., Liu, R., Bosilovich, M. G., Schubert, S. D., Takacs, L.,Kim, G-K, Bloom, S., Chen, J., Collins, D., Conaty, A., daSilva, A., Gu, W., Joiner, J., Koster, R. D., Lucchesi, R.,Molod, A., Owens, T., Pawson, S., Pegion, P., Redder, C. R., Re-ichle, R., Robertson, F. R., Ruddick, A. G., Sienkiewicz, M., andWoollen, J.: MERRA: NASA’s Modern-Era Retrospective Anal-ysis for Research and Applications, J. Climate, 24, 3624–3648,2011.
Rozanov, V., Rozanov, A., Kokhanovsky, A., and Burrows, J.: Ra-diative transfer through terrestrial atmosphere and ocean: soft-ware package SCIATRAN, J. Quant. Spectrosc. Ra., 133, 13–71,2014.
Santer, R., Ramon, D., Vidot, J., and Dilligeard, E.: A surface re-flectance model for aerosol remote sensing over land, Int. J. Re-mote Sens., 28, 737–760, 2007.
Sayer, A. M., Hsu, N. C., Bettenhausen, C., Ahmad, Z., Holben, B.,Smirnov, A., Thomas, G. E., and Zhang, J.: SeaWiFS OceanAerosol Retrieval (SOAR): algorithm, validation, and compari-son with other data sets, J. Geophys. Res.-Atmos., 117, D03206,https://doi.org/10.1029/2011JD016599, 2012.
Sezer, T. F., Nuhoglu, A., and Bayraktar, H.: Impacts ofsome meteorological parameters on SO2 and TSP concen-trations in Erzurum, Turkey, Chemosphere, 59, 1633–1642,https://doi.org/10.1016/j.chemosphere.2005.02.003, 2005.
Sinnhuber, B.-M., Sheode, N., Sinnhuber, M., Chipperfield, M. P.,and Feng, W.: The contribution of anthropogenic bromine emis-sions to past stratospheric ozone trends: a modelling study, At-mos. Chem. Phys., 9, 2863–2871, https://doi.org/10.5194/acp-9-2863-2009, 2009.
Smirnov, A., Holben, B. N., Eck, T. F., Dubovik, O., andSlutsker, I.: Cloud-screening and quality control algorithms forthe AERONET database, Remote Sens. Environ., 73, 337–349,2000.
Sogacheva, L., Kolmonen, P., Virtanen, T. H., Rodriguez, E.,Saponaro, G., and de Leeuw, G.: Post-processing to removeresidual clouds from aerosol optical depth retrieved using the Ad-vanced Along Track Scanning Radiometer, Atmos. Meas. Tech.,10, 491–505, https://doi.org/10.5194/amt-10-491-2017, 2017.
Thomas, G. E., Poulsen, C. A., Sayer, A. M., Marsh, S. H., Dean, S.M., Carboni, E., Siddans, R., Grainger, R. G., and Lawrence, B.N.: The GRAPE aerosol retrieval algorithm, Atmos. Meas. Tech.,2, 679–701, https://doi.org/10.5194/amt-2-679-2009, 2009.
Verstraete, M. M., Pinty, B., and Curran, P. J.: MERIS potential forland applications, Int. J. Remote Sens., 20, 1747–1756, 1999.
von Hoyningen-Huene, W., Freitag, M., and Burrows, J. P.: Re-trieval of aerosol optical thickness over land surface from top-of-atmosphere radiance, J. Geophys. Res.-Atmos., 108, D9,https://doi.org/10.1029/2001JD002018, 2003.
von Hoyningen-Huene, W., Yoon, J., Vountas, M., Istomina, L. G.,Rohen, G., Dinter, T., Kokhanovsky, A. A., and Burrows, J. P.:Retrieval of spectral aerosol optical thickness over land usingocean color sensors MERIS and SeaWiFS, Atmos. Meas. Tech.,4, 151–171, https://doi.org/10.5194/amt-4-151-2011, 2011.
Wilkomirski, B., Sudnik-Wojcikowska, B., Galera, H.,Wierzbicka, M., and Malawska, M.: Railway transportationas a serious source of organic and inorganic pollutionn, WaterAir Soil Poll., 218, 333–345, https://doi.org/10.1007/s11270-010-0645-0, 2011.
Winkler, P.: The growth of atmospheric aerosol parti-cles with relative humidity, Phys. Scripta, 37, 223–230,https://doi.org/10.1088/0031-8949/37/2/008, 1988.
Zhao, P. S., Zhang, X. L., Xu, X. F., and Zhao, X. J.: Long-term visibility trends and characteristics in the region of Bei-jing, Tianjin, and Hebei, China, Atmos. Res., 101, 711–718,https://doi.org/10.1016/j.atmosres.2011.04.019, 2011.
Zheng, G. J., Duan, F. K., Su, H., Ma, Y. L., Cheng, Y., Zheng,B., Zhang, Q., Huang, T., Kimoto, T., Chang, D., Pöschl, U.,Cheng, Y. F., and He, K. B.: Exploring the severe winter haze inBeijing: the impact of synoptic weather, regional transport andheterogeneous reactions, Atmos. Chem. Phys., 15, 2969–2983,https://doi.org/10.5194/acp-15-2969-2015, 2015.
www.atmos-chem-phys.net/18/2511/2018/ Atmos. Chem. Phys., 18, 2511–2523, 2018