Embed Size (px)
Citation preview
x
y
1. Which of the following is the equation of the line shown?
3x32y
2x32y
3x23y
2x23y
3x23y
a.
b.
c.
d.
e.
3. Write the equation of the line which passes through the points (3, 10) and (–1, 2).
Exit Ticket
2. Write the equation of the line with slope and that passes through
the point (8, –3).
2
1
72
1 xy
4x2y
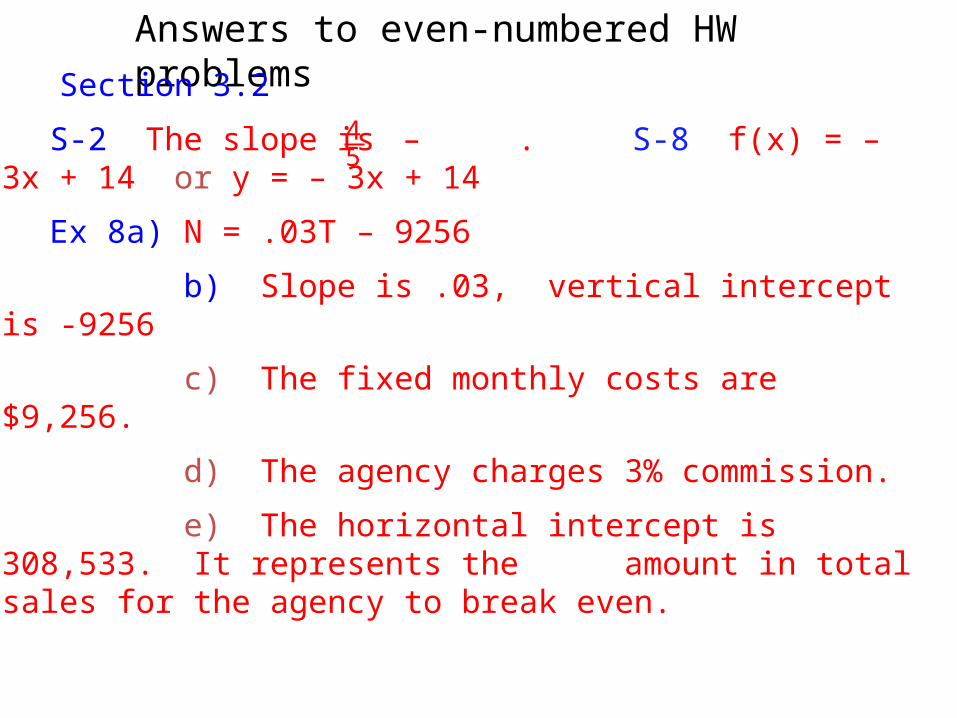
Answers to even-numbered HW problems
Section 3.2
S-2 The slope is – . S-8 f(x) = – 3x + 14 or y = – 3x + 14
Ex 8a) N = .03T – 9256
b) Slope is .03, vertical intercept is -9256
c) The fixed monthly costs are $9,256.
d) The agency charges 3% commission.
e) The horizontal intercept is 308,533. It represents the amount in total sales for the agency to break even.
45

The next screen you see may SCARE some of you.

From IRS Instructions for completing the 1040 individual tax form for 2013
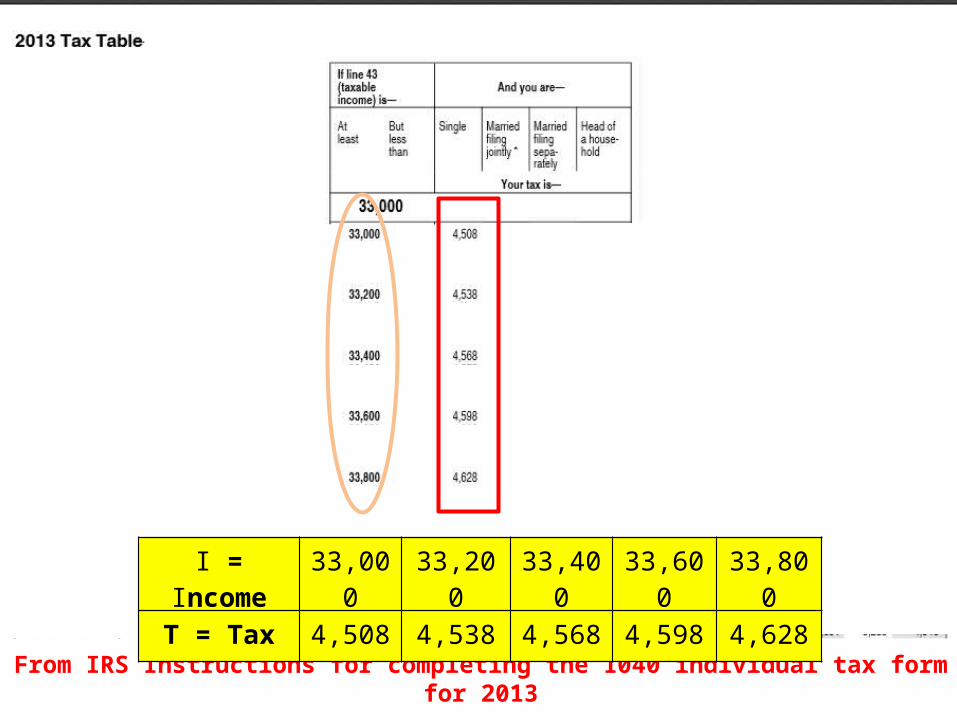
From IRS Instructions for completing the 1040 individual tax form for 2013
I = Income 33,000 33,200 33,400 33,600 33,800
T = Tax 4,508 4,538 4,568 4,598 4,628
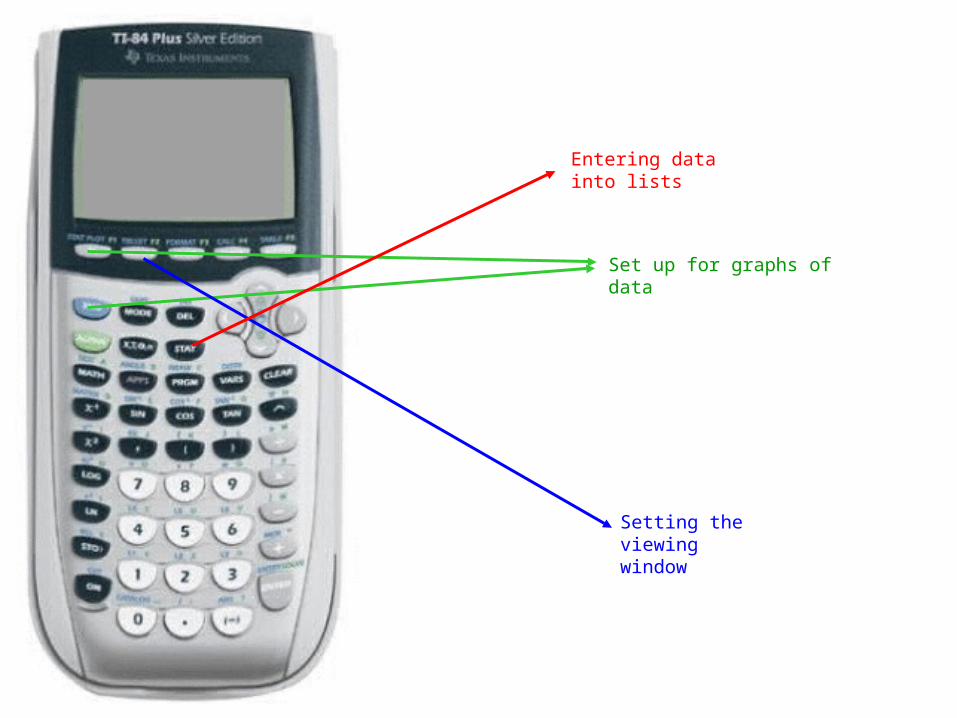
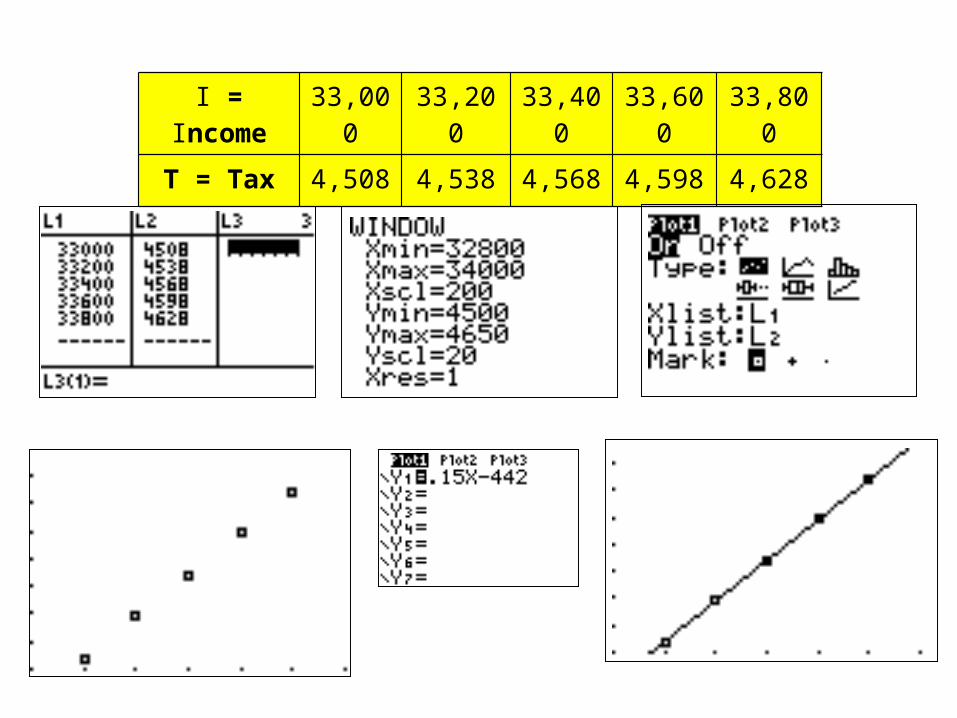
Set up for graphs of data
Setting the viewing window
Entering data into lists

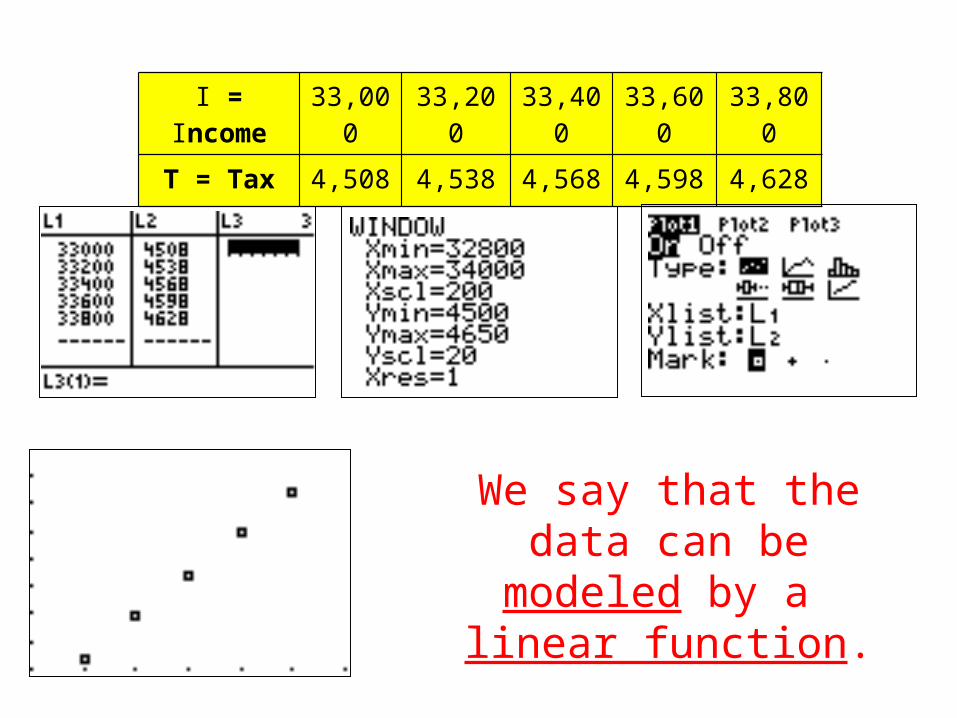
I = Income 33,000 33,200 33,400 33,600 33,800
T = Tax 4,508 4,538 4,568 4,598 4,628
I = Income 33,000 33,200 33,400 33,600 33,800
T = Tax 4,508 4,538 4,568 4,598 4,628
Since the graph of this data appears to be linear, there
should be a linear function that passes through the
data points.
We say that the data can be modeled by a
linear function.
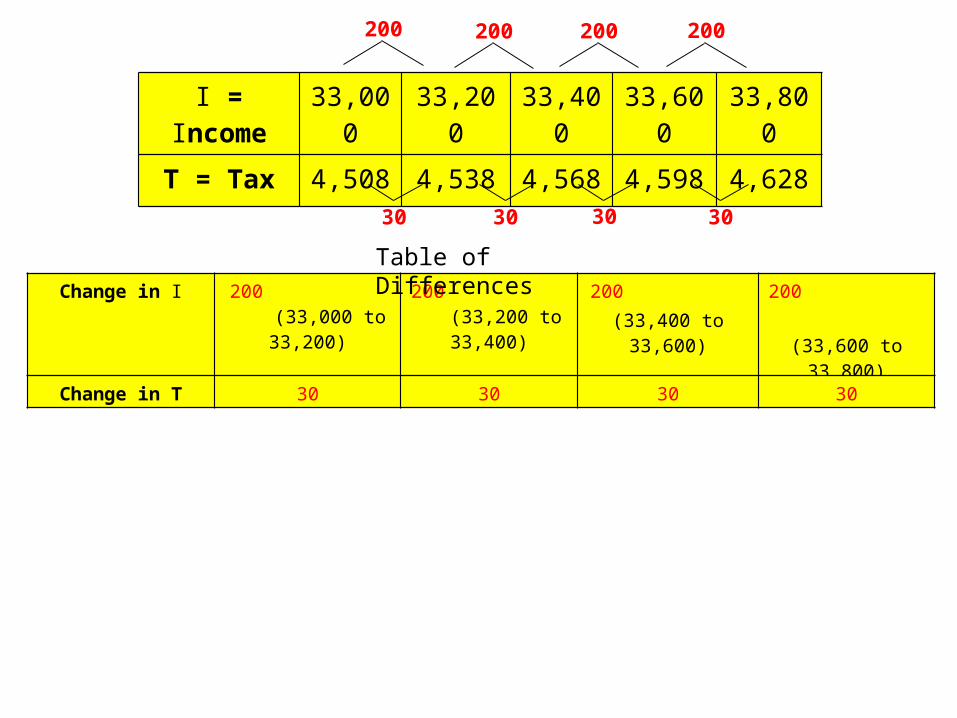
I = Income 33,000 33,200 33,400 33,600 33,800
T = Tax 4,508 4,538 4,568 4,598 4,628
200 200 200 200
30 30 30 30
Change in I 200 (33,000 to 33,200)
200 (33,200 to 33,400)
200 (33,400 to 33,600)
200 (33,600 to 33,800)
Change in T 30 30 30 30
Table of Differences
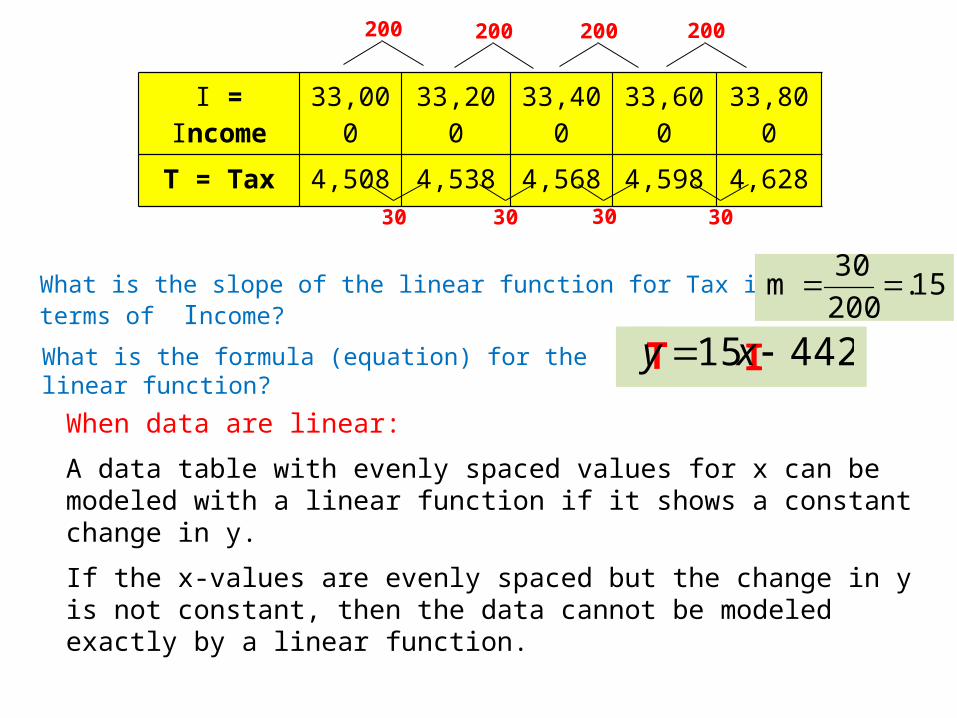
I = Income 33,000 33,200 33,400 33,600 33,800
T = Tax 4,508 4,538 4,568 4,598 4,628
200 200 200 200
30 30 30 30
What is the slope of the linear function for Tax in terms of Income?
What is the formula (equation) for the linear function?
When data are linear:
A data table with evenly spaced values for x can be modeled with a linear function if it shows a constant change in y.
If the x-values are evenly spaced but the change in y is not constant, then the data cannot be modeled exactly by a linear function.
15.200
30m
44215 xy IT
I = Income 33,000 33,200 33,400 33,600 33,800
T = Tax 4,508 4,538 4,568 4,598 4,628

I = Income 48,000
48,600 51,000
54,400
T = Tax 7,935 8,085 8,685 9,535

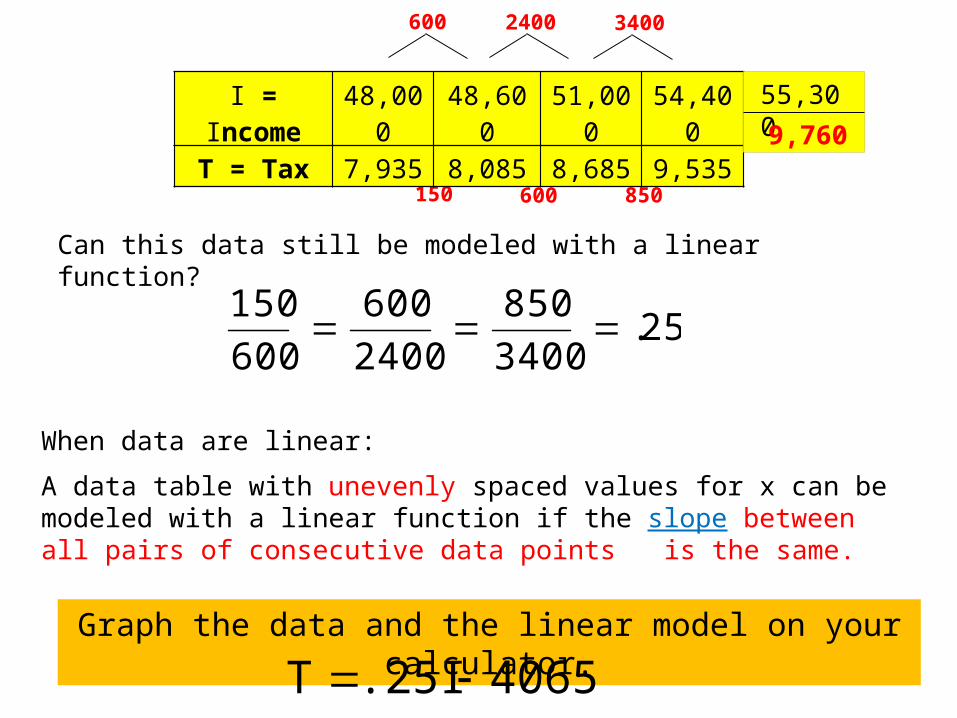
When data are linear:
A data table with unevenly spaced values for x can be modeled with a linear function if the slope between all pairs of consecutive data points is the same.
Can this data still be modeled with a linear function?
600 2400
150 600 850
3400
25.3400
850
2400
600
600
150
I = Income 48,000
48,600 51,000
54,400
T = Tax 7,935 8,085 8,685 9,535
What is the equation for the linear function that models this data? Graph the data and the linear model on your calculator.
4065.25IT
55,300
9,760
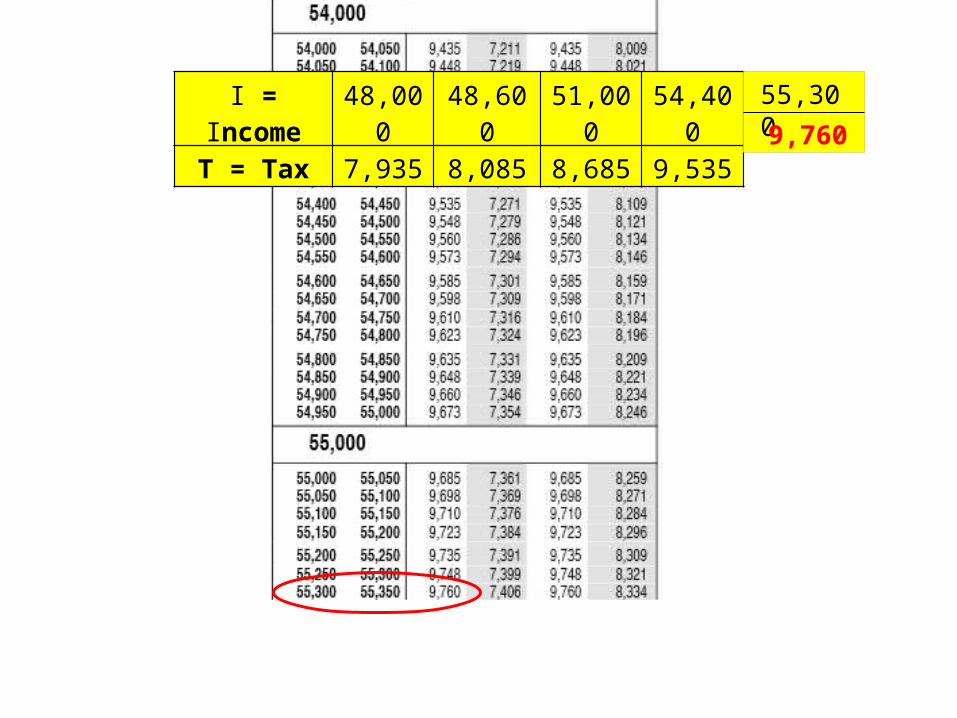
I = Income 48,000
48,600 51,000
54,400
T = Tax 7,935 8,085 8,685 9,535
55,300
9,760
Homework:
Read Section 3.3 (through bottom of page 252)
Page 258 # S-1, S-2, S-3, S-17, S-18
Pages 259–263 # 1, 2, 3, 12

I was on the second day of a road trip when I decided to keep a record of how far I had traveled from home. The table below shows how many hours I drove that day and how far I was away from home. For example, after I had traveled a total of 3½ hours, I was 366 miles away from home.
Number of hours traveled
on day 2
Distance from home (in miles)
2 282
3½ 366
6 506
8 618
8½ 646
Without graphing, determine if the data in the table below are linear.
Exit Ticket
a. Find the linear model (equation) for the data.
b. Graph the data points and the model on your calculator. Call your teacher over to see your calculator screen.
c. How far was I from home at the start of the day?