Embed Size (px)
Citation preview

www.geoinformatics.upol.cz
On Shape Metrics in Landscape Analyses
Vít PÁSZTO
Department of Geoinformatics, Faculty of Science, Palacký University in Olomouc
Reg. č.: CZ.1.07/2.3.00/20.0170

www.geoinformatics.upol.cz
Presentation schedule
• Introduction
• Data used
• Study area
• Methods
• Case study 1 (Results)
• Case study 2 (Results)
• Case study 3 (Initial idea)
• Conclusions
www.geoinformatics.upol.cz
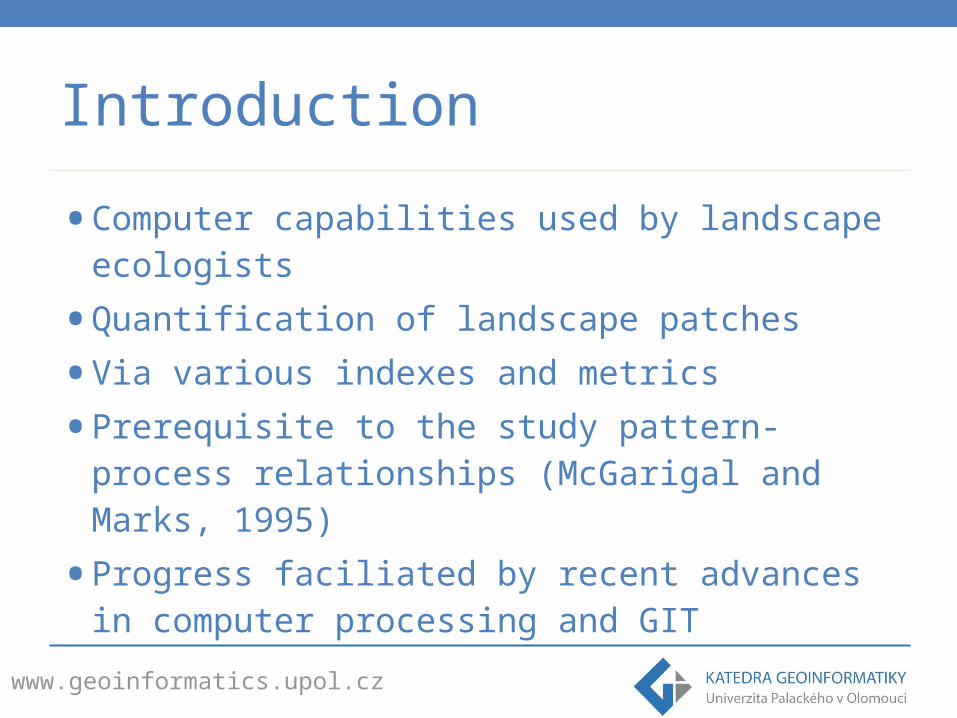
Introduction
• Computer capabilities used by landscape ecologists
• Quantification of landscape patches
• Via various indexes and metrics
• Prerequisite to the study pattern-process relationships (McGarigal and Marks, 1995)
• Progress faciliated by recent advances in computer processing and GIT

www.geoinformatics.upol.cz
Introduction
• Shape and spatial metrics are exactly those methods for quantitative description
• In combination with multivariate statistics, it is possible to evaluate, classify and cluster patches
• Available metrics were used (as many as possible)
• Unusual approach in CLC and city footprint analysis
www.geoinformatics.upol.cz
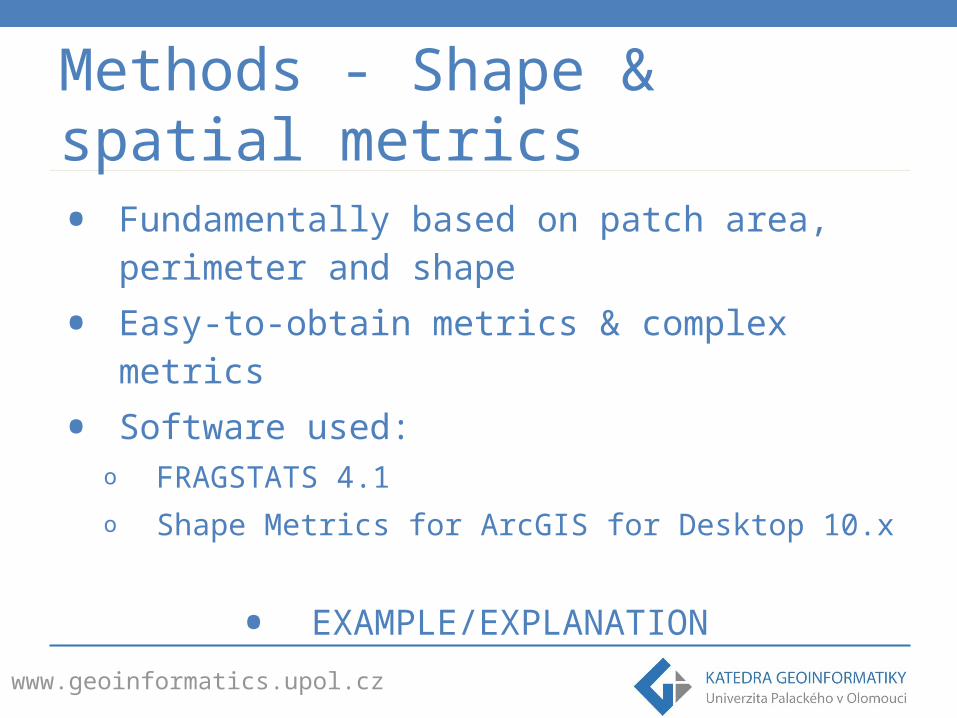
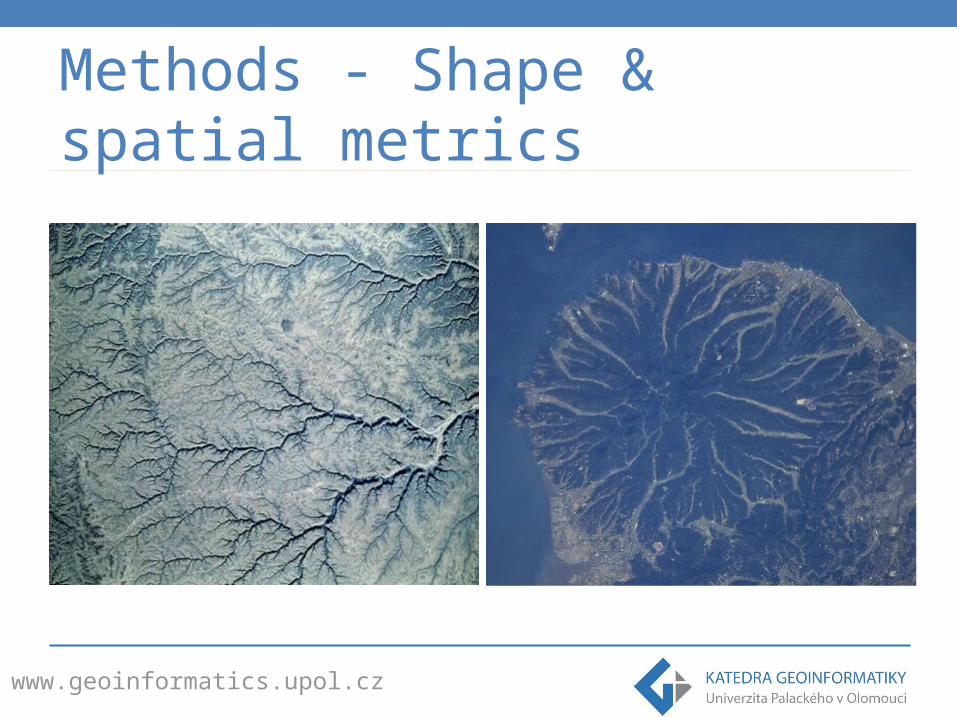
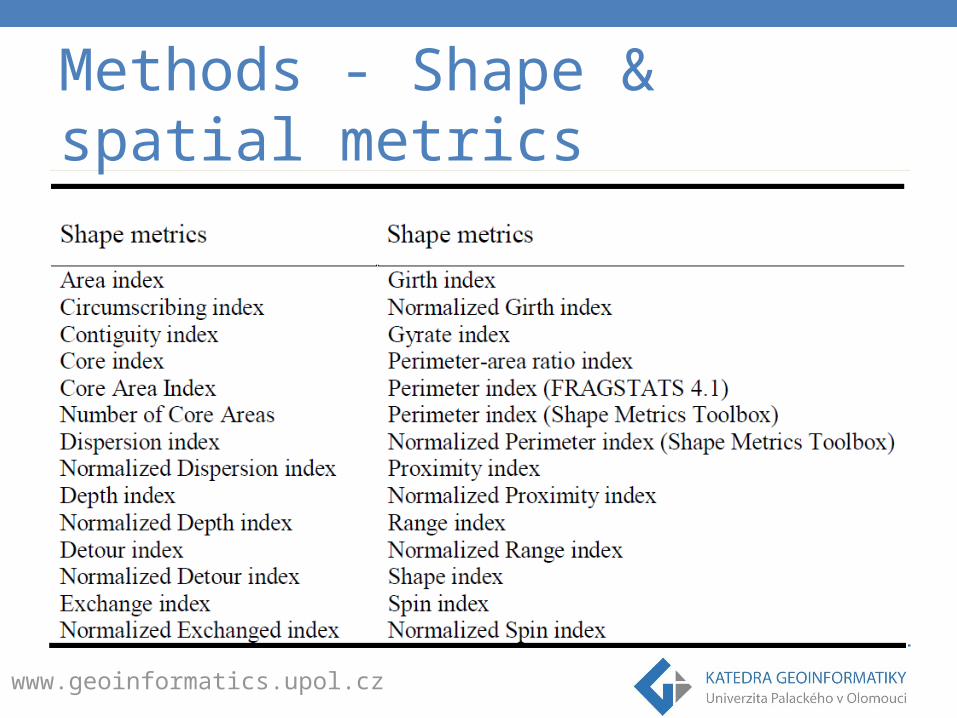
Methods - Shape & spatial metrics
• Fundamentally based on patch area, perimeter and shape
• Easy-to-obtain metrics & complex metrics
• Software used:o FRAGSTATS 4.1o Shape Metrics for ArcGIS for Desktop 10.x
• EXAMPLE/EXPLANATION
www.geoinformatics.upol.cz
Methods - Shape & spatial metrics

www.geoinformatics.upol.cz
Methods - Shape & spatial metrics

www.geoinformatics.upol.cz
Methods - Shape & spatial metrics
www.geoinformatics.upol.cz
Methods - Shape & spatial metrics
www.geoinformatics.upol.cz
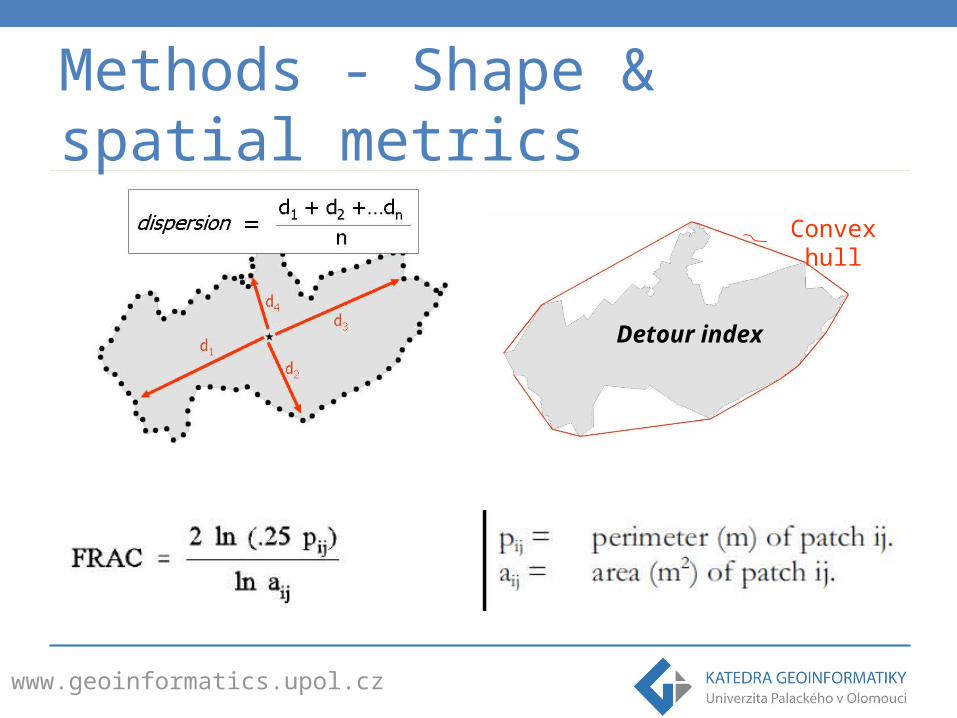
Methods - Shape & spatial metrics
Convex hull
Detour index

www.geoinformatics.upol.cz
Case study 1 - Data
• Freely available CORINE Land Cover dataset:o 1990o 2000o 2006
• Level 1 of CLC - 5 classes:o Artificial surfaceso Agricultural areaso Forest and semi-natural areas
o Wetlandso Water bodies
www.geoinformatics.upol.cz
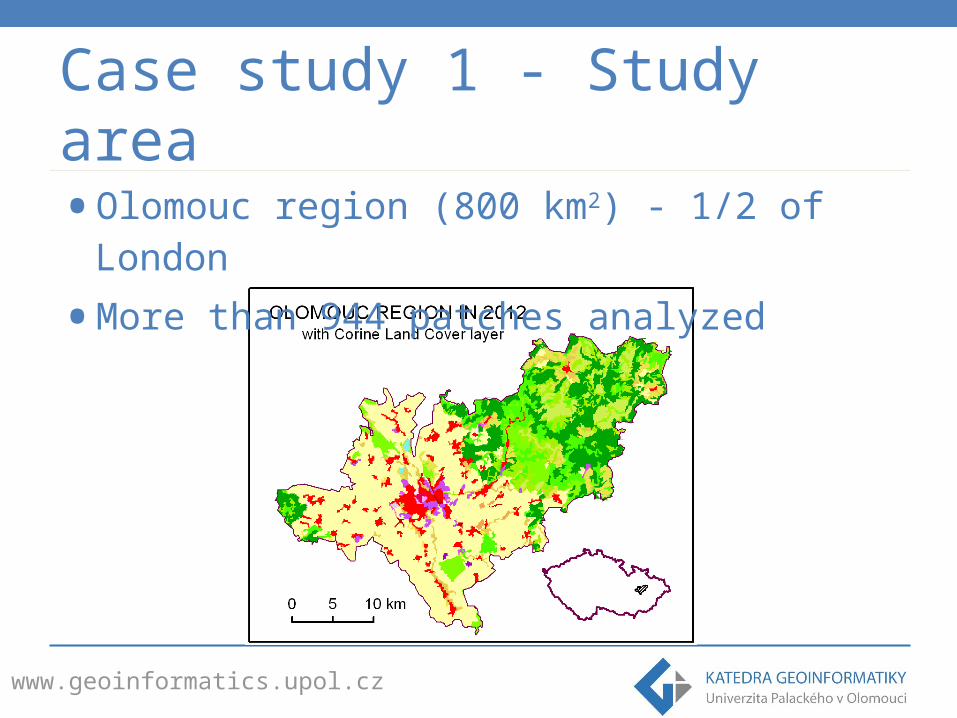
Case study 1 - Study area
• Olomouc region (800 km2) - 1/2 of London
• More than 944 patches analyzed

www.geoinformatics.upol.cz
Case study 1 - Methods
• Principal Component Analysis (PCA) for consequent clustering
• Cluster analysis:o DIvisive ANAlysis clustering (DIANA)o Partitioning Around Medoids (PAM)
• Software - Rstudio environment using R programming language

www.geoinformatics.upol.cz
Case study 1 - Workflow Diagram
CLC (1990, 2000, 2006)
Metrics calculation
PCA Clustering
DIANA
PAM
www.geoinformatics.upol.cz
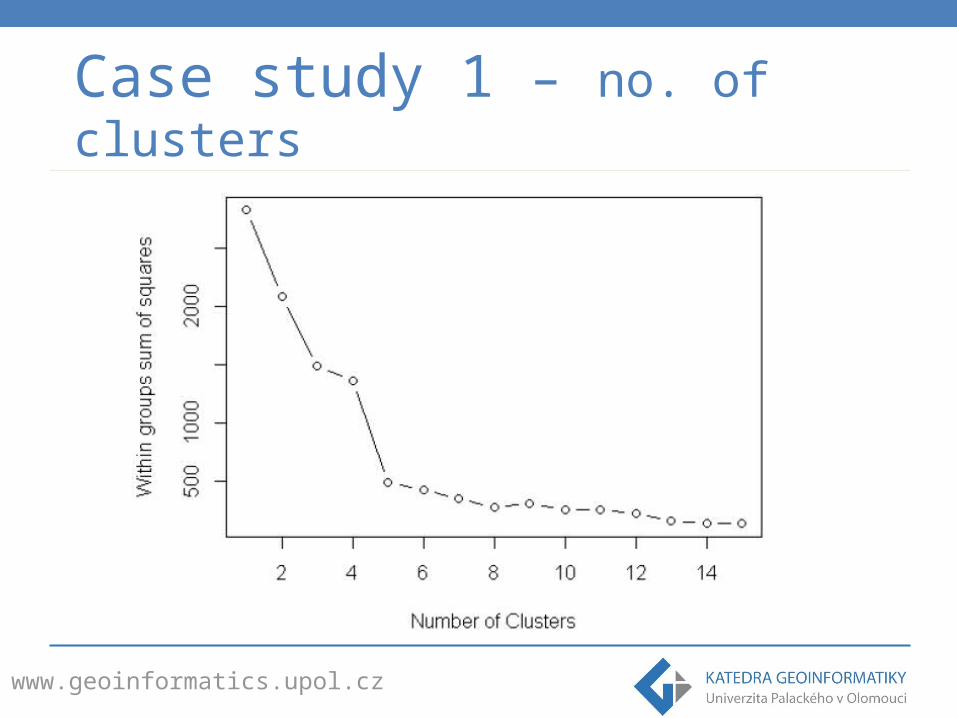
Case study 1 – no. of clusters
www.geoinformatics.upol.cz
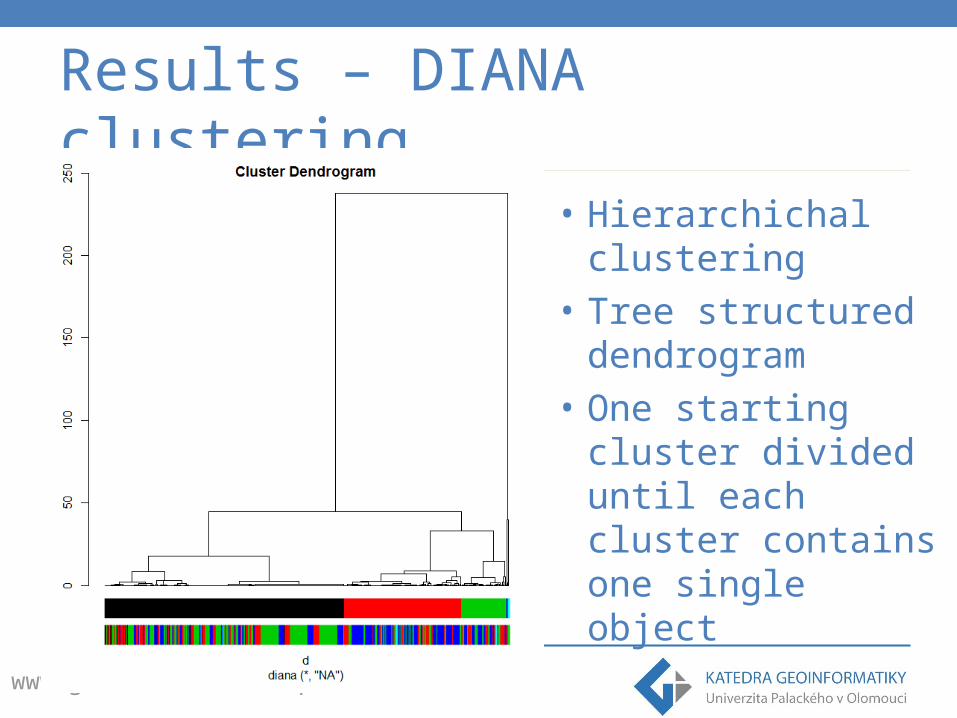
Results – DIANA clustering
• Hierarchichal clustering
• Tree structured dendrogram
• One starting cluster divided until each cluster contains one single object
www.geoinformatics.upol.cz
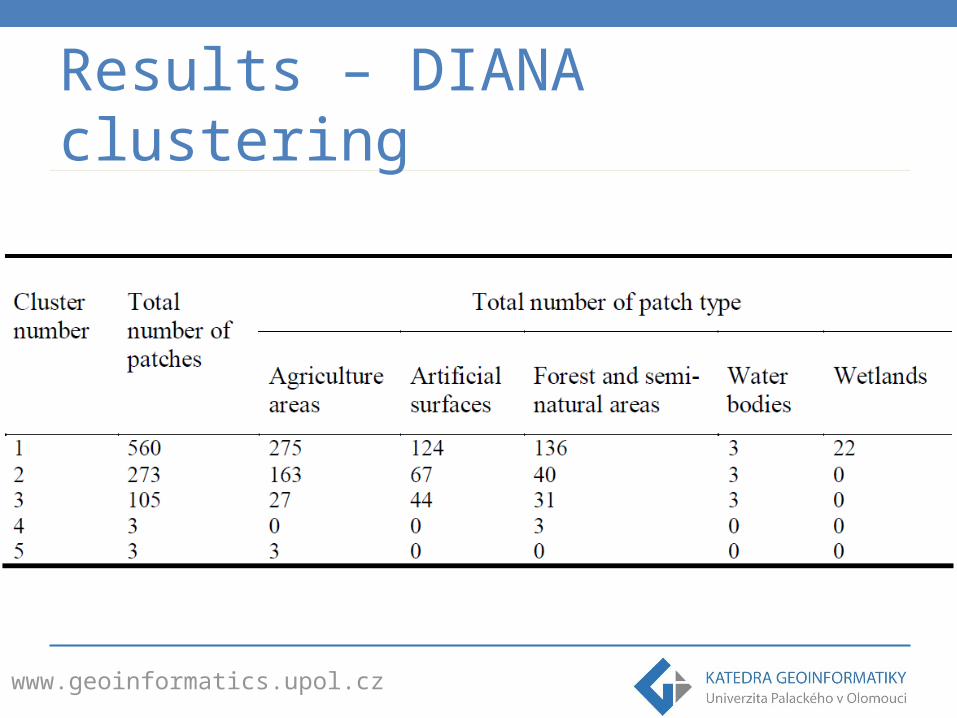
Results – DIANA clustering
www.geoinformatics.upol.cz
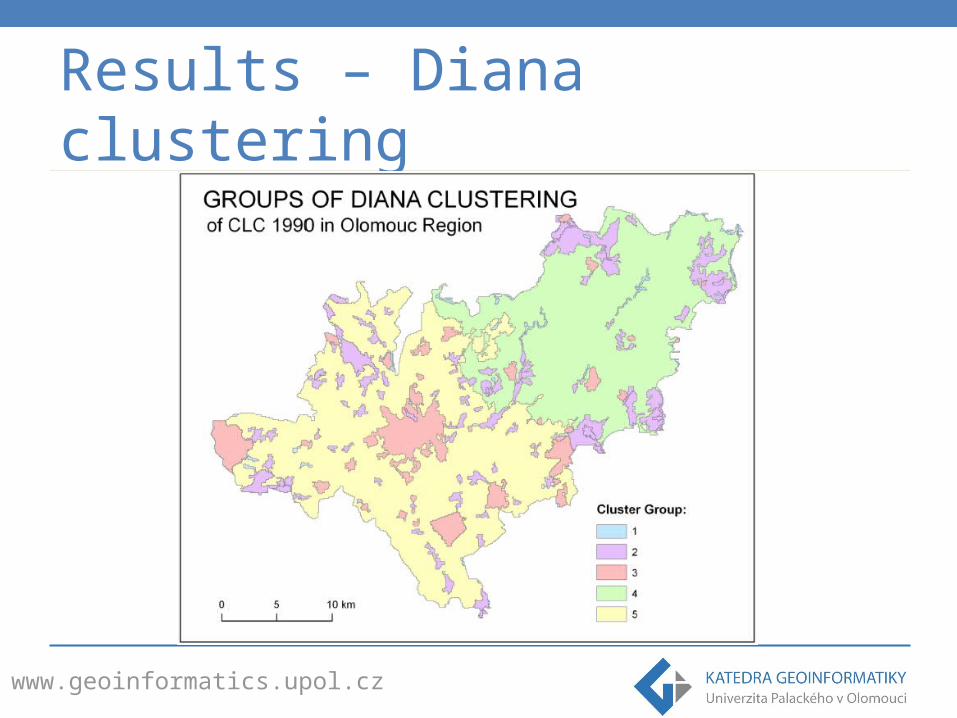
Results – Diana clustering
www.geoinformatics.upol.cz
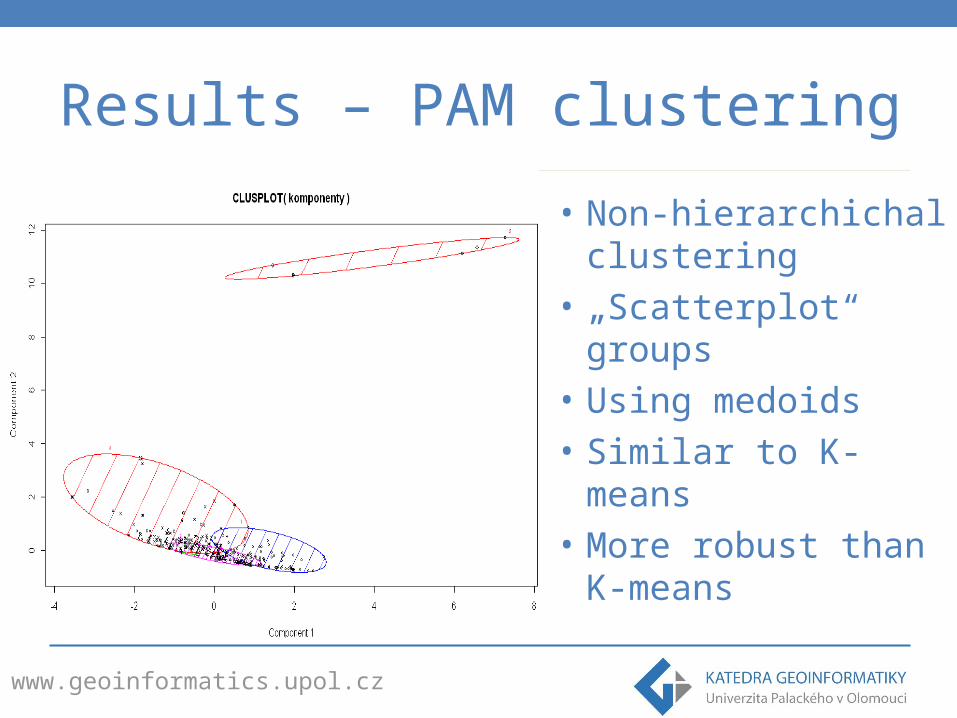
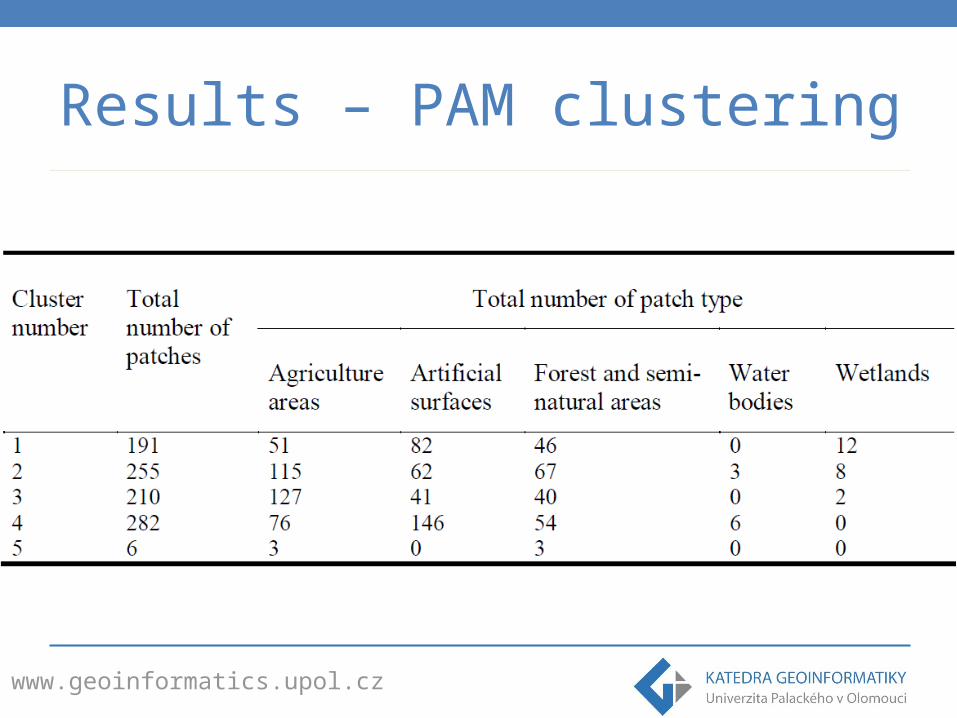
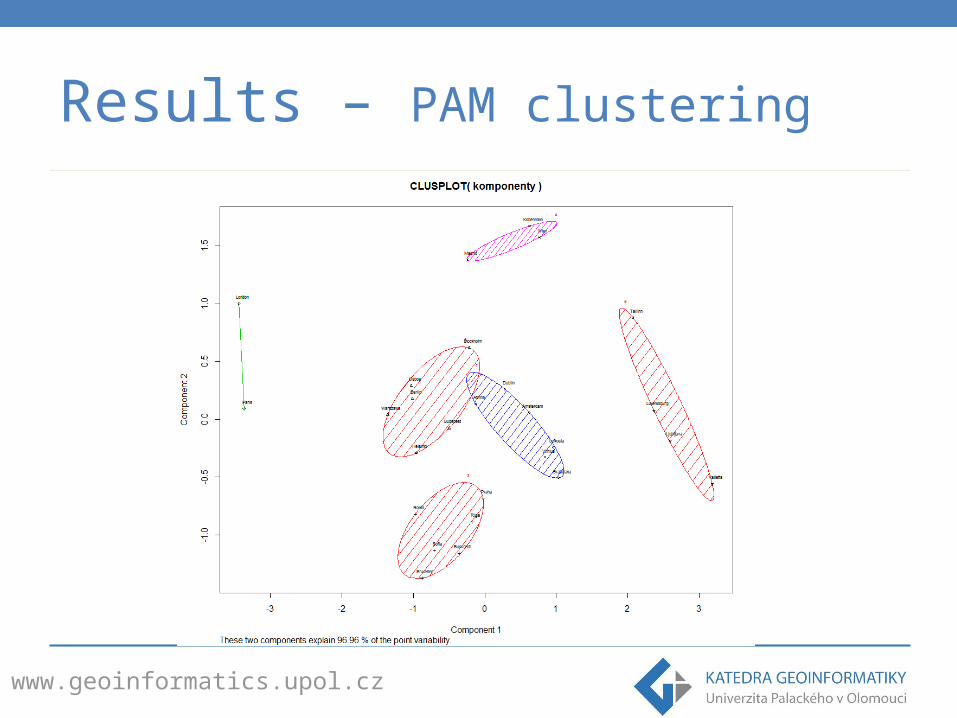
Results – PAM clustering
• Non-hierarchichal clustering
• „Scatterplot“ groups• Using medoids• Similar to K-means• More robust than K-
means
www.geoinformatics.upol.cz
Results – PAM clustering

www.geoinformatics.upol.cz
Results – PAM clustering
www.geoinformatics.upol.cz
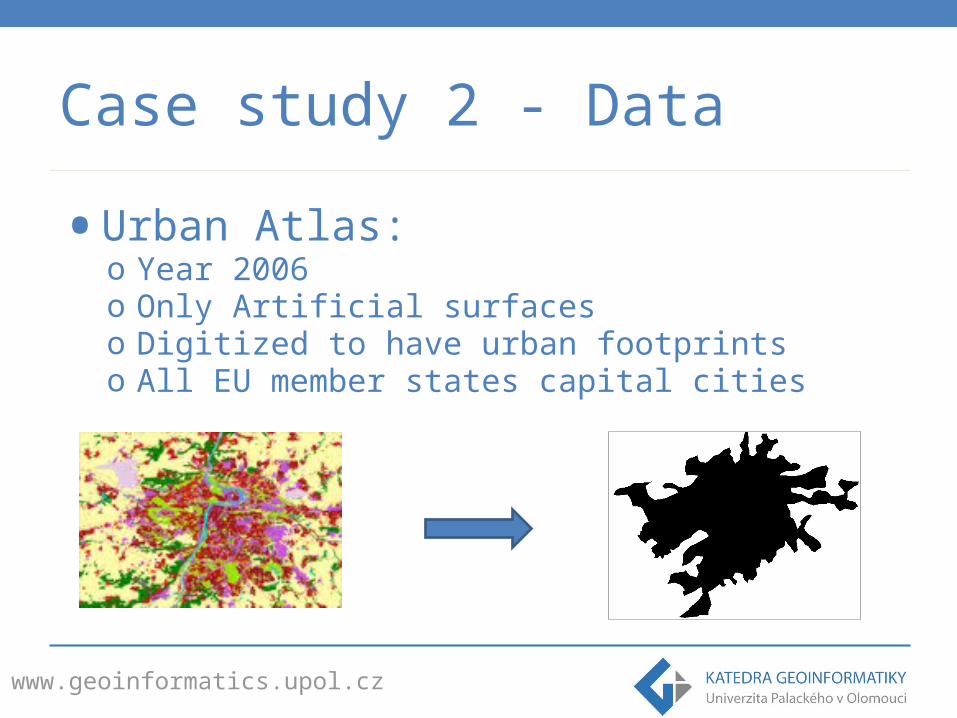
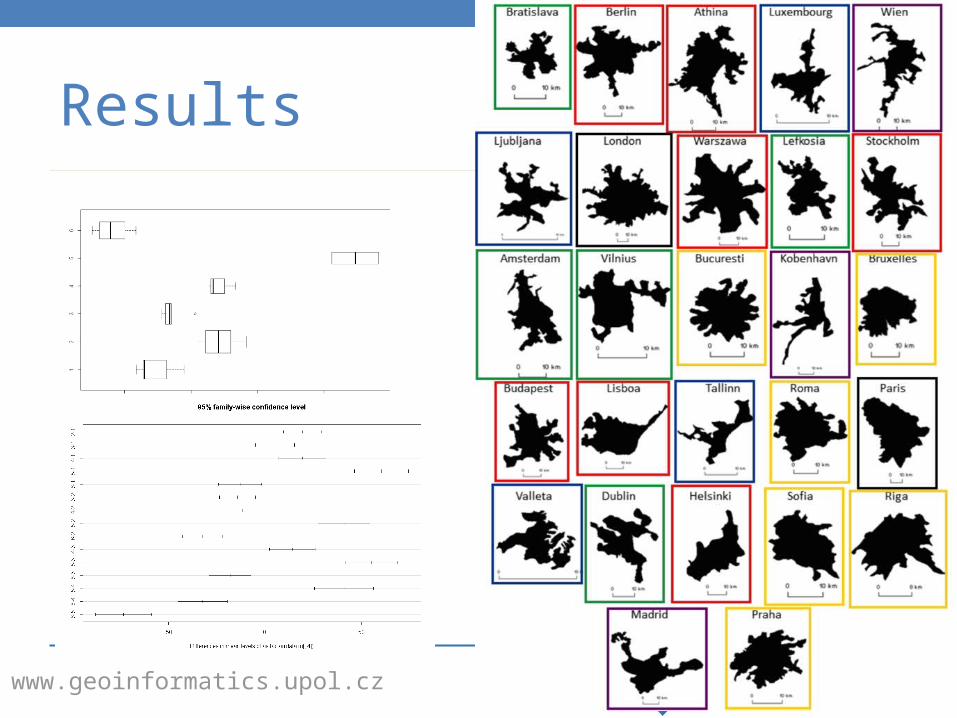
Case study 2 - Data
• Urban Atlas:o Year 2006o Only Artificial surfaceso Digitized to have urban footprintso All EU member states capital cities
www.geoinformatics.upol.cz
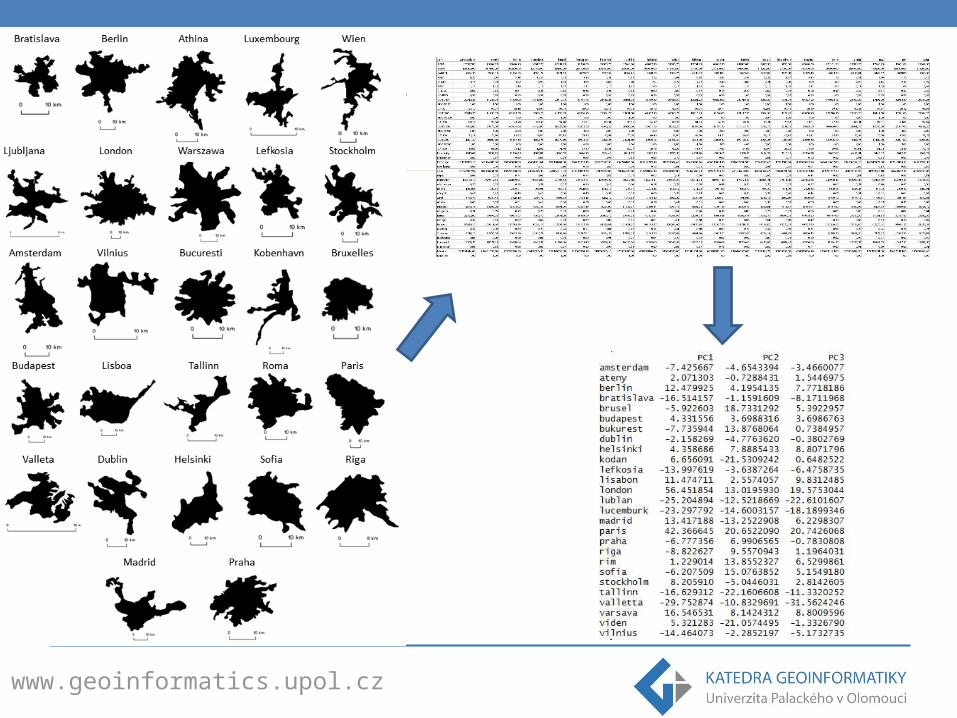
Case study 2

www.geoinformatics.upol.cz
• Fractal Dimension Index• Bruxelles (1.0694) • Vienna (1.1505)
• Cohesion Index• Bruxelles (0,948875) • Tallin (0,636262)
Results

www.geoinformatics.upol.cz
Results
• Elbow diagram (no. of clusters):

www.geoinformatics.upol.cz
Results – DIANA clustering
www.geoinformatics.upol.cz
Results – PAM clustering
www.geoinformatics.upol.cz
Results
www.geoinformatics.upol.cz
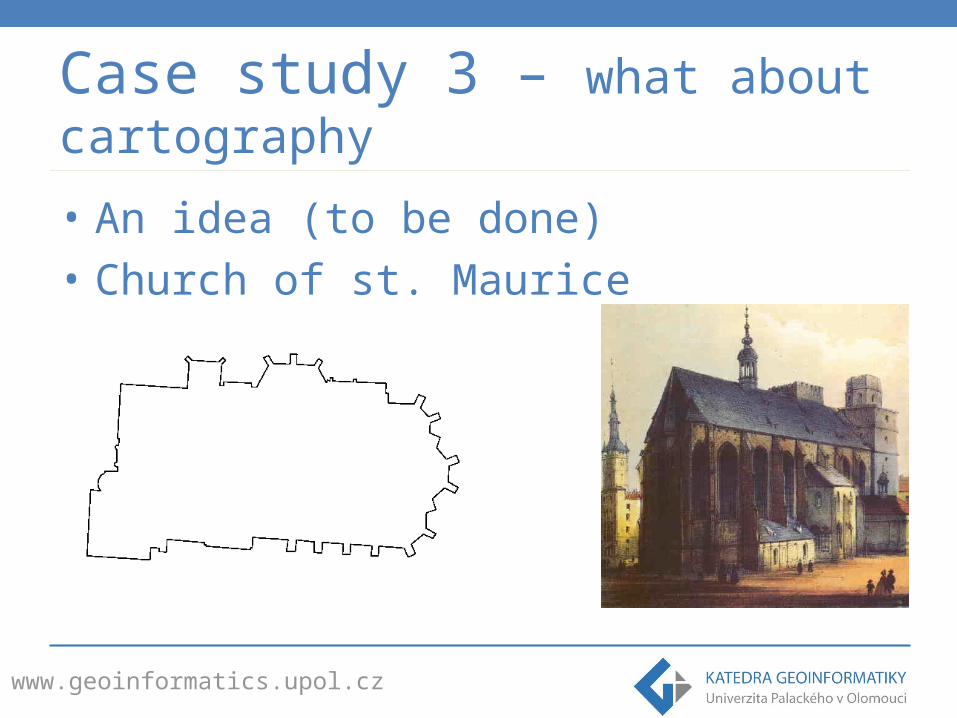
• An idea (to be done)• Church of st. Maurice
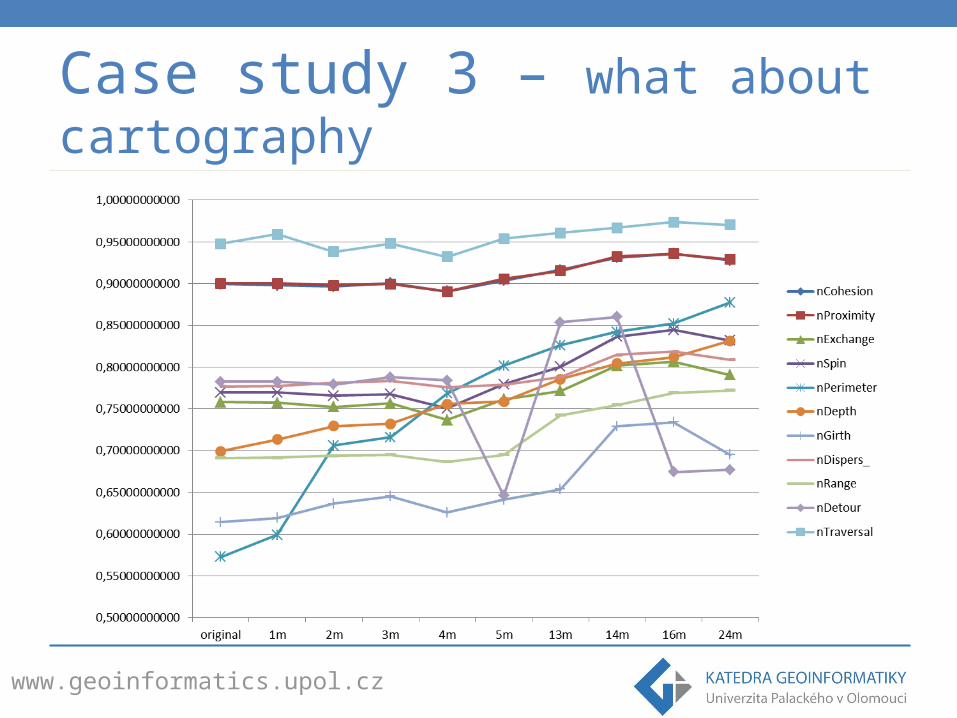
Case study 3 – what about cartography
www.geoinformatics.upol.cz
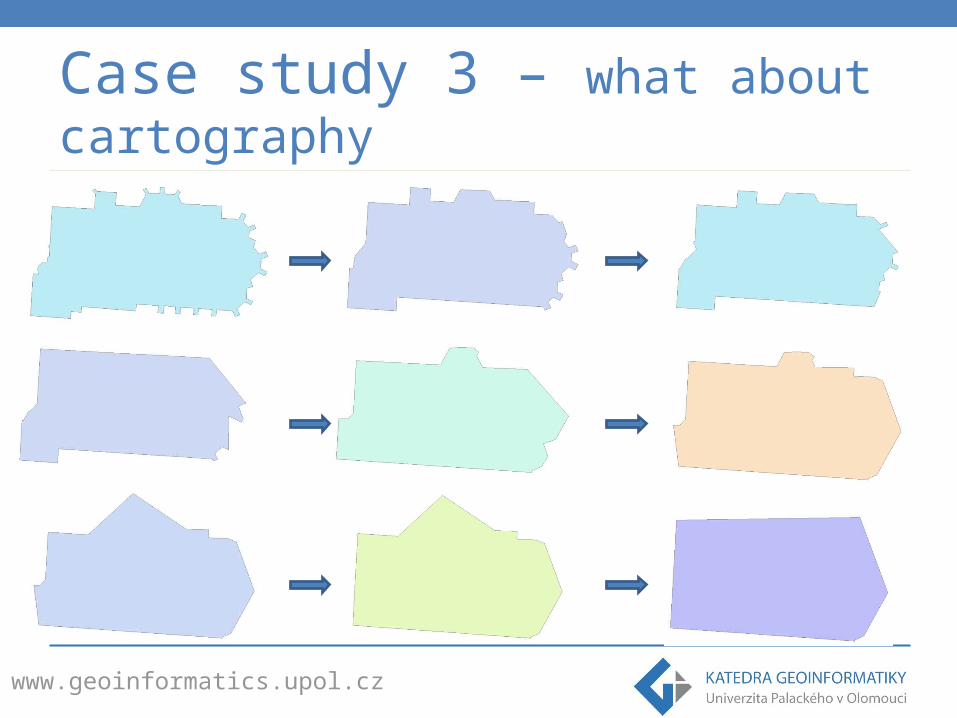
Case study 3 – what about cartography
www.geoinformatics.upol.cz
Case study 3 – what about cartography
www.geoinformatics.upol.cz
Conclusions & Discussion
• Shape Metrics are useful from quantitative point of view
• Tool for (semi)automatic shape recognition via clustering
• Double-edged and difficult interpretation• Strongly purpose-oriented• Geographical context is needed• Input data (raster&vector) sensitivity
www.geoinformatics.upol.cz
Conclusions & Discussion
• Not many reference studies to validate the results
• Shape metrics correlations• There is no consensus about shape metrics
use among the scientists• Proximity and Cohesion index – for centrality
analysis• Fractal dimension, Perim-area, Shape Index –
for line complexity evaluation