Embed Size (px)
Citation preview

www.cme-mec.ca
Roadmap to RecoveryInnovation, Investment, & Growth
Durham Economic Prosperity ConferenceNovember 5th, 2010

www.cme-mec.ca
Moving Forward Together
Strengths Weaknesses
Opportunities Threats

www.cme-mec.ca
Strengths• Regional
– Skilled labour– Airport with Canada Customs & Deep-water port (Canadian Port Authority)– Strong agricultural base & abundant land– 3 state-of-the-art educational & research institutions – World-class medical facility– Nuclear power– State-of the-art auto manufacturing & abundant production capacity– Quality of life, recreation, green space, nature, extensive waterfront
• Provincial– Proximity to customers, suppliers, world-class innovation infrastructure– Strong federal and provincial support for innovation and next generation technologies
• National– Competitively low business tax rates– Comparatively low levels of government debt– Comparatively strong financial sector

www.cme-mec.ca
Weaknesses• Regional
– Road system– Job creation does not keep pace with population growth– Loss of industrial base
• Provincial– Uncertain, slow, costly, and at times impractical regulatory system– Reliable access to cost competitive energy?– Lack of a clear transportation plan– Lack of clear economic development objectives– Weak connections between innovation infrastructure & business needs
• National– Lack of a clear long-term economic/industrial strategy– Partisanship trumps policy– Highly leveraged consumer sector– Manufacturing and exporting sector highly integrated with the United States

www.cme-mec.ca
Threats• A Sustainable Recovery?– Global financial and currency risks– Unwinding stimulus
• Obstacles to Recovery– Strong and volatile Canadian dollar– Weak cash flow = limited availability and higher cost of business financing– Overcapacity in many industrial markets, corporate consolidation & loss of product mandates– Unfair trading practices, protective restrictions in export markets (Buy American) & aggressive
use of investment incentives in the United States– Increasing mandatory overheads – fees, taxes & regulatory compliance costs– Thickening border – security, customs, regulations, fees, administration
• Game Changers – Changing customer requirements & expectations– Shift in market power & economic growth to emerging economies (China, Asia, Latin America)– Corporate restructuring & supply chain reorganization– An aging population – Skill shortages, increased demand for health care & retirement income
with fewer people working & investing– Energy constraints & environmental priorities

www.cme-mec.ca
Opportunities• Challenges = New Business Opportunities
– Changing customer requirements & expectations– Shift in market power & economic growth to emerging economies (China, Asia, Latin America)– New procurement & supply chain requirements = auto, energy, infrastructure, aerospace– An aging population = Productivity, products, services– Energy opportunities = energy efficiency, new processes, nuclear & alternative energy, oil sands
– technologies, services, and manufacturing supply chain– Environmental priorities = clean technologies & services
• Technology Priorities– Energy – Smart grid, energy efficiency– Manufacturing – Auto, agri-food, aerospace, automation, design & engineering, resource
processing– Environment – Clean technologies & services– Health care – Medical technologies & services
• New business opportunities in Ontario, across Canada, North America, and around the world.

www.cme-mec.ca
Critical Questions
• Is manufacturing disappearing?• What are the growth sectors?• What do businesses/industries need to do to
succeed and grow?• What can Durham Region do to promote
economic growth, generate high paying jobs, and sustain a high quality community?

www.cme-mec.ca
Manufacturing in Canada• Companies that produce things = A $540 billion business ($650 billion in 2008)
– 13% of Canada’s GDP (16% in 2005)– 10% of workforce = 1.75 million Canadians (2.4 million in 2005)
• A highly diversified sector • Manufacturing accounts for two-thirds of Canada’s exports• Highly integrated with the US market
– Approximately 50% of Canadian production is exported into or through the United States
– About 40% of manufacturing inputs are imported from the United States• 75% of business sector R&D• 85% of new product commercialization • Canada’s leader in GHG emission reduction (10% reduction since 1990)• The business of manufacturing = A $1.6 trillion business
– Every dollar of output in manufacturing drives $3.25 of total economic activity
www.cme-mec.ca
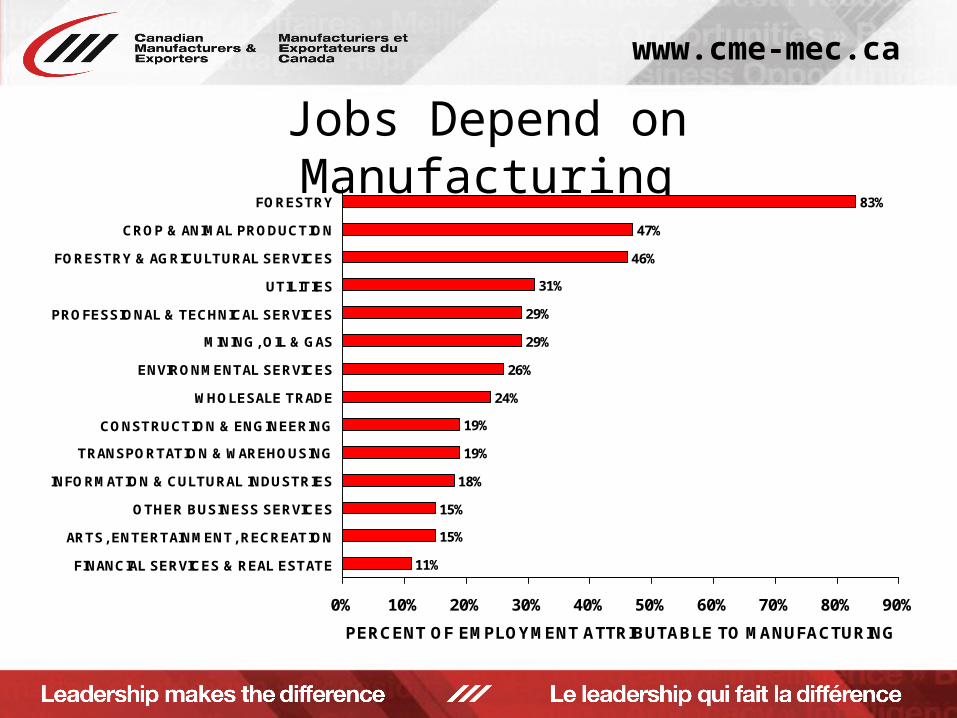
Jobs Depend on Manufacturing83%
47%
46%
31%
29%
29%
26%
24%
19%
19%
18%
15%
15%
11%
0% 10% 20% 30% 40% 50% 60% 70% 80% 90%
FORESTRY
CROP & ANIMAL PRODUCTION
FORESTRY & AGRICULTURAL SERVICES
UTILITIES
PROFESSIONAL & TECHNICAL SERVICES
MINING, OIL & GAS
ENVIRONMENTAL SERVICES
WHOLESALE TRADE
CONSTRUCTION & ENGINEERING
TRANSPORTATION & WAREHOUSING
INFORMATION & CULTURAL INDUSTRIES
OTHER BUSINESS SERVICES
ARTS, ENTERTAINMENT, RECREATION
FINANCIAL SERVICES & REAL ESTATE
PERCENT OF EMPLOYMENT ATTRIBUTABLE TO MANUFACTURING
www.cme-mec.ca
Manufacturers’ New Orders & Sales
2000 2001 2002 2003 2004 2005 2006 2007 2008 2009 2010 201130
35
40
45
50
55
60
Sales New Orders
Billi
ons
of D
olla
rs p
er M
onth

www.cme-mec.ca
Canada’s Merchandise Trade
2000 2001 2002 2003 2004 2005 2006 2007 2008 2009 201020
25
30
35
40
45
Total Exports Exports to USA Total Imports
Billi
ons o
f Dol
lars
per
Mon
th

www.cme-mec.ca
Manufacturing Sales(August 2009 – August 2010)
Canada BC Alta Sask Man Ont Que NB NS PEI NL-15
-10
-5
0
5
10
15
10.38.4
13.2
4.3
-3.6
12.7
8.9
6.3
12.3
-9.5-8.0
Year
-ove
r-Yea
r Per
cent
Cha
nge

www.cme-mec.ca
Manufacturing Sales by Sector(August 2009 – August 2010)
Food Products
Beverage & Tobacco Products
Textile Mills
Textile Products
Clothing
Leather Products
Wood Products
Paper
Printing
Petroleum Products
Chemicals
TOTAL MANUFACTURING
-10 -5 0 5 10 15 20 25 30
3.6
3.9
5.6
15.2
16.4
1.2
5.4
13.0
1.7
4.5
8.1
10.3
1.9
0.3
4.0
21.0
25.0
-0.8
-4.3
10.8
-2.3
14.6
4.2
12.7
Ontario
Canada
Year-over-Year Percent Change
www.cme-mec.ca
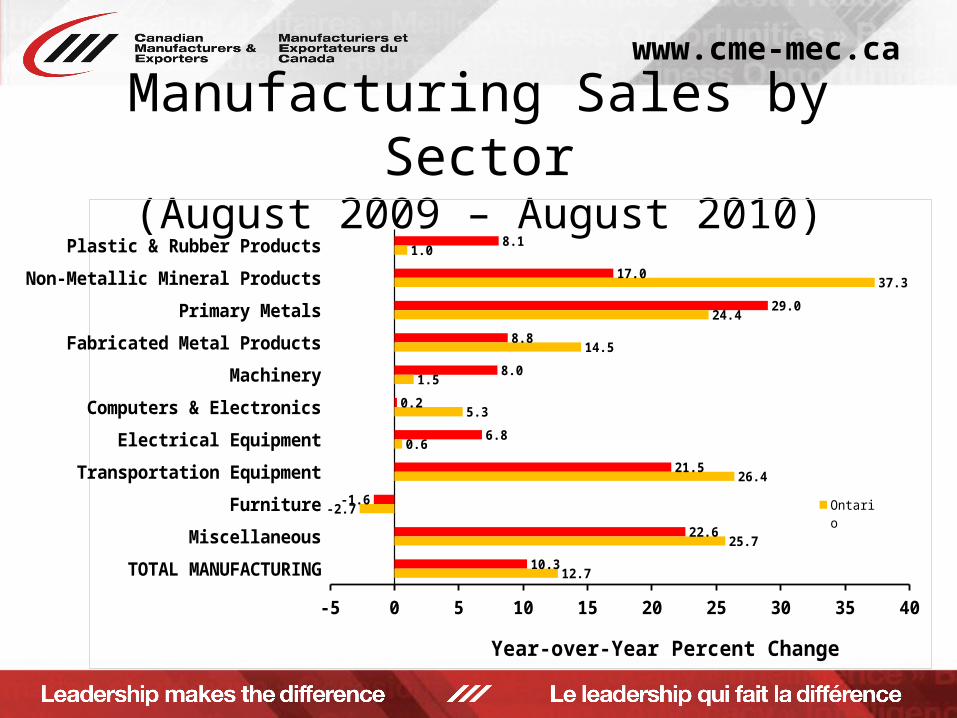
Manufacturing Sales by Sector(August 2009 – August 2010)
Plastic & Rubber Products
Non-Metallic Mineral Products
Primary Metals
Fabricated Metal Products
Machinery
Computers & Electronics
Electrical Equipment
Transportation Equipment
Furniture
Miscellaneous
TOTAL MANUFACTURING
-5 0 5 10 15 20 25 30 35 40
8.1
17.0
29.0
8.8
8.0
0.2
6.8
21.5
-1.6
22.6
10.3
1.0
37.3
24.4
14.5
1.5
5.3
0.6
26.4
-2.7
25.7
12.7
Ontario
Canada
Year-over-Year Percent Change

www.cme-mec.ca
Business as Usual is not an Option• Leadership – New strategies & effective implementation
– Become an integral part of customer/supplier success– Focus on solutions, not products
• New market development – Finding new customers in new supply chains
• Innovation – New & improved solutions, products, services, production and business processes
• Logistics & Supply Chain solutions – Agile, just-when-needed solutions
• Cash Flow – Cash management & financing• LEAN cost reduction – Focus on what customers value & eliminate
waste in business & production processes• Achieving results through people – skills and workforce capabilities

www.cme-mec.ca
Innovation Strategies for Manufacturing• Innovation is a business strategy – and ultimately an investment decision• Drivers of Change
– Challenges = Global competition & commoditization, structural changes– Opportunities = New markets, customers, structural changes
• Objective = Differentiate products as customer solutions• What Manufacturers Need To Do
– Identify problems to solve for customers– Develop & design specialized solutions for customers– New and improved products, services, technologies, services– Work with partners = researchers, suppliers, customers, integrators, services
• Resources = Productive Assets– Knowledge (R&D, Intellectual Property, Knowledge from Extended Networks)– People (Competencies, Techniques, Leadership & Work Practices)– Technology (Materials, Machinery, Equipment, Software)– Money

www.cme-mec.ca
Cash Flow Drives Investment in Research & Development
1995 1996 1997 1998 1999 2000 2001 2002 2003 2004 2005 2006 2007 2008 2009-10
-5
0
5
10
15
20
25
Business Spending on R&D After-Tax Cash Flow
Year
-ove
r-Ye
ar P
erce
nt C
hang
e

www.cme-mec.ca
Cash Flow Drives Investment in New Machinery & Equipment
1980 1985 1990 1995 2000 2005 2010-30
-25
-20
-15
-10
-5
0
5
10
15
20
25
30
35
40
Corporate After-Tax Cash Flow Business Investment in Machinery & Equipment
Year
-ove
r-Ye
ar P
erce
nt C
hang
e

www.cme-mec.ca
Technology Investment as a Share of Cash Flow
19791980
19811982
19831984
19851986
19871988
19891990
19911992
19931994
19951996
19971998
19992000
20012002
20032004
20052006
20072008
20090
5
10
15
20
25
30
35
40
45
Machinery & Equipment Investment in Current Dollars Machinery & Equipment Investment Adjusted for Price Changes
Perc
ent
of A
fter
-Tax
Cas
h Fl
ow

www.cme-mec.ca
Policy OptionsImpact of Policy
Measure on Cash Flow Examples of Policy Measures
Impacts of 1% Change in Cash Flow on Innovation
Investments resulting from Policy Measures
Increase in Before-Tax Profits
- Harmonization of provincial sales taxes with the GST- Elimination of duties on imported technologies, goods, and services- Reduction in regulatory compliance costs- Subsidies tied to business investment
+ 0.36%
Reduction of Effective Tax Rate on Profits
- Reduction in corporate income tax rate- Elimination of capital taxes + 0.11%
Increase in Capital Cost Allowance - Accelerated depreciation rates + 0.64%
Refundable investment Tax Credit
- Scientific Research & Development Tax Credit- Refundable Investment Tax Credit
+ 3.20%

www.cme-mec.ca
Public Policy Priorities• A manufacturing strategy to boost productivity & growth• Encourage productive investments
– Follow though on commitments to lower corporate income tax rates– Make 2-year write-off for M&E investments permanent– Make SR&ED refundable and improve eligibility requirements– Introduce a training tax credit creditable against EI premiums– Introduce a tax credit for regulatory compliance
• Help businesses find new customers and identify new opportunities to participate in technology development initiatives around the world
• Support the development, commercialization, and adoption of new and improved products and processes
• Strengthen technology transfer to business• Maintain an innovative workforce – math, science, engineering, technical
and workplace competencies, transitional training• Improve the availability of financing for innovation and business growth• Improve the business infrastructure – logistics, Lean regulation
www.cme-mec.ca
Regional Strategic Priorities• Community Leadership – Business, labour, government, innovation &
logistics support infrastructure• An economic development plan built on current strengths and taking
advantage of opportunities over the next three to five years• Prioritize – Focus on what can be done at a regional level to make a
difference regionally, provincially, nationally• Don’t try to pick winners – Focus on improving the business environment
and assisting businesses and citizens in taking advantage of new opportunities
• Develop a clear understanding of business needs• Support local entrepreneurship – New and established industries• Communicate – Community objectives, capabilities, assets, and support
services• Collaborate – Businesses, labour, governments, education, innovation &
logistics support infrastructure – to attract and retain investment• Build connections – New procurement, technology opportunities, best
practices, partnerships – regional, provincial, national, global• Establish benchmarks and measure progress