Embed Size (px)
Citation preview

WWF Climate Scorecards Comparison of the climate performance of the G8 countries
Emissions, projections and climate policies for Canada, France, Germany, Italy, Japan, Russia, United Kingdom and Unites States of America Includes background information for China, Brazil, India, Mexico, and South Africa Prepared by Ecofys Germany/Netherlands for WWF

2
Contact: WWF Climate Change Programme: Jennifer Morgan, Director, [email protected]; Martin Hiller, Communications Manager, [email protected] Authors: Ecofys GmbH, Germany: Niklas Höhne, [email protected]; Sina Wartmann, [email protected]; Wina Graus, [email protected] Published in July 2005 by WWF - World Wide Fund For Nature (formerly World Wildlife Fund), Gland, Switzerland. Any reproduction in full or in part of this publication must mention the title and credit the above-mentioned publisher as the copyright owner. © Text (2005) WWF. All rights reserved.

3
Table of contents Introduction ....................................................................................................... 4 Explanation of the scorecards................................................................................ 5 Climate scorecard Canada .................................................................................... 6 Climate scorecard France ..................................................................................... 8 Climate scorecard Germany ................................................................................ 10 Climate scorecard Italy ...................................................................................... 12 Climate scorecard Japan..................................................................................... 14 Climate scorecard Russia.................................................................................... 16 Climate scorecard United Kingdom....................................................................... 18 Climate scorecard United States of America .......................................................... 20 Climate scorecard Brazil ..................................................................................... 22 Climate scorecard China..................................................................................... 24 Climate scorecard India...................................................................................... 26 Climate scorecard Mexico ................................................................................... 28 Climate scorecard South Africa............................................................................ 30 Summary ........................................................................................................ 32 Further reading................................................................................................. 24

4
Introduction Climate change is a serious and urgent threat to global society. It adds stress to unique and already threatened ecosystems, increases the frequency and intensity of extreme weather events, such as storms and droughts, and adds stress to agriculture and food production. In addition, glaciers are melting around the world as is the Arctic, contributing to sea level rise. Climate change also increases the risk of large-scale singular events such as the melting of the West Antarctic Ice Sheet and the shutdown of the thermohaline circulation. The level at which climate change becomes “dangerous” depends on the values attached to the threatened systems. Several countries, most prominently the EU, but also e.g. the Philippines and Micronesia, have agreed that global average temperature increase in comparison to pre-industrial levels should be kept below 2°C. As a consequence, global greenhouse gas emissions will have to peak in the next decade or two and then decline to a fraction of current levels. Leaving some room for growth for developing countries, industrialized countries need to decrease their emission by the order of 80% by the year 2050. This is a major challenge, as current trends are going in the opposite direction with high emissions in developed countries and growing emissions in most developing countries. Individual countries have reacted differently to this challenge. Each country is unique in its starting position, including the economic activities that result in greenhouse gas emissions, its level of development, industrial structure, availability of natural resources and public perceptions. Since the problem was recognized internationally (1992 with the adoption of the United Nations Framework Convention on Climate Change), governments and the public have reacted differently, also depending on national circumstances. These climate scorecards provide a comparable snapshot of the current situation across the G8 countries (Canada, France, Germany, Italy, Japan, Russia, United Kingdom and United States of America). They provide recent and expected emission developments of each country and various other indicators. The scorecards also provide an overview of the most important activities by the governments to respond to the threat of climate change. They finally provide an overall summary evaluation of the climate performance of the country based on all of the criteria covered in the scorecard. This is based on the core benchmark that countries implement enough measures to reduce emissions by the order of 80% by 2050 as to keep the global-average temperature increase below 2°C in comparison with pre-industrial levels. The scoring, based on the ten indicators, demonstrates that none of the G8 countries are implementing enough measures in order to be considered for the upper range of the score (see summary table at the end of this document). Three countries are furthest along this track including France, Germany and the UK, but each is likely to see increases in emissions if further measures are not implemented soon. Italy, Japan, Russia and Canada rank much lower due to their low scoring on the range of indicators, thus quite far away from making a contribution to staying below 2°C. The United States scores the worst of all G8 countries, not having ratified the Kyoto Protocol, nor having put any substantive measures in place to curb emissions in the short term. Information is also provided for major developing countries (Brazil, China, India, Mexico and South Africa), where a number of initiatives are already underway. These five countries are expecting large growth of emissions in the future and the question remains whether G8 countries will assist them in developing in a less carbon intensive manner. These countries have not been scored in the same manner as G8 due to their different national circumstances and level of development.

Emission trendsIncludes the historical trend and future projections of emissions of those greenhouse gases and sectors that are relevant under the Kyoto Protocol in comparison to the Kyoto target.
Emissions by sectorsIncludes the split of emissions into the different sectors. It shows which activities are responsible for the emissions.
Energy sourcesAs most greenhouse gas emissions originate from energy use, it is instructive to examine the energy mix of a country. The chart shows the primary energy consumption, which includes also energy that is consumed but not used such as waste heat
Climate policiesA brief description of the climate policies put in place by the national government.
Summary evaluationA general evaluation of the countries’ climate performance based on the information provided above.
Climate metersAn approximate indication how these indicators relate to the average over the industrialized countries.
Indicators• Past emission trends over the whole
economy• Current distance to the Kyoto target as
magnitude of emission reductions still necessary to reach the Kyoto target
• Emissions per capita• Emission per Gross Domestic Product• Change in share of renewable energy
sources showing efforts made to use more renewable energy since 1990
• CO2 per kWh electricity of public electricity production (national aggregate)
• Energy efficiency in industry as a qualitative aggregate for major industries
• Greenhouse gas emissions in transport per capita
• Greenhouse gas emissions in households and services per capita excluding emissions from use of electricity
Summary Qualitative synthesis of the emission indicators.
Climate meterA visualisation of the approximate overall climate performance taking into account the emission indicators and the climate policies. The benchmark is, whether a country is on a path to keep the global-average temperature increase below 2°C in comparison with pre-industrial levels.
Climate meter A visualisation of the approximate status of the climate policies in place. It is a relative comparison of the ambition level and comprehensiveness of policies by the countries.
Exp
lan
atio
n o
f the sco
reca
rds
5

Climate scorecard: Canada
6
Greenhouse gas emissions1
Past emission trend from 1990 to 2002
+20%
Current distance to the Kyoto target5
26%
Emissions per capita6 23 tCO2eq/cap
Emission per GDP7 807 tCO2eq/M$
Increase of the share of renewable energy sources8
0.4 %-points
CO2 per kWh electricity9 224 g/kWh
Energy efficiency in industry10 Medium
Emissions in transport per capita
6.1 tCO2eq/cap
Emissions in households and services per capita11
2.6 tCO2eq/cap
Emission trends2
0
100
200
300
400
500
600
700
800
900
1990 1995 2000 2005 2010 2015 2020
MtC
O2e
q.
Total emissions
Projections
Kyoto target
Emissions by sector3
Electricity and heat29%
Industry23%
Transport26%
Waste3%Agriculture
8%
Households and services
11%
Energy sources4
Coal
Oil
Gas
Solar/w ind/ other
Nuclear
Hydro
Biomass
Summary • Strongly increasing emissions • Far from reaching the Kyoto target • High emission rates compared to average of
industrialized countries • Relatively large share of renewable energy in
fuel mix, but almost completely large-scale hydro
Climate policies General • Ratified UNFCCC on 04.12.1992 • Ratified the Kyoto Protocol on 17.12.2002 • Hosting and assuming presidency of the first
major UNFCCC conference after entry into force of the Kyoto Protocol in December 2005
• New Climate Fund to purchase domestic reductions/removals and international emission allowances from CDM, JI and international emission trading
Climate policies in place • Climate Change Plan, a first phase in meeting
Kyoto commitments announced (May/05) including development of a limited emission trading scheme, large emitters and incentives for renewables (wind, ethanol) in order to achieve a target of 10% of new capacity to come from renewable sources. Financing still to be approved
• Voluntary targets established for the automotive sector
• Province of Ontario committed to phasing out coal-fired electricity by 2009
Summary evaluation
• High emission rates compared to average of industrialized countries
• Strongly increasing emissions, far from Kyoto target • Supportive of the Kyoto Protocol and starting to implement
national measures
7
1 Unless otherwise specified, emissions refer to greenhouse gas emissions from CO2, CH4, N2O, HFCs, PFCs, and SF6 in Mt CO2 equivalent. The emissions are taken from UNFCCC (2005). www.unfccc.int. The emissions exclude “Land-Use Change & Forestry” and “International Bunker Fuels”. The climate meters are related to how each country compares to the average of industrialized countries. 2 Additional allowances can be generated optionally from “Forest Management” up to the amount of 44 MtCO2/y (Annex to decision 11/CP.7 in UNFCCC document FCCC/CP/2001/13/Add.1). This would represent 7% of the base year emissions. The projections are taken from the National Communication to UNFCCC “Canada’s third national report on climate change 2001”. Revised GHG projection, including current policies. http://unfccc.int/resource/docs/natc/cannce3.pdf 3 For the year 2002. “Industry” includes energy, process and fugitive emissions but excludes emissions from electricity generation. “Households and services” also excludes emissions from electricity generation. “Agriculture” includes only non-CO2 emissions. Emissions exclude “Land-Use Change & Forestry”, which amount to -15 Mt CO2 (i.e. removals) in 2002, equivalent to 2% of total emissions. 4 For the year 2002. Total primary energy supply as provided by IEA (2004) Energy Balances, Paris, France. 5 Difference between emissions in 2002 and the Kyoto target as percentage of emissions in 1990. Additional allowances can be generated optionally from “Forest Management”, which would lower the distance by 7 percentage points. 6 For the year 2002. Population in 2002 is based on World Bank (2005). http://www.worldbank.org/data/wdi2005/index.html 7 For the year 2001. Gross Domestic Product is based on Purchase Power Parity from World Resources Institute (2005). http://cait.wri.org/ 8 Change in share of renewable energy sources in primary energy consumption from 1990 to 2002 based on IEA (2004) Energy Balances, Paris, France. Includes also large hydro, due to lack of disaggregated data. WWF only supports hydropower that is consistent with World Commission on Dams guidelines. 9 For public electricity plants in 2002. Based on IEA (2004) CO2 emissions from fuel combustion and IEA (2004) Energy Balances, Paris, France. 10 Based on CIEEDAC (2002). Energy intensity indicators for Canadian industry 1990 to 2000. Canadian Industrial Energy End-use Database and Analysis Centre. Quebec, Canada. 11 For the year 2002. Includes only direct emissions (e.g. from space heating) and excludes indirect emissions from electricity use.

Climate scorecard: France
8
Greenhouse gas emissions1
Past emission trend from 1990 to 2003
-1.9%
Current distance to the Kyoto target5 -1.9%
Emissions per capita6 9.3 tCO2eq/cap
Emission per GDP7 360 tCO2eq/M$
Increase of the share of renewable energy sources8
-0.8 %-points
CO2 per kWh electricity9 57 g/kWh
Energy efficiency in industry10
High/ medium
Emissions in transport per capita
2.5 tCO2eq/cap
Emissions in households and services per capita11
1.7 tCO2eq/cap
Emission trends2
0
100
200
300
400
500
600
700
1990 1995 2000 2005 2010 2015 2020
MtC
O2e
q.
Total emissions
Projections
Kyoto target
Emissions by sector3
Industry24%
Transport26%
Electricity and heat11%
Waste3%Agriculture
18%
Households and services
18%
Energy sources4
Coal
Oil
Gas
Solar/ w ind/ otherGeother-
mal
Nuclear
Hydro
Biomass
Summary • Emission below Kyoto target, also due to
elimination of industrial HFC by-production, but increasing emissions in transports (+20% from 1990 to 2002) and households/services
• Generally low emission rates compared to average of industrialized countries because of a high share of nuclear energy in the energy mix, which WWF does not consider as viable policy
• Projections show an increase in emissions
Climate policies General • Ratified UNFCCC on 25.03.1994 • Ratified the Kyoto Protocol on 31.05.2002 • Supports that global temperature increase
should be kept below 2°C12 • Long-term national emissions target: -75% by
2050 compared to 1990 level for all GHG
Climate policies in place • New national energy law agreed with
emphasis on reducing emissions by 3% p.a. • Renewable energy sources, cogeneration and
efficient home equipments promotion through fiscal incentives and guaranteed tariffs for delivered electricity13
• Participant in the EU Emission Trading Scheme • Several voluntary agreements for emissions
reduction in industrial sectors • Financial incentives to increase energy
efficiency in existing buildings • Support for bio fuels
Summary evaluation
• Emission rates are low for industrialized countries due to high share of nuclear energy, which WWF does not consider as viable policy
• Emissions currently below Kyoto target, although emissions in transports and households/services increased, and total emissions projected to increase
• Most ambitious long-term target

9
1 Unless otherwise specified, emissions refer to greenhouse gas emissions from CO2, CH4, N2O, HFCs, PFCs, and SF6 in Mt CO2 equivalent. The emissions are taken from UNFCCC (2005). www.unfccc.int. The emissions exclude “Land-Use Change & Forestry” and “International Bunker Fuels”. The climate meters are related to how each country compares to the average of industrialized countries. 2 Emissions trend from 1990 to 2003 is taken from European Environment Agency (2005). Annual European Community greenhouse gas inventory 1990 to 2003 and inventory report 2005, Copenhagen, Denmark. Additional allowances can be generated optionally from “Forest Management” up to the amount of 3.2 Mt CO2/y (Annex to decision 11/CP.7 in UNFCCC document FCCC/CP/2001/13/Add.1). This would represent 0.6% of the base year emissions. The projections are taken from the National Communication to UNFCCC; Third National Communication under the UN Framework Convention, 2001. http://unfccc.int/resource/docs/natc/france3.pdf Page 117 and 118, including existing policies. 3 For the year 2002. “Industry” includes energy, process and fugitive emissions but excludes emissions from electricity generation. “Households and services” also excludes emissions from electricity generation. “Agriculture” includes only non-CO2 emissions. Emissions for “Land-Use Change & Forestry” are not included in the graph. Net emissions from this sector are -55 Mt CO2 in 2002 (i.e. removals), equivalent to 10% of total emissions in 2002. 4 For the year 2002. Total primary energy supply as provided by IEA (2004) Energy Balances, Paris, France. 5 Difference between emissions in 2003 and the Kyoto target as a percentage of emissions in 1990. Additional allowances can be generated optionally from “Forest Management”, which would lower the distance by 0.6 percentage points. 6 For the year 2002. Population in 2002 is based on World Bank (2005). http://www.worldbank.org/data/wdi2005/index.html 7 For the year 2001. Gross Domestic Product is based on Purchase Power Parity from World Resources Institute (2005). http://cait.wri.org/ 8 Change in share of renewable energy sources in primary energy consumption from 1990 to 2002 based on IEA (2004) Energy Balances, Paris, France. Includes also large hydro, due to lack of disaggregated data. WWF only supports hydropower that is consistent with World Commission on Dams guidelines. 9 For public electricity plants in 2002. Based on IEA (2004) CO2 emissions from fuel combustion and IEA (2004) Energy Balances, Paris, France. According to the value, the climate meter should be in the green area, but the rating was reduced due to high use of nuclear power, which WWF does not accept as a viable policy option. 10 Based on energy efficiency of iron and steel and cement production in Phylipsen, G.J.M., W. Graus, K. Blok, Y. Hofman and M. Voogt (2003). International Comparisons Of Energy Efficiency – Results For Iron & Steel, Cement And Electricity Generation. Ecofys, Utrecht, The Netherlands. 11 For the year 2002. Includes only direct emissions (e.g. from space heating) and excludes indirect emissions from electricity use. 12 Ministere de l’ Ecologie et du Developpement Durable; Climate Plan 2004; 2004. 13 Monetary value of the support for renewable energy is much larger than expenditure that is usual for industrialized countries for research and development for renewable energy.

Climate scorecard: Germany
10
Greenhouse gas emissions1
Past emission trend from 1990 to 2003
-18.2%
Current distance to the Kyoto target5 2.8%
Emissions per capita6 12 tCO2eq/cap
Emission per GDP7 464 tCO2eq/M$
Increase of the share of renewable energy sources8
1.9 %-points
CO2 per kWh electricity9 567 g/kWh
Energy efficiency in industry10 High
Emissions in transport per capita
2.2 tCO2/cap
Emissions in households and services per capita11
2.2 tCO2/cap
Emission trends2
0
200
400
600
800
1000
1200
1400
1990 1995 2000 2005 2010 2015 2020
MtC
O2e
q.
Total emissions
Projections
Kyoto target
National target 2005
National target 2020
Emissions by sector3
Electricity and heat36%
Industry19%
Transport18%
Waste1%
Agriculture9%
Households and services
17%
Energy sources4
Coal
Oil
Gas
Solar/ wind/ other
Geo-thermal
Nuclear
HydroBiomass
Summary • Strong dependence on coal and oil • Decreasing emissions, partly due to economic
downturn in Eastern Germany • Currently small distance to Kyoto target, but
new measures likely needed to meet target • Medium emission rates compared to average
of industrialised countries, but high emission rates from electricity generation and households
• Large share of new renewable energy sources • Emissions could increase unless new measures
introduced
Climate policies General • Ratified UNFCCC on 09.12.1993 • Ratified the Kyoto Protocol on 31.05.2002 • Supports that global temperature increase
should be kept below 2°C12 • Long-term target of 40% emission reduction
by 2020 compared to 1990 levels13 if EU commits to 30%
• No plans to use CDM/JI for achieving Kyoto target
• Initiated the “KfW Carbon Fund” to pool industry demand for credits from CDM projects
Climate policies in place • Eco-Tax: taxation of energy-use, revenues are
used to lower labour costs • Guaranteed tariffs for delivered electricity
from renewable sources through feed-in law, which led to considerable increase of renewable capacity14
• Favourable loans for measures to reduce CO2 emissions in the household sector
• Participant in the EU Emission Trading Scheme, allocated so that there is low incentive for further reductions from electricity generation
Summary evaluation • Average emission rates for industrialized countries, but high
emission rates from electricity generation due to use of coal • Emissions already close to Kyoto target, partly due to economic
downturn in Eastern Germany but also due to national measures, but still likely gap to meet Kyoto target
• Proactive in taking national measures, e.g. successful promotion of new renewable energy sources, but less ambitious for electricity production from fossil fuels
11
1 Unless otherwise specified, emissions refer to greenhouse gas emissions from CO2, CH4, N2O, HFCs, PFCs, and SF6 in Mt CO2 equivalent. The emissions are taken from UNFCCC (2005). www.unfccc.int. The emissions exclude “Land-Use Change & Forestry” and “International Bunker Fuels”. The climate meters are related to how each country compares to the average of industrialized countries. 2 Emissions trend from 1990 to 2003 is taken from European Environment Agency (2005), Annual European Community greenhouse gas inventory 1990 to 2003 and inventory report 2005, Copenhagen, Denmark. Additional allowances can be generated optionally from “Forest Management” up to the amount of 4.5 Mt CO2/y (Annex to decision 11/CP.7 in UNFCCC document FCCC/CP/2001/13/Add.1). This would represent 0.4% of the base year emissions. The projections are taken from the National Communication to UNFCCC “Third Report by the Government of the Federal Republic of Germany in accordance with the Framework Convention of the United Nations”. http://unfccc.int/resource/docs/natc/gernc3.pdf page 118-125, excluding sinks. Germany has a long-term target of 40% emission reduction by 2020 compared to 1990 levels. This goal was made conditional to the prerequisite that the European Union as a whole commits itself to a minus 30% target during the same time period. Source: Germany (2002): Koalitionsvertrag vom 16. Oktober 2002. Berlin. An older voluntary national target aimed at reducing CO2 emissions from 1990 to 2005 by 25%. 3 For the year 2002. “Industry” includes energy, process and fugitive emissions but excludes emissions from electricity generation. “Households and services” also excludes emissions from electricity generation. “Agriculture” includes only non-CO2 emissions. Emissions exclude “Land-Use Change & Forestry” which account for 14 Mt CO2 in 2002, equivalent to 1% of total emissions. 4 For the year 2002. Total primary energy supply as provided by IEA (2004) Energy Balances, Paris, France. 5 Difference between emissions in 2003 and the Kyoto target as percentage of emissions in 1990. Additional allowances can be generated optionally from “forest management”, which would lower the distance by 0.4 percentage points. 6 For the year 2002. Population in 2002 is based on World Bank (2005). http://www.worldbank.org/data/wdi2005/index.html 7 For the year 2001. Gross Domestic Product is based on Purchase Power Parity from World Resources Institute (2005). http://cait.wri.org/ 8 Change in share of renewable energy sources in primary energy consumption from 1990 to 2002 based on IEA (2004) Energy Balances, Paris, France. Includes also large hydro, due to lack of disaggregated data. WWF only supports hydropower that is consistent with World Commission on Dams guidelines. 9 For public electricity plants in 2002. Based on IEA (2004) CO2 emissions from fuel combustion and IEA (2004) Energy Balances, Paris, France. 10 Based on energy efficiency of iron and steel and cement production in Phylipsen, G.J.M., W. Graus, K. Blok, Y. Hofman and M. Voogt (2003). International Comparisons Of Energy Efficiency – Results For Iron & Steel, Cement And Electricity Generation. Ecofys, Utrecht, The Netherlands. 11 For the year 2002. Includes only direct emissions (e.g. from space heating) and excludes indirect emissions from electricity use. 12 International Institute for Sustainable Development (IISD); Earth Negotiations Bulletin; Vol 12 No 231; 15.12.2003 13 This goal was made conditional to the prerequisite that the European Union as a whole commits itself to a minus 30% target during the same time period. Source: Germany (2002): Koalitionsvertrag vom 16. Oktober 2002. Berlin. 14 Monetary value of the support for renewable energy is much larger than expenditure that is usual for industrialized countries for research and development for renewable energy.

Climate scorecard: Italy
12
Greenhouse Gas Emissions1
Past emission trend from 1990 to 2003
+11.5%
Current distance to the Kyoto target5 18%
Emissions per capita6 10 tCO2eq/cap
Emission per GDP7 370 tCO2eq/M$
Increase of the share of renewable energy sources8
1.3 %-points
CO2 per kWh electricity9 509 g/kWh
Energy efficiency in industry10 Medium
Emissions in transport per capita
2.2 tCO2eq/cap
Emissions in households and services per capita11
1.4 tCO2eq/cap
Emission trends2
0
100
200
300
400
500
600
700
1990 1995 2000 2005 2010 2015 2020
MtC
O2e
q.
Total emissions
Projections
Kyoto target
Emissions by sector3
Electricity and heat29%
Industry24%
Transport23%
Waste2%
Agriculture7%
Households and services
15%
Energy sources4
Oil
Gas
Coal
Solar/ wind/ otherGeo-
thermalHydro
Biomass
Summary • Increasing emissions • Far from reaching the Kyoto target • Medium/low emission rates compared to
industrialised countries • Strong dependence on oil, fast increasing
share of natural gas • No use of nuclear power since 1987
Climate policies General • Ratified UNFCCC on 15.04.1994 • Ratified the Kyoto Protocol on 31.05.2002 • Mixed public/private “Italian Carbon Fund” set
up to provide certificates from CDM/JI projects
Climate policies in place • Participant in the EU Emission Trading Scheme • Voluntary agreements with industry sectors to
increase energy efficiency in production • Promotion of energy efficiency through
innovative tradable energy efficiency certificates (white certificates)
• Promotion of electricity from renewable sources through renewable certificates
• Additional policies needed to meet Kyoto target
Summary evaluation
• Emission rates are average for industrialized countries with relatively high but decreasing share of oil
• Emissions considerably above Kyoto target and projected to further increase substantially
• Only a few national measures in place that have reduced emissions
13
1 Unless otherwise specified, emissions refer to greenhouse gas emissions from CO2, CH4, N2O, HFCs, PFCs, and SF6 in Mt CO2 equivalent. The emissions are taken from UNFCCC (2005). www.unfccc.int. The emissions exclude “Land-Use Change & Forestry” and “International Bunker Fuels”. The climate meters are related to how each country compares to the average of industrialized countries. 2 Emissions trend from 1990 to 2003 is taken from European Environment Agency (2005), Annual European Community greenhouse gas inventory 1990 to 2003 and inventory report 2005, Copenhagen, Denmark. Additional allowances can be generated optionally from “forest management” up to the amount of 0.7 Mt CO2/y (Annex to decision 11/CP.7 in UNFCCC document FCCC/CP/2001/13/Add.1). This would represent 0.1% of the base year emissions. The projections are taken from the National Communication to UNFCCC “Third National Communication under the Framework Convention on Climate Change” page 123. http://www.minambiente.it/Sito/settori_azione/pia/docs/III_ccc/5.pdf 3 For the year 2002. “Industry” includes energy, process and fugitive emissions but excludes emissions from electricity generation. “Households and services” also excludes emissions from electricity generation. “Agriculture” includes only non-CO2 emissions. Emissions exclude “Land-Use Change & Forestry”, where net emissions from this sector account for a -20 Mt CO2 (i.e. removal) in 2002, equivalent to 4% of total emissions in 2002. 4 For the year 2002. Total primary energy supply as provided by IEA (2004) Energy Balances, Paris, France. 5 Difference between emissions in 2003 and the Kyoto target as percentage of emissions in 1990. Additional allowances can be generated optionally from “forest management”, which would lower the distance by 0.1 percentage points. 6 For the year 2002. Population in 2002 is based on World Bank (2005). http://www.worldbank.org/data/wdi2005/index.html 7 For the year 2001. Gross Domestic Product is based on Purchase Power Parity from World Resources Institute (2005). http://cait.wri.org/ 8 Change in share of renewable energy sources in primary energy consumption from 1990 to 2002 based on IEA (2004) Energy Balances, Paris, France. Includes also large hydro, due to lack of disaggregated data. WWF only supports hydropower that is consistent with World Commission on Dams guidelines. 9 For public electricity plants in 2002. Based on IEA (2004) CO2 emissions from fuel combustion and IEA (2004) Energy Balances, Paris, France. 10 Based on energy efficiency of iron and steel and cement production in Phylipsen, G.J.M., W. Graus, K. Blok, Y. Hofman and M. Voogt (2003). International Comparisons Of Energy Efficiency – Results For Iron & Steel, Cement And Electricity Generation. Ecofys, Utrecht, The Netherlands. 11 For the year 2002. Includes only direct emissions (e.g. from space heating) and excludes indirect emissions from electricity use.

Climate scorecard: Japan
14
Greenhouse gas emissions1
Past emission trend from 1990 to 2003
+8.3%
Current distance to the Kyoto target5 14.3%
Emissions per capita6 10 tCO2eq/cap
Emission per GDP7 386 tCO2eq/M$
Increase of the share of renewable energy sources8
-0.2 %-points
CO2 per kWh electricity9 389 g/kWh
Energy efficiency in industry10 High
Emissions in transport per capita
2.1 tCO2eq/cap
Emissions in households and services per capita11
1.5 tCO2eq/cap
Emission trends2
0
200
400
600
800
1000
1200
1400
1600
1990 1995 2000 2005 2010 2015 2020
MtC
O2e
q.
Total emissions
Projections
Kyoto target
Emissions by sector3
Industry31%
Transport20%
Electricity and heat29%
Waste2%
Agriculture3%
Households and services
15%
Energy sources4
Coal
Oil
Gas
Solar/wind/ otherGeother-
mal
Nuclear
Hydro
Biomass
Summary • Increasing emissions from 1990 to 2002 • Large distance to Kyoto target • Relatively low emission rates compared to
average of industrialised countries due to high efficiency and use of nuclear power, which WWF does not consider as viable policy
• Projections show an emission increase
Climate policies General • Ratified UNFCCC on 28.05.1993 • Ratified the Kyoto Protocol on 04.06.2002 • Early involvement in joint implementation and
clean development projects. Government plans to achieve at least 1.6% of the 6% target from JI and CDM and 3.9% from land-use change and forestry
Climate policies in place • Voluntary action plans with industries for
energy conservation, reporting and disclosure of CO2 emissions will become mandatory from 2006 for large emitters
• Enhancing efficiency of household appliances and vehicles through “top runner” standards
• Voluntary emission trading scheme with subsidies for participants
• Obligatory energy management systems for large factories, commercial buildings and emitters in the transport sector
• Considering carbon tax
Summary evaluation
• Relatively low emission rates compared to average of industrialized countries due to high efficiency and use of nuclear power, which WWF does not consider as viable policy
• Increasing emissions and large distance to Kyoto target • No mandatory emission reduction scheme based on market
mechanisms
15
1 Unless otherwise specified, emissions refer to greenhouse gas emissions from CO2, CH4, N2O, HFCs, PFCs, and SF6 in Mt CO2 equivalent. The emissions are taken from UNFCCC (2005). www.unfccc.int. The emissions exclude “Land-Use Change & Forestry” and “International Bunker Fuels”. The climate meters are related to how each country compares to the average of industrialized countries. 2 For the years 1990 to 1994 no data is available for the emissions of HFCs, PFCs and SF6. In 1995, the emissions for these gases amounted to 49.7 Mt CO2 eq. This amount is added to the emissions for the years 1990 to 1994. For the year 2003, emissions are taken from the Greenhouse Gas Inventory Office of Japan (2005). http://www-gio.nies.go.jp/download/6gas_2005E-gioweb.xls. Additional allowances can be generated optionally from “Forest Management” up to the amount of 48 Mt CO2/y (Annex to decision 11/CP.7 in UNFCCC document FCCC/CP/2001/13/Add.1). This would represent 3.9% of the base year emissions. The projections are taken from the National Communication to UNFCCC “Japan’s Third National Communication Under the United Nations Framework Convention on Climate Change”. http://unfccc.int/resource/docs/natc/japnc3.pdf page 133, including current policies, excluding additional policies. 3 For the year 2002. “Industry” includes energy, process and fugitive emissions but excludes emissions from electricity generation. “Households and services” also excludes emissions from electricity generation. “Agriculture” includes only non-CO2 emissions. Emissions are exclude “Land-Use Change & Forestry”, which amounted to -97 Mt CO2 in 1995 (i.e. removals), equivalent to 7% of total emissions in 1995. 4 For the year 2002. Total primary energy supply as provided by IEA (2004) Energy Balances, Paris, France. 5 Difference between emissions in 2003 and the Kyoto target as percentage of emissions in 1990. Additional allowances can be generated optionally from “forest management”, which would lower the distance by 3.9 percentage points. 6 For the year 2002. Population in 2002 is based on World Bank (2005). http://www.worldbank.org/data/wdi2005/index.html 7 For the year 2001. Gross Domestic Product is based on Purchase Power Parity from World Resources Institute (2005). http://cait.wri.org/ 8 Change in share of renewable energy sources in primary energy consumption from 1990 to 2002 based on IEA (2004) Energy Balances, Paris, France. Includes also large hydro, due to lack of disaggregated data. WWF only supports hydropower that is consistent with World Commission on Dams guidelines. 9 For public electricity plants in 2002. Based on IEA (2004) CO2 emissions from fuel combustion and IEA (2004) Energy Balances, Paris, France. According to the value, the climate meter should be in the green area, but the rating was reduced due to high use of nuclear power, which WWF does not consider as viable policy. 10 Based on energy efficiency of iron and steel and cement production in Phylipsen, G.J.M., W. Graus, K. Blok, Y. Hofman and M. Voogt (2003). International Comparisons Of Energy Efficiency – Results For Iron & Steel, Cement And Electricity Generation. Ecofys, Utrecht, The Netherlands. 11 For the year 2002. Includes only direct emissions (e.g. from space heating) and excludes indirect emissions from electricity use.
Climate scorecard: Russia
16
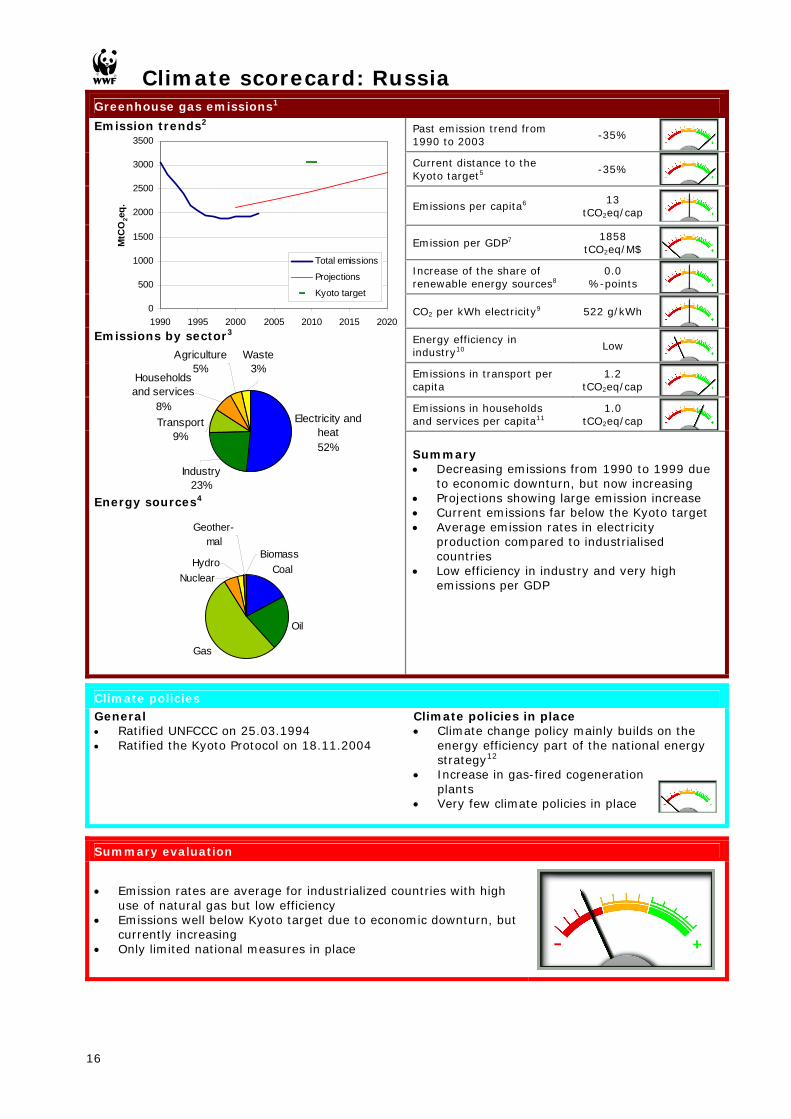
Greenhouse gas emissions1
Past emission trend from 1990 to 2003
-35%
Current distance to the Kyoto target5 -35%
Emissions per capita6 13 tCO2eq/cap
Emission per GDP7 1858 tCO2eq/M$
Increase of the share of renewable energy sources8
0.0 %-points
CO2 per kWh electricity9 522 g/kWh
Energy efficiency in industry10
Low
Emissions in transport per capita
1.2 tCO2eq/cap
Emissions in households and services per capita11
1.0 tCO2eq/cap
Emission trends2
0
500
1000
1500
2000
2500
3000
3500
1990 1995 2000 2005 2010 2015 2020
MtC
O2e
q.
Total emissions
Projections
Kyoto target
Emissions by sector3
Electricity and heat52%
Industry23%
Transport9%
Waste3%
Agriculture5%
Households and services
8%
Energy sources4
Coal
Oil
Gas
Geother-mal
NuclearHydro
Biomass
Summary • Decreasing emissions from 1990 to 1999 due
to economic downturn, but now increasing • Projections showing large emission increase • Current emissions far below the Kyoto target • Average emission rates in electricity
production compared to industrialised countries
• Low efficiency in industry and very high emissions per GDP
Climate policies General • Ratified UNFCCC on 25.03.1994 • Ratified the Kyoto Protocol on 18.11.2004
Climate policies in place • Climate change policy mainly builds on the
energy efficiency part of the national energy strategy12
• Increase in gas-fired cogeneration plants
• Very few climate policies in place
Summary evaluation
• Emission rates are average for industrialized countries with high use of natural gas but low efficiency
• Emissions well below Kyoto target due to economic downturn, but currently increasing
• Only limited national measures in place
17
1 Unless otherwise specified, emissions refer to greenhouse gas emissions from CO2, CH4, N2O, HFCs, PFCs, and SF6 in Mt CO2 equivalent. The emissions are taken from UNFCCC (2005). www.unfccc.int. The emissions exclude “Land-Use Change & Forestry” and “International Bunker Fuels”. The climate meters are related to how each country compares to the average of industrialized countries. 2 Russia reported emissions only up to 1999 to the UNFCCC. For the years 2000 to 2002, emissions are extrapolated based on the annual growth rates of CO2 emissions from IEA (2004) CO2 emissions from fuel combustion; total CO2 emissions, sectoral approach. The share of CO2 emissions from fuel combustion is assumed to remain equal to the share in 1999 (79%). For the year 2003, the annual growth rate of the Russian Institute of Energy Studies was used (Report of Director A. Makarov in the Kyoto-into-Force Conference, 16 Feb 2005, Moscow, House of Scientists, Russia). Additional allowances can be generated optionally from “Forest Management” up to the amount of 121 Mt CO2/y (Annex to decision 11/CP.7 in UNFCCC document FCCC/CP/2001/13/Add.1). This would represent 4% of the base year emissions. The projections are taken from the National Communication to UNFCCC “Third National Communication of the Russian Federation (2002)”. http://unfccc.int/resource/docs/natc/rusnce3.pdf page 73. Scenario I: favorable economic development. 3 For the year 2002. “Industry” includes energy, process and fugitive emissions but excludes emissions from electricity generation. “Households and services” also excludes emissions from electricity generation. “Agriculture” includes only non-CO2 emissions. Emissions for “Land-Use Change & Forestry” are not included in the graph. These emissions are 54 Mt CO2 in 2000, equivalent to 3% of total emissions. The breakdown is based on World Resources Institute (2005), available at: http://cait.wri.org/cait.php?page=yearly&sort=val-desc&url=form&pHints=shut&year=2000§or=erg&co2=1&update=Update 4 For the year 2001. Total primary energy supply as provided by IEA (2003) Energy Balances, Paris, France. 5 Difference between emissions in 2003 and the Kyoto target as a percentage of emissions in 1990. Additional allowances can be generated optionally from “forest management”, which would lower the distance by 4 percentage points. 6 For the year 2000. Population in 2000 is based on World Resources Institute (2005). http://cait.wri.org/ 7 For the year 2000. Gross Domestic Product is based on Purchase Power Parity from World Resources Institute (2005). http://cait.wri.org/ 8 Change in share of renewable energy sources in primary energy consumption from 1990 to 2002 based on IEA (2004) Energy Balances, Paris, France. Includes also large hydro, due to lack of disaggregated data. WWF only supports hydropower that is consistent with World Commission on Dams guidelines. 9 For public electricity plants in 2001. Corrected for heat supply by adding the exergetic value of the heat supply (0.175 of heat supply) to the power output. Without this correction the emission intensity is 408 g/kWh. Based on IEA (2004) CO2 emissions from fuel combustion and IEA (2003) Energy Balances, Paris, France. 10 Based on IEA (2004), Energy Balances, and United Nations Industrial Statistics Yearbook. 11 For the year 2002. Includes only direct emissions (e.g. from space heating) and excludes indirect emissions from electricity use. Emissions are based on IEA (2004) CO2 emissions from fuel combustion for “Commercial and public services” and “Residential sector”. 12 “Main Directions of the Energy Strategy of Russia by 2020”; 2003. “Federal Target Programme Energy -Efficient Economy for 2002 to 2005 with an outlook to 2010”, 2001. “Federal Target Programme Energy Saving in Russia for 1998 to 2005”; 1997. “Federal Target Programme for the Prevention of Dangerous Climate Change and its Negative Impacts”; 1996.
Climate scorecard: United Kingdom
18
Greenhouse gas emissions1
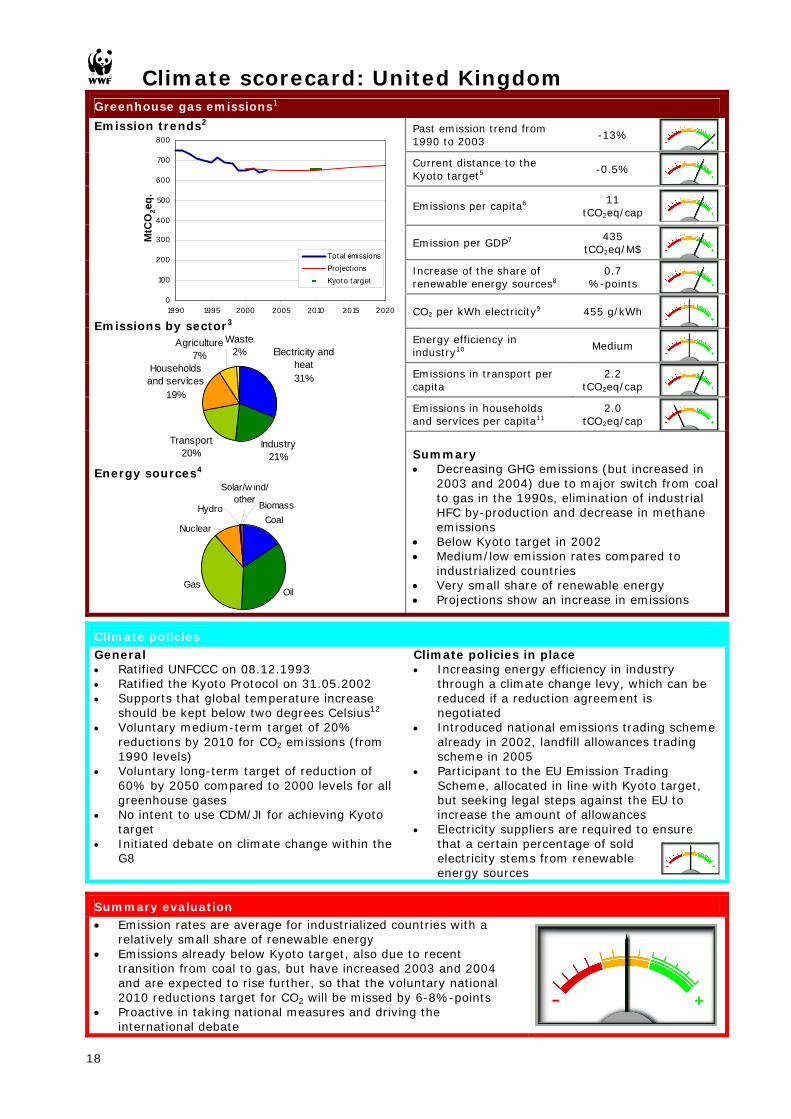
Past emission trend from 1990 to 2003
-13%
Current distance to the Kyoto target5 -0.5%
Emissions per capita6 11 tCO2eq/cap
Emission per GDP7 435 tCO2eq/M$
Increase of the share of renewable energy sources8
0.7 %-points
CO2 per kWh electricity9 455 g/kWh
Energy efficiency in industry10 Medium
Emissions in transport per capita
2.2 tCO2eq/cap
Emissions in households and services per capita11
2.0 tCO2eq/cap
Emission trends2
0
100
200
300
400
500
600
700
800
1990 1995 2000 2005 2010 2015 2020
MtC
O2e
q.
Total emissionsProject ionsKyoto target
Emissions by sector3
Electricity and heat31%
Industry21%
Transport20%
Households and services
19%
Agriculture7%
Waste2%
Energy sources4
Coal
OilGas
Solar/w ind/ other
Nuclear
Hydro Biomass
Summary • Decreasing GHG emissions (but increased in
2003 and 2004) due to major switch from coal to gas in the 1990s, elimination of industrial HFC by-production and decrease in methane emissions
• Below Kyoto target in 2002 • Medium/low emission rates compared to
industrialized countries • Very small share of renewable energy • Projections show an increase in emissions
Climate policies General • Ratified UNFCCC on 08.12.1993 • Ratified the Kyoto Protocol on 31.05.2002 • Supports that global temperature increase
should be kept below two degrees Celsius12 • Voluntary medium-term target of 20%
reductions by 2010 for CO2 emissions (from 1990 levels)
• Voluntary long-term target of reduction of 60% by 2050 compared to 2000 levels for all greenhouse gases
• No intent to use CDM/JI for achieving Kyoto target
• Initiated debate on climate change within the G8
Climate policies in place • Increasing energy efficiency in industry
through a climate change levy, which can be reduced if a reduction agreement is negotiated
• Introduced national emissions trading scheme already in 2002, landfill allowances trading scheme in 2005
• Participant to the EU Emission Trading Scheme, allocated in line with Kyoto target, but seeking legal steps against the EU to increase the amount of allowances
• Electricity suppliers are required to ensure that a certain percentage of sold electricity stems from renewable energy sources
Summary evaluation • Emission rates are average for industrialized countries with a
relatively small share of renewable energy • Emissions already below Kyoto target, also due to recent
transition from coal to gas, but have increased 2003 and 2004 and are expected to rise further, so that the voluntary national 2010 reductions target for CO2 will be missed by 6-8%-points
• Proactive in taking national measures and driving the international debate

19
1 Unless otherwise specified, emissions refer to greenhouse gas emissions from CO2, CH4, N2O, HFCs, PFCs, and SF6 in Mt CO2 equivalent. The emissions are taken from UNFCCC (2005). www.unfccc.int. The emissions exclude “Land-Use Change & Forestry” and “International Bunker Fuels”. The climate meters are related to how each country compares to the average of industrialized countries. 2 Emissions trend from 1990 to 2003 is taken from European Environment Agency (2005), Annual European Community greenhouse gas inventory 1990 to 2003 and inventory report 2005, Copenhagen, Denmark. Additional allowances can be generated optionally from “Forest Management” up to the amount of 1.4 Mt CO2/y (Annex to decision 11/CP.7 in UNFCCC document FCCC/CP/2001/13/Add.1). This would represent 0.2% of the base year emissions. The projections are taken from the National Communication to UNFCCC “The UK’s Third National Communication under the United Nations Framework Convention on Climate Change”. http://www.defra.gov.uk/environment/climatechange/3nc/pdf/climate_3nc.pdf, page 44. The UK has a national target for reducing CO2 emissions (not total greenhouse gas emissions) of 20% by 2010 in comparison to 1990 levels (source: DTI (2005). Energy white paper. Our energy future – creating a low carbon economy. UK. http://www.dti.gov.uk/energy/whitepaper/ourenergyfuture.pdf) 3 For the year 2002. “Industry” includes energy, process and fugitive emissions but excludes emissions from electricity generation. “Households and services” also excludes emissions from electricity generation. “Agriculture” includes only non-CO2 emissions. Emissions exclude “Land-Use Change & Forestry”, which account for 2Mt in 2002, equivalent to 0.3% of total emissions. 4 For the year 2002. Total primary energy supply as provided by IEA (2004) Energy Balances, Paris, France. 5 Difference between emissions in 2003 and the Kyoto target as a percentage of emissions in 1990. Additional allowances can be generated optionally from “forest management”, which would lower the distance by 0.2 percentage points. 6 For the year 2002. Population in 2002 is based on World Bank (2005). http://www.worldbank.org/data/wdi2005/index.html 7 For the year 2001. Gross Domestic Product is based on Purchase Power Parity from World Resources Institute (2005). http://cait.wri.org/ 8 Change in share of renewable energy sources in primary energy consumption from 1990 to 2002 based on IEA (2004) Energy Balances, Paris, France. Includes also large hydro, due to lack of disaggregated data. WWF only supports hydropower that is consistent with World Commission on Dams guidelines. 9 For public electricity plants in 2002. Based on IEA (2004) CO2 emissions from fuel combustion and IEA (2004) Energy Balances, Paris, France. 10 Based on energy efficiency of iron and steel and cement production in Phylipsen, G.J.M., W. Graus, K. Blok, Y. Hofman and M. Voogt (2003). International Comparisons Of Energy Efficiency – Results For Iron & Steel, Cement And Electricity Generation. Ecofys, Utrecht, The Netherlands. 11 For the year 2002. Includes only direct emissions (e.g. from space heating) and excludes indirect emissions from electricity use. 12 International Institute for Sustainable Development (IISD); Earth Negotiations Bulletin; Vol 12 No 231; 15.12.2003.
Climate scorecard: United States of America
20
Greenhouse gas emissions1
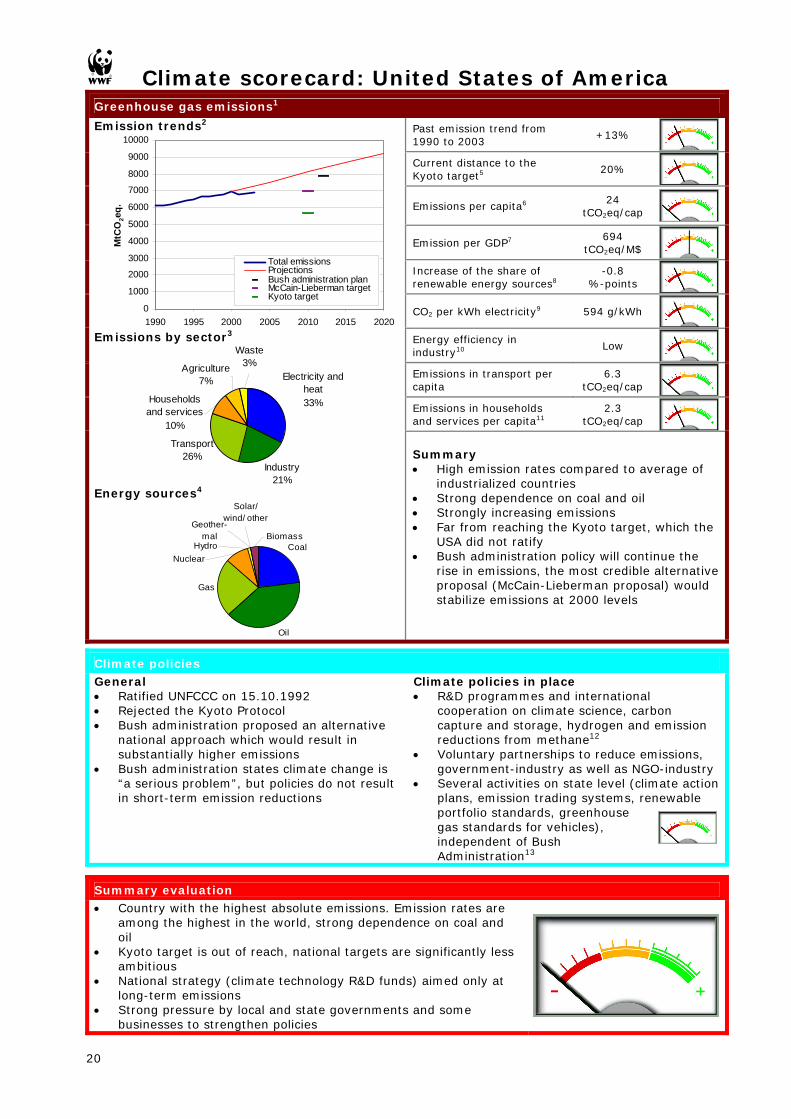
Past emission trend from 1990 to 2003
+13%
Current distance to the Kyoto target5
20%
Emissions per capita6 24
tCO2eq/cap
Emission per GDP7 694
tCO2eq/M$ Increase of the share of renewable energy sources8
-0.8 %-points
CO2 per kWh electricity9 594 g/kWh
Energy efficiency in industry10
Low
Emissions in transport per capita
6.3 tCO2eq/cap
Emissions in households and services per capita11
2.3 tCO2eq/cap
Emission trends2
0
1000
2000
3000
4000
5000
6000
7000
8000
9000
10000
1990 1995 2000 2005 2010 2015 2020
MtC
O2e
q.
Total emissionsProjectionsBush administration planMcCain-Lieberman targetKyoto target
Emissions by sector3
Electricity and heat33%
Industry21%
Transport26%
Waste3%Agriculture
7%
Households and services
10%
Energy sources4
Coal
Oil
Gas
BiomassHydro
Nuclear
Geother-mal
Solar/ wind/ other
Summary • High emission rates compared to average of
industrialized countries • Strong dependence on coal and oil • Strongly increasing emissions • Far from reaching the Kyoto target, which the
USA did not ratify • Bush administration policy will continue the
rise in emissions, the most credible alternative proposal (McCain-Lieberman proposal) would stabilize emissions at 2000 levels
Climate policies General • Ratified UNFCCC on 15.10.1992 • Rejected the Kyoto Protocol • Bush administration proposed an alternative
national approach which would result in substantially higher emissions
• Bush administration states climate change is “a serious problem”, but policies do not result in short-term emission reductions
Climate policies in place • R&D programmes and international
cooperation on climate science, carbon capture and storage, hydrogen and emission reductions from methane12
• Voluntary partnerships to reduce emissions, government-industry as well as NGO-industry
• Several activities on state level (climate action plans, emission trading systems, renewable portfolio standards, greenhouse gas standards for vehicles), independent of Bush Administration13
Summary evaluation • Country with the highest absolute emissions. Emission rates are
among the highest in the world, strong dependence on coal and oil
• Kyoto target is out of reach, national targets are significantly less ambitious
• National strategy (climate technology R&D funds) aimed only at long-term emissions
• Strong pressure by local and state governments and some businesses to strengthen policies

21
1 Unless otherwise specified, emissions refer to greenhouse gas emissions from CO2, CH4, N2O, HFCs, PFCs, and SF6 in Mt CO2 equivalent. The emissions are taken from UNFCCC (2005). www.unfccc.int. The emissions exclude “Land-Use Change & Forestry” and “International Bunker Fuels”. The climate meters are related to how each country compares to the average of industrialized countries. 2 Based on UNFCCC (2005) except for the years 1990 and 1997 to 2003, which are based on EPA (2005). US Emissions Inventory 2005. United States. http://yosemite.epa.gov/oar/globalwarming.nsf/UniqueKeyLookup/RAMR69V4ZZ/$File/05trends.pdf The projections are taken from the National Communication to UNFCCC “U.S. Climate Action Report (2002)”. http://unfccc.int/resource/docs/natc/usnc3.pdf page 79. The Bush Administration Plan requires a 18% improvement in greenhouse gas intensity (the ratio of greenhouse gas emissions to economic output) amounting to a 350 Mt reduction in CO2 by 2012 (source: http://64.70.252.93/newfiles/Final_Report/II_Climate%20Change/ II.3.a%20-%20Greenhouse%20Gas%20Emissions%20Targets.pdf page 10). In terms of absolute emissions, total U.S. greenhouse gas emissions would grow 12% from 2002 to 2012, resulting in greenhouse gas emissions of 7,900 MtCO2eq) (source: http://www.pewclimate.org/policy_center/analyses/ response_bushpolicy.cfm). The McCain-Lieberman Climate Stewardship Act of 2003 was discussed in the Senate but not yet accepted. It calls for U.S. emissions to be capped at 2000 levels in 2010. McCain-Lieberman excludes residential and agricultural sources of greenhouse gases, as well as any entity responsible for less than 10,000 metric tons of carbon dioxide per year or its equivalent. The proposed programme covers more than 70% of all U.S. carbon dioxide and industrial greenhouse gas emissions (source: http://64.70.252.93/newfiles/Final_Report/ II_Climate%20Change/II.3.a%20-%20Greenhouse%20Gas%20Emissions%20Targets.pdf page 13). 3 For the year 2002. “Industry” includes energy, process and fugitive emissions but excludes emissions from electricity generation. “Households and services” also excludes emissions from electricity generation. “Agriculture” includes only non-CO2 emissions. Emissions exclude “Land-Use Change & Forestry”, which account for -691 Mt CO2 in 2002 (i.e. net removals), equivalent to 10% of total emissions. 4 For the year 2002. Total primary energy supply as provided by IEA (2004) Energy Balances, Paris, France. 5 Difference between emissions in 2003 and the Kyoto target as a percentage of emissions in 1990. 6 For the year 2002. Population in 2002 is based on World Bank (2005). http://www.worldbank.org/data/wdi2005/index.html 7 For the year 2001. Gross Domestic Product is based on Purchase Power Parity from World Resources Institute (2005). http://cait.wri.org/ 8 Change in share of renewable energy sources in primary energy consumption from 1990 to 2002 based on IEA (2004) Energy Balances, Paris, France. Includes also large hydro, due to lack of disaggregated data. WWF only supports hydropower that is consistent with World Commission on Dams guidelines. 9 For public electricity plants in 2001. Based on IEA (2004) CO2 emissions from fuel combustion and IEA (2003) Energy Balances, Paris, France. 10 Based on energy efficiency of iron and steel and cement production in Phylipsen, G.J.M., W. Graus, K. Blok, Y. Hofman and M. Voogt (2003). International Comparisons Of Energy Efficiency – Results For Iron & Steel, Cement And Electricity Generation. Ecofys, Utrecht, The Netherlands. 11 For the year 2002. Includes only direct emissions (e.g. from space heating) and excludes indirect emissions from electricity use. 12 Research budgets are in the range of those of other industrialized countries in comparison to their GDP. Other countries’ support for renewable energy through feed in tariffs in comparison to their GDP is substantially higher. 13 “The good, the bad, and the ugly: A guide to U.S. climate policy”, U.S. Climate Action Network Report, COP10, December 2004, available at: http://www.climatenetwork.org/uscanweb/gbu.htm; PEW Center for global climate change 2005: “Learning From State Action On Climate Change”, in brief No. 8, available at: http://www.pewclimate.org/policy_center/policy_reports_and_analysis/state/index.cfm
22
Climate scorecard: Brazil Greenhouse gas emissions1
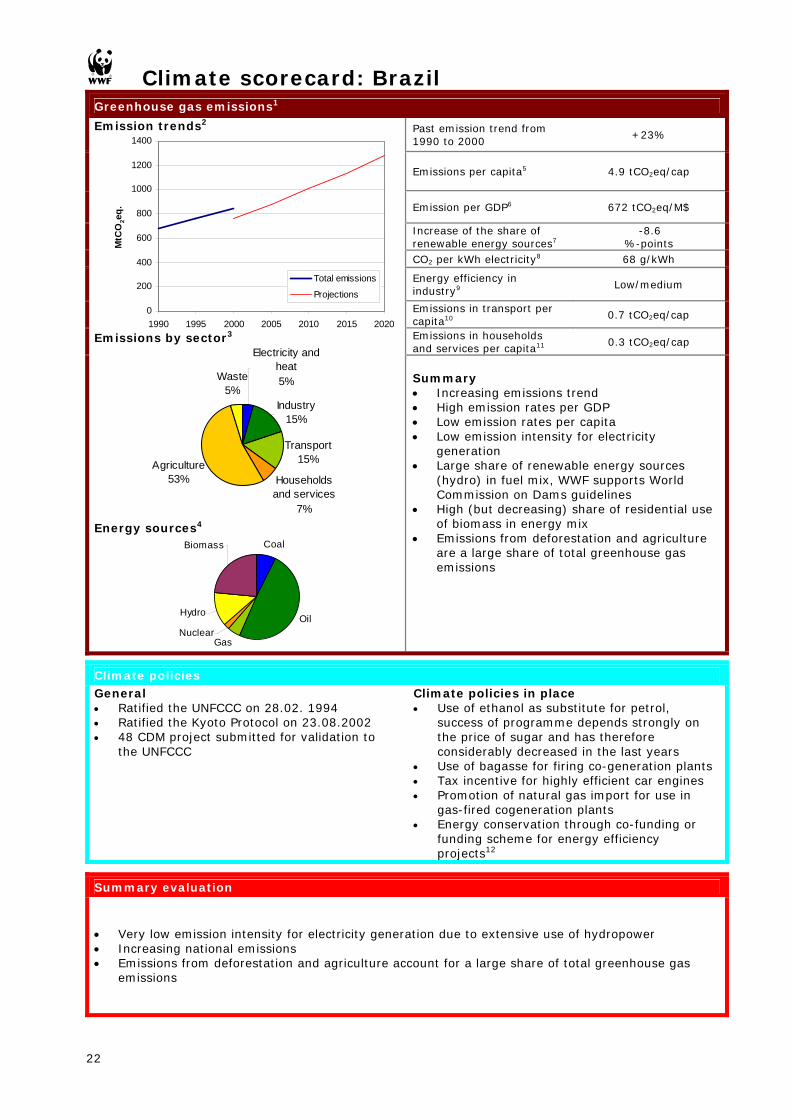
Past emission trend from 1990 to 2000
+23%
Emissions per capita5 4.9 tCO2eq/cap
Emission per GDP6 672 tCO2eq/M$
Increase of the share of renewable energy sources7
-8.6 %-points
CO2 per kWh electricity8 68 g/kWh
Energy efficiency in industry9
Low/medium
Emissions in transport per capita10
0.7 tCO2eq/cap
Emissions in households and services per capita11
0.3 tCO2eq/cap
Emission trends2
0
200
400
600
800
1000
1200
1400
1990 1995 2000 2005 2010 2015 2020
MtC
O2e
q.
Total emissions
Projections
Emissions by sector3
Electricity and heat5%
Industry15%
Transport15%
Waste5%
Agriculture53% Households
and services7%
Energy sources4
Coal
Oil
GasNuclear
Hydro
Biomass
Summary • Increasing emissions trend • High emission rates per GDP • Low emission rates per capita • Low emission intensity for electricity
generation • Large share of renewable energy sources
(hydro) in fuel mix, WWF supports World Commission on Dams guidelines
• High (but decreasing) share of residential use of biomass in energy mix
• Emissions from deforestation and agriculture are a large share of total greenhouse gas emissions
Climate policies General • Ratified the UNFCCC on 28.02. 1994 • Ratified the Kyoto Protocol on 23.08.2002 • 48 CDM project submitted for validation to
the UNFCCC
Climate policies in place • Use of ethanol as substitute for petrol,
success of programme depends strongly on the price of sugar and has therefore considerably decreased in the last years
• Use of bagasse for firing co-generation plants • Tax incentive for highly efficient car engines • Promotion of natural gas import for use in
gas-fired cogeneration plants • Energy conservation through co-funding or
funding scheme for energy efficiency projects12
Summary evaluation
• Very low emission intensity for electricity generation due to extensive use of hydropower • Increasing national emissions • Emissions from deforestation and agriculture account for a large share of total greenhouse gas
emissions

23
1 Unless otherwise specified, emissions refer to greenhouse gas emissions from CO2, CH4, N2O, HFCs, PFCs, and SF6 in Mt CO2 equivalent. The emissions are taken from Climate Analysis Indicators Tool (CAIT) by the World Resources Institute, available at: http://cait.wri.org. The emissions exclude “Land-Use Change & Forestry” and “International Bunker Fuels”. The emissions are available for the years 1990, 1995 and 2000 from this source. 2 The projections are taken from IEA CO2 emissions from fuel combustion from CAIT. http://cait.wri.org/cait.php?page=project&menu=5&start=2010&end=2020&update=Update for CO2 and U.S. EPA 2002: "Emissions and Projections of Non-CO2 Greenhouse Gases from Developing Countries: 1990 to 2020" DRAFT June 2002, Elizabeth Scheehle, available at http://www.epa.gov/methane/pdfs/draftdevelopingcountries.pdf for CH4 and N2O 3 For the year 2000. “Industry” includes energy, process and fugitive emissions but excludes emissions from electricity generation. “Households and services” also excludes emissions from electricity generation. “Agriculture” includes only non-CO2 emissions. Emissions exclude “Land-Use Change & Forestry”. These emissions account for 1372 Mt in 2000, equivalent to 160% of total emissions (excluding Land-Use Change & Forestry). 4 For the year 2001. Total primary energy supply as provided by IEA (2003) Energy Balances, Paris, France. 5 For the year 2000. Population is based on World Resources Institute (2005). http://cait.wri.org/ 6 For the year 2000. Gross Domestic Product is based on Purchase Power Parity from World Bank, World Development Indicators (Online), 2005, available at: http://devdata.worldbank.org/dataonline/. 7 Change in share of renewable energy sources in primary energy consumption from 1990 to 2001 based on IEA (2003) Energy Balances, Paris, France. Includes also large hydro, due to lack of disaggregated data. WWF only supports hydropower that is consistent with World Commission on Dams guidelines. 8 For public electricity plants in 2001. Based on IEA (2004) CO2 emissions from fuel combustion and IEA (2003) Energy Balances, Paris, France. 9 L. Price, E. Worrell and D. Phylipsen (1999). Energy Use and Carbon Dioxide Emissions in Energy-Intensive Industries in Key Developing Countries. Lawrence Berkeley National Laboratory. LBNL-45292. United States. 10 For the year 2000. Includes only CO2 emissions. Based on World Resources Institute (2005). http://cait.wri.org/cait.php?page=yearly&filter=1 11 For the year 2001. Includes only direct emissions (e.g. from space heating) and excludes indirect emissions from electricity use. 12 PEW Center on Climate Change: Climate Change Mitigation in Developing countries, 2002.
24
Climate scorecard: China Greenhouse gas emissions1
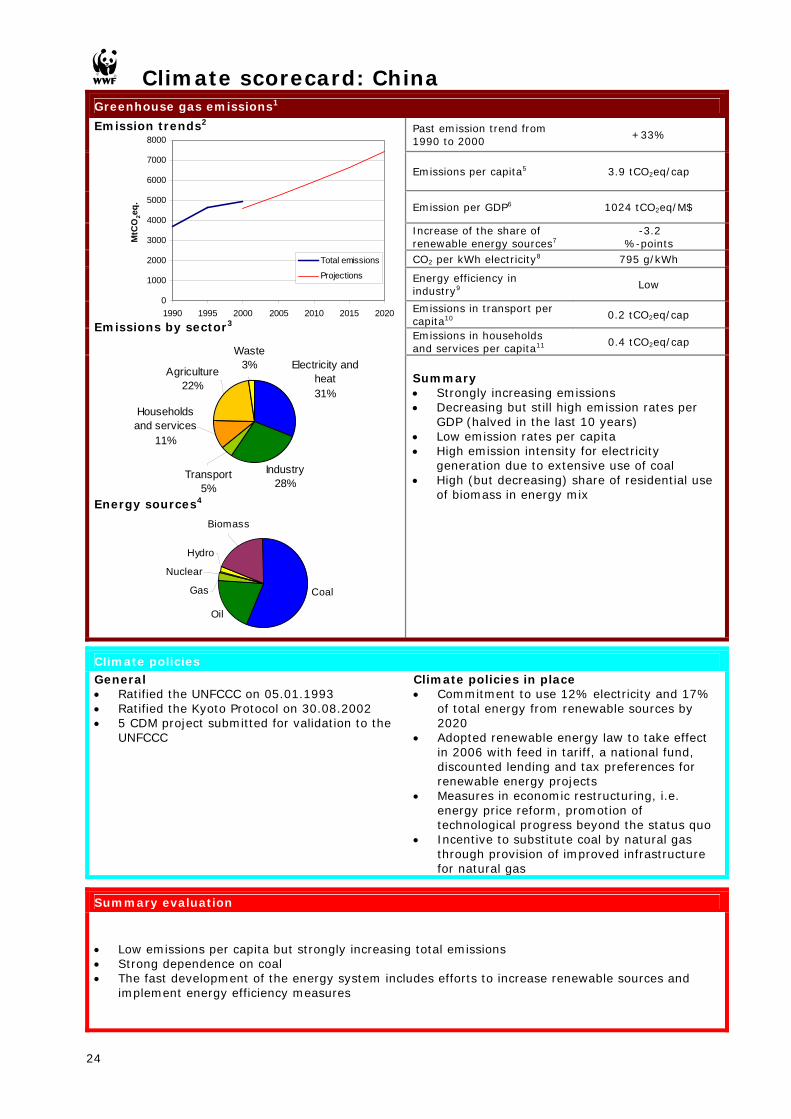
Past emission trend from 1990 to 2000
+33%
Emissions per capita5 3.9 tCO2eq/cap
Emission per GDP6 1024 tCO2eq/M$
Increase of the share of renewable energy sources7
-3.2 %-points
CO2 per kWh electricity8 795 g/kWh
Energy efficiency in industry9
Low
Emissions in transport per capita10
0.2 tCO2eq/cap
Emissions in households and services per capita11
0.4 tCO2eq/cap
Emission trends2
0
1000
2000
3000
4000
5000
6000
7000
8000
1990 1995 2000 2005 2010 2015 2020
MtC
O2e
q.
Total emissions
Projections
Emissions by sector3
Electricity and heat31%
Industry28%
Transport5%
Waste3%Agriculture
22%
Households and services
11%
Energy sources4
Coal
Oil
Gas
Nuclear
Hydro
Biomass
Summary • Strongly increasing emissions • Decreasing but still high emission rates per
GDP (halved in the last 10 years) • Low emission rates per capita • High emission intensity for electricity
generation due to extensive use of coal • High (but decreasing) share of residential use
of biomass in energy mix
Climate policies General • Ratified the UNFCCC on 05.01.1993 • Ratified the Kyoto Protocol on 30.08.2002 • 5 CDM project submitted for validation to the
UNFCCC
Climate policies in place • Commitment to use 12% electricity and 17%
of total energy from renewable sources by 2020
• Adopted renewable energy law to take effect in 2006 with feed in tariff, a national fund, discounted lending and tax preferences for renewable energy projects
• Measures in economic restructuring, i.e. energy price reform, promotion of technological progress beyond the status quo
• Incentive to substitute coal by natural gas through provision of improved infrastructure for natural gas
Summary evaluation
• Low emissions per capita but strongly increasing total emissions • Strong dependence on coal • The fast development of the energy system includes efforts to increase renewable sources and
implement energy efficiency measures

25
1 Unless otherwise specified, emissions refer to greenhouse gas emissions from CO2, CH4, N2O, HFCs, PFCs, and SF6 in Mt CO2 equivalent. The emissions are taken from Climate Analysis Indicators Tool (CAIT) by the World Resources Institute, available at: http://cait.wri.org. The emissions exclude “Land-Use Change & Forestry” and “International Bunker Fuels”. The emissions are available for the years 1990, 1995 and 2000 from this source. 2 The projections are taken from IEA CO2 emissions from fuel combustion from CAIT http://cait.wri.org/cait.php?page=project&menu=5&start=2010&end=2020&update=Update for CO2 and U.S. EPA 2002: "Emissions and Projections of Non- CO2 Greenhouse Gases from Developing Countries: 1990 to 2020" DRAFT June 2002, Elizabeth Scheehle, available at: http://www.epa.gov/methane/pdfs/draftdevelopingcountries.pdf for CH4 and N2O 3 For the year 2000. “Industry” includes energy, process and fugitive emissions but excludes emissions from electricity generation. “Households and services” also excludes emissions from electricity generation. “Agriculture” includes only non-CO2 emissions. Emissions are exclude “Land-Use Change & Forestry”. Net emissions from this sector account for -47 Mt in 2000 (i.e. removals), equivalent to 1% of total emissions. 4 For the year 2001. Total primary energy supply as provided by IEA (2003) Energy Balances, Paris, France. 5 For the year 2000. Population is based on World Resources Institute (2005). http://cait.wri.org/ 6 For the year 2000. Gross Domestic Product is based on Purchase Power Parity from World Bank, World Development Indicators (Online), 2005, available at: http://devdata.worldbank.org/dataonline/. 7 Change in share of renewable energy sources in primary energy consumption from 1990 to 2001 based on IEA (2003) Energy Balances, Paris, France. Includes also large hydro, due to lack of disaggregated data. WWF only supports hydropower that is consistent with World Commission on Dams guidelines. 8 For public electricity plants in 2001. Based on IEA (2004) CO2 emissions from fuel combustion and IEA (2003) Energy Balances, Paris, France. 9 L. Price, E. Worrell and D. Phylipsen (1999). Energy Use and Carbon Dioxide Emissions in Energy-Intensive Industries in Key Developing Countries. Lawrence Berkeley National Laboratory. LBNL-45292. United States. 10 For the year 2000. Includes only CO2 emissions. 11 For the year 2001. Includes only direct emissions (e.g. from space heating) and excludes indirect emissions from electricity use.

26
Climate scorecard: India Greenhouse gas emissions1
Past emission trend from 1990 to 2000
+41%
Emissions per capita5 1.8 tCO2eq/cap
Emission per GDP6 745 tCO2eq/M$
Increase of the share of renewable energy sources7
-10 %-points
CO2 per kWh electricity8 932 g/kWh
Energy efficiency in industry9
Low
Emissions in transport per capita10
0.1 tCO2eq/cap
Emissions in households and services per capita11
0.2 tCO2eq/cap
Emission trends2
0
500
1000
1500
2000
2500
3000
3500
1990 1995 2000 2005 2010 2015 2020
MtC
O2e
q.
Total emissions
Projections
Emissions by sector3
Electricity and heat28%
Transport7%
Industry16%
Waste5%
Agriculture34%
Households and services
10%
Energy sources4
Coal
Oil
Gas
Biomass
Hydro
Nuclear
Solar/w ind/ other
Summary • Strongly increasing emissions • High emission rates per GDP • Very low emission rates per capita • Very high emission intensity for electricity
generation due to large share of coal • Very high (but decreasing) share of residential
use of biomass in energy mix
Climate policies General • Ratified the UNFCCC on 01.11.1993 • Ratified the Kyoto Protocol on 26.08.2002 • 27 CDM project submitted for validation to
the UNFCCC
Climate policies in place • Reduction of vehicle emissions through
measures like required performance standards or obligatory use of compressed natural gas as fuel
• Reduced coal subsidies • Public investment for development of natural
gas infrastructure • Mandatory annual reporting of energy
conservation measures for private companies • Renewable energy programme, e.g. biomass
gasification systems for rural homes, subsidisation of renewable technologies
Summary evaluation
• Very low emissions per capita but strongly increasing emissions • Strong dependence on coal, some efforts underway to increase renewables • Efforts made to slow emission growth

27
1 Unless otherwise specified, emissions refer to greenhouse gas emissions from CO2, CH4, N2O, HFCs, PFCs, and SF6 in Mt CO2 equivalent. The emissions are taken from Climate Analysis Indicators Tool (CAIT) by the World Resources Institute, available at: http://cait.wri.org. The emissions exclude “Land-Use Change & Forestry” and “International Bunker Fuels”. The emissions are available for the years 1990, 1995 and 2000 from that source. 2 The projections are taken from IEA CO2 emissions from fuel combustion from CAIT. http://cait.wri.org/cait.php?page=project&menu=5&start=2010&end=2020&update=Update for CO2 and U.S. EPA 2002: "Emissions and Projections of Non-CO2 Greenhouse Gases from Developing Countries: 1990 to 2020" DRAFT June 2002, Elizabeth Scheehle, available at: http://www.epa.gov/methane/pdfs/draftdevelopingcountries.pdf for CH4 and N2O 3 For the year 2000. “Industry” includes energy, process and fugitive emissions but excludes emissions from electricity generation. “Households and services” also excludes emissions from electricity generation. “Agriculture” includes only non-CO2 emissions. Emissions exclude “Land-Use Change & Forestry”. Net emissions of this sector account for -40 Mt in 2000 (i.e. removals), equivalent to 2% of total emissions. 4 For the year 2001. Total primary energy supply as provided by IEA (2003) Energy Balances, Paris, France. 5 For the year 2000. Population is based on World Resources Institute (2005). http://cait.wri.org/ 6 For the year 2000. Gross Domestic Product is based on Purchase Power Parity from Nation Master, H Gross Domestic Product is based on Purchase Power Parity from World Bank, World Development Indicators (Online), 2005, available at: http://devdata.worldbank.org/dataonline/.H7 Change in share of renewable energy sources in primary energy consumption from 1990 to 2001 based on IEA (2003) Energy Balances, Paris, France. Includes also large hydro, due to lack of disaggregated data. WWF only supports hydropower that is consistent with World Commission on Dams guidelines. 8 For public electricity plants in 2001. Based on IEA (2004) CO2 emissions from fuel combustion and IEA (2003) Energy Balances, Paris, France. 9 L. Price, E. Worrell and D. Phylipsen (1999). Energy Use and Carbon Dioxide Emissions in Energy-Intensive Industries in Key Developing Countries. Lawrence Berkeley National Laboratory. LBNL-45292. United States. 10 For the year 2000. Includes only CO2 emissions. 11 For the year 2001. Includes only direct emissions (e.g. from space heating) and excludes indirect emissions from electricity use.

28
Climate scorecard: Mexico Greenhouse gas emissions1
Past emission trend from 1990 to 2000
+18
Emissions per capita5 5.1 tCO2eq/cap
Emission per GDP6 585 tCO2eq/M$
Increase of the share of renewable energy sources7
-0.9 %-points
CO2 per kWh electricity8 571 g/kWh
Energy efficiency in industry9
Low
Emissions in transport per capita10
1.0 tCO2eq/cap
Emissions in households and services per capita11
0.5 tCO2eq/cap
Emission trends2
0
100
200
300
400
500
600
700
800
900
1000
1990 1995 2000 2005 2010 2015 2020
MtC
O2e
q.
Total emissions
Projection
Emissions by sector3
Electricity and heat34%
Industry17%
Transport21%
Waste7%Agriculture
11%
Households and services
10%
Energy sources4
Coal
Oil
Gas
Solar/ w ind/ otherGeother-
mal
NuclearHydro
Biomass
Summary • Low emissions per capita • Increasing emissions • High emission growth projected for 2010 • Strong dependence on oil
Climate policies General • Ratified the UNFCCC on 11.03.1993 • Ratified the Kyoto Protocol on 07.09.2000 • 5 CDM project submitted for validation to the
UNFCCC
Climate policies in place • Creation of the National Commission for
Energy Saving (CoNAE) to promote energy savings at national level and the use of renewable energy. Implemented energy efficiency standards
• Enhancing natural gas use by opening gas transport and distribution to private sector
Summary evaluation
• Low emissions per capita, but increasing and projected to increase faster in the future • Strong dependence on oil • First efforts to slow emission growth
29
1 Unless otherwise specified, emissions refer to greenhouse gas emissions from CO2, CH4, N2O, HFCs, PFCs, and SF6 in Mt CO2 equivalent. The emissions are taken from Climate Analysis Indicators Tool (CAIT) by the World Resources Institute, available at: http://cait.wri.org. The emissions exclude “Land-Use Change & Forestry” and “International Bunker Fuels”. The emissions are available for the years 1990, 1995 and 2000 from this source. 2 The projections are taken from Mexico’s second National Communication to UNFCCC. The projection for the year 2010 refers only to CO2 emissions from fuel combustion. http://unfccc.int/resource/docs/natc/mexnc2.pdf page 145. Medium scenario; 4.5% annual growth GDP. 3 For the year 2000. “Industry” includes energy, process and fugitive emissions but excludes emissions from electricity generation. “Households and services” also excludes emissions from electricity generation. “Agriculture” includes only non-CO2 emissions. Emissions exclude “Land-Use Change & Forestry”, which amount to 97 Mt in 2000, equivalent to 19% of total emissions (excluding Land-Use Change & Forestry). 4 For the year 2001. Total primary energy supply as provided by IEA (2003) Energy Balances, Paris, France. 5 For the year 2000. Population is based on World Resources Institute (2005). http://cait.wri.org/ 6 For the year 2000. HGross Domestic Product is based on Purchase Power Parity from World Bank, World Development Indicators (Online), 2005, available at: http://devdata.worldbank.org/dataonline/.H7 Change in share of renewable energy sources in primary energy consumption from 1990 to 2001 based on IEA (2003) Energy Balances, Paris, France. Includes also large hydro, due to lack of disaggregated data. WWF only supports hydropower that is consistent with World Commission on Dams guidelines. 8 For public electricity plants in 2001. Based on IEA (2004) CO2 emissions from fuel combustion and IEA (2003) Energy Balances, Paris, France. 9 L. Price, E. Worrell and D. Phylipsen (1999). Energy Use and Carbon Dioxide Emissions in Energy-Intensive Industries in Key Developing Countries. Lawrence Berkeley National Laboratory. LBNL-45292. United States. 10 For the year 2000. Includes only CO2 emissions. 11 For the year 2001. Includes only direct emissions (e.g. from space heating) and excludes indirect emissions from electricity use.

30
Climate scorecard: South Africa Greenhouse gas emissions1
Past emission trend from 1990 to 2000
+16%
Emissions per capita5 9.2 tCO2eq/cap
Emission per GDP6 994 tCO2eq/M$
Increase of the share of renewable energy sources7
0.3 %-points
CO2 per kWh electricity8 890 g/kWh
Energy efficiency in industry9
Low
Emissions in transport per capita10
0.8 tCO2eq/cap
Emissions in households and services per capita11
0.6 tCO2eq/cap
Emission trends2
0
100
200
300
400
500
600
1990 1995 2000 2005 2010 2015 2020
MtC
O2e
q.
Total emissions
Projections
Emissions by sector3
Electricity and heat50%
Industry19%
Transport10%
Waste3%
Agriculture11%
Households and services
7%
Energy sources4
Coal
OilGas
Nuclear
HydroBiomass
Summary • Very large share of coal in energy mix • High emission intensity for electricity
generation due to large share of coal • Very high emission rate per GDP • Low emissions per capita compared to
industrialized countries, but high for developing countries
• Increasing emissions
Climate policies General • Ratified the UNFCCC on 28.08.1997 • Ratified the Kyoto Protocol on 31.07.2002 • 2 CDM projects submitted
Climate policies in place • Programmes addressing energy efficiency in
energy production and the main energy-consuming sectors
• Renewable energy target of 10 000 GWh by 2013, about 4% of then projected electricity generation12
• Government took legal and economical steps taken for future substitution of coal-based liquid fuel by natural gas
Summary evaluation
• Emissions per capita slightly below average of industrialized countries, increasing trend • Very strong dependence on coal • First intentions to lower emissions in the future

31
1 Unless otherwise specified, emissions refer to greenhouse gas emissions from CO2, CH4, N2O, HFCs, PFCs, and SF6 in M CO2 equivalent. The emissions are taken from Climate Analysis Indicators Tool (CAIT) by the World Resources Institute, available at: http://cait.wri.org. The emissions exclude “Land-Use Change & Forestry” and “International Bunker Fuels”. The emissions are available for the years 1990, 1995 and 2000 from this source. 2 The projections are taken from IEA CO2 emissions from fuel combustion from CAIT. http://cait.wri.org/cait.php?page=project&menu=5&start=2010&end=2020&update=Update for CO2 and U.S. EPA 2002: "Emissions and Projections of Non-CO2 Greenhouse Gases from Developing Countries: 1990 to 2020" DRAFT June 2002, Elizabeth Scheehle, available at: http://www.epa.gov/methane/pdfs/draftdevelopingcountries.pdf for CH4 and N2O 3 For the year 2000. “Industry” includes energy, process and fugitive emissions but excludes emissions from electricity generation. “Households and services” also excludes emissions from electricity generation. “Agriculture” includes only non-CO2 emissions. Emissions are excluding “Land-Use Change & Forestry”. These emissions are 1.7 Mt in 2000, equivalent to 0.4% of total emissions. 4 For the year 2001. Total primary energy supply as provided by IEA (2003) Energy Balances, Paris, France. 5 For the year 2000. Population is based on World Resources Institute (2005). http://cait.wri.org/ 6 For the year 2000. Gross Domestic Product is based on Purchase Power Parity from Nation Master, http://www.nationmaster.com/graph-T/eco_gdp_ppp 7 Change in share of renewable energy sources in primary energy consumption from 1990 to 2001 based on IEA (2003) Energy Balances, Paris, France. Includes also large hydro, due to lack of disaggregated data. WWF only supports hydropower that is consistent with World Commission on Dams guidelines. 8 Eskom (2003). Annual report: Corporate delivery in a decade of democracy. Sandton, Eskom Holdings. www.eskom.co.za 9 L. Price, E. Worrell and D. Phylipsen (1999). Energy Use and Carbon Dioxide Emissions in Energy-Intensive Industries in Key Developing Countries. Lawrence Berkeley National Laboratory. LBNL-45292. United States. 10 For the year 2000. Includes only CO2 emissions. 11 For the year 2001. Includes only direct emissions (e.g. from space heating) and excludes indirect emissions from electricity use. 12 DME (Department of Minerals and Energy) 2003. White paper on renewable energy, Pretoria, South Africa. www.dme.gov.za

32 Summary
Middle position1
France Germany UK
Italy Japan Russia Canada
USA
Greenhouse gas emissions2
Past emission trend from 1990 to 20023
0%
Current distance to the Kyoto target4
0%
Emissions per capita 14
tCO2eq/cap5
Emission per GDP6 662
tCO2eq/M$7
Increase of the share of renewable energy sources8
0.0%9
CO2 per kWh electricity10 477 g/kWh11
Energy efficiency in industry12
Medium
Emissions in transport per capita
2.7 tCO2eq/cap13
Emissions in households and services per capita14
1.4 eqtCO2 /cap15
Climate policies -
Summary evaluation -
France Germany UK Italy Japan Russia Canada USA
1 Value that defines the middle of the climate meter. It is derived as the average over the industrialized countries. 2 Unless otherwise specified, emissions refer to greenhouse gas emissions from CO2, CH4, N2O, HFCs, PFCs, and SF6 in Mt CO2 equivalent. The emissions exclud “Land-Use Change & Forestry” and “International Bunker Fuels”. The climate meters refer to deviation from average of industrialized countries. 3 Past emission trend in the period 1990 to 2000 for developing countries, 1990 to 2003 for the United Kingdom, France, Italy, Germany, Japan, Russia and the United States and 1990-2002 for Canada. 4 Difference between emissions in most recent year available and the Kyoto target as percentage of emissions in 1990. 5 For the year 2000. Based on CAIT: http://cait.wri.org/cait.php?page=compcoun&url=form&pHints=shut&pOne=shut&pTwo=shut&pThree=&pFour=&lmenu=520&rmenu=534&year=2000§or=natl&co2=1&ch4=1&n2o=1&pfc=1&hfc=1&sf6=1&update=Update&start2=1950&limit2=1&emit2=1&luc2=1 6 The Gross Domestic Product (GDP) is based on Purchase Power Parity (PPP). 7 For the year 2000. Gross Domestic Product is based on Purchase Power Parity from World Bank, World Development Indicators (Online), 2005, available at: http://devdata.worldbank.org/dataonline/. 8 Change in share of renewable energy sources in primary energy consumption from 1990 to 2002 (or most recent year available). Includes also large-scale hydro. 9 For OECD countries. As percentage of total primary energy supply in 2002 as provided by IEA (2004) Energy Balances, Paris, France. 10 For public electricity plants. Reflects CO2 emissions from fuel combustion. For France and Japan, the climate meter has been adapted from green to medium to reflect the relatively large share of nuclear power in their fuel mix. 11 For the year 2000. Based on CAIT: http://cait.wri.org/cait.php?page=compcoun&url=form&pHints=shut&pOne=shut&pTwo=shut&pThree=&pFour=&lmenu=520&rmenu=534&year=2000§or=natl&co2=1&ch4=1&n2o=1&pfc=1&hfc=1&sf6=1&update=Update&start2=1950&limit2=1&emit2=1&luc2=1 12 Based on energy efficiency of iron and steel and cement production. Countries are divided into three categories: high, medium and low energy efficiency. 13 For the year 2000. Includes only CO2 emissions. Based on World Resources Institute (2005). http://cait.wri.org/cait.php?page=yearly&filter=1 14 Includes only direct emissions (e.g. from space heating) and excludes indirect emissions from electricity use. 15 For the year 2001. Includes only direct emissions (e.g. from space heating) and excludes indirect emissions from electricity use. Emissions are based on IEA (2004) CO2 emissions from fuel combustion for “Commercial and public services” and “Residential sector”.
33

34
Further reading
• Official national emission estimates reported to the UNFCCC: Greenhouse gas inventory data of the UNFCCC secretariat, available at http://ghg.unfccc.int/index.html
• Compilation of national greenhouse gas emissions and other climate
relevant data: Climate Analysis Indicators Tool (CAIT) by the World Resources Institute, available at http://cait.wri.org
• Annex I emission fact sheets: Malte Meinshausen, 2004: “Emissions, Targets
and Projections for Annex I Parties”, revised version of data appendix in F. Yamin and J. Depledge, “The International Climate Change Regime: A Guide to Rules, Institutions, and Procedures”, Cambridge University Press, 2004, available at http://www.simcap.org
• Emission trends in EU countries: European Environment Agency’s European
Topic Centre for Air and Climate Change, 2004: “Greenhouse gas emission trends and projections in Europe 2004”, EEA Report No 5/2004, available at http://reports.eea.eu.int/eea_report_2004_5/en
• Analysis of national allocation plans and Kyoto targets: Ecofys, 2004:
“Interim Report on National Allocation Plans”, YUES4003, available at www.ecofys.com
• Comparison of energy efficiency: Phylipsen, G.J.M., W. Graus, K. Blok, Y.
Hofman and M. Voogt (2003). International Comparisons Of Energy Efficiency - Results For Iron & Steel, Cement And Electricity Generation. Ecofys, Utrecht, The Netherlands.

35

Published in July 2005 by WWF - World Wide Fund For Nature (formerly World Wildlife Fund), Gland, Switzerland. Any reproduction in full or in part of this publication must mention the title and credit the above-mentioned publisher as the copyright owner. © Text (2005) WWF. All rights reserved.
36