Embed Size (px)
Citation preview
page 1
WSTA Annual Wine Report
May 2016
The Wine and Spirit Trade AssociationRegistered number: 410660 England Limited by Guarantee
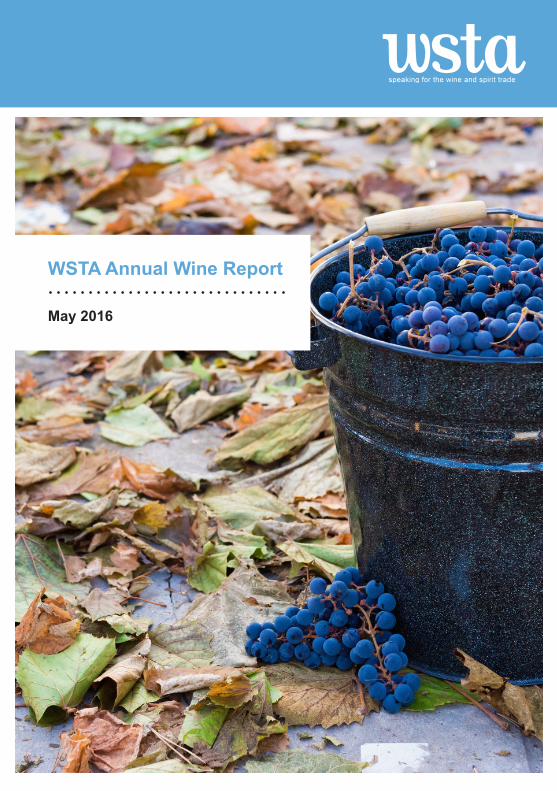
Contents
Champagne and Sparkling, p.14
Foreword, p.4 Wine duty in the UK, p.6
Consumer polling, p.7 Still wine overview, p.8
White, p.10 Red, p.12
Import and export, p.18
Fortified and others, p.16

page 3
About
About us
The WSTA represents over 300 companies producing, importing, exporting, transporting and selling wines and spirits in the United Kingdom.
We campaign for a vibrant and sustainable wine and spirit industry, helping to build a future in which alcohol is produced, sold and enjoyed responsibly.
Methodology
This publication aims to build upon the wine-based information and data in the WSTA Quarterly Market Reports. The most up-to-date data possible has been used and, though the end dates are not consistent across the report, the data is exactly accurate to its source. For example, where the market data for the on and off trade is dated to December 2015 and January 2016 respectively, UK export data is for the entire year of 2015. Premiumisation and other parts of the publication uses IWSR projection data for 2015. All insights and analysis written by WSTA.
Special thanks to:
For more information on data providers and publications they produce for the drinks industry, please contact [email protected].
The Wine and Spirit Trade AssociationRegistered number: 410660 England Limited by Guarantee
Foreword
Welcome to the inaugural edition of the WSTA’s Wine Report. We have brought together data from various sources to give you a broad overview of the market in the UK, which remains one of the world’s most important and diverse markets for wine businesses and consumers alike.
The industry in the UK has faced tough trading conditions for a number of years, particularly due to the tightening of consumer spending. As a mature market there is little room to grow and these factors have led to a slow, consistent decline in volume sales and a rise in consolidation of businesses in the trade.
However, there have been some positive changes for the industry recently. Following the WSTA’s campaigning the alcohol duty escalator was scrapped, ending year on year inflation busting duty rises. In the past two years wine duty has risen at its lowest rates for 13 years helping to save the industry millions in tax liabilities.
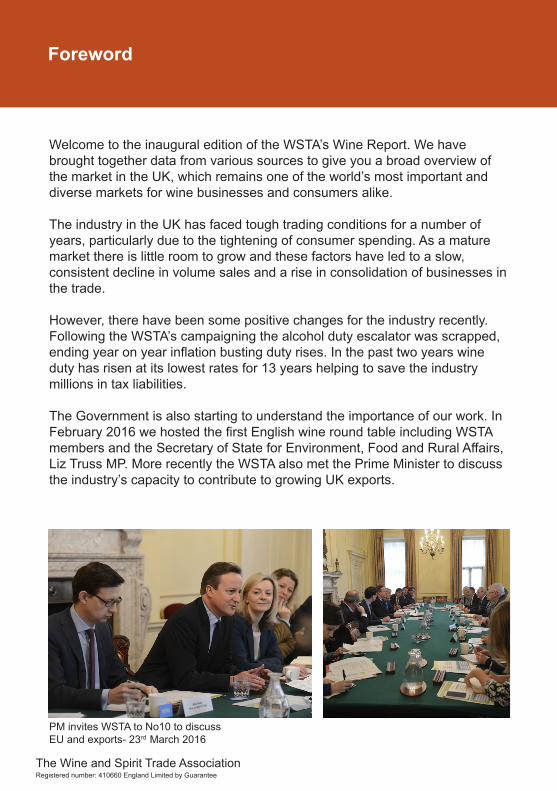
The Government is also starting to understand the importance of our work. In February 2016 we hosted the first English wine round table including WSTA members and the Secretary of State for Environment, Food and Rural Affairs, Liz Truss MP. More recently the WSTA also met the Prime Minister to discuss the industry’s capacity to contribute to growing UK exports.
PM invites WSTA to No10 to discuss EU and exports- 23rd March 2016
page 5
Foreword
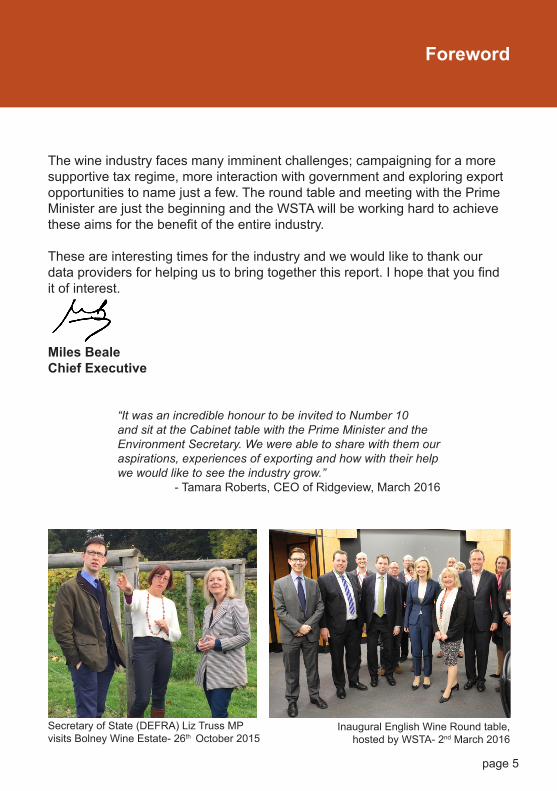
“It was an incredible honour to be invited to Number 10 and sit at the Cabinet table with the Prime Minister and the Environment Secretary. We were able to share with them our aspirations, experiences of exporting and how with their help we would like to see the industry grow.”
- Tamara Roberts, CEO of Ridgeview, March 2016
Secretary of State (DEFRA) Liz Truss MP visits Bolney Wine Estate- 26th October 2015
Inaugural English Wine Round table, hosted by WSTA- 2nd March 2016
The wine industry faces many imminent challenges; campaigning for a more supportive tax regime, more interaction with government and exploring export opportunities to name just a few. The round table and meeting with the Prime Minister are just the beginning and the WSTA will be working hard to achieve these aims for the benefit of the entire industry.
These are interesting times for the industry and we would like to thank our data providers for helping us to bring together this report. I hope that you find it of interest.
Miles BealeChief Executive
The Wine and Spirit Trade AssociationRegistered number: 410660 England Limited by Guarantee
Wine duty in the UK
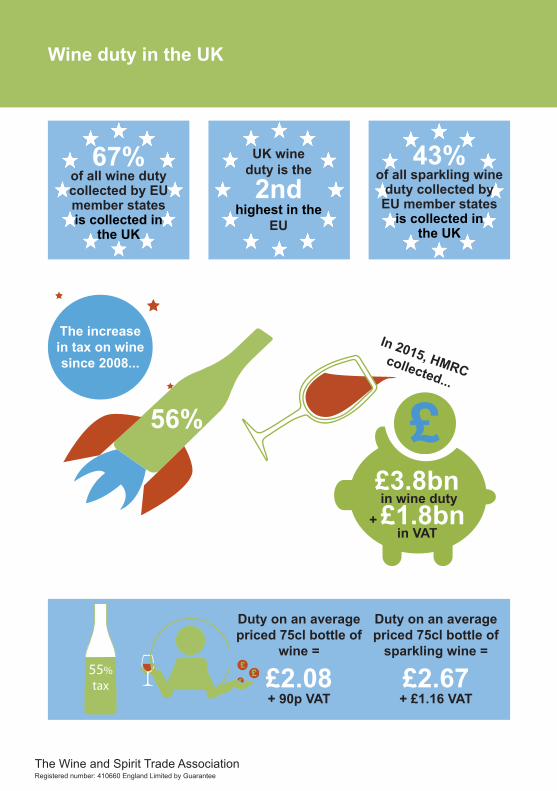
UK wine duty is the
2nd highest in the
EU
In 2015, HMRC collected...
£3.8bn in wine duty
+ £1.8bn in VAT
Duty on an average priced 75cl bottle of
wine =
£2.08+ 90p VAT
55%tax
Duty on an average priced 75cl bottle of
sparkling wine =
£2.67+ £1.16 VAT
43% of all sparkling wine
duty collected by EU member states
is collected in the UK
67% of all wine duty collected by EU member states is collected in
the UK
56%
The increase in tax on wine since 2008...
page 7
Consumer polling
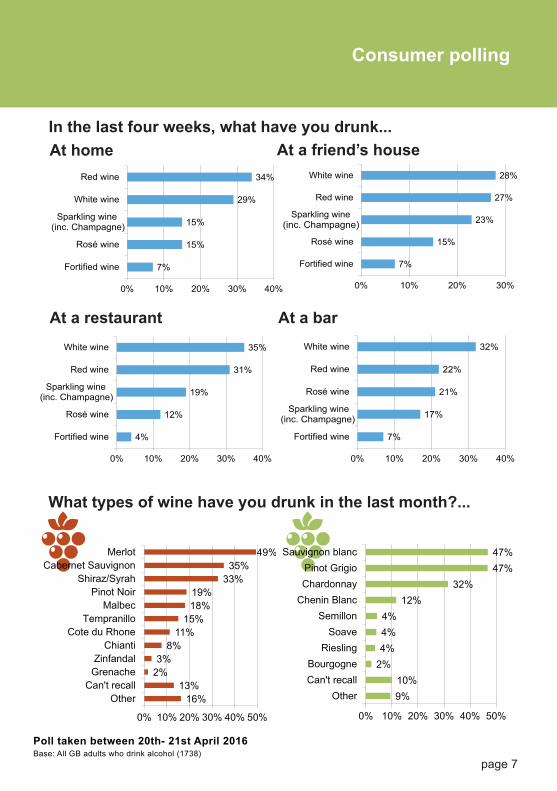
Base: All GB adults who drink alcohol (1738) Poll taken between 20th- 21st April 2016
What types of wine have you drunk in the last month?...
16%13%
2%3%
8%11%
15%18%19%
33%35%
49%
0% 10% 20% 30% 40% 50%
OtherCan't recall
GrenacheZinfandal
ChiantiCote du Rhone
TempranilloMalbec
Pinot NoirShiraz/Syrah
Cabernet SauvignonMerlot
9%10%
2%4%4%4%
12%32%
47%47%
0% 10% 20% 30% 40% 50%
OtherCan't recallBourgogne
RieslingSoave
SemillonChenin BlancChardonnayPinot Grigio
Sauvignon blanc
In the last four weeks, what have you drunk...
7%
15%
15%
29%
34%
0% 10% 20% 30% 40%
Fortified wine
Rosé wine
Sparkling wine(inc. Champagne)
White wine
Red wine
At home
7%
15%
23%
27%
28%
0% 10% 20% 30%
Fortified wine
Rosé wine
Sparkling wine(inc. Champagne)
Red wine
White wine
At a friend’s house
7%
17%
21%
22%
32%
0% 10% 20% 30% 40%
Fortified wine
Sparkling wine(inc. Champagne)
Rosé wine
Red wine
White wine
At a bar
4%
12%
19%
31%
35%
0% 10% 20% 30% 40%
Fortified wine
Rosé wine
Sparkling wine(inc. Champagne)
Red wine
White wine
At a restaurant
The Wine and Spirit Trade AssociationRegistered number: 410660 England Limited by Guarantee
Still wine:Overview
11 10 11 9
4237
43 39
47 54 47 52
0%
10%
20%
30%
40%
50%
60%
70%
80%
90%
100%
Off trade On trade Off trade On trade
Volume Value
Red White Rosé
Market shares by colour
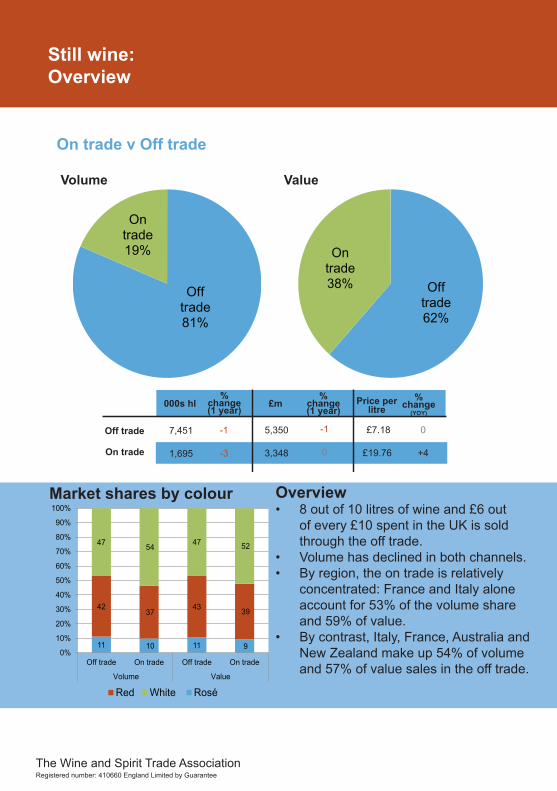
Off trade81%
On trade19%
Off trade62%
On trade38%
On trade v Off trade
% change (1 year)
% change (1 year)
£m000s hl % change
(YOY)
Price per litre
7,451
1,695
-1
-3
£7.18
£19.76
5,350
3,348
Off trade
On trade
-1
0
0
+4
Overview• 8 out of 10 litres of wine and £6 out
of every £10 spent in the UK is sold through the off trade.
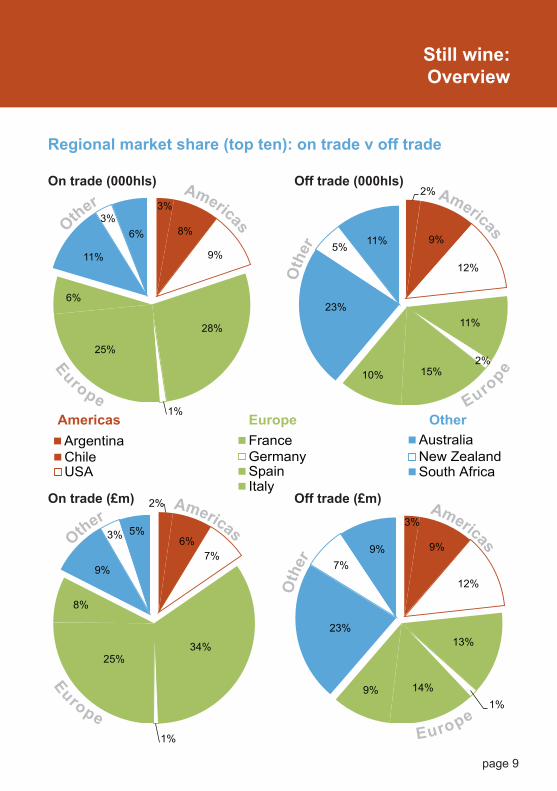
• Volume has declined in both channels.• By region, the on trade is relatively
concentrated: France and Italy alone account for 53% of the volume share and 59% of value.
• By contrast, Italy, France, Australia and New Zealand make up 54% of volume and 57% of value sales in the off trade.
Volume Value
page 9
3%
8%
9%
28%
1%
25%
6%
11%
3%6%
Still wine:Overview
Regional market share (top ten): on trade v off trade
2%
9%
12%
11%
2%15%10%
23%
5% 11%
On trade (000hls) Off trade (000hls)
2%
6%7%
34%
1%
25%
8%
9%
3% 5%3%
9%
12%
13%
1%14%9%
23%
7%9%
ArgentinaChileUSA
FranceGermany
ItalySpain
AustraliaNew ZealandSouth Africa
Americas Europe Other
On trade (£m) Off trade (£m)
Oth
er
Americas
Other
Americas
O
ther Americas
Oth
er
Americas
Europe
EuropeEurope
Euro
pe
The Wine and Spirit Trade AssociationRegistered number: 410660 England Limited by Guarantee
Still wine: White
% change (1 year)
% change (1 year)
£m000s hl % change
(YOY)
Price per litre
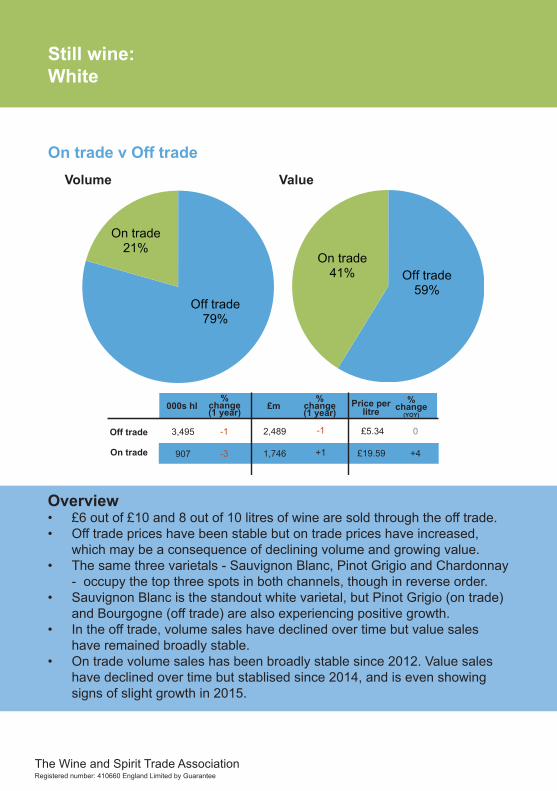
3,495
907
-1
-3
£5.34
£19.59
2,489
1,746
Off trade
On trade
-1
+1
0
+4
Value (£m)
Off trade59%
On trade41%
Overview• £6 out of £10 and 8 out of 10 litres of wine are sold through the off trade. • Off trade prices have been stable but on trade prices have increased,
which may be a consequence of declining volume and growing value.• The same three varietals - Sauvignon Blanc, Pinot Grigio and Chardonnay
- occupy the top three spots in both channels, though in reverse order.• Sauvignon Blanc is the standout white varietal, but Pinot Grigio (on trade)
and Bourgogne (off trade) are also experiencing positive growth.• In the off trade, volume sales have declined over time but value sales
have remained broadly stable.• On trade volume sales has been broadly stable since 2012. Value sales
have declined over time but stablised since 2014, and is even showing signs of slight growth in 2015.
On trade v Off tradeVolume Value
Off trade79%
On trade21%
page 11
Still wine: White
white
-
500
1,000
1,500
2,000
2,500
3,000
3,500
4,000
Volu
me
(000
hls)
/ Val
ue (£
m)
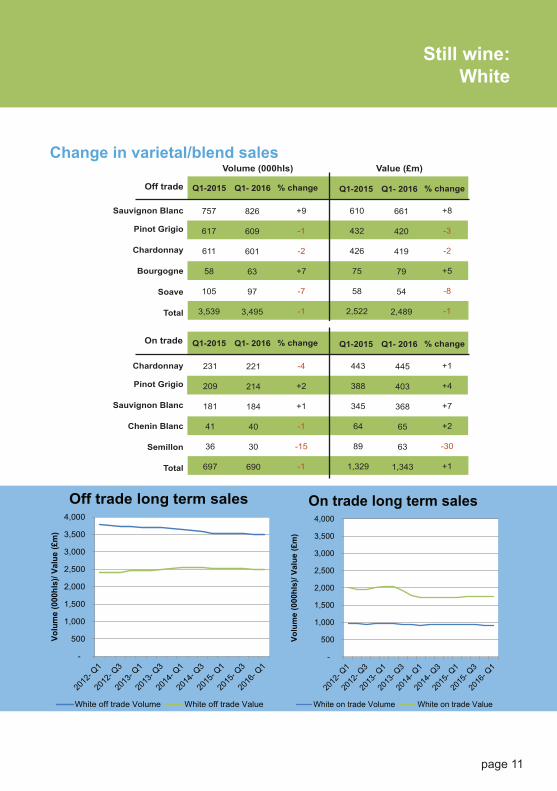
On trade long term sales
White on trade Volume White on trade Value
-
500
1,000
1,500
2,000
2,500
3,000
3,500
4,000
Volu
me
(000
hls)
/ Val
ue (£
m)
Off trade long term sales
White off trade Volume White off trade Value
Q1- 2016Q1-2015
Volume (000hls)
Sauvignon Blanc
Pinot Grigio
Chardonnay
Bourgogne
Soave
Total
Value (£m)
% change Q1- 2016Q1-2015 % change
+9
-1
-2
+7
-7
-1
610
432
426
75
58
2,522
661
420
419
79
54
2,489
+8
-3
-2
+5
-8
-1
757
617
611
58
105
3,539
826
609
601
63
97
3,495
Off trade
Change in varietal/blend sales
Q1- 2016Q1-2015
Chardonnay
Pinot Grigio
Sauvignon Blanc
Chenin Blanc
Semillon
Total
% change Q1- 2016Q1-2015 % change
-4
+2
+1
-1
-15
-1
443
388
345
64
89
1,329
445
403
368
65
63
1,343
+1
+4
+7
+2
-30
+1
231
209
181
41
36
697
221
214
184
40
30
690
On trade

The Wine and Spirit Trade AssociationRegistered number: 410660 England Limited by Guarantee
Still wine: Red
% change (1 year)
% change (1 year)
£m000s hl % change
(YOY)
Price per litre
3,123
620
-1
-4
£5.51
£20.81
2,295
1,290
Off trade
On trade
0
+1
+1
+5
On trade17%
Off trade83%
On trade36%
Off trade64%
Overview• The off trade dominance is more pronounced in red wine than in white,
occupying more of the market share in both volume (+4%) and value (+5%) sales.
• As with much of the category,prices have increased in the last year, especially in the on trade.
• The top two spots are occupiued by the same two varietals, Merlot and Shiraz, in both the on and off trade.
• The on trade is a very concentrated market by country of origin (see p.9) but also by red varietal/blend. Merlot dominates the on trade, occupying a 46% volume share of the top five varietals (in the off trade Merlot has 15% of the market share). Given its market share, Merlot may be a key indicator of red’s overall decline.
On trade v Off tradeVolume Value

page 13
Still wine:Red
-
200.00
400.00
600.00
800.00
1,000.00
1,200.00
1,400.00
1,600.00
Volu
me
(000
hls)
/ Val
ue (£
m)
On trade long term sales
Red on trade Volume Red on trade Value
-
500
1,000
1,500
2,000
2,500
3,000
3,500
4,000
Volu
me
(000
hls)
/ Val
ue (£
m)
Off trade long term sales
Red off trade Volume Red off trade Value
Change in varietal/blend sales
Q1- 2016Q1-2015
Volume (000hls)
Merlot
Shiraz
Tempranillo
Cabernet Sauvignon
Rhone
Total
Value (£m)
% change Q1- 2016Q1-2015 % change
+9
+9
+2
-2
0
-1
292
266
204
184
115
2,522
315
290
213
179
119
2,489
+8
+9
+5
-3
+4
-1
416
381
242
250
126
3,142
454
414
248
245
126
3,123
Off trade
Q1- 2016Q1-2015
Merlot
Shiraz
Cabernet Sauvignon
Zinfandel
Pinot Noir
Total
% change Q1- 2016Q1-2015 % change
-3
-9
-10
-6
+3
-5
462
129
140
110
107
947
452
123
129
106
114
924
-2
-5
-8
-4
+7
-2
228
77
73
62
52
492
221
70
66
58
54
469
On trade
The Wine and Spirit Trade AssociationRegistered number: 410660 England Limited by Guarantee
Sparkling wine andChampagne
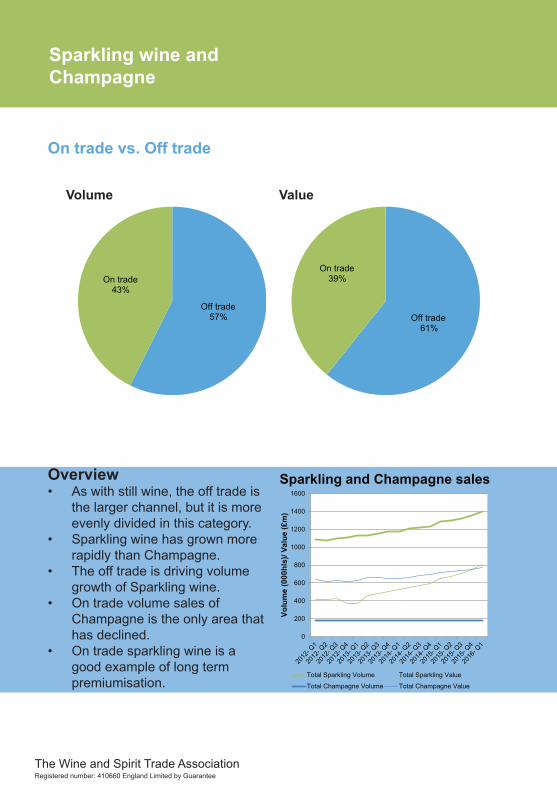
Overview• As with still wine, the off trade is
the larger channel, but it is more evenly divided in this category.
• Sparkling wine has grown more rapidly than Champagne.
• The off trade is driving volume growth of Sparkling wine.
• On trade volume sales of Champagne is the only area that has declined.
• On trade sparkling wine is a good example of long term premiumisation.
Off trade61%
On trade39%
On trade vs. Off trade
0
200
400
600
800
1000
1200
1400
1600
Volu
me
(000
hls)
/ Val
ue (£
m)
Sparkling and Champagne sales
Total Sparkling Volume Total Sparkling Value
Total Champagne Volume Total Champagne Value
Off trade57%
On trade43%
Volume Value
page 15
Sparkling wine andChampagne
-
100
200
300
400
500
600
700
800
900
Vlou
me
(000
hls)
/ Val
ue (£
m)
Sparkling wine sales
Off trade Volume Off trade Value
On trade Volume On trade Value
-
50
100
150
200
250
300
350
400
450
500
Volu
me
(000
hls)
/ Val
ue (£
m)
Champagne sales
Off trade Volume Off trade Value
On trade Volume On trade Value
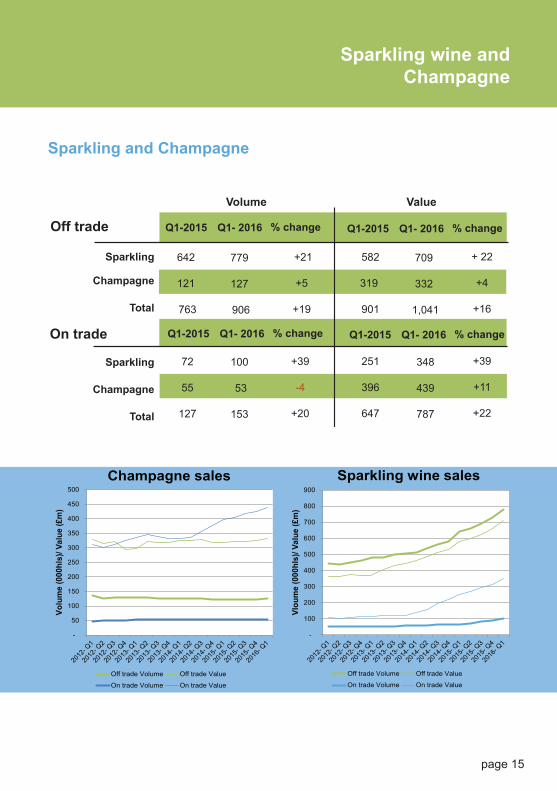
Q1- 2016Q1-2015
Volume
Sparkling
Champagne
Total
On trade
Sparkling
Champagne
Total
Value
% change Q1- 2016Q1-2015 % change
+21
+5
+19
+39
-4
+20
582
319
901
251
396
647
709
332
1,041
348
439
787
+ 22
+4
+16
+39
+11
+22
642
121
763
72
55
127
779
127
906
100
53
153
Off trade
Q1- 2016Q1-2015 % change Q1- 2016Q1-2015 % change
Sparkling and Champagne
The Wine and Spirit Trade AssociationRegistered number: 410660 England Limited by Guarantee
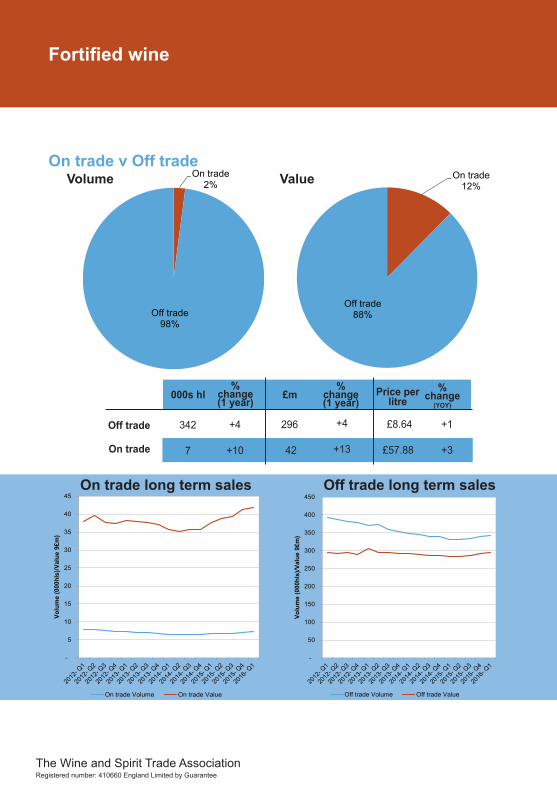
On trade2%
Off trade98%
Fortified wine
On trade12%
Off trade88%
On trade v Off tradeVolume Value
-
50
100
150
200
250
300
350
400
450
Volu
me
(000
hls)
/Val
ue 9
£m)
Off trade Volume Off trade Value
-
5
10
15
20
25
30
35
40
45
Volu
me
(000
hls)
/Val
ue 9
£m)
On trade Volume On trade Value
On trade long term sales Off trade long term sales
% change (1 year)
% change (1 year)
£m000s hl % change
(YOY)
Price per litre
342
7
+4
+10
£8.64
£57.88
296
42
Off trade
On trade
+4
+13
+1
+3
page 17
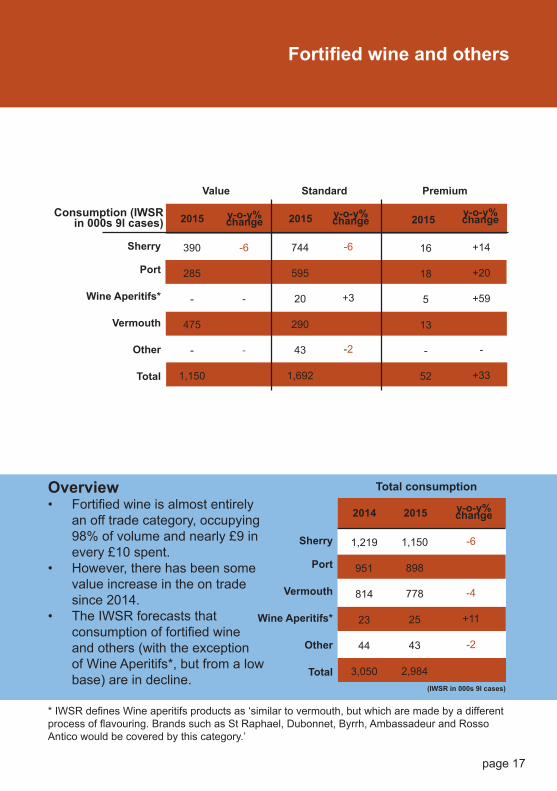
Fortified wine and others
2014
Sherry
Port
Vermouth
Wine Aperitifs*
Other
Total
2015
1,150
898
778
25
43
2,984
-6
-6
-4
+11
-2
-5
1,219
951
814
23
44
3,050
Total consumption
y-o-y% change
(IWSR in 000s 9l cases)
Value
2015
Sherry
Port
Wine Aperitifs*
Vermouth
Other
Total
y-o-y% change 2015 2015
Standard Premium
-6
-5
-
-5
-
-5
744
595
20
290
43
1,692
16
18
5
13
-
52
+14
+20
+59
-68
-
+33
-6
-6
+3
-5
-2
-6
390
285
-
475
-
1,150
Consumption (IWSR in 000s 9l cases)
y-o-y% changey-o-y% change
Overview• Fortified wine is almost entirely
an off trade category, occupying 98% of volume and nearly £9 in every £10 spent.
• However, there has been some value increase in the on trade since 2014.
• The IWSR forecasts that consumption of fortified wine and others (with the exception of Wine Aperitifs*, but from a low base) are in decline.
* IWSR defines Wine aperitifs products as ‘similar to vermouth, but which are made by a different process of flavouring. Brands such as St Raphael, Dubonnet, Byrrh, Ambassadeur and Rosso Antico would be covered by this category.’
The Wine and Spirit Trade AssociationRegistered number: 410660 England Limited by Guarantee
Import and Export:Overview
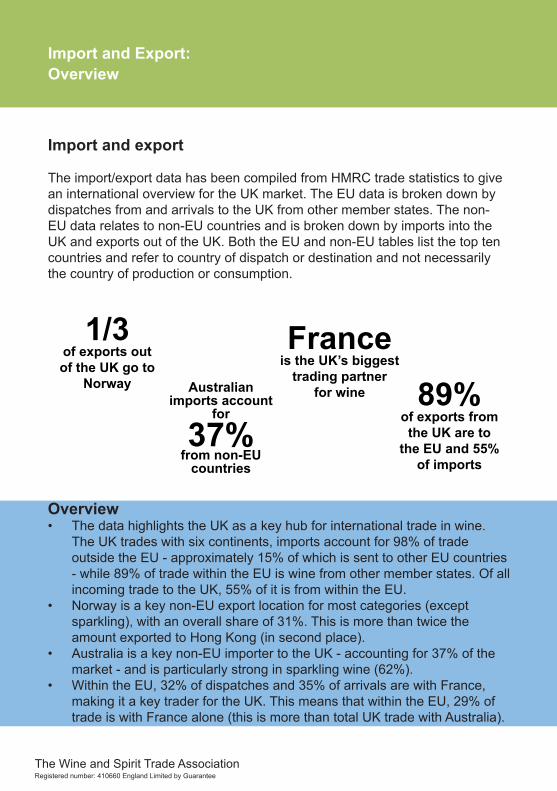
Import and export
The import/export data has been compiled from HMRC trade statistics to give an international overview for the UK market. The EU data is broken down by dispatches from and arrivals to the UK from other member states. The non-EU data relates to non-EU countries and is broken down by imports into the UK and exports out of the UK. Both the EU and non-EU tables list the top ten countries and refer to country of dispatch or destination and not necessarily the country of production or consumption.
Overview• The data highlights the UK as a key hub for international trade in wine.
The UK trades with six continents, imports account for 98% of trade outside the EU - approximately 15% of which is sent to other EU countries - while 89% of trade within the EU is wine from other member states. Of all incoming trade to the UK, 55% of it is from within the EU.
• Norway is a key non-EU export location for most categories (except sparkling), with an overall share of 31%. This is more than twice the amount exported to Hong Kong (in second place).
• Australia is a key non-EU importer to the UK - accounting for 37% of the market - and is particularly strong in sparkling wine (62%).
• Within the EU, 32% of dispatches and 35% of arrivals are with France, making it a key trader for the UK. This means that within the EU, 29% of trade is with France alone (this is more than total UK trade with Australia).
France is the UK’s biggest
trading partner for wine 89%
of exports from the UK are to
the EU and 55% of imports
Australian imports account
for
37%from non-EU
countries
1/3 of exports out of the UK go to
Norway

page 19
Import and Export:All wine
Market Market Share (%)
31
14
8
6
6
4
4
2
2
2
Norway
Hong Kong
Switzerland
USA
Australia
UAE
China
Japan
Singapore
South Africa
1
2
3
4
5
6
7
8
9
10
Non-EU exports from UK in 2015
Total
3,384
1,564
878
650
619
430
396
266
252
228
10,928
Net Mass (000kgs) Market Market
Share (%)
37
17
16
16
9
4
0.1
0.1
0.1
0.04
Australia
USA
Chile
South Africa
New Zealand
Argentina
Canada
Moldova
Lebanon
Israel
1
2
3
4
5
6
7
8
9
10
Non-EU imports to UK in 2015
Total
245,798
109,013
107,959
105,395
59,318
27,313
941
535
428
260
658,196
Net Mass (000kgs)
Market Market Share (%)
32
18
11
10
7
5
4
2
2
2
France
Netherlands
Denmark
Ireland
Sweden
Spain
Germany
Finland
Belgium
Czech Republic
1
2
3
4
5
6
7
8
9
10
Dispatches to EU in 2015
£
Total
30,876
16,984
10,427
9,925
6,618
4,617
4,149
2,348
2,224
1,768
95,270
Net Mass (000kgs) Market Market
Share (%)
38
29
20
8
3
1
0.4
0.4
0.3
0.3
Italy
France
Spain
Germany
Portugal
Hungary
Bulgaria
Romania
Belgium
Netherlands
1
2
3
4
5
6
7
8
9
10
Arrivals from EU in 2015Net Mass (000kgs)
Total
303,709
225,825
154,618
67,072
20,476
5,206
3,205
3,011
2,104
2,070
790,170
The Wine and Spirit Trade AssociationRegistered number: 410660 England Limited by Guarantee
Import and Export:
Market Market Share (%)
30
8
7
7
7
6
4
4
3
3
Norway
Hong Kong
Switzerland
UAE
USA
Australia
New Zealand
Iceland
China
South Korea
1
2
3
4
5
6
7
8
9
10
Non-EU exports from UK in 2015
Total
830
226
199
195
189
162
108
98
73
73
2,810
Net Mass (000kgs) Market Market
Share (%)
35
18
17
17
11
2
0.2
0.1
0.02
0.02
Australia
New Zealand
South Africa
Chile
USA
Argentina
Canada
Moldova
Israel
India
1
2
3
4
5
6
7
8
9
10
Non-EU imports to UK in 2015
Total
107,738
54,266
53,152
52,263
32,752
4,608
739
362
70
55
306,351
Net Mass (000kgs)
Market Market Share (%)
47
15
9
7
4
4
3
2
2
2
France
Netherlands
Ireland
Denmark
Spain
Sweden
Germany
Belgium
Finland
Czech Republic
1
2
3
4
5
6
7
8
9
10
Dispatches to EU in 2015
£
Total
22,917
7,473
4,264
3,387
2,155
2,089
1,493
1,187
932
829
48,911
Net Mass (000kgs) Market Market
Share (%)
46
24
14
13
1
1
1
0.5
0.3
0.2
Italy
France
Germany
Spain
Hungary
Romania
Portugal
Belgium
Bulgaria
Netherlands
1
2
3
4
5
6
7
8
9
10
Arrivals from EU in 2015Net Mass (000kgs)
Total
125,752
65,756
37,509
36,486
3,032
1,825
1,817
1,372
745
429
275,953
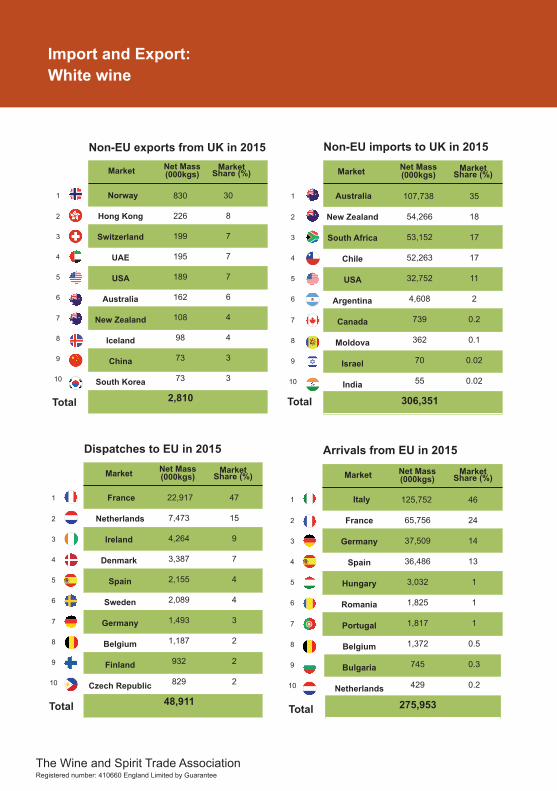
White wine

page 21
Import and Export:
Market Market Share (%)
35
17
9
5
4
4
3
2
2
2
Norway
Hong Kong
Switzerland
Australia
USA
China
UAE
South Africa
Japan
Canada
1
2
3
4
5
6
7
8
9
10
Non-EU exports from UK in 2015
Total
2,524
1,207
659
390
309
305
198
163
153
152
7,227
Net Mass (000kgs) Market Market
Share (%)
39
22
16
15
7
1
0.1
0.1
0.1
0.05
Australia
USA
Chile
South Africa
Argentina
New Zealand
Lebanon
Canada
Israel
Moldova
1
2
3
4
5
6
7
8
9
10
Non-EU imports to UK in 2015
Total
135,327
76,002
55,587
51,565
22,668
4,586
375
198
188
173
347,368
Net Mass (000kgs)
Market Market Share (%)
21
17
15
11
10
6
5
3
2
2
Netherlands
France
Denmark
Ireland
Sweden
Germany
Spain
Finland
Belgium
Czech Republic
1
2
3
4
5
6
7
8
9
10
Dispatches to EU in 2015
Total
9,447
7,581
6,906
5,026
4,472
2,625
2,380
1,416
985
828
44,580
Net Mass (000kgs) Market Market
Share (%)
37
28
24
7
1
1
1
0.4
0.3
0.2
France
Italy
Spain
Germany
Portugal
Bulgaria
Hungary
Netherlands
Romania
Belgium
1
2
3
4
5
6
7
8
9
10
Arrivals from EU in 2015
Total
130,880
97,949
82,954
24,299
4,716
2,461
2,069
1,322
1,183
577
349,903
Net Mass (000kgs)
Red wine
The Wine and Spirit Trade AssociationRegistered number: 410660 England Limited by Guarantee
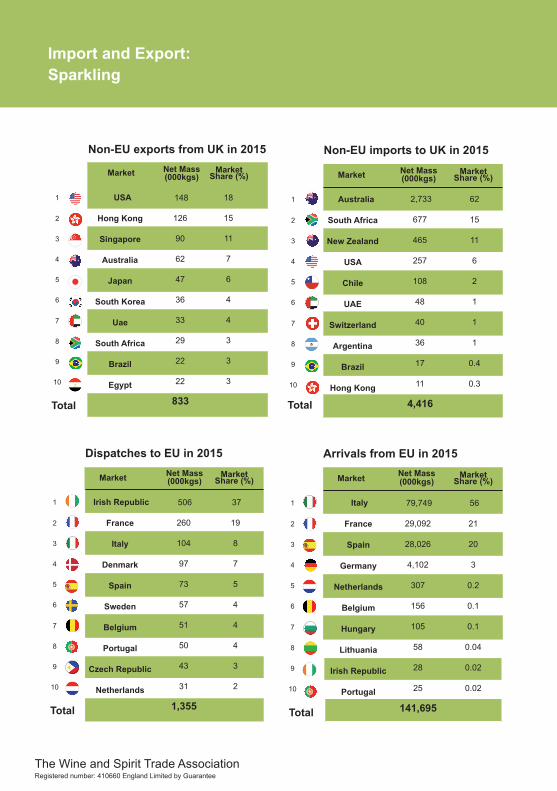
Import and Export:Sparkling
Market Market Share (%)
Net Mass (000kgs)
18
15
11
7
6
4
4
3
3
3
USA
Hong Kong
Singapore
Australia
Japan
South Korea
Uae
South Africa
Brazil
Egypt
1
2
3
4
5
6
7
8
9
10
Non-EU exports from UK in 2015
Total
148
126
90
62
47
36
33
29
22
22
833
Market Market Share (%)
62
15
11
6
2
1
1
1
0.4
0.3
Australia
South Africa
New Zealand
USA
Chile
UAE
Switzerland
Argentina
Brazil
Hong Kong
1
2
3
4
5
6
7
8
9
10
Non-EU imports to UK in 2015
Total
2,733
677
465
257
108
48
40
36
17
11
4,416
Net Mass (000kgs)
Market Market Share (%)
37
19
8
7
5
4
4
4
3
2
Irish Republic
France
Italy
Denmark
Spain
Sweden
Belgium
Portugal
Czech Republic
Netherlands
1
2
3
4
5
6
7
8
9
10
Dispatches to EU in 2015
£
Total
506
260
104
97
73
57
51
50
43
31
1,355
Net Mass (000kgs) Market Market
Share (%)
56
21
20
3
0.2
0.1
0.1
0.04
0.02
0.02
Italy
France
Spain
Germany
Netherlands
Belgium
Hungary
Lithuania
Irish Republic
Portugal
1
2
3
4
5
6
7
8
9
10
Arrivals from EU in 2015
Total
79,749
29,092
28,026
4,102
307
156
105
58
28
25
141,695
Net Mass (000kgs)
page 23
Import and Export:
Market Market Share (%)
18
12
11
10
10
8
6
6
5
2
Norway
Switzerland
India
Hong Kong
Australia
UAE
USA
Bahamas
Thailand
Turkey
1
2
3
4
5
6
7
8
9
10
Non-EU exports from UK in 2015
Total
11
7
6
6
6
5
4
3
3
1
58
Net Mass (000kgs) Market Market
Share (%)
78
7
6
2
2
2
2
1
0.8
0.6
UAE
Switzerland
India
Israel
Singapore
New Zealand
USA
Australia
Taiwan
Hong Kong
1
2
3
4
5
6
7
8
9
10
Non-EU imports to UK in 2015
Total
48
4
4
1
1
1
1
1
0.5
0.3
62
Net Mass (000kgs)
Market Market Share (%)
31
28
16
9
8
2
2
1
1
1
Ireland
France
Czech Republic
Denmark
Netherlands
Italy
Spain
Slovakia
Germany
Portugal
1
2
3
4
5
6
7
8
9
10
Dispatches to EU in 2015
£
Total
129
117
68
36
33
10
8
6
5
5
423
Net Mass (000kgs) Market Market
Share (%)
62
32
5
1
0.4
0.1
0.05
0.01
0.005
0.0004
Portugal
Spain
Germany
Italy
France
Irish Republic
Netherlands
Romania
Denmark
Belgium
1
2
3
4
5
6
7
8
9
10
Arrivals from EU in 2015
Total
13,918
7,152
1,162
260
96
19
10
2
1
1
22,620
Net Mass (000kgs)
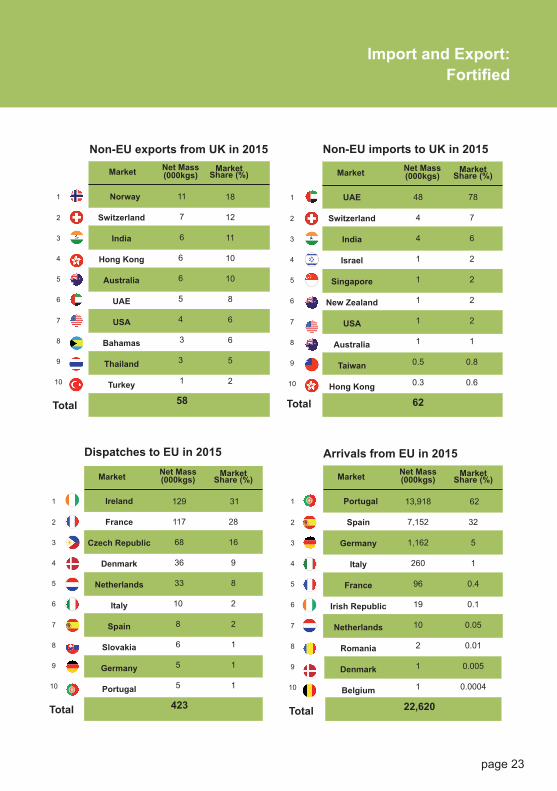
Fortified
The Wine and Spirit Trade AssociationRegistered number: 410660 England Limited by Guarantee
www.wsta.co.uk
@wstauk
+44 (0)20 7089 3877