Embed Size (px)
Citation preview
Writing Chapter 3Chapter 3: Methodology (Quantitative)
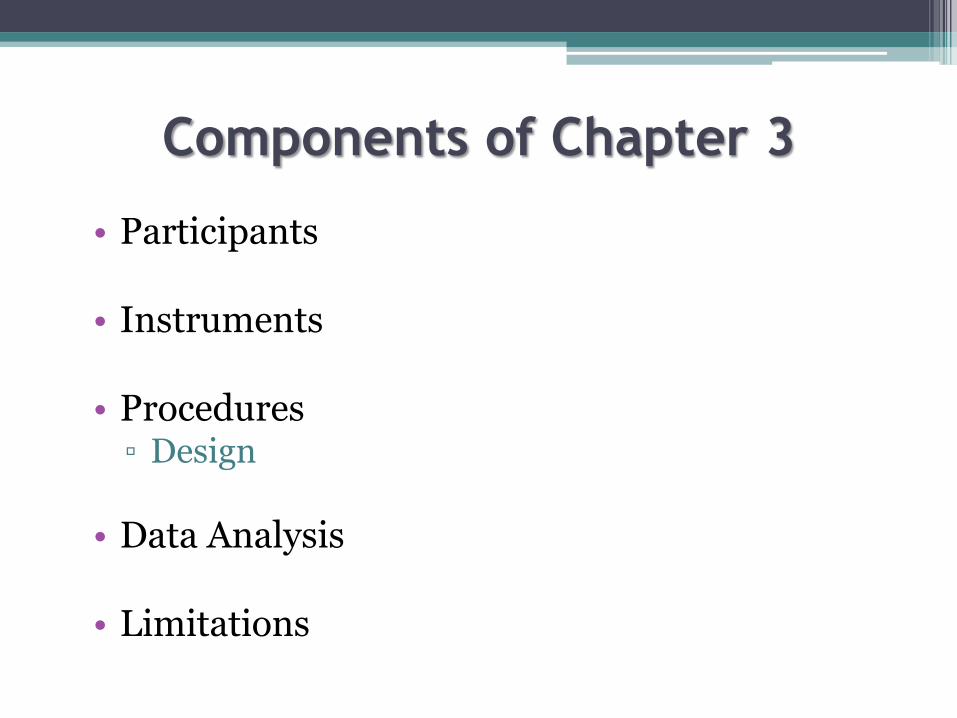
Components of Chapter 3
• Participants
• Instruments
• Procedures▫ Design
• Data Analysis
• Limitations
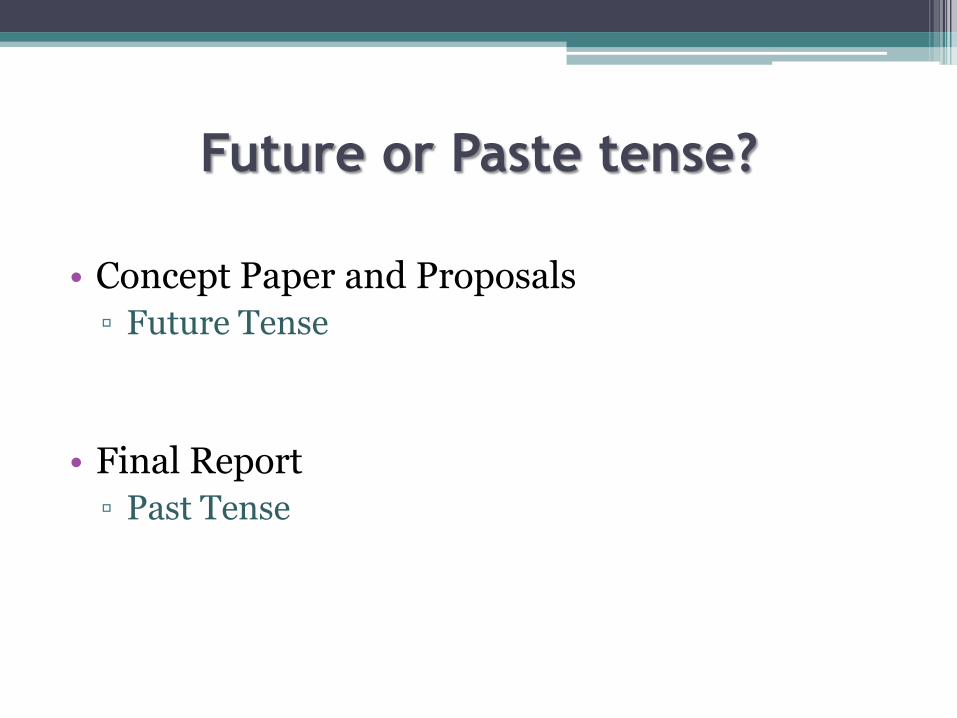
Future or Paste tense?
• Concept Paper and Proposals
▫ Future Tense
• Final Report
▫ Past Tense
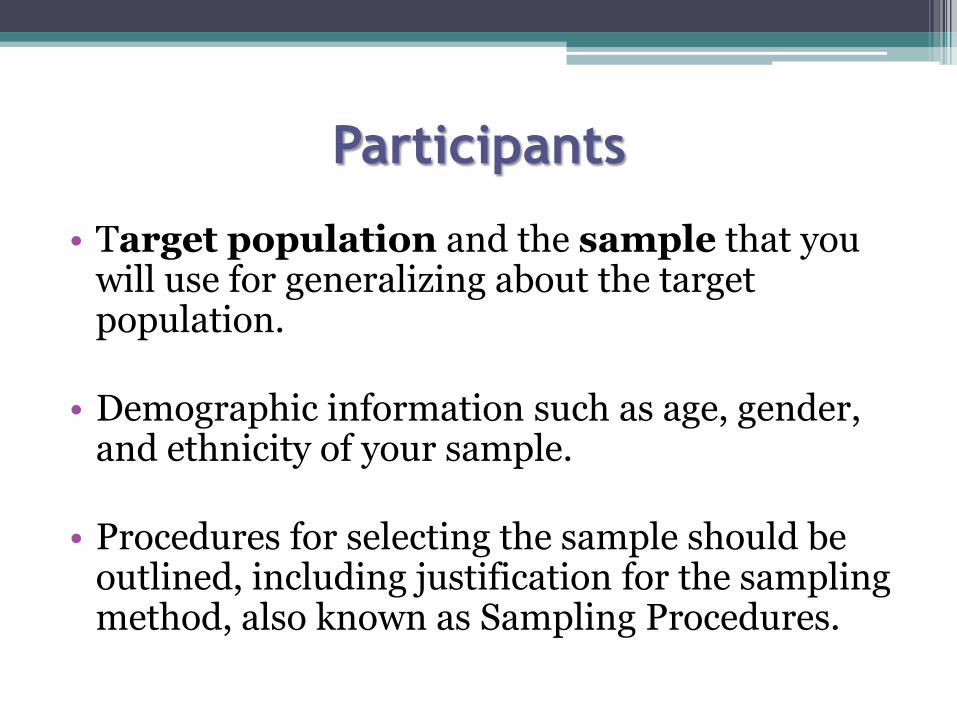
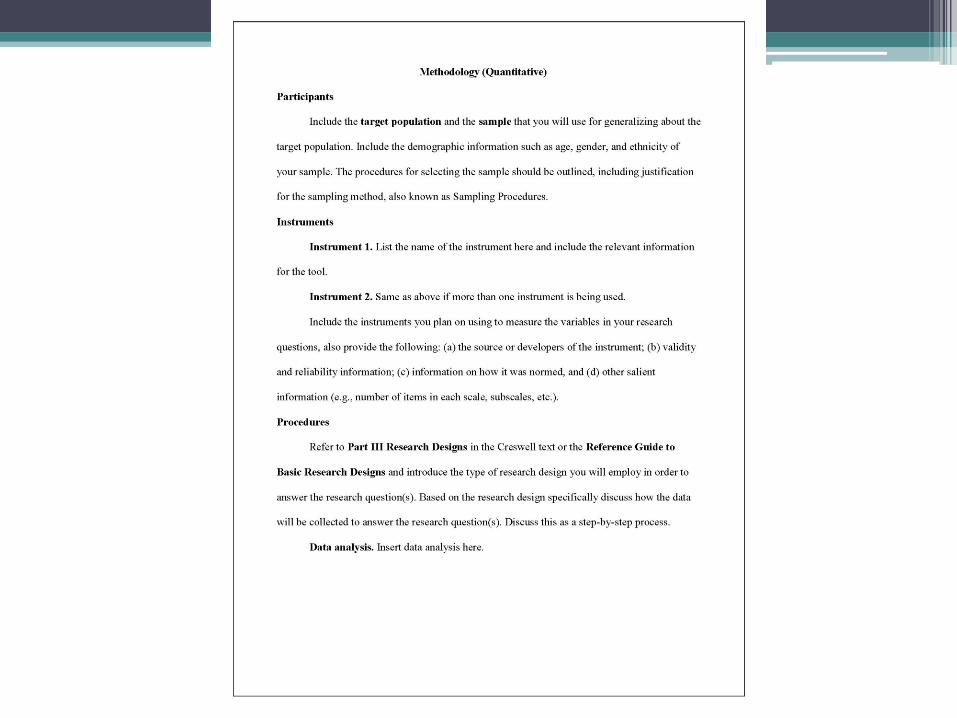
Participants
• Target population and the sample that you will use for generalizing about the target population.
• Demographic information such as age, gender, and ethnicity of your sample.
• Procedures for selecting the sample should be outlined, including justification for the sampling method, also known as Sampling Procedures.
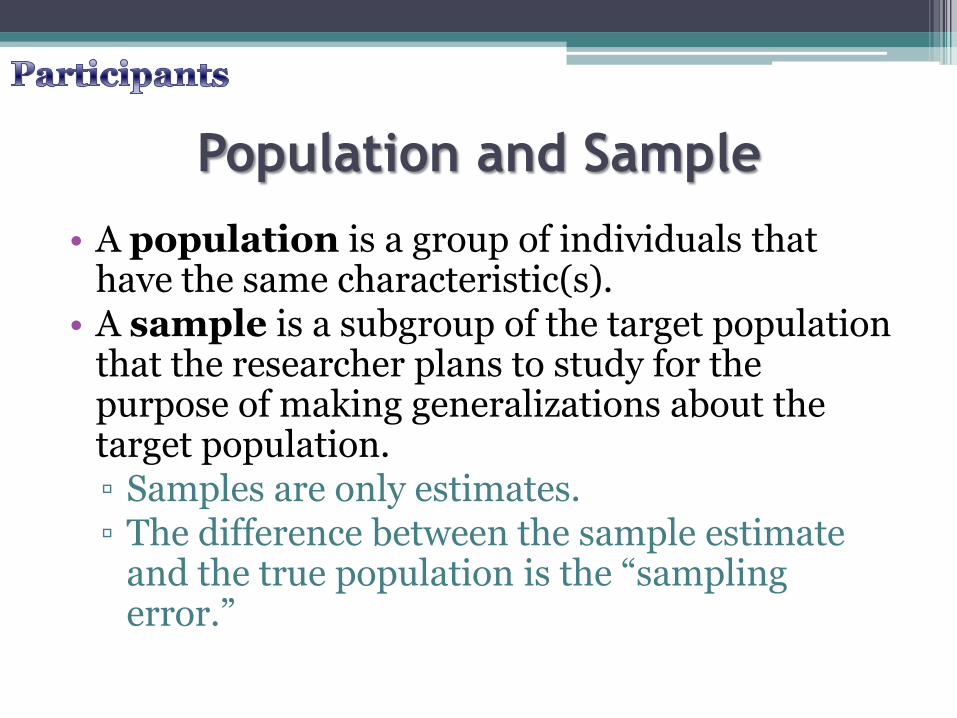
Population and Sample
• A population is a group of individuals that have the same characteristic(s).
• A sample is a subgroup of the target population that the researcher plans to study for the purpose of making generalizations about the target population.▫ Samples are only estimates.▫ The difference between the sample estimate
and the true population is the “sampling error.”
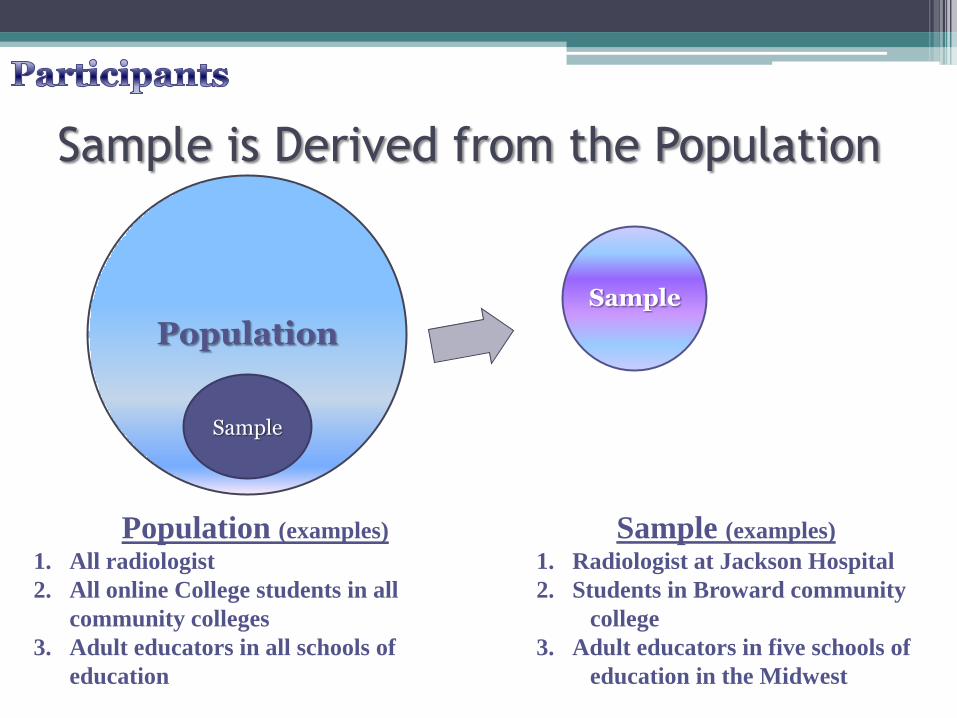
Sample is Derived from the Population
Sample
Population
Population (examples)
1. All radiologist
2. All online College students in all
community colleges
3. Adult educators in all schools of
education
Sample (examples)
1. Radiologist at Jackson Hospital
2. Students in Broward community
college
3. Adult educators in five schools of
education in the Midwest
Sample
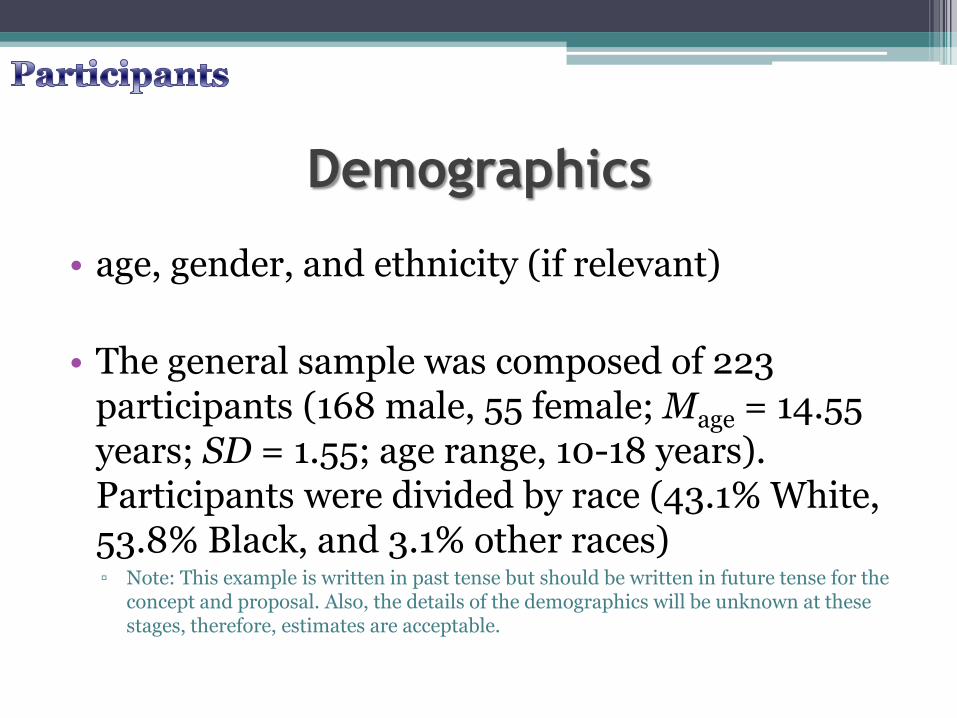
Demographics
• age, gender, and ethnicity (if relevant)
• The general sample was composed of 223 participants (168 male, 55 female; Mage = 14.55 years; SD = 1.55; age range, 10-18 years). Participants were divided by race (43.1% White, 53.8% Black, and 3.1% other races)▫ Note: This example is written in past tense but should be written in future tense for the
concept and proposal. Also, the details of the demographics will be unknown at these stages, therefore, estimates are acceptable.
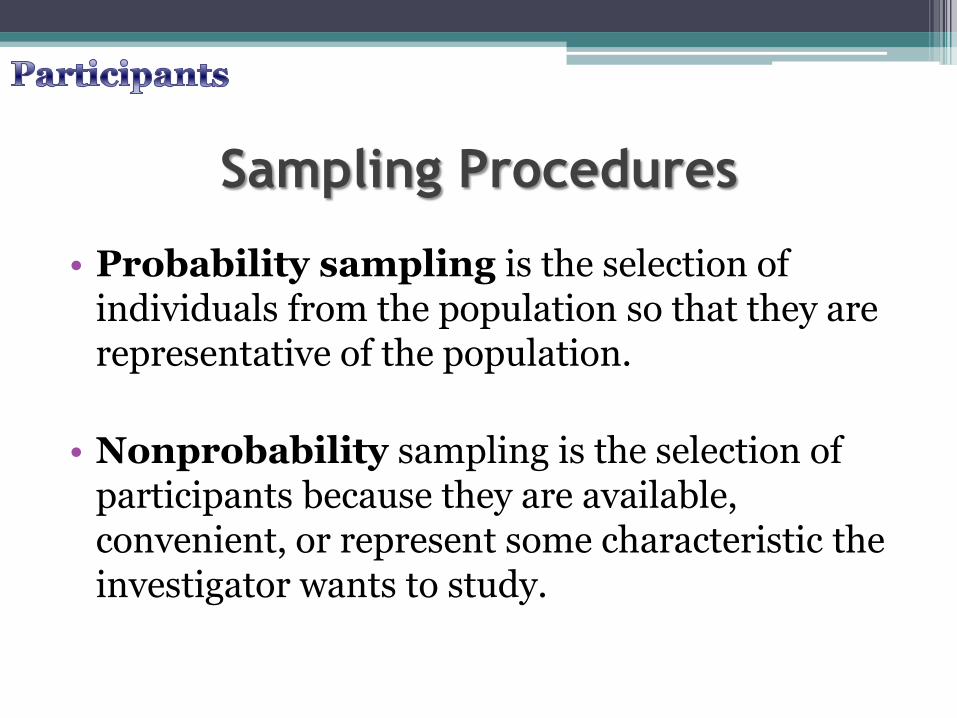
Sampling Procedures
• Probability sampling is the selection of individuals from the population so that they are representative of the population.
• Nonprobability sampling is the selection of participants because they are available, convenient, or represent some characteristic the investigator wants to study.
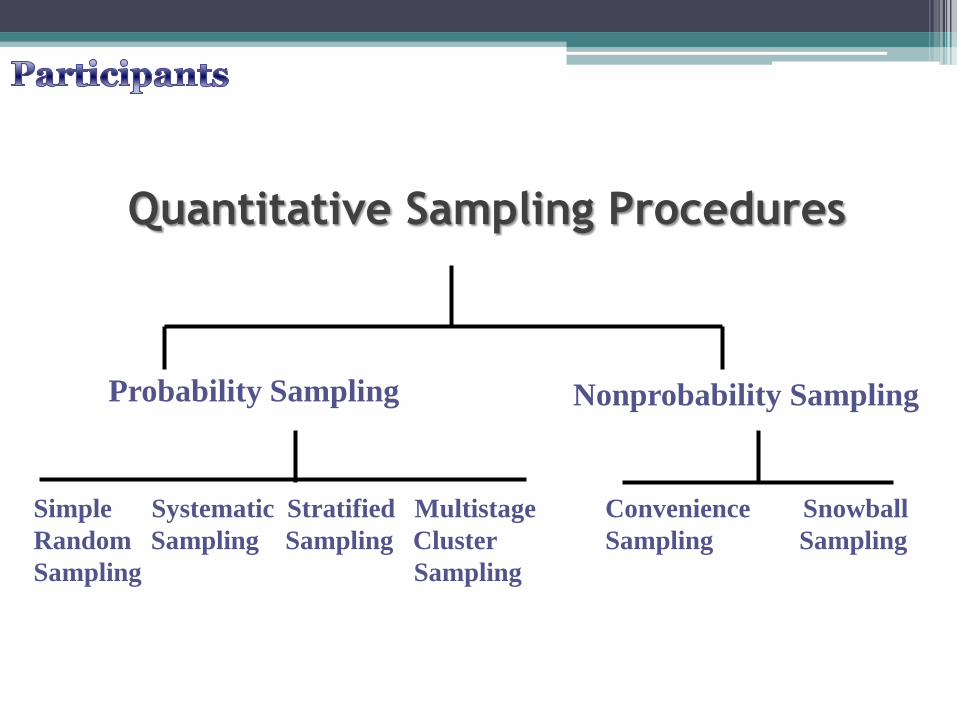
Quantitative Sampling Procedures
Probability Sampling Nonprobability Sampling
Simple Systematic Stratified Multistage
Random Sampling Sampling Cluster
Sampling Sampling
Convenience Snowball
Sampling Sampling
Instruments
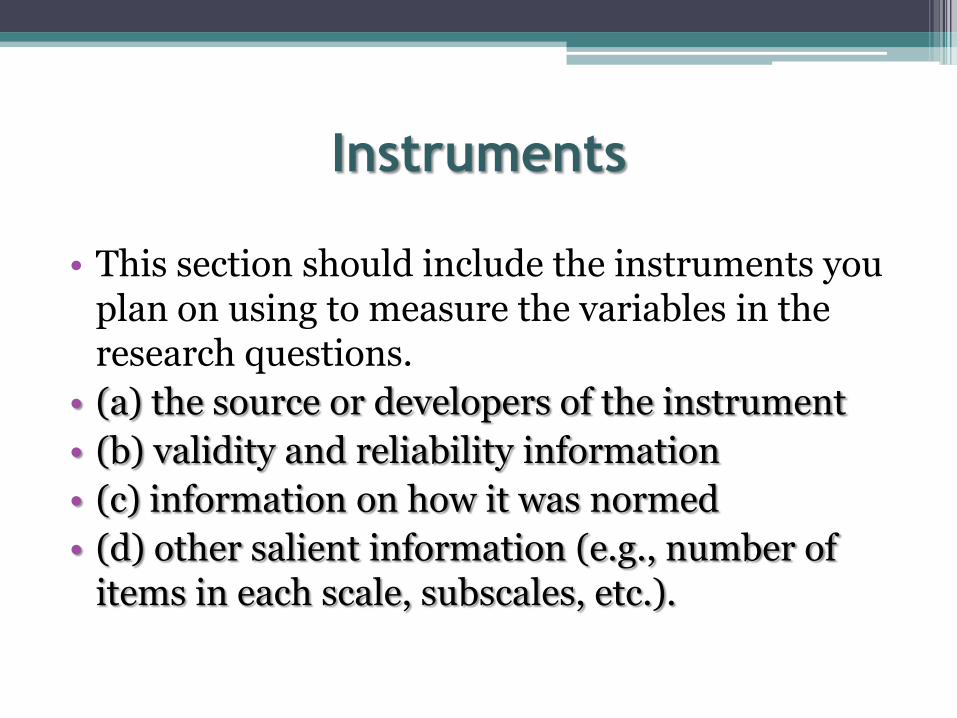
• This section should include the instruments you plan on using to measure the variables in the research questions.
• (a) the source or developers of the instrument
• (b) validity and reliability information
• (c) information on how it was normed
• (d) other salient information (e.g., number of items in each scale, subscales, etc.).
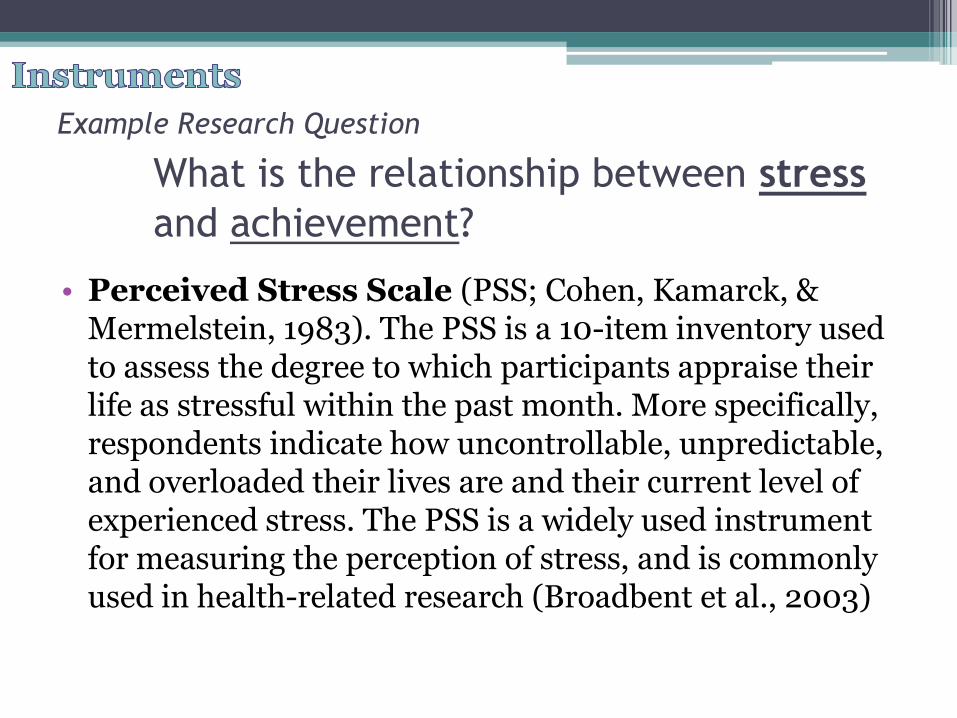
Example Research Question
What is the relationship between stress
and achievement?
• Perceived Stress Scale (PSS; Cohen, Kamarck, & Mermelstein, 1983). The PSS is a 10-item inventory used to assess the degree to which participants appraise their life as stressful within the past month. More specifically, respondents indicate how uncontrollable, unpredictable, and overloaded their lives are and their current level of experienced stress. The PSS is a widely used instrument for measuring the perception of stress, and is commonly used in health-related research (Broadbent et al., 2003)
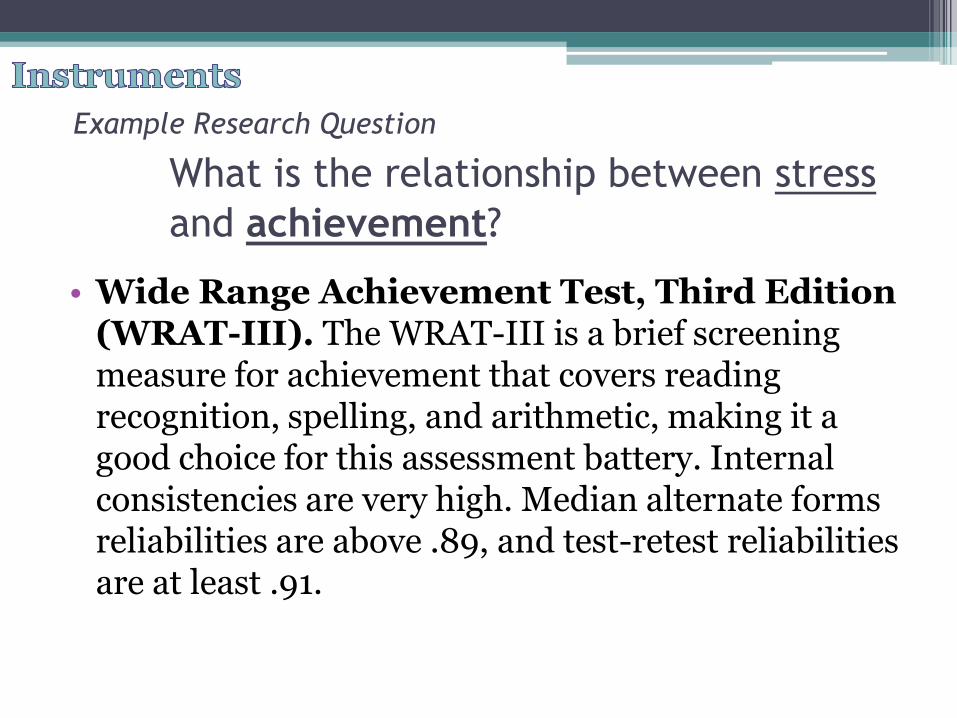
• Wide Range Achievement Test, Third Edition (WRAT-III). The WRAT-III is a brief screening measure for achievement that covers reading recognition, spelling, and arithmetic, making it a good choice for this assessment battery. Internal consistencies are very high. Median alternate forms reliabilities are above .89, and test-retest reliabilities are at least .91.
Example Research Question
What is the relationship between stress
and achievement?
Procedures
• The Procedures section is based directly on the research questions. Specifically, this is the “how-to” section of the study and will introduce the design of the research and how the data will be collected based on the questions of interest.
• The material should be presented in a step by step fashion.
• Another researcher should be able to replicate the study by reading the Procedures section without asking any questions.
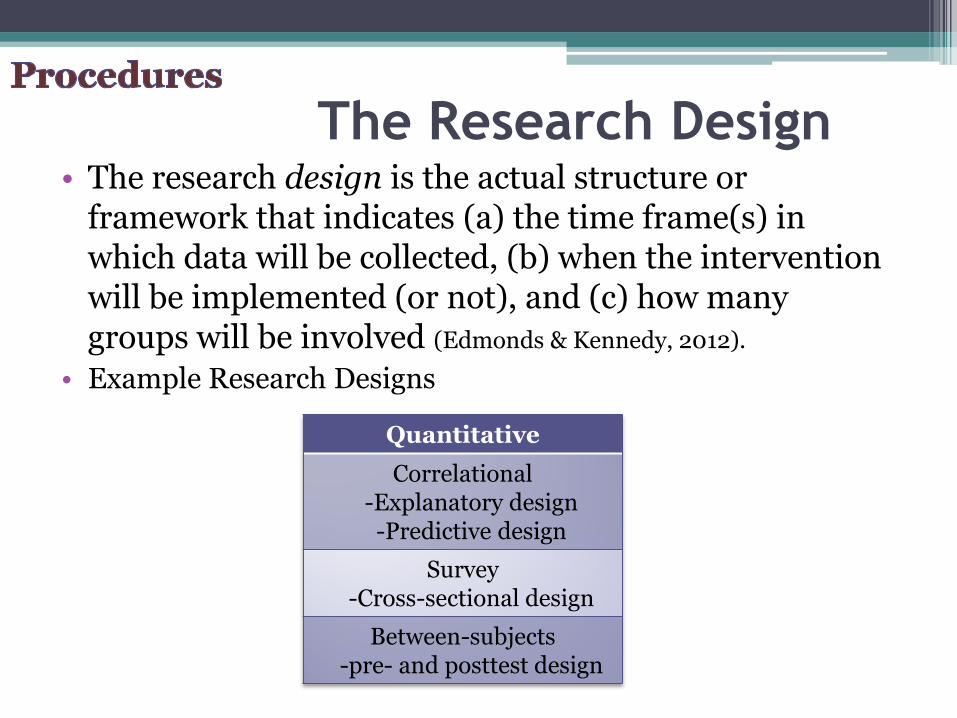
The Research Design• The research design is the actual structure or
framework that indicates (a) the time frame(s) in which data will be collected, (b) when the intervention will be implemented (or not), and (c) how many groups will be involved (Edmonds & Kennedy, 2012).
• Example Research Designs
Quantitative
Correlational -Explanatory design-Predictive design
Survey-Cross-sectional design
Between-subjects-pre- and posttest design
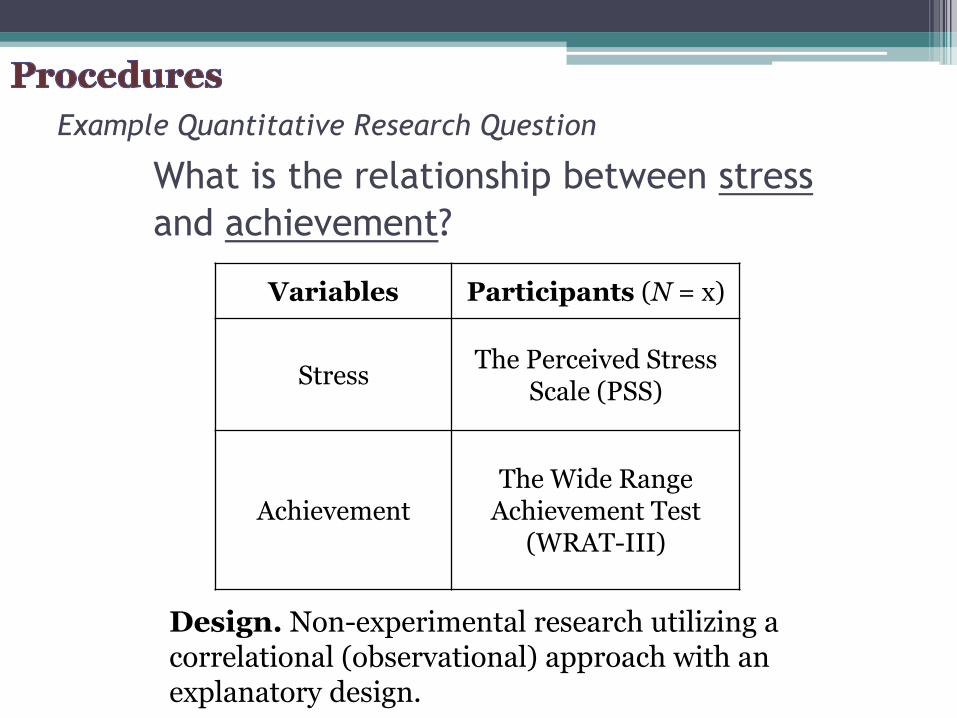
Variables Participants (N = x)
StressThe Perceived Stress
Scale (PSS)
AchievementThe Wide Range
Achievement Test (WRAT-III)
Example Quantitative Research Question
What is the relationship between stress
and achievement?
Design. Non-experimental research utilizing a correlational (observational) approach with an explanatory design.
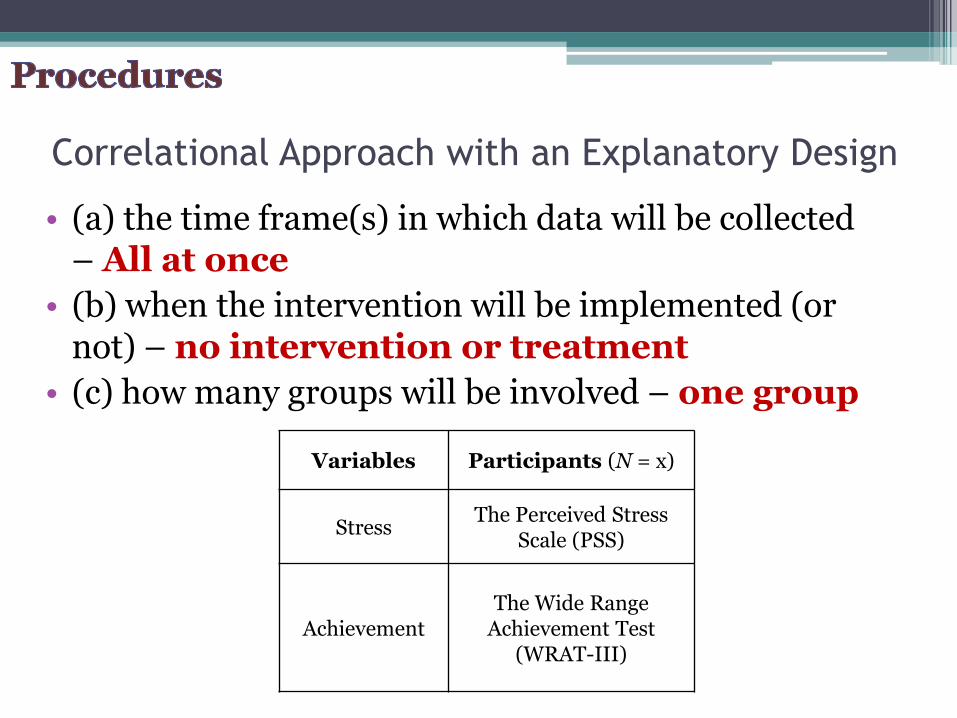
Correlational Approach with an Explanatory Design
• (a) the time frame(s) in which data will be collected – All at once
• (b) when the intervention will be implemented (or not) – no intervention or treatment
• (c) how many groups will be involved – one group
Variables Participants (N = x)
StressThe Perceived Stress
Scale (PSS)
AchievementThe Wide Range
Achievement Test (WRAT-III)
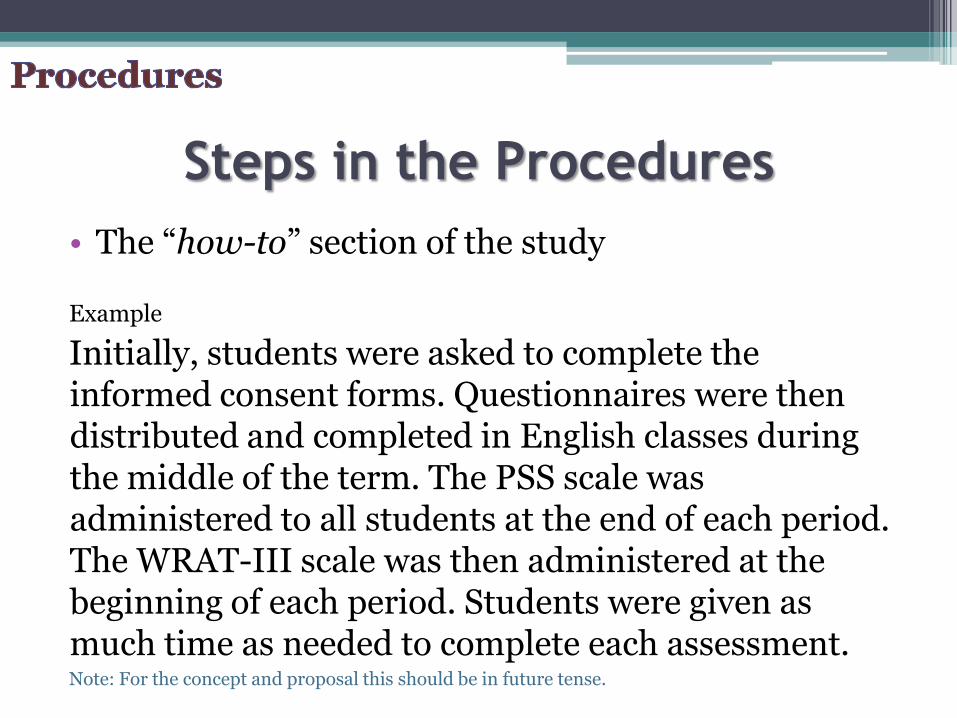
Steps in the Procedures
• The “how-to” section of the study
Example
Initially, students were asked to complete the informed consent forms. Questionnaires were then distributed and completed in English classes during the middle of the term. The PSS scale was administered to all students at the end of each period. The WRAT-III scale was then administered at the beginning of each period. Students were given as much time as needed to complete each assessment.Note: For the concept and proposal this should be in future tense.
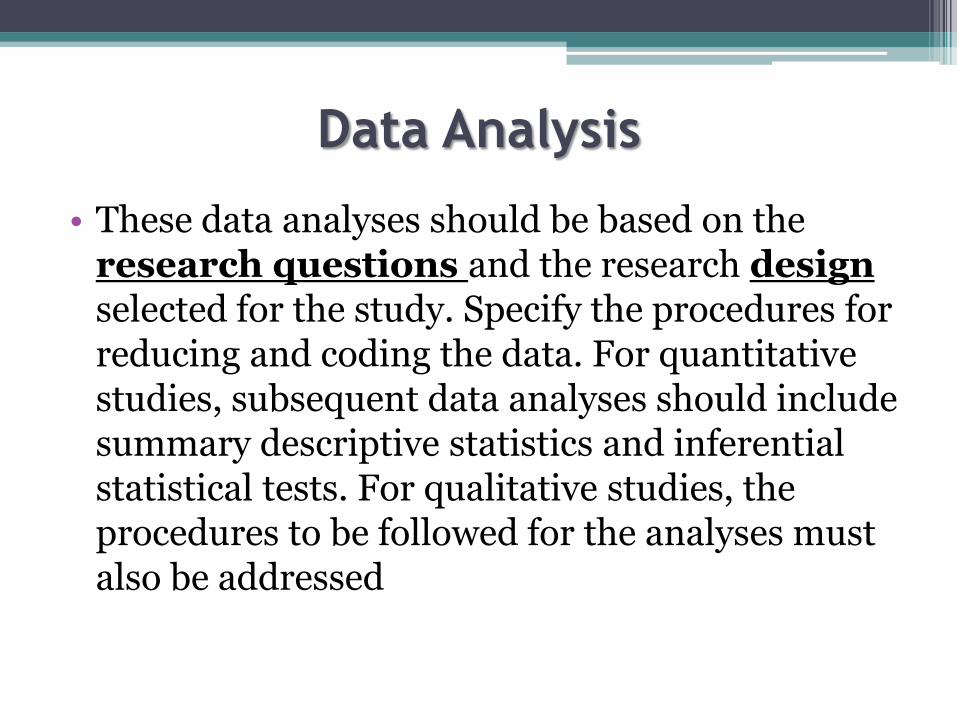
Data Analysis
• These data analyses should be based on the research questions and the research designselected for the study. Specify the procedures for reducing and coding the data. For quantitative studies, subsequent data analyses should include summary descriptive statistics and inferential statistical tests. For qualitative studies, the procedures to be followed for the analyses must also be addressed
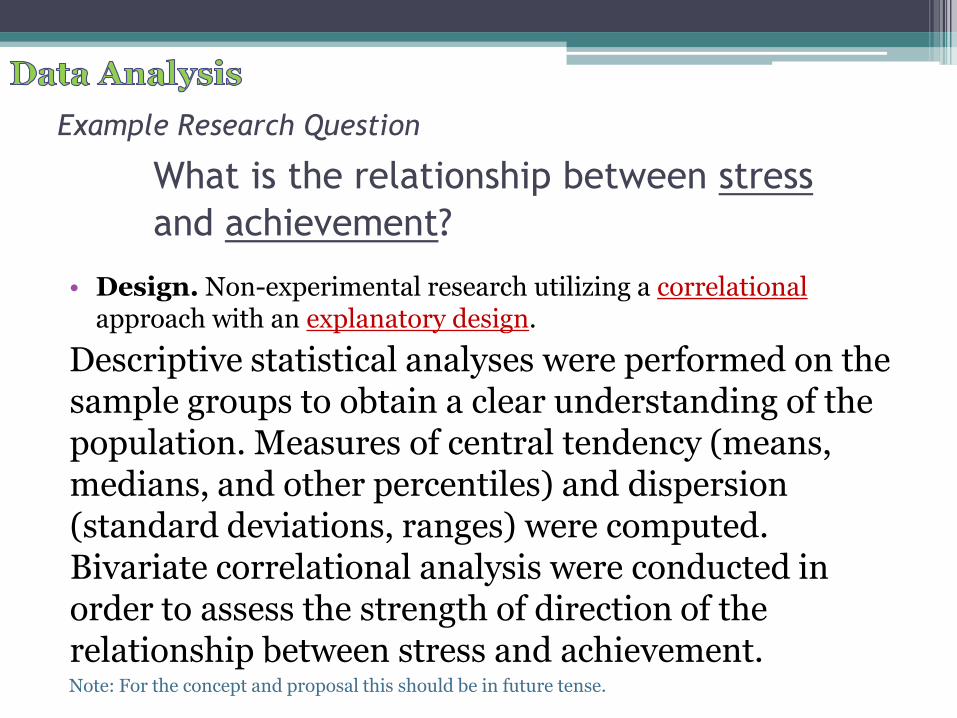
• Design. Non-experimental research utilizing a correlationalapproach with an explanatory design.
Descriptive statistical analyses were performed on the sample groups to obtain a clear understanding of the population. Measures of central tendency (means, medians, and other percentiles) and dispersion (standard deviations, ranges) were computed. Bivariate correlational analysis were conducted in order to assess the strength of direction of the relationship between stress and achievement. Note: For the concept and proposal this should be in future tense.
Example Research Question
What is the relationship between stress
and achievement?

Thank you for your Attention!