Embed Size (px)
Citation preview
7AD-AO94 GO0. AIR FORCE INST OF TECH WRIGHT-PATTERSON AFB OH SCHOO-ETC F/6 7/4MEASURmEMENT OF CL2 CONCENTRATION IN A XECL HOLLOW CATHODE DISCH--ETC(U)
L NL DEC 80 J D WINEBAROENINCLASSIFIED AFIT/SEP/PH/80-12 N
2uuuuum
OLEVEL~
DTICSELECTEOF S FEB 2 1981
Appovd fmpublic relecs"s-JDitiuton U nmte
DEPARTMENT OF THE AIR FORCE
AIR UNIVERSITY (ATC)
AIR FORCE INSTITUTE OF TECHNOLOGY
Wright-Patterson Air Force Base, Ohio
*K81 2 02 160
: '0 LEVELS AITGPIH8 '12 LL L1 4 JAN 1981.
APPROVED FOR pUBLIC RELEASE AFR 190-17
SPublic ia1pWfarCe institute 53n3
P,.I£ OTC l s B. O1t. "
, JEASUREMENT OF C CONCENTRATION IN
A XeCl HOLLOW CATHODE DISCHARGE
INCLUDING THE EFFECT OF H' ADDITION.
9 7THESIS
AFIT/GEP/PH Jerry-'. : egarden
80-12 n UAF
DTICS.lELECTED
BApproved for public release; distribution
unlimited.
AFIT/GEP/PH/80-12
MEASUREMENT OF C12 CONCENTRATION IN A XeCl HOLLOW CATHODE
DISCHARGE INCLUDING THE EFFECT OF H2 ADDITION
THESIS
Presented to the Faculty of the School of Engineering
of the Air Force Institute of Technology
Air University
in Partial Fulfillment of the
Requirements for the Degree of
Master of Science
by
Jerry D. Winegarden, B.S.
2nd Lt USAF
Graduate Engineering Physics
December 1980
Approved for public release; distribution unlimited.
Preface
The writer wishes to express his thanks to the many fine people
who helped in the thesis project. Thanks are given to Dr Peter
Bletzinger, Dr Alan Garscadden, and Capt Gary Duke of the Wright
Aeronautical Laboratory, Plasma Physics Branch, for contributing
their vast resources of knowledge to the project. Thanks also goes
out to my advisor, Lt Col W. F. Bailey, for his guidance and sug-
gestions during the project.
A special note of thanks goes to Mr Charles DeJoseph of the
Wright Aeronautical Laboratory, Plasma Physics Branch, who led me
through the pitfalls of the project and who put up with many inane
questions and thoughts by the writer.
Thanks also goes out to Ms Peggy Schram for typing the grading
copy of the thesis and to Mrs Anna L. Lloyd for the finalization of
it.
Jerry D. Winegarden
t~cn qor
7 . 1 . 1
A i l,1' .' Codes
Dit 19cc izi
Dedication
This thesis is dedicated to my loving wife, Megan, for without
her support and concern this thesis would not have been possible.
iii

Table of Contents
Page
Preface........... . ... . ... .. .. .. .. .. .......
Dedication.......... . ... .. .. .. .. .. .......
List of Figures. .. ... ..... ..... ........... v
List of Tables .. ... ...... ..... ..... .... vii
Abstract .. .. ...... ..... ...... ....... viii
I. Introduction. .. ..... ..... ..... ..... 1
Ii. Theory. .. ... ....... ..... ........ 11
Kinetics .. .. .... ........ ........ 11Hollow Cathode Discharge. .. ... .......... 27Photon Counting .. .. .... ...... ....... 39
III. Experimental Apparatus and Approach. .. ... ..... 49
IV. Results .. .. .... ...... ..... ....... 62
V. Conclusions. .. ... ..... ..... ........ 73
VI. Recommnendations. .. ... ..... ..... ..... 80
Bibliography .. .. ...... ...... ..... ..... 81
Appendix A .. ... ..... ..... ...... ....... 86
Appendix B .. ... ..... ..... ...... ....... 89
Vita. .. ... ..... ....... ...... ........ 0
iv
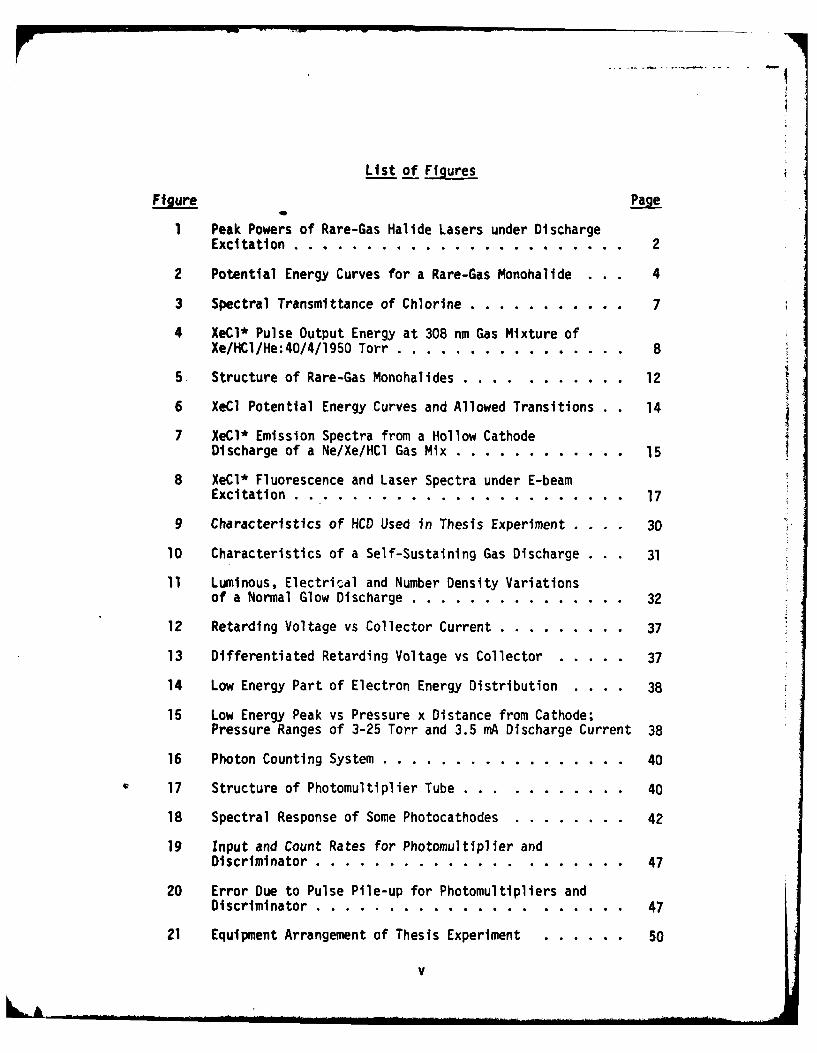
List of Figures
Figure Page
1 Peak Powers of Rare-Gas Halide Lasers under DischargeExcitation ..... ....................... .... 2
2 Potential Energy Curves for a Rare-Gas Monohalide . . 4
3 Spectral Transmittance of Chlorine ..... ........... 7
4 XeCl* Pulse Output Energy at 308 nm Gas Mixture ofXe/HCl/He:40/4/1950 Torr ....... ............... 8
5. Structure of Rare-Gas Monohalides ...... ......... 12
6 XeCl Potential Energy Curves and Allowed Transitions . 14
7 XeCl* Emission Spectra from a Hollow CathodeDischarge of a Ne/Xe/HCl Gas Mix ..... ............ 15
8 XeCl* Fluorescence and Laser Spectra under E-beam
Excitation ...... ....................... ... 17
9 Characteristics of HCD Used in Thesis Experiment .... 30
10 Characteristics of a Self-Sustaining Gas Discharge . 31
11 Luminous, Electrical and Number Density Variationsof a Normal Glow Discharge ... ............... ... 32
12 Retarding Voltage vs Collector Current .......... ... 37
13 Differentiated Retarding Voltage vs Collector .. ..... 37
14 Low Energy Part of Electron Energy Distribution .... 38
15 Low Energy Peak vs Pressure x Distance from Cathode;Pressure Ranges of 3-25 Torr and 3.5 mA Discharge Current 38
16 Photon Counting System ....... ................ 40
17 Structure of Photomultiplier Tube ... ........... ... 40
18 Spectral Response of Some Photocathodes .... ...... 42
19 Input and Count Rates for Photomultiplier andDiscriminator ...... .. ..................... 47
20 Error Due to Pulse Pile-up for Photomultipliers andDiscriminator ...... .. ..................... 47
21 Equipment Arrangement of Thesis Experiment ... ...... 50
v
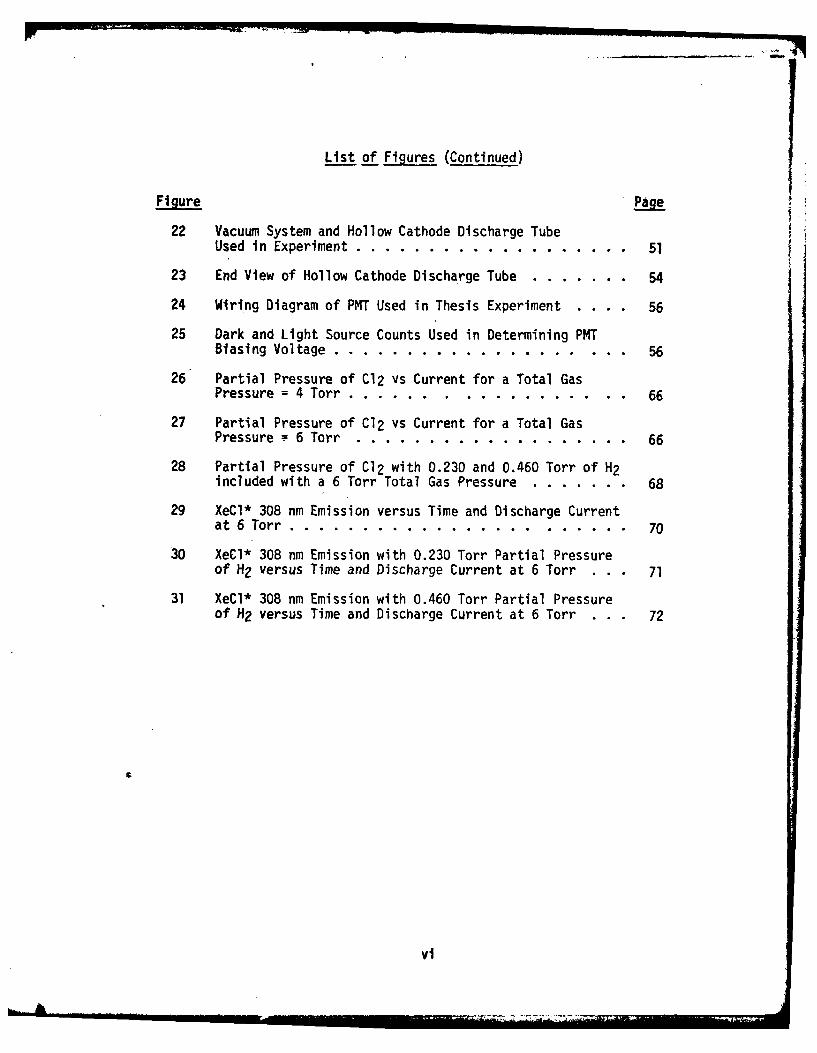
List of Figures (Continued)
Figure Page
22 Vacuum System and Hollow Cathode Discharge TubeUsed in Experiment ....... ................... 51
23 End View of Hollow Cathode Discharge Tube ... ....... 54
24 Wiring Diagram of PMT Used in Thesis Experiment . ... 56
25 Dark and Light Source Counts Used in Determining PMTBiasing Voltage ...... .. .................... 56
26 Partial Pressure of C12 vs Current for a Total GasPressure = 4 Torr ..... .................. ... 66
27 Partial Pressure of C12 vs Current for a Total GasPressure = 6 Torr ..... ... .................. 66
28 Partial Pressure of Cl2 with 0.230 and 0.460 Torr of H2included with a 6 Torr Total Gas Pressure ... ....... 68
29 XeCl* 308 nm Emission versus Time and Discharge Currentat 6 Torr ...... .. ....................... 70
30 XeCl* 308 nm Emission with 0.230 Torr Partial Pressureof H2 versus Time and Discharge Current at 6 Torr . . 71
31 XeCl* 308 nm Emission with 0.460 Torr Partial Pressureof H2 versus Time and Discharge Current at 6 Torr . . . 72
vi
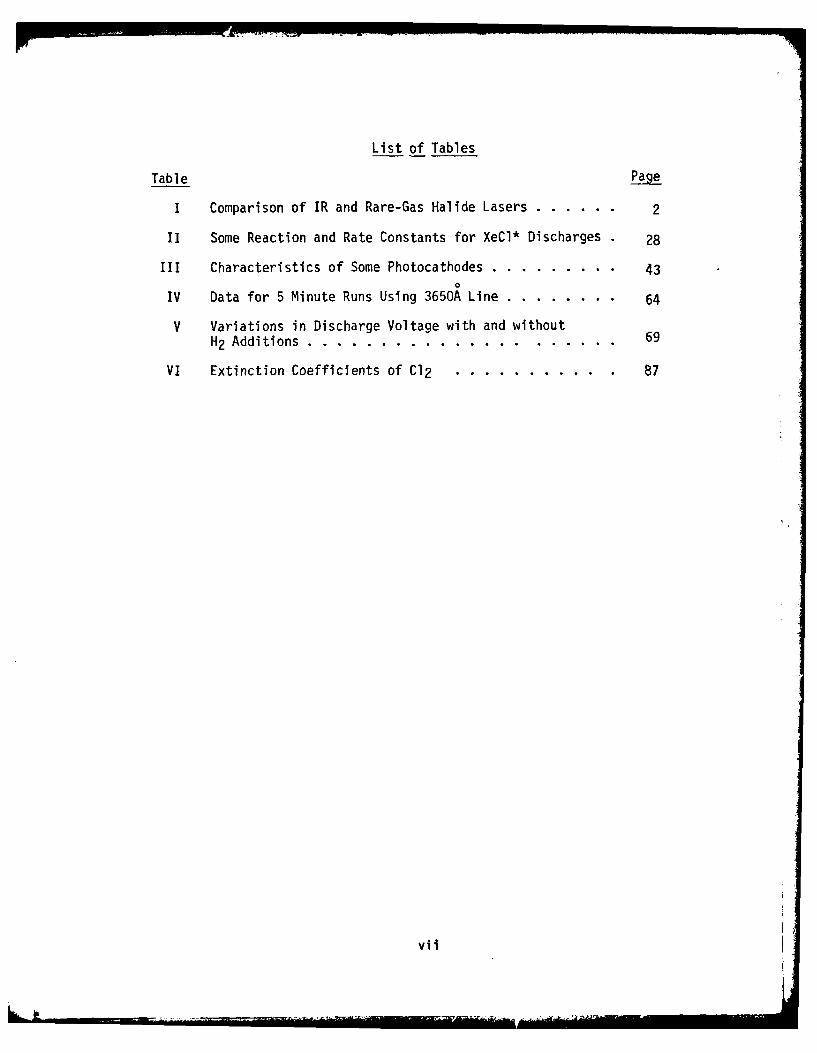
List of Tables
Table Page
I Comparison of IR and Rare-Gas Halide Lasers ... ...... 2
II Some Reaction and Rate Constants for XeCl* Discharges . 28
III Characteristics of Some Photocathodes ........... .... 43
IV Data for 5 Minute Runs Using 3650A Line .... ........ 64
V Variations in Discharge Voltage with and withoutH2 Additions ...... .. ..................... 69
VI Extinction Coefficients of C12 ..... ........... 87
vii
,.
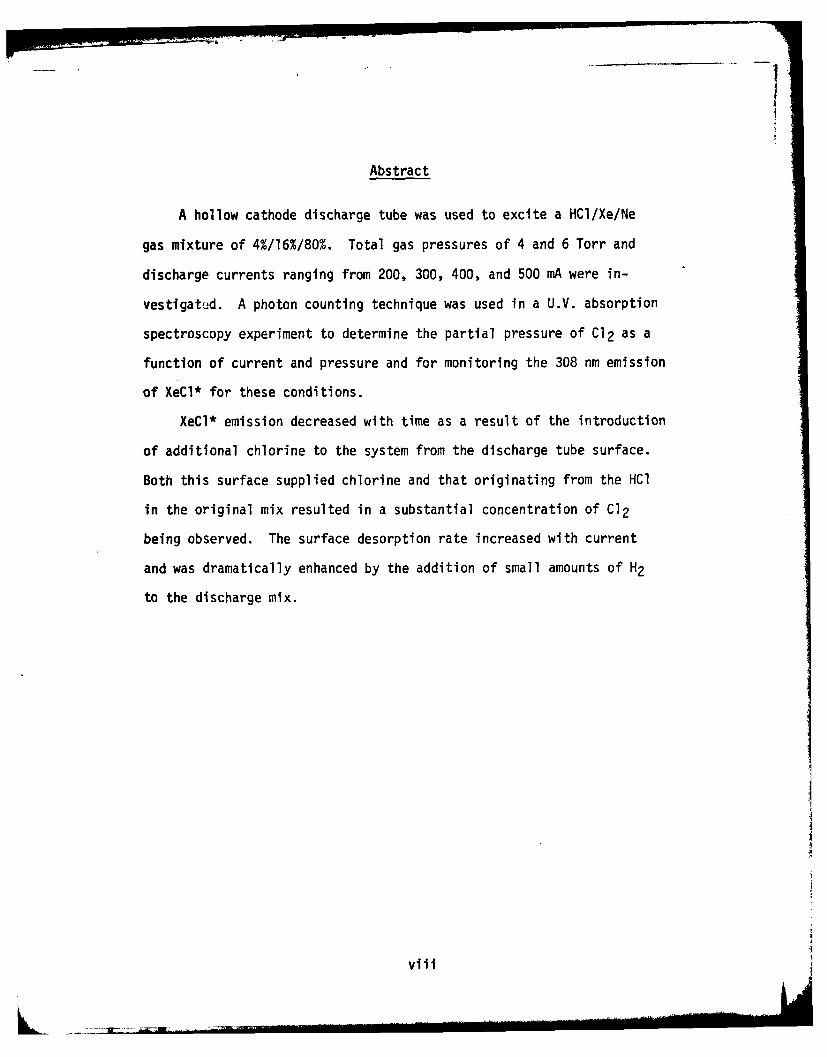
Abstract
A hollow cathode discharge tube was used to excite a HCl/Xe/Ne
gas mixture of 4%/16%/80%. Total gas pressures of 4 and 6 Torr and
discharge currents ranging from 200, 300, 400, and 500 mA were in-
vestigated. A photon counting technique was used in a U.V. absorption
spectroscopy experiment to determine the partial pressure of Cl2 as a
function of current and pressure and for monitoring the 308 nm emission
of XeCl* for these conditions.
XeCl* emission decreased with time as a result of the introduction
of additional chlorine to the system from the discharge tube surface.
Both this surface supplied chlorine and that originating from the HCl
in the original mix resulted in a substantial concentration of Cl2
being observed. The surface desorption rate increased with current
and was dramatically enhanced by the addition of small amounts of H2
to the discharge mix.
Iviii
MEASUREMENT OF C12 CONCENTRATION IN A XeCl HOLLOW CATHODE
DISCHARGE INCLUDING THE EFFECT OF H2 ADDITION
I. Introduction
The properties of the diatomic rare-gas monohalide molecules were
essentially unknown as recently as 1974 (Ref 1). Since 1975, rare-gas
monohalides such as KrF, XeCl, and ArF have been used extensively as
lasing mediums and show such promise that research and development
concerning these lasers has grown significantly (Ref 1). Lasers using
a rare-gas monohalide as the lasing molecule have demonstrated high
output peak and average powers. Peak output powers of greater than
1000 megawatts (1000 MW) have been achieved in some experiments (Ref 2).
Commercially available XeCl lasers have peak output powers ofup to
25 MW (Ref 2). The output powers attained by these lasers is strongly
dependent upon the method of excitation of the laser medium. These
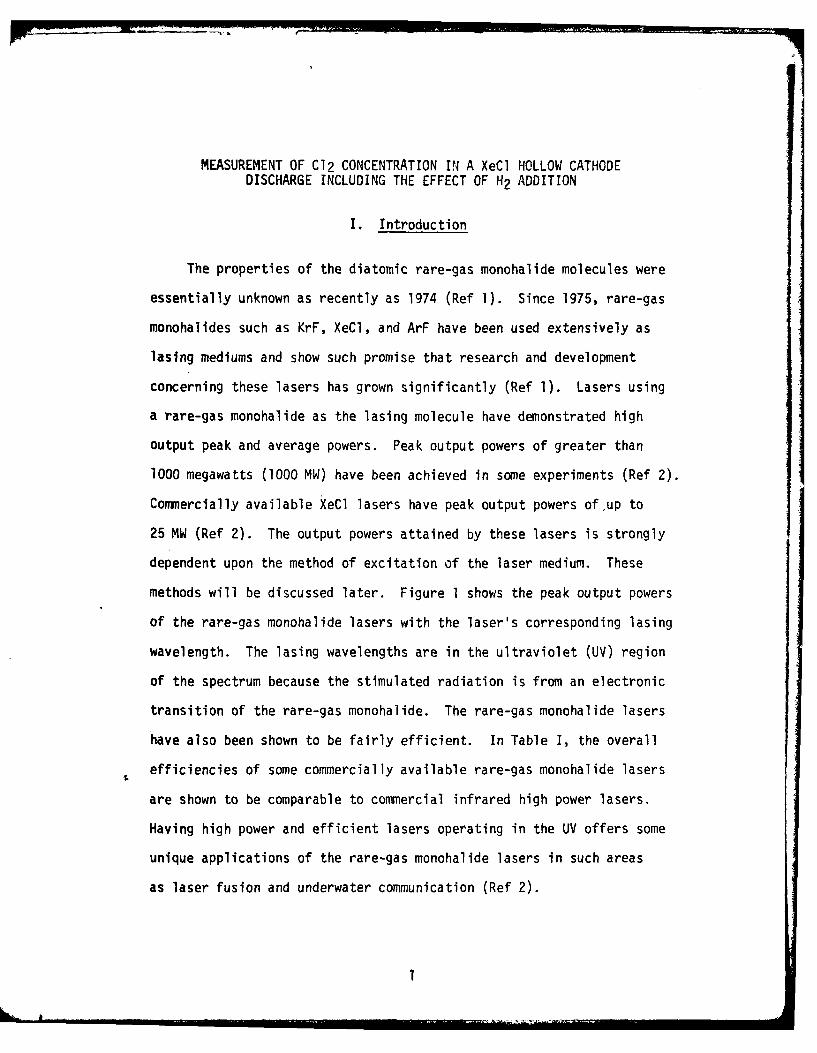
methods will be discussed later. Figure I shows the peak output powers
of the rare-gas monohalide lasers with the laser's corresponding lasing
wavelength. The lasing wavelengths are in the ultraviolet (UV) region
of the spectrum because the stimulated radiation is from an electronic
transition of the rare-gas monohalide. The rare-gas monohalide lasers
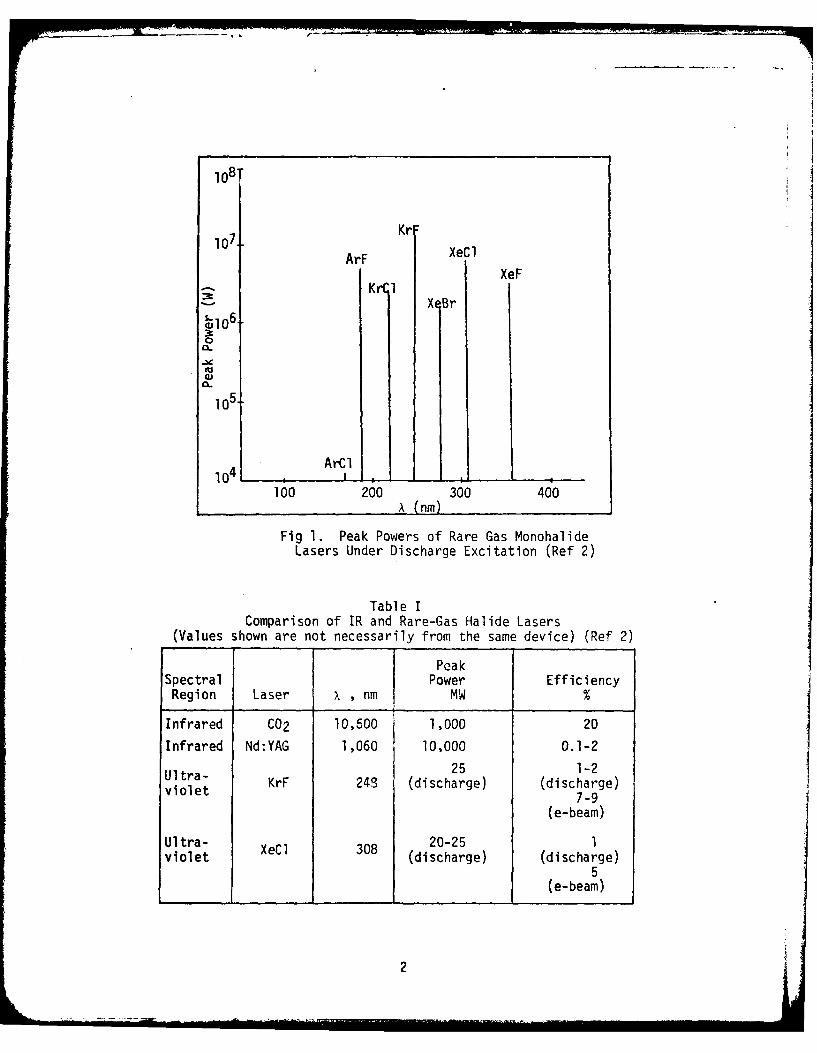
have also been shown to be fairly efficient. In Table I, the overall
efficiencies of some commercially available rare-gas monohalide lasers
are shown to be comparable to commercial infrared high power lasers.
Having high power and efficient lasers operating in the UV offers some
unique applications of the rare-gas monohalide lasers in such areas
as laser fusion and underwater communication (Ref 2).
108
1 7 -ArF K ' XeC1
2 Ki XeFX Br
..(Ul
05.
ArCi -
100 200 (n)300 400
Fig 1. Peak Powers of Rare Gas MonohalideLasers Under Discharge Excitation (Ref 2)
Table IComparison of IR and Rare-Gas Halide Lasers
(Values shown are not necessarily from the same device) (Ref 2)
I Pea kRpegionl Laser EfficnenMWSpectral Lae Powe Effcinc
Infrared C02 10,500 j 1,000 20Infrared Nd:YAG 1,060 10,000 0.1-2
Ulta-25 1-2viltKrF 248 (discharge) (discharge)violet7-9
(e-beam)
Uilt XeCl 308 20-251vilt(discharge) (discharge)
5(e-beam)
2
The rare-gas monohalide lasers typically operate at very high
pressures, from 1 to 3 atmospheres. There are various methods of
excitation of the lasing medium. One of the methods uses an electron
beam (e-beam) for the excitation of the medium, while another utilizes
an e-beam in conjunction with a sustainer electric field discharge.
Another method of excitation employed is to first preiomize the lasing
medium with a UV radiation source and then apply a powerful electric
discharge. All three of these methods use pulsed excitation, in order
to avoid instabilities leading to arcing.
There are several problems associated with the rare-gas monohalide
lasers. The halide gases used in such lasers are highly corrosive,
causing damage of the discharge tube, electrodes, and optics employed.
These gases are also highly electronegative and can cause instabilities
in the discharge. The rare gases, such as Xe and Kr, are extremely
expensive and are not cost effective when used in a flowing gas laser
system. Closed cycle rare-gas monohalide lasers suffer from a degrada-
tion in power output as the laser is operated. Development of these
lasers and attempts to solve the various problems are currently being
pursued. But the question arises, what makes rare-gas monohalides
such unique lasing candidates?
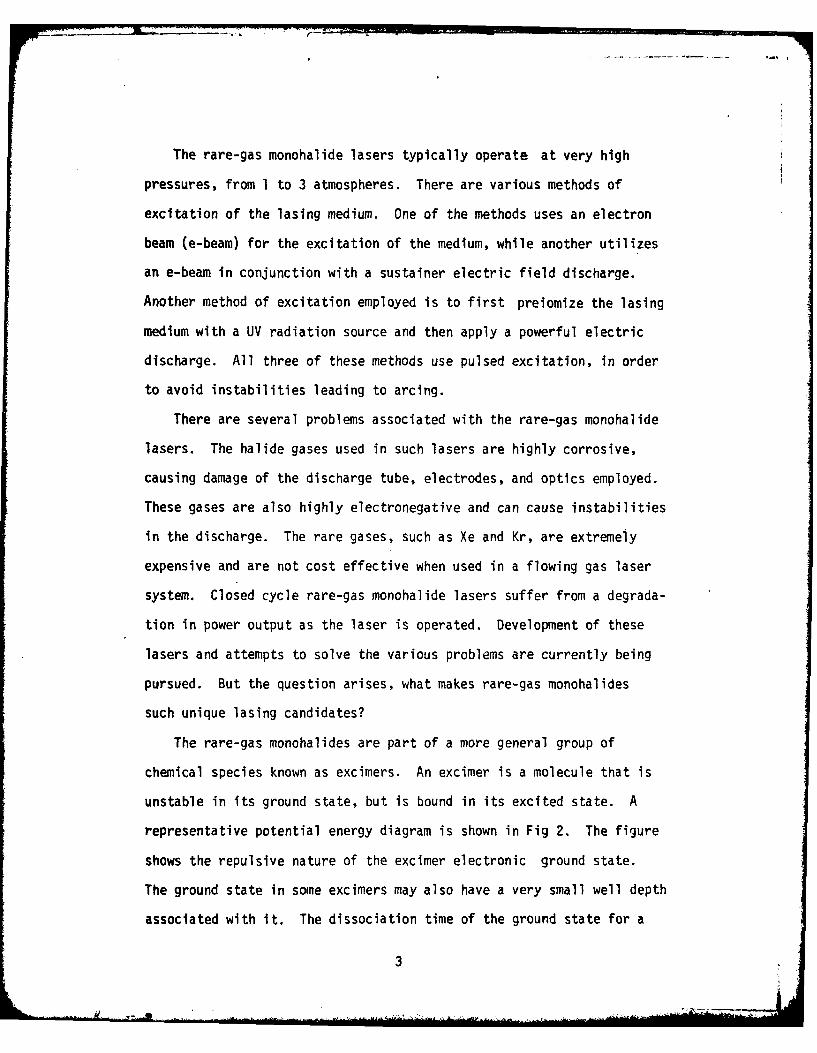
The rare-gas monohalides are part of a more general group of
chemical species known as excimers. An excimer is a molecule that is
unstable in its ground state, but is bound in its excited state. A
representative potential energy diagram is shown in Fig 2. The figure
shows the repulsive nature of the excimer electronic ground state.
The ground state in some excimers may also have a very small well depth
associated with it. The dissociation time of the ground state for a
3
~Excimeri Excitedi State
J Emission
~Excimer Ground State
Continuum Bandwidth Weak van der Waals Binding
Internuclear Separation
Fig 2. Potential Energy Curves for a Rare-Gas Monohalide
(Ref 1 )
rare-gas monohalide is on the order of 10-1 2 seconds. With radiative
lifetimes of 10-9 to 10- 6 seconds for the excited state, population
inversions between the excited and ground states are easily produced
and maintained. The excited state can radiate in a broad band of
frequencies, due to the repulsive nature of the ground state. The
broad bandwidth of emission from the excited state results in low
stimulated emission cross sections for a given frequency of radiation
of the electronic tansition. The small stimulated emission cross
sections give correspondingly low gain for excimer systems (Ref 1).
The gain coefficient for a laser medium is given by (Ref 3):
4
(N2- N) (1)
where
s( ) : gain coefficient as a function of frequency, cm"1
a(w) = stimulated emission cross section as a function offrequency, cm
N2, Ni = number density of upper and lower laser levels re-spectively, cm
-3
92 = ratio of the degeneracy of the upper and lower laserlevels
From this equation it can be seen that to attain a large gain for
lasing, a high population inversion is needed if the a(w) is small.
To attain a high population inversion, conditions within the laser
should be favorable for excimer formation. The two main reaction
channels of formation for the excited rare-gas monohalides are an ion
reaction such as (Ref 1):
. Xe+ + CI- + M - XeCl* + M (2)
where M is some third body. The * indicates an excited state. The
other reaction involves an excited rare-gas atom reacting with a
halogen in a reaction of the type (Ref 1):
Xe* + C12 - XeCl* + Cl (3)
Both of these reactions are highly efficient at high pressures. To
form the large numbers of rare-gas ions and metastables from electron
impact collision requires many high energy electrons. High energy
electrons are needed because Eqs (2) and (3) require ionization and
electronic excitation, energies much greater than what is needed for
5
excitation of a laser utilizing a vibrational transition, such as the
CO2 laser. Continuous positive column discharges can not operate at
the high pressures required without degenerating into an arc. Electron
beams can supply high numbers of electrons at high energies. Some
e-beams can deliver a kilojouleof energy in 5 nanoseconds to a gas
(Ref 2). Electron beams have been used with sustained electric field
discharges also. The e-beam supplies the ionization to maintain the
discharge while the sustained field accelerates low energy electrons
back up to energies for electronic excitation. UV preionizatlon tech-
niques give the electric field of a d4scharge a uniformed charge dis-
tribution to grow from, deterring instabilities from rapidly occurring.
Even these methods are pulsed techniques, due to the high operating
pressures and electronegative gases employed.
As mentioned before, the rare-gas monohalide lasers suffer from a
degradation in laser output power with time if the laser is operated
in a closed cycle fashion. The XeCl laser system, one of the most
powerful and efficient of the rare-gas monohalide lasers, has received
a great deal of interest due to its long life operation. The lifetime
of a laser is generally defined as the time (or number of pulses) it
takes until the laser's output power is one-half of the initial output
power. XeCl lasers have demonstrated the longest life time operations
of the rare-gas monohalide lasers with as many as a million pulses being
achieved. A XeCl laser medium consists of a buffer gas of a light rare
gas such as He or Ne, the rare gas Xe, and a halogen donor species,
such as C12 or HCI. A severe lack of knowledge about the reactions
within a XeCl discharge has severely hampered attempts to explain the
power degradation associated with the laser.
6
G/UI
C4-b
I |
200 300 400
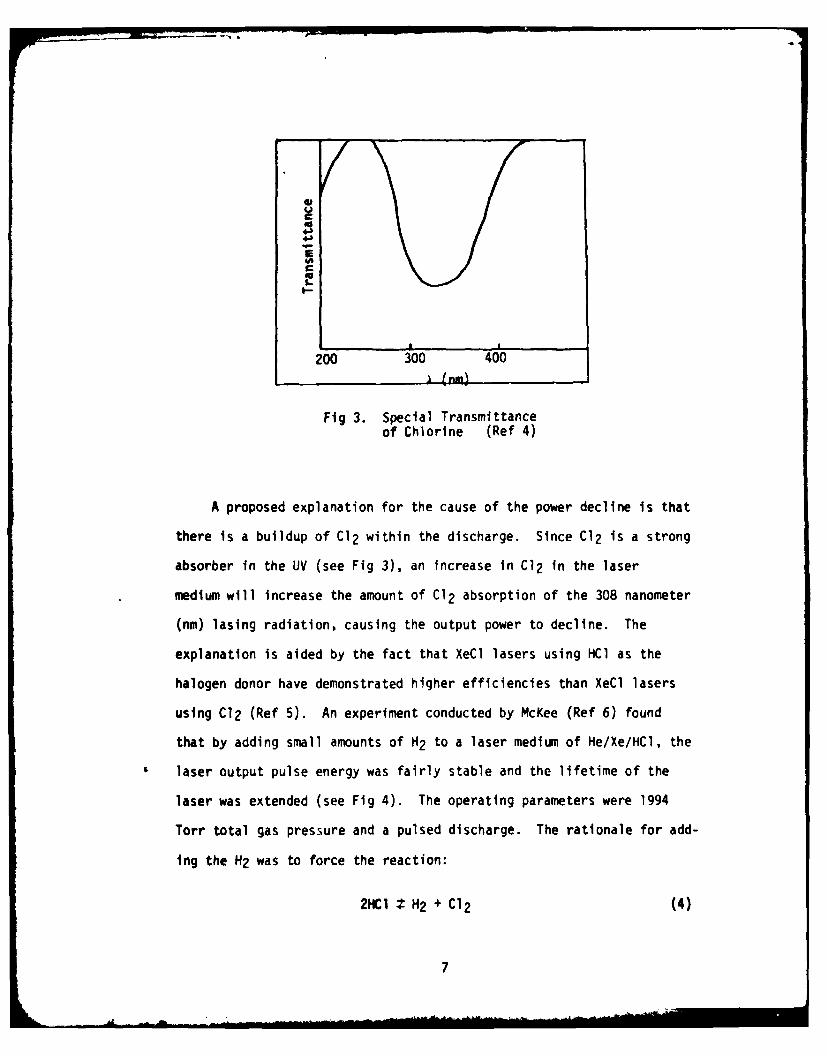
Fig 3. Special Transmittanceof Chlorine (Ref 4)
A proposed explanation for the cause of the power decline is that
there is a buildup of C12 within the discharge. Since C12 is a strong
absorber in the UV (see Fig 3), an increase in C12 in the laser
medium will increase the amount of C12 absorption of the 308 nanometer
(nm) lasing radiation, causing the output power to decline. The
explanation is aided by the fact that XeCl lasers using HCI as the
halogen donor have demonstrated higher efficiencies than XeCl lasers
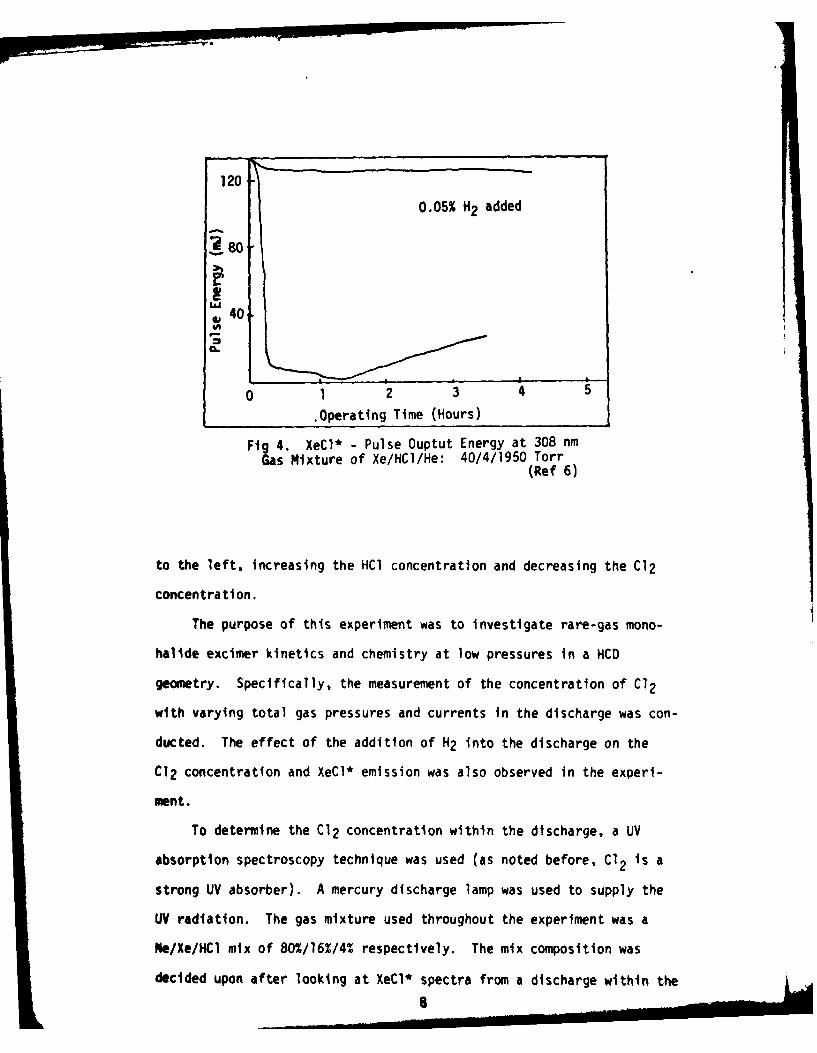
using C12 (Ref 5). An experiment conducted by McKee (Ref 6) found
that by adding small amounts of H2 to a laser medium of He/Xe/HC1, the
laser output pulse energy was fairly stable and the lifetime of the
laser was extended (see Fig 4). The operating parameters were 1994
Torr total gas pressure and a pulsed discharge. The rationale for add-
ing the H2 was to force the reaction:
2HCl Z H2 + C12 (4)
7
120
0.05% H2 added
~80
4 40
CL
0 1 2 3 4 5
.Operating Time (Hours)
Fig 4. XeCl* - Pulse Ouptut Energy at 308 nmGas Mixture of Xe/HC1/He: 40/4/1950 Torr
(Ref 6)
to the left, increasing the HCI concentration and decreasing the C12
concentration.
The purpose of this experiment was to investigate rare-gas mono-
halide excimer kinetics and chemistry at low pressures in a HCD
geometry. Specifically, the measurement of the concentration of Cl2
with varying total gas pressures and currents in the discharge was con-
ducted. The effect of the addition of H2 into the discharge on the
C12 concentration and XeCl* emission was also observed in the experi-
ment.
To determine the C12 concentration within the discharge, a UV
absorption spectroscopy technique was used (as noted before, Cl2 is a
strong UV absorber). A mercury discharge lamp was used to supply the
UV radiation. The gas mixture used throughout the experiment was a
Ne/Xe/HCI mix of 80%/16%/4% respectively. The mix composition was
decided upon after looking at XeCl* spectra from a discharge within the8
hollow cathode taken previously by George Vogel (Ref 7). This mixture
was found to give the most intense XeCl*emission. The intensity of
the UV radiation was monitored by photon counters, after the radiation
has been passed through a monochromator. The absorption of the
radiation by Cl2 followsBeer's Law:
I = 10 enax (5)
where
I = the radiation intensity after passage through the gas
10 = radiation intensity
P = number density of absorbing species, cm"3
a = cross section for radiation absorption by thespecies, cm2
x - distance radiation traveled through the gas, cm
To be able to understand and analyze the results of the experiment
as presented in Chapter four, one must understand the various attributes
of the experiment. The kinetics of the laser discharge, i.e., the
possible ionizations, excitations, rare-gas halide formations and
quenching, need to be understood if any reasonable explanation of the
results can be proposed. The limitation or favoring of any kinetic
processes due to the hollow cathode discharge need also be examined.
Therefore, the physics of a hollow cathode discharge need to be known.
The limitations and errors introduced by the measuring technique need
to be examined. Therefore, photon counting techniques have to be
understood. The theory of the laser kinetics, hollow cathode discharge,
and photon counting are presented in Chapter two. The experimental
apparatus and measurement procedure are outlayed in Chapter three.
9
The conclusions drawn from the experimental results are presented
in Chapter five. Recommendations for future work to strengthen or
verify our conclusions are presented in Chapter six.
10
II. Theory
Excimer lasers have been extensively studied with most of the
research being in rare-gas halide lasers, due to the high efficiencies
and high average power outputs demonstrated by these lasers. XeCl
lasers have received special interest due to their long life operation
relative to other rare-gas monohalide lasers, as well as XeCl's high
power and efficiency. Much is known about the XeCl molecule itself,
but the laser reaction kinetics are not completely understood. In-
volved in the reaction kinetics of the XeCl laser plasma is the forma-
tion of C12, which absorbs the XeCl* laser emission (308 nm). The
purpose of the experiment was to measure the C12 partial pressures
with varying current, total pressure, and H2 concentrations in a
hollow cathode discharge.
Kinetics
Due to the complexity of excimers (He*, one of the simplest
excimers, has over sixty electronic states (Refs 8 and 9)), the dis-
cussion of the energy levels of excimers will be limited to the levels
involved only in the lasing transitions. The reaction kinetics in-
volved in the formation of XeCl* are not yet completely understood.
Unless otherwise referenced, material for this section was taken from
"Rare Gas Halogen Excimers", Topics in Applied Physics, Volume 30,
Chapter 4, written by Ch. A. Brau and edited by Ch. K. Rhodes, Berlin
and Heidelberg: Springer-Verlag, 1979.
A typical potential energy diagram of the laser levels for a
rare-gas monohalide is shown in Fig 5. The lower laser level of a
rare-gas monohalide, such as XeCl, is its covalently bonded ground
i
"2z Strongly Bound, Ionic Like
Alkali Halide
1j
2H Strongly repulsive, Covalent
2z Weakly attractive,Covalent Thermally unstable
Internuclear Distance
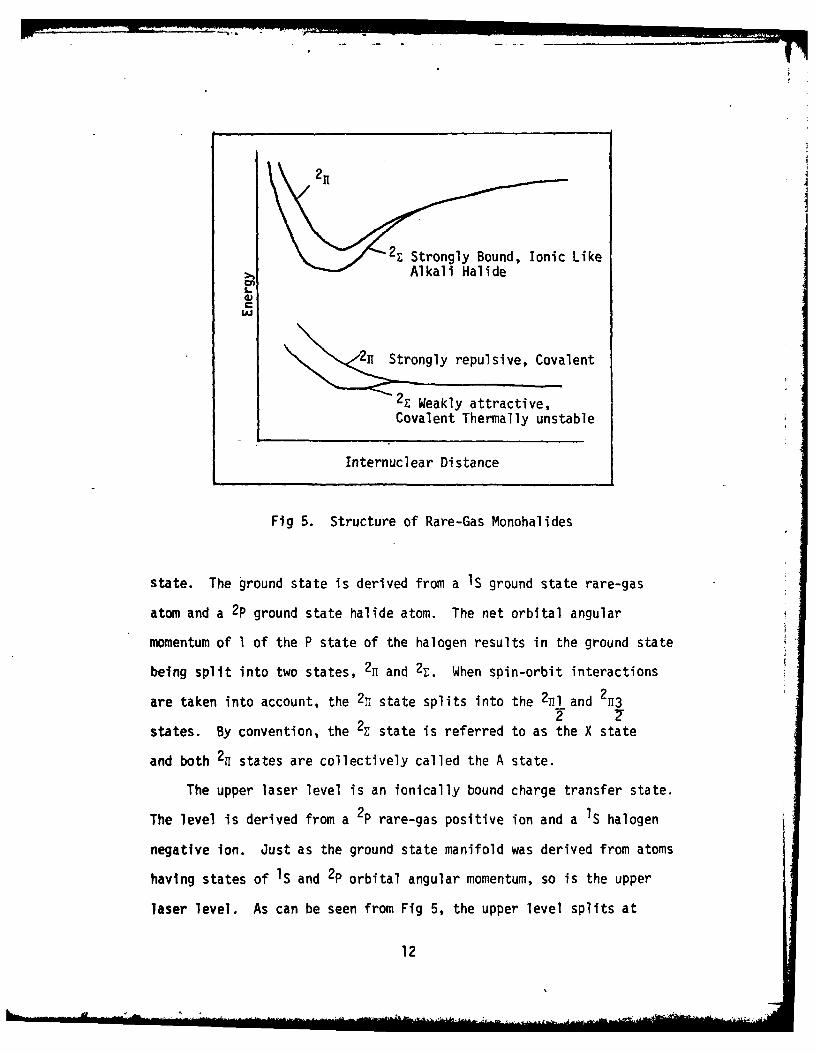
Fig 5. Structure of Rare-Gas Monohalides
state. The ground state is derived from a Is ground state rare-gas
atom and a 2p ground state halide atom. The net orbital angular
momentum of 1 of the P state of the halogen results in the ground state
being split into two states, 2H and 2E. When spin-orbit interactions
are taken into account, the 2n state splits into the 2HI and 213
states. By convention, the 2z state is referred to as the X state
and both 21 states are collectively called the A state.
The upper laser level is an ionically bound charge transfer state.
The level is derived from a 2P rare-gas positive ion and a IS halogen
negative ion. Just as the ground state manifold was derived from atoms
having states of IS and 2p orbital angular momentum, so is the upper
laser level. As can be seen from Fig 5, the upper level splits at
12
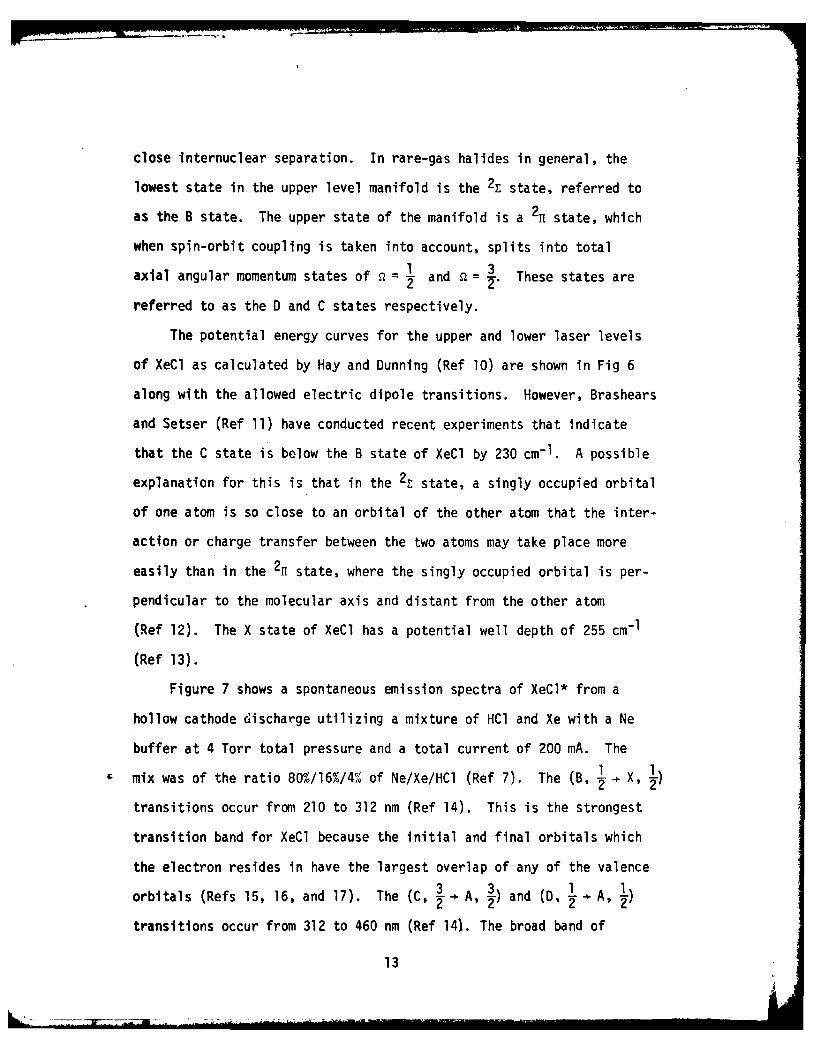
close internuclear separation. In rare-gas halides in general, the
lowest state in the upper level manifold is the 2E state, referred to
as the B state. The upper state of the manifold is a 21 state, which
when spin-orbit coupling is taken into account, splits into total
axial angular momentum states of 2 = 1 and Q = .. These states are22
referred to as the D and C states respectively.
The potential energy curves for the upper and lower laser levels
of XeCl as calculated by Hay and Dunning (Ref 10) are shown in Fig 6
along with the allowed electric dipole transitions. However, Brashears
and Setser (Ref 11) have conducted recent experiments that indicate
that the C state is below the B state of XeCl by 230 cm-1 . A possible
explanation for this is that in the 2E state, a singly occupied orbital
of one atom is so close to an orbital of the other atom that the inter-
action or charge transfer between the two atoms may take place more
easily than in the 2n state, where the singly occupied orbital is per-
pendicular to the molecular axis and distant from the other atom
(Ref 12). The X state of XeCl has a potential well depth of 255 cm-1
(Ref 13).
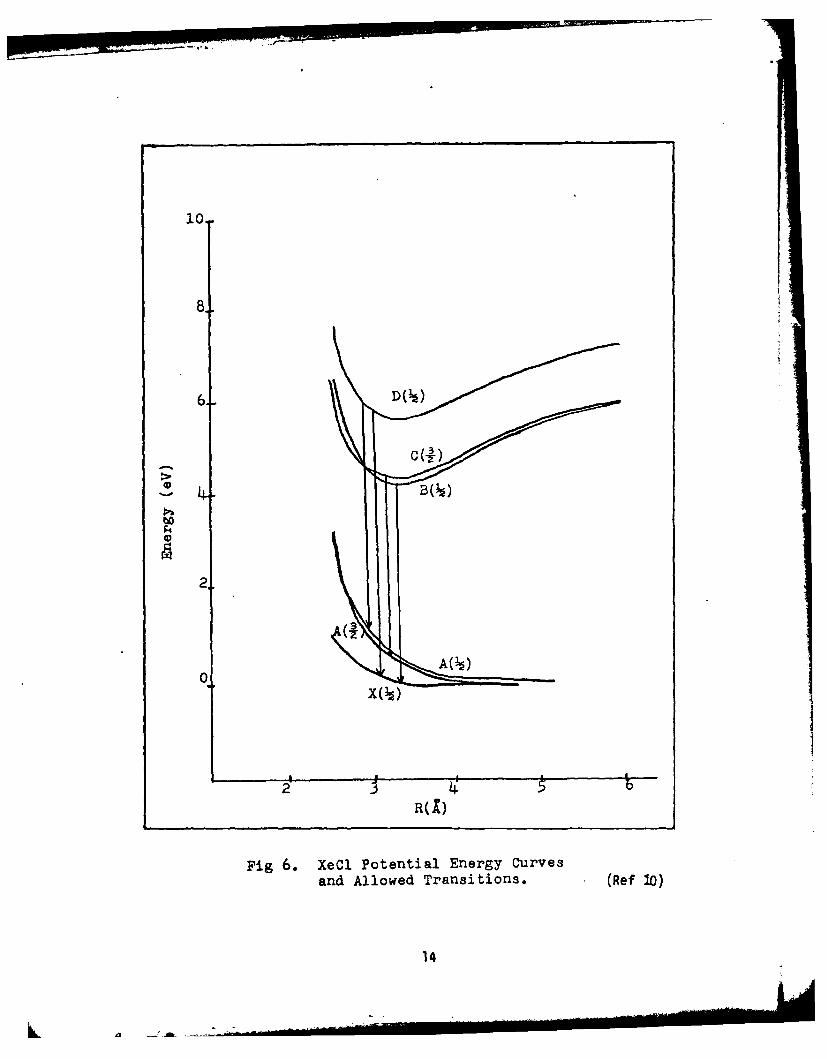
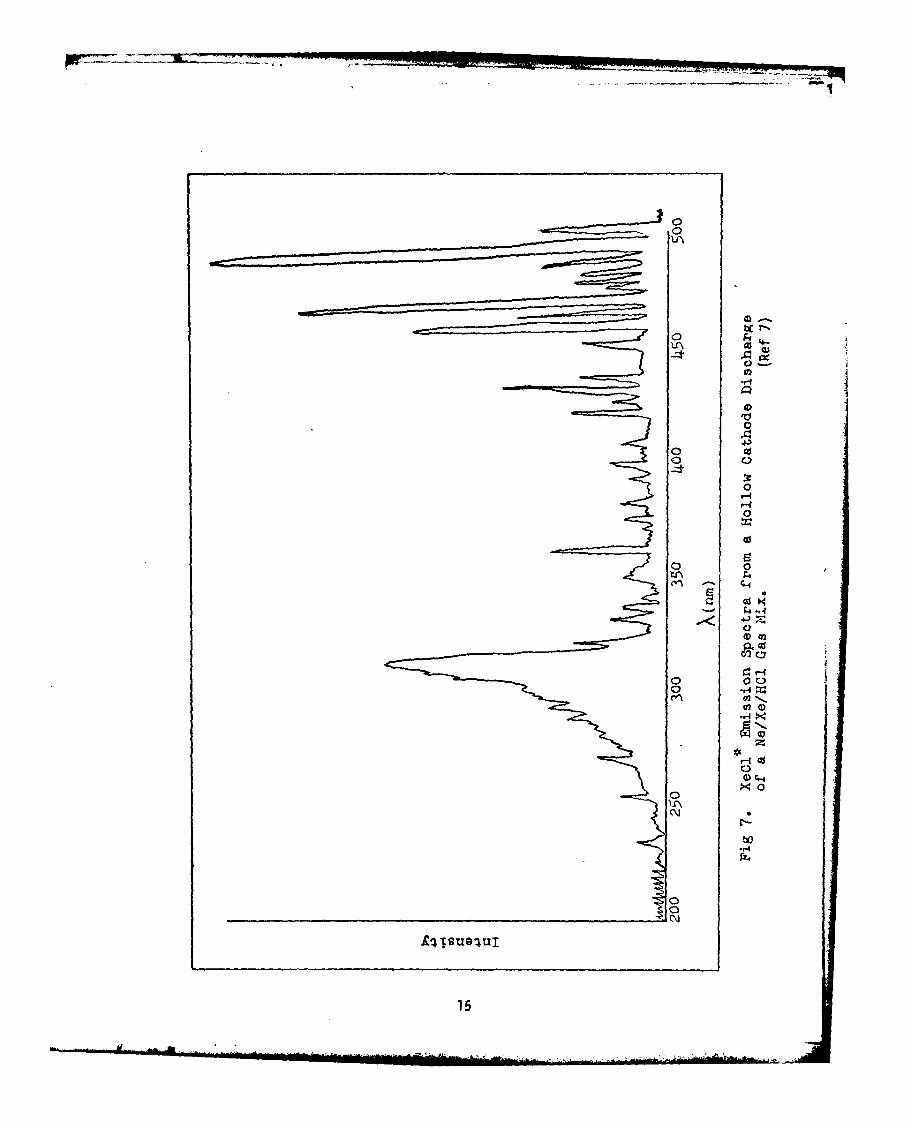
Figure 7 shows a spontaneous emission spectra of XeCl* from a
hollow cathode discharge utilizing a mixture of HCl and Xe with a Ne
buffer at 4 Torr total pressure and a total current of 200 mA. The
mix was of the ratio 80%/16%/40 of Ne/Xe/HCl (Ref 7). The (B, , X, 1
transitions occur from 210 to 312 nm (Ref 14). This is the strongest
transition band for XeCl because the initial and final orbitals which
the electron resides in have the largest overlap of any of the valence
orbitals (Refs 15, 16, and 17). The (C, - A, 3)and (D, 1 A, )2 2cu f 2'
transitions occur from 312 to 460 nm (Ref 14). The broad band of
13
10.
t
6- O
pa
2
0
2'R( l)
Fig 6. XeC1 Potential Energy Curvesand Allowed Transitions. (Ref 10)
14
00
0 c
00
0
0
0
4<.4
0C-)
0 004
cn 02---
-4
0
.r4Pi4
12-
2H- 21 transitions, resulting from transitions to the repulsive A
electronic state, are very weak (Refs 16 and 17). The D state, which
mixes with the B state at close internuclear distances, can radiate
to the X state (Ref 17). The (D, I - X, 1) transition occurs at2 tnt o
235.8 nm. The higher intensity spectral lines at wavelengths greater
than 460 nm are due to atomic Xe transitions (Ref 18). Located at
450 nm are transitions due to Xe2Cl* (Ref 19).
As the pressure is increased, the short and long wavelength regions
shift toward the main peak which becomes located at 308 nm, the main
lasing transition for XeCl*. The (B, - X, 1) emission becomes more
intense with increasing pressure because molecules in the (C, -) state2)
are collisionally transferred to the B, -state (Ref 14). The lasing
radiative lifetime of the (B, X, ) transition of XeCl* has been
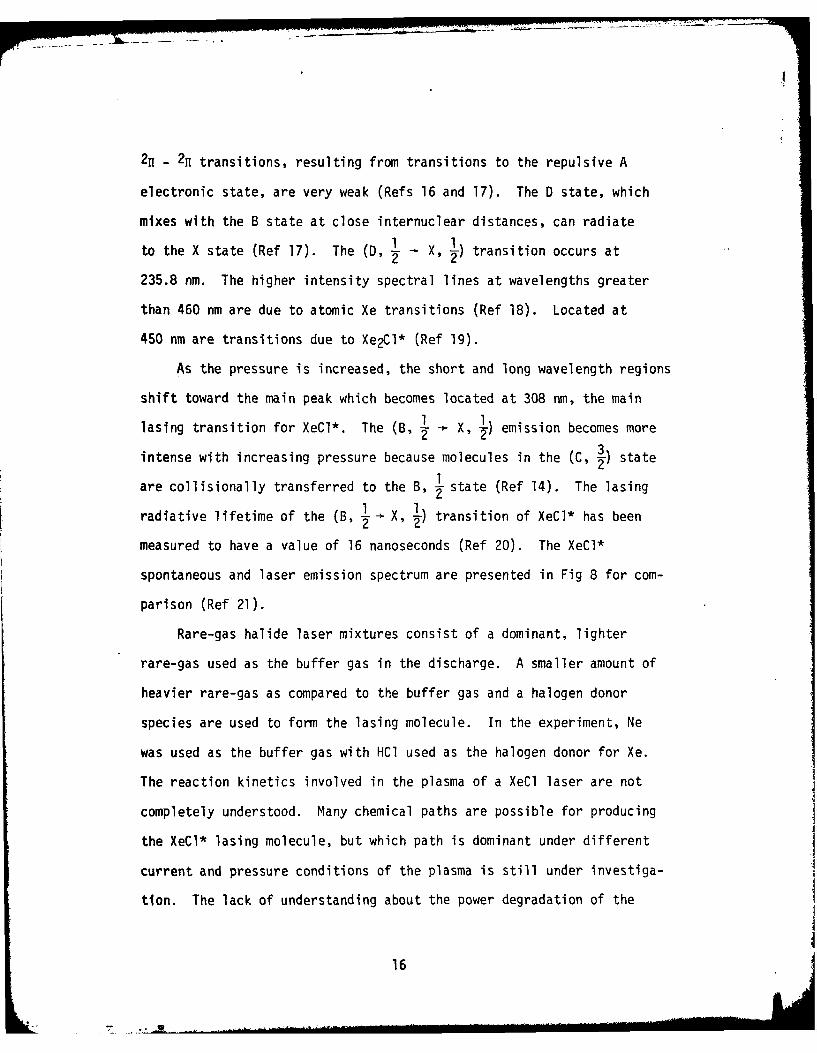
measured to have a value of 16 nanoseconds (Ref 20). The XeCl*
spontaneous and laser emission spectrum are presented in Fig 8 for com-
parison (Ref 21).
Rare-gas halide laser mixtures consist of a dominant, lighter
rare-gas used as the buffer gas in the discharge. A smaller amount of
heavier rare-gas as compared to the buffer gas and a halogen donor
species are used to form the lasing molecule. In the experiment, Ne
was used as the buffer gas with HCI used as the halogen donor for Xe.
The reaction kinetics involved in the plasma of a XeCl laser are not
completely understood. Many chemical paths are possible for producing
the XeCl* lasing molecule, but which path is dominant under different
current and pressure conditions of the plasma is still under investiga-
tion. The lack of understanding about the power degradation of the
16
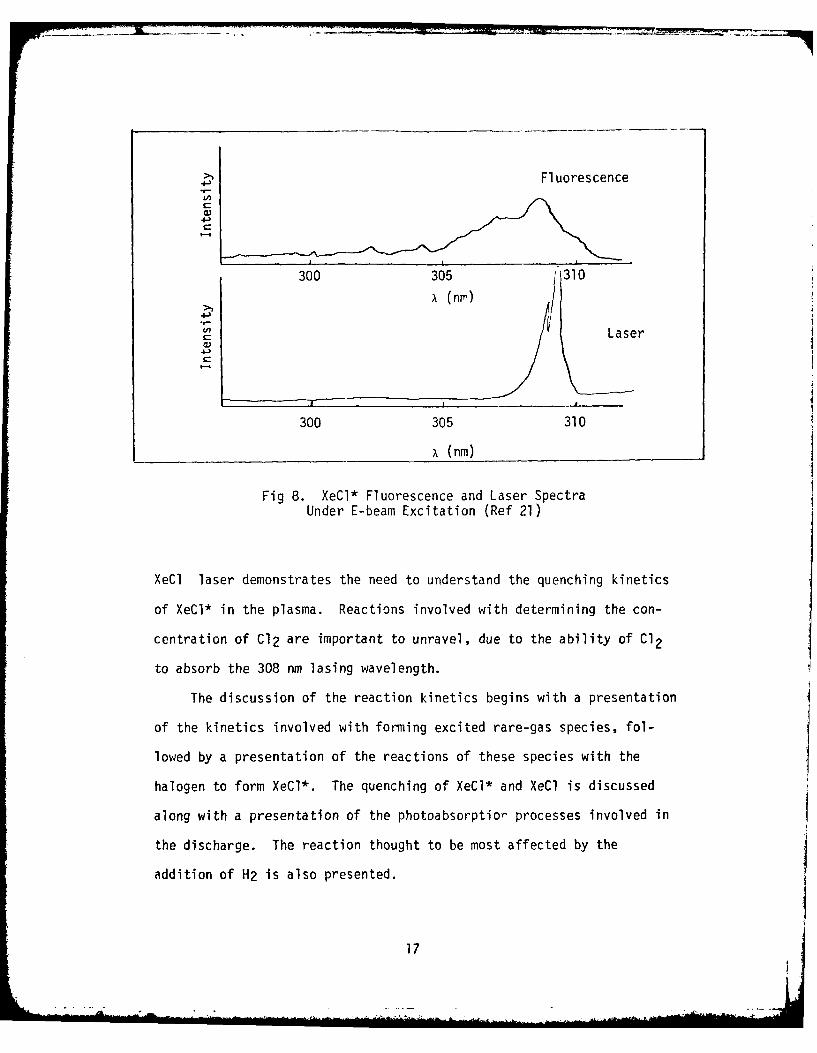
Fluorescence
LOP)
4
300 305 310
x (nr) /"a Laser
300 305 310
x (nm)
Fig 8. XeCl* Fluorescence and Laser SpectraUnder E-beam Excitation (Ref 21)
XeCl laser demonstrates the need to understand the quenching kinetics
of XeCl* in the plasma. Reactions involved with determining the con-
centration of Cl2 are important to unravel, due to the ability of Cl2
to absorb the 308 nm lasing wavelength.
The discussion of the reaction kinetics begins with a presentation
of the kinetics involved with forming excited rare-gas species, fol-
lowed by a presentation of the reactions of these species with the
halogen to form XeCl*. The quenching of XeCI* and XeCl is discussed
along with a presentation of the photoabsorptio,- processes involved in
the discharge. The reaction thought to be most affected by the
addition of H2 is also presented.
17
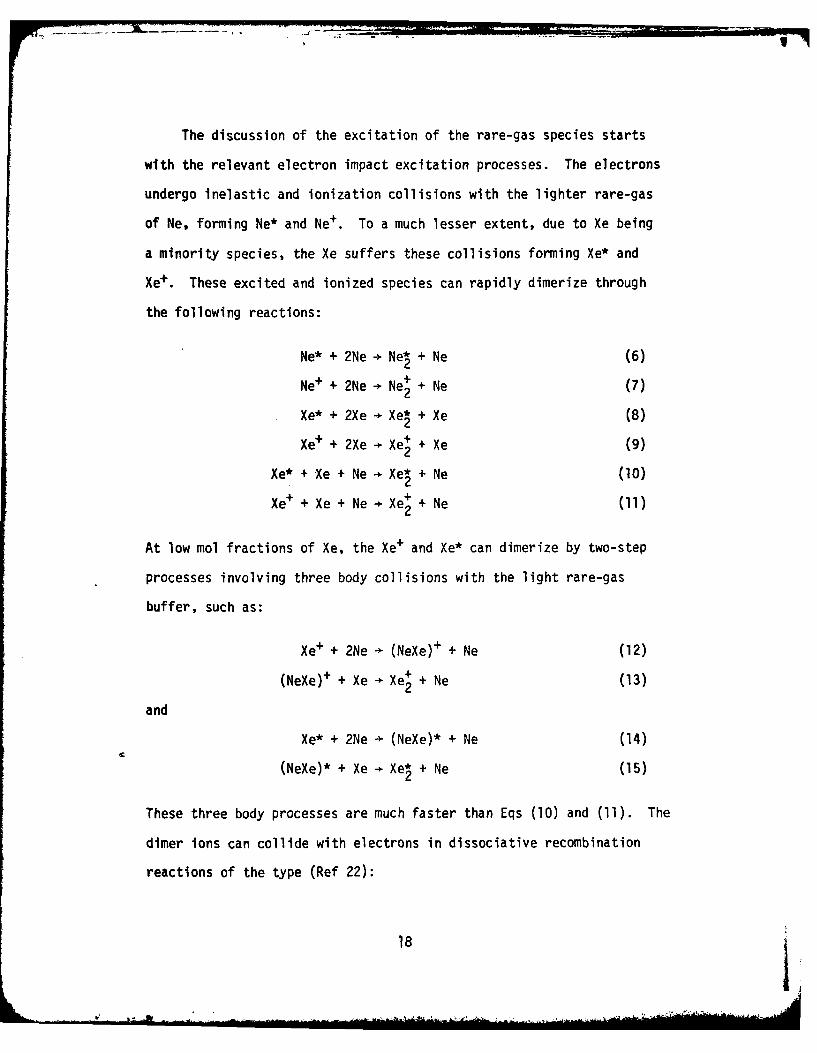
The discussion of the excitation of the rare-gas species starts
with the relevant electron impact excitation processes. The electrons
undergo inelastic and ionization collisions with the lighter rare-gas
of Ne, forming Ne* and Ne+. To a much lesser extent, due to Xe being
a minority species, the Xe suffers these collisions forming Xe* and
Xe+. These excited and ionized species can rapidly dimerize through
the following reactions:
Ne* + 2Ne - Ne* + Ne (6)
Ne+ + 2Ne - Ne+ + Ne (7)
Xe* + 2Xe - Xe* + Xe (8)
Xe+ + 2Xe - Xe+ + Xe (9)2
Xe* + Xe + Ne Xe* + Ne (10)
Xe+ + Xe + Ne - Xe+ + Ne (11)
At low mol fractions of Xe, the Xe+ and Xe* can dimerize by two-step
processes involving three body collisions with the light rare-gas
buffer, such as:
Xe+ + 2Ne - (NeXe)+ + Ne (12)
(NeXe)+ + Xe - Xe+ + Ne (13)
and
Xe* + 2Ne - (NeXe)* + Ne (14)
(NeXe)* + Xe - Xe* + Ne (15)
These three body processes are much faster than Eqs (10) and (11). The
dimer ions can collide with electrons in dissociative recombination
reactions of the type (Ref 22):
18j
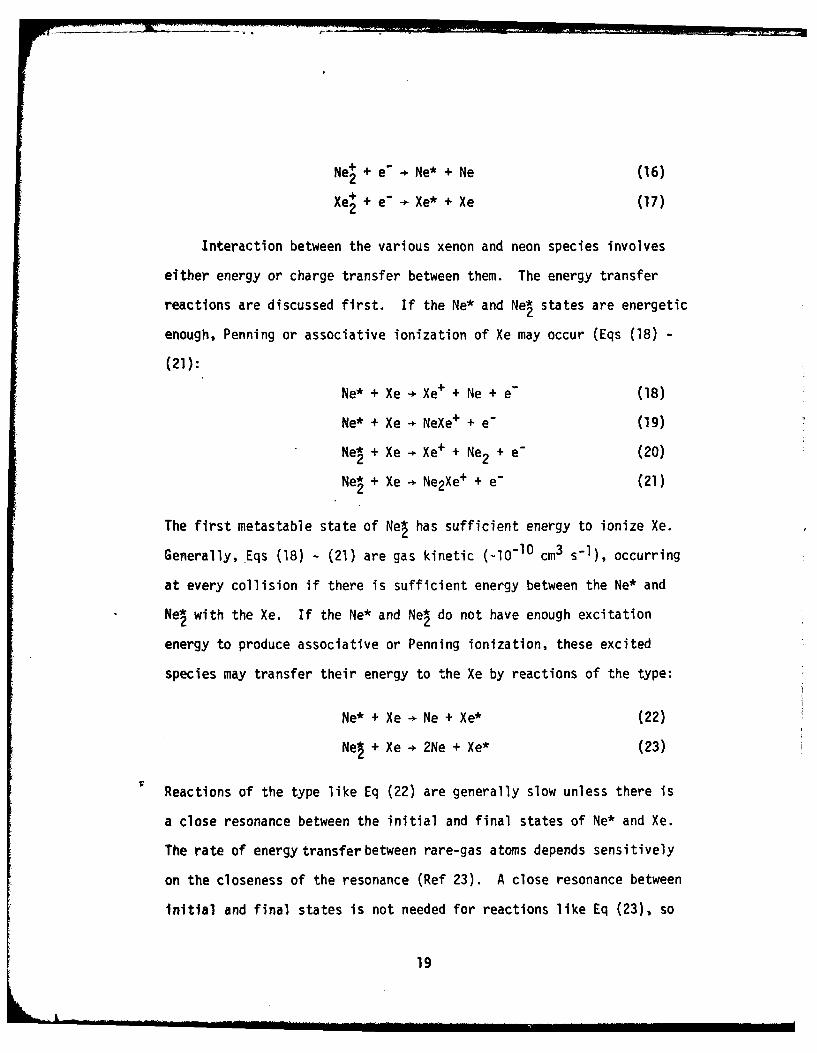
Ne+ + e Ne* + Ne (16)
Xe4 + e- Xe* + Xe (17)
Interaction between the various xenon and neon species involves
either energy or charge transfer between them. The energy transfer
reactions are discussed first. If the Ne* and Ne* states are energetic
enough, Penning or associative ionization of Xe may occur (Eqs (18) -
(21):
Ne* + Xe Xe+ + Ne + e" (18)
Ne* + Xe NeXe + + e- (19)
Ne + Xe Xe+ + Ne2 + e- (20)
Ne* + Xe Ne2Xe+ + e- (21)
The first metastable state of Ne* has sufficient energy to ionize Xe.
Generally, Eqs (18) - (21) are gas kinetic (-10lO cm3 s'1), occurring
at every collision if there is sufficient energy between the Ne* and
Ne* with the Xe. If the Ne* and Ne* do not have enough excitation
energy to produce associative or Penning ionization, these excited
species may transfer their energy to the Xe by reactions of the type:
Ne* + Xe Ne + Xe* (22)
Nel + Xe 2Ne + Xe* (23)
Reactions of the type like Eq (22) are generally slow unless there is
a close resonance between the initial and final states of Ne* and Xe.
The rate of energy transfer between rare-gas atoms depends sensitively
on the closeness of the resonance (Ref 23). A close resonance between
Initial and final states is not needed for reactions like Eq (23), so
19
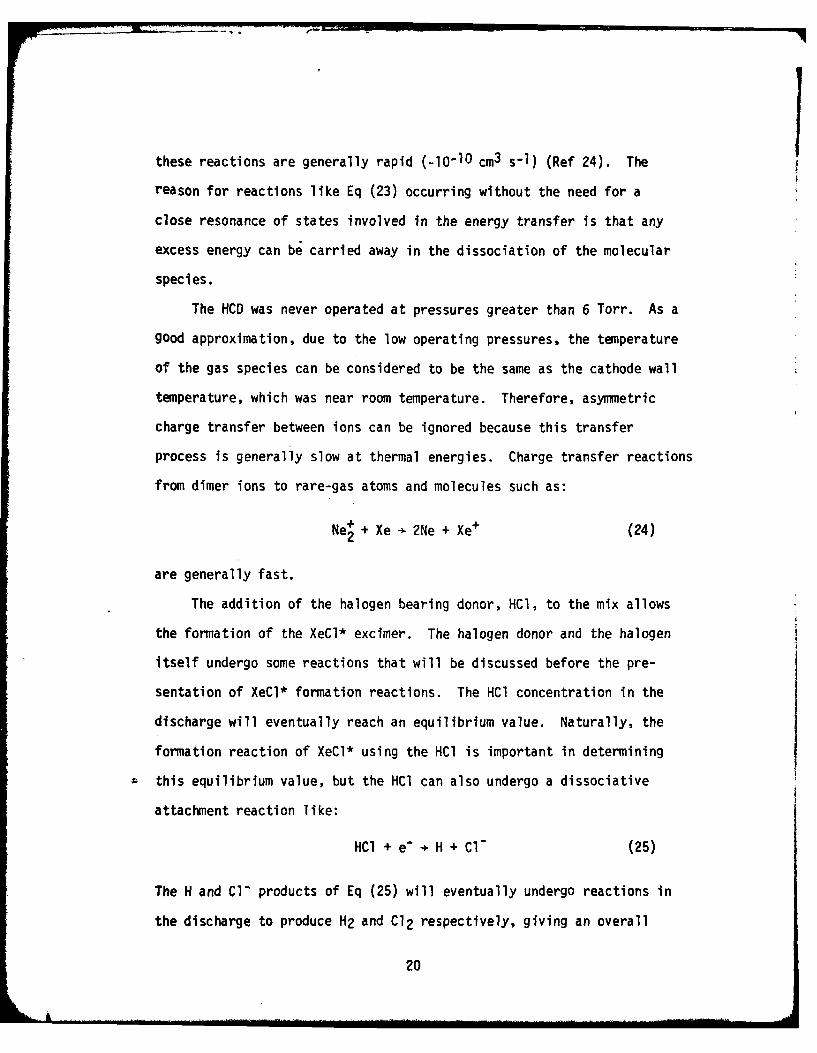
these reactions are generally rapid (_10 -10 cm3 s-1) (Ref 24). The
reason for reactions like Eq (23) occurring without the need for a
close resonance of states involved in the energy transfer is that any
excess energy can be carried away in the dissociation of the molecular
species.
The HCD was never operated at pressures greater than 6 Torr. As a
good approximation, due to the low operating pressures, the temperature
of the gas species can be considered to be the same as the cathode wall
temperature, which was near room temperature. Therefore, asymmetric
charge transfer between ions can be ignored because this transfer
process is generally slow at thermal energies. Charge transfer reactions
from dimer ions to rare-gas atoms and molecules such as:
Ne4 + Xe - 2Ne + Xe+ (24)
are generally fast.
The addition of the halogen bearing donor, HCI, to the mix allows
the formation of the XeCl* excimer. The halogen donor and the halogen
itself undergo some reactions that will be discussed before the pre-
sentation of XeCl* formation reactions. The HCl concentration in the
discharge will eventually reach an equilibrium value. Naturally, the
formation reaction of XeCl* using the HCl is important in determining
this equilibrium value, but the HCl can also undergo a dissociative
attachment reaction like:
HCl + e- 9 H + Cl" (25)
The H and CI" products of Eq (25) will eventually undergo reactions in
the discharge to produce H2 and C12 respectively, giving an overall
20
reaction of the dissociation of HCl:
2HCl - H2 + C12 (26)
Cl2 and Cl formed in the discharge may undergo exothermic dissociative
attachment reactions like:
C12 + e- Cl" + Cl (27)
Cl + e- Cl (28)
Reactions like Eq (27) are usually very rapid, with rate coefficients
as great as l0-7 cm3 s-l at room temperature. The rate decreases
somewhat at higher electron temperatures (Refs 25 and 26). A lower
rate for a reaction of the type like Eq (27) would be expected in the
hollow cathode due to the greater fraction of high energy electrons
found in a hollow cathode as compared to a positive column discharge.
There is little data available for halogens of interest in rare-gas
monohalide lasers, but evidence seems to indicate that fluorine (F2)
has an exothermic dissociative attachment reaction rate coefficient
on the order of 0.5--l.0 x 10- 9 cm3 s-l at an electron temperature of
a few eV (Refs 27 and 28). A rate constant for Eq (28) at low pressures
could not be found, but at total gas mix pressures of atmospheres,
atomic fluorine (F) has a dissociative attachment rate constant
estimated to be 1.0 x 1l-12 cm3 - s-l (Ref 29). Cl probably has a
comparable rate constant at high pressures.
The HCl and other halogen species can react with the excited and
ionized rare-gas species to form rare-gas halide excimers. Through
similar types of reactions to be presented for XeCl* formation, the
21
various excited and ionized species of neon can react with the halogen
or halogen donor to form NeCl* and Ne2Cl*. The formation of XeCl* due
to the Xe* produced by Eqs (17), (22), and (23) reacting directly with
the HCl, is through the reaction:
Xe* + HCl * XeCl* + H (29)
This reaction was previously thought to be the dominant channel of
formation for the upper laser level for discharges using HC1 as the
halogen donor, but recent results contradict this belief (Refs 11 and
14). The quenching rates and branching ratios for xenon metastable
atoms Xe(3P2) and Xe(3P1) (the excited xenon states involved in forma-
tion of XeCl*), with HCl as a halogen donor at low pressure were
measured and branching ratios of .02 and .01 were found for Xe( 3P2 )
and Xe(3PI) respectively (Refs 11 and 14). The low branching ratios
for HCl as the quencher for xenon metastables at low pressure suggests
that there is another more dominant reaction path leading to XeCl*
formation. Equation (29) has a rate constant of 5.6 x10⁻¹⁰ cm3 - s-1
for the Xe(3P2) (Ref 14), but the rate constant for the Xe( 3P1 ) was
not measured (Ref 11). The Xe* product of Eqs (8), (10), and (15)
may have reactions with the HC of the type:
Xe* + HC1 - XeCl* + Xe + H (30)
Xe2CI* may also be formed through Eq (30) but since this molecule is
not an important contributor to the lasing wavelength, it will not be
discussed further.
22
The Xe* may also directly react with Cl2 through the reaction:
Xe* + C12 -* XeCl* + Cl (31)
This reaction has a large cross section and near unit efficiency for
producing excited products (Ref 30). Equation (31) has a rate constant
of 7.2 x 10⁻¹⁰ cm3 - s-1 for the Xe(3P2) metastable (Ref 14), but the
rate constant for the Xe( 3PI) could not be found. The reader may ask
why is C12 still a problem if it reacts so fast with Xe* to form
XeCl*? Equation (31) cannot produce XeCl* any faster than Xe* is pro-
duced. The production of Xe* does not occur with the same large cross
sections and efficiencies as Eq (31), so Eq (31) is limited by the
Xe* production rate, allowing quantities of Cl2 to remain in the dis-
charge. The Cl product of Eq (31) can recombine with another Cl and
form C12 also.
The rare-gas positive ions can react with the Cl- ions to form
XeCl*. The Xe+ of Eqs (18) and (24) may react with Cl" to form
XeCI* via the reaction:
Xe+ + Cl- + Ne - XeCI* + Ne (32)
The Xe+ of Eqs (9), (11), and (13) form XeCl* through the reaction:
Xe4 + Cl- + M - XeCl* + Xe + M (33)
where M is some third body. Three-body recombination reactions of
ions are extremely rapid. At low pressures ( 1 atm), reactions like
Eq (33) have rate coefficients on the order of 10-25 cm6 s-l. The
large rate coefficient is due to the long range Coulomb interactions
of the ions (Ref 31). At pressures k 1 atm, the rate coefficient
23
begins to decrease due to the larger number of particles in a volume
that the ions must migrate through to get to one another (Ref 32).
The rate coefficient for Eq (33) has never been measured. Finally,
XeCl* may also be formed from reactions with NeCl* and Ne2Cl* via
reactions of the type:
NeCl* + Xe - XeCl* + Ne (34)
Ne2Cl* + Xe - XeCl* + 2Ne (35)
Reactions like Eq (34) are extrenely fast, on the order of gas kinetic
(Refs 33 and 34).
Just as the XeCl* is formed by very rapid reactions, it is also
quenched by rapid reactions. The Xe* needed for the formation of
XeCl* can be quenched by electron impact (Refs 35 and 36). It can
also be quenched by collisions with other Xe* atoms through the reaction:
Xe* + Xe* . Xe+ + Xe + e- (36)
Quenching of XeCl* can be possible by nearly all the species in the
laser plasma, excluding maybe the heavy ions due to their low concentration.
The dominant quenching process of rare-gas monohalide excimers in a
low pressure discharge is direct quenching by the halogen bearing
molecules, HC and Cl2 , via reactions of the type:
XeCl* + HCl + products (37)
XeC1* + C12 - products (38)
Equation (37) has a rate constant of 8 x 10⁻¹⁰ cm3 s-1 (Ref 20).
Equation (38) has a rate constant probably on the order of 1O-9 cm3 s-l .
Quenching of XeCl* by the rare-gas atoms Xe and Ne is much slower than
24
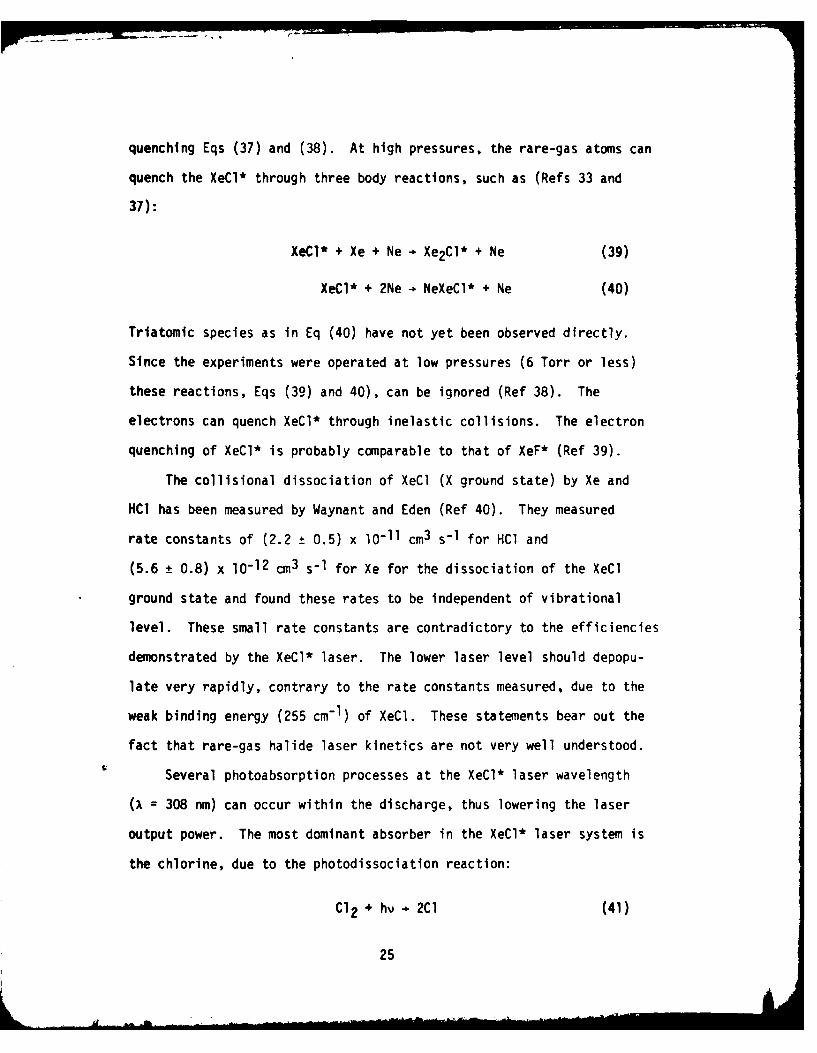
quenching Eqs (37) and (38). At high pressures, the rare-gas atoms can
quench the XeCl* through three body reactions, such as (Refs 33 and
37):
XeCl* + Xe + Ne - Xe2CI* + Ne (39)
XeCl* + 2Ne - NeXeCl* + Ne (40)
Triatomic species as in Eq (40) have not yet been observed directly.
Since the experiments were operated at low pressures (6 Torr or less)
these reactions, Eqs (39) and 40), can be ignored (Ref 38). The
electrons can quench XeCl* through inelastic collisions. The electron
quenching of XeCl* is probably comparable to that of XeF* (Ref 39).
The collisional dissociation of XeCl (X ground state) by Xe and
HCl has been measured by Waynant and Eden (Ref 40). They measured
rate constants of (2.2 ± 0.5) x 10-11 cm3 s-l for HCl and
(5.6 ± 0.8) x 10-12 cm3 s-1 for Xe for the dissociation of the XeCl
ground state and found these rates to be independent of vibrational
level. These small rate constants are contradictory to the efficiencies
demonstrated by the XeCl* laser. The lower laser level should depopu-
late very rapidly, contrary to the rate constants measured, due to the
weak binding energy (255 cm-1 ) of XeCl. These statements bear out the
fact that rare-gas halide laser kinetics are not very well understood.
Several photoabsorption processes at the XeCl* laser wavelength
(X = 308 nm) can occur within the discharge, thus lowering the laser
output power. The most dominant absorber in the XeCl* laser system is
the chlorine, due to the photodissociation reaction:
Cl2 + hv - 2CI (41)
25
1
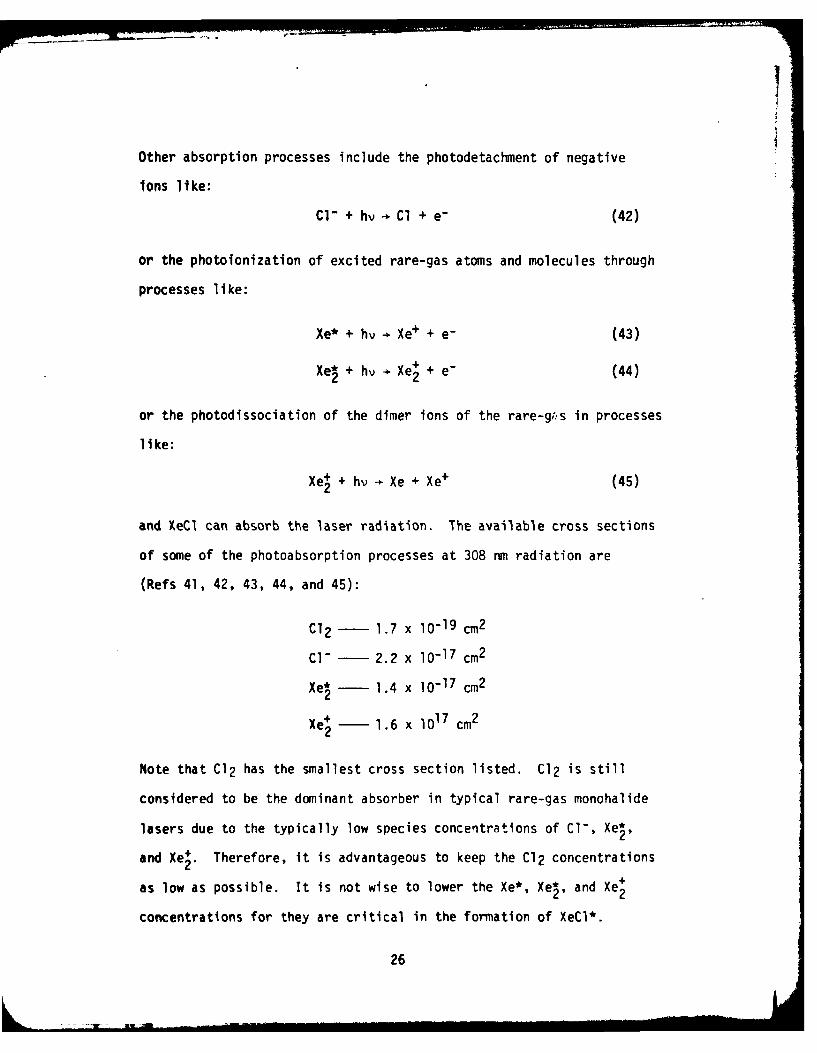
Other absorption processes include the photodetachment of negative
ions like:
CI" + hv Cl + e- (42)
or the photoionization of excited rare-gas atoms and molecules through
processes like:
Xe* + hv Xe+ + e- (43)
Xe* + hv- Xe+ + e- (44)
or the photodissociation of the dimer ions of the rare-grs in processes
like:
Xe+ + hv - Xe + Xe+ (45)
and XeC1 can absorb the laser radiation. The available cross sections
of some of the photoabsorption processes at 308 nm radiation are
(Refs 41, 42, 43, 44, and 45):
C12 - 1.7 x 10⁻¹⁹ cm2
C1" - 2.2 x 10⁻¹⁷ cm2
Xe* - 1.4 x 10⁻¹⁷ cm2
Xe+ - 1.6 x 1017 cm2
Note that Cl2 has the smallest cross section listed. C12 is still
considered to be the dominant absorber in typical rare-gas monohalide
lasers due to the typically low species concentrations of Cl', Xe*,
and Xe+. Therefore, it is advantageous to keep the C12 concentrations
as low as possible. It is not wise to lower the Xe*, Xe*, and Xe+
concentrations for they are critical in the formation of XeCl*.
26
The addition of small amounts of H2 to high pressure XeCl laser
discharges has shown to have beneficial effects on the laser's per-
formance, by maintaining the laser's high output power and lifetime.
The basis of adding H2 to the mixture revolves around the reaction of
Eq (26) reproduced below:
2HCl ' H2 + C12
It was hoped that through the addition of H2 , the reaction would be
driven to the left, forming more HCl and depleting the C12 concentra-
tion.
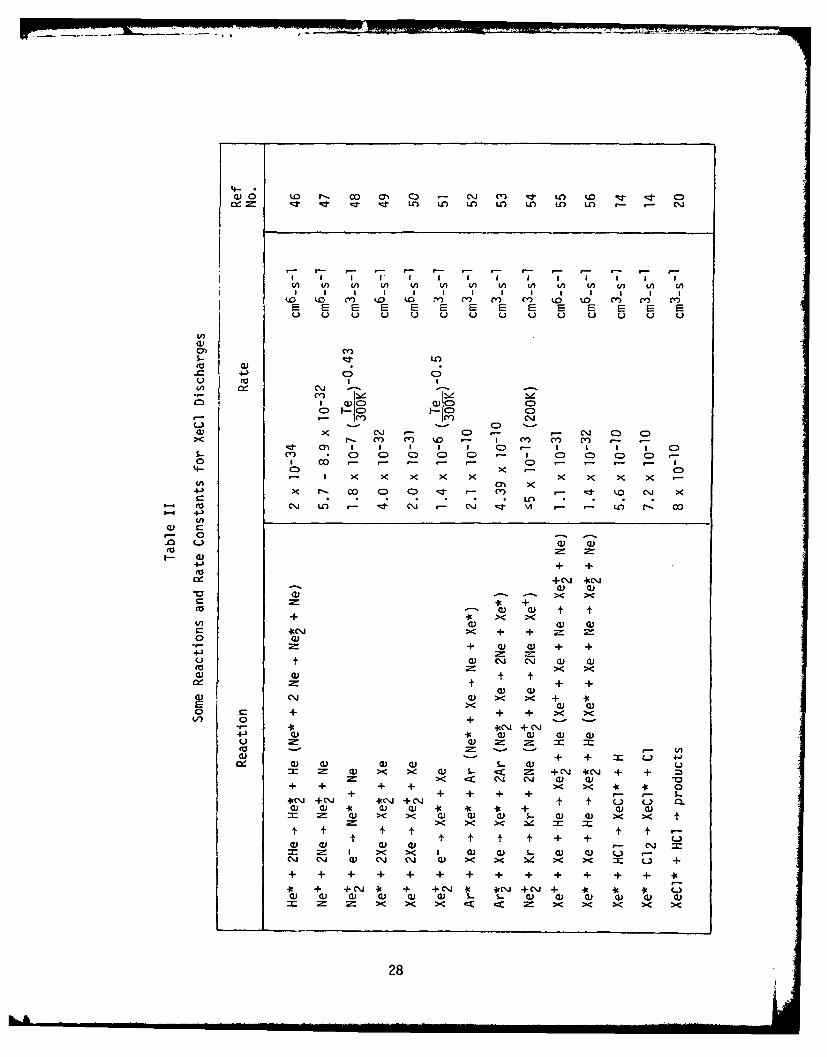
Table llists some of the reactions mentioned in this section with
their rate coefficients. If the rate for a XeCl* laser reaction was
not known or available, a comparable reaction was listed along with the
XeCl* laser reaction it represented. This was done to give the reader
a knowledge of the magnitudes of the different types of reactions.
Hollow Cathode Discharge
The first rare-gas monohalide lasers used an electron beam to
pump the media (Ref 21). Electron beams can supply the large number
of high energy electrons needed to excite the rare-gas ions and meta-
stables at a sufficient rate (the ionization potential and energy of
the first metastable for Xe for example, are 12.1 and 8.4eV respectively
(Ref 57:73))for lasering to occur (Ref 58:1). Electron beams were
also used for the reason that normal glow discharges could not be used
at the high operating pressures of the rare-gas monohalide lasers,
because the discharge would degrade into an arc. Electron beams are
rather complex and expensive devices. Any other discharge system used
27
a)0 tn r- 00 m~ 0~ M qd LA) ko C)-
-;: UO U) U U ) U') U) U-) UO Ur) U )
tD Lo C- 40 4.0 Zv m m Cl) to mA m mI E E E E E 2= E E E E E E 2
0 dii
CU I I
C~) CIC) C
- ,-C 6 LC.J C,o) -c- - - 0 ,- . "
4- 0x .- ) X X X X x )< >( .
0) 0) )x4-> N- 00 CD 0- qr -zi k- ~ J x
to4 C's LA C. C 's c ~ - m. U; - A - C
4-)C
0I- a)
4-) + +
(aa-oa a) U
a ) c) t t+ X'> ><
U)a)a) 0)4'C"' > + +o00
+ 0) a) + +4-) ;
u u)l l a) 0 +t 4- +
w) a)a) c") a) > < + 4E X0) 0)o r + + + X~
1/) 0 + - '
4' 4s + C").4-) a4 ) a) a) 0u a) 2-to =- U)a) '-+ + t i 4-J
0) a) a) 0V S- cucua > aj a) . < = + 4C') *4' + + :3
><C") C") a) a) '+ + + + >< >< 4'k4 0
+ + +- - .4CC'. +C") *CC') -". + C-) f- t0.0) 0)Q ) 0) *' 4' 4 + a) c)
= a) >< >< w) 0) a) L. w) 0) >< X' t
t t + +0) a) a) a) - C"x = I >< >< I a) a) S- (V 0) u -C') C"4 a) C") C") a) >< X~ N4 < >< Liu +
. . + . + . + + + + . . +. 4
4k + + CVJ + +-" + 4'%+"+ it4'4'La) a) 0) 0) 0) 0) S- L a) 0) a) 0) w Q)
X < X< X<>
28
to pump rare-gas monohalide laser media would need to be able to
supply enough high energy electrons to obtain ample excitation rates.
The hollow cathode discharge (HCD) has a highly non-Maxwellian
electron energy distribution (eed). This departure from a Maxwellian
distribution results in an increase in the number of high energy
electrons (Ref 59). Hollow cathode discharges have been used to pump
a helium-fluorine laser (Ref 60) and rare-gas ion lasers (Refs 61,
62, 63, 64, 65, and 66).
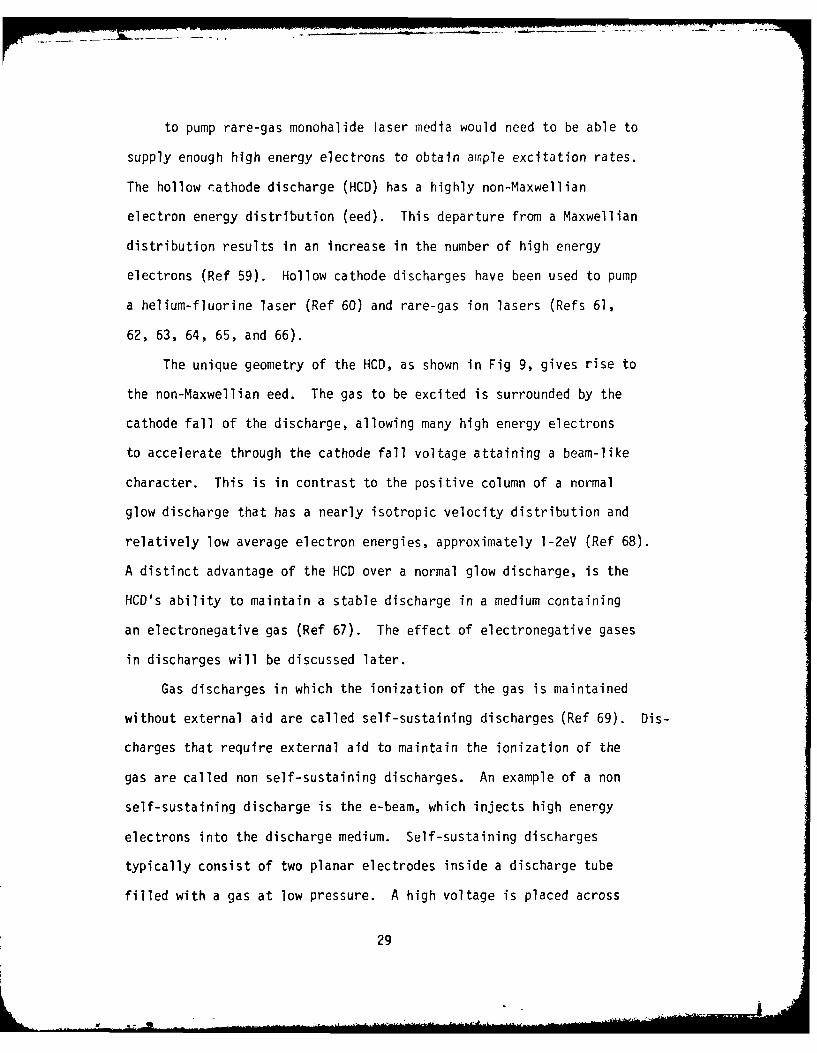
The unique geometry of the HCD, as shown in Fig 9, gives rise to
the non-Maxwellian eed. The gas to be excited is surrounded by the
cathode fall of the discharge, allowing many high energy electrons
to accelerate through the cathode fall voltage attaining a beam-like
character. This is in contrast to the positive column of a normal
glow discharge that has a nearly isotropic velocity distribution and
relatively low average electron energies, approximately 1-2eV (Ref 68).
A distinct advantage of the HCD over a normal glow discharge, is the
HCD's ability to maintain a stable discharge in a medium containing
an electronegative gas (Ref 67). The effect of electronegative gases
in discharges will be discussed later.
Gas discharges in which the ionization of the gas is maintained
without external aid are called self-sustaining discharges (Ref 69). Dis-
charges that require external aid to maintain the ionization of the
gas are called non self-sustaining discharges. An example of a non
self-sustaining discharge is the e-beam, which injects high energy
electrons into the discharge medium. Self-sustaining discharges
typically consist of two planar electrodes inside a discharge tube
filled with a gas at low pressure. A high voltage is placed across
29
Anode Electrode
Cathode - -fY
Cathode Fall
Block
Fig 9. Characteristics of HCD used in Thesis Experiment (Ref 67)
the electrodes that accelerates a free electron to a high enough
energy that the electron can ionize a gas molecule and cause an
avalanche of electrons to the anode,making the gas conductive. There
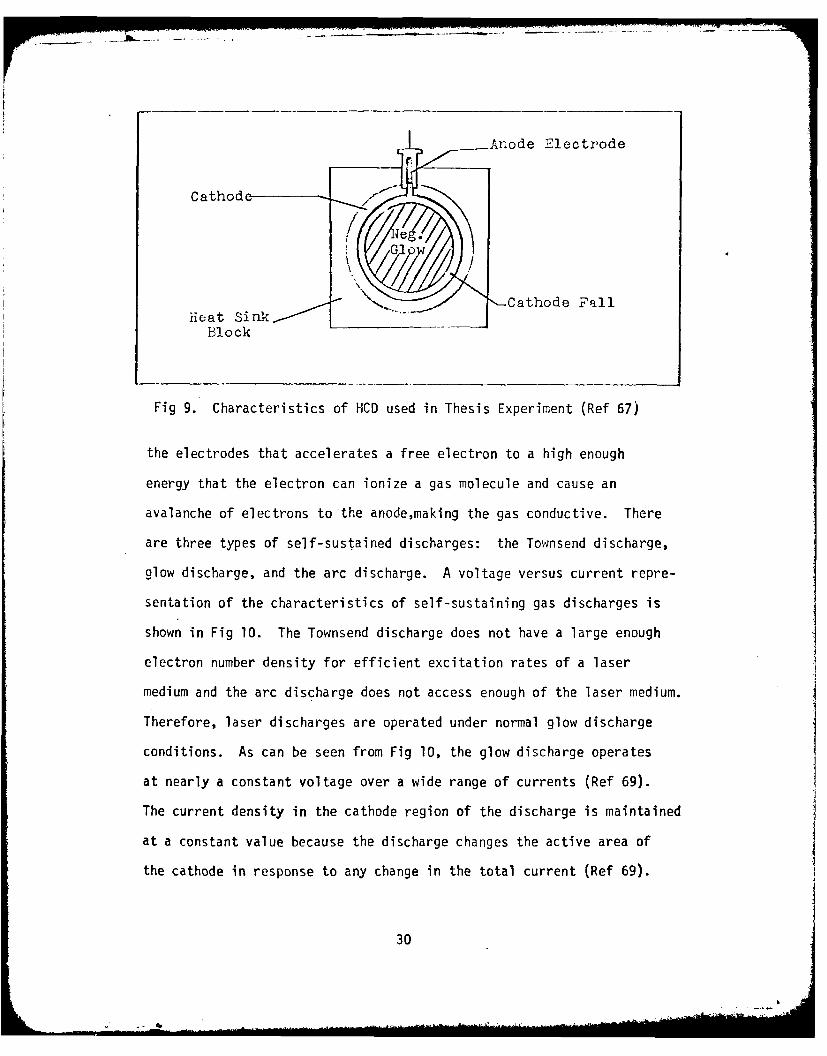
are three types of self-sustained discharges: the Townsend discharge,
glow discharge, and the arc discharge. A voltage versus current repre-
sentation of the characteristics of self-sustaining gas discharges is
shown in Fig 10. The Townsend discharge does not have a large enough
electron number density for efficient excitation rates of a laser
medium and the arc discharge does not access enough of the laser medium.
Therefore, laser discharges are operated under normal glow discharge
conditions. As can be seen from Fig 10, the glow discharge operates
at nearly a constant voltage over a wide range of currents (Ref 69).
The current density in the cathode region of the discharge is maintained
at a constant value because the discharge changes the active area of
the cathode in response to any change in the total current (Ref 69).
30
Id !) Xi)000 F-4 0 - _4 C41
0 -4bo_A 3° w4 0
E09 l - ~ - 10 -3 0 " 0
CC_)
'CO
00
-_ __ ___ rmn_ u _
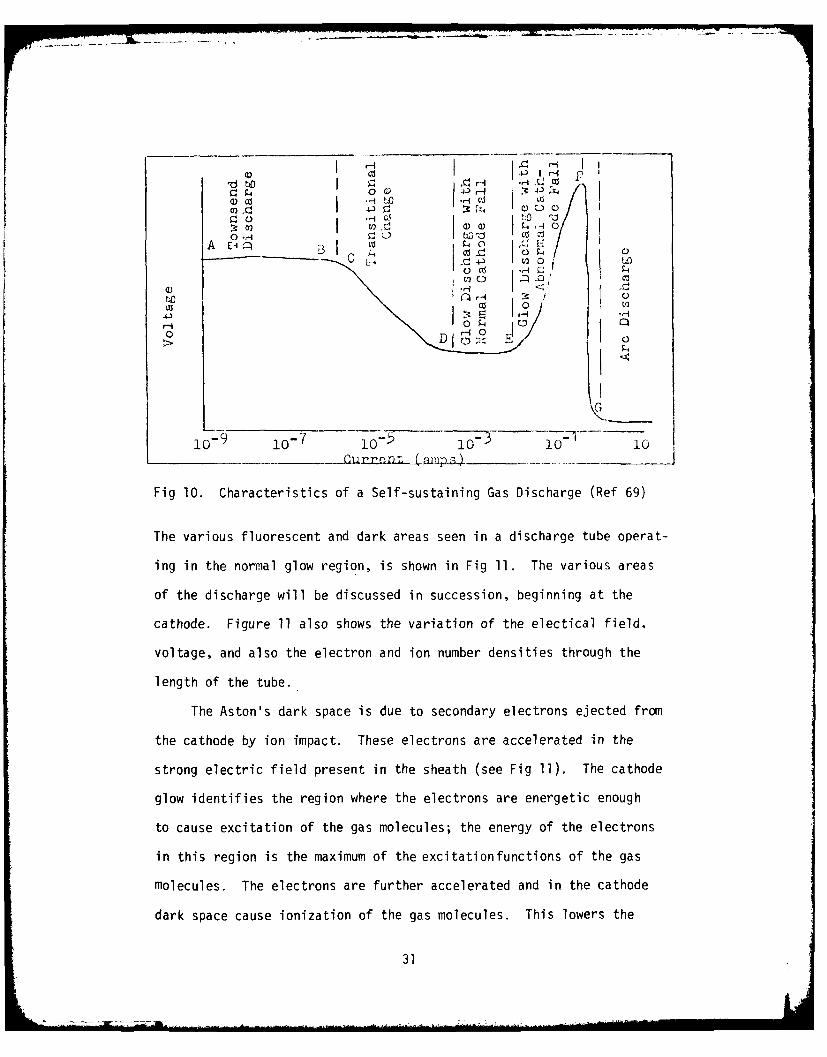
Fig 10. Characteristics of a Self-sustaining Gas Discharge (Ref 69)
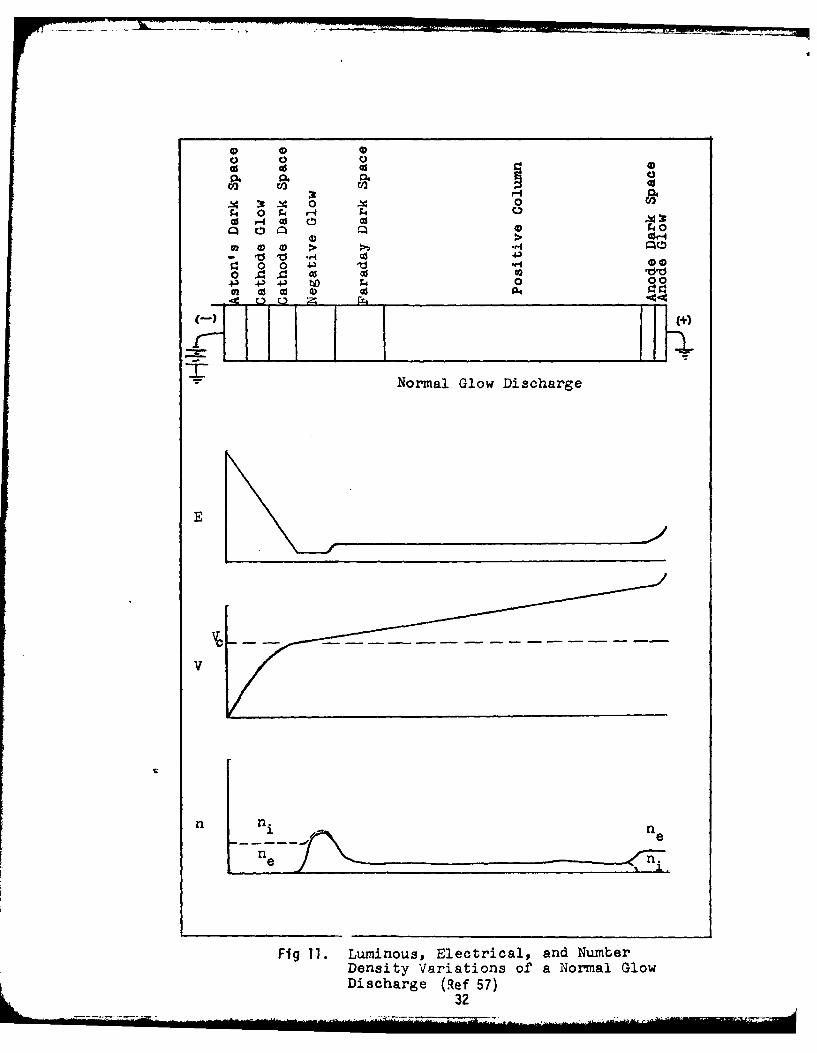
The various fluorescent and dark areas seen in a discharge tube operat-
ing in the normal glow region, is shown in Fig 11. The various areas
of the discharge will be discussed in succession, beginning at the
cathode. Figure 11 also shows the variation of the electical field.
voltage, and also the electron and ion number densities through the
length of the tube.
The Aston's dark space is due to secondary electrons ejected from
the cathode by ion impact. These electrons are accelerated in the
strong electric field present in the sheath (see Fig 11l). The cathode
glow identifies the region where the electrons are energetic enough
to cause excitation of the gas molecules; the energy of the electrons
in this region is the maximum of the excitationfunctions of the gas
molecules. The electrons are further accelerated and in the cathode
dark space cause ionization of the gas molecules. This lowers the
31
0 0 -1o4 004r4 t
CZ4>O CO CO
0 >~ 0 . -0 C:O~10 004) C
0: 0~ 4- "q0 aSH O dU3lc
43 4)1 W- bo 0 00-. 4 U~ 0 ;2:
Normal Glow Discharge
E
C---
n ne
Fig 11. Luminous, Electrical, and NumberDensity Variations of a Normal GlowDischarge (R~ef 57)
32
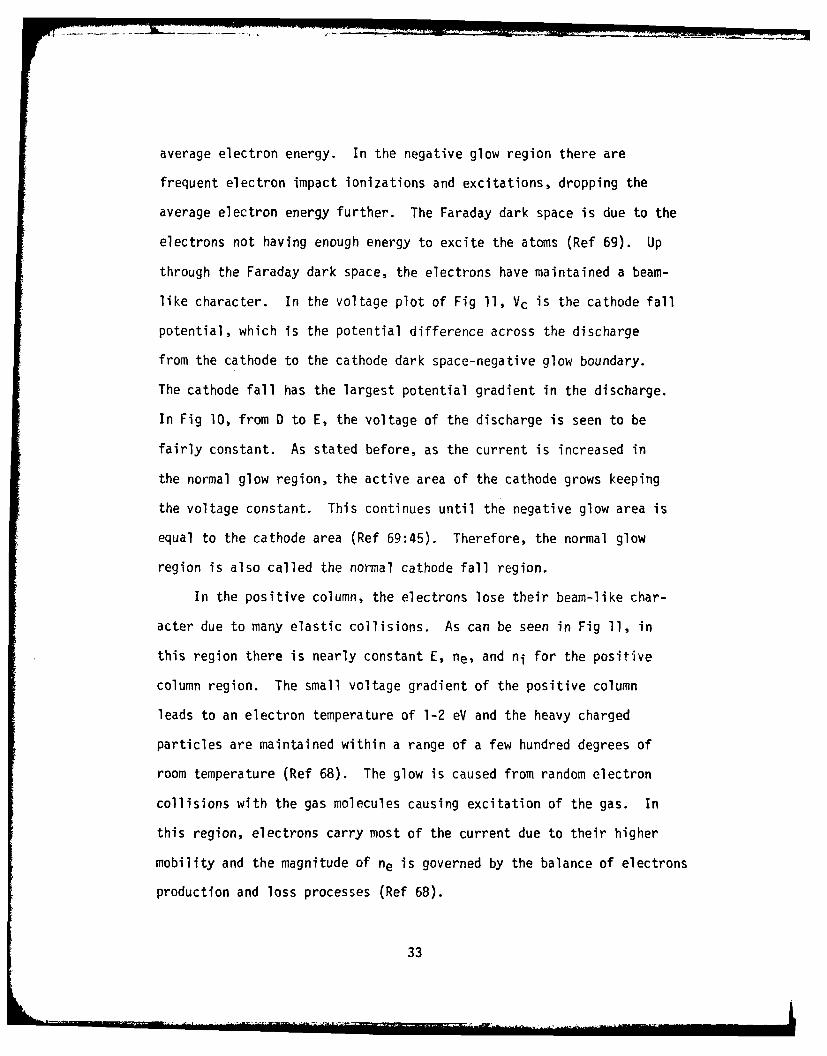
average electron energy. In the negative glow region there are
frequent electron impact ionizations and excitations, dropping the
average electron energy further. The Faraday dark space is due to the
electrons not having enough energy to excite the atoms (Ref 69). Up
through the Faraday dark space, the electrons have maintained a beam-
like character. In the voltage plot of Fig 11, Vc is the cathode fall
potential, which is the potential difference across the discharge
from the cathode to the cathode dark space-negative glow boundary.
The cathode fall has the largest potential gradient in the discharge.
In Fig 10, from D to E, the voltage of the discharge is seen to be
fairly constant. As stated before, as the current is increased in
the normal glow region, the active area of the cathode grows keeping
the voltage constant. This continues until the negative glow area is
equal to the cathode area (Ref 69:45). Therefore, the normal glow
region is also called the normal cathode fall region.
In the positive column, the electrons lose their beam-like char-
acter due to many elastic collisions. As can be seen in Fig 11, in
this region there is nearly constant E, ne, and ni for the positive
column region. The small voltage gradient of the positive column
leads to an electron temperature of 1-2 eV and the heavy charged
particles are maintained within a range of a few hundred degrees of
room temperature (Ref 68). The glow is caused from random electron
collisions with the gas molecules causing excitation of the gas. In
this region, electrons carry most of the current due to their higher
mobility and the magnitude of ne is governed by the balance of electrons
production and loss processes (Ref 68).
33
In the anode dark space, the electron velocity distribution assumes
a beam-like character again due to their acceleration ir. the field of
the anode. In the anode glow region, the electrons have gathered
enough energy to excite and ionize the gas just before striking the
anode. With this review of self-sustained discharges completed, a dis-
cussion of the hollow cathode discharge, which is also a self-
sustained discharge, will be presented and contrasted with the positive
column discharge.
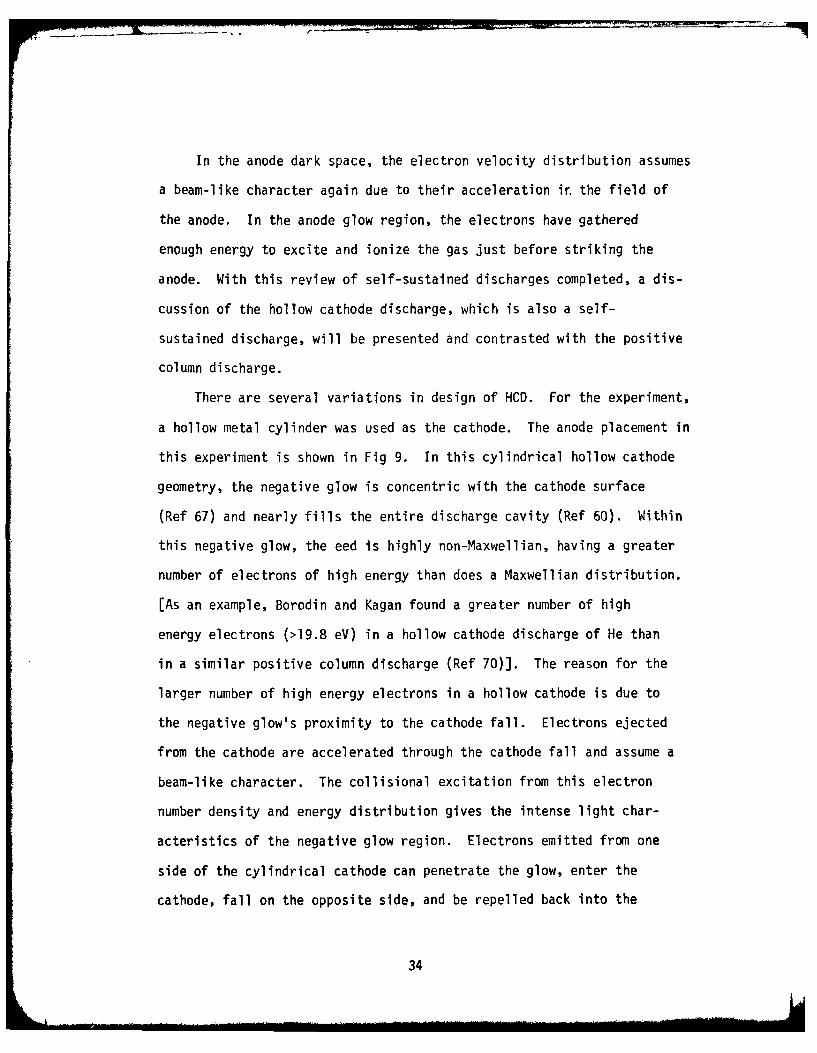
There are several variations in design of HCO. For the experiment,
a hollow metal cylinder was used as the cathode. The anode placement in
this experiment is shown in Fig 9. In this cylindrical hollow cathode
geometry, the negative glow is concentric with the cathode surface
(Ref 67) and nearly fills the entire discharge cavity (Ref 60). Within
this negative glow, the eed is highly non-Maxwellian, having a greater
number of electrons of high energy than does a Maxwellian distribution.
[As an example, Borodin and Kagan found a greater number of high
energy electrons (>19.8 eV) in a hollow cathode discharge of He than
in a similar positive column discharge (Ref 70)]. The reason for the
larger number of high energy electrons in a hollow cathode is due to
the negative glow's proximity to the cathode fall. Electrons ejected
from the cathode are accelerated through the cathode fall and assume a
beam-like character. The collisional excitation from this electron
number density and energy distribution gives the intense light char-
acteristics of the negative glow region. Electrons emitted from one
side of the cylindrical cathode can penetrate the glow, enter the
cathode, fall on the opposite side, and be repelled back into the
34
glow (Ref 59). Therefore, there is also increased ionization and excita-
tion due to the oscillatory motion of the electrons within the tube.
An attempt to determine the actual electron distribution of a
hollow cathode was made by P. Gill and C. E. Webb (Ref 59). They
measured the electron energy distribution in the negative glow of a
planar cathode abnormal glow discharge in He. The abnormal glow,
while not an exact model of a hollow cathode discharge, still reveals
the important features of both the hollow cathode and abnormal glow
discharge. They used a differentially pumped retarding-field analyzer
(Ref 59). Electrons from the negative glow would effuse through a
sampling orifice in the anode into a low-pressure section that was
continuously evacuated (Ref 59). For their experiment, the current,
i, collected at any retaring potential V, is given by (Ref 71):
i = C ne iv f (V)VI/2 dV (46)
where
C = constant determined by the geometry of the orifice andscreen, and the charge and mass of an electron.
ne = the electron number density in the glow region sampled
f(V)dV = normalized electron energy distribution giving the fractionof electrons with energies between eV and e(V + dV).
If this expression is differentiated with respect to voltage, a quantity
related to the eed can be found, i.e.
ld 1 = C ne f(V)V I/2 (47)
The eed is usually expressed as f(c) , where c is the energy of the
electron in eV.
35
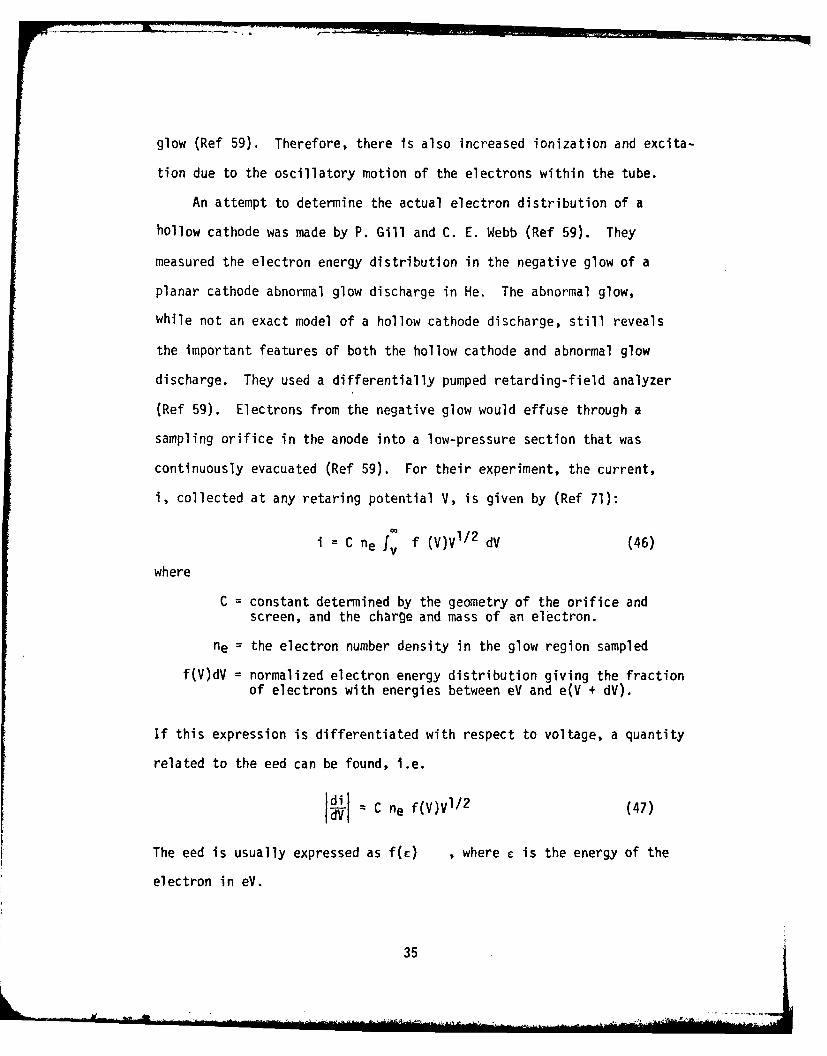
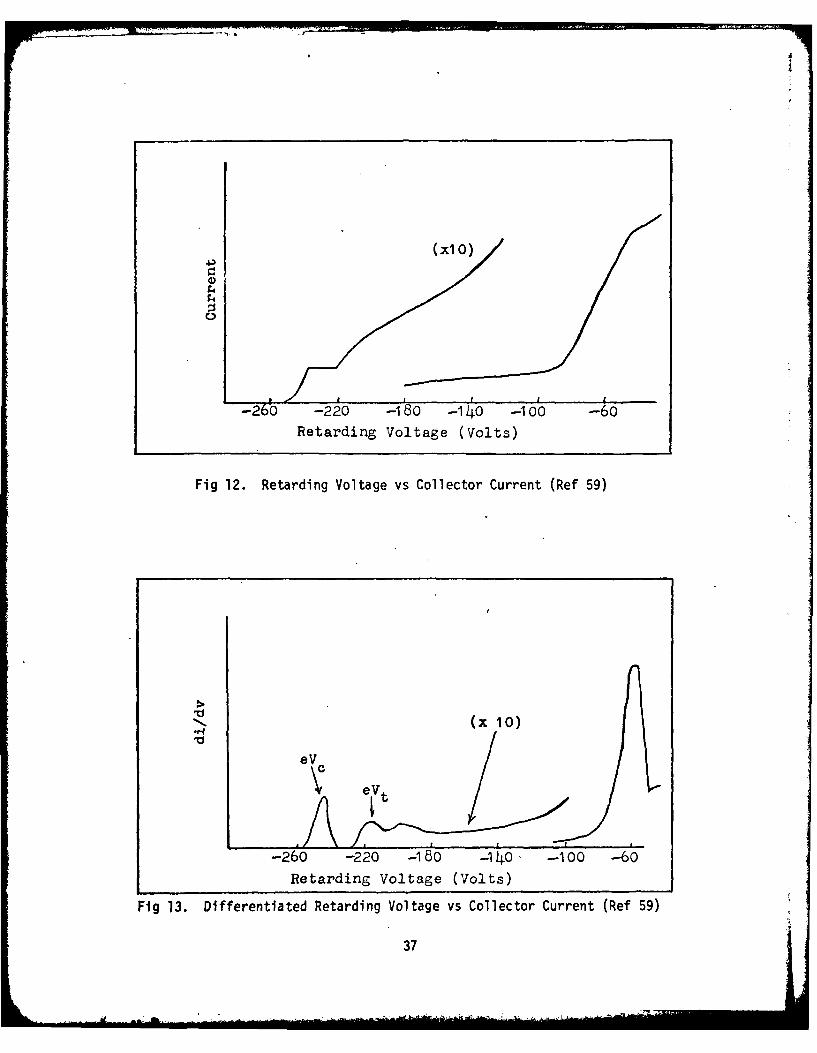
A v-i (retarding voltage versus collector :urrent) plot from the
Gill and Webb experiment is shown in Fig 12 for a pressure of 10 Torr,
3.5 mA discharge current, and an anode-cathode separation of 1.5 mm.
Figure 13 shows the differentiated result. Note the presence of groups
of high energy electrons. The plot shows three major components of the
distribution:
1. At the full cathode fall energy of eVc, there is an electron"Beam" component. The electrons in this component as a fraction of thetotal distribution were measured to be -0.1-0.03, at a pd value of-1.57 Torr cm where p is the pressure of the discharge and d is thedistance from the cathode.
2. There is a small peak in the distribution at eVtafter a smallgap separating it from the "beam" component. This peak corresponds toelectrons which have undergone one inelastic collision. The gapbetween eVc and eVt is approximately equal to the first excitationpotential of the gas which is 20 eV for He. There is an appreciabletail of high energy electrons from eVt down to low energies, -26.4 eV.Graphical estimates yield values of 0.3 and 0.45 of the total numberof electrons lie in this high energy tail. These values correspond topd values of 1.5 Torr cm (Vc = 190V) and -2.5 Torr cm (Vc = 50OV) re-spectively.
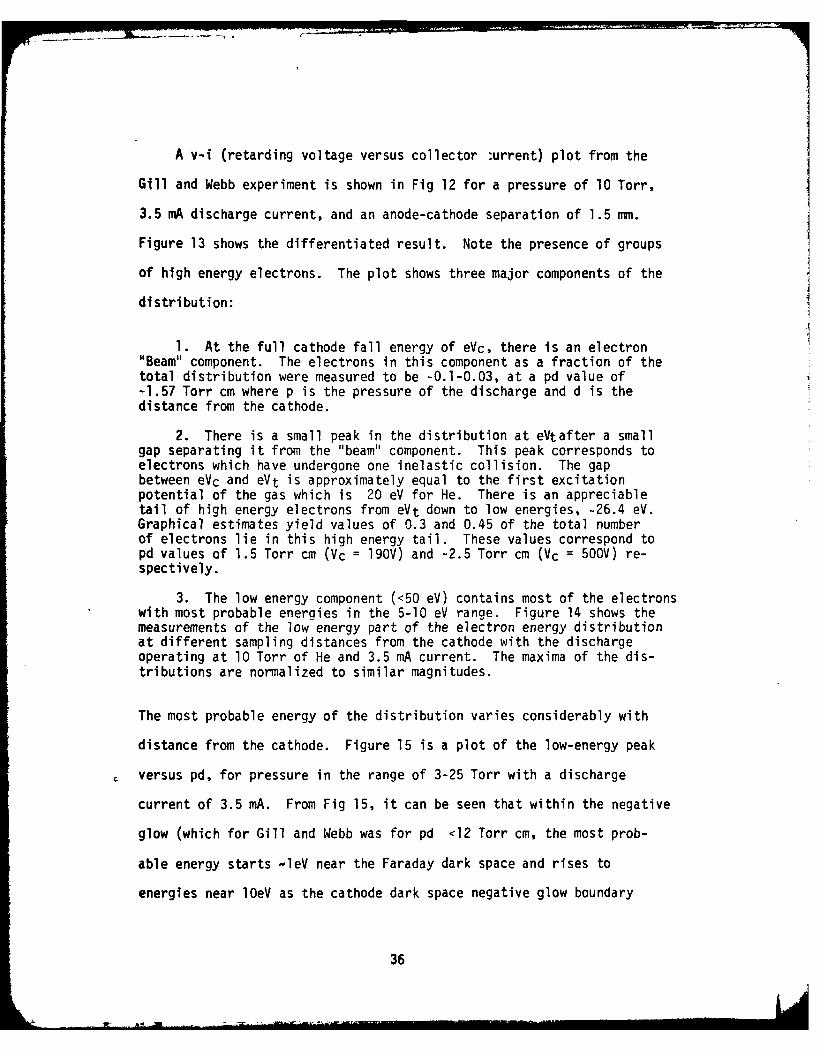
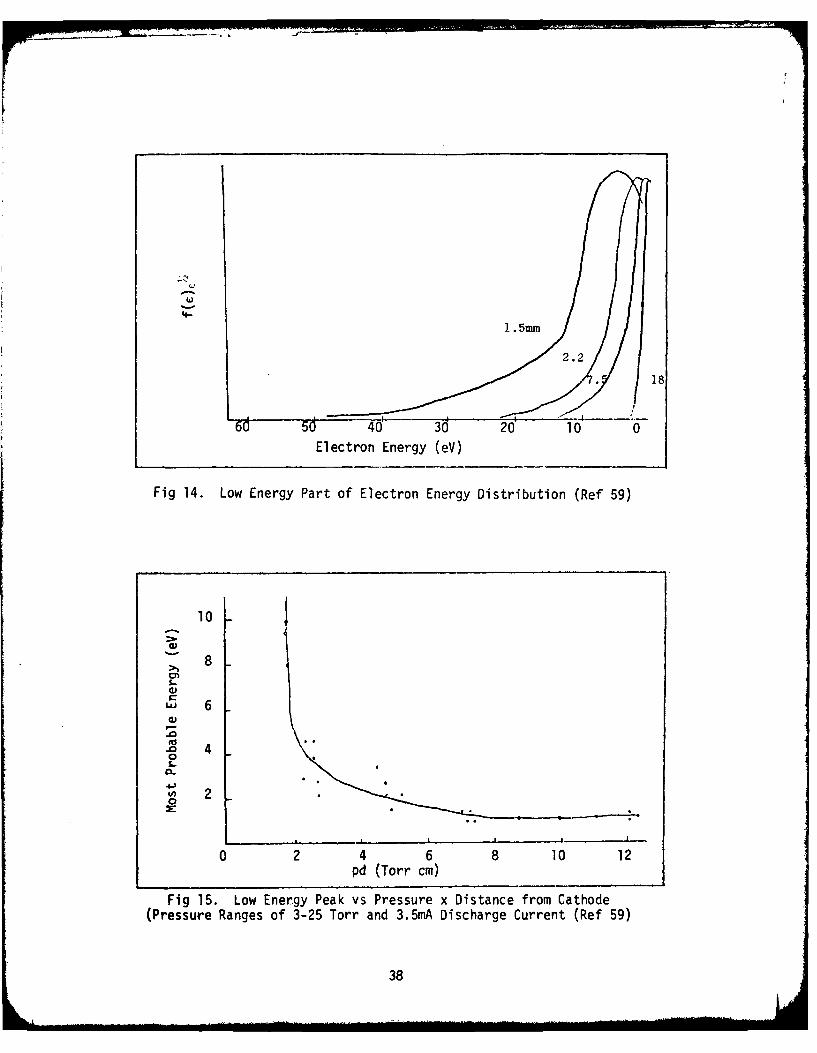
3. The low energy component (<50 eV) contains most of the electronswith most probable energies in the 5-10 eV range. Figure 14 shows themeasurements of the low energy part of the electron energy distributionat different sampling distances from the cathode with the dischargeoperating at 10 Torr of He and 3.5 mA current. The maxima of the dis-tributions are normalized to similar magnitudes.
The most probable energy of the distribution varies considerably with
distance from the cathode. Figure 15 is a plot of the low-energy peak
versus pd, for pressure in the range of 3-25 Torr with a discharge
current of 3.5 mA. From Fig 15, it can be seen that within the negative
glow (which for Gill and Webb was for pd <12 Torr cm, the most prob-
able energy starts -leV near the Faraday dark space and rises to
energies near lOeV as the cathode dark space negative glow boundary
36
(xl 0)
-260 -220 -180 -140. -100 -60Retarding Voltage (Volts)
Fig 12. Retarding Voltage vs Collector Current (Ref 59)
N(x 10)
eV
S eVt
-260 -220 -180 -1I40 " -100 --60Retarding Voltage (Volts)
Fig 13. Differentiated Retarding Voltage vs Collector Current (Ref 59)
37
64-
1 . 5mm
2.2
18
60 3002 100
Electron Energy (eV)
Fig 14. Low Energy Part of Electron Energy Distribution (Ref 59)
10
>1 8
wi 6
-o 40
0-
0
0 2 4 6 8 10 12pd (Torr cm)
Fig 15. Low Energy Peak vs Pressure x Distance from Cathode(Pressure Ranges of 3-25 Torr and 3.5mA Discharge Current (Ref 59)
38
is approached. The cathode dark space negative glow boundary was
further investigated by Gill and Webb.
The results of Gill and Webb show why the HCD is capable of pro-
viding the large number of high energy electrons needed for excitation
of rare-gas monohalide laser media. A further advantage of the HCD is
its ability to maintain a stable discharge in electronegative gases,
such as C12 and HCl (Ref 67). Positive column discharges in electro-
negative gases, in contrast, result in the occurrence of a wide variety
of instabilities such as striations, streamers, and thermal arcing
(Ref 67). In the negative glow region of a HCD, the ionization of
neutrals is due to high energy elecLrons from the cathode fall. Also,
there is weak electric field strengths in the negative glow (see Fig 11)
and since ionization is by fast electrons, the stability of the dis-
charge is not determined by the local field (Ref 67). Thus, electro-
negative gases can be used in large percentages in the hollow cathode
discharge with the discharge remaining stable (Ref 67).
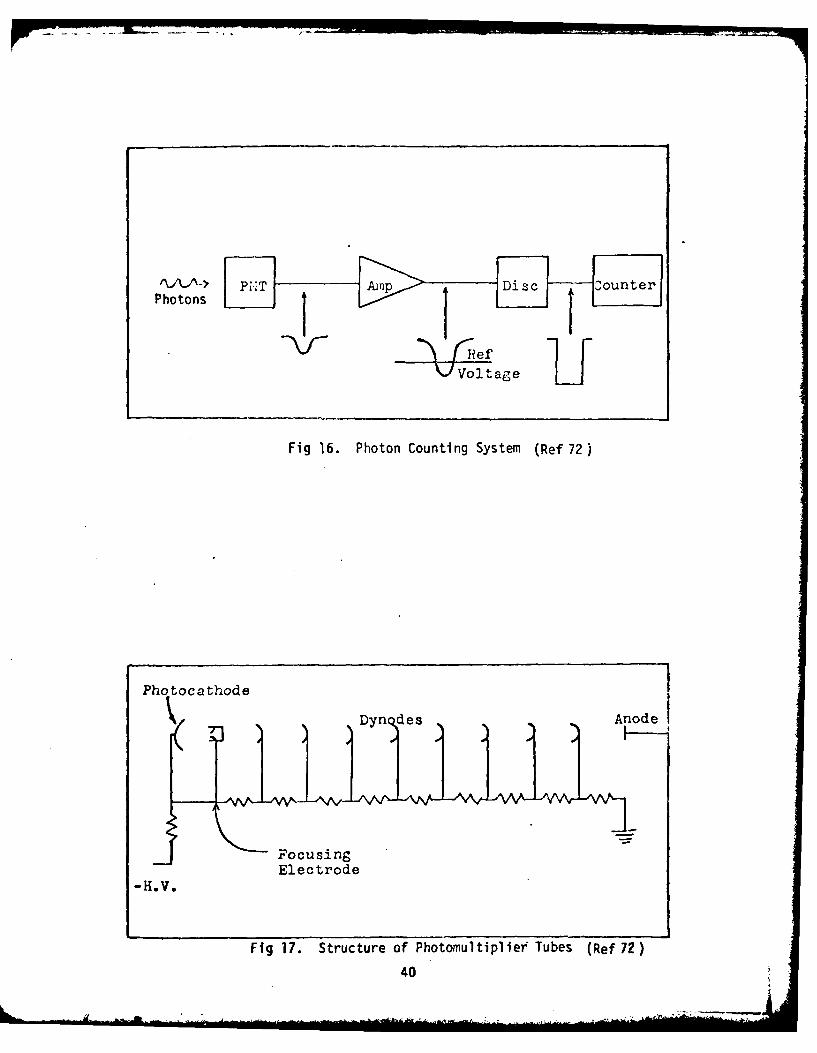
Photon Counting
A typical photon counting system is shown in Fig 16. The system
consists of a photomultiplier tube, an amplifier, a discriminator, and
a counter. The job of the photomultiplier is to convert the radiant
energy into electrical energy and amplify it. The photomultiplier
tube consists of two main sections, the photocathode and a series of
dynodes (see Fig 17). Photons incident on the photocathode may cause
the ejection of photoelectrons out of the photocathode and the electrons
are accelerated by a potential difference through the dynode chain.
The ratio of the number of photoelectrons emitted per incident photon
39
PII An 'Disc - ounterPhotons
eU
Fig 16. Photon Counting System (Ref 72)
Photocathode
FocusingElectrode
-H.V.
Fig 17. Structure of Photomul tipl iee Tubes (Ref 72)
40
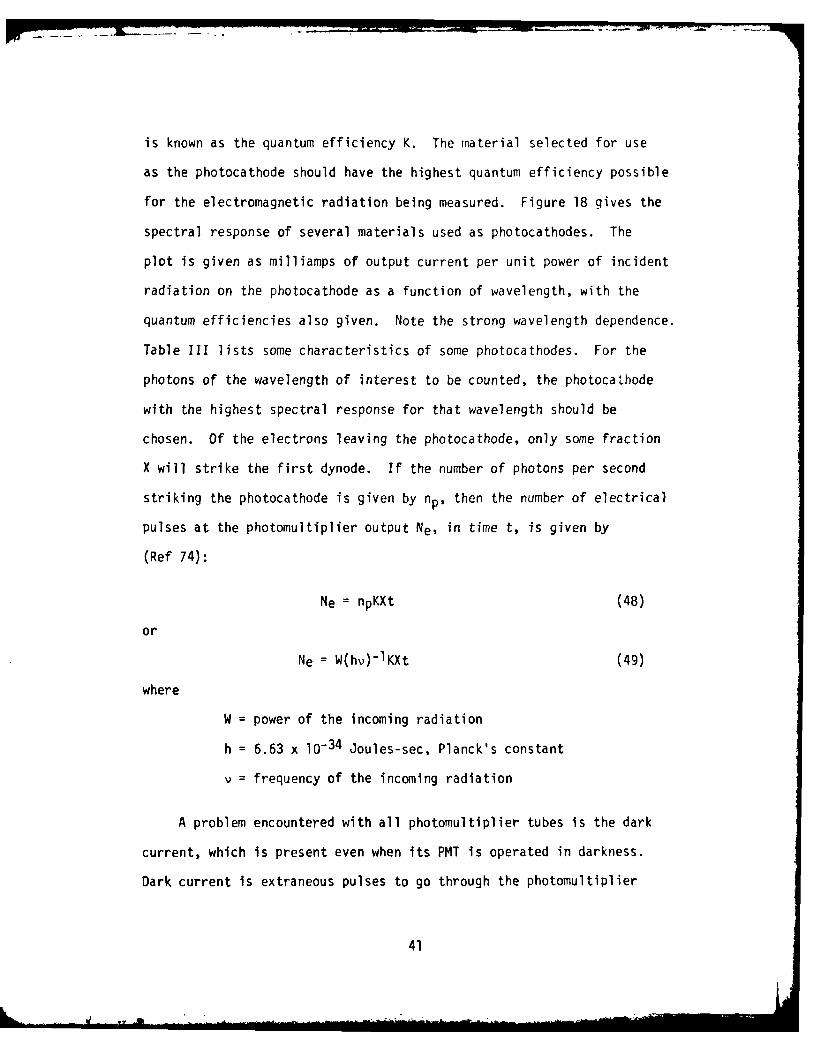
is known as the quantum efficiency K. The material selected for use
as the photocathode should have the highest quantum efficiency possible
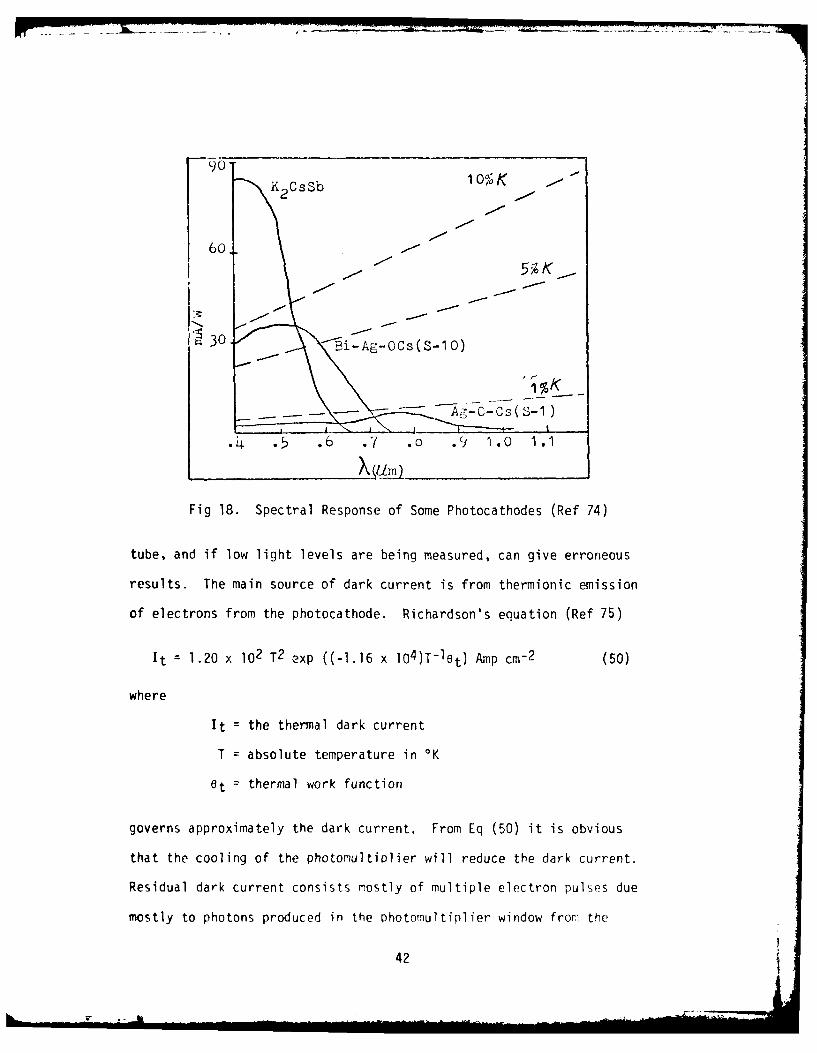
for the electromagnetic radiation being measured. Figure 18 gives the
spectral response of several materials used as photocathodes. The
plot is given as milliamps of output current per unit power of incident
radiation on the photocathode as a function of wavelength, with the
quantum efficiencies also given. Note the strong wavelength dependence.
Table III lists some characteristics of some photocathodes. For the
photons of the wavelength of interest to be counted, the photocathode
with the highest spectral response for that wavelength should be
chosen. Of the electrons leaving the photocathode, only some fraction
X will strike the first dynode. If the number of photons per second
striking the photocathode is given by np, then the number of electrical
pulses at the photomultiplier output Ne, in time t, is given by
(Ref 74):
Ne = npKXt (48)
or
Ne = W(hv)-IKXt (49)
where
W = power of the incoming radiation
h = 6.63 x 1O-34 Joules-sec, Planck's constant
v = frequency of the incoming radiation
A problem encountered with all photomultiplier tubes is the dark
current, which is present even when its PMT is operated in darkness.
Dark current is extraneous pulses to go through the photomultiplier
41
90 " T
go- K2 CsSb 10%K
60..
K5 K
0 30P o-Ag-OCs(S-1o)
~ C, --- - -CS( S- 1)
4 . * 6 .7 .6 .9 1.0 1.1
Fig 18. Spectral Response of Some Photocathodes (Ref 74)
tube, and if low light levels are being measured, can give erroneous
results. The main source of dark current is from thermionic emission
of electrons from the photocathode. Richardson's equation (Ref 75)
It = 1.20 x 10² T2 exp ((-1.16 x 10⁴)T-let) Amp cm- 2 (50)
where
It = the thermal dark current
T = absolute temperature in 'K
et = thermal work function
governs approximately the dark current. From Eq (50) it is obvious
that the cooling of the photomultiplier will reduce the dark current.
Residual dark current consists mostly of multiple electron pulses due
mostly to photons produced in the photoITultiplier window frori the
42
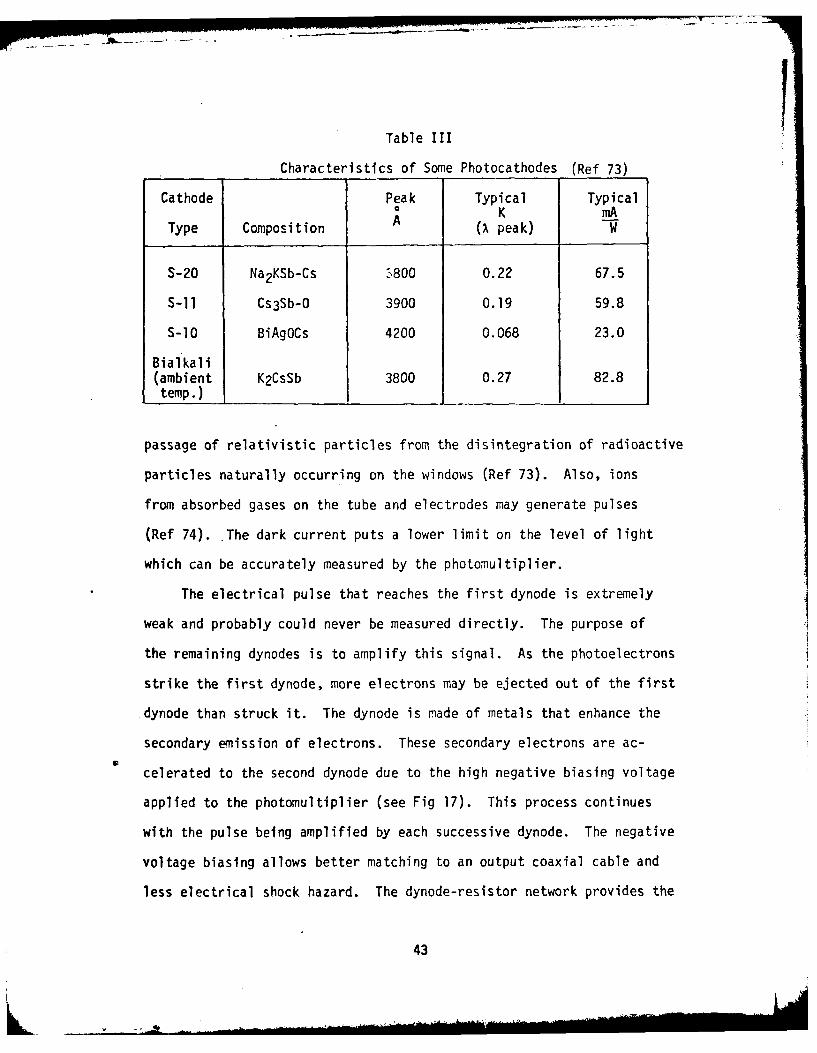
Table III
Characteristics of Some Photocathodes (Ref 73)
Cathode Peak Typical TypicalK mA
Type Composition A (X peak) W
S-20 Na2KSb-Cs 3800 0.22 67.5
S-1i Cs3Sb-0 3900 0.19 59.8
S-10 BiAgOCs 4200 0.068 23.0
Bialkali(ambient K2CsSb 3800 0.27 82.8temp.)
passage of relativistic particles from the disintegration of radioactive
particles naturally occurring on the windows (Ref 73). Also, ions
from absorbed gases on the tube and electrodes may generate pulses
(Ref 74). The dark current puts a lower limit on the level of light
which can be accurately measured by the photomultiplier.
The electrical pulse that reaches the first dynode is extremely
weak and probably could never be measured directly. The purpose of
the remaining dynodes is to amplify this signal. As the photoelectrons
strike the first dynode, more electrons may be ejected out of the first
dynode than struck it. The dynode is made of metals that enhance the
secondary emission of electrons. These secondary electrons are ac-
celerated to the second dynode due to the high negative biasing voltage
applied to the photomultiplier (see Fig 17). This process continues
with the pulse being amplified by each successive dynode. The negative
voltage biasing allows better matching to an output coaxial cable and
less electrical shock hazard. The dynode-resistor network provides the
43
correct accelerating potentials. The proper voltage should be chosen
such as to maximize the pulse amplitude, but not to the point of in-
creasing thermal heating, thereby creating more dark current. The
electrons from thermal heating can cause erroneous counts and poor
signal to noise ratios. Due to the slightly varying paths of the
individual electrons through the dynode chain, they will have differing
transit times. The varying transit times will cause the electrical
pulse to have a finite width. For typical photomultipliers, the full
width at half maximum (FWHM) of the pulse varies from 5-20 ns (Ref 72).
The total gain G for the photomultiplier is given by (Ref 75)
G = X (g6)n (51)
where
X = fraction of photoelectrons emitted from photocathodethat strike the first dynode
g = the transfer efficiency of electrons between dynodes
6 = average secondary emission coefficient of the dynodes
n = the number of dynodes
The pulse, after being amplified by the dynode chain, leaves the
anode of the photomultiplier and goes to the amplifier (see Fig 16).
The amplifier amplifies the signal a specific amount and sends it to
the discriminator. The discriminator compares the peak value of the
pulse to a reference voltage. If the pulse peak is greater than the
reference voltage, the discriminator puts out a standard pulse to the
counter to be counted. If the peak of the pulse from the photo-
multiplier is less than the reference voltage, the discriminator sends
no pulse to the counter. The reference voltage is set so as to keep
tr dark current counts as low as possible.
44
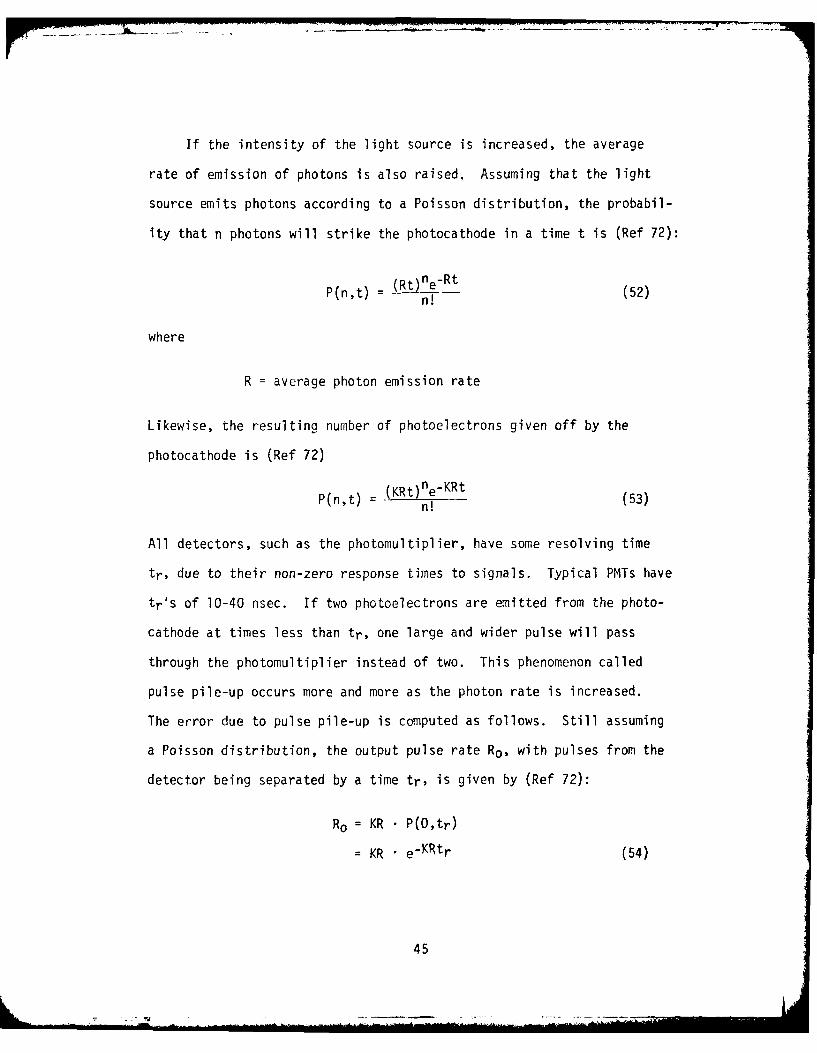
If the intensity of the light source is increased, the average
rate of emission of photons is also raised. Assuming that the light
source emits photons according to a Poisson distribution, the probabil-
ity that n photons will strike the photocathode in a time t is (Ref 72):
P(n,t) = (Rt)ne-Rt (52)
where
R = average photon emission rate
Likewise, the resulting number of photoelectrons given off by the
photocathode is (Ref 72)
P(n,t) = (KRt)ne-KRt (53)
n!
All detectors, such as the photomultiplier, have some resolving time
tr, due to their non-zero response times to signals. Typical PMTs have
tr's of 10-40 nsec. If two photoelectrons are emitted from the photo-
cathode at times less than tr, one large and wider pulse will pass
through the photomultiplier instead of two. This phenomenon called
pulse pile-up occurs more and more as the photon rate is increased.
The error due to pulse pile-up is computed as follows. Still assuming
a Poisson distribution, the output pulse rate Ro, with pulses from the
detector being separated by a time tr, is given by (Ref 72):
Ro = KR P(O,tr)
= KR e-KRtr (54)
45
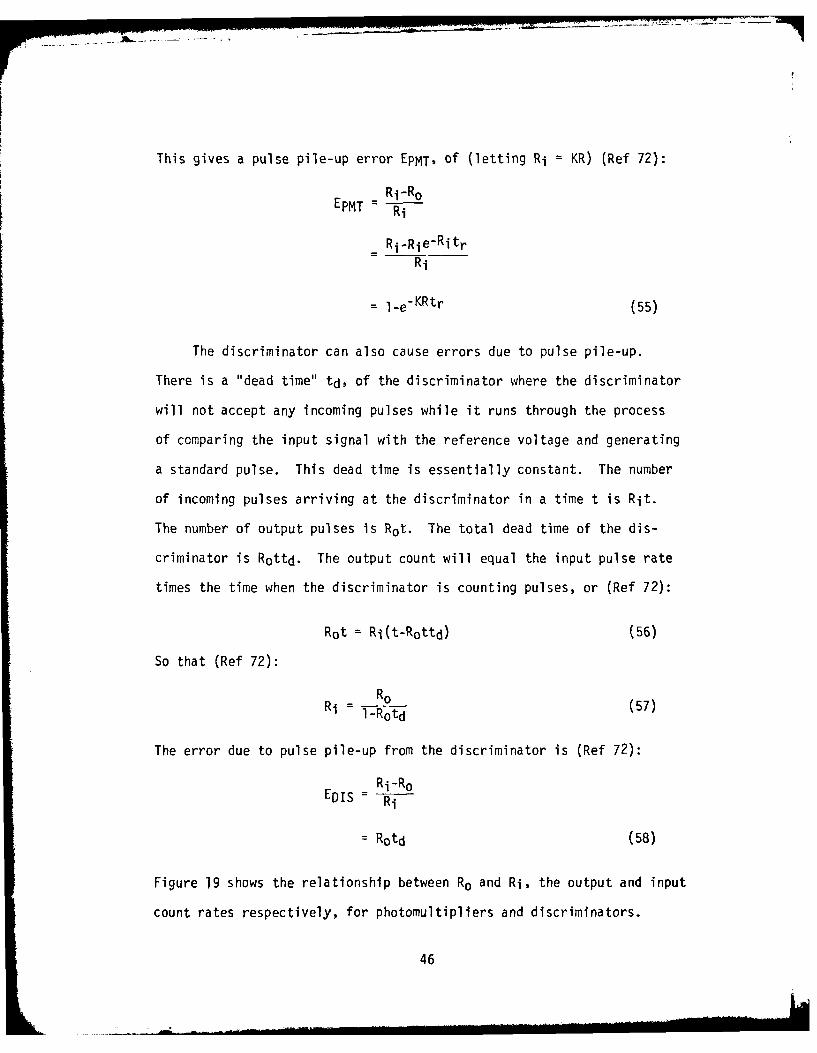
This gives a pulse pile-up error EPMT, of (letting Ri KR) (Ref 72):
Ri-Ro
EPMTRi
Ri-Rie-RitrRi
-le-KRtr (55)
The discriminator can also cause errors due to pulse pile-up.
There is a "dead time" td, of the discriminator where the discriminator
will not accept any incoming pulses while it runs through the process
of comparing the input signal with the reference voltage and generating
a standard pulse, This dead time is essentially constant. The number
of incoming pulses arriving at the discriminator in a time t is Rit.
The number of output pulses is Rot. The total dead time of the dis-
criminator is Rottd. The output count will equal the input pulse rate
times the time when the discriminator is counting pulses, or (Ref 72):
Rot Ri(t-Rottd) (56)
So that (Ref 72):
Ri Ro (57)i- lRotd
The error due to pulse pile-up from the discriminator is (Ref 72):
Ri-RoEDIS = Ri
= Rotd (58)
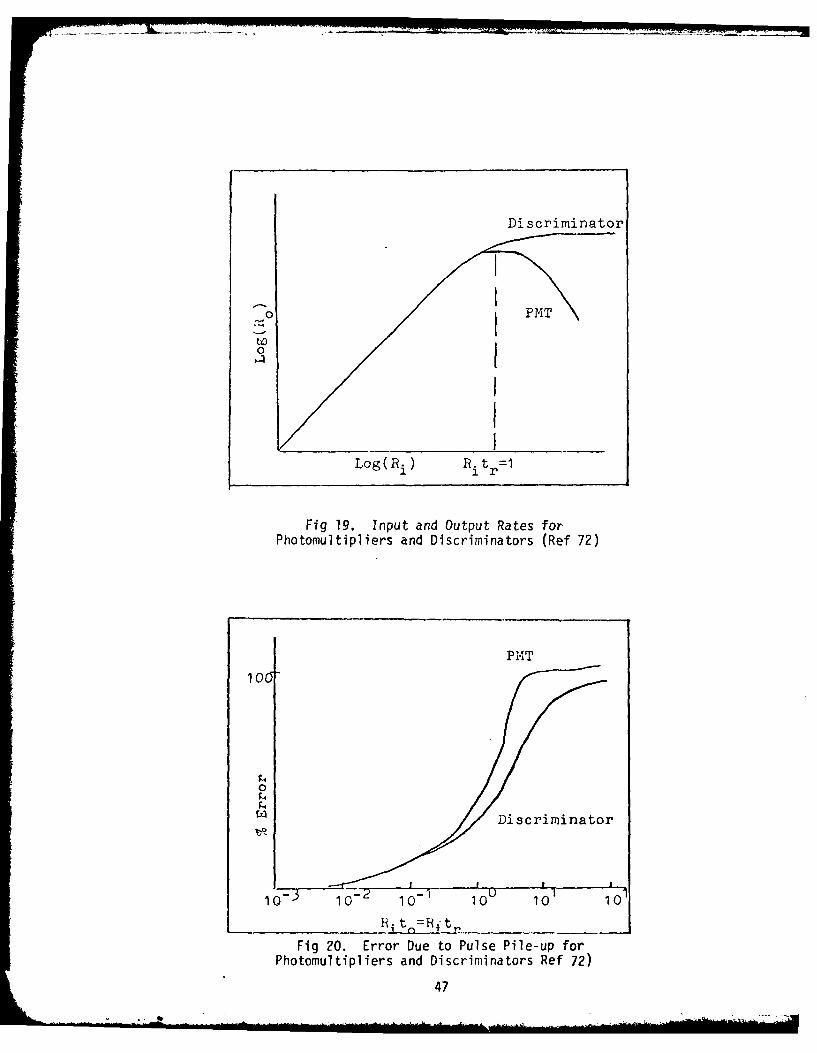
Figure 19 shows the relationship between Ro and Ri, the output and input
count rates respectively, for photomultipliers and discriminators.
46
Di scriminator
0PM
to0
Log(R.) R it =1
Fig 19. Input and Output Rates for-Photomultipliers and Discriminators (Ref 72)
PMT
10(5
0
Discrimiinator
Fig 20. Error Due to Pulse Pile-up forPhotomultipliers and Discriminators Ref 72)
47
Figure 20 shows the percentage of error due to pulse pile-up for photo-
multipliers and discriminators. C
Even if conditions are such that the errors just discussed are
small, a fundamental uncertainty exists in the counting of photons,
due to the statistical and discrete nature of photons and electrons.
Assuming the distribution of photoelectrons given by Eq (53), the
average number of photoelectrons, N, emitted in a time t, is given by:
N = KRt (59)
The noise or uncertainty in N is given by a, the standard deviation
of the distribution which is:
(60)
Neglecting thermionic emission and pulse pile-up errors, the signal
to noise ratio for a photomultiplier is:
SNR = KRt
= -4 (61)
48
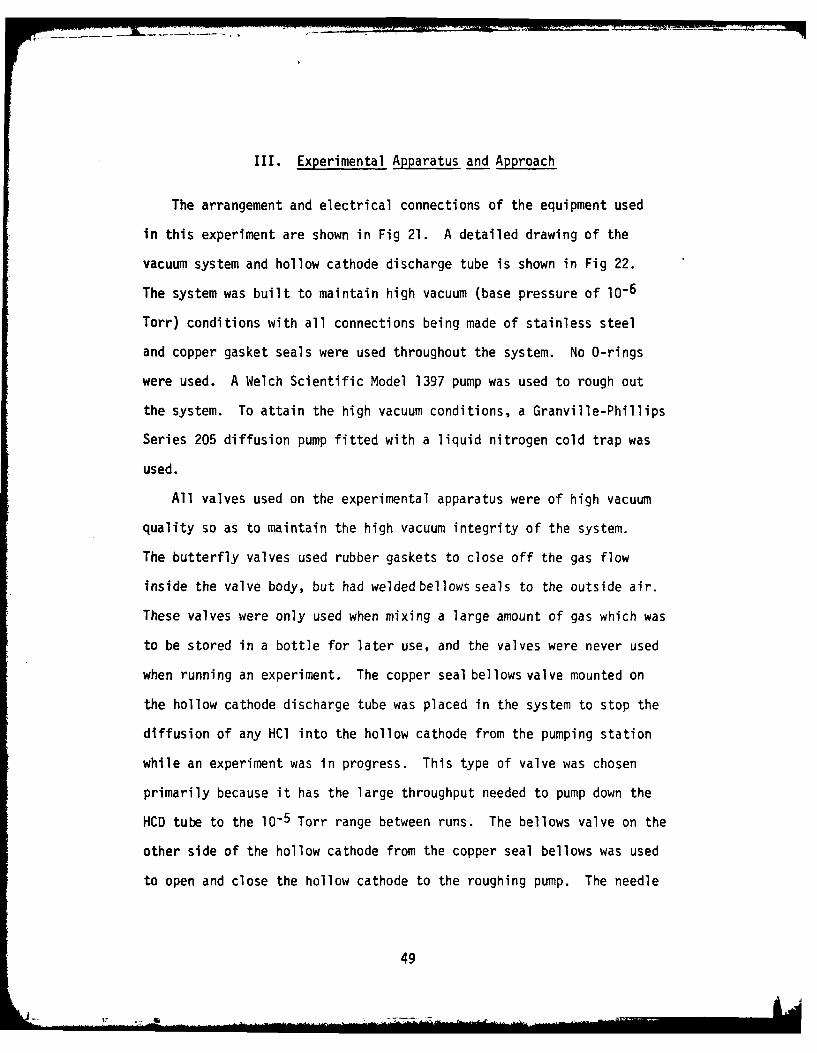
III. Experimental Apparatus and Approach
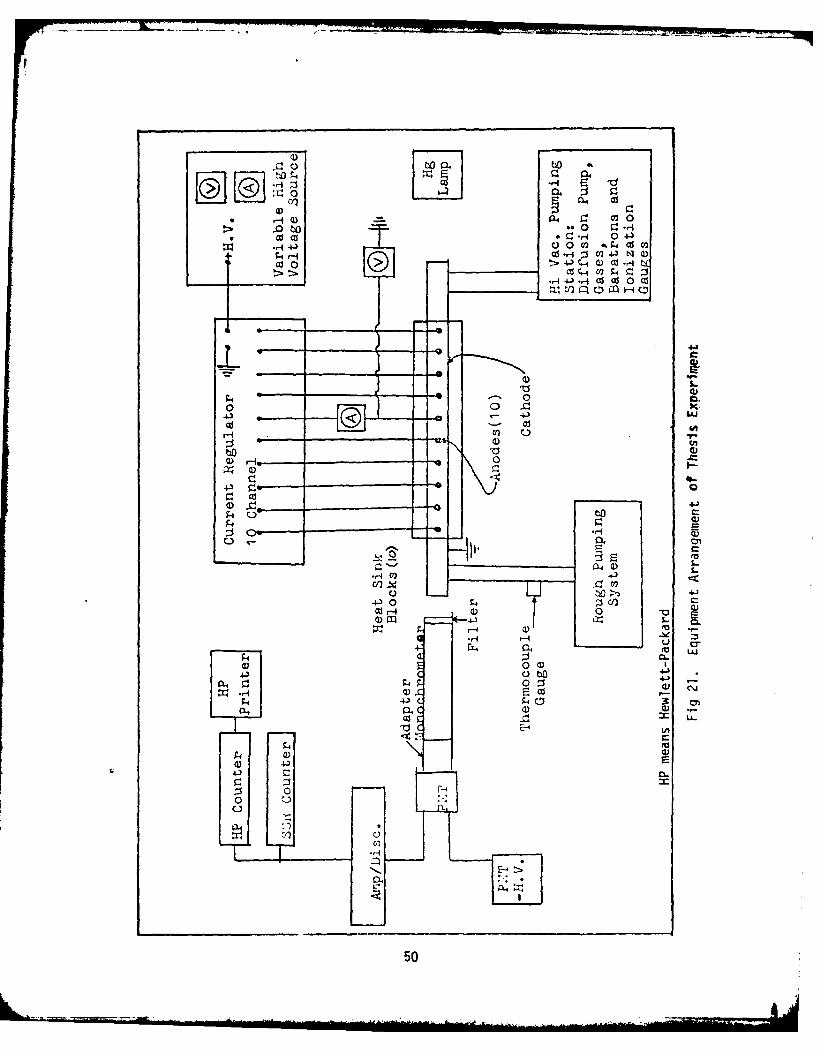
The arrangement and electrical connections of the equipment used
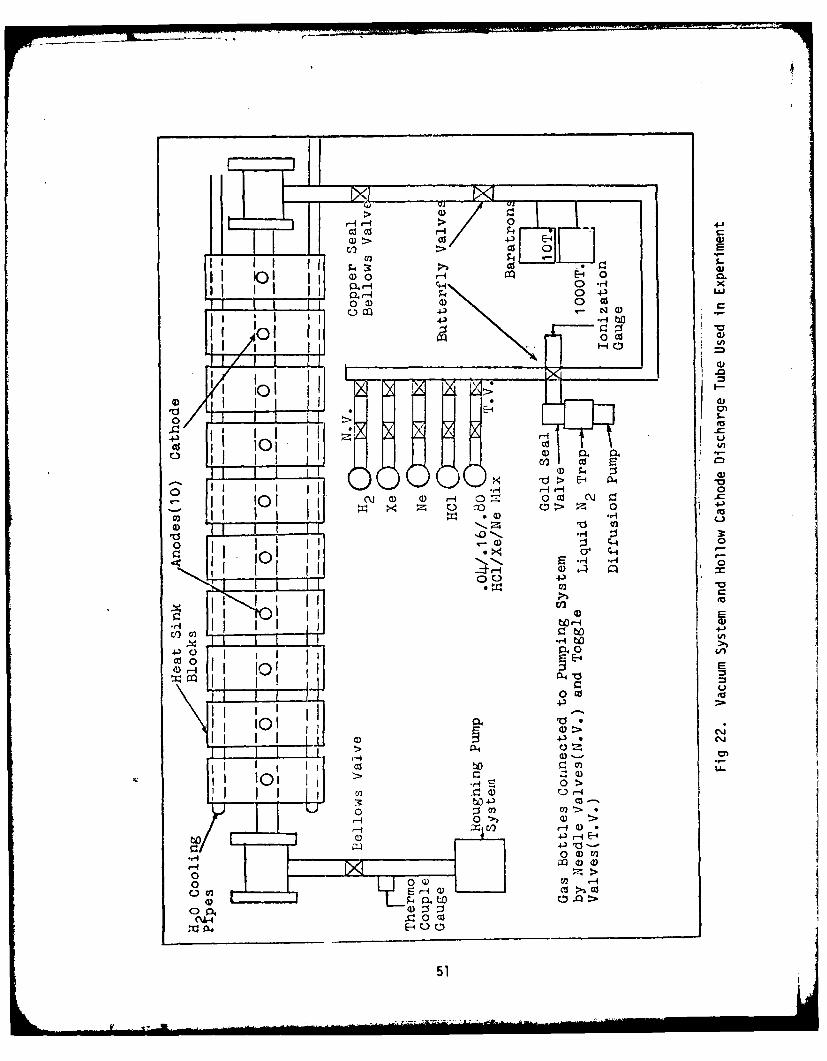
in this experiment are shown in Fig 21. A detailed drawing of the
vacuum system and hollow cathode discharge tube is shown in Fig 22.
The system was built to maintain high vacuum (base pressure of 10-6
Torr) conditions with all connections being made of stainless steel
and copper gasket seals were used throughout the system. No O-rings
were used. A Welch Scientific Model 1397 pump was used to rough out
the system. To attain the high vacuum conditions, a Granville-Phillips
Series 205 diffusion pump fitted with a liquid nitrogen cold trap was
used.
All valves used on the experimental apparatus were of high vacuum
quality so as to maintain the high vacuum integrity of the system.
The butterfly valves used rubber gaskets to close off the gas flow
inside the valve body, but had welded bellows seals to the outside air.
These valves were only used when mixing a large amount of gas which was
to be stored in a bottle for later use, and the valves were never used
when running an experiment. The copper seal bellows valve mounted on
the hollow cathode discharge tube was placed in the system to stop the
diffusion of any HCl into the hollow cathode from the pumping station
while an experiment was in progress. This type of valve was chosen
primarily because it has the large throughput needed to pump down the
HCD tube to the l0 5 Torr range between runs. The bellows valve on the
other side of the hollow cathode from the copper seal bellows was used
to open and close the hollow cathode to the roughing pump. The needle
49
co
00
cc CU .,1 04-)r-i 4- 0 02 . 4 CJ co
Cd 00 >4-).3 Ht
.4J
0 0 X.
:S cn
___ __ __ 0e
4-)
4.3.
~cI)
Od r-4 Q0 00
C-
0 0 4)11
4.) C- 3P4 0
4.3 E4.~
0
0
0
05
(.J r- 4
01 E)10 0) 04.4.)C
H- 0 x
r-4 0l 4.) E- C0 ) > 0 Ed
101.
I6] 0 08 04 10>E P411
i~ 4) 0 40)
00
u 4-)
II a
4d 02
I~ E
Al0 >
Co.
4.3
0 >2
0 ; 0i 41.m
00, 4) :3)
0".- c 0 'UE- 0
51
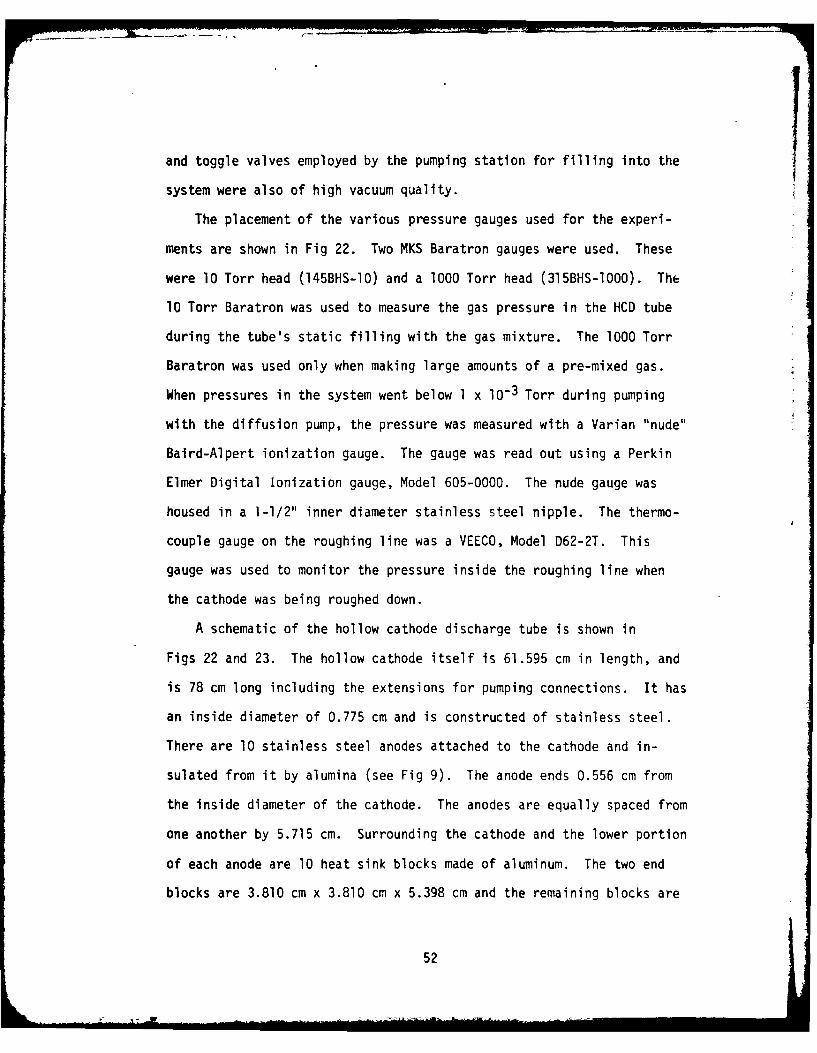
and toggle valves employed by the pumping station for filling into the
system were also of high vacuum quality.
The placement of the various pressure gauges used for the experi-
ments are shown in Fig 22. Two MKS Baratron gauges were used. These
were 10 Torr head (145BHS-10) and a 1000 Torr head (315BHS-1000). The
10 Torr Baratron was used to measure the gas pressure in the HCD tube
during the tube's static filling with the gas mixture. The 1000 Torr
Baratron was used only when making large amounts of a pre-mixed gas.
When pressures in the system went below 1 x 10- 3 Torr during pumping
with the diffusion pump, the pressure was measured with a Varian "nude"
Baird-Alpert ionization gauge. The gauge was read out using a Perkin
Elmer Digital Ionization gauge, Model 605-0000. The nude gauge was
housed in a 1-1/2" inner diameter stainless steel nipple. The thermo-
couple gauge on the roughing line was a VEECO, Model D62-2T. This
gauge was used to monitor the pressure inside the roughing line when
the cathode was being roughed down.
A schematic of the hollow cathode discharge tube is shown in
Figs 22 and 23. The hollow cathode itself is 61.595 cm in length, and
is 78 cm long including the extensions for pumping connections. It has
an inside diameter of 0.775 cm and is constructed of stainless steel.
There are 10 stainless steel anodes attached to the cathode and in-
sulated from it by alumina (see Fig 9). The anode ends 0.556 cm from
the inside diameter of the cathode. The anodes are equally spaced from
one another by 5.715 cm. Surrounding the cathode and the lower portion
of each anode are 10 heat sink blocks made of aluminum. The two end
blocks are 3.810 cm x 3.810 cm x 5.398 cm and the remaining blocks are
52
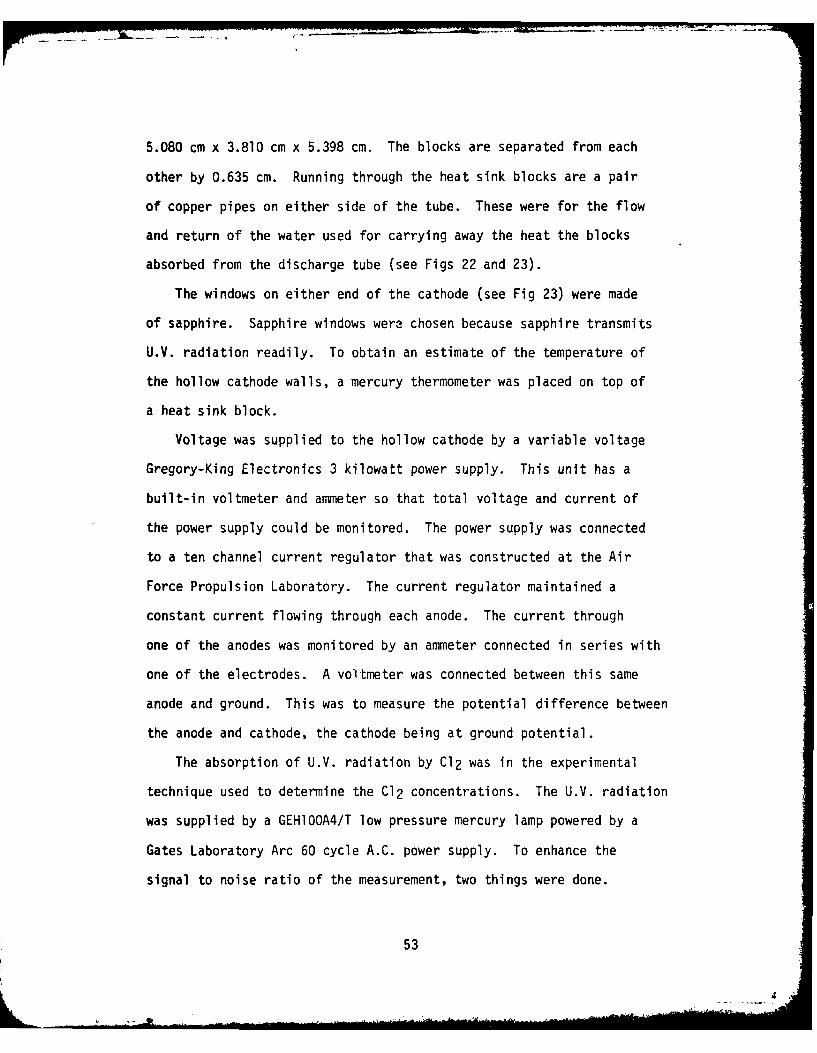
5.080 cm x 3.810 cm x 5.398 cm. The blocks are separated from each
other by 0.635 cm. Running through the heat sink blocks are a pair
of copper pipes on either side of the tube. These were for the flow
and return of the water used for carrying away the heat the blocks
absorbed from the discharge tube (see Figs 22 and 23).
The windows on either end of the cathode (see Fig 23) were made
of sapphire. Sapphire windows were chosen because sapphire transmits
U.V. radiation readily. To obtain an estimate of the temperature of
the hollow cathode walls, a mercury thermometer was placed on top of
a heat sink block.
Voltage was supplied to the hollow cathode by a variable voltage
Gregory-King Electronics 3 kilowatt power supply. This unit has a
built-in voltmeter and ammeter so that total voltage and current of
the power supply could be monitored. The power supply was connected
to a ten channel current regulator that was constructed at the Air
Force Propulsion Laboratory. The current regulator maintained a
constant current flowing through each anode. The current through
one of the anodes was monitored by an ammeter connected in series with
one of the electrodes. A voltmeter was connected between this same
anode and ground. This was to measure the potential difference between
the anode and cathode, the cathode being at ground potential.
The absorption of U.V. radiation by Cl2 was in the experimental
technique used to determine the Cl2 concentrations. The U.V. radiation
was supplied by a GEHlOOA4/T low pressure mercury lamp powered by a
Gates Laboratory Arc 60 cycle A.C. power supply. To enhance the
signal to noise ratio of the measurement, two things were done.
53
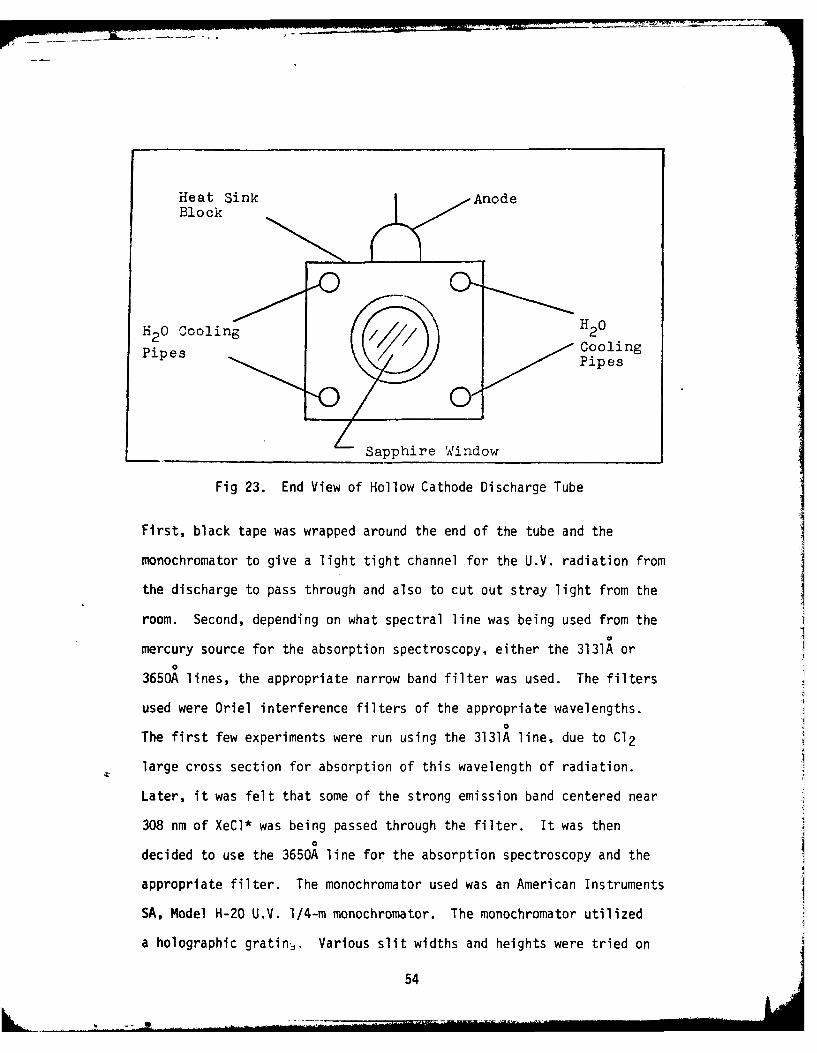
Heat Sink Ande
Block
H2 0 Cooling H20
Pipes CoolingPipes
Sapphire Window
Fig 23. End View of Hollow Cathode Discharge Tube
First, black tape was wrapped around the end of the tube and the
monochromator to give a light tight channel for the U.V. radiation from
the discharge to pass through and also to cut out stray light from the
room. Second, depending on what spectral line was being used from the
mercury source for the absorption spectroscopy, either the 3131A or0
3650A lines, the appropriate narrow band filter was used. The filters
used were Oriel interference filters of the appropriate wavelengths.0
The first few experiments were run using the 3131A line, due to Cl2
large cross section for absorption of this wavelength of radiation.
Later, it was felt that some of the strong emission band centered near
308 nm of XeCl* was being passed through the filter. It was then0
decided to use the 3650A line for the absorption spectroscopy and the
appropriate filter. The monochromator used was an American Instruments
SA, Model H-20 U.V. 1/4-m monochromator. The monochromator utilized
a holographic gratin.. Various slit widths and heights were tried on
54
the monochromator to optimize the intensity of the signal entering the
photomultiplier. It was found that no combination of slit widths and
heights altered the intensity of the signal significantly. It was
decided to use the 0.5mm width slits and the smallest height adjustment
so as to enhance the resolution of the system.
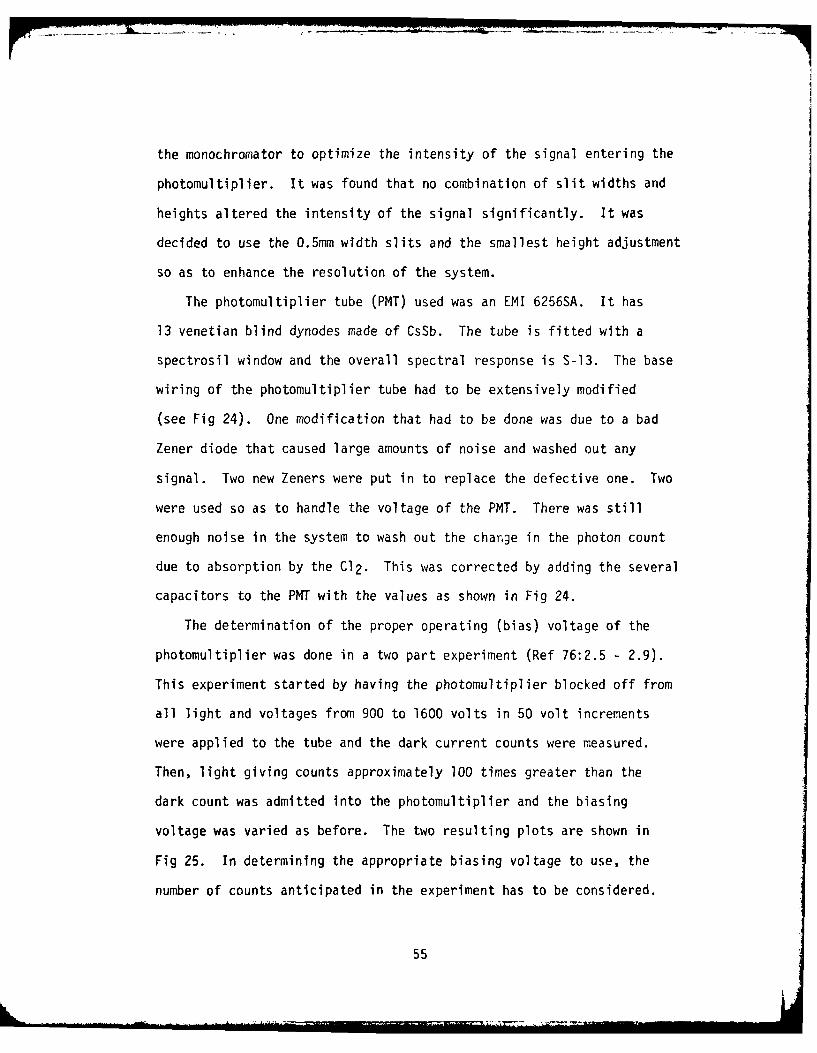
The photomultiplier tube (PMT) used was an EMI 6256SA. It has
13 venetian blind dynodes made of CsSb. The tube is fitted with a
spectrosil window and the overall spectral response is S-13. The base
wiring of the photomultiplier tube had to be extensively modified
(see Fig 24). One modification that had to be done was due to a bad
Zener diode that caused large amounts of noise and washed out any
signal. Two new Zeners were put in to replace the defective one. Two
were used so as to handle the voltage of the PMT. There was still
enough noise in the system to wash out the change in the photon count
due to absorption by the Cl2. This was corrected by adding the several
capacitors to the PMT with the values as shown in Fig 24.
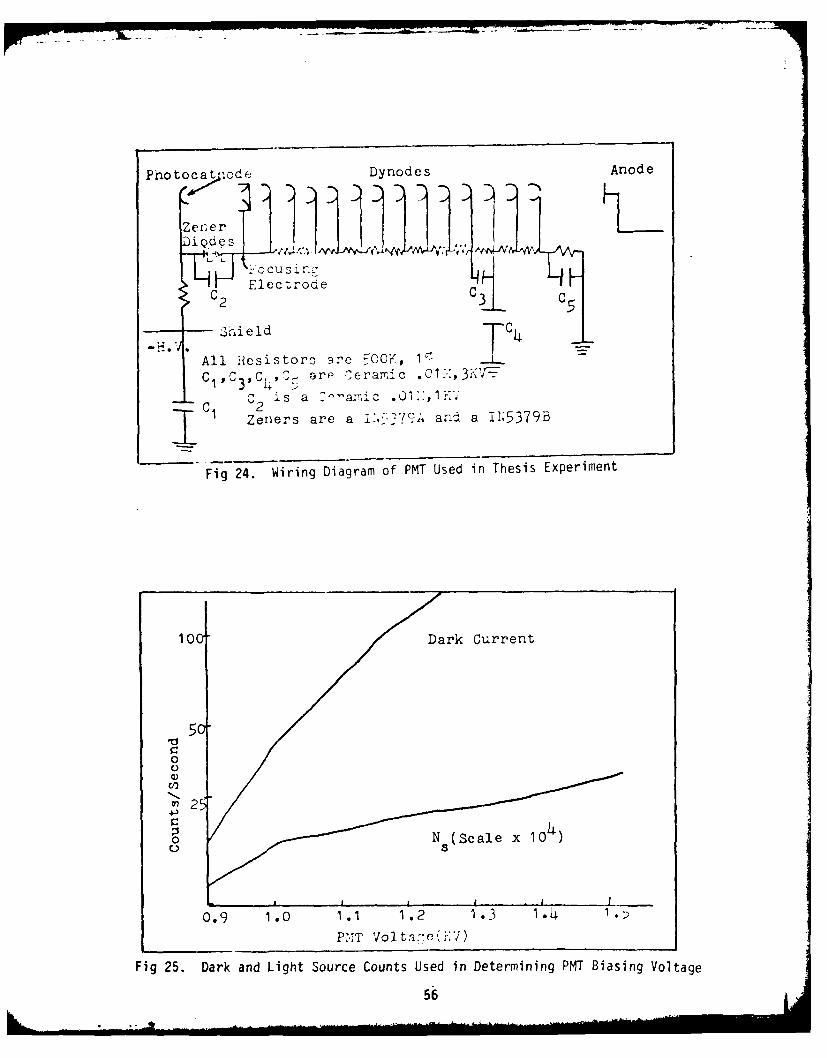
The determination of the proper operating (bias) voltage of the
photomultiplier was done in a two part experiment (Ref 76:2.5 - 2.9).
This experiment started by having the photomultiplier blocked off from
all light and voltages from 900 to 1600 volts in 50 volt increments
were applied to the tube and the dark current counts were measured.
Then, light giving counts approximately 100 times greater than the
dark count was admitted into the photomultiplier and the biasing
voltage was varied as before. The two resulting plots are shown in
Fig 25. In determining the appropriate biasing voltage to use, the
number of counts anticipated in the experiment has to be considered.
55
Photocatiuc&. Dynodes Anode
Zener1
ElectrodeC 2 3 C
Ohield 4All Resistor. are O(K, 1 T
C1, C C, re Cra'm-;c - 1 ,r/312is Ia -- ar .u ,l
11 Zeners are a 7% and a I1I5379B
Fig 24. Wiring Diagram of PMT Used in Thesis Experiment
100 Dark Current
5CY0
C)
4j)
-,
PINT VIoltiae'*:CK)
Fig 25. Dark and Light Source Counts Used in Determining PMT Biasing Voltage
56
It was desired to attain the greatest accuracy possible, requiring
as many counts as possible from the source (assuming a Poisson dis-
tribution of photons from the source, the standard deviation of the
measurement is the square root of the counts). Therefore, the counts
from the source would be much greater than the dark counts. For this
reason, the operating voltage is obtained from the flattest portion
of the light source count curve, Ns. This criteria is desirable for
two reasons (Ref 76:2.7):
1. It minimizes variations in effective calibrations withchanges in multiplier gain; and
2. avoids counting spurious pulses and after-pulses whichcause the rise in the Ns curve at high operating voltages.
From this experiment, the operating voltage was determined to be 1050V.
If light levels comparable to the dark count were to be measured,
the optimum operating voltage is found at the point where the slope
of the logarithm of the dark count is twice the slope of the light
source's count logarithm. This is the point where the signal to
noise ratio is optimum (Ref 76:2.7).
The number of counts per second of U.V. radiation from the
mercury lamp when the photomultiplier was biased with 1050V was on the
order of 5.0 x 10⁶. An experiment was done to ensure that the photo-
multiplier was operating in a linear fashion, i.e., that the counts
from a source A plus counts from a source B did in fact equal counts0
from A plus B (see Fig 19). With the monochromator set at 3131A, the
mercury lamp source and another U.V. source were allowed to shine on the
photomultiplier together and then separately. This was done several
times with varying bias voltages. It was found that the counts had to
57
I
be no greater than -1.2 x 10⁶ counts/sec. to still have the PMT
operating in a linear fashion. To maintain this order of counts with
the mercury source, a bias voltage of 885 volts was used. The source
for this biasing voltage was a Hewlett-Packard Model 6110A D.C. power
source.
The signal from the photomultiplier was sent into a SSR Instrument
Model 1120 Amplifier-Discriminator which was connected to a SSR Instru-
ment Model 1110 Digital Synchronous Computer counter. The SSR counter
gave only a three digit display. Greater accuracy was needed, so an
eight digit Hewlett-Packard Model 5248M counter was placed in parallel
with the SSR counter. The SSR counter was still needed to drive the
amplifier-discriminator. The Hewlett-Packard counter was connected
to a Hewlett-Packard Model 5050B digital printer which has a six
digit capacity. Since the counts/sec during ai, experiment was ,ot
going to exceed a value of 1.2 x 10⁶, the printer was capable of
handling all measurements. The counter was operated throughout the
thesis in the one second counting interval mode.
A standard mixture of gas was used throughout the experiments.
Upon examination of spectra of XeCl* in the hollow cathode taken by
George Vogel, the most intense emission of XeCl* was found to be
from a mixture of 4% - 16% - 80% of HC1:Xe:Ne respectively. Large
quantities of this mixture were prepared and stored in a separate gas
bottle (see Fig 22). Before starting a discharge experiment, the mercury
lamp was turned on and was always allowed enough time to warm up and
stabilize. The water cooling system was also turned on. Depending
on what mercury spectral line was going to be used for the absorption
58
0 0
spectroscopy measurement, i.e., either the 3131A or 3650A, determined
what filter was placed in front of the monochromator, and the mono-
chromator was appropriately tuned.
With the gas valves and diffusion pump closed, the system was
pumped out to : 0.1 Torr with the roughing pump. Once the level of
pressure was attained, the bellows valve cutting off the roughing pump
from the system was closed and the diffusion pump was opened, pumping
on the hollow cathode and connecting lines. The diffusion pump was
left to operate until pressures on the order of lO-5 Torr were achieved.
The diffusion pump was then closed and gas of the predetermined mix
was bled into the system until the pressure needed for the experiment
was obtained. When H2 was added to the gas mix, the procedure was
changed slightly. The appropriate pressure of H2 was first bled into
the system, with the standard mix then allowed to fill the system
the rest of the way to the final total pressure desired. H2 partial
pressures were 0.230 and 0.460 Torr for mixes of 6 Torr total pressure
and 0.160 Torr for mixes of 4 Torr total pressure. The full range
experimental operating total pressures were 2, 4, and 6 Torr. The low
pressures were used so as to have the negative glow of the hollow
cathode extend uniformly over as much as possible of the inner diameter
of the cathode tube, as explained earlier. The copper seal bellows
valve was then closed, sealing the discharge tube off from the
pumping station.
The lamp intensity through the gas was monitored fcr 30 seconds.
This would allow a check at the end of the experiment to see if the
lamp had changed intensity during the experiment. The lamp light was
then blocked off from entering the discharge tube and the voltage from
59
the 3KW power supply was turned up until the gas was broken down. The
current regulator was then adjusted to give the amount of current
wanted for the discharge. This was monitored with the ammeter, and
experimental parameters for current flow into one anode were 10, 20,
30, 40, and 50 mA. This meant total discharge currents of 100, 200,
300, 400, and 500 mA. The discharge's emission was monitored for five
minutes with the counters. Later, experiment discharge runs of ten and
twenty minutes were done. After the discharge emission had been moni-
tored for the appropriate length of time, the lamp was unblocked and
the lamp plus discharge emission was monitored for thirty seconds and
then the lamp was blocked for another ten seconds. This was done to
look for further changes in discharge intensity. At the end of the
ten seconds, the lamp was unblocked and the discharge turned off.
The lamp's intensity through the gas was monitored for thirty seconds.
The printer was then turned off and the valve to the roughing pump
would then be opened and the hollow cathode was pumped out for two
minutes.
This is more than enough time to pump out the tube to pressures
<.02 Torr. After the pump out by the roughing pump, the lamp intensity
through the discharge tube would then be monitored for another 30
seconds. The ratio of the average of the counts per second of the
lamp intensity through the gas to the average of the counts per second
of the intensity through the pumped out tube is used in determining
the fraction of absorption by Cl2.
When monitoring the XeCl* 308 nm emission, the procedure of
filling the system with the gas mixes (either the standard mix or the
standard mix with H2 added) was the same as described above. In
60
monitoring the emission of the XeCl* discharge, no filter was used and
the tube was sealed off from any other forms of light.
61
IV. Results
From Fig 3, it can be seen that Cl2 absorbs strongly in the 300
to 400 nm wavelength region. The mercury lamp has two strong spectral
emission lines in that region, the 3131A and 3650A lines. These two
lines were used in the U.V. photoabsorption spectroscopy experiments
of the thesis. Ne, Xe, HCl, and XeCl do not absorb these lines. The
mercury lamp radiation was passed through the gas immediately after a
discharge was run and the counts were measured of the photons of0 0
either the 3131A or 3650A lines, depending on which line was used in
the experiment. This measurement would give the intensity (I) of the
radiation making it through the gas after absorption by Cl2 in the
discharge. It was assumed that once the discharge was shut off, the
Cl2 concentration was constant while the photon counting was taking
place. The tube would then be pumped out and the intensity of the
light source would be measured (1o). The expression used for evaluat-0
ing the partial pressure of Cl2 when using the 3131A line was:
-TcI2 Io65.6T5 n = PCL 2 (62)
where
TCl2 = Temperature of the C12 gas in OK
PCL2 = Partial pressure of Cl2 in Torr
The expression for evaluating the partial pressure of Cl2 when the0
3650A line was used is quite similar:
TCl 2 n o - PCI (63)35.167 10 2
62
Appendix A contains the derivation of these expressions.
For a value of TCI2, the temperature of the cathode's wall was
used for the temperature of the gas species. This was reasoned due
to the low pressures (c 6 Torr) in the discharge tube, allowing the
gas and wall of the discharge tube to equilibrate rapidly (Ref 18).
See Appendix B for a derivation of the equation used for the calcula-
tion of the standard deviation of error for Eqs (62) and (63).
The original experimental parameters were to use the premixed
gas of HCl/Xe/Ne in 4%/16%/80% mix ratio at pressures of 2, 4, and
6 Torr. For each pressure, the total discharge current was to be
set at 100, 200, and 400 mA. The 3131A line was to be used for the
experiment. The values of the partial pressures of Cl2 from these
experiment runs was quite erratic and at low pressures and current,
the partial pressure results were lost in the standard deviation of
error. It was felt that at low pressure and current the Cl2 concentra-
tion was too small for the system to measure and the erratic behavior
of the other results was due to photons from the strong 308 nm band
of XeCl* being passed through the system. It was then decided to use0
the 3650A line for the absorption spectroscopy. In addition, the
experimental parameters were narrowed down to just mix pressures of
4 and 6 Torr and total currents of 200, 300, 400, and 500 mA.0
Table IV gives the data taken using the 3650A line and five
minute discharge runs. It also emphasizes some problems that were
encountered in the experiment. The data is fairly scattered, due to
four main reasons:
63
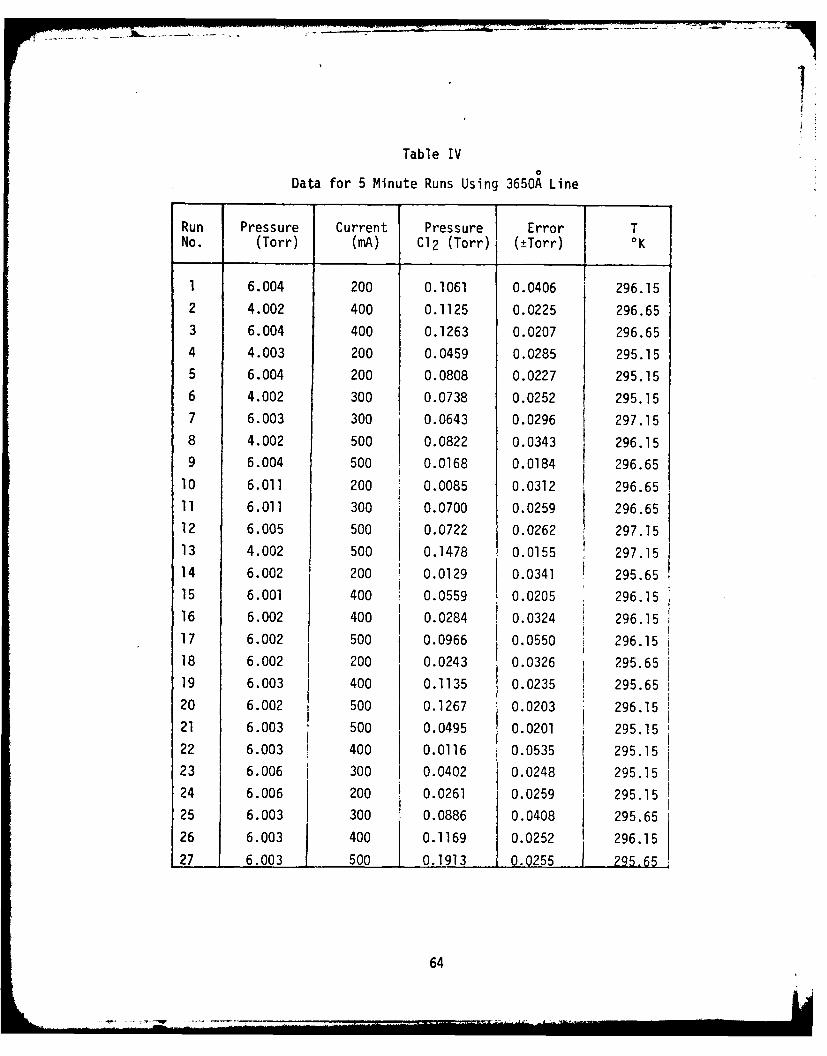
Table IV0
Data for 5 Minute Runs Using 3650A Line
Run Pressure Current Pressure Error TNo. (Torr) (mA) Cl2 (Torr) (±Torr) OK
1 6.004 200 0.1061 0.0406 296.15
2 4.002 400 0.1125 0.0225 296.65
3 6.004 400 0.1263 0.0207 296.654 4.003 200 0.0459 0.0285 295.15
5 6.004 200 0.0808 0.0227 295.15
6 4.002 300 0.0738 0.0252 295.15
7 6.003 300 0.0643 0.0296 297.15
8 4.002 500 0.0822 0.0343 296.159 6.004 500 0.0168 0.0184 296.65
10 6.011 200 0.0085 0.0312 296.65
11 6.011 300 0.0700 0.0259 296.6512 6.005 500 0.0722 0.0262 297.15
13 4.002 500 0.1478 0.0155 297.15
14 6.002 200 0.0129 0.0341 295.65
15 6.001 400 0.0559 0.0205 296.15
16 6.002 400 0.0284 0.0324 296.1517 6.002 500 0.0966 0.0550 296.15
18 6.002 200 0.0243 0.0326 295.65
19 6.003 400 0.1135 0.0235 1 295.65
20 6.002 500 0.1267 0.0203 296.1521 6.003 500 0.0495 0.0201 295.15
22 6.003 400 0.0116 0.0535 295.15
23 6.006 300 0.0402 0.0248 295.15
24 6.006 200 0.0261 0.0259 295.1525 6.003 300 0.0886 0.0408 295.65
26 6.003 400 0.1169 0.0252 296.15
27 6.003 500 0.1913 0.0255 295.65
64
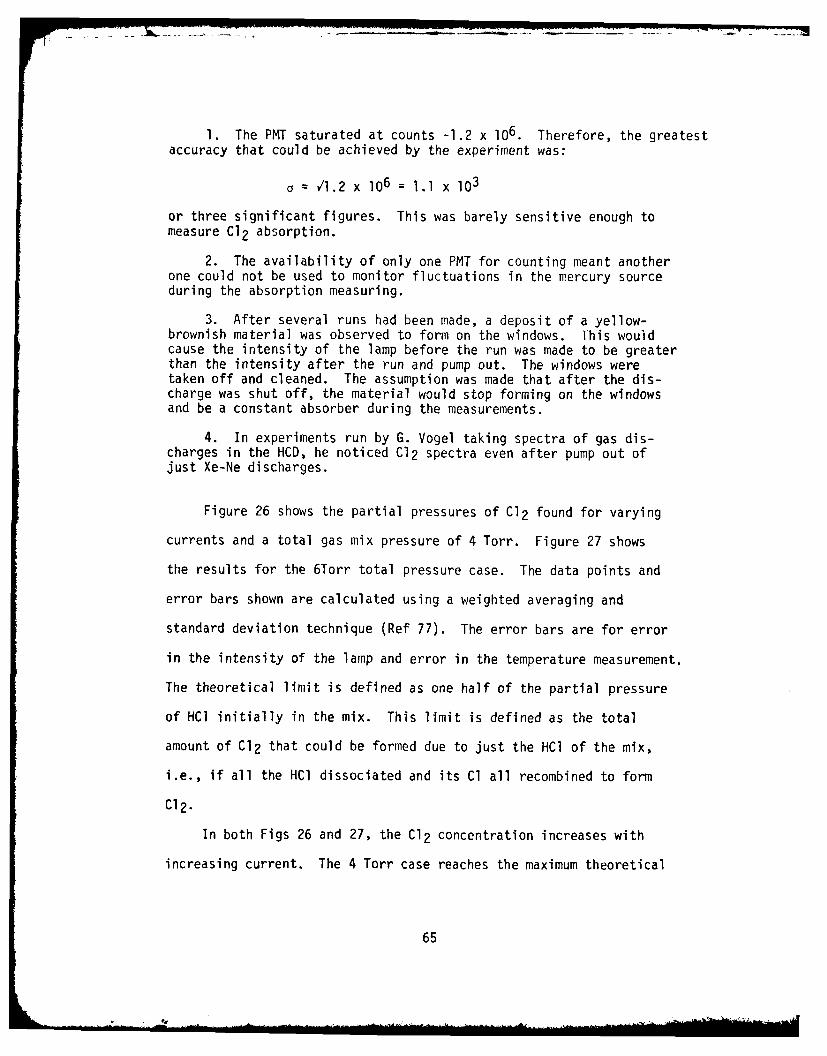
1. The PMT saturated at counts -1.2 x 10⁶. Therefore, the greatestaccuracy that could be achieved by the experiment was:
a= 1.2 x 106 = 1.I x 103
or three significant figures. This was barely sensitive enough tomeasure C12 absorption.
2. The availability of only one PMT for counting meant anotherone could not be used to monitor fluctuations in the mercury sourceduring the absorption measuring.
3. After several runs had been made, a deposit of a yellow-brownish material was observed to form on the windows. This wouldcause the intensity of the lamp before the run was made to be greaterthan the intensity after the run and pump out. The windows weretaken off and cleaned. The assumption was made that after the dis-charge was shut off, the material would stop forming on the windowsand be a constant absorber during the measurements.
4. In experiments run by G. Vogel taking spectra of gas dis-charges in the HCD, he noticed C12 spectra even after pump out ofjust Xe-Ne discharges.
Figure 26 shows the partial pressures of C12 found for varying
currents and a total gas mix pressure of 4 Torr. Figure 27 shows
the results for the 6Torr total pressure case. The data points and
error bars shown are calculated using a weighted averaging and
standard deviation technique (Ref 77). The error bars are for error
in the intensity of the lamp and error in the temperature measurement.
The theoretical limit is defined as one half of the partial pressure
of HC1 initially in the mix. This limit is defined as the total
amount of Cl2 that could be formed due to just the HCl of the mix,
i.e., if all the HCl dissociated and its Cl all recombined to form
Cl2.
In both Figs 26 and 27, the Cl2 concentration increases with
increasing current. The 4 Torr case reaches the maximum theoretical
65
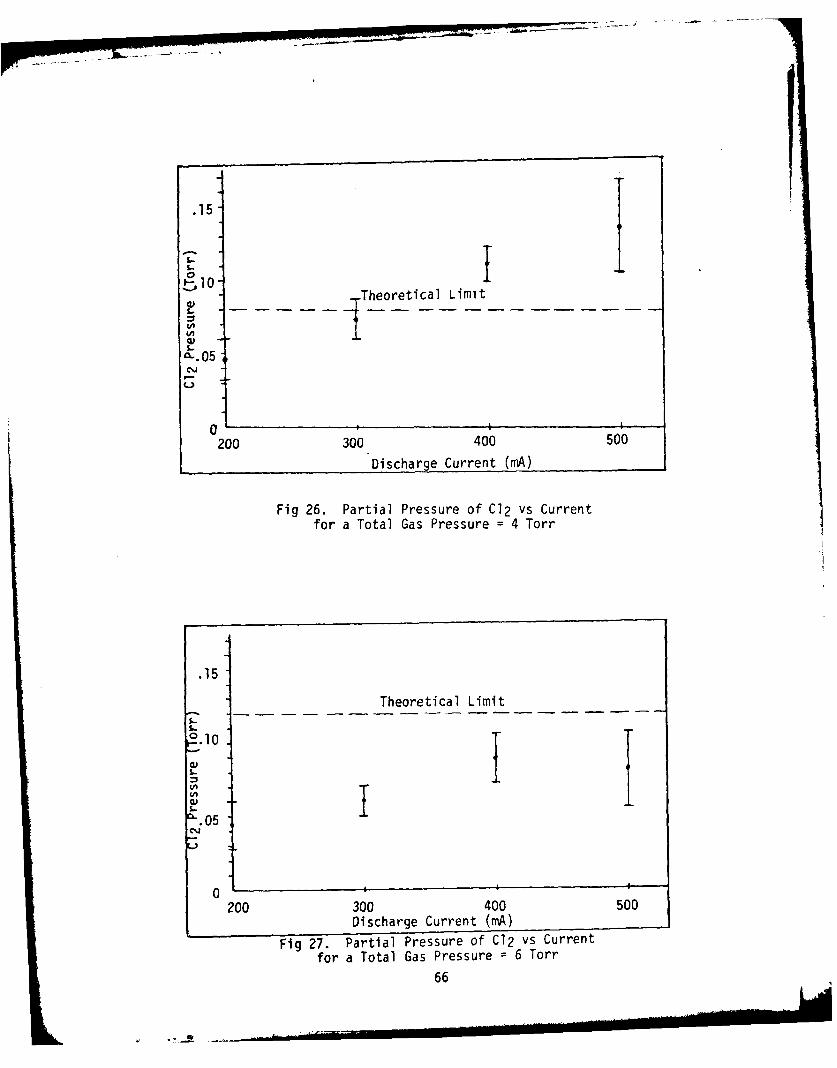
.15
01
200 300. 400 50'0
Discharge Current (mA)__
Fig 26. Partial Pressure Of C12 vs Currentfor a Total Gas Pressure =4 Torr
.15
Theoretical Limit
Limi
Q.050 I
200 300 400 500
Discharge Current (mA)
Fig 27. Partial Pressure of C12 vs Currentfor a Total Gas Pressure = 6 Torr
66
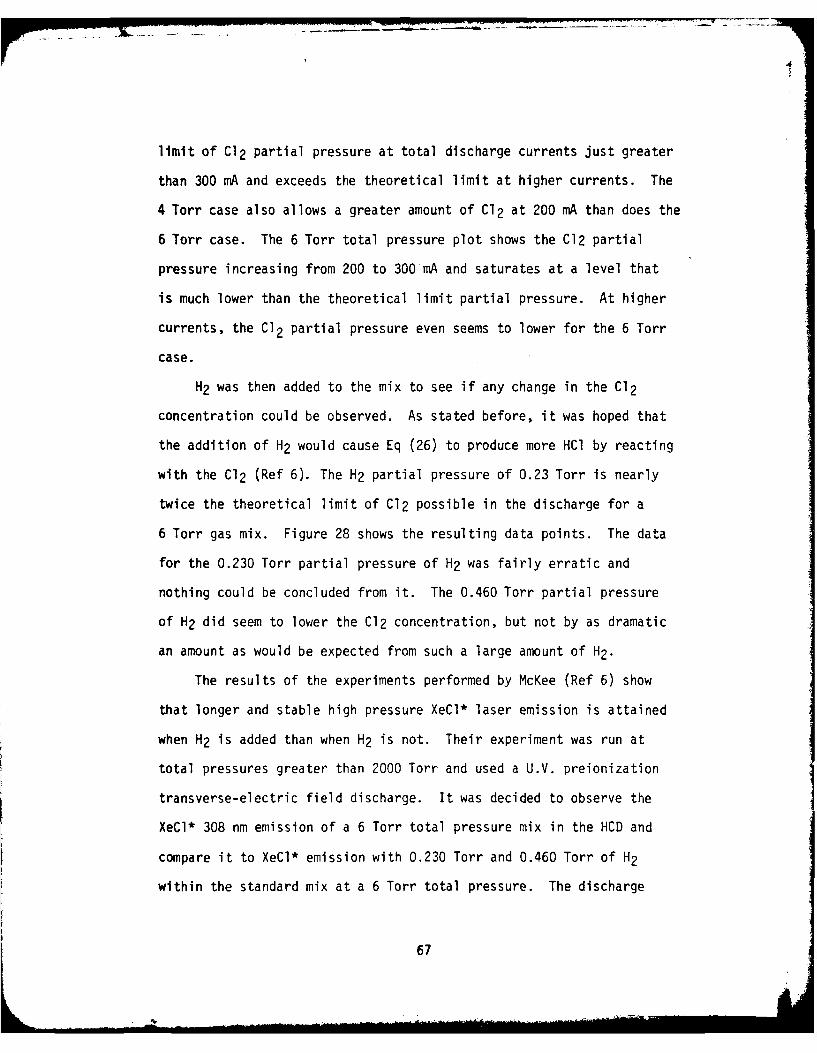
limit of Cl2 partial pressure at total discharge currents just greater
than 300 mA and exceeds the theoretical limit at higher currents. The
4 Torr case also allows a greater amount of Cl2 at 200 mA than does the
6 Torr case. The 6 Torr total pressure plot shows the C12 partial
pressure increasing from 200 to 300 mA and saturates at a level that
is much lower than the theoretical limit partial pressure. At higher
currents, the Cl2 partial pressure even seems to lower for the 6 Torr
case.
H2 was then added to the mix to see if any change in the Cl2
concentration could be observed. As stated before, it was hoped that
the addition of H2 would cause Eq (26) to produce more HCI by reacting
with the Cl2 (Ref 6). The H2 partial pressure of 0.23 Torr is nearly
twice the theoretical limit of C12 possible in the discharge for a
6 Torr gas mix. Figure 28 shows the resulting data points. The data
for the 0.230 Torr partial pressure of H2 was fairly erratic and
nothing could be concluded from it. The 0.460 Torr partial pressure
of H2 did seem to lower the C12 concentration, but not by as dramatic
an amount as would be expected from such a large amount of H2 .
The results of the experiments performed by McKee (Ref 6) show
that longer and stable high pressure XeCl* laser emission is attained
when H2 is added than when H2 is not. Their experiment was run at
total pressures greater than 2000 Torr and used a U.V. preionization
transverse-electric field discharge. It was decided to observe the
XeCl* 308 nm emission of a 6 Torr total pressure mix in the HCD and
compare it to XeCl* emission with 0.230 Torr and 0.460 Torr of H2
within the standard mix at a 6 Torr total pressure. The discharge
67
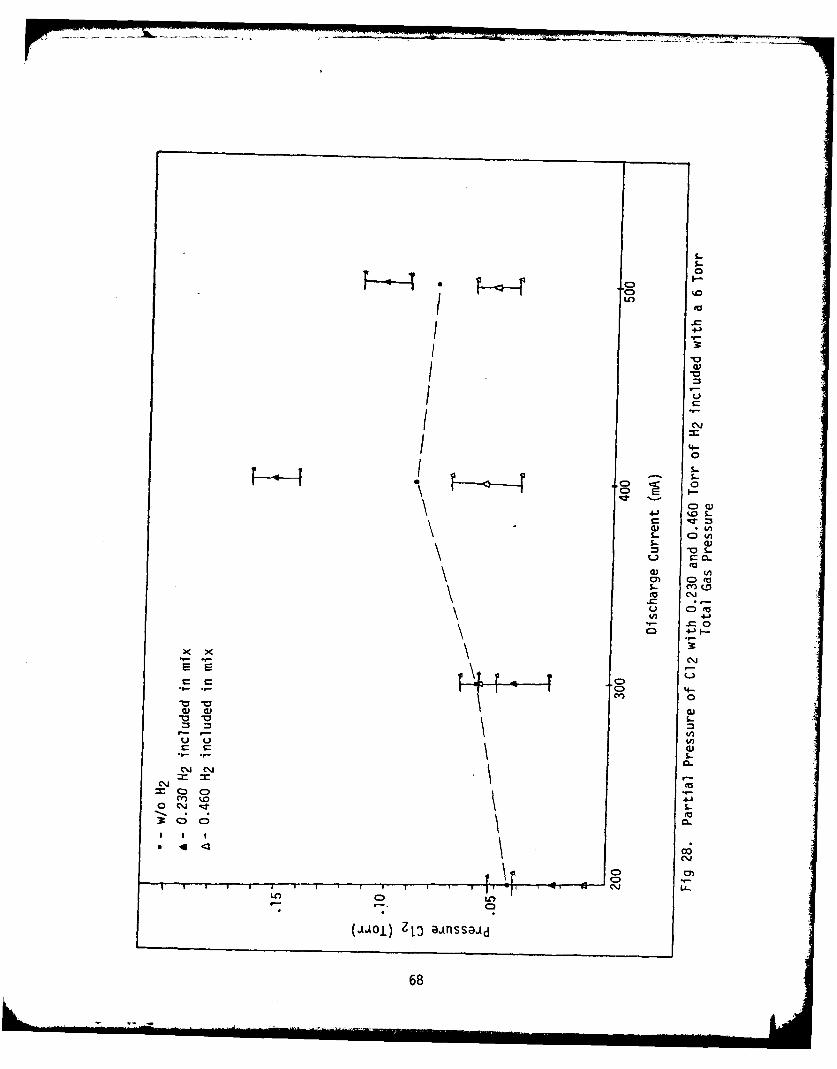
- 4-
0
ul 41
/ x I a)Q
cn 0
- L
cm
CIQ)
C)~C -)~
I CIQ 0
(JOI ZL3 aiss
68'
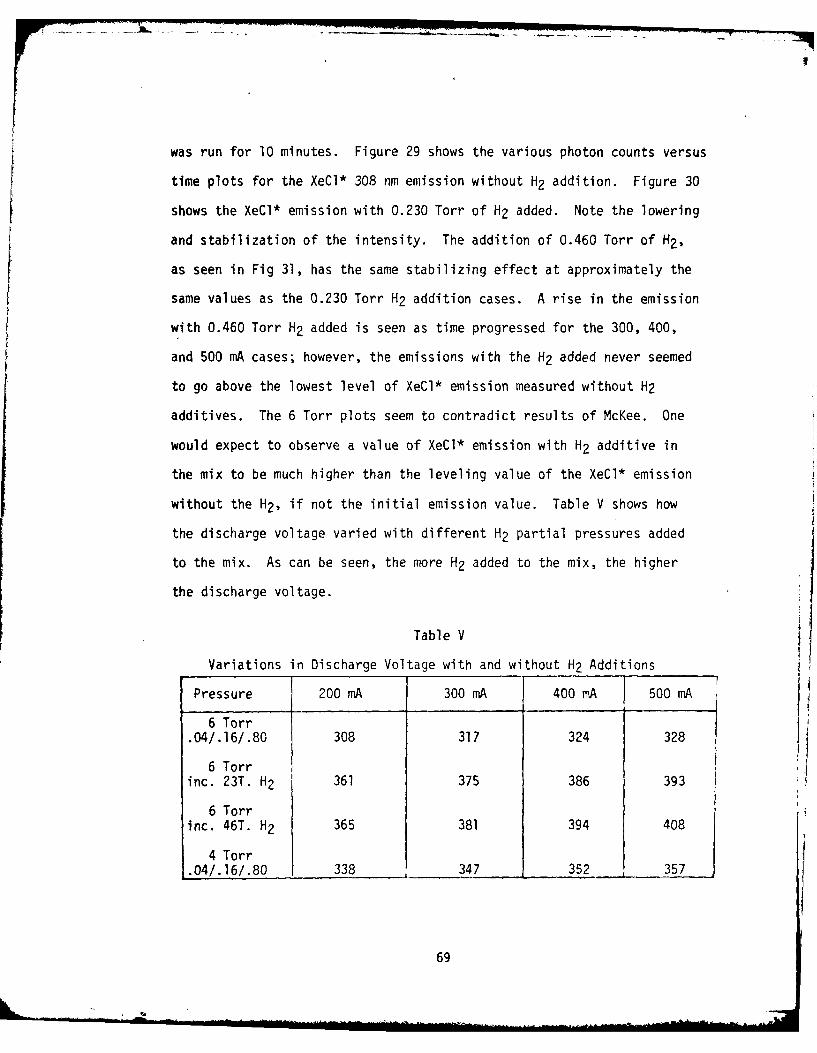
- - ' -7-
was run for 10 minutes. Figure 29 shows the various photon counts versus
time plots for the XeCl* 308 nm emission without H2 addition. Figure 30
shows the XeCl* emission with 0.230 Torr of H2 added. Note the lowering
and stabilization of the intensity. The addition of 0.460 Torr of H2 ,
as seen in Fig 31, has the same stabilizing effect at approximately the
same values as the 0.230 Torr H2 addition cases. A rise in the emission
with 0.460 Torr H2 added is seen as time progressed for the 300, 400,
and 500 mA cases; however, the emissions with the H2 added never seemed
to go above the lowest level of XeCl* emission measured without H2
additives. The 6 Torr plots seem to contradict results of McKee. One
would expect to observe a value of XeCl* emission with H2 additive in
the mix to be much higher than the leveling value of the XeCl* emission
without the H2 , if not the initial emission value. Table V shows how
the discharge voltage varied with different H2 partial pressures added
to the mix. As can be seen, the more H2 added to the mix, the higher
the discharge voltage.
Table V
Variations in Discharge Voltage with and without H2 Additions
Pressure 200 mA 300 mA 400 mA 500 mA
6 Torr.04/.16/.80 308 317 324 328
6 Torrinc. 23T. H2 361 375 386 393
6 Torrinc. 46T. H2 365 381 394 408
4 Torr.04/.16/.80 338 347 352 357
69
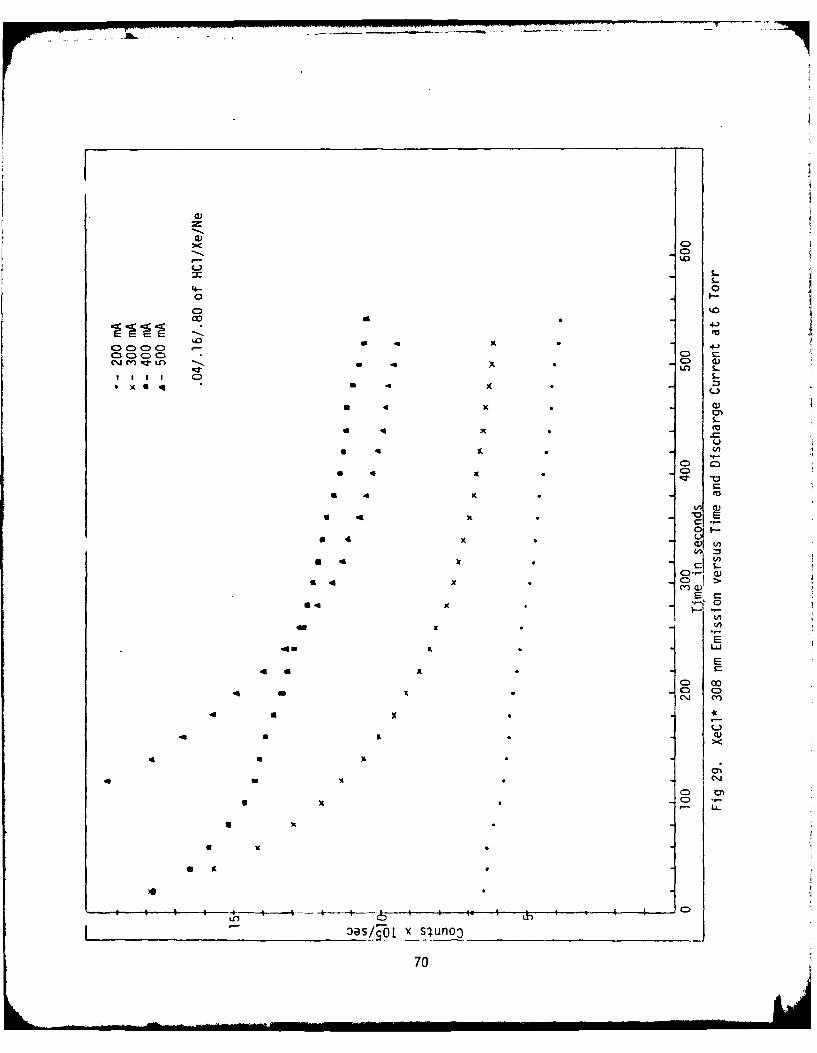
-L - --721-
C.))
0 I-
* 4-
* l LC)C
Ln S
* 4 x *E
-4 -
CU-
* 4x * >/
0.4
E
4 j C
C.D
4 4 ---- 4 40
70~
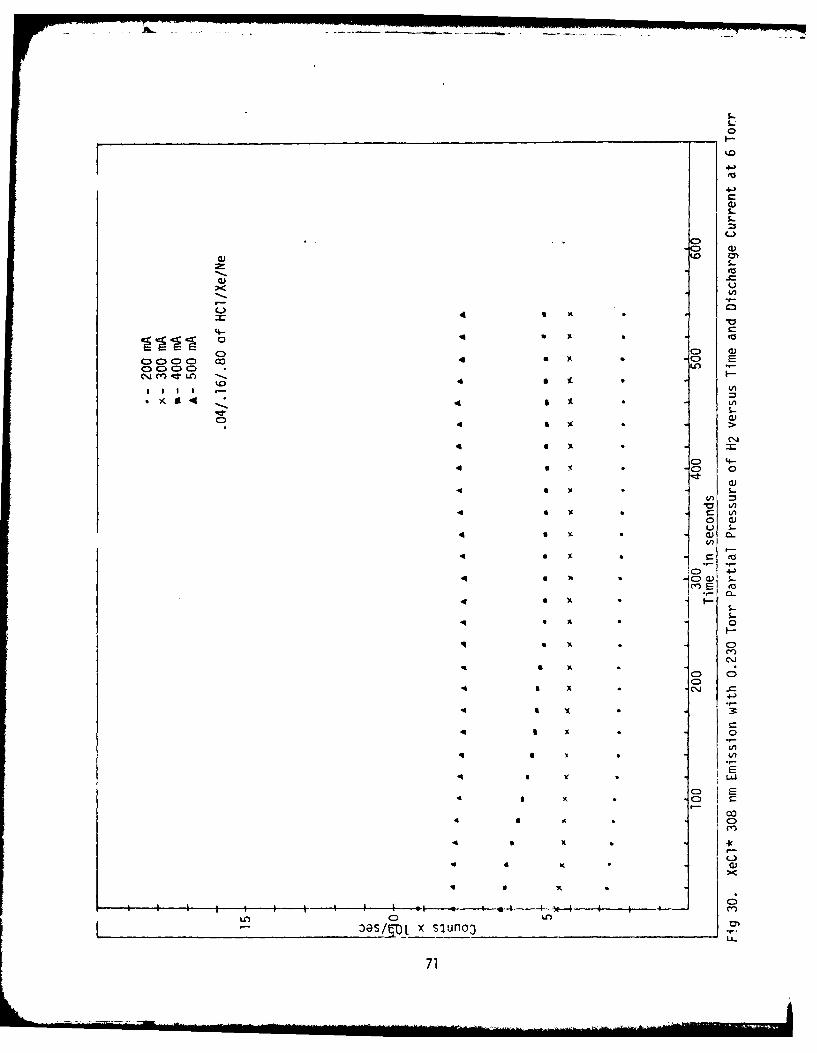
S.-
Q4=
4- aJ
0 to
C) ~C
0: 4-4C0 0
00 0 ) *.-(c')l E (14 3 *I
.KS4 K4 C3n
0 4CB C)
04-J
141
C:)
Li)
-o4 3 K C ci
--------- o CLn. L-
4a 3 K x sju..
71i
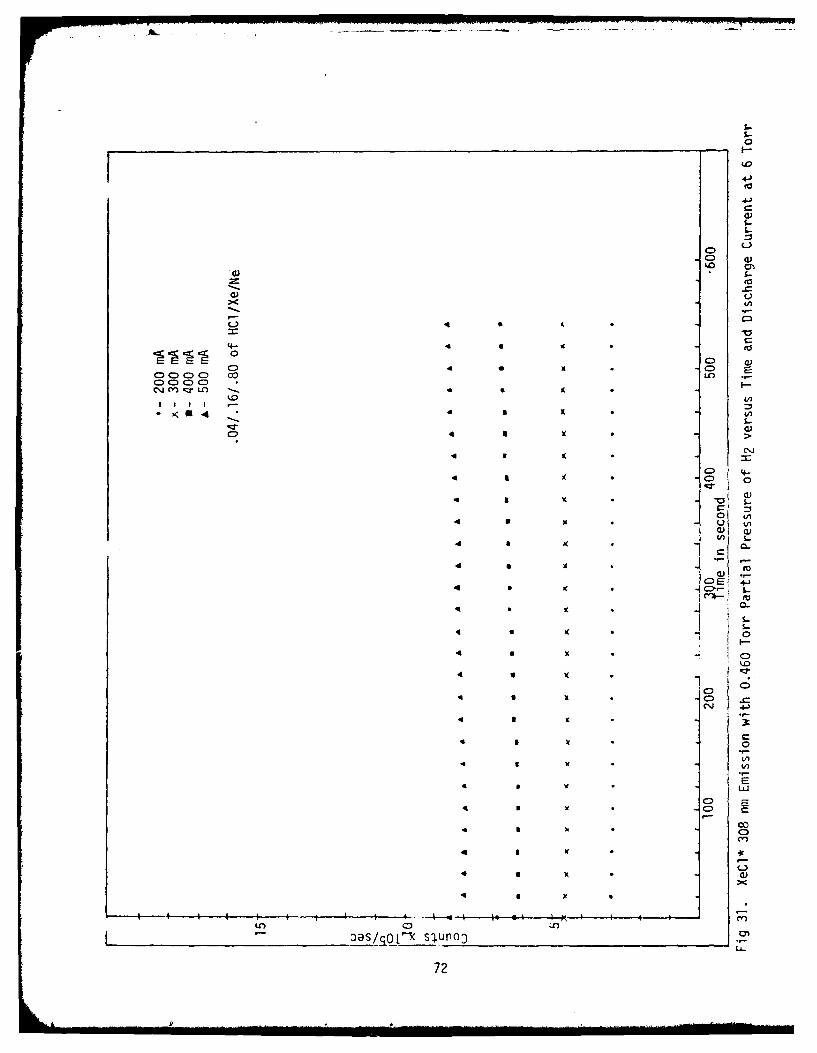
- -
14V
4-.
0 a)
C: C)C.) C4 S C) o
C). C) CD CD) F-4S
4.-
L)
44-3
4 3 K
x C)
411
LI-
CD S K
CD,4 I K *
4 I K Q)
C)0 .O@SAOL-'O sjno
72L
V. Conclusions
In order to provide a framework for establishing the implications
of the experimental observations, a brief review of these results is in
order. The measurements can be divided into two cases, case A in
which the source of H2 was only the initial HC. concentration within
the mix, the second, case B, when concentrations of H2 were deliberately
added to the discharge mix. In both cases, measurcments were made of
the C12 concentration versus current at total gas pressures of 4 and 6
Torr, and the XeCl* 308 nm spontaneous emission versus time.
In case A, the Cl2 concentration increased with increasing current
for both the 4 and 6 Torr pressure runs, as shown in Figs 26 and 27.
The C12 concentration saturated at a total current of 400 mA for the
6 Torr case. In the 4 Torr case, a similar increase of C12 is observed,
but at currents greater than 400 mA, the concentration of Cl2 exceeded
that which could originate from the.,original 0.16 Torr of HCI. The
XeCl* emission monitored at 308 nm decreased with discharge run time
for all the total current runs (Fig 29).
In case B, the addition of H2 to the cas mix had no significant
effect on the observed concentration of C12 , i.e., H2 addition did not
force the reaction
2HCl - H2 + C12
to the left, forming more HCI and depleting the Cl2 concentration.
The XeCl* 208 nm emission stabilized with the addition cf H2 to the
gas mix, but the intensity was lower than the final measured intensity
of the XeCl* emission without H2 added. This was true for all current
73
runs. When twice as much H2 as what was originally added was added
to the mix, there was no significant change in the intensity of the
XeCl* emission as compared with the emission with the original H2
addition.
The primary formation channel of XeCl* was assumed to be:
Xe* + C12 - XeCl* + Cl
because of the low branching ratios at low pressures for the reaction
(Refs 11 and 14):
Xe* + HCl -* XeCl* + H
The ion reaction:
Xe+ + C1- + Ne -* XeCl* + Ne
was also not considered to be a major formation channel because three
body reactions are more efficient at high pressure, and the experiments
with the HCD were conducted at low pressures.
Let us first address the increase of the C12 concentration with
increases in discharge current. As the current increased, the
electron number density increases causing more dissociation of HCI and
more dissociative attachment between the electrons and Cl, giving C1-.
The Cl- undergoes reactions in the discharge that allow the formation
of C12 . This explains the increase in C12 concentration, but why is
there such a large increase, even increasing past the theoretical
limit in the 4 Torr case? It is possible that the greater currents
in the discharge result in the release of adsorbed Cl on the discharge
74
tube's walls, which can recombine with another Cl and form Cl2. This
hypothesis is substantiated by looking at spectra from the HCD. It
was found by Vogel (Ref 7) that if a pure Xe discharge was run after
a discharge was run containing HCI in the mix, XeCI* emission could
still be observed. Therefore, Cl2 concentrations greater than what
can be achieved by the gas mix itself are possible.
In order to understand the observed decrease in the XeCl*
emission, both Cl- and Cl2 are considered as possible dominant 308 nm
radiation absorbers in the HCD. First, the possibility that Cl- is
the dominant absorber will be discussed, As presented earlier, Cl-
has a 308 nm photon absorption cross section a hundred times greater
than C12 (2.2 x 10⁻¹⁷ cm2 for Cl- and 1.7 x 10⁻¹⁹ cm2 for Cl2 ). For
the Cl- to be as significant an absorber as the Cl2 , the number
density of Cl- would have to be at least 1% of the C12 number density.
Normally, negative ion concentrations in glow discharges are quite
small, due to diffusion losses. By looking at the current density
expression and negative ion production rate equation, it will be
possible to determine if such appreciable quantities of Cl- can exist
in the HCO. The current density j is given by:
j = neee E + n__e E + n+41 +e E (64)
where
ne , n_,n+ number density of the electrons, negativeions and positive ions. cm-3
we, V_, i+ = mobilities of the elec rons, negative ionsand positive ions. cmV-IS -l
e = 1.6 x 10⁻¹⁹ coulombs, electronic charge
E = electric field. V-cm-l
75
We wish to get an upper bound on the C- concentration. If we assume
that the current is carried by the C1- ions alone, and the n = n+ and
v +, we find:
u- (65)
Using the 400 mA 6 Torr runs as an example, the current density would
be:
40 x l0-3 Amps_0 0848 Amps - cm-2 (66)7 (0.3875 cme) - *
where 40 mA is the current flowing into one of the ten anodes and
0.3875 cm2 is the radius of the discharge tube. The voltage across
the tube was 324V (from Table V), and with the diameter of the tube
being 0.775 cm, a value for the electric field is obtained
E 324V - 418.06 V - cm-1 (67)
0.775 cm
Assuming that the mobility of the Cl- negative ions is approximately
the same as the mobility of the positive ions in a Ne gas, a value of
8.2 cm2 V-ls -I is obtained (Ref 78). Substituting these values back
into Eq (65), one finds the number density of Cl-:
n_ = 7.73 x 1013 cm-3 (68)
The maximum number density of C12 possible from the amount of HC1
present in the 6 Torr runs is 4.26 x 1015 cm-3 . The value found above
for Cl- is 1.8% of the maximum C12 number density. Thus, at this
point, Cl- appears to be a possibility as a major absorber. To
76
establish the consistency of the assumed dominance of n_ over ne,
we now consider the negative ion production equation.
The time rate of change of the negative ion concentration, _
is given by:
n = kNAne - an' (69)
where
k = rate constant of negative ion production. cm3-S-I
NA = number density of electron attaching species, HCIor C12. cm-
a= ion recombination rate constant. cm3-S-I
Assuming steady state condition and solving for ne, we find:
an 2(70)nle = kNA 0
The values for a and k for the C1- ions could not be found, but values
from comparable reactions should suffice. When the values of
a = 2 x 10⁻⁶ cm3 -S-1 (Ref 58), k = 4 x 10⁻¹⁰ cm3 -S-1 (Ref 58), the
Cl- concentration previously calculated, and letting NA equal to the
initial number density of HCI of the mix (8.5 x 101 5cm-3), are sub-
stituted back in Eq (70) we find an electron number density of
3.51 x I015cm-3. This value of an electron number density is greater
than the value of n_ that was calculated. Since the mobility of
electron is larger than the mobility of ions, the majority of the
current, under the conditions we have specified, will be carried by
the electrons. Thus our previous assumptions are false and we con-
clude that C12 is the dominant absorber of XeCl* 308 nm emission in
the HCD.
77
To explain the effect of C12 absorption of XeCl* emission, it
should be recalled that as the discharge current was increased, the
observed Cl2 concentration also increased. This increase of C12
with increases of current was due to more dissociative attachment
occurring and more absorbed Cl being released from the walls of the
discharge going to form Cl2. Since the total amount of Cl coming
off the walls increased with increasing current, a reasonable assump-
tion is that the total amount of Cl that comes off the walls increases
with time also. This increase of Cl allows more C12 to be formed and
allows more XeCl* to form, as seen on Fig 29 by the emission of
XeCl* at the higher current as compared to the emission at lower cur-
rents. The increase in Cl2 also means more Cl2 to absorb the 308 nm
radiation. The effect of more Cl2 for absorption is seen in Fig 29
by the greater drops, in general, of the intensity of the XeCl*
emission as the current is increased.
When H2 was deliberately added to the discharge, there was no
great reduction in the C12 concentration (see Fig 28). It must be
remembered that the C12 concentration measurements were made with the
discharge off. This non-reactive condition allows time for the Cl2
to equilibrate with the walls.
The lowering in XeCl* intensity of emission when H2 is added
(see Figs 30 and 31) can be explained as follows. It is postulated
that H2 causes the rapid desorption of Cl from the walls of the dis-
charge. This is a good assumption since it was found that after
discharges of pure H2 were run, C12 was still being detected in
significant quantities. This effect seems to be so efficient that
78
the discharge is swamped with Cl. The additional amounts of Cl
increases the Cl2 concentration. The large concentration of C12
allows the formation of XeCl* to occur as fast as Xe* metastables
are formed, accounting for the stability of the emission. However,
the large background Cl2 concentration also absorbs the emission,
lowering the output intensity that was monitored. It appears that
relatively small amounts of H2 addition to the gas mix is quite
effective in clearing the walls of Cl, for when greater amounts of
H2 were added to the mix, the XeCl* emission intensity hardly changed
(compare Figs 30 and 31).
There are three main conclusions to be drawn from the experiments:
1. Cl is absorbed in the walls of the discharge tube andreturned to the gas under discharge conditions. The rate of returnincreases with current.
2. H2 is quite effective in clearing the Cl off the dischargewalls.
3. Cl2 appears to be the dominant XeCl* 308 nm emission absorber.
The Recommendations chapter will propose experiments that can provide
data to help in the further understanding of a XeCl hollow cathode
discharge.
79
VI. Recommendations
Several proposals for future study with a XeCl discharge in a
hollow cathode are recommended. A repeat of the thesis experiment
only utilizing two PMTs, one for measuring the absorption of the
lamp source's light and another for monitoring the lamp's output
intensity. Another recommendation would be to obtain a lamp source
with a higher intensity in the 300-400 nm spectral range. Both of
these suggestions are made so as to increase the accuracy of the
experiment.
A broad band U.V. spectroscopy experiment might be done to look
at variations in the intensity of the spectral emissions from the dis-
charge. The variation of the C12 concentration in the discharge with
time would prove to be a most enlightening experiment. These experi-
ments would help in the determination of the reaction kinetics involved.
A spectroscopic experiment to find out what was being deposited on
the windows of the discharge tube would also be interesting. An
experiment using the same procedure as used in the thesis experiment
only monitoring the HCl concentration could be conducted. More experi-
ments involved with monitoring the XeCl* 308 nm emission intensity
with the addition of H2 or other additives to the XeCl discharge mix
are highly recommended.
80
Bibliography
1. Ewing, J. J. Physics Today., 31:32 (1978).
2. Eden, G., Burnham, R., Champagne, L. F., Donohue, T., and Djeu,N. IEEE Spectrum. Page 50 (April 1979).
3. Pedrotti, L. Lecture Materials distributed in PH 7.43, Schoolof Engineering, Air Force Institute of Technology, Wright-PattersonAFB, Ohio, 1980.
4. Alberti, F. OSAHandbook of Optics. 8-34 (Fig 14). Edited byW. G. Driscoll.
5. Rothe, D. E., West, J. B., Bhaumik. IEEE J. Quant. Electron.,15: 314 (1979).
6. McKee, T. J., James, D. J., Nip, W. S., Weeks, R. W., andWillis, C. Applied Phys. Lett., 36: 943 (1980).
7. Vogel, G. AFIT Thesis on Hollow Cathode Discharge of XeCl(in preparation).
8. Ginter, M. L., Battino, R. J. Chem Phys., 52: 4469 (1970).
9. Fitzsimmons, W. A. Atomic Physics 3. Edited by S. J. Smithand G. K. Walters. New York: Plenum Press, 1973.
10. Hay, P. J. and Dunning, T. H. J. Chem. Phys., 69: 2209 (1978).
11. Brashears, H. C., Jr., and Setser, D. W. J. Phys. Chem., 84:224 (1980).
12. Tamagake, K., Kolts, J. H., and Setser, D. W. J. Chem. Phys.,71: 1264 (1979).
13. Tellinghuisen, J., Hoffman, J. M., Tisone, G. C., Hays, A. K.J. Chem. Phys., 64: 2484 (1976).
14. Kolts, J. H., Velazco, J. E., and Setser, D. W. J. Chem. Phys.,71: 1247 (1979).
15. Ewing, J. J. and Brau, C. A. Phys. Rev. A., 12: 129 (1975).
16. Dunning, T. H., Jr. and Hay, P. J. Appl. Phys. Lett., 28:649 (1976).
17. Hay, P. J. and Dunning, T. H., Jr. J. Chem. Phys., 66: 1306(1977).
18. DeJoseph, Charles. Wright Aeronautical Laboratory, Plasma
Physics Branch (private communication).
81
19. Lorents, D. C., Heustis, D. L., McCusken, M. V., Nakano, H. H.,and Hill, R. M. J. Chem. Phys., 68: 4657 (1978).
20. Fisher, C. H., Center, R. E., &nd McDaniel, J. P. Paper AB-3,presented at the 32nd Gaseous Electronics Conference, Pittsburgh,Penn., (October 1979).
21. Ewing, J. J. and Brau, C. A. Apii. PVs. Lett., 27: 350 (1975)
22. Bardsley, J. N. and Biondi, M. A. Advances in Atomic andMolecular Physics. New York: Academic Press, 1970.
23. Gundel, L. A., Setser, D. W., Clyne, M. A. A., Coxon, J. A. andNip, W. J. Chem. Phys., 64: 4390 (1976)
24. Gedanken, A. G., Jortner, J., Raz, B., and Szoke, A. J. Chem.Phys. 57: 3456 (1972).
25. Caledonia, G. E. Chem. Rev., 75: 333 (1975).
26. Christophorou, L. G. Atomic and Molecular Radiation Physics.London: Wiley and Sons, 1971.
27. Chen, J. L., Center, R. E., Trainor, D. W., and Fyfe, W. I.Appl. Pys. Lett., 30: 99 (1977).
28. Nygaard, K. J., Hunter, S. R., Fletcher, J., and Foltyn, S. R.Appl. Phys. Lett., 32: 351 (1978).
29. Johnson, T. H. and Hunter, A. M., II. J. .ppl. Phys., 5l: 2406(1980).
30. Velazco, J. E., Kolts, J. H., and Setser, D. W. J. Chem. Phys.,65: 3468 (1976).
31. Thompson, J. J. Philos. Mag., 47: 337 (1924).
32. Langevin, P. Ann. Chem. Phys., 28: 433 (1903).
33. Mangano, J. A., Jacob, J. H., Rokni, M., and Hawryluk, A.Appl. Phys. Lett., 31: 26 (1977).
34. Setser, D. W. Seventh Winter Colloquium on High Power VisibleLasers, Park City, Utah (1977) and subsequent private communicationto Ch. A. Brau. Quenching of KrF* by Xe was observed to be very fast(of the order of gas kinetic), but XeF* emission was very weak.
35. Lorents, D. C. Physica, 82c: 19 (1976).
36. Brau, C. A. Appl. Phys. Lett., 29: 7 (1976).
37. Rokni, M., Jacob, J. H., Managano, J. A., and Brocha, R. Ap_.Phys. Lett., 31: 79 (1977).
82
38. Tang, K. Y., Lorents, D. C., and Huestis, D. L. Paper AB-5,presented at the 32nd Gaseous Electronics Conference, Pittsburgh,Penn (October 1979).
39. Laser Meeting, Williamsburg, Virginia. August 1979.
40. Waynant and Eden, G. A~pRp Phys. Lett., (February 1980).
41. Seery, D. J. and Britton, D. J. Phys. Chem., 69: 2263 (1964).
42. Rothe, D. E. Phys. Rev., 177: 93 (1969).
43. Lorents, D. C., et al. SRI Rpt. MP73-2, Stanford Res. Inst.Unpublished Text. Menlo Park, California, 1973.
44. Gibson, G. E. and Bayless, N. S. Phys. Rev., 44: 188 (1933).
45. Wadt, W., et al. Appi. Phys. Lett., 31: 672 (1977).
46. Phelps, A. V. and Molnar, J. P. Phys. Rev., 82: 1202 (1953).
47. Gaur, J. P. and Chanin, L. M. Phys. Rev., 182: 167 (1969).
48. Kasner, W. H. Phys. Rev., 164: 194 (1967).
49. Leichner, P. K., et al. Phys. Rev. A., 13: 1787 (1976).
50. Vitols, A. P. and Oskam, H. J. Phys. Rev. A., 8: 1860 (1973).
51. Bardsley, J. N. and Biondi, M. A. Adv. At. Mol. Phy., 6: 2(1970).
52. Bourene, M. and LeCalve, J. J. Chem. Phys., 58: 1452 (1973).
53. Gleason, R. E., et al. J. Chem. Phys., 66: 1589 (1977).
54. Bohme, D. K., et al. J. Chem. Phys., 52: 5094 (1970).
55. Chen, C. L. Phys. Rev., 131: 2250 (1963).
56. Rice, J. K., Johnson, A. W. J. Chem. Phys. 63: 5238 (1975).
57. von Engel, A. Ionized Gases, 2nd ed., Great Britain: OxfordUniversity Press, 1965.
58. Rhodes, Ch. K., Editor. Topics in Applied Physics. Volume 30.Berlin and Heidelberg: Springer-Verlag, 1979.
59. Gill, P. and Webb, C. E. J, Phys. D: Appj. Phys., 10: 299(1977).
83
60. Crane, J. K. and Verdeyen, J. T. J. AppI. Phys., 51: 123-(1980).
61. Schuebel, W. K. Proc. XI Int. Conf. Phenomena in Ionized CCzech. Academy of Science, Prague, Czech., 1973.
62. Janossy, M., Csillag, L., Rozsa, K., and Salamon, T. Phys.A, 68: 317 (1978).
63. Janossy, M., Rozsa, K., Csillag, L., and Bergow, J. Phys.A, 46: 379 (1974).
64. Rozsa, K., Janossy, M., Bergow, J., and Csillag, L. Opt. C23: 15 (1977).
65. Nuchkov, N. K., Grozeva, M. G., and Sabotinov, N. V. Opt.27: 114 (1978).
66. Pacheva, Y., Stefanova, M., and Pramatarov, P. Opt. Commur121 (1978).
67. Verdeyen, J. T., Cherrington, B. E., Griffin, S. T., and SiM. H. Progress Report P-12528-P. Presented at Gaseous ElectronConference, Palo Alto, CA, October 1977.
68. Bailey, W. F. Lecture materials distributed in PH 7.51, Scof Engineering, Air Force Institute of Technology, Wright-PatterAFB, Ohio, 1980.
69. Penning, F. M. Handout in PH 7.51, School of Engineering,Force Institute of Technology, Wright-Patterson AFB, Ohio, 1980.
70. Borodin, V. S. and Kagan, Yu M. Sov. Phys. Tech. Phs.,
11: 131 (1966).
71. Gill, P. D. Phil. Thesis. University of Oxford (1975).
72. ---- Princeton Applied Research Photon CountinR. PrincetonNew Jersey: Princeton Applied Research Corporation, 1975.
73. ---- EMI Photomultilier Tubes, Brochure Ref: POOI/fP70 byEMI Electronics Ltd. Crawley Sussex England: Bookprint Limited
74. Morton, G. A. Appjed Optics, 7: 1 (1968).
75. Hengehold, R. L. Lecture materials distributed in PH 6.42,School of Engineering, Air Force Institute of Technology, WrightPatterson AFB, Ohio, 1980.
76. Solid State Radiations, Inc. Tech. Publ. 1100-1 (1969) LosAngeles, California.
84
77. Bevington, Philip R. Data Reduction and Error Analysis fc
Physical Sciences. New York: McGraw-Hill Book Company, 1969.
78. Chanin, L. M. and Biondi, M. A. Phys. Rev., 107: 1219 (1
79. Seery, D. J., and Britton, D. J. Phys. Chem., 68: 2263 (1
85
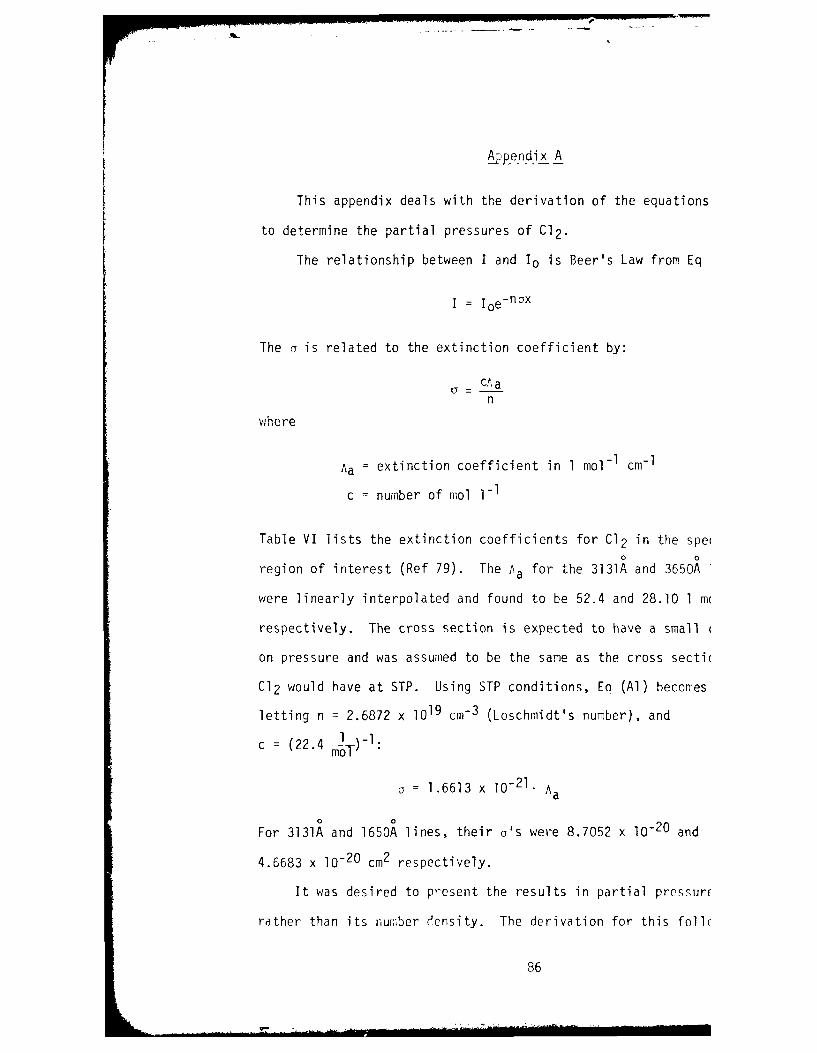
Appendix A
This appendix deals with the derivation of the equations
to determine the partial pressures of C12.
The relationship between I and Io is Beer's Law from Eq
I = Io e - n ax
The a is related to the extinction coefficient by:
CA an
where
Aa = extinction coefficient in 1 mol- I cm - 1
c = number of tool 1-1
Table VI lists the extinction coefficients for C12 in the spe(
region of interest (Ref 79). The Aa for the 3131A and 3650A
were linearly interpolated and found to be 52.4 and 28.10 1 m(
respectively. The cross section is expected to have a small (
on pressure and was assumed to be the same as the cross secti(
Cl2 would have at STP. Using STP conditions, En (Al) becomes
letting n 2.6872 x 1019 cm-3 (Loschmidt's number), and
c = (22.4 -iT)-1:
1.6613 x 10⁻² 1 . Aa
For 3131A and 1650A lines, their a's were 8.7052 x 10⁻²⁰ and
4.6683 x 10⁻²⁰ cm2 respectively.
It was desired to present the results in partial pressur(
rather than its nurmber density. The derivation for this follc
86
A-O-AO%4 4O AIR FORCE INST OF TECH WRIGHT-PATTERSON AFS OH SCHOO- ETC F/S 7/4MEASURE14ENT OF CL2 CONCENTRATION IN A XECL HOLLOW CATHODE DISCH--ETC(UlDEC Go j 0 WINEGARDEN
UNCLASSIFIED AFIT/GEP/PH/80 1
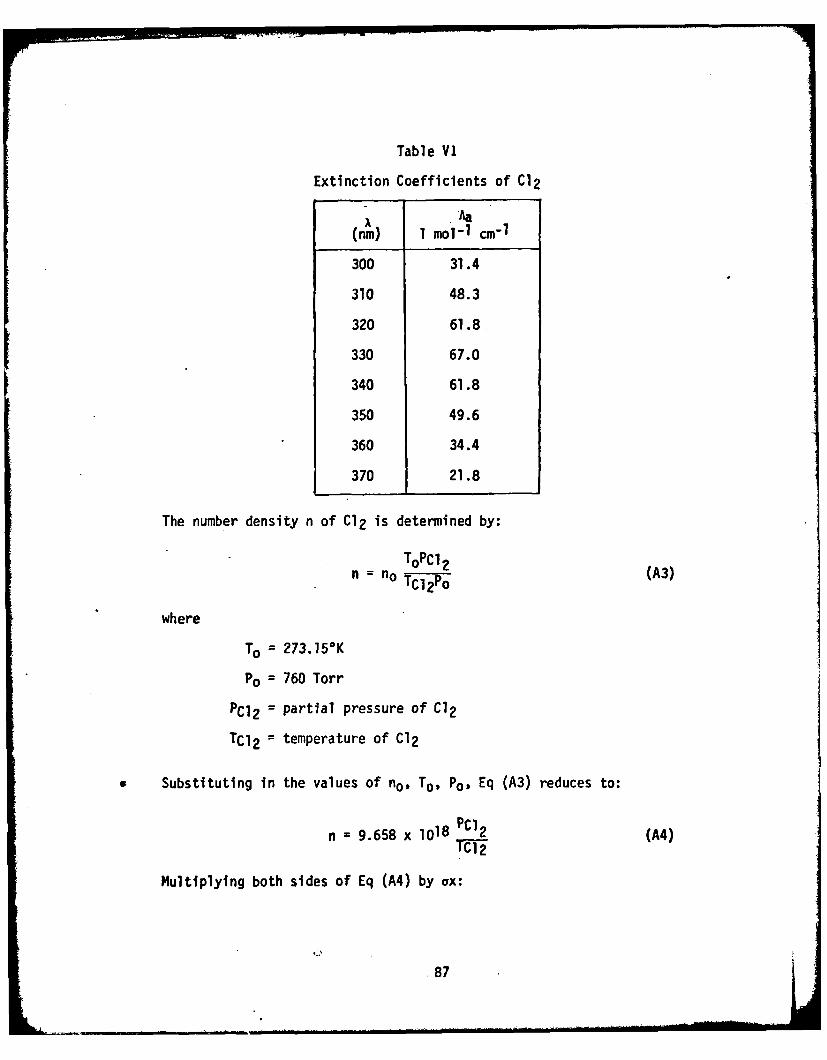
Table VI
Extinction Coefficients of C12
A Aa(nm) I mo 1-1 cm-1
300 31.4
310 48.3
320 61.8
330 67.0
340 61.8
350 49.6
360 34.4
370 21.8
The number density n of C12 is determined by:
ToPC12n = no TC12Po (A3)
where
To = 273.15 0K
PO = 760 Torr
PC12 = partial pressure of C12
TC12 = temperature of C12
Substituting in the values of no, To, Po, Eq (A3) reduces to:
n = 9.658 x 10¹⁸ PC12 (A4)
Multiplying both sides of Eq (A4) by ax:
87
nax 9.658 x 1018 PC12 Ox (M)TC 12
Reducing Eq (5) to: C
In ° -nx (A6)
Substituting for nax from Eq (A5):
In I = -9.658 x 10¹⁸ PC12 ax (A)0o TC12
0
Using the 3131A line and letting x = 78 cm (the length of the gas
filled tube) Eq (A7) reduces to:
-Tel 2 In __ - PCL 2 (A8)
65.6T5 Io
0
and using the a for 3650A line, Eq (A7) reduces to:
-TC 1i2 in L = PC12 (A9)
35.167 10
88
Appendix B
This appendix presents the derivation of the standard deviation
formula for error analysis of results. Since data is only presented
that was taken with the use of the 3650A line, the derivation will
use Eq (63)
-T n35.167In p
The standard mathematical procedure for finding the standard
deviation was used, i.e.,
2 nfl (Bi)nP IP"
where S2 = Variance of Pp
Sxn = Standard Deviation of the n variable
Using Eq (BI) on Eq (63) it is found:
IS2 =(In I ) 2 S2 ~- T 1-1)2 S2 + ( T 1o1)2 S2 (B2)
The ST was taken to equal 0.5*K and S1 and Slo were found from the
data. Factoring out (35.167)-2 and taking the square root of Eq (62),
the formula used is found:
Sp = 0.0284357 A(STln 1)2 + (TSjI1') 2 + (TS 0IoO-1)2 (B3)
The error of the data points plotted used this formula and were
refined before graphing (Ref 77).
89
Vita
Jerry D. Winegarden was born on 17 December 1956 in Gaylord,
Michigan. He is the son of Mr and Mrs F. Dean Winegarden of
Petoskey, Michigan. In June of 1975 he graduated from Petoskey High
School, Petoskey, Michigan. He received a B.S. degree in Applied
Physics from Michigan Technological University, Houghton, Michigan
in 1979 and was commissioned through the ROTC program and entered
the Air Force Institute of Technology in June 1979. He was married
to his wife, Megan, on 15 March 1980.
Permanent Address: 1005 Hazelton StreetPetoskey, MI 49770
This thesis was typed by Mrs Anna L. Lloyd.
90
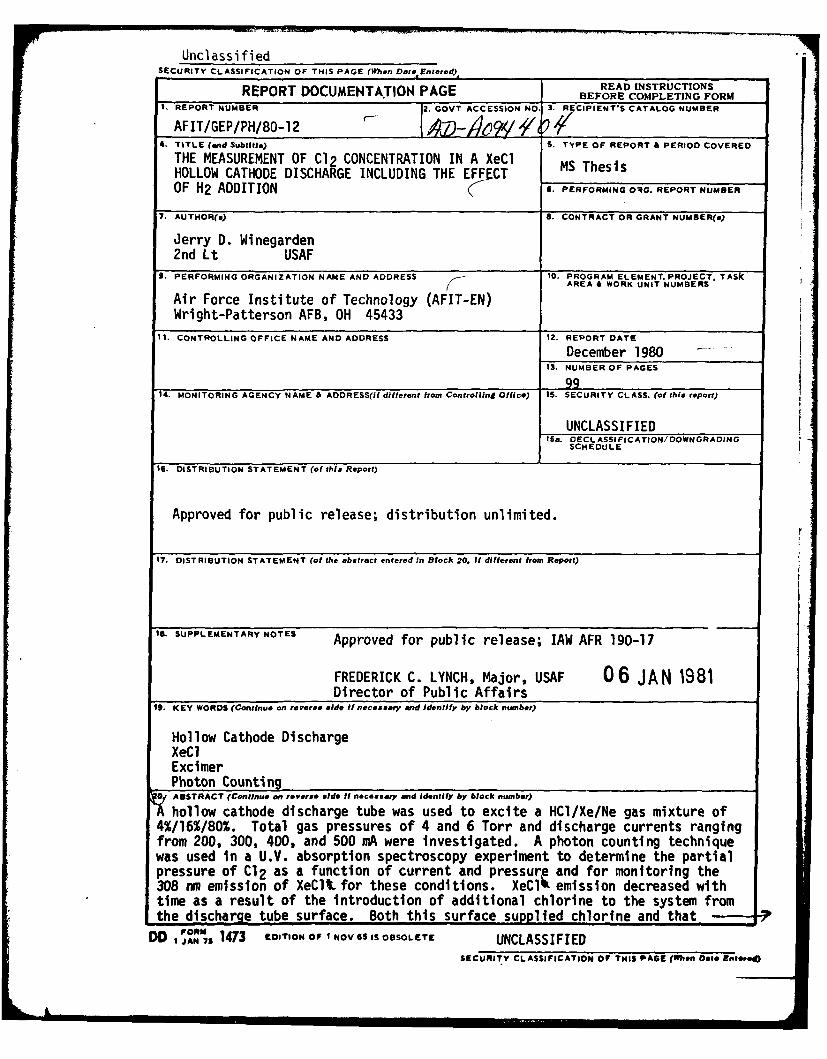
Unclassi fiedSECURITY CLASSIFICATION OF THIS PAGE (hen Date.Entered),
REPORT DOCUMENTATION PAGE READ INSTRUCTIONSREPORT __ __ __ __ __ __ _ BEFORE COMPLETING FORM
I. REPORT NUMBER 2. GOVT ACCESSION NO. 3. RECIPIENT'S CATALOG NUMBERAFIT/GEP/PH/80-12 _- _______,_/___, _/_/
4. TITLE (and Subtitle) S. TYPE OF REPORT & PERIOD COVERED
THE MEASUREMENT OF C12 CONCENTRATION IN A XeCl MS ThesisHOLLOW CATHODE DISCHARGE INCLUDING THE EFFECTOF H2 ADDITION - 6. PERFORMING ORG. REPORT NUMBER
7. AUTHOR(u) S. CONTRACT OR GRANT NUMBER(a)
Jerry D. Winegarden2nd Lt USAF
9. PERFORMING ORGANIZATION NAME AND ADDRESS 10. PROGRAM ELEMENT. PROJECT, TASkAREA 6 WORK UNIT NUMBERS
Air Force Institute of Technology (AFIT-EN)Wright-Patterson AFB, OH 45433
Ii. CONTROLLING OFFICE NAME AND ADDRESS 12. REPORT DATEDecember 1980
13. NUMBER OF PAGES
99__14. MONITORING AGENCY NAME & ADDRESS(II dilfersent from Controlling Office) IS. SECURITY CLASS. (of this report)
UNCLASSIFIEDIS. DECLASSIFICATION/DOWNGRADING
SCHEDULE
16. DISTRIBUTION STATEMENT (of this Report)
Approved for public release; distribution unlimited.
17. DISTRIBUTION STATEMENT (of the abstract entered In Block 20, If different from Report)
I8. SUPPLEMENTARY NOTES Approved for public release; IAW AFR 190-17
FREDERICK C. LYNCH, Major, USAF 06 JAN 1981Director of Public Affairs
19. KEY WORDS (Continu, on reveres side if necessary and identify by block number)
Hollow Cathode DischargeXeC1ExcimerPhoton Counting
7 ABSTRACT (Continue an reverae side II necessary and Identify by block number)
hollow cathode discharge tube was used to excite a HCl/Xe/Ne gas mixture of4%/16%/80%. Total gas pressures of 4 and 6 Torr and discharge currents rangingfrom 200, 300, 400, and 500 mA were investigated. A photon counting techniquewas used in a U.V. absorption spectroscopy experiment to determine the partialpressure of C12 as a function of current and pressure and for monitoring the308 rim emission of XeClI. for these conditions. XeCli emission decreased withtime as a result of the introduction of additional chlorine to the system fromthe discharge tube surface. Both this surface supplied chlorine and that
DD 1473 EDITIONOR NOV65 IS OSOLETE UNCLASSIFIED
SECURITY CLASSIFICATION OP THIS PAGE (When ole EnteteQ
S CURITY CLASSIFICATION OF THIS PAGZ(V*iwu Data Rptetgd)
originating froi the HCl in the original mix resulted in a substantial con-centration of Clj being observed. The surface desorption rate increased w hcurrent and was dramatically enhanced by the addition of small amounts of Hto the discharge mix.
UNCLASSIFIED__________________SIECURIY CLASSIFICATION OF ?' AGEI'Wh,.f Dote En.


![88TH FORCE SUPPORT SQUADRON WRIGHT-PATTERSON AFB…1].pdf · 88TH FORCE SUPPORT SQUADRON WRIGHT-PATTERSON AFB, OHIO ... . You may also view your leave and earnings statement (LES)](https://img.pdfslide.us/doc/110x75/5abf9e037f8b9a3a428e6d53/88th-force-support-squadron-wright-patterson-afb-1pdf88th-force-support-squadron.jpg)