Embed Size (px)
Citation preview
White Rose Development Plan Amendment
Production Volume Increase Supplemental Information
November 2006
Husky Document No. WR-DVG-RP-0010
Production Volume Increase Supplemental Information
WR-DVG-RP-0010
WR-DVG-RP-0010 Page 2 of 26
Table of Contents
1.0 Introduction ....................................................................................................................... 3 2.0 Supplemental Information ................................................................................................. 3
List of Tables Table 2.1 Hycal and Core Lab Measurements............................................................................ 3 Table 2.2 Values from Formation Water Testing......................................................................... 3 Table 2.3 Field Oil Water and Gas Production Volumes for 15,900 sm3/d Case ......................... 3 Table 2.4 Field Oil Water and Gas Production Volumes for 19,875 sm3/d Case ......................... 3 Table 2.5 Field Oil Water and Gas Production Volumes for 22,261 sm3/d Case ......................... 3 Table 2.6 Summary of Field Water Injection for Sealing Fault Scenario...................................... 3 Table 2.7 Summary of Field Water Injection for Non-Sealing Fault Scenario.............................. 3 Table 2.8 Summary of Predicted Gas Injection Volumes for each Rate Sensitivity Case
Evaluated.......................................................................................................................... 3 Table 2.9 Typical Gas-lift Rate for White Rose Field................................................................... 3 Table 2.10 Remaining South Avalon Development Wells to be Drilled ....................................... 3 Table 2.11 Base Case and Dry Oil Case .................................................................................... 3
List of Figures
Figure 2.1 Core Lab - Hycal Comparison.................................................................................... 3 Figure 2.2 Core Porosity and Permeability at Low Pressure ....................................................... 3 Figure 2.3 Core Porosity and Permeability at Simulated Overburden Pressure .......................... 3 Figure 2.4 Core Porosity-Permeability Relationship for White Rose Wells.................................. 3 Figure 2.5 Porosity-Permeability Relationship ............................................................................ 3
List of Appendices
Appendix A Increased Capacity Impact on Piping
Production Volume Increase Supplemental Information
WR-DVG-RP-0010
WR-RP-0010 Page 3 of 26
1.0 Introduction
On September 29, 2006, Husky Energy submitted an Amendment to its White Rose Development Plan, White Rose Development Plan Amendment – Production Volume Increase (WR-RP-00187) to the Canada – Newfoundland and Labrador Offshore Petroleum Board (C-NLOPB).
Following submission of the Development Plan Amendment, the C-NLOPB conducted a Completeness Review and on October 26, 2006 issued a request for additional information (C-NLOPB File:8010) (Husky Reference No. 003979508). This supplemental report addresses the request for additional information received from the C-NLOPB.
2.0 Supplemental Information
The following supplemental information is provided using the same numbering scheme as that used in the request for further information received from the C-NLOPB on October 26, 2006. The specific request from the C-NLOPB is shown in bold text.
1. A listing of all reports and data used by the proponent in the preparation of the Application.
Following is a list of reports and data used in the preparation of the Development Plan Amendment:
SeaRose FPSO - Performance Test - July / August 2006 Final Test Report (WR-DVG-RP-0005). 2006. Prepared by Husky Energy.
SeaRose FPSO - Performance Test - Main Power Generators - Final Test Report (WR-DVG-RP-0006). 2006. Report prepared for Husky Energy by Aker Kvaerner, Cahill, SCN-Lavalin.
SeaRose Debottlenecking Study (WR-DVG-RP-0001). 2006 Report prepared for Husky Energy by SGS Canada.
SeaRose FPSO MPG Gas Turbine Offshore Site Performance Testing August 2006 WR-DVG-RP-0004. 2006. Report prepared for Husky Energy by MSE Consultants Ltd.
White Rose Field Development Sea Rose Metering for 140,000 bbls/d Case (WR-DVG-RP-0003). 2006. Report prepared for Husky Energy by SGS Canada.
Sea Rose FPSO Piping Vibration Risk Assessment. (NSOX0046/1 Rev 0). 2006. Report prepared for Husky Energy by Acoustics and Vibrations Group, Bureau Veritas, Hampshire, UK. Reference to the following reports was made in Section 8.0 of the Development Plan Amendment. The reports have been re-issued as a result of the higher production rate and offloading frequency.
Production Volume Increase Supplemental Information
WR-DVG-RP-0010
WR-DVG-RP-0010 Page 4 of 26
Quantitative Risk Analysis (QRA) (WR-HSE-RP-0003). 2006. Report prepared for Husky Energy by W.S. Atkins, Glasgow, Scotland. Temporary Refuge Impairment Analysis (TRIA) (WR-HSE-RP-0004) 2006. Report prepared for Husky Energy by W.S. Atkins, Glasgow, Scotland. Fire Risk Analysis (FRA) (WR-HSE-RP-0009) 2006. Report prepared for Husky Energy by W.S. Atkins, Glasgow, Scotland. Inert Gas Dispersion Analysis (WR-HSE-RP-0014) 2006. Report prepared for Husky Energy by W.S. Atkins, Glasgow, Scotland. Ship Collision Risk Analysis (WR-HSE-RP-0021) 2006. Report prepared for Husky Energy by W.S. Atkins, Glasgow, Scotland. Cargo Pump Room Explosion Analysis (WR-HSE-RP-0062) 2006. Report prepared for Husky Energy by W.S. Atkins, Glasgow, Scotland.
2. Section 6.0, Figure 6.1 notes the current development region. It is observed that
Block 6, which was proposed for development in the Approved Development Plan, is not proposed for development in the Application. If this is correct it should be stated and the reason for no longer pursuing development should be noted.
The development of Block 6 was contemplated in the original White Rose Development Plan. However, with the drilling of the F-04 and F-04z wells in 2003, a greater understanding of the seismic interpretation into Block 6 was realized. The potential for reserves in Block 6 has decreased significantly as a result of this information because a level of fault seal not seen in the South Avalon Pool would be required for there to be any appreciable amount of hydrocarbons present. Therefore, development wells into Block 6 are not currently planned.
3. Section 6.2 Petrophysics: The following should be provided for the wells drilled since the original development plan submission:
a. the methods used to adjust core analysis data to reflect subsurface conditions;
b. assumptions and methods used in interpreting log data, including water resistivity values, porosity and permeability relationships;
c. cut-off criteria used to estimate net pays; and
d. procedures to calibrate logs and to calculate porosity, permeability and water saturation.
Reservoir Porosity and K_Air Permeability Overburden Compaction Factor
Standard core analysis may incorporate systematic errors in porosity because these values are measured at low pressure (e.g. 2758 Kpa), which lead to an over-estimation of porosity. At surface conditions pore volumes tend to expand with the decrease in
Production Volume Increase Supplemental Information
WR-DVG-RP-0010
WR-DVG-RP-0010 Page 5 of 26
confining pressure. Additional core analysis was undertaken to correct for the overburden.
Porosity and permeability measurements were taken on thirteen core plugs from WhiteRose A-17 and N-30. This work was carried out by Hycal Laboratories as a supplement to special core analysis work. The measurements were taken using CMS-300 equipment. Measurements were taken using a series of increasing pressures intended to simulate and span reservoir pressures existing in the White Rose Field.
The resulting data series have been trended to extract equations. These equations link the decrease in reservoir porosity and permeability to an increase to overburden or reservoir-equivalent pressures, and to the original porosity and permeability in each sample. These equations provide the basis for adjusting all “as measured” lab porosities and permeabilities to those representing the same rock under reservoir conditions.
Work Method
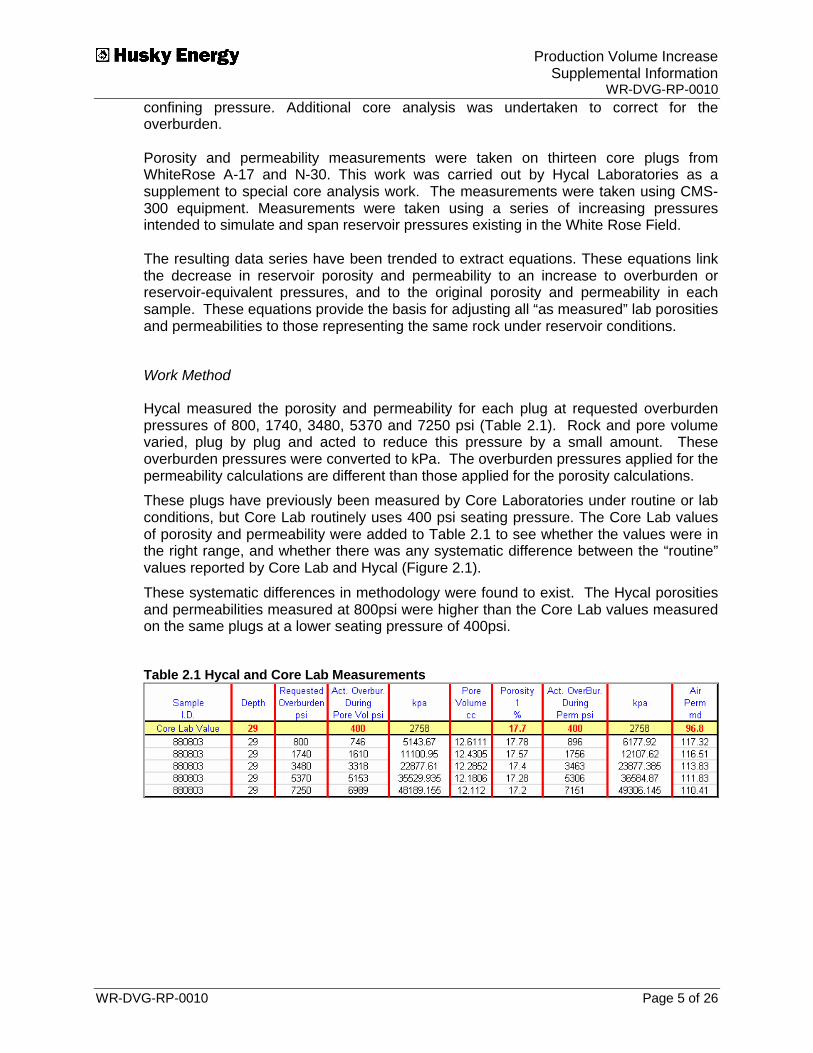
Hycal measured the porosity and permeability for each plug at requested overburden pressures of 800, 1740, 3480, 5370 and 7250 psi (Table 2.1). Rock and pore volume varied, plug by plug and acted to reduce this pressure by a small amount. These overburden pressures were converted to kPa. The overburden pressures applied for the permeability calculations are different than those applied for the porosity calculations.
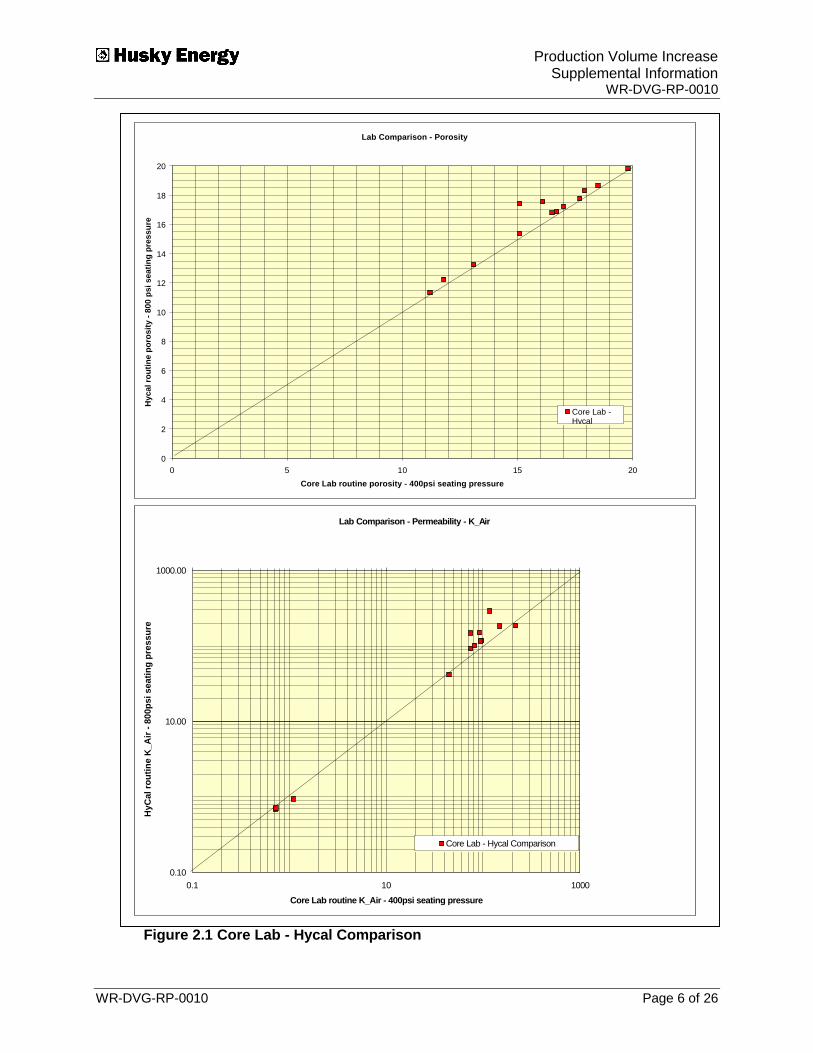
These plugs have previously been measured by Core Laboratories under routine or lab conditions, but Core Lab routinely uses 400 psi seating pressure. The Core Lab values of porosity and permeability were added to Table 2.1 to see whether the values were in the right range, and whether there was any systematic difference between the “routine” values reported by Core Lab and Hycal (Figure 2.1).
These systematic differences in methodology were found to exist. The Hycal porosities and permeabilities measured at 800psi were higher than the Core Lab values measured on the same plugs at a lower seating pressure of 400psi.
Table 2.1 Hycal and Core Lab Measurements
Production Volume Increase Supplemental Information
WR-DVG-RP-0010
WR-DVG-RP-0010 Page 6 of 26
Figure 2.1 Core Lab - Hycal Comparison
Lab Comparison - Porosity
0
2
4
6
8
10
12
14
16
18
20
0 5 10 15 20Core Lab routine porosity - 400psi seating pressure
Hyc
al ro
utin
e po
rosi
ty -
800
psi s
eatin
g pr
essu
re
Core Lab -Hycal
Lab Comparison - Permeability - K_Air
0.10
10.00
1000.00
0.1 10 1000
Core Lab routine K_Air - 400psi seating pressure
HyC
al ro
utin
e K
_Air
- 800
psi s
eatin
g pr
essu
re
Core Lab - Hycal Comparison
Production Volume Increase Supplemental Information
WR-DVG-RP-0010
WR-DVG-RP-0010 Page 7 of 26
Overburden Correction
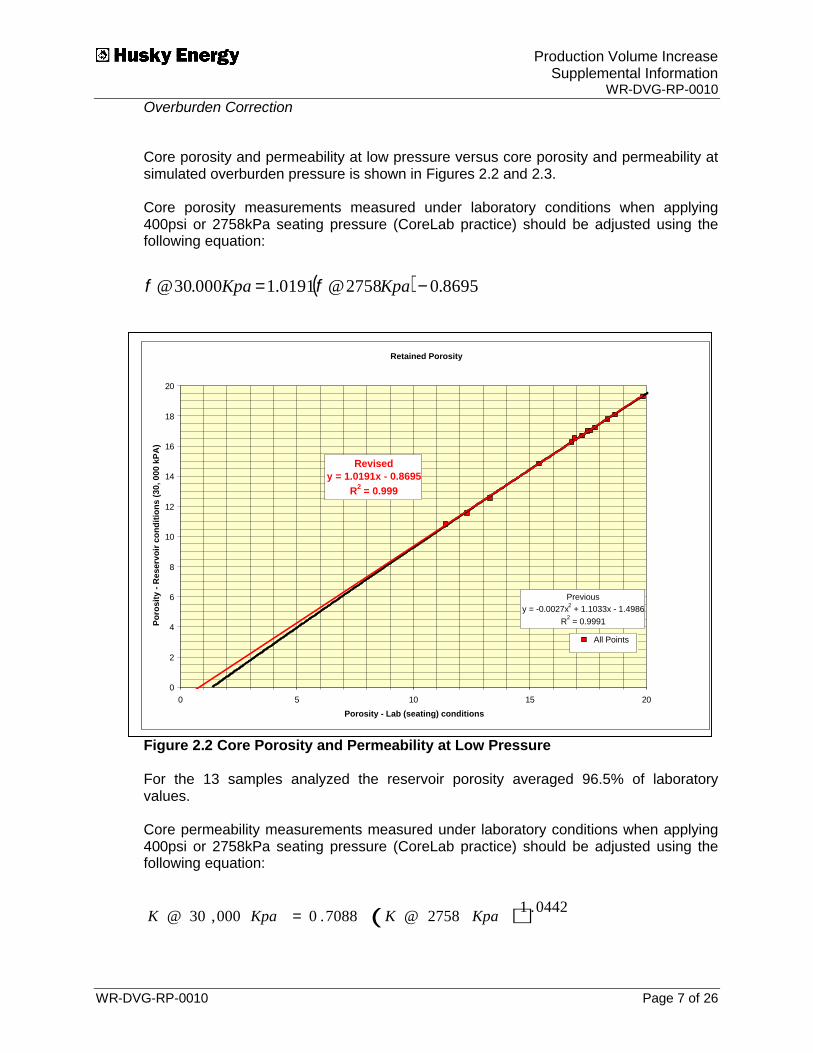
Core porosity and permeability at low pressure versus core porosity and permeability at simulated overburden pressure is shown in Figures 2.2 and 2.3.
Core porosity measurements measured under laboratory conditions when applying 400psi or 2758kPa seating pressure (CoreLab practice) should be adjusted using the following equation:
( ) [email protected]@ −= KpaKpa φφ
Figure 2.2 Core Porosity and Permeability at Low Pressure
For the 13 samples analyzed the reservoir porosity averaged 96.5% of laboratory values.
Core permeability measurements measured under laboratory conditions when applying 400psi or 2758kPa seating pressure (CoreLab practice) should be adjusted using the following equation:
( )KpaKKpaK 2758@ 0442.17088.0000,30@ =
Retained Porosity
Previousy = -0.0027x2 + 1.1033x - 1.4986
R2 = 0.9991
Revised y = 1.0191x - 0.8695
R2 = 0.999
0
2
4
6
8
10
12
14
16
18
20
0 5 10 15 20Porosity - Lab (seating) conditions
Poro
sity
- R
eser
voir
cond
ition
s (3
0, 0
00 k
PA)
All Points
Poly. (All

Production Volume Increase Supplemental Information
WR-DVG-RP-0010
WR-DVG-RP-0010 Page 8 of 26
Figure 2.3 Core Porosity and Permeability at Simulated Overburden Pressure
For the 13 samples measured, the reservoir permeability averages 87.2% of laboratory values.
Methods used in the Petrophysics of the White Rose Field Permeability calculation
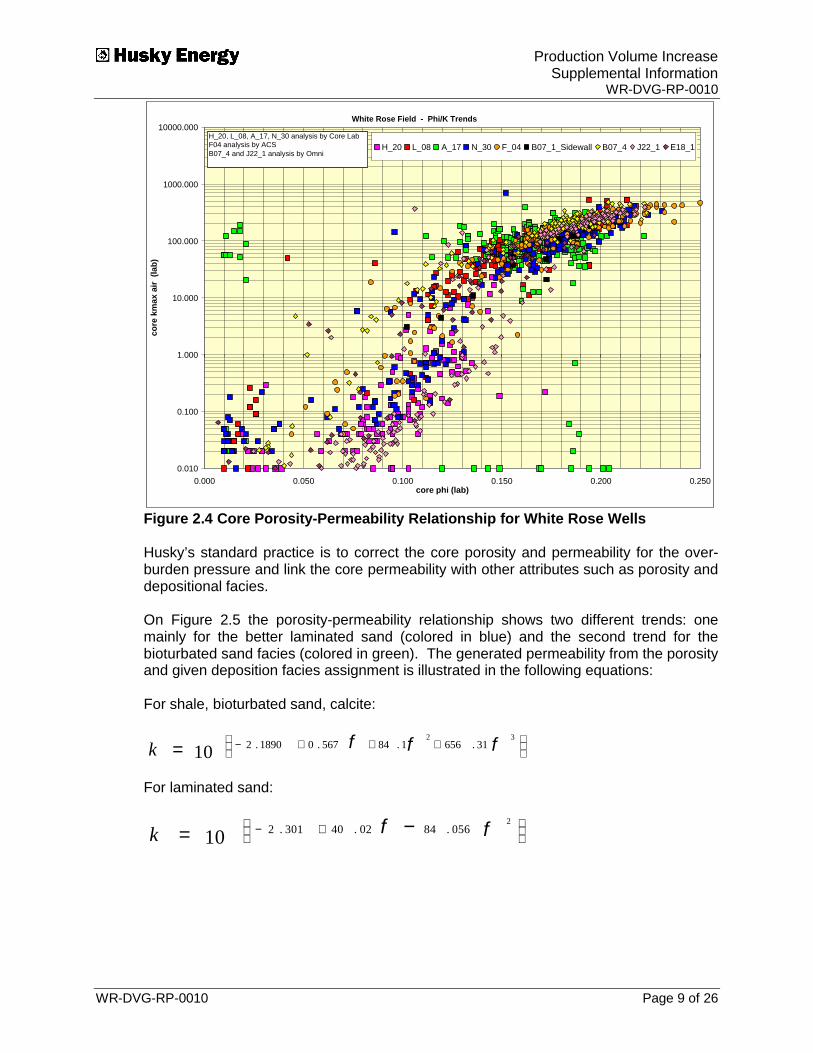
For all the wells in the White Rose Field that have core, Figure 2.4 illustrates the core porosity-permeability relationship.
Retained K_Air
Previous y = 0.5237x1.1205
R2 = 0.9995
Revised y = 0.7088x1.0442
R2 = 0.9975
0.1
10
1000
0.1 10 1000
Perm (K_Air)- Lab (Seating) Conditions
Per
m (K
_Air)
- R
eser
voir
Pres
sure
(30,
000
kPa)
K_Air - Lab to OB correction factor
Production Volume Increase Supplemental Information
WR-DVG-RP-0010
WR-DVG-RP-0010 Page 9 of 26
0.010
0.100
1.000
10.000
100.000
1000.000
10000.000
0.000 0.050 0.100 0.150 0.200 0.250core phi (lab)
core
km
ax a
ir (l
ab)
H_20 L_08 A_17 N_30 F_04 B07_1_Sidewall B07_4 J22_1 E18_1
White Rose Field - Phi/K Trends
H_20, L_08, A_17, N_30 analysis by Core LabF04 analysis by ACS B07_4 and J22_1 analysis by Omni
Figure 2.4 Core Porosity-Permeability Relationship for White Rose Wells
Husky’s standard practice is to correct the core porosity and permeability for the over-burden pressure and link the core permeability with other attributes such as porosity and depositional facies.
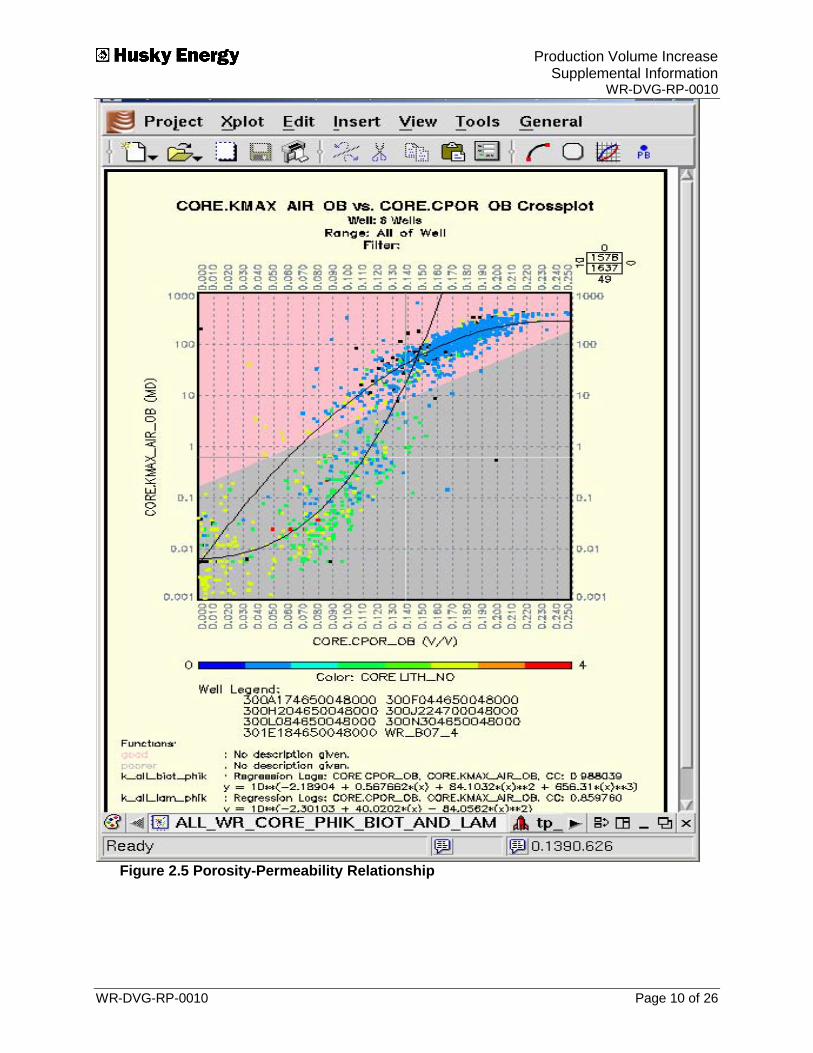
On Figure 2.5 the porosity-permeability relationship shows two different trends: one mainly for the better laminated sand (colored in blue) and the second trend for the bioturbated sand facies (colored in green). The generated permeability from the porosity and given deposition facies assignment is illustrated in the following equations:
For shale, bioturbated sand, calcite:
1032
31.6561.84567.01890.2
+++−= φφφk
For laminated sand:
102
056.8402.40301.2
+− −= φφk
Production Volume Increase Supplemental Information
WR-DVG-RP-0010
WR-DVG-RP-0010 Page 10 of 26
Figure 2.5 Porosity-Permeability Relationship
Production Volume Increase Supplemental Information
WR-DVG-RP-0010
WR-DVG-RP-0010 Page 11 of 26
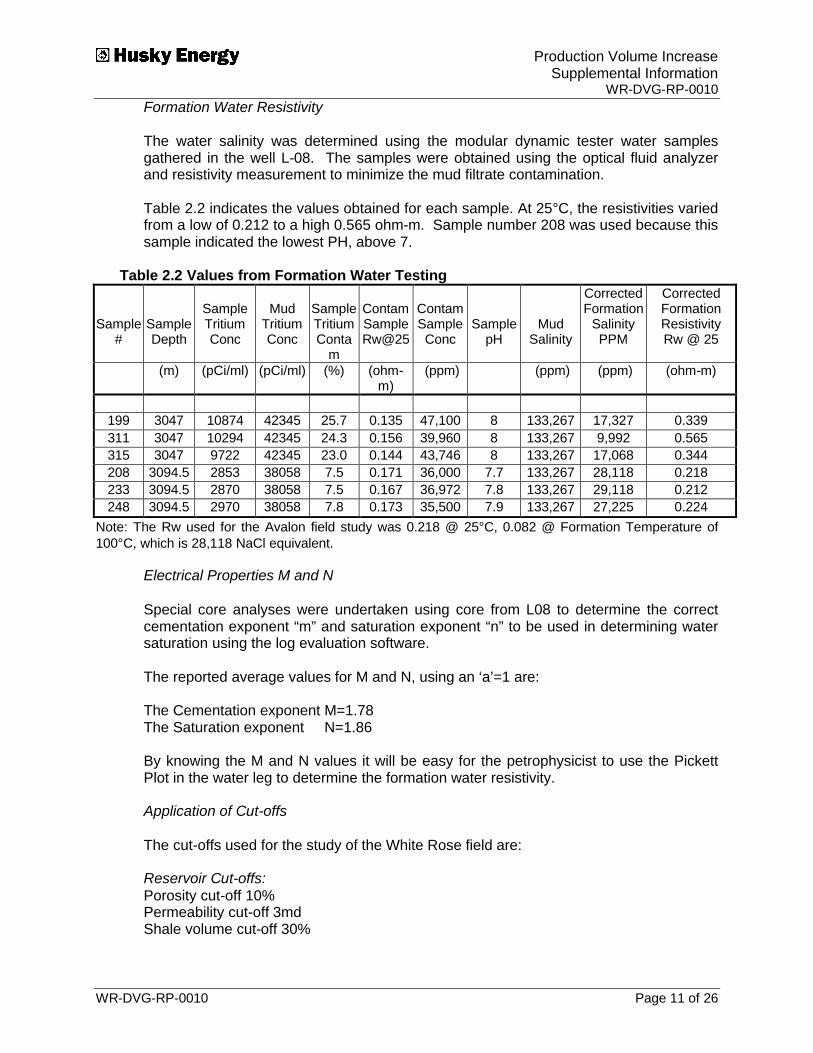
Formation Water Resistivity The water salinity was determined using the modular dynamic tester water samples gathered in the well L-08. The samples were obtained using the optical fluid analyzer and resistivity measurement to minimize the mud filtrate contamination. Table 2.2 indicates the values obtained for each sample. At 25°C, the resistivities varied from a low of 0.212 to a high 0.565 ohm-m. Sample number 208 was used because this sample indicated the lowest PH, above 7.
Table 2.2 Values from Formation Water Testing
Sample #
Sample Depth
Sample Tritium Conc
Mud
Tritium Conc
Sample Tritium Conta
m
Contam Sample Rw@25
Contam Sample Conc
Sample pH
Mud Salinity
Corrected Formation
Salinity PPM
Corrected Formation Resistivity Rw @ 25
(m) (pCi/ml) (pCi/ml) (%) (ohm-m)
(ppm) (ppm) (ppm) (ohm-m)
199 3047 10874 42345 25.7 0.135 47,100 8 133,267 17,327 0.339 311 3047 10294 42345 24.3 0.156 39,960 8 133,267 9,992 0.565 315 3047 9722 42345 23.0 0.144 43,746 8 133,267 17,068 0.344 208 3094.5 2853 38058 7.5 0.171 36,000 7.7 133,267 28,118 0.218 233 3094.5 2870 38058 7.5 0.167 36,972 7.8 133,267 29,118 0.212 248 3094.5 2970 38058 7.8 0.173 35,500 7.9 133,267 27,225 0.224
Note: The Rw used for the Avalon field study was 0.218 @ 25°C, 0.082 @ Formation Temperature of 100°C, which is 28,118 NaCl equivalent.
Electrical Properties M and N Special core analyses were undertaken using core from L08 to determine the correct cementation exponent “m” and saturation exponent “n” to be used in determining water saturation using the log evaluation software. The reported average values for M and N, using an ‘a’=1 are: The Cementation exponent M=1.78 The Saturation exponent N=1.86 By knowing the M and N values it will be easy for the petrophysicist to use the Pickett Plot in the water leg to determine the formation water resistivity. Application of Cut-offs The cut-offs used for the study of the White Rose field are: Reservoir Cut-offs: Porosity cut-off 10% Permeability cut-off 3md Shale volume cut-off 30%
Production Volume Increase Supplemental Information
WR-DVG-RP-0010
WR-DVG-RP-0010 Page 12 of 26
Pay Cut-offs Porosity cut-off 10% Permeability cut-off 3md Shale volume cut-off 30% Water saturation cut-off 50%
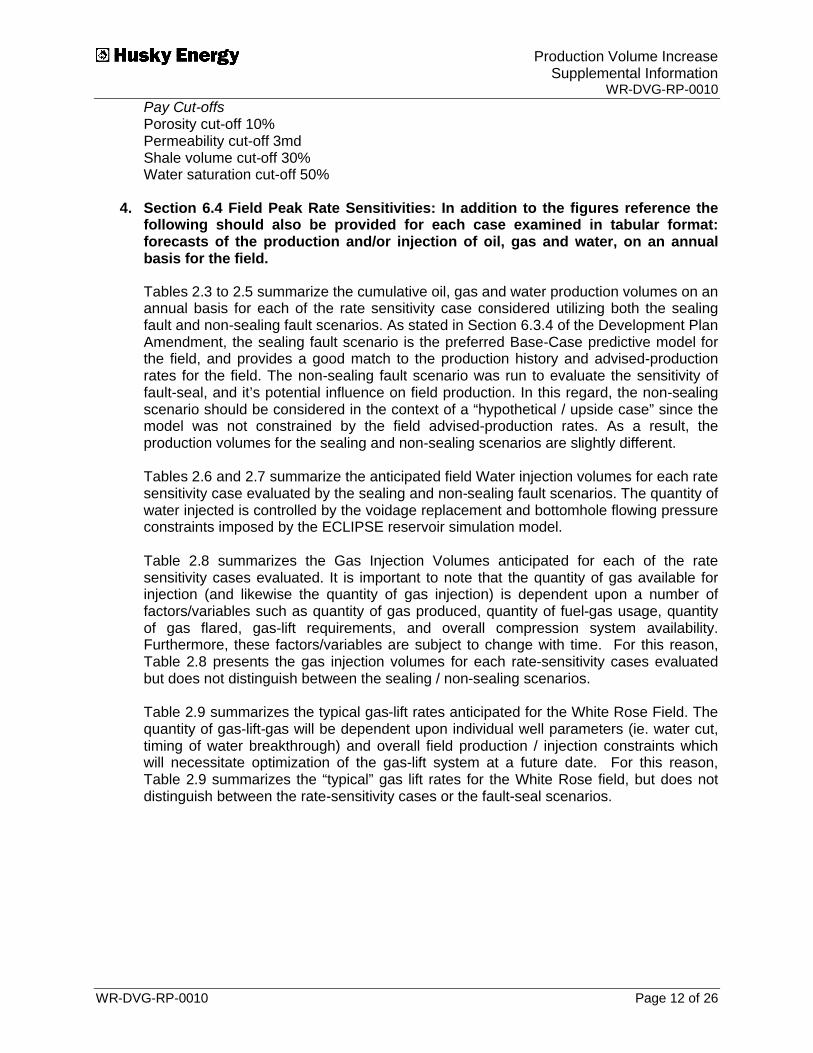
4. Section 6.4 Field Peak Rate Sensitivities: In addition to the figures reference the
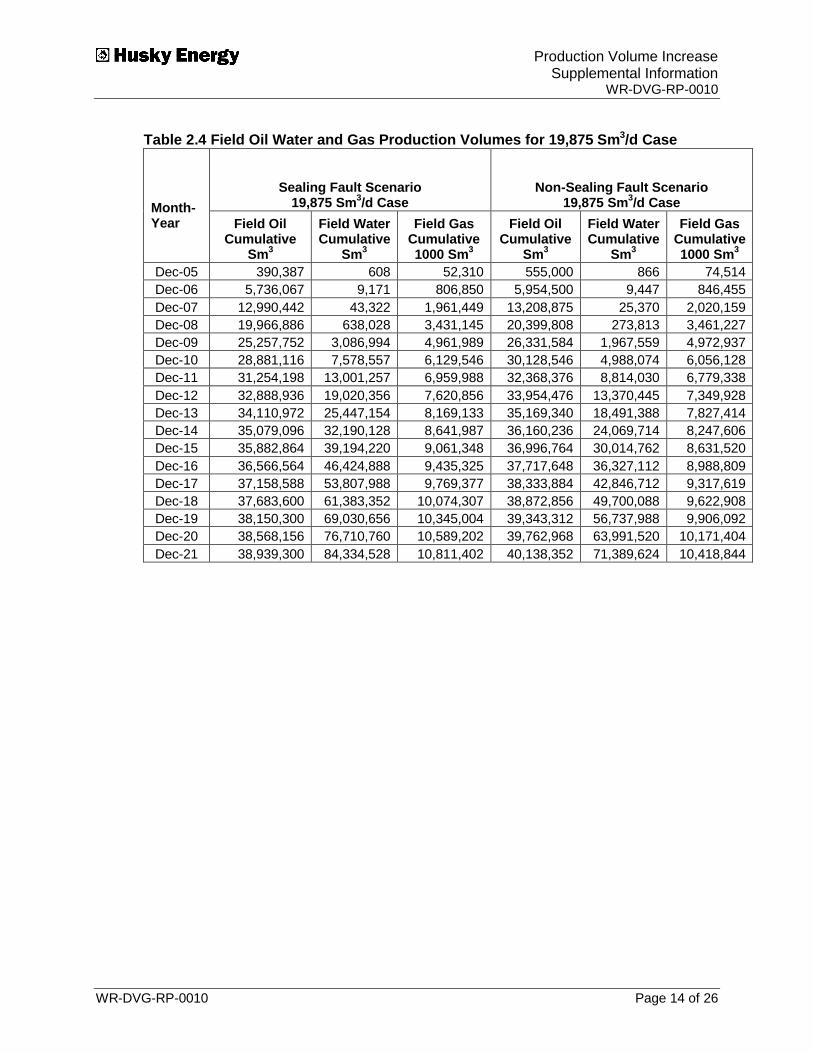
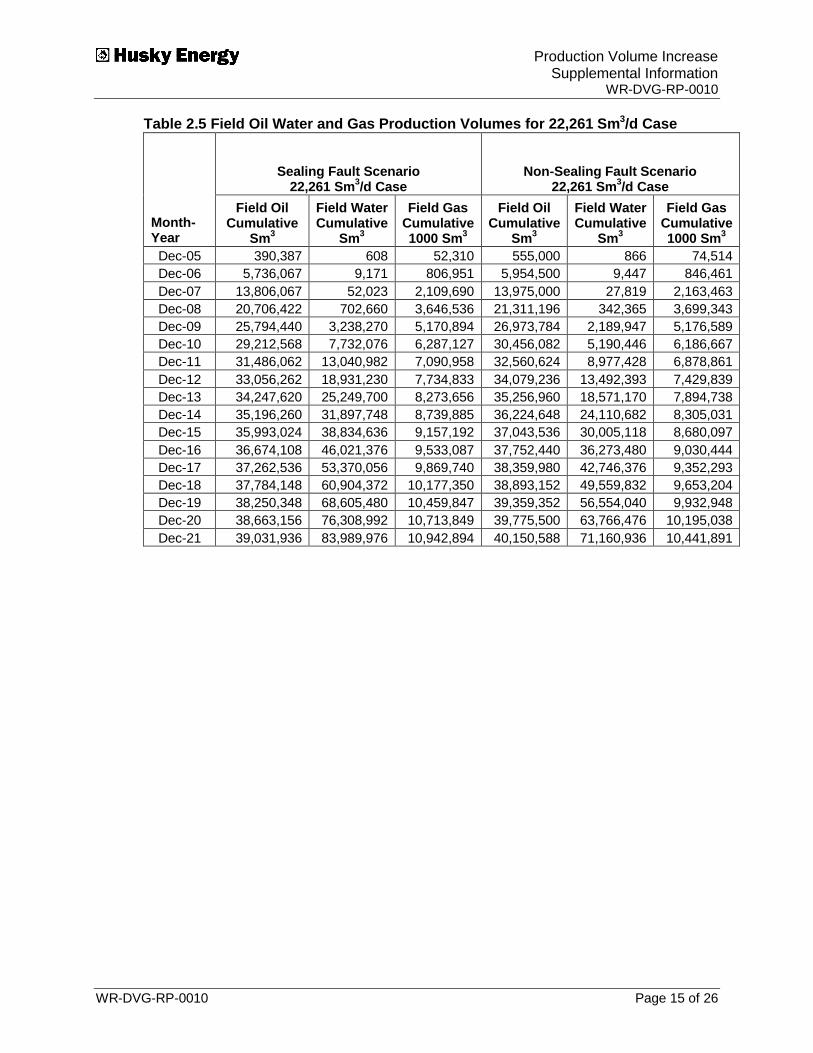
following should also be provided for each case examined in tabular format: forecasts of the production and/or injection of oil, gas and water, on an annual basis for the field.
Tables 2.3 to 2.5 summarize the cumulative oil, gas and water production volumes on an annual basis for each of the rate sensitivity case considered utilizing both the sealing fault and non-sealing fault scenarios. As stated in Section 6.3.4 of the Development Plan Amendment, the sealing fault scenario is the preferred Base-Case predictive model for the field, and provides a good match to the production history and advised-production rates for the field. The non-sealing fault scenario was run to evaluate the sensitivity of fault-seal, and it’s potential influence on field production. In this regard, the non-sealing scenario should be considered in the context of a “hypothetical / upside case” since the model was not constrained by the field advised-production rates. As a result, the production volumes for the sealing and non-sealing scenarios are slightly different.
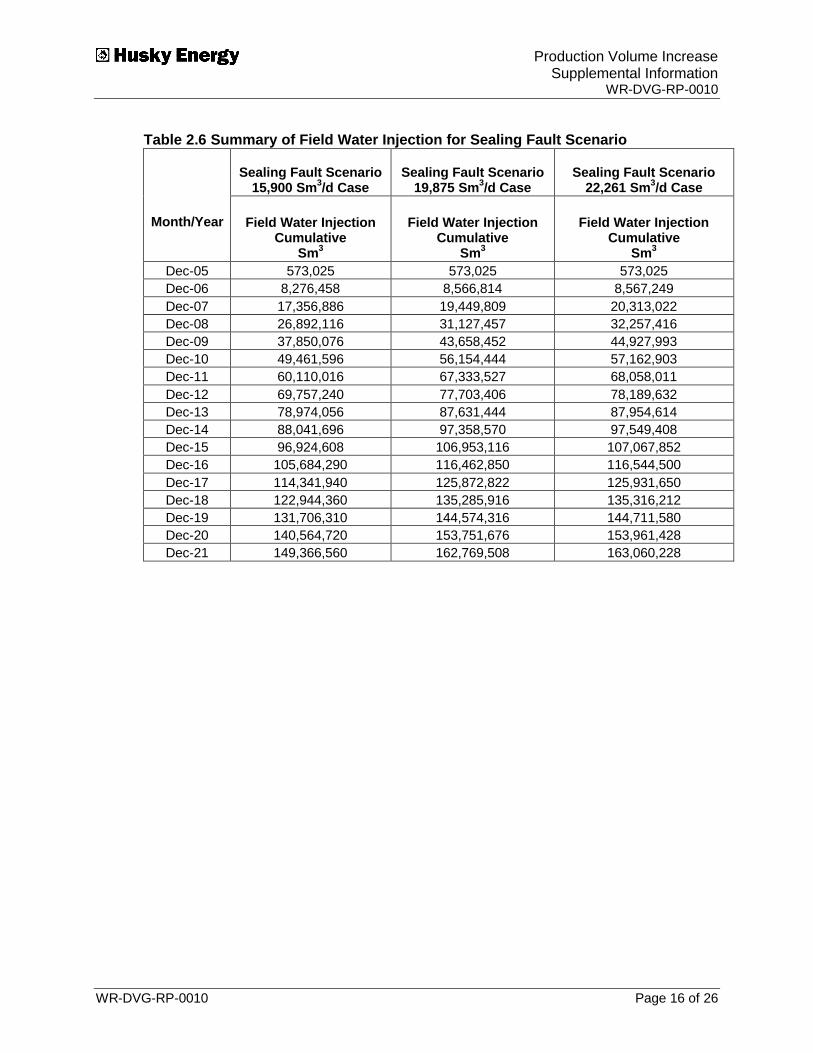
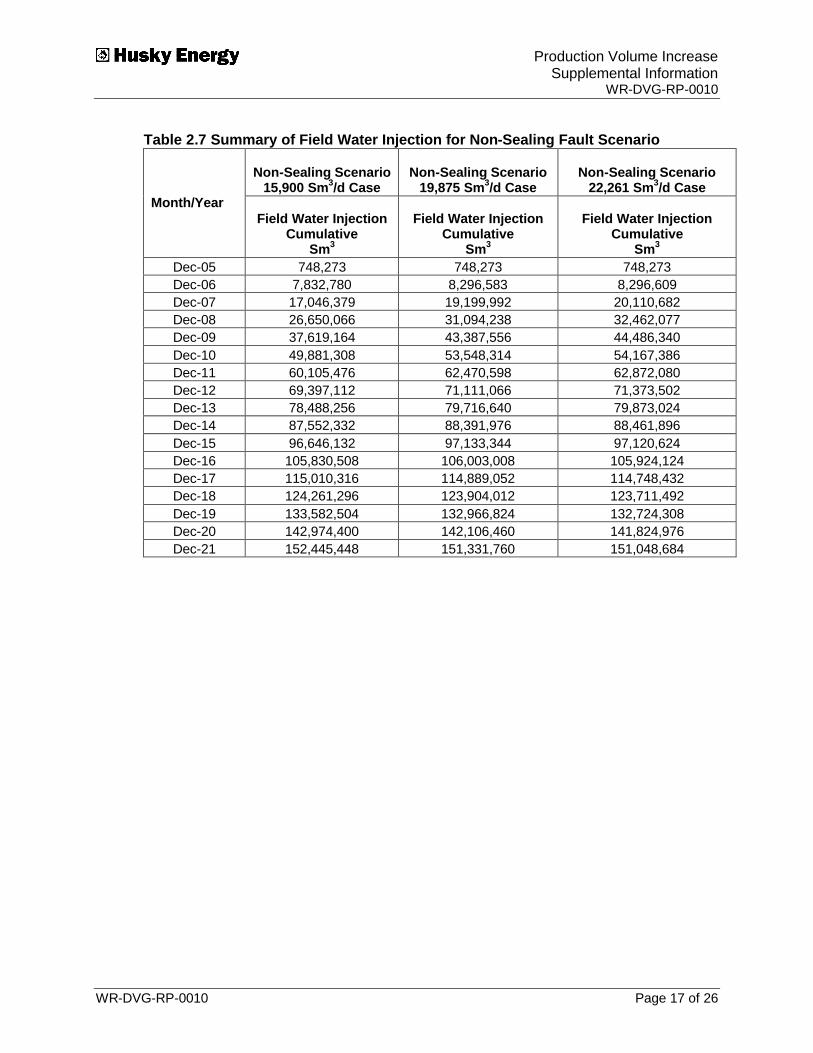
Tables 2.6 and 2.7 summarize the anticipated field Water injection volumes for each rate sensitivity case evaluated by the sealing and non-sealing fault scenarios. The quantity of water injected is controlled by the voidage replacement and bottomhole flowing pressure constraints imposed by the ECLIPSE reservoir simulation model.
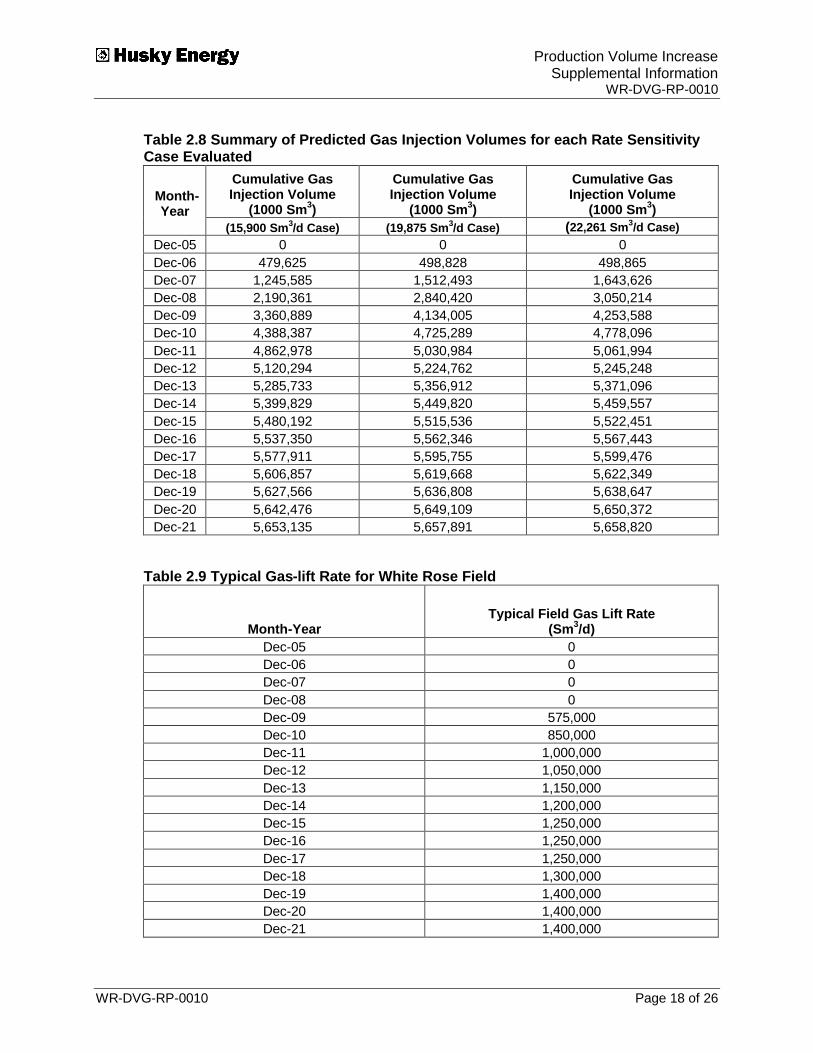
Table 2.8 summarizes the Gas Injection Volumes anticipated for each of the rate sensitivity cases evaluated. It is important to note that the quantity of gas available for injection (and likewise the quantity of gas injection) is dependent upon a number of factors/variables such as quantity of gas produced, quantity of fuel-gas usage, quantity of gas flared, gas-lift requirements, and overall compression system availability. Furthermore, these factors/variables are subject to change with time. For this reason, Table 2.8 presents the gas injection volumes for each rate-sensitivity cases evaluated but does not distinguish between the sealing / non-sealing scenarios.
Table 2.9 summarizes the typical gas-lift rates anticipated for the White Rose Field. The quantity of gas-lift-gas will be dependent upon individual well parameters (ie. water cut, timing of water breakthrough) and overall field production / injection constraints which will necessitate optimization of the gas-lift system at a future date. For this reason, Table 2.9 summarizes the “typical” gas lift rates for the White Rose field, but does not distinguish between the rate-sensitivity cases or the fault-seal scenarios.
Production Volume Increase Supplemental Information
WR-DVG-RP-0010
WR-DVG-RP-0010 Page 13 of 26
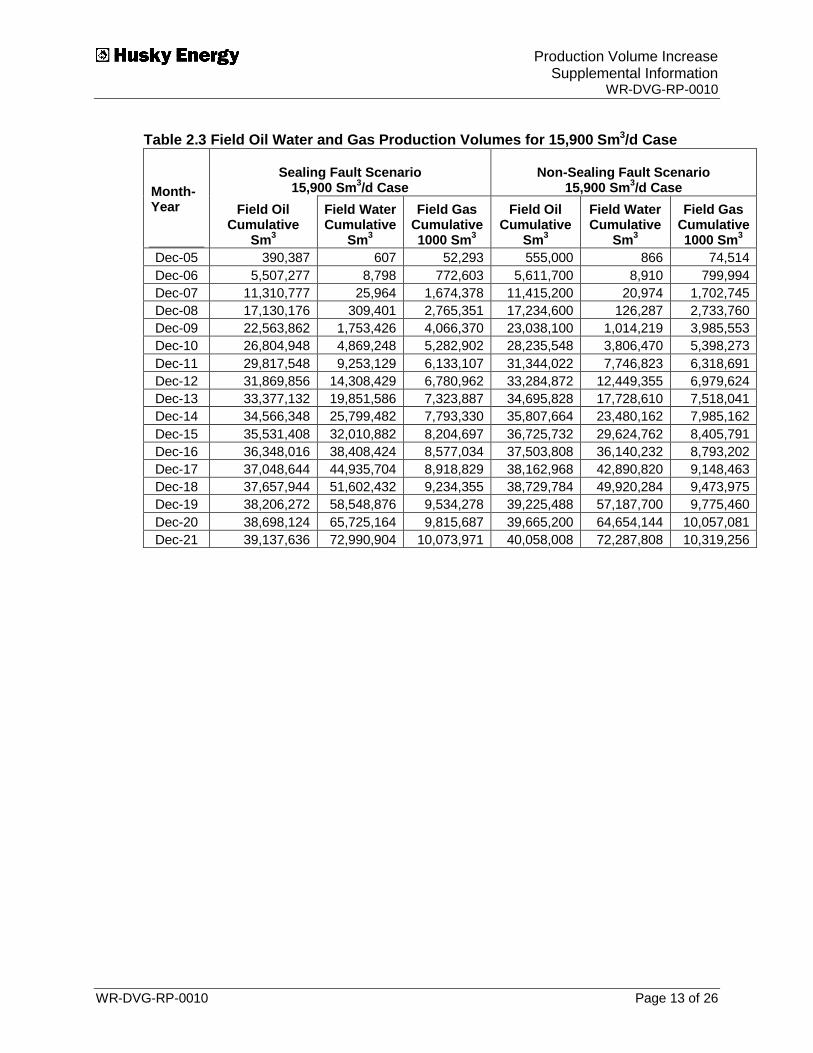
Table 2.3 Field Oil Water and Gas Production Volumes for 15,900 Sm3/d Case
Sealing Fault Scenario 15,900 Sm3/d Case
Non-Sealing Fault Scenario 15,900 Sm3/d Case
Month-Year
Field Oil Cumulative
Sm3
Field Water Cumulative
Sm3
Field Gas Cumulative 1000 Sm3
Field Oil Cumulative
Sm3
Field Water Cumulative
Sm3
Field Gas Cumulative 1000 Sm3
Dec-05 390,387 607 52,293 555,000 866 74,514 Dec-06 5,507,277 8,798 772,603 5,611,700 8,910 799,994 Dec-07 11,310,777 25,964 1,674,378 11,415,200 20,974 1,702,745 Dec-08 17,130,176 309,401 2,765,351 17,234,600 126,287 2,733,760 Dec-09 22,563,862 1,753,426 4,066,370 23,038,100 1,014,219 3,985,553 Dec-10 26,804,948 4,869,248 5,282,902 28,235,548 3,806,470 5,398,273 Dec-11 29,817,548 9,253,129 6,133,107 31,344,022 7,746,823 6,318,691 Dec-12 31,869,856 14,308,429 6,780,962 33,284,872 12,449,355 6,979,624 Dec-13 33,377,132 19,851,586 7,323,887 34,695,828 17,728,610 7,518,041 Dec-14 34,566,348 25,799,482 7,793,330 35,807,664 23,480,162 7,985,162 Dec-15 35,531,408 32,010,882 8,204,697 36,725,732 29,624,762 8,405,791 Dec-16 36,348,016 38,408,424 8,577,034 37,503,808 36,140,232 8,793,202 Dec-17 37,048,644 44,935,704 8,918,829 38,162,968 42,890,820 9,148,463 Dec-18 37,657,944 51,602,432 9,234,355 38,729,784 49,920,284 9,473,975 Dec-19 38,206,272 58,548,876 9,534,278 39,225,488 57,187,700 9,775,460 Dec-20 38,698,124 65,725,164 9,815,687 39,665,200 64,654,144 10,057,081 Dec-21 39,137,636 72,990,904 10,073,971 40,058,008 72,287,808 10,319,256
Production Volume Increase Supplemental Information
WR-DVG-RP-0010
WR-DVG-RP-0010 Page 14 of 26
Table 2.4 Field Oil Water and Gas Production Volumes for 19,875 Sm3/d Case
Sealing Fault Scenario 19,875 Sm3/d Case
Non-Sealing Fault Scenario 19,875 Sm3/d Case
Month-Year
Field Oil Cumulative
Sm3
Field Water Cumulative
Sm3
Field Gas Cumulative 1000 Sm3
Field Oil Cumulative
Sm3
Field Water Cumulative
Sm3
Field Gas Cumulative 1000 Sm3
Dec-05 390,387 608 52,310 555,000 866 74,514 Dec-06 5,736,067 9,171 806,850 5,954,500 9,447 846,455 Dec-07 12,990,442 43,322 1,961,449 13,208,875 25,370 2,020,159 Dec-08 19,966,886 638,028 3,431,145 20,399,808 273,813 3,461,227 Dec-09 25,257,752 3,086,994 4,961,989 26,331,584 1,967,559 4,972,937 Dec-10 28,881,116 7,578,557 6,129,546 30,128,546 4,988,074 6,056,128 Dec-11 31,254,198 13,001,257 6,959,988 32,368,376 8,814,030 6,779,338 Dec-12 32,888,936 19,020,356 7,620,856 33,954,476 13,370,445 7,349,928 Dec-13 34,110,972 25,447,154 8,169,133 35,169,340 18,491,388 7,827,414 Dec-14 35,079,096 32,190,128 8,641,987 36,160,236 24,069,714 8,247,606 Dec-15 35,882,864 39,194,220 9,061,348 36,996,764 30,014,762 8,631,520 Dec-16 36,566,564 46,424,888 9,435,325 37,717,648 36,327,112 8,988,809 Dec-17 37,158,588 53,807,988 9,769,377 38,333,884 42,846,712 9,317,619 Dec-18 37,683,600 61,383,352 10,074,307 38,872,856 49,700,088 9,622,908 Dec-19 38,150,300 69,030,656 10,345,004 39,343,312 56,737,988 9,906,092 Dec-20 38,568,156 76,710,760 10,589,202 39,762,968 63,991,520 10,171,404 Dec-21 38,939,300 84,334,528 10,811,402 40,138,352 71,389,624 10,418,844
Production Volume Increase Supplemental Information
WR-DVG-RP-0010
WR-DVG-RP-0010 Page 15 of 26
Table 2.5 Field Oil Water and Gas Production Volumes for 22,261 Sm3/d Case
Sealing Fault Scenario 22,261 Sm3/d Case
Non-Sealing Fault Scenario 22,261 Sm3/d Case
Month-Year
Field Oil Cumulative
Sm3
Field Water Cumulative
Sm3
Field Gas Cumulative 1000 Sm3
Field Oil Cumulative
Sm3
Field Water Cumulative
Sm3
Field Gas Cumulative 1000 Sm3
Dec-05 390,387 608 52,310 555,000 866 74,514 Dec-06 5,736,067 9,171 806,951 5,954,500 9,447 846,461 Dec-07 13,806,067 52,023 2,109,690 13,975,000 27,819 2,163,463 Dec-08 20,706,422 702,660 3,646,536 21,311,196 342,365 3,699,343 Dec-09 25,794,440 3,238,270 5,170,894 26,973,784 2,189,947 5,176,589 Dec-10 29,212,568 7,732,076 6,287,127 30,456,082 5,190,446 6,186,667 Dec-11 31,486,062 13,040,982 7,090,958 32,560,624 8,977,428 6,878,861 Dec-12 33,056,262 18,931,230 7,734,833 34,079,236 13,492,393 7,429,839 Dec-13 34,247,620 25,249,700 8,273,656 35,256,960 18,571,170 7,894,738 Dec-14 35,196,260 31,897,748 8,739,885 36,224,648 24,110,682 8,305,031 Dec-15 35,993,024 38,834,636 9,157,192 37,043,536 30,005,118 8,680,097 Dec-16 36,674,108 46,021,376 9,533,087 37,752,440 36,273,480 9,030,444 Dec-17 37,262,536 53,370,056 9,869,740 38,359,980 42,746,376 9,352,293 Dec-18 37,784,148 60,904,372 10,177,350 38,893,152 49,559,832 9,653,204 Dec-19 38,250,348 68,605,480 10,459,847 39,359,352 56,554,040 9,932,948 Dec-20 38,663,156 76,308,992 10,713,849 39,775,500 63,766,476 10,195,038 Dec-21 39,031,936 83,989,976 10,942,894 40,150,588 71,160,936 10,441,891
Production Volume Increase Supplemental Information
WR-DVG-RP-0010
WR-DVG-RP-0010 Page 16 of 26
Table 2.6 Summary of Field Water Injection for Sealing Fault Scenario
Sealing Fault Scenario 15,900 Sm3/d Case
Sealing Fault Scenario 19,875 Sm3/d Case
Sealing Fault Scenario 22,261 Sm3/d Case
Month/Year
Field Water Injection Cumulative
Sm3
Field Water Injection Cumulative
Sm3
Field Water Injection Cumulative
Sm3 Dec-05 573,025 573,025 573,025 Dec-06 8,276,458 8,566,814 8,567,249 Dec-07 17,356,886 19,449,809 20,313,022 Dec-08 26,892,116 31,127,457 32,257,416 Dec-09 37,850,076 43,658,452 44,927,993 Dec-10 49,461,596 56,154,444 57,162,903 Dec-11 60,110,016 67,333,527 68,058,011 Dec-12 69,757,240 77,703,406 78,189,632 Dec-13 78,974,056 87,631,444 87,954,614 Dec-14 88,041,696 97,358,570 97,549,408 Dec-15 96,924,608 106,953,116 107,067,852 Dec-16 105,684,290 116,462,850 116,544,500 Dec-17 114,341,940 125,872,822 125,931,650 Dec-18 122,944,360 135,285,916 135,316,212 Dec-19 131,706,310 144,574,316 144,711,580 Dec-20 140,564,720 153,751,676 153,961,428 Dec-21 149,366,560 162,769,508 163,060,228
Production Volume Increase Supplemental Information
WR-DVG-RP-0010
WR-DVG-RP-0010 Page 17 of 26
Table 2.7 Summary of Field Water Injection for Non-Sealing Fault Scenario
Non-Sealing Scenario 15,900 Sm3/d Case
Non-Sealing Scenario 19,875 Sm3/d Case
Non-Sealing Scenario 22,261 Sm3/d Case
Month/Year
Field Water Injection Cumulative
Sm3
Field Water Injection Cumulative
Sm3
Field Water Injection Cumulative
Sm3 Dec-05 748,273 748,273 748,273 Dec-06 7,832,780 8,296,583 8,296,609 Dec-07 17,046,379 19,199,992 20,110,682 Dec-08 26,650,066 31,094,238 32,462,077 Dec-09 37,619,164 43,387,556 44,486,340 Dec-10 49,881,308 53,548,314 54,167,386 Dec-11 60,105,476 62,470,598 62,872,080 Dec-12 69,397,112 71,111,066 71,373,502 Dec-13 78,488,256 79,716,640 79,873,024 Dec-14 87,552,332 88,391,976 88,461,896 Dec-15 96,646,132 97,133,344 97,120,624 Dec-16 105,830,508 106,003,008 105,924,124 Dec-17 115,010,316 114,889,052 114,748,432 Dec-18 124,261,296 123,904,012 123,711,492 Dec-19 133,582,504 132,966,824 132,724,308 Dec-20 142,974,400 142,106,460 141,824,976 Dec-21 152,445,448 151,331,760 151,048,684
Production Volume Increase Supplemental Information
WR-DVG-RP-0010
WR-DVG-RP-0010 Page 18 of 26
Table 2.8 Summary of Predicted Gas Injection Volumes for each Rate Sensitivity Case Evaluated
Cumulative Gas Injection Volume
(1000 Sm3)
Cumulative Gas Injection Volume
(1000 Sm3)
Cumulative Gas Injection Volume
(1000 Sm3) Month-
Year (15,900 Sm3/d Case) (19,875 Sm3/d Case) (22,261 Sm3/d Case)
Dec-05 0 0 0 Dec-06 479,625 498,828 498,865 Dec-07 1,245,585 1,512,493 1,643,626 Dec-08 2,190,361 2,840,420 3,050,214 Dec-09 3,360,889 4,134,005 4,253,588 Dec-10 4,388,387 4,725,289 4,778,096 Dec-11 4,862,978 5,030,984 5,061,994 Dec-12 5,120,294 5,224,762 5,245,248 Dec-13 5,285,733 5,356,912 5,371,096 Dec-14 5,399,829 5,449,820 5,459,557 Dec-15 5,480,192 5,515,536 5,522,451 Dec-16 5,537,350 5,562,346 5,567,443 Dec-17 5,577,911 5,595,755 5,599,476 Dec-18 5,606,857 5,619,668 5,622,349 Dec-19 5,627,566 5,636,808 5,638,647 Dec-20 5,642,476 5,649,109 5,650,372 Dec-21 5,653,135 5,657,891 5,658,820
Table 2.9 Typical Gas-lift Rate for White Rose Field
Month-Year Typical Field Gas Lift Rate
(Sm3/d) Dec-05 0 Dec-06 0 Dec-07 0 Dec-08 0 Dec-09 575,000 Dec-10 850,000 Dec-11 1,000,000 Dec-12 1,050,000 Dec-13 1,150,000 Dec-14 1,200,000 Dec-15 1,250,000 Dec-16 1,250,000 Dec-17 1,250,000 Dec-18 1,300,000 Dec-19 1,400,000 Dec-20 1,400,000 Dec-21 1,400,000
Production Volume Increase Supplemental Information
WR-DVG-RP-0010
WR-DVG-RP-0010 Page 19 of 26
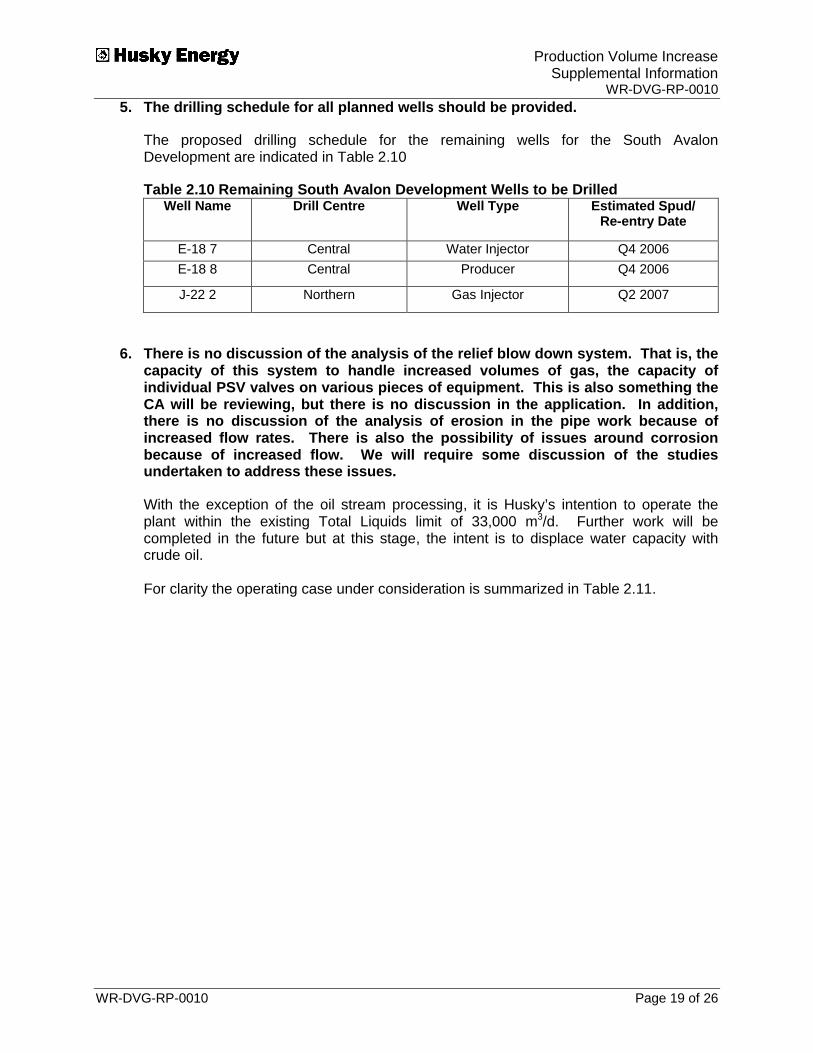
5. The drilling schedule for all planned wells should be provided.
The proposed drilling schedule for the remaining wells for the South Avalon Development are indicated in Table 2.10
Table 2.10 Remaining South Avalon Development Wells to be Drilled Well Name Drill Centre Well Type Estimated Spud/
Re-entry Date
E-18 7 Central Water Injector Q4 2006 E-18 8 Central Producer Q4 2006
J-22 2 Northern Gas Injector Q2 2007
6. There is no discussion of the analysis of the relief blow down system. That is, the capacity of this system to handle increased volumes of gas, the capacity of individual PSV valves on various pieces of equipment. This is also something the CA will be reviewing, but there is no discussion in the application. In addition, there is no discussion of the analysis of erosion in the pipe work because of increased flow rates. There is also the possibility of issues around corrosion because of increased flow. We will require some discussion of the studies undertaken to address these issues.
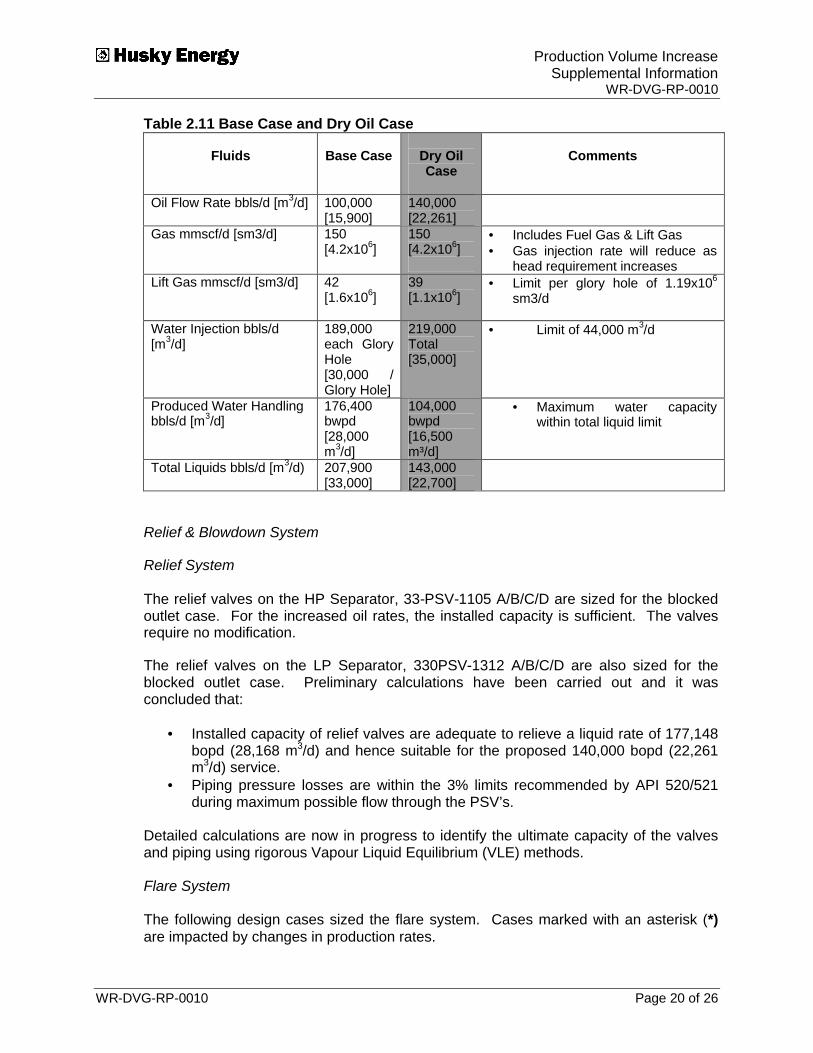
With the exception of the oil stream processing, it is Husky’s intention to operate the plant within the existing Total Liquids limit of 33,000 m3/d. Further work will be completed in the future but at this stage, the intent is to displace water capacity with crude oil. For clarity the operating case under consideration is summarized in Table 2.11.
Production Volume Increase Supplemental Information
WR-DVG-RP-0010
WR-DVG-RP-0010 Page 20 of 26
Table 2.11 Base Case and Dry Oil Case
Fluids
Base Case
Dry Oil Case
Comments
Oil Flow Rate bbls/d [m3/d]
100,000 [15,900]
140,000 [22,261]
Gas mmscf/d [sm3/d]
150 [4.2x10⁶]
150 [4.2x10⁶]
• Includes Fuel Gas & Lift Gas • Gas injection rate will reduce as
head requirement increases Lift Gas mmscf/d [sm3/d] 42
[1.6x10⁶]
39 [1.1x10⁶]
• Limit per glory hole of 1.19x10⁶
sm3/d
Water Injection bbls/d [m3/d]
189,000 each Glory Hole [30,000 / Glory Hole]
219,000 Total [35,000]
• Limit of 44,000 m3/d
Produced Water Handling bbls/d [m3/d]
176,400 bwpd [28,000 m3/d]
104,000 bwpd [16,500 m³/d]
• Maximum water capacity within total liquid limit
Total Liquids bbls/d [m3/d) 207,900 [33,000]
143,000 [22,700]
Relief & Blowdown System
Relief System The relief valves on the HP Separator, 33-PSV-1105 A/B/C/D are sized for the blocked outlet case. For the increased oil rates, the installed capacity is sufficient. The valves require no modification.
The relief valves on the LP Separator, 330PSV-1312 A/B/C/D are also sized for the blocked outlet case. Preliminary calculations have been carried out and it was concluded that:
• Installed capacity of relief valves are adequate to relieve a liquid rate of 177,148 bopd (28,168 m3/d) and hence suitable for the proposed 140,000 bopd (22,261 m3/d) service.
• Piping pressure losses are within the 3% limits recommended by API 520/521 during maximum possible flow through the PSV’s.
Detailed calculations are now in progress to identify the ultimate capacity of the valves and piping using rigorous Vapour Liquid Equilibrium (VLE) methods. Flare System The following design cases sized the flare system. Cases marked with an asterisk (*) are impacted by changes in production rates.
Production Volume Increase Supplemental Information
WR-DVG-RP-0010
WR-DVG-RP-0010 Page 21 of 26
HP Flare Tip Emergency blowdown/ continuous flaring off HP Separator
and blowdown of compression train* LP Flare Tip Continuous flaring off LP and MP Separators * HP Cold Flare Header Emergency blowdown
HP Warm Flare Header HP Separator blocked outlet PSV relief * LP Warm Flare Header LP Separator blocked outlet PSV relief * HP Flare Emergency Blowdown
LP Flare Emergency Blowdown
1. HP Flare Tip
The design profile under review has maximum gas rates within the original design capacity – hence no impact.
2. LP Flare Tip
Increasing oil flow may increase gas evolution in LP and MP Separators and hence peak continual flaring rates. Technical Query (TQ) 0796 addressed the capacity of the LP flare tip versus capacity of control valves to flare. The recommendations from this TQ (to install stops to limit opening of LP and MP valves to flare) will be implemented prior to increasing production over 125,000 bopd (19,875 m3/d).
3. Warm HP Header
The existing HP Separator PSVs can adequately relieve the revised production during blocked outlet. The PSV rated flow will remain the same and therefore the HP Flare header will not be impacted.
4. LP Flare Header
The PSV’s on the LP Separator are suitably sized for the 140,000 bopd (22,261 m3/d) case. Based upon the detailed VLE approach, the limiting capacity of the LP Flare Header will also be determined.
5. Relieving Cases – Impact on existing Flare & KO Drums
Study work for the relieving scenarios associated with increased oil production is currently in progress. Husky continues to progress the evaluation of the relieving scenarios for the 140,000 bbl/d (22,261 m3/d) dry oil case and it is expected that this will be concluded in the first quarter 2007. Any consequential improvements or additional process safeguarding will be implemented prior to increasing oil production in the summer of 2007.
Husky is also evaluating whether there may be a requirement for production limitation during flaring (relating to excess radiation).
Production Volume Increase Supplemental Information
WR-DVG-RP-0010
WR-DVG-RP-0010 Page 22 of 26
Results from the study work will be submitted and agreed with the Certifying Authority. It is anticipated that the Certifying Authority will provide a conditional release pending completion of actions required for facility output of 140,000 bbls/d (22,261 m3/d).
Corrosion and Erosion
As outlined above, with the exception of the oil stream processing, the plant will be operated within the existing Total Liquids limit of 33,000 m3/d.
The performance of the HP Separator will not be impacted as this unit is a two-phase separator, with the total fluid rate and overall gas rate remaining within design values.
The MP and LP Separator total fluid handling also remains within design limits with the exception that the crude oil outlet from the LP Separator is increased above the original design in order to process 140,000 bbls/d (22,261 m3/d). The impact of this increased oil flow on piping velocity is discussed in the following sections.
Corrosion
No significant changes in composition, pressure and temperatures are envisaged in either liquid or gas, hence there will be no impact on existing corrosion rates of materials as installed.
Erosion and Vibration
With the increased production scenario a number of Crude Oil lines that exceed API recommended velocity criteria have been identified. These are further detailed in Appendix A. While the velocity in the crude oil lines exceeds the API criteria, the velocities remain within the NORSOK guidelines. The exception to meeting the NORSOK criteria is the crude oil cooler bypass, however this is not open in the normal operating case and will only be fully open in the event of a process upset.
Since the increased oil production is above the Base Case 100,000 bbl/d (15,900 m3/d), as a mitigating measure, an erosional monitoring program has already been initiated on the particular lines as part of the asset integrity monitoring. This monitoring program will remain in place until such times as the crude oil flow rate returns to the original Base Case flow rate of 100,000 bbl/d (15,900 m3/d).
Although the API RP14E is a recommended practice, the RQF process will be used as a query process to ensure a common interpretation of the regulations. An RQF will be raised, submitted to the Certifying Authority for concurrence by December 15, 2006, and to the C-NLOPB for approval.
7. The Application appears to indicate that the maximum produced water (PW) discharge rate will be less than the 30,000 m3 maximum assessed in the WR Comprehensive Study Report (see, for example, Figure 6.25 on page 98, that appears to indicate a maximum discharge of approximately 23,000 m3/d). This being the case, there is no requirement for additional environmental assessment related to PW discharges. However, the maximum anticipated PW discharge rate is not state explicitly in the Application and this should be clarified.
Production Volume Increase Supplemental Information
WR-DVG-RP-0010
WR-DVG-RP-0010 Page 23 of 26
Based upon predictions from the ECLIPSE reservoir simulation model, the maximum anticipated produced water discharge rate for the White Rose South Avalon Pool is approximately 22,000 m3/d. The C-NLOPB also asked for the following information (not numbered):
• A copy of the most recent seismic cube.
This information will be provided to the C-NLOPB under the conditions outlined in the letter sent to Mr. Wayne Chipman on November 9, 2006 (Husky Ref. No. HUS-CPB-WR-LTR-00308).
• A digital copy of WBHP, WHP and build-up extrapolated pressure that was used in the history match process.
This information has been provided to the C-NLOPB in electronic format on the CD accompanying this report.
• The prorated oil production and water injection rates used, covering the first seven months of production data with a cutoff date of June 13, 2006.
This information has been provided to the C-NLOPB in electronic format on the CD accompanying this report.
Production Volume Increase Supplemental Information
WR-DVG-RP-0010
WR-DVG-RP-0010 Page 24 of 26
Appendix A – Increased Capacity Impact on Piping
Production Volume Increase Supplemental Information
WR-DVG-RP-0010
WR-DVG-RP-0010 Page 25 of 26
Piping
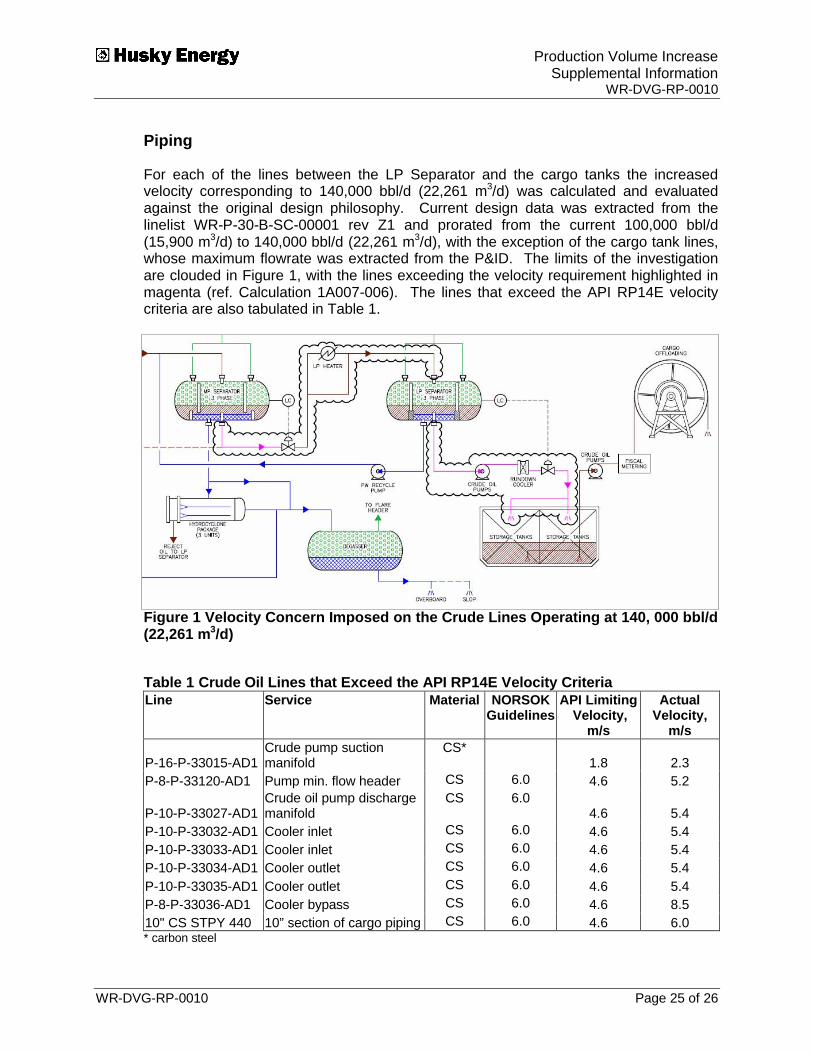
For each of the lines between the LP Separator and the cargo tanks the increased velocity corresponding to 140,000 bbl/d (22,261 m3/d) was calculated and evaluated against the original design philosophy. Current design data was extracted from the linelist WR-P-30-B-SC-00001 rev Z1 and prorated from the current 100,000 bbl/d (15,900 m3/d) to 140,000 bbl/d (22,261 m3/d), with the exception of the cargo tank lines, whose maximum flowrate was extracted from the P&ID. The limits of the investigation are clouded in Figure 1, with the lines exceeding the velocity requirement highlighted in magenta (ref. Calculation 1A007-006). The lines that exceed the API RP14E velocity criteria are also tabulated in Table 1.
Figure 1 Velocity Concern Imposed on the Crude Lines Operating at 140, 000 bbl/d (22,261 m3/d)
Table 1 Crude Oil Lines that Exceed the API RP14E Velocity Criteria Line Service Material NORSOK
Guidelines API Limiting
Velocity, m/s
Actual Velocity,
m/s
P-16-P-33015-AD1 Crude pump suction manifold
CS* 1.8 2.3
P-8-P-33120-AD1 Pump min. flow header CS 6.0 4.6 5.2
P-10-P-33027-AD1 Crude oil pump discharge manifold
CS 6.0 4.6 5.4
P-10-P-33032-AD1 Cooler inlet CS 6.0 4.6 5.4 P-10-P-33033-AD1 Cooler inlet CS 6.0 4.6 5.4 P-10-P-33034-AD1 Cooler outlet CS 6.0 4.6 5.4 P-10-P-33035-AD1 Cooler outlet CS 6.0 4.6 5.4 P-8-P-33036-AD1 Cooler bypass CS 6.0 4.6 8.5 10" CS STPY 440 10” section of cargo piping CS 6.0 4.6 6.0 * carbon steel
Production Volume Increase Supplemental Information
WR-DVG-RP-0010
WR-DVG-RP-0010 Page 26 of 26
These velocities occur under normal conditions. Operating of control valves will typically increase flow rate by 20 to 40%. The lines highlighted in Table 1 require further investigation because the high velocities introduce the potential for vibration-induced fatigue and erosion to occur. Specifically, a risk review will be completed followed by development of a crude rundown lines inspection plan and subsequent erosion inspections on the affected lines.
To determine if excess pressure loss would be introduced into the system by the additional 40% capacity, the pressure drop was modeled from the LP Separators, through the crude oil pumps and heaters to the crude rundown valve (ref. Calculation 1A007-003). The pressure drop increase is marginal and will not impede the cargo delivery rate or capacity. There is no evidence to suggest that the pressure at any point in the pump supply line will drop below the oil vapor pressure, therefore cavitation is not predicted.