Embed Size (px)
Citation preview

Peter Kallioniemi
Göteborg, Sweden, 2010
Department of Chemical and Biological Engineering, Chalmers University of Technology
Effect of Plasminogen on Wound Healing in Mice A Functionality analysis of wound healing quality in mice treated with plasminogen
Master thesis project in Biotechnology

The project was performed in the facilities of Umeå University in conjunction with the company OmnioHealer
in Umeå.

B
Functionality analysis of wound healing quality in mice treated with plasminogen
Peter Kallioniemi, Institution of Biotechnology, Chalmers University of Technology
Abstract
Background: Wound healing is a dynamic, interactive process critically involved in maintaining normal physiology and host
defence of the body. Nevertheless, a healed wound (scar) is only about 70% as strong as normal skin. Moreover,
reduced healing capability in the elderly, costs the American government more than $9 billion yearly due to
hospitalisation. Apart from that, surgical scars can be a cause of psychological problem. Therefore, a new
treatment that can speed up healing and decreases scarring is in great need. Plasminogen has shown significant
healing acceleration effect in earlier studies on punctured tympanic membrane. Therefore, in the current study,
we aim at investigating the healing quality in mice treated with plasminogen by functionality analysis.
Methods: In the first part of the study, the correlation of skin tensile strength with gender, skin color and plasminogen
genotypes of mice were analyzed. In the second part of the study, the effects of plasminogen injection on the
tensile strength of different types of wounds in wild-type mice and mice lacking plasminogen gene were
analyzed.
Results: The studies on excision and incision wounds did not supply any data that significantly confirmed that
plasminogen has a positive effect on the tensile strength of the wounds. When plasminogen was only
administered for a limited period during the whole experimental process, the data did not give any overt
conclusive effects. However, when the plasminogen was injected locally and daily for the entire duration of a
burn study, the data showed clearly that plasminogen significantly improve the tensile strength of burn wounds.
Conclusion: There are at least a couple of factors affecting the tensile strength of a mouse skin; gender, male skin is stronger,
and skin colour, fair skin is stronger, both had significant effect, whereas the genotype have no effect at all.
Administering plasminogen has a positive effect on the tensile strength of the healed burn wounds when the
mice were treated during the entire 28-day experimental period. In the other studies, too few animals were
included to give any final conclusions.
Key words: plasminogen ■ tensile ■ strength ■ wound ■ healing ■ scar ■ formation

i
Table of Contents
Introduction ............................................................................................................................................................. 1
Skin biology - Dermatology................................................................................................................................ 1
Wound healing .................................................................................................................................................... 2
Concept of plasminogen ..................................................................................................................................... 2
Animal model...................................................................................................................................................... 3
Previous studies .................................................................................................................................................. 4
Market prospect .................................................................................................................................................. 4
Materials ................................................................................................................................................................. 6
Measuring tools and setup gear........................................................................................................................... 6
Tools for tissue preparation ................................................................................................................................. 6
Chemicals ............................................................................................................................................................ 6
Animals ............................................................................................................................................................... 7
Methods................................................................................................................................................................... 7
Inflicting wound .................................................................................................................................................. 7
Treatment ............................................................................................................................................................ 7
Testing ................................................................................................................................................................. 8
Trial setup ......................................................................................................................................................... 10
Incision .......................................................................................................................................................... 10
Excision......................................................................................................................................................... 10
Burn 17 and 28 days – treatment day 5-11 ................................................................................................... 10
Burn 28 days – treatment day 1-27 ............................................................................................................... 10
Burn 18 and 28 days – treatment day 0-17 and 0-28 .................................................................................... 10
Other test ........................................................................................................................................................11
Data processing ..................................................................................................................................................11
Picture processing ..............................................................................................................................................11
Results ....................................................................................................................................................................11
Identifying the variables ....................................................................................................................................11
Gender ........................................................................................................................................................... 12
Skin color ...................................................................................................................................................... 12
Incision study .................................................................................................................................................... 16
Excision study ................................................................................................................................................... 17
Burn wound ....................................................................................................................................................... 18
17 and 28 days study ..................................................................................................................................... 18
Burn 28 days – treatment day1-27 ................................................................................................................ 19
Burn 18 and 28 days – treatment day 0-17 and 0-27 .................................................................................... 22
ii
Discussion ............................................................................................................................................................. 29
Conclusions ........................................................................................................................................................... 32
Bibliography ......................................................................................................................................................... 33
1
Introduction
Skin biology - Dermatology
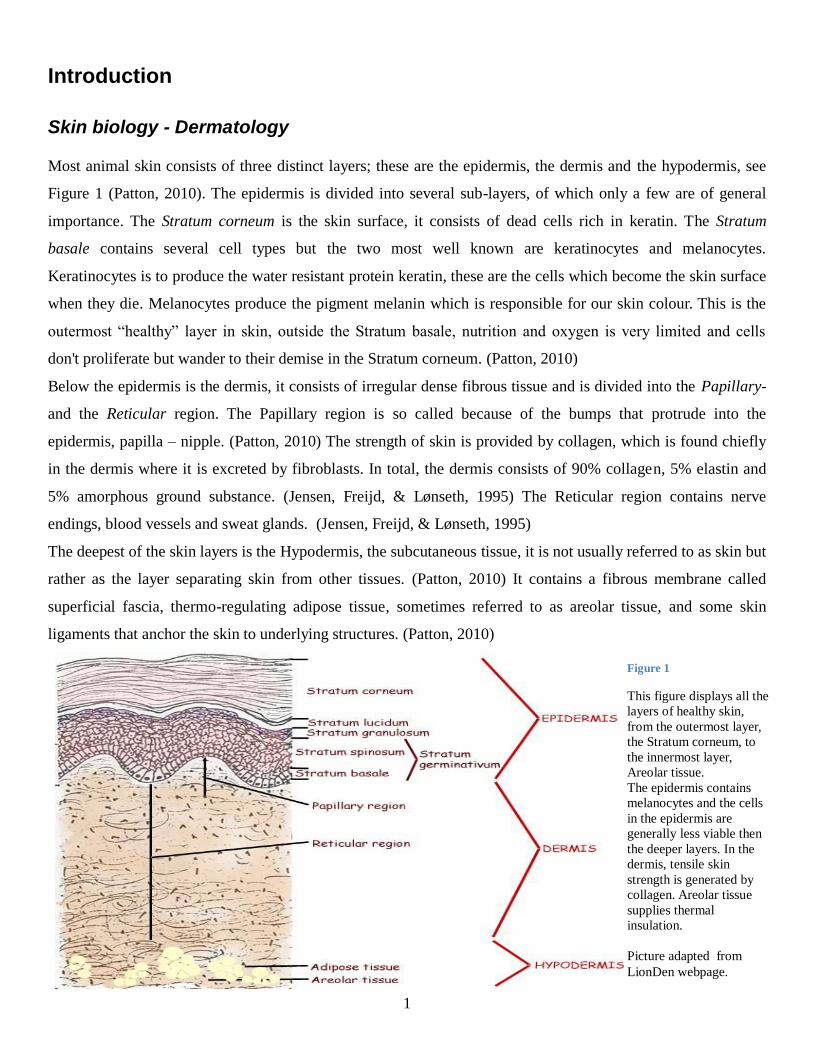
Most animal skin consists of three distinct layers; these are the epidermis, the dermis and the hypodermis, see
Figure 1 (Patton, 2010). The epidermis is divided into several sub-layers, of which only a few are of general
importance. The Stratum corneum is the skin surface, it consists of dead cells rich in keratin. The Stratum
basale contains several cell types but the two most well known are keratinocytes and melanocytes.
Keratinocytes is to produce the water resistant protein keratin, these are the cells which become the skin surface
when they die. Melanocytes produce the pigment melanin which is responsible for our skin colour. This is the
outermost ―healthy‖ layer in skin, outside the Stratum basale, nutrition and oxygen is very limited and cells
don't proliferate but wander to their demise in the Stratum corneum. (Patton, 2010)
Below the epidermis is the dermis, it consists of irregular dense fibrous tissue and is divided into the Papillary-
and the Reticular region. The Papillary region is so called because of the bumps that protrude into the
epidermis, papilla – nipple. (Patton, 2010) The strength of skin is provided by collagen, which is found chiefly
in the dermis where it is excreted by fibroblasts. In total, the dermis consists of 90% collagen, 5% elastin and
5% amorphous ground substance. (Jensen, Freijd, & Lønseth, 1995) The Reticular region contains nerve
endings, blood vessels and sweat glands. (Jensen, Freijd, & Lønseth, 1995)
The deepest of the skin layers is the Hypodermis, the subcutaneous tissue, it is not usually referred to as skin but
rather as the layer separating skin from other tissues. (Patton, 2010) It contains a fibrous membrane called
superficial fascia, thermo-regulating adipose tissue, sometimes referred to as areolar tissue, and some skin
ligaments that anchor the skin to underlying structures. (Patton, 2010)
Figure 1
This figure displays all the
layers of healthy skin,
from the outermost layer,
the Stratum corneum, to
the innermost layer,
Areolar tissue.
The epidermis contains
melanocytes and the cells
in the epidermis are
generally less viable then
the deeper layers. In the
dermis, tensile skin
strength is generated by
collagen. Areolar tissue
supplies thermal
insulation.
Picture adapted from
LionDen webpage.

2
Wound healing
The process of wound healing involves several steps that merge into each other. First phase, Hemostasis, a
fibrin clot is formed which prevents blood from leaking and dirt from entering the wound it also provides a
provisional extracellular matrix (ECM) into which macrophages and neutrophils can migrate. (Singer & Clark,
1999) This migration is the key feature of the second phase - Inflammation. Several growth factors are involved,
such as TGF-β1, TGF-α, VEGF and PDGF. (Singer & Clark, 1999) Out of these, latent tissue TGF-β1 is
activated by plasmin. (Khalil, Corne, Whitman, & Yacyshyn, 1996) Cutaneous wounds then enter one of several
pathways, shallow wounds that do not reach the dermis need only be repopulated by epidermal cells from the
epidermis or hair follicles, and this is called re-epithelialisation. (Singer & Clark, 1999) This process is
facilitated by the dissolution of desmosomes which otherwise connect the cells. (Krawczyk, 1971) New blood
vessel might be created as well to supply enough nutrients and oxygen as a response to local hypoxia, oxygen
deficiency. For deeper wounds, the third phase is the Granulation during which granulation tissue, the
intermediary ECM unto which the epidermis can migrate, is formed, the migration is made possible by
proteases that break down the fibrin clot such as matrix metalloproteinases (MMPs) and plasmin, here both
proteases are activated by or produced from plasminogen. (Darin K. Fogg, 2003) Blood vessels sprout into the
granulation tissue and collagen type III is predominantly formed to replace the provisional ECM. (Jensen,
Freijd, & Lønseth, 1995) Myofibroblasts (Mfs) present in the tissue continuously probe the stiffness of the ECM
and in the given event that the ECM is stiff enough and TGF-β1 is present, they differentiate into fibrogenic
Mfs, producing large quantities of collagen type III and at the same time they contract the wound in a manner
not unlike sipping a string bag shut. (Singer & Clark, 1999) Fourth phase, Remodelling, with time, the collagen
changes from type III to the normal collagen type I and the new tissue acquires either the characteristics of a
scar or normal skin tissue, if the healing is successful. (Mercandetti)
Concept of plasminogen
Plasminogen is the precursor of plasmin, a protease that breaks down fibrin, and it also activates MMPs that can
degrade collagen strands. (Li, 2005) This means that it is doubly involved in the remodelling of the ECM. The
conversion of plasminogen to plasmin is carries out by Urokinase-type plasminogen activator - uPA and tissue-
type plasminogen activator - tPA. (Li, 2005) uPA is located on endothelial cells and is highly active during
angiogenesis. It is activated from its precursor by enzymes such as plasmin, kallikrein, factor XIIa and
cathepsin B. tPA is found in the bloodstream where it localises the fibrinolysis to the fibrin clots where it
activates plasmin. (Li, 2005) This localisation is mediated by a finger domain that has a high-affinity binding
site for fibrin. tPA has been shown to be activated by the following enzymes; plasmin, tissue kallikrein and

3
activated Factor X (Li, 2005). These activators are suppressed by their specific inhibitors, PAI-1 and PAI-2.
Studies have shown that PAI-1 is a prerequisite for angiogenesis during tumour formation (Pepper, 2003). It has
also been shown that uPA is needed for pulmonary vascular remodelling to occur since the removal thereof, or
the removal of plasminogen itself, completely suppresses the development of hypoxia-induced pulmonary
hypertension and pulmonary vascular remodelling. (Levi o.a., 2001)
As is, plasminogen and plasmin work at different points in activating and suppressing the Mfs, and thus
regulates the formation of collagen in wounds. On one hand, they break down the fibrin that would otherwise,
in part, activate Mfs to form collagen, and on the other hand they activate latent TGF-β1 which tries to activate
said Mfs.
Animal model
The animal model of choice, mice, and the strain used, c57BL6, is chosen as it is an animal that is easy
tohandle. The strain is stable and supposedly without unwanted mutations, having been inbred for many
generations. The plasminogen deficient gene was introduced from another strain mated with c57BL6 mice, the
heterozygous plasminogen deficient mice were mated with wild type c57BL6 mice at least 10 times to make
them ―pure‖ c57BL6. There might still be some genetic deviation, apart from the plasminogen gene, but they
are considered c57BL6 in all cases. The colour is, as in human, decided by the amount of melanocytes in the
Stratum basale and the normal tone ranges from pig-pink to ―cooked salmon‖-pink. In spite of this, a skin
discolouration was present with some mice being blue, either lightly or quite darkly so. This discolouration
seemed to coincided with significantly thicker skin. For mice, the recorded tensile strength is between 1 and 2
MPa. (Thomay, o.a., 2009)
Figure 2 A B C D
Depicting the different skin colours, starting with fair skin, A), then the polar opposite in dark blue skin, B), small spots of
discolouration, which might be hard to make out, C). Finally there is light blue, D), It also shows one of the tendencies to
become blue from the lower back and sides.
4
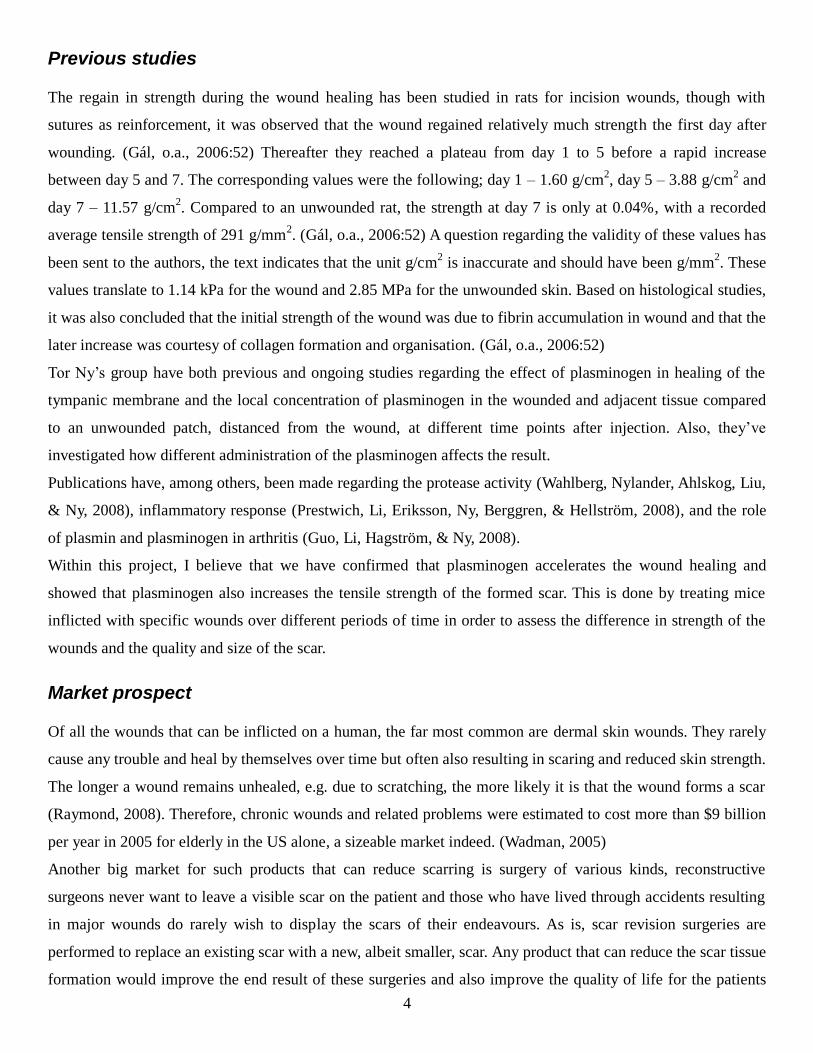
Previous studies
The regain in strength during the wound healing has been studied in rats for incision wounds, though with
sutures as reinforcement, it was observed that the wound regained relatively much strength the first day after
wounding. (Gál, o.a., 2006:52) Thereafter they reached a plateau from day 1 to 5 before a rapid increase
between day 5 and 7. The corresponding values were the following; day 1 – 1.60 g/cm2, day 5 – 3.88 g/cm
2 and
day 7 – 11.57 g/cm2. Compared to an unwounded rat, the strength at day 7 is only at 0.04%, with a recorded
average tensile strength of 291 g/mm2. (Gál, o.a., 2006:52) A question regarding the validity of these values has
been sent to the authors, the text indicates that the unit g/cm2 is inaccurate and should have been g/mm
2. These
values translate to 1.14 kPa for the wound and 2.85 MPa for the unwounded skin. Based on histological studies,
it was also concluded that the initial strength of the wound was due to fibrin accumulation in wound and that the
later increase was courtesy of collagen formation and organisation. (Gál, o.a., 2006:52)
Tor Ny’s group have both previous and ongoing studies regarding the effect of plasminogen in healing of the
tympanic membrane and the local concentration of plasminogen in the wounded and adjacent tissue compared
to an unwounded patch, distanced from the wound, at different time points after injection. Also, they’ve
investigated how different administration of the plasminogen affects the result.
Publications have, among others, been made regarding the protease activity (Wahlberg, Nylander, Ahlskog, Liu,
& Ny, 2008), inflammatory response (Prestwich, Li, Eriksson, Ny, Berggren, & Hellström, 2008), and the role
of plasmin and plasminogen in arthritis (Guo, Li, Hagström, & Ny, 2008).
Within this project, I believe that we have confirmed that plasminogen accelerates the wound healing and
showed that plasminogen also increases the tensile strength of the formed scar. This is done by treating mice
inflicted with specific wounds over different periods of time in order to assess the difference in strength of the
wounds and the quality and size of the scar.
Market prospect
Of all the wounds that can be inflicted on a human, the far most common are dermal skin wounds. They rarely
cause any trouble and heal by themselves over time but often also resulting in scaring and reduced skin strength.
The longer a wound remains unhealed, e.g. due to scratching, the more likely it is that the wound forms a scar
(Raymond, 2008). Therefore, chronic wounds and related problems were estimated to cost more than $9 billion
per year in 2005 for elderly in the US alone, a sizeable market indeed. (Wadman, 2005)
Another big market for such products that can reduce scarring is surgery of various kinds, reconstructive
surgeons never want to leave a visible scar on the patient and those who have lived through accidents resulting
in major wounds do rarely wish to display the scars of their endeavours. As is, scar revision surgeries are
performed to replace an existing scar with a new, albeit smaller, scar. Any product that can reduce the scar tissue
formation would improve the end result of these surgeries and also improve the quality of life for the patients

5
and it would reduce the need of scar removal surgeries as well as other various treatments presently in use to
reduce the ill effects of scars. The greatest change would still be the reduced time in hospital experienced by
patients and the reduced need for revisit to remove stitches if they are not needed to begin with.

6
Materials
Measuring tools and setup gear
When doing early tests, the force needed to rupture a skin sample was acknowledged as being in the vicinity of
20 N for the stronger skins. Two dynamometers, each with pin that retained the maximum measured value, were
used; the first had a maximum load 2000g from Correx, Haag-Streit AG and the second dynamometer had a
maximum load 500g from Correx, Haag-Streit AG, which met these requirements. Next, the samples needed to
be fastened securely during the tests. This was accomplished by 4 plastic fittings, 50x25x5 mm, prepared with
holes for screws and a small hole for attaching a cord, these were made in house. Wing nuts and bolts matching
the holes were procured and synthetic cord able to withstand the force was collected. Finally, tools for
measuring the dimensions of the skin were procured in the form of a MitutoyoTM
thickness gauge, range 0-25
mm and accuracy 0.01 mm and a set of callipers from SometTM
, accuracy 0.05 mm.
Tools for tissue preparation
For preparing the samples, the following scissors were procured to be used in removing the skin and trim the
samples as well as inflicting the incision wounds; Cuticle Scissors, Straight, 10.5 cm, furthermore, forceps for
holding the samples; Microscopic Forceps, Straight, smooth point, 10 cm and Mod. USA, Dressing Forceps,
Straight, slender, 12 cm, a scalpel was used for spacing cuts around the wounds. The excision wounds were
made by a Biopsy Punch, 8 mm in diameter from kai medical and burn wounds were created by metal rods, 10
mm in diameter with a weight of 25 grams. A standard hair trimmer was used to shave the animals and VeetTM
was used to remove the fur. A wooden cutting board inlaid with cork sponge was used together with map
needles to hold the skin during preparation.
Chemicals
For deep anaesthesia in connection to wound inflicting, a mix of Ketaminol® from Intervet International B.V
and Dormitor®
vet from Pfizer was used. During treatment, a light anaesthesia was used, named IsoFlo®
vet from
Abbott Laboratories Ltd. The plasminogen was purified from blood plasma as described by Wiman and Wallén
in the 70-ies, the technique is handed down by Tor Ny and . The solution had a concentration of 10 mg/mL. The
blood plasma was purchased from the blod bank at Norrlands Univeristets Sjukhus in Umeå. The phosphate
buffer solution, 1xPBS, that was used as control treatment was prepared in house according to standard
procedures. (Per Wallén, 1977)

7
Animals
The animals used were of the strain c57BL6 that were bred in house from parents heterozygous for the lack of
the plasminogen gene. The progeny was genotyped as plasminogen wild type, heterozygous or knock-out and
could be selected for use in experiments whereas only heterozygous mice were selected for further breeding.
Methods
Inflicting wound
Animals were put to sleep using the anaesthetic mix presented in materials. The animal was then shaved with a
trimmer and in some cases the fur was removed with VeetTM
, approximately 20 seconds was allowed for the
cream to take effect. Depending on what type of wound these different approaches were used;
Incision, a primary cut was made using scissors on folded skin. The cut was made along the spine and
then elongated until the cut was 1.5 cm of length.
Burn, the wound was made using a metal rod of diameter 10 mm, weighing 20 grams, which had been
heated to 100oC in boiling water. It was applied to the back using forceps and with a plastic tube pressed
onto the skin to avoid sliding around on the skin. Duration of burn was 6 seconds.
Excision, the skin sampler Biopsy Punch was used. First, it was applied straight onto the back with mild
pressure to leave slight indention on the skin, which was then outlined using a pen and a centreline was
made to ease positioning. After that, the animals was laid on its side and the skin folded so that a
puncture could be made, encompassing as much as possible of the outline.
Treatment
Animals were put to sleep using IsoFloTM
, exposure was always minimised to avoid adverse side effects and
care was taken not to disturb the scar on the back. The animals were then injected, alternating between the
anterior/posterior and dextral/sinistral sides of the wound with a total of 50 µL of liquid, plasminogen or PBS.
At different time points, pictures were taken for reference purposes.
Figure 3 A B C
These are the resulting wounds after A) incision, B) burn and C) excision.

8
Figure 4
A. Cuts are made around the wound and, on the same animals, parallel cuts are made for an internal control.
B. The cuts are extended at a small angle, to prevent stress formation, towards the edges of the skin.
C. The samples are separated and their tensile strengths are tested separately.
Testing
Animals were euthanised in one of two ways; unwounded animals by breaking the neck, wounded animals were
put to sleep using IsoFloTM
until cardiac arrest. The reason for not breaking the neck of wounded animals was
because it puts some stress on the skin and this might cause the wounds to rupture. The animals were then
shaved with a trimmer and the fur was removed with VeetTM
hair remover as previously described. The skin was
photographed for final superficial reference and then the thickness of a skin fold was measured with a
MitutoyoTM
thickness gauge, the recorded value approximated as twice the actual thickness of the skin for
calculating the cross-sectional area. Thereafter, a primary cut was made across the back close to the tail and then
the cut was extended until a rough square of skin was cut on the back. The skin could then be removed by
gently pulling from the back with a forceps, care had to be taken not to exert too much force on the eventual
scar, lest it could rupture. When pulling the skin with forceps, ligaments and membranes were cut using
scissors, fat deposits were removed from the skin, and when needed, the scalpel was used to release the scarred
area from the fascia. These steps were designed as the project proceded.
Once the skin was removed, pictures were taken of treated skins. Then small pieces of paper were placed on the
ends of areas to be tested, on opposite sides from each other, to increase the traction against the plastic fittings.
The reason for this was that in initial tests done without paper, the samples slipped from the fittings prior to
breaking. Now, using one of the plastic fittings as a frame, 2 cuts were made with a scalpel. The aim being
getting a width of approximately 5 mm, the same as the thickness of the fittings, and afterwards the width was
verified using calipers. Since some tension was almost always present, the actual width of the cut was usually a
bit less than 5 mm. The skin was then cut with scissors at a small angle from the ends of the scalpel marks to the
edge close to the pieces of paper, this was to avoid producing stress accumulating knicks in the skin which can
occur when cutting sharp angles. As presented in Figure 4. The cuts can be made either parallel- or
perpendicular to the spine, depending on the colouration and position of the wound relative to the edges.

9
The skin pieces were now fixed between the two pairs of plastic fittings using screws and wing nuts. The lower
of the fittings has a synthetic cord was fixed to it. One of the cords was tied to the dynamometer and the other
was pulled at a steady pace until the skin breaks. The value was recorded and the skin pieces aligned again for
one more photo to assess if the break was clean or if any abnormalities contributed to the brake. See Figure 5
and 6.
All through the testing procedure, photos were taken of various aspects that can be of interest, such as skin
colour, mis-coloured formations and what parts of the skin that were selected for the tests. Figure 7.
A B C
D E F
Figure 7
A. Skin after fur has been removed; blue and fair regions are clearly visible.
B. Skin is being removed, ligament from wound to fascia visible.
C. Skin nailed in place with dermal side up, blood vessels are clearly visible.
D. Sample set for testing, prior to being fitted.
E. Internal control after testing.
F. Wound after testing.
Figure 6
All pieces needed for fixing the samples, plastic fittings, screws,
wing nuts, and synthetic chord.
Figure 5 Figure 6
A. The sample is placed onto the fittings where
the screws and chords have been inserted.
B. The covers are fitted and the wing nuts
tightened to ensure minimal slippage.

10
Trial setup
The major studies were conducted as follows; one study on incision wounds, three separate studies on burn
wounds and one study on excision wounds. The wounds were always inflicted on day 0, though, when
necessary, the fur was removed one or two days prior to that.
Incision
The study on incision wounds contained 24 wild type mice in the beginning. The mice were treated from day 5
to day 10, when euthanised on day 11, or until day 16 when euthanised on day 17. The animals were divided in
following groups; 8 males treated with Plg for euthanasia on either day 11 or 17, 6 males were treated with PBS
in the same manner, as well as 6 females treated with Plg and 4 females treated with PBS. Treatment was started
on day 5.
Excision
When it came to the excision trials, it was started with 19 mice with duration of 28 days from wounding. They
were treated from day 5 to day 17 and had the division as follows; 4 wild type and 4 knock-out for PBS
treatment, and 5 wild type and 6 knock-out for Plg treatment.
Burn 17 and 28 days – treatment day 5-11
For burn wounds, two different studies were carried out; the first with treatment day 5-11, euthanasia at day 17
and day 28. This study had 3 PBS-treated wild type mice each at both 17 and 28 days whereas it had 4 and 3
Plg-treated wild type mice on 17 and 28 days respectively. For the knock-out mice, the count was 3 animals in
each of the four groups, Plg/PBS and 17/28 days.
Burn 28 days – treatment day 1-27
This burn trial was set up to have 28 days duration with treatment day 1-27. It started out with 6 knock-out mice
treated with PBS, 3 male and 3 female, 8 knock-out mice with Plg, 5 male and 3 female. 7 wild type mice were
treated with Plg, 3 male and 4 female, and, finally, 6 wild type mice were treated with PBS, 3 male and 3
female. Pictures were taken every other day in this study.
Burn 18 and 28 days – treatment day 0-17 and 0-28 This was the final study that was performed within this project. In this case, the treatment was started on day 0.
40 wild type animals, 20 male and 20 female, were divided into groups of 5, the groups were divided amongst
18 and 28 days as well as Plg- and PBS-treatment. 9 knock-out animals, 4 male and 5 female, were divided into
4, 3 animals of each gender were treated with PBS and the remaining 3 animals were treated with Plg. The
knock-out mice ran 28 days. Pictures were taken day 0, 4, 8, 10, 12, 15, 18, 21 and 28 in the same session as the
drugs were administered.

11
Other test
Apart from these major studies, several tests were made on untreated animals or animals for which the intended
study did not include the skin on the back. This was done mainly to gather base line data on skin strength and to
learn how to do the tests in a reproducible way.
Data processing
All these studies and tests generated a lot of information. All recorded values were inserted into an spreadsheet.
Therein, the absolute tensile strength was calculated according to the following formula:
– units are in brackets and the denominator is divided by 2 to
compensate for the thickness measurement which was made over a skin fold and hence it is twice the actual
skin thickness. The resulting force have the unit of N/mm2, this is the same as MPa which is frequently used.
Graphs were made and t-tests performed to visualise and confirm trends that became evident during the studies.
Picture processing
In the cases where pictures were compared, the ruler applied during photo sessions was matched to a line of set
length on the computer to make sure that the pictures were of equal size.
The open wound size in pictures was approximated as the area of the scab which was connected to the wound.
This connection between scab and wound was identified as the area which was reddish in colour.
Results
Identifying the variables
From each tested animal, several values were recorded, including tensile breaking force, the colour of the skin,
width and thickness of the sample as well as in what direction the samples were collected. The strength of the
Unwounded skin
All mice
0
5
10
15
20
25
Tens
ile S
treng
th / [
N/mm
2 ]
Figure 8
The individual differences presented
ranges from as strong as 20 N/mm2, that
is 20 MPa, down to less than 1 N/mm2.
These values include animals from
unrelated studies, internal controls and
animals used as raw data specifically to
this study.
12
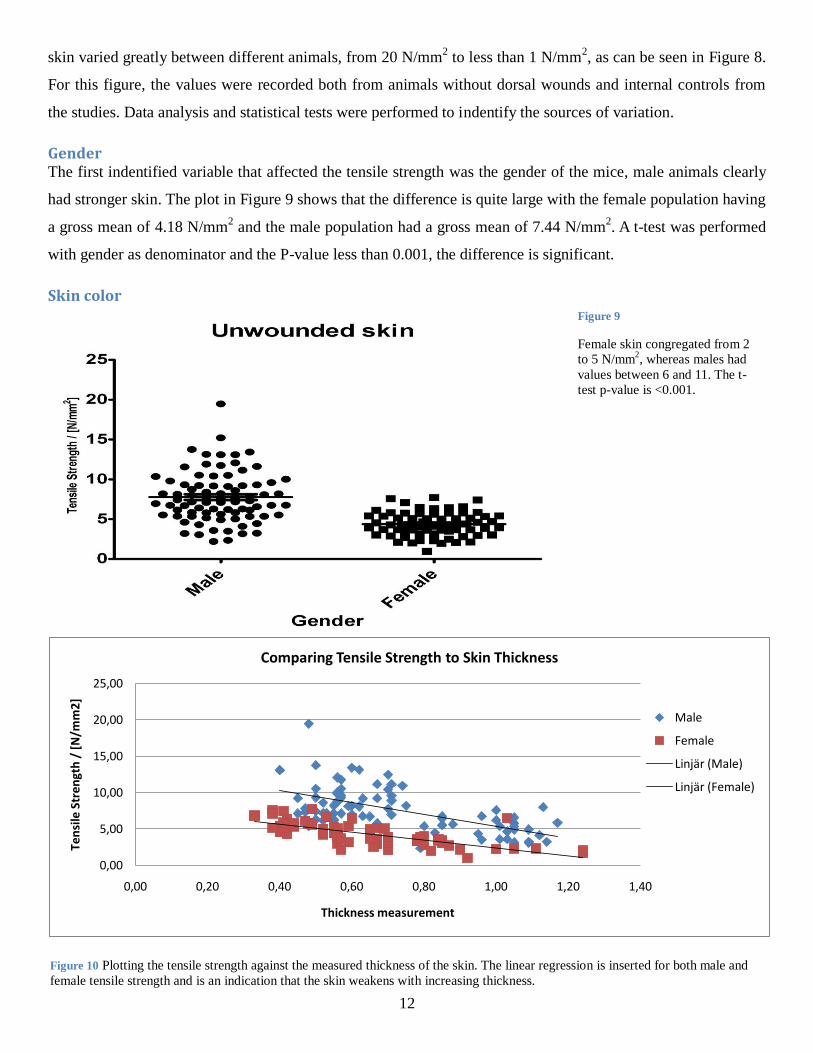
skin varied greatly between different animals, from 20 N/mm2 to less than 1 N/mm
2, as can be seen in Figure 8.
For this figure, the values were recorded both from animals without dorsal wounds and internal controls from
the studies. Data analysis and statistical tests were performed to indentify the sources of variation.
Gender The first indentified variable that affected the tensile strength was the gender of the mice, male animals clearly
had stronger skin. The plot in Figure 9 shows that the difference is quite large with the female population having
a gross mean of 4.18 N/mm2 and the male population had a gross mean of 7.44 N/mm
2. A t-test was performed
with gender as denominator and the P-value less than 0.001, the difference is significant.
Skin color
0,00
5,00
10,00
15,00
20,00
25,00
0,00 0,20 0,40 0,60 0,80 1,00 1,20 1,40
Ten
sile
Str
engt
h /
[N
/mm
2]
Thickness measurement
Comparing Tensile Strength to Skin Thickness
Male
Female
Linjär (Male)
Linjär (Female)
Figure 9
Female skin congregated from 2
to 5 N/mm2, whereas males had
values between 6 and 11. The t-
test p-value is <0.001.
Figure 10 Plotting the tensile strength against the measured thickness of the skin. The linear regression is inserted for both male and
female tensile strength and is an indication that the skin weakens with increasing thickness.

13
0,00
5,00
10,00
15,00
20,00
0,00 0,50 1,00 1,50
Ten
sile
str
engt
h /
[N
/mm
2]
Skin fold thickness / [mm]
Comparing Male Skin Phenotypes and Thickness
Coloured
Fair
Some mice had very much thicker skin than the general populus, a plot of tensile strength compared to skin
thickness was made, Figure 10, in which the linear trend lines were calculated with an R2-value for the male
population was 0.36 and the female R2-value was 0.52. Both these R-values show that the correlation is far from
perfect but the trend remains. Amongst the mice with wounds inflicted on their back, more than 32 out of 76
animals showed signs of being blue or speckled on the back. In some cases the blue had not reached the
wounded area or the wound was deemed to be more of a match to fair skin than that of blue. The tensile strength
of coloured mice was generally lower than that of fair skinned mice as well. Thus, both the skin thickness and
skin colour indicated weaker skin per cross-section area (tensile strength). Plotting tensile strength against skin
thickness with skin colour as a third two-level parameter, it became apparent that the colour and skin thickness
coincided, Figure 11.
To verify these differences, statistical t-tests were made. Table 1 represents the tests that were made for skin
colours, done using the online t-test tool GrafPad. (GraphPad Software, 2009) The two-tailed P value is much
less than 0.0001 and hence the difference is statistically significant, the same was true for comparison of fair-
and blue skin in both male and female mice. An Analysis Of VAriance, ANOVA - a statistical caclulation, was
performed to see whether there was any combined effect of colour and gender on the tensile strength. Since the
blue skinned females are the smallest population, they set the number of mice to be used from each group, and
random selection provided the counterparts from the other three groups. Table 2 displays a typical ANOVA-test
from the ones made. It shows significant difference between the groups and also an interaction between the
0,00
1,00
2,00
3,00
4,00
5,00
6,00
7,00
8,00
9,00
0,00 0,50 1,00 1,50
Ten
sile
str
engt
h /
[N
/mm
2]
Measured skin fold thickness / [mm]
Comparing Female Skin Phenotypes and Thickness
Coloured
Fair
Figure 11 A B
The different skin colours were quite closely grouped in fair skin and coloured skin, the two denoted groups that were observed
during testing. It was the case both for male A) and female B).

14
variables. For the ANOVA, Microsoft Office© 2007 Excel with the Data analysis tool pack was used. Other
statistical t-tests were made; one of the t-tests compared the tensile strengths between genotypes and it stated
that there is no difference at all. Wild type, heterozygous and knock-out mice tends to have equally strong skin
as long as you compare the same gender and skin colour as can be seen in Table 3 and Figure 12, this test was
made with fair skinned mice only. The last comparison was made between samples taken parallel and
perpendicular to the spine, since the samples could be taken both ways on unwounded and animal with burn- or
excision wound. The reason for using taking samples in either way was, as presented in the methods, to avoid
taking samples that contained interfaces between blue- and white skin which could otherwise become stress
accumulating. These tests showed no significant statistical difference though mean value in each group was
higher for the perpendicular samples, Table 4.
Table 1
The t-tests performed between the tensile strength of different skin phenotypes and between the genders, corresponding to Figure 11, gave significant difference in each case, the unit of the mean values are N/mm2.
Group
Male
fair skin
Female
fair skin
Male
fair skin
Male
blue skin
Female
fair skin
Femal
blue skin
Mean 9.17 4.68
9.17 4.54
4.68 2.35
SD 2.78 1.35
2.78 1.58
1.35 0.65
N 59 73
59 31
73 12
P-value <0,0001
<0,0001
<0,0001
Table 2
The ANOVA table between gender and skin colour, the interaction between skin colour and mouse gender was found to be significant. SS – Sum of Squares, df – degress of freedom, MS – Mean Sum of Squares, F- statistical value, F-crit – statistical limit of significance
ANOVA
Variable SS df MS F P-value F crit
Skin colour 78,14773 1 78,14773 26,78723 8,78E-06 4,113165
Gender 185,946 1 185,946 63,73798 1,76E-09 4,113165
Interaction 24,45785 1 24,45785 8,383584 0,006398 4,113165
Error 105,0246 36 2,91735
Total 393,5762 39
Table 3
T-test between fair skinned males of different genotypes, no significant difference, the unit of the mean values are N/mm2.
Group Wild type Heterozygous Wild type Knock-out Heterozygous Knock-out
Mean 9.38 9.14 9.38 8.99 9.14 8.99
SD 2.42 1.52 2.42 3.53 1.52 3.53
N 34 5 34 22 5 22
P-value 0.83 0.62 0.92

15
Table 4
T-test done on male skin samples taken parallel or perpendicular to the spine, no significant difference, the unit of the mean values are N/mm2.
Whilst doing the experiments, other parameters were recorded by photographing each animal at regular
intervals. Through this, a tendency blue skin appearing around the wound was recognised. In the first, all male,
burn test, 14 wild type mice were started and out of these, 6 had blue tendencies to begin with. Upon sacrifice, a
total of 9 mice remained and of these; 1 had reduced blue tendency though some marked blue spots pertaining
to the wound, 2 had increase blue tendencies pertaining to the wound and the rest either remained fair or went
deeper into blue. For the knock-out part, 5 out of 12 had blue tendencies to begin with. When the experiment
was over, 11 mice were tested and of these, 8 had blue skin in connection to the wound and 2 more had blue
patches on other areas of their backs. Figure 13 shows some typical phenotypes with or without blue skin.
The exact same analysis could not be done for the incision test due to the fact that the fur wasn’t removed with
Veet™
prior to wound infliction, and as such, the colour could not be assessed as clearly but looking through the
fur, there seems to have been no blue skins to begin with. In the end, 17 mice showed more or less prominent
signs of blue skin, predominantly from the edges of the wound and then along the ridge of the spine. Only 5
mice were without blue colour, and all of these were in the group treated with plasminogen.
Group Fair parallel Fair perpend Blue parallel Blue perpend Speckled parallel Speckled perpend
Mean 8,67 9,91 3,91 5,27 5,83 6,47
SD 2,34 3,23 1,19 1,40 3,02 1,45
N 35 24 6 18 3 4
P-value 0,114662153 0,209949252 0,806462099
Figure 7
The difference between the genotypes is very
small, Table 3 show the mean values as being
similar and the p-values are larger than 0.6

16
The same problem with not using Veet™
existed in the excision wound experiment. There is one alternative way
of recognising blue skin animals, their fur is a lot thicker than normal fair skin mice and it grows back faster. In
this manner 2 mice, out of the 17 started, were identified as having blue skin. Of the 15 mice that were tested,
11 had blue skin and only 4 were without blue tendencies. In this case, the blue skin had two distinct
phenotypes; either the blue skirted the back from middle and back across the tail end of the animals as was seen
in unwounded animals as well, or it was concentrated to the wound edges.
Incision study
The most basic wound, a simple cut, was tested in a small experiment. Due to the unfortunate deaths of many
animals, the only groups that were large enough to be relevant were male mice with 17 days of duration. The
results thereof did not show a significant difference. The indication is that plasminogen strengthens the wound
but the P-value given by the t-test was 0.18. This lack of significance might be corrected if more animals were
to be added to the study, Figure 14.
Figure 8 A B C
A. Burn wounded animal 28 days after wounding,
fair skin with no discoloration.
B. Burn wounded animal 28 days after wounding,
blue discoloration concentrated to wound.
C. Burn wounded animal 28 days after wounding,
blue skin in connection to wound, can be of
varying size and number of spots.
Figure 9
This graph shows the values from wild type mice, treated day
5-16 and tested at day 17 from the incisional study. Animals
treated with plasminogen have a higher tensile strength but the
difference was not statistically significant.

17
Excision study
In the excision wound study, the total number of tested animals was 13. With only 4 males, not much can be
said about them except that, maybe, the Plg increased the strength in the knock-out mouse and that the wild type
mice were approximately as strong (data not shown). The females provided more information with trends in
both wild type and knock-out mice, though the differences were not significant with a P-value of 0.16 for the t-
test of female wild type Plg to wild type PBS. The progress of wound healing could be seen when excising the
skin from the mouse, those animals lacking in Plg tended to have a connection between the wound and the
fascia, this ligament was most prominent in the knock-out mice treated with PBS but could occasionally be seen
in knock-outs treated with Plg and wild types treated with PBS though very rarely in wild type animals treated
with Plg, Figure 15.
Figure 10 A B
The graphs show the strengths of different female and male genotypes. All mice received an excision wound centred on their backs
and were treated day 5-17. The female subjects, A), show a trend that the Plg-treated animals have a stronger scar than their PBS-
treated counterparts. The males, B), however, did not give much information since the number of animals in each group was too
few, 1 animal each.

18
Burn wound
17 and 28 days study
These two earlier studies with treatment between day 5 and day 11 show the difference in having Plg
administered all through a test, as in the later burn studies. The difference that could be observed at day 17 was
almost gone by day 28, even for the knock-out mice, see Figure 16. The wounds had developed very differently
in the knock-out mice until day 17 with the Plg-treated mice had a healthier look to it and the PBS-treated mice
had swollen and/or reddish, colour to the wounds. By day 28, all PBS-treated knock-out mice had a light paper-
like covering on their wounds but the healing hadn’t progressed very far.
The wild type animals tested at day 17 contained a couple of animals that had received no treatment instead of
PBS-treatment. These animals showed the same trend as the treated knock-out mice with more strength being
regained by the Plg-treated animals. Just like the knock-out mice, they showed very little difference with
regards to their wound integrity at day 28. The wounds were the same to look at, both superficially and
internally.
Figure 11 A B
Male animals with burn wounds, treated day 5-11, both treatments for each genotype are accounted for.
A) At day 17, there’s a difference between the Plg- and PBS-treated groups, though not significant.
B) By day 28, the difference is all but gone since no additional Plg has been present to further the wound healing.

19
Burn 28 days – treatment day1-27 When reviewing the pictures taken from the tests in this study, plasminogen treatment seemed to have a positive
effect on the size of the scar. However, due to poor picture quality, the exact area could not be calculated in
some cases. The pictures of the knock-out mice were the best and the values obtained show that Plg-treated
animals have visually smaller scars at day 28. Two of the animals in the plasminogen treated group had very
inflamed red skin, the reason for this is unknown but they are clearly an exception to the normal healing process
and were excluded from the t-test. Using the photo series, another factor was considered; at what day did the
wounds shed their scabs? This was seen to happen after approximately 22 days for PBS-treated knock-out mice
and after approximately 18 days for the other groups. Examples of pictures from day 28 of each treatment are
presented in Figure 17, including an example of the inflamed skin from one of the two excluded plasminogen
treated knock-outs.
At the end of this 28 days trial, only 3 of the PBS-treated knock-out mice were yet alive. They had passed away
at different days during the experiments, one died in during a night and two died due to anaesthesia during
treatment. This meant that those groups were small to a fault which can be seen in Figure 18. It does not affect
the observation that Plg-treatment had a positive effect compared to PBS-treatment. The Plg-treated mice were
overall a lot stronger.
The deaths affected the statistics unfavourably since it became impossible to run t-tests in with only the male
knock-out mice. T-tests were performed within wt males and both genotypic female groups but none of the
calculated differences were statistically significant, Table 5 and 6. An attempt to counteract the lack of
significance was made my normalising the male and female groups separately, i.e. each individual value was
divided by the largest recorded value in the group (gender), the values before and after normalisation are
displayed in Table 7.
Figure 12 A B C D E
These pictures are examples of the scar sizes for the different genotypes and treatments on burn wounded animals.
A) Knock-out with PBS, B) knock-out with Plg, C) wild type with PBS, and D) wild type with Plg. E) is of a, supposedly, inflamed
wound from knock-out plasminogen treated animal.

20
The normalised values of male and female mice were pooled to make new t-tests on the Plg- and PBS-treated
groups. For the wild type populace, there was a significant difference between the treatments with the Plg-
treated mice being stronger, p-value = 0.026. The knock-out populace, however, did not show significant
difference, p-value = 0.225, quite likely due to insufficient number of mice in the PBS-treated group, see Table
8.
Table 5
This is the t-test for the treatment in the 28 days male burn study with 27 days of treatment. Due to there being only one animal left in
amongst the knock-out mice treated with PBS, nothing can be said in that test. For the wild type animals, the difference was close to
significant.
Group Male KO Plg Male KO PBS Male WT Plg Male WT PBS
Mean 2.7400 1.0700 4.5233 2.4067
SD 0.4158 0.0000 1.6421 0.5972
N 3 1 3 3
P-value NaN, too few values 0.1039
Figure 13 A B
Plots of the tensile strength from burn wounded animals after 28 days, treatment day 1-27.
In the male populaces, A), the wild type groups are almost exclusive which was reflected by a low, but not significant P-value
for the t-test. There is a major difference between the lone knock-out treated with PBS and those treated with Plg but no statistic
statement can be made. For the female groups, B), the groups are almost as distinct and the P-values were promising.

21
Table 6
This is the t-test for the treatment in the 28 days female burn study with 27 days of treatment. The difference is not significant in either
of the groups but there is a trend.
Group Female KO Plg Female KO PBS
Female WT Plg Female WT PBS
Mean 2.6033 1.8750
2.8950 2.3333
SD 0.5217 0.6152
0.6028 0.2223
N 3 2
4 3
P-value 0.2419
0.2458
Table 7
Here are the tensile strengths of all animals in the 28 days burn study with 27 days of treatment with the corresponding normalised
value. Highlighted values are the highest recording values within each gender, which was used to normalise the entire group (gender).
Female wt Plg wt PBS KO Plg KO PBS
Absolute TS 2,6 3,8 2,8 2,4 2,2 2,2 2,6 2,7 2 3,1 2,3 1,4
Normalised TS 0,7 1 0,7 0,6 0,6 0,6 0,7 0,7 0,5 0,8 0,6 0,4
Male
Absolute TS 3,1 4,2 6,3 2,3 3,1 1,9 3,2 2,5 2,5 1,1
Normalised TS 0,5 0,7 1 0,4 0,5 0,3 0,5 0,4 0,4 0,2
Table 8
The normalised values were pooled and this is the resulting t-tests, wild type animals show significant difference between the
treatments whereas knock-out animals fall short. Most likely they are hampered by the lack of animals in the PBS-group.
Group WT Plg WT PBS KO Plg KO PBS
Mean 0,75 0,5
0,56
0,39
SD 0,19 0,15
0,17 0,22
N 7 6
6 3
P-value 0,02645
0,23947

22
Burn 18 and 28 days – treatment day 0-17 and 0-27 This study, which had the best division of animals to begin with, suffered one premature casualty when a wild
type male set for 28 days duration died on the night between day 18 and 19. Apart from that, and a temporal
runaway animal, the study was concluded with no problems at all.
The indications obtained from the results of the wild type animals in this study contradicts the previous data
from the burn study with treatment day 1-27; animals treated with Plg had generally weaker wounds this time
and the healing was visibly worse off in 3 out of 4 groups, only in the female group running 28 days had the
Plg-treated mice better visual healing. The impeded healing showed itself through the scab which fell later and
the final replacement of raw, red, tissue with white, supposedly scar, tissue took longer time as well. Not until
day 15, or even later, were most Plg-injected on par with their PBS counterparts. Before plotting, each animal
had its wound size normalised to the picture from day 4 for the same animal, i.e.
. The
use of day 4 for normalisation was since it is the day on which the affected area is usually the largest, the
affected area on day 0 is almost always smaller since only the skin in contact with the burning rod looks
affected, though the skin in close proximity is damaged as well. These data are presented in Figures 22-25. The
analysis of the pictures also revealed that the scab is shed on about the same day, there is no difference between
Plg- and PBS-treated.
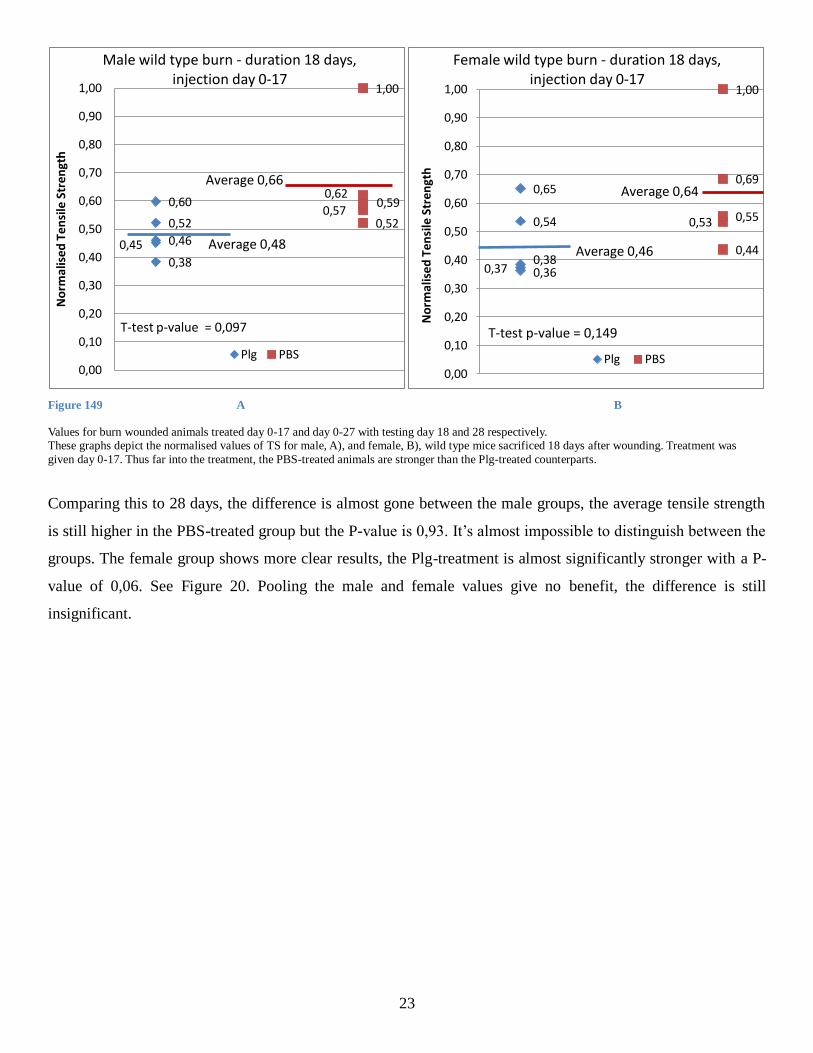
In the tests running 18 days, male wild type mice were almost significantly stronger when injected with PBS
compared to Plg-injection, 2,14 N/mm2 compared to 1,57 N/mm
2. The P-value was 0,097. Female animals
under the same premises showed no significant difference but the PBS-animals had the higher average, 2,08
N/mm2 compared to 1,50 N/mm
2. See Figure 19. When the values were normalised and pooled, the PBS-treated
animals were significantly stronger, see Table 9.
23
Figure 149 A B
Values for burn wounded animals treated day 0-17 and day 0-27 with testing day 18 and 28 respectively. These graphs depict the normalised values of TS for male, A), and female, B), wild type mice sacrificed 18 days after wounding. Treatment was
given day 0-17. Thus far into the treatment, the PBS-treated animals are stronger than the Plg-treated counterparts.
Comparing this to 28 days, the difference is almost gone between the male groups, the average tensile strength
is still higher in the PBS-treated group but the P-value is 0,93. It’s almost impossible to distinguish between the
groups. The female group shows more clear results, the Plg-treatment is almost significantly stronger with a P-
value of 0,06. See Figure 20. Pooling the male and female values give no benefit, the difference is still
insignificant.
0,38
0,60
0,460,45
0,520,57
0,62
0,52
0,59
1,00
0,00
0,10
0,20
0,30
0,40
0,50
0,60
0,70
0,80
0,90
1,00
No
rmal
ised
Ten
sile
Str
engt
hMale wild type burn - duration 18 days,
injection day 0-17
Plg PBS
Average 0,66
Average 0,48
T-test p-value = 0,097
0,65
0,37 0,360,38
0,54
1,00
0,44
0,53 0,55
0,69
0,00
0,10
0,20
0,30
0,40
0,50
0,60
0,70
0,80
0,90
1,00
No
rmal
ise
d T
ensi
le S
tren
gth
Female wild type burn - duration 18 days, injection day 0-17
Plg PBS
Average 0,46
Average 0,64
T-test p-value = 0,149

24
Figure 20 A B
At day 28, the tensile strength of the wounds on Plg-treated animals had caught up to the PBS-treated animals, for males, A), and surpassed it, when looking at the females, B).
Having values from two time points, an indication of the increase in tensile strength for the wound can be seen.
Between day 18 and day 28, the strength of the wounds in the male population had increased with 60% from
day 18 to day 28 for the Plg- and 25% for the PBS-treated animals. The same values for the female population
were 250% increase for Plg- and, again, 25% for PBS-treated animals. Remarkably, against all previous
indications, the female wounds were the strongest of all when looking at the tensile strength. The average of the
females at day 28 was 3,73 N/mm2 whereas the male value was only 2,56 N/mm
2.
The differences between the two alike, yet not equal, 28 days burn studies were assessed. Table 9 and 10
displays the recorded tensile strengths and their corresponding t-tests. When the values are stacked together,
there can be seen some difference between wild type males treated with Plg in the two studies, P-value = 0.0642
with the mice treated day 1-27 being stronger. For the other groups, the differences are less pronounced though
females treated with plasminogen might be a little stronger when treated from day 0-27 than when treated day
1-27, P-value = 0.22 for wild type and 0.21 for knock-out females. The other groups had P-values over 0.4 and
the male knock-out mice are too few to have t-tests made upon them.
0,68
0,87
0,77
0,59
1,00
0,81
0,45
0,75
0,68
0,00
0,10
0,20
0,30
0,40
0,50
0,60
0,70
0,80
0,90
1,00
No
rmal
ised
Ten
sile
Str
engt
hMale wild type burn - duration 28 days,
injection day 0-27
Plg PBS
Average 0,73
Average 0,74
T-test p-value = 0,93
0,47
0,590,630,66
1,00
0,44
0,62
0,45
0,380,35
0,00
0,10
0,20
0,30
0,40
0,50
0,60
0,70
0,80
0,90
1,00
No
rmal
ise
d T
ensi
le S
tren
gth
Female wild type burn - 28 days duration, injection day 0-27
Plg PBS
Average 0,67
Average 0,45
T-test p-value = 0,06

25
Table 9
These are the tensile strengths recorded for of each animal in the burn studies testing day 28 and treatment until day 27. The two studies are positioned in pairs depending on their genotypes and treatments for easy comparison.
Treated days 1-27 0-27 1-27 0-27 1-27 0-27 1-27 0-27
Genotype Male WT Male WT Male KO Male KO Female WT Female WT Female KO Female KO
Treatment Plg PBS Plg PBS Plg PBS Plg PBS Plg PBS Plg PBS Plg PBS Plg PBS
3,08 2,30 2,39 3,52 3,22 1,07 3,57 2,57 2,58 2,21 2,59 2,46 2,73 1,44 4,26 2,01
4,18 3,05 3,05 2,84 2,49 2,41 3,77 2,20 3,31 3,47 2,03 2,31 2,95 1,00
6,31 1,87 2,70 1,57 2,51 1,68 2,80 2,59 3,51 2,49 3,05 1,02
2,08 2,63 2,43 3,68 2,14
2,41 5,56 1,95
Average 4,52 2,41 2,56 2,60 2,74 1,07 3,57 2,22 2,89 2,33 3,73 2,50 2,61 1,87 3,60 1,34
STD 1,64 0,6 0,42 0,71 0,41 NaN NaN 0,47 0,6 0,22 1,11 0,59 0,52 0,61 0,93 0,58 Table 10
These are the corresponding t-tests to the values in Table 9 measuring the difference between the burn studies with treatment day 1-27 and day 0-27. The largest differences are observed for male wild type mice treated with plasminogen, which show an almost significant difference, and the females
treated with plasminogen, both knock-out and wild type.
T-tests between burn groups treated day 1-27 or day 0-27 Male WT Plg Male WT PBS Female WT Plg Female WT PBS Female KO Plg Female KO PBS
0,0642 0,7129 0,2201 0,6221 0,2093 0,3966
The last group of mice were knock-outs that were intended as complementary study for the earlier study.
However, these animals received treatment from day 0 and as such they were not the same as the previous
study. These animals were tested and due to the small amount of animals, they were normalised and pooled to
have a decent amount of animals for a t-test. The resulting p-value was 0,019, showing that the treatment with
plasminogen was positive. When the raw values were compared to the previous study, they appeared in the
same range with values intertwining, no group is differing in a significant way between the two studies. Because
of this likeness, the normalised values of both studies, in spite being from differently performed studies, were
pooled and the t-test on this combined set of values gave a significant p-value of 0,017. See Figure 21.
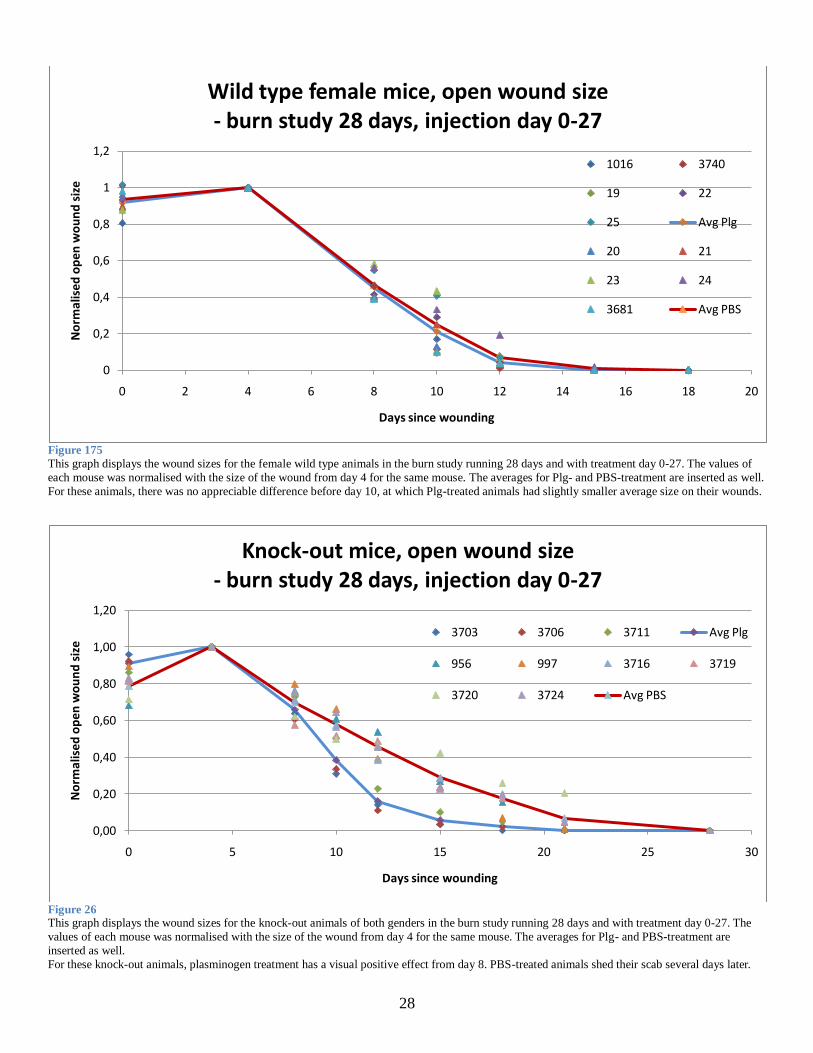
The wound size on the knock-out mice are depicted in Figure 26 where the difference is clear from day 8 and
onwards. The scab on plasminogen treated animals was shed several days earlier and the underlying scar was
visibly smaller as well. Most plasminogen treated animals shed their scab around day 12, whereas PBS-treated
animals shed after day 15 and the last scab in the PBS-group was shed between day 21 and 28. At day 28, the
size of the scar is significantly smaller on the mice treated with plasminogen, p-value <0.001.

26
Figure 151 A B
These graphs show the normalised values of burned knock-out mice treated day 0-27 and tested day 28 in the first one, A). The second graph, B),
displays the pooled normalised values from the burn studies on knock-out mice with treatment day 0-27 and day 1-27, testing on day 28. Both the
study with treatment from day 0-27 and the pooled study with both treatment regimes show significant differences between Plg- and PBS-treatment.
Figure 162
This graph displays the wound sizes for the male wild type animals in the burn study running 18 days and with treatment day 0-17. The values of
each mouse was normalised with the size of the wound from day 4 for the same mouse. The averages for Plg- and PBS-treatment are inserted as well. For these male mice, the wounds were generally a bit larger in the Plg-treated population in the early days. At day 12, the difference was almost gone,
yet, at testing, 2 mice were still not completely devoid of red skin.
1,00 1,00
0,69
0,47
0,230,24
0,720,68
0,47
0,00
0,10
0,20
0,30
0,40
0,50
0,60
0,70
0,80
0,90
1,00
No
rmal
ise
d T
ensi
le S
tren
gth
Knock-out mice with 28 days duration -injected day 0-27
Plg PBS
Average 0,897
Average 0,469
T-test p-value = 0,019
0,72
0,540,51
0,81
0,39
0,84
0,67
0,40
1,001,00
0,69
0,17
0,38
0,61
0,47
0,230,24
0,720,68
0,47
0,00
0,10
0,20
0,30
0,40
0,50
0,60
0,70
0,80
0,90
1,00
Ten
sile
Str
engt
h /
[N
/mm
2]
Knock-out mice 28 days duration - injection day 1-27 and day 0-27
Plg PBS
Average 0,69
Average 0,44
T-test P-value = 0,017
0
0,2
0,4
0,6
0,8
1
1,2
1,4
0 2 4 6 8 10 12 14 16 18 20
No
rmal
ise
d o
pen
wo
un
d s
ize
Days since wounding
Wild type male mice, open wound size- burn study 18 days, injection day 0-17
1016 3740
19 22
25 Avg Plg
20 21
23 24
3681 Avg PBS

27
Figure 23
This graph displays the wound sizes for the female wild type animals in the burn study running 18 days and with treatment day 0-17. The values of each mouse was normalised with the size of the wound from day 4 for the same mouse. The averages for Plg- and PBS-treatment are inserted as well.
This female population contains an anomaly; one animal had the wound decreasing in size every day from day 1, hence the ―high‖ start-value when
normalised. Plg-treated animals were slightly slower on healing, though they had caught up and overtaken the PBS-treated animals by day 15.
Figure 24
This graph displays the wound sizes for the male wild type animals in the burn study running 28 days and with treatment day 0-27. The values of each mouse was normalised with the size of the wound from day 4 for the same mouse. The averages for Plg- and PBS-treatment are inserted as well.
As in Figure 22-23, Plg-treatment has no positive effect on the wound size until day 15 at which is catches up to PBS treatment.
0
0,5
1
1,5
2
2,5
0 2 4 6 8 10 12 14 16 18 20
No
rmal
ise
d o
pen
wo
un
d s
ize
Days since wounding
Wild type female, open wound size- burn study 18 days, injection day 0-17
1016 3740
19 22
25 Avg Plg
20 21
23 24
3681 Avg PBS
0
0,2
0,4
0,6
0,8
1
1,2
0 5 10 15 20 25 30
No
rmal
ise
d o
pen
wo
un
d s
ize
Days since wounding
Wild type male, open wound size- burn study 28 days, injection day 0-27
1 2
3 4
New Avg Plg
6 7
8 9
3715 Avg PBS
28
Figure 175
This graph displays the wound sizes for the female wild type animals in the burn study running 28 days and with treatment day 0-27. The values of
each mouse was normalised with the size of the wound from day 4 for the same mouse. The averages for Plg- and PBS-treatment are inserted as well.
For these animals, there was no appreciable difference before day 10, at which Plg-treated animals had slightly smaller average size on their wounds.
Figure 26 This graph displays the wound sizes for the knock-out animals of both genders in the burn study running 28 days and with treatment day 0-27. The
values of each mouse was normalised with the size of the wound from day 4 for the same mouse. The averages for Plg- and PBS-treatment are
inserted as well.
For these knock-out animals, plasminogen treatment has a visual positive effect from day 8. PBS-treated animals shed their scab several days later.
0
0,2
0,4
0,6
0,8
1
1,2
0 2 4 6 8 10 12 14 16 18 20
No
rmal
ise
d o
pen
wo
un
d s
ize
Days since wounding
Wild type female mice, open wound size- burn study 28 days, injection day 0-27
1016 3740
19 22
25 Avg Plg
20 21
23 24
3681 Avg PBS
0,00
0,20
0,40
0,60
0,80
1,00
1,20
0 5 10 15 20 25 30
No
rmal
ise
d o
pen
wo
un
d s
ize
Days since wounding
Knock-out mice, open wound size- burn study 28 days, injection day 0-27
3703 3706 3711 Avg Plg
956 997 3716 3719
3720 3724 Avg PBS

29
Discussion
As the treatment was shown to have a positive effect when applied with moderation, this should make it more
desirable to continue research and maybe get a product onto the market as a supplemental treatment to stitches
or staples in major surgery and after accidents. The focus of the research group is on how to administer
plasminogen, if it works intravenously, and what concentration of plasminogen that works the best. To be a
putative drug, it should be possible to give only a few shots, or perhaps apply the drug as a salve or lotion;
topical application has been used in some tympanic studies with positive result. These are aspects that need to
be researched further before clinical trials can be performed.
When the two studies with long term injection are compared, one can see a few things worthy of noting;
plasminogen injection has a positive straight off positive effect when administered from day 1 but not when the
injections are started on day 0. With injections from day 0, both male and female plasminogen treated mice are
weaker than PBS-treated ones at day 18, though not significantly. At day 28, the values of the male groups are
very similar. Day 28 for the females reveal an almost significant difference, the plasminogen treated mice seems
to be stronger than their PBS-treated counterparts, for the female groups. As presented, the plasminogen treated
animals gained a lot more strength from day 18 to day 28 than did the PBS-treated animals. When the closing of
the wounds were evaluated from the pictures taken on different days, the scab fell on roughly the same day
within each group but the PBS-treated animals were slightly ahead, with exception for one animal that was
some days late in all aspects, and the female 28 days duration group in which there was hardly any difference. It
might be that starting the treatment on day 0 has an initially negative effect but, if these values are to be trusted,
the administration of plasminogen has a positive effect as time goes by and if the study were to continue even
further, the difference could be even greater. More specifically, it might be that having too much plasminogen
during the inflammatory phase delays the return of haemostasis and thus the entire healing process is pushed
back.
As to why there was difference between male and female regeneration in the 28 days burn study with injection
starting on day 0, a theory is females may be better prepared to heal from burn wounds, specifically. It might be
dependent on the skin biology where the females have more hypodermis, i.e. fat tissue which could possibly
insulate the surrounding tissue and reduce the effect of a point burn such as the technique we use. These are free
thoughts on the matter but they would be interesting to investigate.
With each passing study, some parameters changed, especially the starting day and duration of the treatment,
which made the different studies incompatible in the sense that they can not be compared straight off. One can
only suggest that plasminogen has a positive effect, not that it works more or less well based on the different
types of wounds that were tested. Further studies would be needed to decide if the type of wound has any effect

30
on the efficacy of plasminogen in the healing of the wound.
One theory of scar tissue formation states that it is caused by excessive formation of fibrous tissue emitted from
contractile fibroblasts. (Wipff, Rifkin, Meister, & Hinz, 2007) This transition from fibroblasts that arrange fibrin
threads to contractile fibroblasts is governed by the stiffness of the ECM. (Wipff, Rifkin, Meister, & Hinz,
2007) Together with our hypothesis that plasminogen reduces the scar tissue formation, it seems likely that the
plasminogen acts by reducing the stiffness of the ECM so that the fibroblasts no longer excretes TGF-β1, the
growth factor that causes fibrous tissue formation. This is in kind contradicted by a recent unpublished result
that concludes that collagen levels are increased in plasminogen treated animals. (Yong-Zhi, 2010) This would
go better with the most frequent visual effect of plasminogen, faster shedding of the scab and consequent higher
contraction of the wound edges.
The different phenotypes presented earlier, involving pigmentation and thickness of the epidermis, were a cause
for concern. The anomaly, which was found as a correlation between blue skin and greater skin thickness,
coincided with weaker skin. The consistent weakness of the blue skin made it desirable to separate the animals
based on skin colour, as such they were preliminary excluded in the early analysis. However, if a confirmation
of this distinction wasn’t found, they would have to be included in the general population. In an article
presented by Fitch et al. in 2002, the answer was found, the phenotypes were presented as mutations, and the
ones in case are likely to be one of the mutations Dsk2 and Dsk5. This discolouration can be chemically induced
or be caused by wounds. Since the thickness of the skin correlated with weaker skin, the increased thickness
should be visible, either as more epidermis which is unlikely, or more hypo (Fitch, o.a., 2002)
There was one result that we found quite interesting, male mouse skin is about twice as strong as female skin. A
proposed cause of this was found in an article written by Azzi et al in 2005, they presented data stating that
males have a significantly larger proportion of dermis than epidermis or hypodermis than do females. The ratios
epidermis : dermis : hypodermis are 2 : 95 : 3 in males and 4 : 46 : 50 in females. In total, they presented that a
male skin is approximately 40% thicker than a female skin. Since the dermis is the major layer of collagen
production, the tensile strengths of male and female skin differ concordantly. This gender specific difference has
been observed in humans as well where the dermis is thicker in men and the total skin is thicker in men as well
as presented by Tur in 1997. (Azzi, El-Aly, & Labrie, 2005) (Tur, 1997)
Seeing as how the darker skin were thicker and weaker, especially in the male population, it might be that their
skins changed phenotype from being a vast majority dermis to having a more ―female‖ phenotype with roughly
relatively less dermis. This lead me to believe that if the thickness was removed as a factor and the values are
plotted, then the strength of blue skins and fair skins should be more alike. Indeed, they were more alike, though
the fair skin is still significantly stronger. Even though it is not supported by this data, it still leads me to believe
31
that the same amount of collagen, and thus dermis, is present in both phenotypes, based on picture analysis
which has not been included into this report. This could be tested by staining the layers and then use image
analysis to obtain the relative thicknesses of the layers as done by Azzi et al in 2005 and Coppola and
O’Connell in 1989. (Azzi, El-Aly, & Labrie, 2005) (Coppola & O'Connell, 1989)
When the absolute tensile strength is calculated, the thickness of the wound is approximated as the normal skin
surrounding it. Whether this is an acceptable approximation is still uncertain. The tissue of the wound is a great
deal thicker than the surrounding skin for some days even after the scab has fallen. Wounds, that have
developed a white glassy scar, tend to be of roughly the same thickness as the normal skin. Some evidence
points to these scars being even thinner than normal tissue given that it is more permeable to light, the scar is a
patch of see-through tissue when the skin has been removed and placed on the cutting board. The question of
what value to use when calculating the tensile strength is still undecided. The normal skin thickness has been
used throughout this work since it is what the wound should turn into. If a simple technique for measuring the
thickness of the scar were to present itself, than the future values could be more accurately assessed. Some
comparisons were made where the thickness of the wound was hypothesised to be of equal thickness in all
animals, that way the thickness parameter was eliminated and the tensile strength was dependent only on the
width of the sample. This comparison was done in the burn study with 28 days duration and treatment day 1-27.
In this case, the P-values got a little bit higher but the significant values were still significant so this might be a
different way to calculate a generally valid tensile strength, given that all animals in a study have the same
superficial level of healing. In the final study, in which Plg and PBS were administrated from day 0 and
onwards, the choice of including or not including the measured thickness became of great relevance since it
changes some of the groups from having insignificant difference in tensile strength to being significant, and the
reverse, an almost significant group became very much insignificant.

32
Conclusions
Tensile strength tests have been performed on mice back skin. These mice are either unwounded or inflicted
with an incision, excision or a burn wound. Wounded animals are treated with either plasminogen or PBS for
different lengths of time.
First of all, the studies show that female skin is weaker than male skin. A clear relation between skin thickness
and skin colour is shown as well with blue skinned mice having thicker skin than fair skinned mice. Coupled to
the increased thickness is a reduction in tensile strength. Tensile tests made on animals of different genotypes:
wild type, heterozygous and knock-out, shows no significant difference in tensile strength depending on the
natural occurrence of plasminogen.
The intended studies concerned treatment after wounding, the trend in most studies is that plasminogen
increases the strength of the reformed tissue in a wound. There was significant improvement in tensile strength
seen in burn studies on plasminogen deficient animals and in one of the long term burn studies on wild type
animals. One anomaly to this trend was recorded, burn wounded male wild type mice treated with plasminogen
from day 0 to day 27 were only as strong as their PBS counterparts. The tests done at day 18 with treatment
from day 0 to day 17 show PBS as being decidedly, but not significantly, stronger, in both wild type male and
female. From day 18 to day 28, the increase in strength is considerably larger in the plasminogen group,
showing a positive effect of plasminogen treatment in the later stage of wound healing.

33
Bibliography
Azzi, L., El-Aly, M. M., & Labrie, F. (2005). Gender Differences in Mouse Skin Morphology and Specific
Effects of Steroids and Dehydroepiandrosterone. Journal of Investigative Dermatology 124 , 22-27.
Coppola, D. M., & O'Connell, J. J. (1989). Sexual Skin in Rodents: an Across Body Region, Gender, and
Species Analysis. Biology of Reporduction , 53-550.
Darin K. Fogg, K.-S. C. (2003). Plasminogen Receptors. In D. M. Waisman, Plasminogen - Structure,
Activation, adn Regulation (pp. 81-98). Plenum press.
Fitch, K. R., McGowan, K. A., van Raamsdonk, C. D., Fuchs, H., Lee, D., Puech, A., et al. (2002). Genetics of
dark skin in mice. Cold Spring Harbor Laboratory Press.
Gál, P., Toporcer, T., Vidinský, B., Mokrý, M., Novotný, M., Kilík, R., et al. (2006:52). Early Changes in the
Tensile Strength and Morphology. Folia Biologica , 109-115.
GraphPad Software. (2009, 02). QuickCalcs. Retrieved 02 12, 2010, from GraphPad Software:
http://www.graphpad.com/quickcalcs/ttest1.cfm
Guo, Y., Li, J., Hagström, E., & Ny, T. (2008). Protective effects of plasmin(ogen) in a mouse model of
Staphylococcus aureus-induced arthritis. Arthritis and rheumatism , 764-772.
Jensen, B., Freijd, H., & Lønseth, R. (1995). Modern sårbehandling. D. 1, Hudens anatomi, fysiologi och
sårläkning. Bromma ConvaTec.
Khalil, N., Corne, S., Whitman, C., & Yacyshyn, H. (1996). Plasmin regulates the activation of cell-associated
latent TGF-beta 1 secreted by rat alveolar macrophages after in vivo bleomycin injury. Am J Respir Cell Mol
Biol. , 252-259.
Levi, M., Moons, L., Bouché, A., Shapiro, S. D., Collen, D., & Carmeliet, P. (2001:103). Impairs Vascular
Remodeling During Hypoxia-Induced Pulmonary Hypertension in Mice. Journal of the American Heart
Association , 2014-2020.
Li, J. (2005). Multifunctional Roles of Plasmin in Inflammation. Umeå: Solfjädern Offset AB.
Mercandetti, M. (n.d.). Wound Healing, Healing and Repair. Retrieved from eMedicine:
http://emedicine.medscape.com/article/1298129-overview
Patton, K. (2010, 02 07). Integumentary system. Retrieved 02 07, 2010, from Lion Den:
http://www.lionden.com/ap1out-skin.htm
Pepper, M. S. (2003). Role of the Plasminogen Activator-Plasmin System in Angiogeness. In D. M. Waisman,
Plasminogen - Structure, Acivation, and Regulation (pp. 269-283). Plenum publishers.
Per Wallén, B. W. (1977). The specific interaction between plasminogen and fibrin. A physiological role of the
lysine binding site in plasminogen . Thrombosis Research , 213-222.
Prestwich, A. H., Li, J., Eriksson, P. O., Ny, T., Berggren, D., & Hellström, S. (2008). Lack of plasminogen does
not alter the early inflammatory response following a tympanic membrane perforation: a study in plasminogen-
deficient mice. Acta oto-laryngologica , 1294-1302.
Raymond, J. (2008, 01 31). It Feels Good, and Everybody Does It . Retrieved 03 05, 2010, from Newsweek:
http://www.newsweek.com/id/106588
Singer, A. J., & Clark, R. A. (1999). Cutaneous Wound Healing. The New Eng. Jour. of Med. , 738-746.
Thomay, A. A., Daley, J. M., Sabo, E., Worth, P. J., Shelton, L. J., Harty, M. W., et al. (2009). Disruption of
Interleukin-1 Signaling Improves the Quality of Wound Healing. The American Journal of Pathology; Vol 174,
No 6, June , 2129-2136.
Tur, E. (1997). Physiology of the skin—Differences between women and men . Clinics in Dermatology , 5-16.
Wadman, M. (2005). Scar prevention: The healing touch. Nature , 1079-1080.
Wahlberg, P., Nylander, A., Ahlskog, N., Liu, K., & Ny, T. (2008). Expression and localization of the serine
proteases high-temperature requirement factor A1, serine protease 23, and serine protease 35 in the mouse
ovary. Endocrinology , 5070-5077.
Wipff, P.-J., Rifkin, D. B., Meister, J.-J., & Hinz, B. (2007). Myofibroblast contraction activates latent TGF-
β1from the extracellular matrix. The Journal of Cell Biology , 1311-1323.