Embed Size (px)
Citation preview
1
Worthington Industries
The Troops
John Barret
Zack Leggett
Shane Nowak
Aaron Burt
Brant Fuller
2
Table of Contents
Executive Summary ……………………………………………………………………………………. 8
Business and Industry Analysis …………………………………………………………………….. 15
Company Overview ……………………………………………………………………………. 15
Industry Overview ……………………………………………………………………………. 15
Five Forces Model ……………………………………………………………………………………….. 18
Rivalry Amongst existing Firms …………………………………………………………… 19
Industry Growth ……………………………………………………………………… 20
Concentration of Competitors …………………………………………………… 21
Level of Differentiation and Switching Costs ………………………………. 22
Learning /Scale of Economy and Ratio of Fixed to Variable Cost ….. 23
Excess Capacity and Exit Barriers ……………………………………………… 24
Conclusion ……………………………………………………………………………… 24
Threat of New Entrants ……………………………………………………………………… 25
Economies of Scale …………………………………………………………………. 25
First Mover Advantage …………………………………………………………….. 26
Access to Channels of Distribution and Relationships …………………... 26
Legal Barriers ………………………………………………………………………….. 27
Conclusion ……………………………………………………………………………… 27
Threat of Substitute Products ………………………………………………………………28
Relative Price and Performance ………………………………………………… 28
Customer’s Willingness to Switch ………………………………………………. 29
Conclusion ………………………………………………………………………………. 30

3
Bargaining Power of Customers ………………………………………………………….. 30
Price Sensitivity ……………………………………………………………………….. 31
Relative Bargaining Power ………………………………………………………… 31
Conclusion ……………………………………………………………………………….32
Bargaining of Suppliers ……………………………………………………………………….32
Price Sensitivity ………………………………………………………………………..32
Relative Bargaining Power ………………………………………………………… 33
Conclusion ………………………………………………………………………………. 33
Key Success Factors …………………………………………………………………………………….. 34
Cost Leadership ………………………………………………………………………………… 35
Economies of Scale ………………………………………………………………….. 35
Cost Control ……………………………………………………………………………. 35
Reduced Transportation Costs …………………………………………………… 36
Differentiation …………………………………………………………………………………… 37
Research and Development ………………………………………………………. 37
Firms Competitive Advantage ……………………………………………………. 39
Cost Leadership ………………………………………………………………………..39
Economies of Scale ………………………………………………………………….. 39
Cost Control ……………………………………………………………………………. 40
Differentiation ……………………………………………………………….………… 41
Research and Development ………………………………………………………. 41
Conclusion ………………………………………………………………………………. 42
Key Accounting Policies ……………………………………………………………………………….. 43
Operating Leases ………………………………………………………………………………. 43
4
Pension Plans …………………………………………………………………………………… 44
Reporting Goodwill …………………………………………………………………………….. 44
Foreign Currency Risk ……………………………………………………………………….. 46
Evaluating Accounting Strategies ………………………………………………………………….. 46
Level of Disclosure …………………………………………………………………………….. 46
Aggressiveness of Accounting Policies …………………………………………………. 47
Pension Plans …………………………………………………………………………..47
Operating Leases …………………………………………………………………….. 48
Goodwill ………………………………………………………………………………….. 48
Evaluating the Quality of Disclosure ………………………….……………………………………49
Qualitative Analysis ……………………………………….……………………………………49
Pension Plans …………………………………….…………………………………….49
Goodwill ………………………………………….………………….…………………… 49
Operating Leases …………………………………………………………………….. 50
Currency Risk …………………………………………………………………………..50
Quantitative Analysis …………………………………………………………………………. 51
Revenue and Expense Diagnostics……………………………………………… 51
Cash from Sales Ratio……………………………………………………… 51
Accounts Receivable Ratio……………………………………………….. 53
Nets Sales/ Inventory……………………………………………………… 54
Expense Diagnostic Ratios………………………………………………………….55
Asset Turnover………………………………………………………………..55
CFFO/ OI……………………………………………………………………….. 57
CFFO/ NOA…………………………………………………………………….. 58
5
Accruals to Sales Ratio…………………………………………………….. 60
Potential Red Flags……………………………………………………………………………… 60
Undo Accounting Distortions………………………………………………………………… 62
Financial Analysis…………………………………………………………………………………………. 65
Liquidity Analysis………………………………………………………………………………… 65
Current Ratio……………………………………………………………………………. 66
Quick Assets Ratio……………………………………………………………………. 67
Accounts Receivable Turnover Ratio…………………………………………… 68
Days in Accounts Receivable……………………………………………………… 69
Inventory Turnover…………………………………………………………………… 70
Days in Inventory……………………………………………………………………… 70
Working Capital Turnover………………………………………………………….. 71
Cash to Cash Cycle……………………………………………………………………. 72
Conclusion……………………………………………………………………………….. 73
Profitability Ratio Analysis…………………………………………………………………… 74
Gross Profit Margin…………………………………………………………………… 74
Operating Profit Margin……………………………………………………………… 75
Net Profit Margin……………………………………………………………………….76
Asset Turnover…………………………………………………………………………. 77
Return on Asset………………………………………………………………………… 78
Return on Equity……………………………………………………………………… 79
Firms Growth Rate Ratios……………………………………………………………………. 80
Internal Growth Rate………………………………………………………………… 80
Sustainable Growth Rate……………………………………………………………. 81
6
Conclusion……………………………………………………………………………….. 82
Capital Structure Ratios………………………………………………………………………. 83
Debt-to-Equity Ratio…………………………………………………………………. 83
Times Interest Earned………………………………………………………………. 85
Debt Service Margin………………………………………………………………….. 85
Altman’s Z-Score………………………………………………………………………. 86
Conclusion………………………………………………………………………………..87
Forecasting………………………………………………………………………………………………….. 88
Year 1 Income Forecast………………………………………………………………………. 90
Income Statement………………………………………………………………………………. 90
Income Statement (Revised) ………………………………………………………………. 94
Balance Sheet……………………………………………………………………………………..97
Balance sheet (Revised)……………………………………………………………………… 100
Statement of Cash Flows…………………………………………………………………….. 103
Cost of Financing…………………………………………………………………………………………. 105
Cost of Equity (Ke)……………………………………………………………………………… 105
Estimating Beta………………………………………………………………………………….. 105
Regression Results……………………………………………………………………………… 106
Backdoor Method……………………………………………………………………………….. 107
Cost of Debt (Kd)……………………………………………………………………………….. 108
Weighted Average Cost of Capital (WACC)……………………………………………. 109
Valuation Analysis………………………………………………………………………………………… 110
Method of Comparables………………………………………………………………………. 110
Price/ Earnings Trailing……………………………………………………………… 111

7
Price/ Earnings Forecasting………………………………………………………… 112
Price/ Book………………………………………………………………………………. 112
Price Earnings Growth (P.E.G.)…………………………………………………… 113
Price/ EBITDA…………………………………………………………………………… 114
Enterprise Value/ EBITDA………………………………………………………….. 114
Price to Free Cash Flows……………………………………………………………. 115
Dividends/ Price………………………………………………………………………… 116
Conclusion……………………………………………………………………………….. 116
Intrinsic Value Models…………………………………………………………………………. 117
Discounted Dividends Model……………………………………………………….117
Discounted Free Cash Flows Model…………………………………………….. 119
Residual Income Model……………………………………………………………… 120
Long Run Residual Income Model………………………………………………. 122
Abnormal Earnings Growth Model……………………………………………… 124
Analyst Recommendation………………………………………………………………………………. 127
Appendices………………………………………………………………………………………………….. 129
References…………………………………………………………………………………………………… 140
8
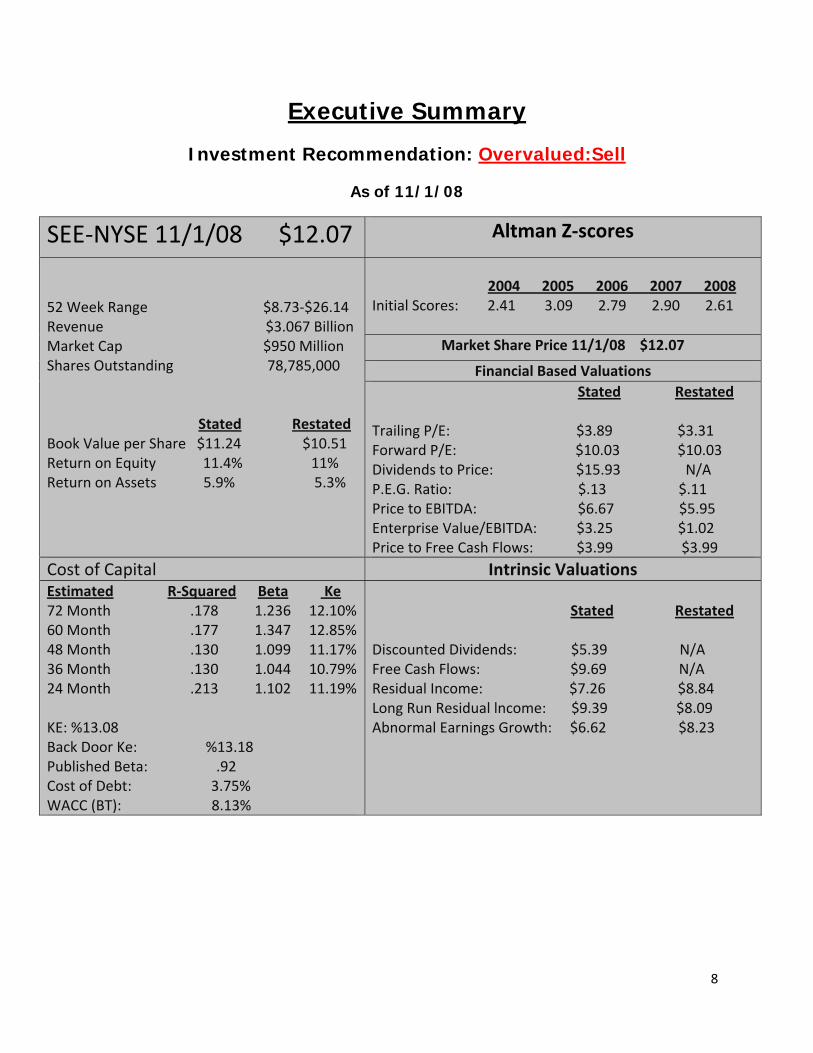
Executive Summary
Investment Recommendation: Overvalued:Sell
As of 11/1/08
SEE‐NYSE 11/1/08 $12.07 Altman Z‐scores
52 Week Range $8.73‐$26.14 Revenue $3.067 Billion Market Cap $950 Million Shares Outstanding 78,785,000 Stated Restated Book Value per Share $11.24 $10.51 Return on Equity 11.4% 11% Return on Assets 5.9% 5.3%
2004 2005 2006 2007 2008 Initial Scores: 2.41 3.09 2.79 2.90 2.61
Market Share Price 11/1/08 $12.07
Financial Based Valuations Stated Restated Trailing P/E: $3.89 $3.31 Forward P/E: $10.03 $10.03 Dividends to Price: $15.93 N/A P.E.G. Ratio: $.13 $.11 Price to EBITDA: $6.67 $5.95 Enterprise Value/EBITDA: $3.25 $1.02 Price to Free Cash Flows: $3.99 $3.99
Cost of Capital Intrinsic Valuations Estimated R‐Squared Beta Ke 72 Month .178 1.236 12.10%60 Month .177 1.347 12.85% 48 Month .130 1.099 11.17% 36 Month .130 1.044 10.79%24 Month .213 1.102 11.19% KE: %13.08 Back Door Ke: %13.18 Published Beta: .92 Cost of Debt: 3.75% WACC (BT): 8.13%
Stated Restated Discounted Dividends: $5.39 N/A Free Cash Flows: $9.69 N/A Residual Income: $7.26 $8.84 Long Run Residual lncome: $9.39 $8.09 Abnormal Earnings Growth: $6.62 $8.23
9
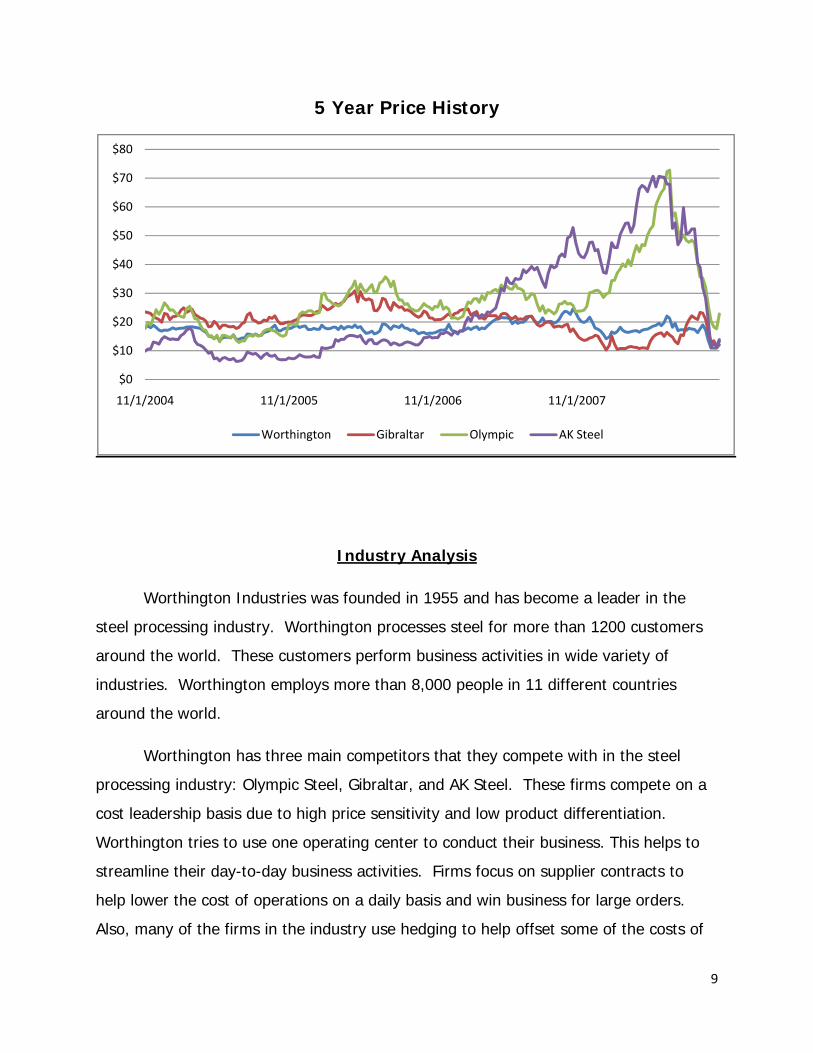
5 Year Price History
Industry Analysis
Worthington Industries was founded in 1955 and has become a leader in the
steel processing industry. Worthington processes steel for more than 1200 customers
around the world. These customers perform business activities in wide variety of
industries. Worthington employs more than 8,000 people in 11 different countries
around the world.
Worthington has three main competitors that they compete with in the steel
processing industry: Olympic Steel, Gibraltar, and AK Steel. These firms compete on a
cost leadership basis due to high price sensitivity and low product differentiation.
Worthington tries to use one operating center to conduct their business. This helps to
streamline their day-to-day business activities. Firms focus on supplier contracts to
help lower the cost of operations on a daily basis and win business for large orders.
Also, many of the firms in the industry use hedging to help offset some of the costs of
$0
$10
$20
$30
$40
$50
$60
$70
$80
11/1/2004 11/1/2005 11/1/2006 11/1/2007
Worthington Gibraltar Olympic AK Steel
10
raw materials. The companies in the steel processing industries try to discover ways to
efficiently get their products to more people in a much quicker and cheaper way. Doing
this allows them to lower their prices and compete as cost leaders in the industry. The
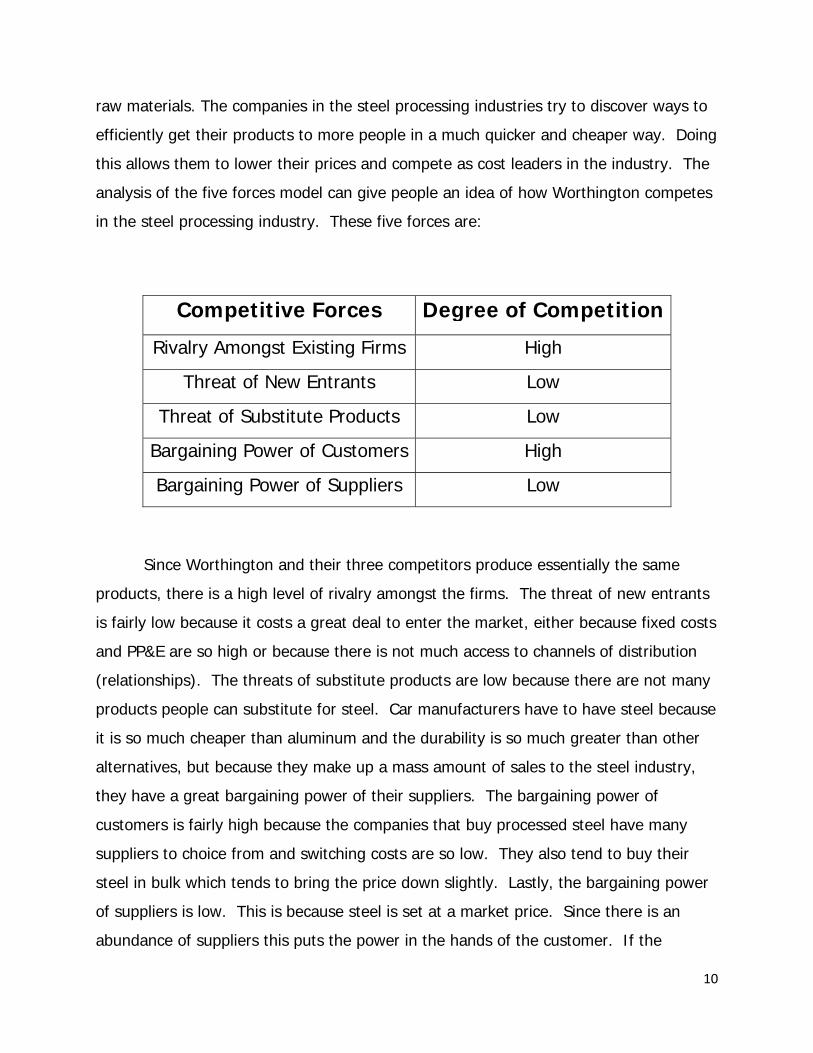
analysis of the five forces model can give people an idea of how Worthington competes
in the steel processing industry. These five forces are:
Competitive Forces Degree of Competition
Rivalry Amongst Existing Firms High
Threat of New Entrants Low
Threat of Substitute Products Low
Bargaining Power of Customers High
Bargaining Power of Suppliers Low
Since Worthington and their three competitors produce essentially the same
products, there is a high level of rivalry amongst the firms. The threat of new entrants
is fairly low because it costs a great deal to enter the market, either because fixed costs
and PP&E are so high or because there is not much access to channels of distribution
(relationships). The threats of substitute products are low because there are not many
products people can substitute for steel. Car manufacturers have to have steel because
it is so much cheaper than aluminum and the durability is so much greater than other
alternatives, but because they make up a mass amount of sales to the steel industry,
they have a great bargaining power of their suppliers. The bargaining power of
customers is fairly high because the companies that buy processed steel have many
suppliers to choice from and switching costs are so low. They also tend to buy their
steel in bulk which tends to bring the price down slightly. Lastly, the bargaining power
of suppliers is low. This is because steel is set at a market price. Since there is an
abundance of suppliers this puts the power in the hands of the customer. If the
11
suppliers try to raise prices the firms will be tempted to go somewhere else to buy their
processed steel.
Accounting Analysis
The main idea of this section was to attempt to identify Worthington’s key
accounting policies and figure out whether these policies properly represent the firm.
The level that a firm discloses their financial information is very important to investors.
The more a firm discloses the better an idea an investor will have of how that firm is
doing at a particular time. Most firms tend to disclose as little as the SEC deems
necessary for many reasons. This can lead to distortion in certain numbers that
investors think are very important.
The key accounting policies for the steel processing industry are the writing off
of operating leases, reporting of goodwill, pension plans and the discount rate they are
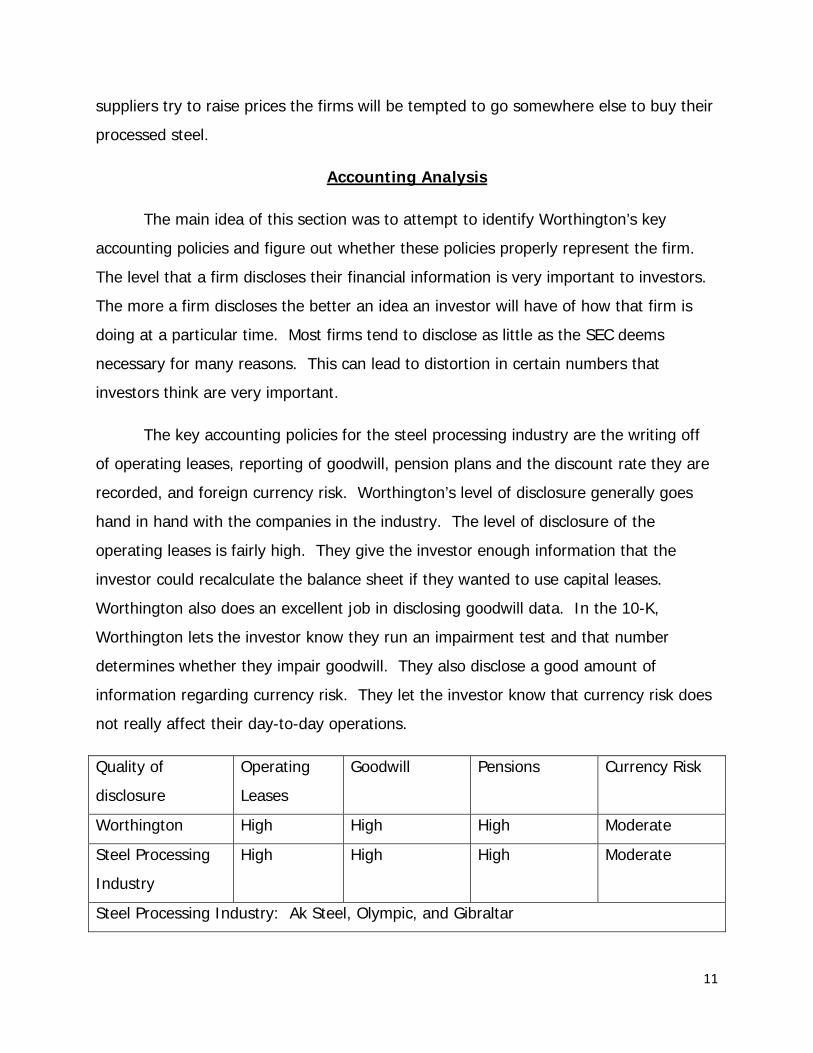
recorded, and foreign currency risk. Worthington’s level of disclosure generally goes
hand in hand with the companies in the industry. The level of disclosure of the
operating leases is fairly high. They give the investor enough information that the
investor could recalculate the balance sheet if they wanted to use capital leases.
Worthington also does an excellent job in disclosing goodwill data. In the 10-K,
Worthington lets the investor know they run an impairment test and that number
determines whether they impair goodwill. They also disclose a good amount of
information regarding currency risk. They let the investor know that currency risk does
not really affect their day-to-day operations.
Quality of
disclosure
Operating
Leases
Goodwill Pensions Currency Risk
Worthington High High High Moderate
Steel Processing
Industry
High High High Moderate
Steel Processing Industry: Ak Steel, Olympic, and Gibraltar
12
Worthington does an excellent job of letting the investor know what kind of
leases they use and the amounts they are for. They also let the investor know about
the foreign currency acquisitions and how they affect their business. As far as goodwill
goes, Worthington does not impair any goodwill. This causes the assets to be
overstated, which causes the owners equity of the firm to be overstated. This could
lead investors to believe that Worthington is making more money than they really
make. Throughout this report we adjusted the balance sheet and income statement to
represent what would have happened had the goodwill actually been impaired.
Generally speaking, Worthington lets the investor know where they stand financially
speaking. The 10-K report was very concise and has an appropriate amount of
information regarding financial figures.
Financial Analysis, Cost of Capital Estimation, and Forecasting
The first step of performing financial analysis is through the use of ratios. These ratios
can be categorized in three groups: liquidity, profitability, and capital structure. By
using these ratios we can compare Worthington’s performance to its competitor over
time. Liquidity ratios measure how well a company is able to take care of, or pay, their
liabilities. Banks or other types of lenders are interested in these ratios. Liquidity ratios
give a good idea how probable a firm can pay back liabilities, like a loan. Worthington
liquidity ratios, overall, tend to line up with the rest of the industry. Worthington’s
liquidity ratios were stable, on the whole. Profitability ratios indicate how well a firm
translates things, such as assets or equity, into profit. Profitability ratios also compute
how well a firm manages their expenses. Worthington’s profitability ratios were able to
out-perform the industry average on a consistent basis. Capital structure ratios are
ratios that can indicate possible problems and risks. The capital structure ratios,
however, do not use performance measures to judge the possible problems or risks.
Capital structure ratios measure things like how a company finances assets. A company
can finance through borrowing money from lenders or through selling new stock to
13
shareholders. Worthington’s capital structure ratios, similar to the liquidity ratios, were
close to the industry average.
Finding the cost of capital was necessary to value the firm because we needed
proper discount and growth rates related to the firm. We found Worthington’s cost of
equity, cost of debt and their weighted average cost of capital. To find Worthington’s
cost of equity we used regression analysis to determine a beta. From the regressions
we then chose the beta that gave us the most explanatory power of the firms
systematic risk, which is shown by the adjusted R squared from each regression. We
then found Worthington’s cost of equity bay using the capital asset pricing model.
Inputs in this model include the risk free rate, Worthington’s beta of 1.102 and the
market risk premium. For the risk free rate we used the 10-year U.S. Treasury Bill rate
and for the market risk premium we took an average of S&P 500 returns. After using
the capital asset pricing model we computed Worthington’s cost of equity to be
11.18%. But then we had to adjust the risk due to the market size of the firm which
increased Worthington’s cost of equity to 13.08%. Next we found Worthington’s cost of
debt by taking the weighted average of all interest rates of all the firms debt. We
calculated Worthington’s cost of debt to be 3.75%. Now that we have Worthington’s
cost of equity and cost of debt we were able to compute a weighted average cost of
capital both before tax and after tax.
Forecasting Worthington’s financial statement proved to be the most important
part of the financial analysis because valuations are based upon it. We started by
forecasting total sales by estimated growth rates. These growth rates were estimated
on conclusions draw form historical trends and the recent recession. Once we had total
sales forecasted we then used Worthington’s liquidity and profitability ratios to properly
link and forecasted all financial statements. As an example we used Worthington’s
average 5 year asset turnover to link forecasted sales to total assets. Also, the
accuracy of forecasts of the income and balance sheet should be better than the
statement of cash flows. Because cash flows of a firm are erratic and extremely difficult
to predict.
14
Valuations
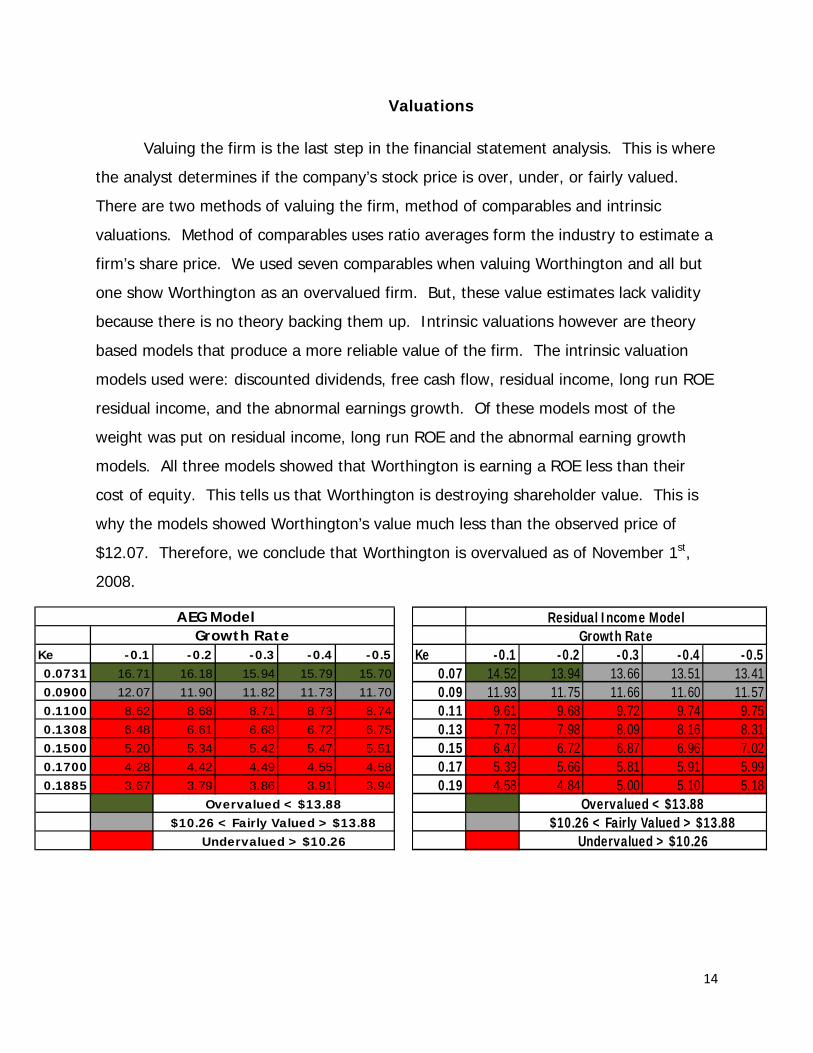
Valuing the firm is the last step in the financial statement analysis. This is where
the analyst determines if the company’s stock price is over, under, or fairly valued.
There are two methods of valuing the firm, method of comparables and intrinsic
valuations. Method of comparables uses ratio averages form the industry to estimate a
firm’s share price. We used seven comparables when valuing Worthington and all but
one show Worthington as an overvalued firm. But, these value estimates lack validity
because there is no theory backing them up. Intrinsic valuations however are theory
based models that produce a more reliable value of the firm. The intrinsic valuation
models used were: discounted dividends, free cash flow, residual income, long run ROE
residual income, and the abnormal earnings growth. Of these models most of the
weight was put on residual income, long run ROE and the abnormal earning growth
models. All three models showed that Worthington is earning a ROE less than their
cost of equity. This tells us that Worthington is destroying shareholder value. This is
why the models showed Worthington’s value much less than the observed price of
$12.07. Therefore, we conclude that Worthington is overvalued as of November 1st,
2008.
Ke -0.1 -0.2 -0.3 -0.4 -0.50.0731 16.71 16.18 15.94 15.79 15.700.0900 12.07 11.90 11.82 11.73 11.700.1100 8.62 8.68 8.71 8.73 8.740.1308 6.48 6.61 6.68 6.72 6.750.1500 5.20 5.34 5.42 5.47 5.510.1700 4.28 4.42 4.49 4.55 4.580.1885 3.67 3.79 3.86 3.91 3.94
Overvalued < $13.88$10.26 < Fairly Valued > $13.88
Undervalued > $10.26
Growth RateAEG Model
Ke -0.1 -0.2 -0.3 -0.4 -0.50.07 14.52 13.94 13.66 13.51 13.410.09 11.93 11.75 11.66 11.60 11.570.11 9.61 9.68 9.72 9.74 9.750.13 7.78 7.98 8.09 8.16 8.310.15 6.47 6.72 6.87 6.96 7.020.17 5.39 5.66 5.81 5.91 5.990.19 4.58 4.84 5.00 5.10 5.18
Overvalued < $13.88$10.26 < Fairly Valued > $13.88
Undervalued > $10.26
Growth RateResidual Income Model
15
Overview
Worthington Industries was started and founded in 1955 with its headquarters in
Columbus, Ohio. Since then, they have grown to a corporation with a net market
capital of 1.32 billion dollars. Worthington process’ steel for more than 1200 customers
in various industries across the globe. Their customers include industries in areas such
as agriculture, lawn & garden, hardware, aviation, automotive, office furniture, and
others. Worthington creates many different kinds and shapes of metal. Some of these
include cold rolling, slitting, pickling, primacoat, dry-coating, and others. Fortune
Magazine placed them in the “Top 100 companies to work for in America” in 2006,
2002, 1998, 1997. Its number one priority is to make the shareholders money while
increasing the value of their investments.
They make different metals parts for many different industries. The biggest of
these industries is the automobile industry. A large proportion of Worthington’s sales
are to the “Big 3” here in the United States. Worthington makes many different parts
for them such as frames to bolts.
Worthington operates in three segments: steel processing, metal framing, and
cylinders. The steel processing unit consists of finished steel products primarily used in
automobile manufacturing. The metal framing segment consists of steel framing used in
construction. Worthington’s third segment, cylinders, is a small niche segment
consisting of made-to-order pressure cylinders.
A few of the direct competitors of Worthington are AK Steel, Gibraltar, Nucor,
and Olympic Steel Incorporation. There are different competitors for different areas. In
the steel framing segment, Gibraltar is the biggest competitor. In the steel processing
segment, AK Steel and Olympic Steel are their biggest competitors.
Worthington tries to incorporate all of their operating activities in one location
which makes it easier to communicate within the company. This also reduces freight
cost for its customers. (www.worthingtonsteel.com)
16
Automobile manufacturers are the processing industry’s biggest customers and
are expected to take a large decrease in sales during the upcoming recession. This is
expected to negatively impact Worthington and its competitors. Any spending cuts a
company can make without sacrificing quality will result in a competitive advantage for
that company.
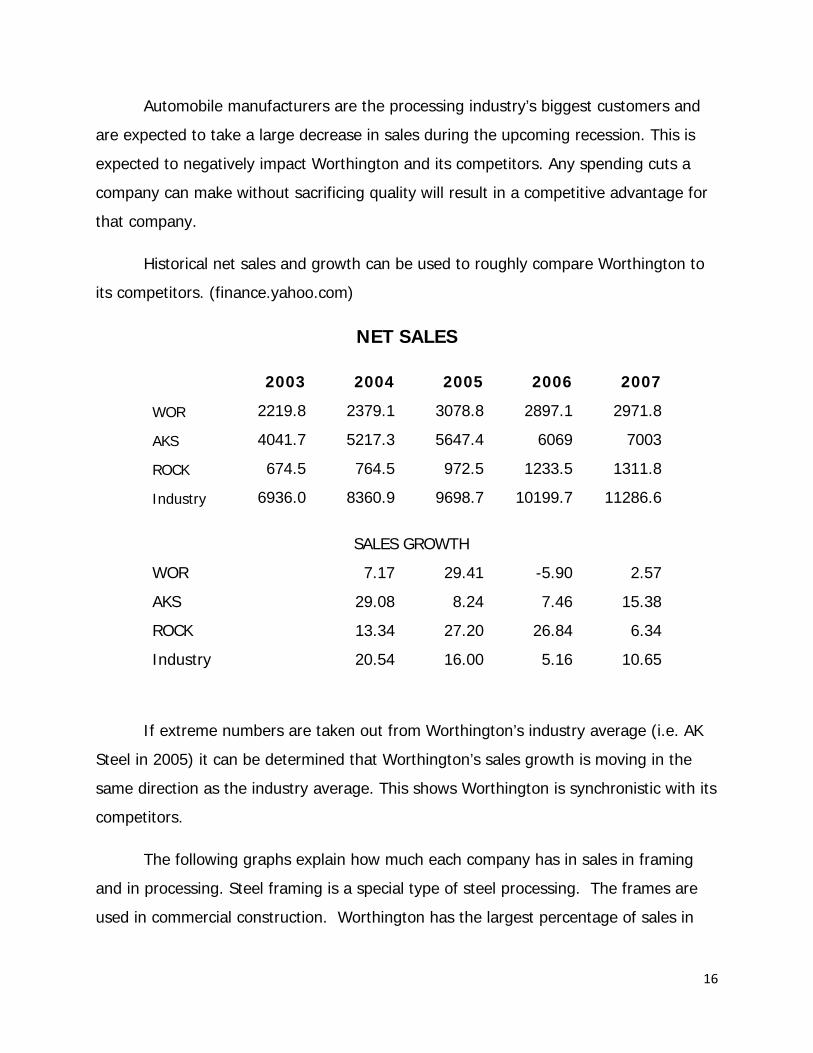
Historical net sales and growth can be used to roughly compare Worthington to
its competitors. (finance.yahoo.com)
NET SALES
2003 2004 2005 2006 2007
WOR 2219.8 2379.1 3078.8 2897.1 2971.8
AKS 4041.7 5217.3 5647.4 6069 7003
ROCK 674.5 764.5 972.5 1233.5 1311.8
Industry 6936.0 8360.9 9698.7 10199.7 11286.6
SALES GROWTH
WOR 7.17 29.41 -5.90 2.57
AKS 29.08 8.24 7.46 15.38
ROCK 13.34 27.20 26.84 6.34
Industry 20.54 16.00 5.16 10.65
If extreme numbers are taken out from Worthington’s industry average (i.e. AK
Steel in 2005) it can be determined that Worthington’s sales growth is moving in the
same direction as the industry average. This shows Worthington is synchronistic with its
competitors.
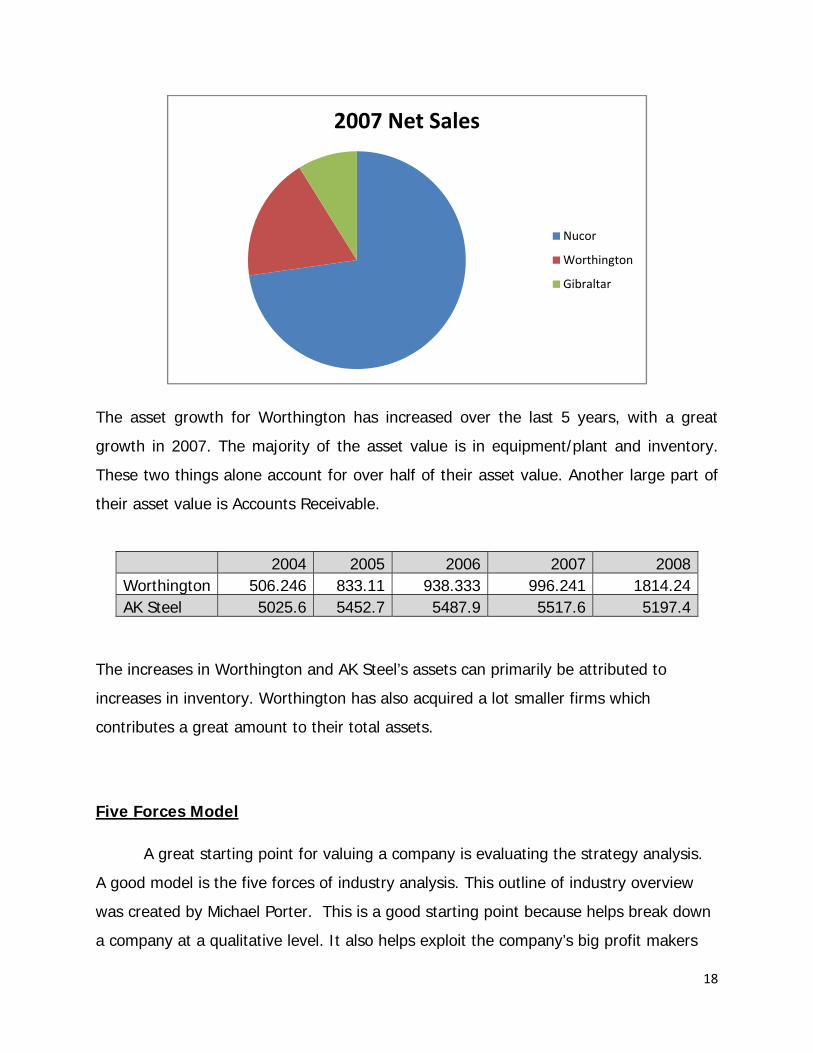
The following graphs explain how much each company has in sales in framing
and in processing. Steel framing is a special type of steel processing. The frames are
used in commercial construction. Worthington has the largest percentage of sales in
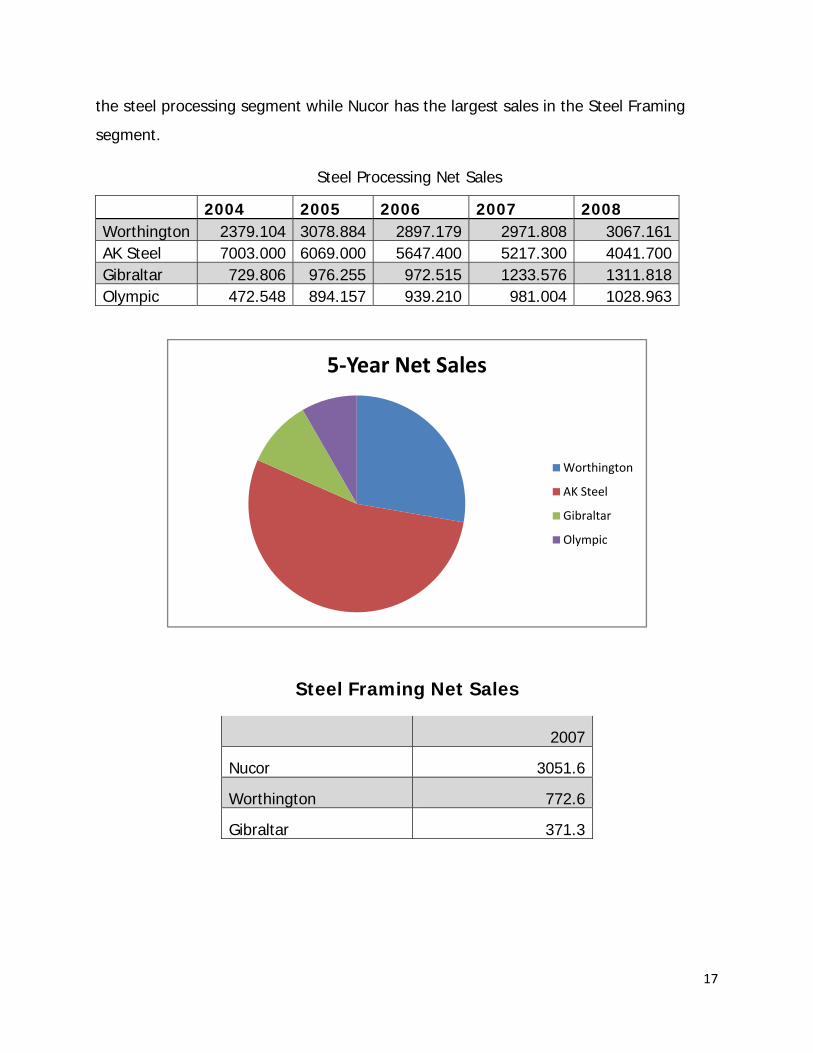
17
the steel processing segment while Nucor has the largest sales in the Steel Framing
segment.
Steel Processing Net Sales
2004 2005 2006 2007 2008 Worthington 2379.104 3078.884 2897.179 2971.808 3067.161AK Steel 7003.000 6069.000 5647.400 5217.300 4041.700Gibraltar 729.806 976.255 972.515 1233.576 1311.818Olympic 472.548 894.157 939.210 981.004 1028.963
Steel Framing Net Sales
2007
Nucor 3051.6
Worthington 772.6
Gibraltar 371.3
5‐Year Net Sales
Worthington
AK Steel
Gibraltar
Olympic
18
The asset growth for Worthington has increased over the last 5 years, with a great
growth in 2007. The majority of the asset value is in equipment/plant and inventory.
These two things alone account for over half of their asset value. Another large part of
their asset value is Accounts Receivable.
2004 2005 2006 2007 2008Worthington 506.246 833.11 938.333 996.241 1814.24AK Steel 5025.6 5452.7 5487.9 5517.6 5197.4
The increases in Worthington and AK Steel’s assets can primarily be attributed to
increases in inventory. Worthington has also acquired a lot smaller firms which
contributes a great amount to their total assets.
Five Forces Model
A great starting point for valuing a company is evaluating the strategy analysis.
A good model is the five forces of industry analysis. This outline of industry overview
was created by Michael Porter. This is a good starting point because helps break down
a company at a qualitative level. It also helps exploit the company’s big profit makers
2007 Net Sales
Nucor
Worthington
Gibraltar

19
and the big risk takers of the company. The five areas in this type of analysis are:
rivalry among existing firms, threat of new entrants, threat of substitute products,
bargaining power of buyer, and bargaining power of suppliers. The first three areas
involve the potential sources of competition in an industry (Palepu and Healy 2-20).
The last two areas discussed focus on how profits are affected by the industries
bargaining power with its customers and suppliers. Individually the five forces may not
provide much detail for the business. When viewed as a whole, the five forces model
can be very helpful when trying to determine what drives the profit in a firm’s industry.
Competitive Forces Degree of CompetitionRivalry Among Existing Firms High
Threat of New Entrants Low
Threat of Substitute Products Low
Bargaining Power of Customers High
Bargaining Power of Suppliers Low
The threat of existing firms is considerably higher than others because of the low steel
processing industry concentration. The bargaining power of suppliers is low because
costs and prices have been cut already quite a bit. The bargaining power is high also.
When there is not a big difference in products from one firm to another, it is much
easier for customers to shop from one to another. Therefore, companies must keep
their prices low to compete with existing firms.
Rivalry Among Existing Firms
If an industry is highly competitive, as the steel processing industry proves to be,
cost leadership tends to be the most common used. Competition in the steel processing
industry is intense to the point that firms in the industry drive the prices downward
closer to marginal costs to get the business of customers. There are many factors that
20
should be considered when analyzing the rivalry among the existing firms in an
industry. These factors are: industry growth rate, concentration of competitors, degree
of differentiation and switching costs, scale/learning economies, the ratio of fixed to
variable cost, excess capacity and exit barriers.
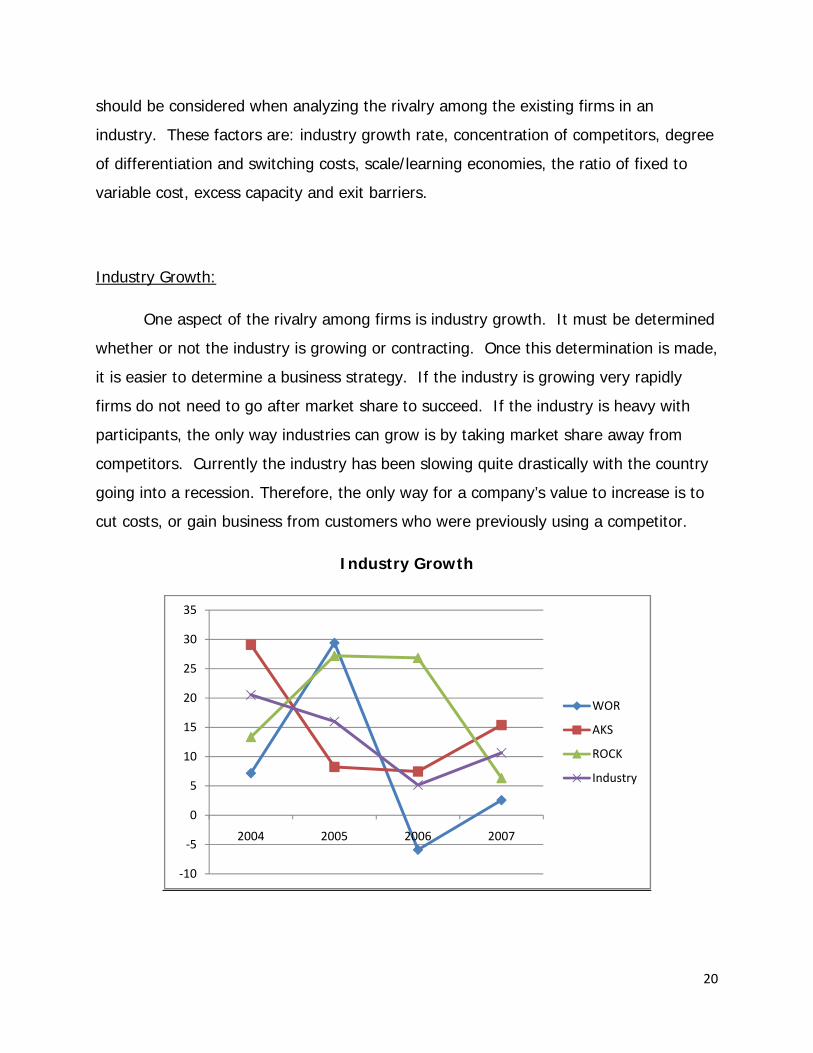
Industry Growth:
One aspect of the rivalry among firms is industry growth. It must be determined
whether or not the industry is growing or contracting. Once this determination is made,
it is easier to determine a business strategy. If the industry is growing very rapidly
firms do not need to go after market share to succeed. If the industry is heavy with
participants, the only way industries can grow is by taking market share away from
competitors. Currently the industry has been slowing quite drastically with the country
going into a recession. Therefore, the only way for a company’s value to increase is to
cut costs, or gain business from customers who were previously using a competitor.
Industry Growth
‐10
‐5
0
5
10
15
20
25
30
35
2004 2005 2006 2007
WOR
AKS
ROCK
Industry
21
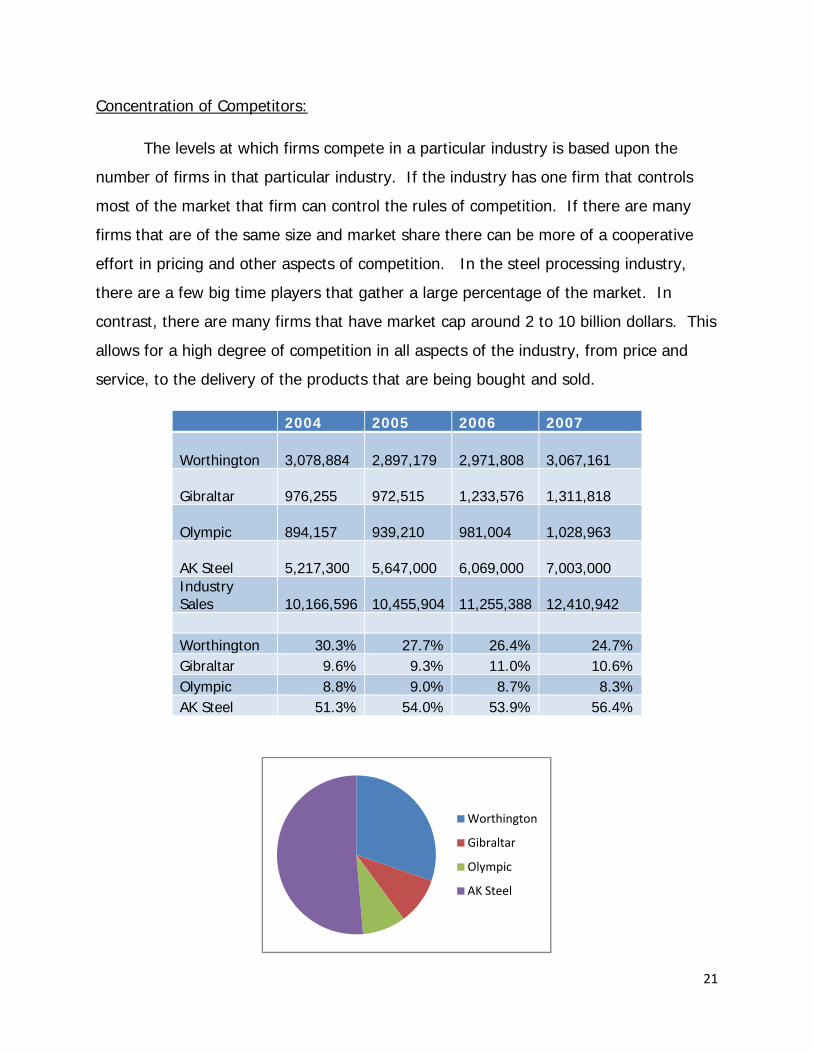
Concentration of Competitors:
The levels at which firms compete in a particular industry is based upon the
number of firms in that particular industry. If the industry has one firm that controls
most of the market that firm can control the rules of competition. If there are many
firms that are of the same size and market share there can be more of a cooperative
effort in pricing and other aspects of competition. In the steel processing industry,
there are a few big time players that gather a large percentage of the market. In
contrast, there are many firms that have market cap around 2 to 10 billion dollars. This
allows for a high degree of competition in all aspects of the industry, from price and
service, to the delivery of the products that are being bought and sold.
2004 2005 2006 2007
Worthington 3,078,884
2,897,179
2,971,808
3,067,161
Gibraltar 976,255
972,515
1,233,576
1,311,818
Olympic 894,157
939,210
981,004
1,028,963
AK Steel 5,217,300
5,647,000
6,069,000
7,003,000
Industry Sales
10,166,596
10,455,904
11,255,388
12,410,942
Worthington 30.3% 27.7% 26.4% 24.7% Gibraltar 9.6% 9.3% 11.0% 10.6% Olympic 8.8% 9.0% 8.7% 8.3% AK Steel 51.3% 54.0% 53.9% 56.4%
Worthington
Gibraltar
Olympic
AK Steel
22
As the graphs above shows, the percent of Worthington’s sells in comparison to
the industry has been dropping at a fairly constant rate in the last 4 years, while AK
Steel’s and Olympic Steel’s stay pretty constant and Gibraltar’s goes up than back
down, but still finishing higher than they did in 2004. Although it appears that AK Steel
holds the largest proportion, AK Steel has considerably more segments than the rest of
the firms in the steel processing industry. Worthington holds a smaller proportion than
AK Steel but much larger than the other two firms of Olympic and Gibraltar. This
proves that the steel processing industry concentration is low.
Level of Differentiation:
One of the ways that firms can avoid direct competition depends on how the
firms can differentiate their products and services. If there is low product
differentiation in the industry, firms will tend to compete on price. A higher level of
differentiation allows a firm to set a higher price. Although there are many ways to
manufacture and produce steel products, the finished goods are mostly identical.
Therefore, because the mass amount of the products produced from each firm at
identical, the competition comes back to price and a firm’s ability to control its cost to
be able to reduce the cost.
Switching Cost:
Another risk a company has to watch is their customers’ switching costs. If a
customer of the firm can easily change from one steel processing company to the next,
it wouldn’t take much for the customer to start dealing with a competitor. Within the
steel processing industry, switching costs are low. According to both companies’ 10-Ks,
Worthington and AK Steel process steel for the “Big Three” in the United States
automotive industry. If one of the “Big Three” are dissatisfied with AK Steel, there
wouldn’t be much of a drop off or penalty to switch to Worthington and vice-versa.
23
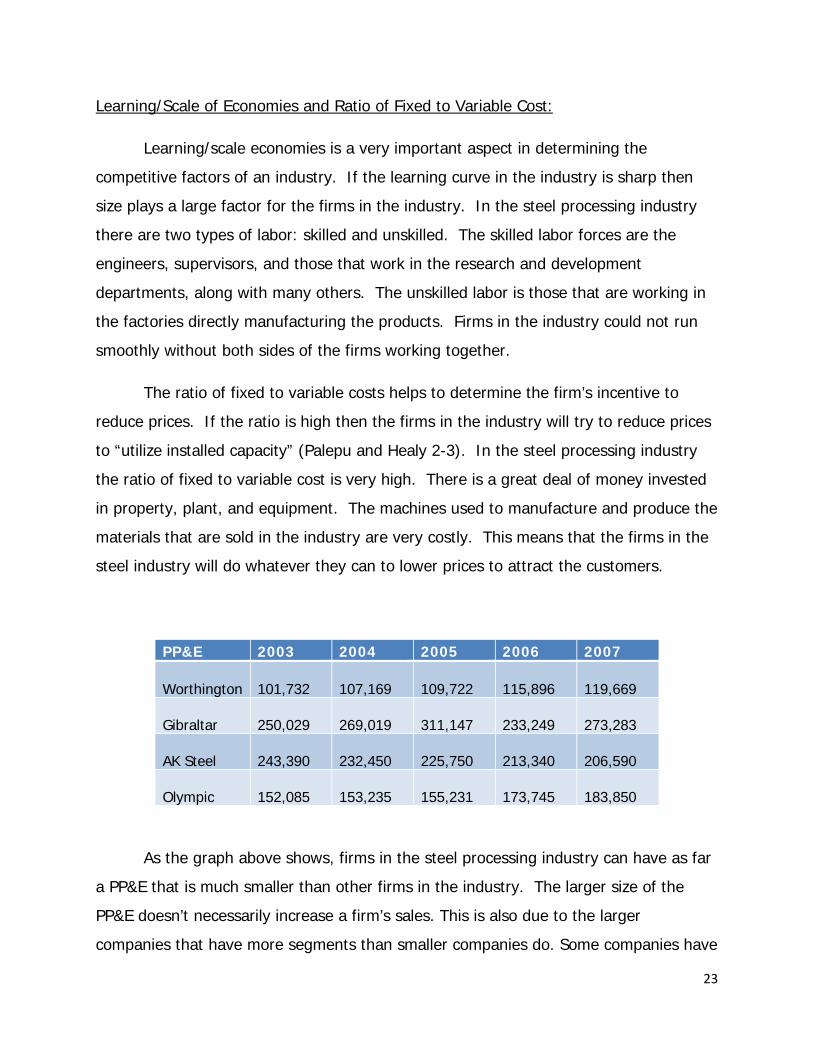
Learning/Scale of Economies and Ratio of Fixed to Variable Cost:
Learning/scale economies is a very important aspect in determining the
competitive factors of an industry. If the learning curve in the industry is sharp then
size plays a large factor for the firms in the industry. In the steel processing industry
there are two types of labor: skilled and unskilled. The skilled labor forces are the
engineers, supervisors, and those that work in the research and development
departments, along with many others. The unskilled labor is those that are working in
the factories directly manufacturing the products. Firms in the industry could not run
smoothly without both sides of the firms working together.
The ratio of fixed to variable costs helps to determine the firm’s incentive to
reduce prices. If the ratio is high then the firms in the industry will try to reduce prices
to “utilize installed capacity” (Palepu and Healy 2-3). In the steel processing industry
the ratio of fixed to variable cost is very high. There is a great deal of money invested
in property, plant, and equipment. The machines used to manufacture and produce the
materials that are sold in the industry are very costly. This means that the firms in the
steel industry will do whatever they can to lower prices to attract the customers.
PP&E 2003 2004 2005 2006 2007
Worthington 101,732
107,169
109,722
115,896
119,669
Gibraltar 250,029
269,019
311,147
233,249
273,283
AK Steel 243,390
232,450
225,750
213,340
206,590
Olympic 152,085
153,235
155,231
173,745
183,850
As the graph above shows, firms in the steel processing industry can have as far
a PP&E that is much smaller than other firms in the industry. The larger size of the
PP&E doesn’t necessarily increase a firm’s sales. This is also due to the larger
companies that have more segments than smaller companies do. Some companies have
24
more specific fields than their competitors. The PP&E does make up a mass amount of
every company’s assets. Worthington’s PP&E has been growing over the years just as
Olympics’, while their competitors have been declining.
Excess Capacity:
Excess capacity in an industry has to do with supply and demand. If supply
exceeds demand there will be a strong incentive for firms to lower cost to increase
sales. In the steel processing industry, most of the firms base their production on the
customer orders. In most cases, excess capacity is not an issue. Most of the firms in
the steel processing industry have a number of operations centers that are used for
customers to receive their products in a timely manner. This strategy keeps inventories
down and allows the steel companies to only produce what the customers need. This,
in turn, keeps the excess capacity to a minimum. The problem of excess capacity can
be increased a great deal if the barriers to exit are high. Exit barriers are extremely
high in the industry. The highly specialized equipment that is needed for production
makes for low resale value. In addition, the factory employees are unionized and have
pension plans that must be taken into account.
Exit Barriers:
Exit Barriers are very costly, especially in the steel industry because the PP&E are
so expensive and specific. Not many people need steel processing plants. Therefore, it
is very hard to sell any of the PP&E. So, companies will do everything they can to
prevent this from happening, making competition that much steeper.
Conclusion:
Because rivalry among the companies is very high, it is important to get a clear
picture of what is taking place in the industry. Starting with the analysis of the industry
growth, concentration and balance of the competitors, degree of differentiation,
switching costs, scale/learning economies, excess capacity and exit barriers, one can
get a good idea of where a firm needs to be and which pricing strategy should be used.
25
Also, because the steel industry is so competitive, expensive to for new entries, and
specialized, this industry is high cost competitive.
Threat of New Entrants
The second competitive force is the threat of new entrants. The threat of new
entrants to a market exists for every firm. If an industry is making abnormal amounts of
profits, this make is a prime candidate for new entrants. This competitive force plays a
large part in the pricing structure of existing firms within the market. There are several
factors that should be taken into account. These factors are: economies of scale, first
mover advantage, access to channels of distribution and relationships, and legal
barriers. All of these factors play a part in determining the profitability of a firm as new
firms enter the already existing market. But, because of the competitiveness of the
industry, and the costs to start, makes it very tough for new entrants.
Economies of Scale:
The first factor to consider when discussing the threat of new entrants is
economies of scale. The term ‘economies of scale’ refers to how much the cost per unit
decreases as a firm increases output. When large economies of scale exist, new firms
may have to choose between investing in large capacity, or entering with a lower
capacity than desired. These choices may be very critical. If a firm does not have the
proper capacity they may not have enough resources to compete with existing firms.
This will put new entrants in the market at a major disadvantage.
For the steel processing industry, the high economies of scale is a major
deterrent for new firms into this market. The high initial start up cost and the technical
nature of the production systems used to produce steel are two factors that lead to the
high level of economies of scale. Furthermore, companies would need a large amount
26
of capital to be able to compete on the same level as the firms that already exist in the
rather large steel processing market.
First Mover Advantage:
The first mover advantage is established when a company moves into a market
and establishes rights that are exclusive to one firm. First movers are able to obtain
contracts or other agreements with suppliers that are difficult to obtain otherwise. First
movers would have an advantage due to lower raw materials costs, and better
negotiate contracts.
In the steel processing industry, which is a fairly homogeneous field among the
industry, the first mover advantage has a low deterrent level on firms that may want to
join the market. The industry standards are the same for all firms in the industry. All
firms also have to abide by the same environmental standards. In addition, suppliers
provide the same raw materials to most companies and the price they pay is generally
based on the quantity ordered.
Access to Channels of Distribution and Relationships
This is a factor that hinders many new firms from entering a particular market,
especially in an industry that has been around for long time and relationships have
been going on for decades. Once relationships are formed and channels of distribution
are established, the cost of developing new channels can be rather high. Some existing
companies have relationships with particular suppliers that go back a long time. With
these relationships comes a sense of trust that money may not be able to surpass.
For example in 1995, Worthington made an agreement with North Star steel
company who is a supplier, to build the biggest plant they have adjacent with North
Star. An agreement like this basically locks up Worthington’s relationship with North

27
Star since they are adjacent with them. It will be highly expensive for any other steel
company to come take the business away from Worthington. And because North Star is
the thirteenth largest steel producer in the world, this is a very important relationship
for Worthington, so Worthington will do just about whatever it takes to keep this
relationship. (http://findarticles.com/p/articles/mi_m0EIN/is_/ai_16934172)
In the steel processing industry, a lack of a relationship within the channels of
distribution leads to a lower bargaining power. Most firms get most raw materials from
a limited number of suppliers. This helps to develop good relationships with a particular
supplier. The better relationship with suppliers, the better price steel processing
companies are likely to receive. These actions may deter new firms from being able to
acquire the same goods for the same price.
Legal Barriers
The last factor to consider is the legal barriers that must be overcome. In many
research-intensive industries, the price of patents and copyrights alone are enough to
deter new firms from entering the market. Licensing agreements are also legal barriers
firms must overcome before they can consider entering a market. Most companies
require a legal department to help with the daily operations that are required to keep a
firms head above water.
For instance, in Worthington’s 2008 10-k, they have trademark and patent costs
of only $11,364, which is very small in comparison to the rest of the costs in the
company.
Conclusion
In conclusion, the threat of new entrants into the steel processing market is very
low. The majority of firms in this market have been around for a large amount of

28
years, with relationships that have been around for a long time. Because of this, for a
new entry to be able to take business away from another is very expensive and
unlikely. Between the required high economies of scale, the extreme high costs of
PP&E to get started, the access to channels of distribution and relationships, one can
conclude it will be difficult for a new firm to enter the steel processing industry.
Threat of Substitute Product
Firms in an industry should be aware of the possible substitute products. If the firms in
the steel processing industry are not prepared for the substitute products, they will be
out of the loop. The substitute products for the steel processing industry include
aluminum, wood, and heavy-duty plastic.
Relative Price and Performance
Aluminum is one type of substitute product for steel. When a car manufacturer wants
to make the car lighter like in high performance sports cars, aluminum would be a
sensible choice. What has to be taken into consideration for the substitution, however,
is the price of aluminum relative to steel.
(http://xnet3.uss.com/auto/steelvsal/cost.htm)

29
In the graph above, it shows the price of steel in comparison to aluminum, in which
steel is almost 3 times cheaper than aluminum, and twice as strong. Because of this, it
will be very tough for aluminum to be able to replace steel has alternative, especially in
the automobile industry which is a large percentage of Worthington’s sales.
Steel, however, is the pricier alternative in the construction business. Most residential
builders opt to use wood for framing. Wood is much cheaper, but it is not as strong.
But for large buildings, steel is used because of its strength and price.
Customer’s willingness to switch
Not all customers’ wants are alike. A large amount of our customers are the “Big
3” automobile industry and construction. A low-end car manufacturer might not be
willing to put forth twice the amount of money in order to make their cars weigh less.
A higher-end sports car manufacturer that doesn’t want to use carbon-fiber would be
more likely to forgo the price penalty in order to improve car performance.

30
A single story residential building can use a weaker material than steel, such as
wood. On the other hand, a multi-story skyscraper could not stand if it were framed
with wood. A commercial builder would opt to pay the premium for the steel in order
to provide the needed strength to accomplish the build. Commercial builders use steel
framing to build the much bigger structures and need steel to do so rather than wood.
Conclusion
The customers in the steel industry have already chosen steel. The only
possibility customers that would leave steel for a different material would be for either a
rise in steel price, a decrease in the price of aluminum, or an increase in a lower quality
substitute’s attributes. And the price of aluminum is so much more than steel, one can
pretty confident that this will not happen anytime soon. Also, with car safety ratings
becoming so important, and the weakness of aluminum, steel for the automobile is the
only product they can use that can accomplish what they need.
Bargaining Power of Customers
Customers can have a leg up on their suppliers if the customer can switch
between companies without a loss in profit. And with the competitiveness of the steel
industry, there is a fair threat of this. But as we stated before, relationships are very
important and are respected from both the customers and suppliers. Also, because the
products of steel from one company to another are so similar, and prices are so evenly
matched, switching to another supplier is not that common. Price sensitivity plays the
main role in a customer to switch to another supplier.
31
Price Sensitivity
The abundance of companies in the steel industry makes a competitive market.
The competitive market leads to competitive pricing. The customers, especially in
construction, buy large volumes of steel framing. The steel companies are eager to do
business with the high volume orders from the customers. The steel companies are
more apt to lower prices to stay competitive to earn business. And anything a company
can do to help lock up long term contracts, they will do. And going back to
relationships, most customers will give their supplier first hand when comes to renewing
contracts, but again this puts the pressure back on the supplier to keep their prices low
so they can renew their business.
Relative Bargaining Power
Companies buying processed steel have many options. There are plenty of steel
companies for them to choose from. This puts the bargaining power in the customer’s
hands. If a customer is dissatisfied with the quality or the price of the steel good, the
customer can change suppliers. The high volume in an order looks attractive to the
supplier. The customer wants a discount for the volume and the supplier is willing to
cooperate. Therefore, customers will make large orders so they can drive down the
price. Every company in the steel processing industry will lower their prices to compete
and try to get the business of the customer.
In addition, switching costs, which is the costs that would occur of switching
suppliers, is relatively low. This plays in favor of the customer to be able to bargain and
shop for cheaper prices. So suppliers must do everything they can to keep or earn the
business of suppliers.
32
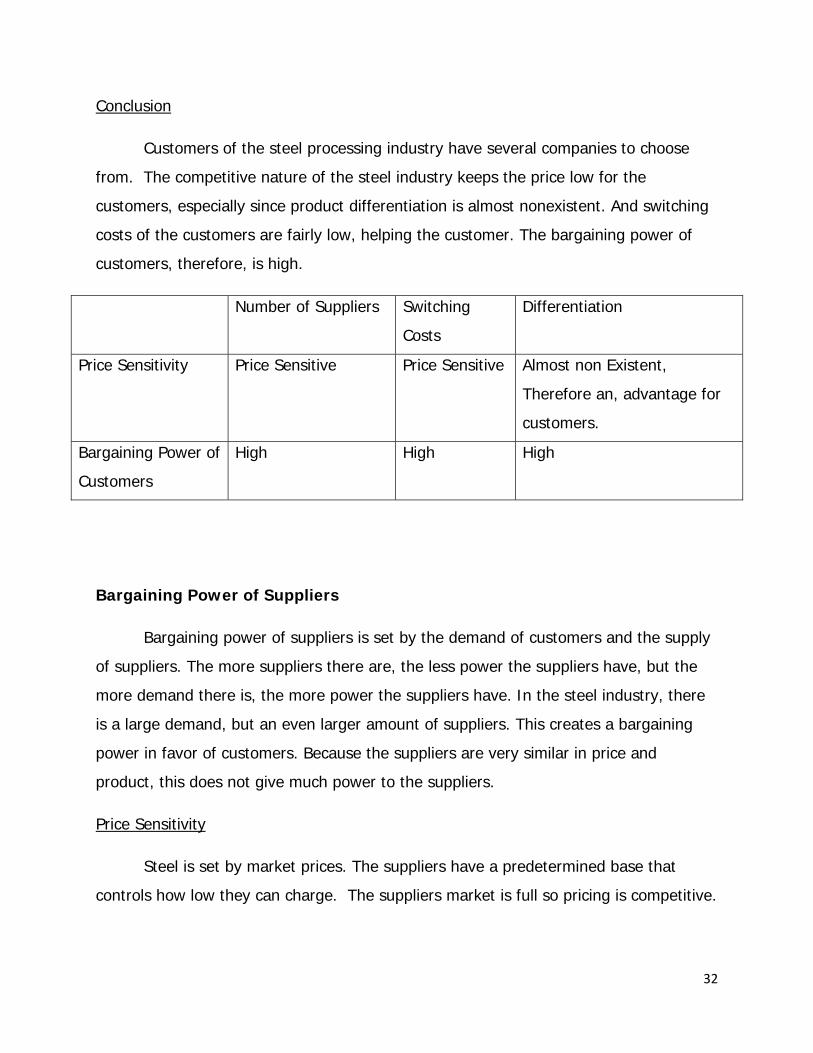
Conclusion
Customers of the steel processing industry have several companies to choose
from. The competitive nature of the steel industry keeps the price low for the
customers, especially since product differentiation is almost nonexistent. And switching
costs of the customers are fairly low, helping the customer. The bargaining power of
customers, therefore, is high.
Number of Suppliers Switching
Costs
Differentiation
Price Sensitivity Price Sensitive Price Sensitive Almost non Existent,
Therefore an, advantage for
customers.
Bargaining Power of
Customers
High High High
Bargaining Power of Suppliers
Bargaining power of suppliers is set by the demand of customers and the supply
of suppliers. The more suppliers there are, the less power the suppliers have, but the
more demand there is, the more power the suppliers have. In the steel industry, there
is a large demand, but an even larger amount of suppliers. This creates a bargaining
power in favor of customers. Because the suppliers are very similar in price and
product, this does not give much power to the suppliers.
Price Sensitivity
Steel is set by market prices. The suppliers have a predetermined base that
controls how low they can charge. The suppliers market is full so pricing is competitive.
33
Also, because switching costs are so low, and suppliers will bring down their prices to
renew contracts and win new business, it increases price sensitivity.
Steel processing companies cannot simply shop the market for lower cost
alternative materials. It is impossible to produce steel framing from heavy-duty plastic.
The suppliers understand this, but it is evened out through competitive pricing amongst
competing suppliers.
Relative Bargaining Power
Bargaining power depend on the cost of each company to not do business with
the other. Because switching costs are very low, this favors the customer. The customer
can change to another supplier and not lose much at all, but could get a better price
which would help them in the long run. Because the amount of suppliers in the
industry, shopping around for prices is something customers do after every contract.
For instance, the automobile industry has a large amount of bargaining power over the
steel industry because of the large orders, with a large number of suppliers to choose
from. In this, the auto industry can drive the prices down.
“Steelmakers are suspending and renegotiating contracts with their raw-material
suppliers as they grapple with the sudden drop in demand for everything from cars and
appliances to bridges and buildings.”
(http://online.wsj.com/article/SB122697117526435811.html)
Conclusion
Bargaining power in the steel industry is in favor the customer. This conclusion is
drawn from a few key factors. The large amount of suppliers compared to the demand
gives the customer the advantage to shop around and drive the prices down. Also,
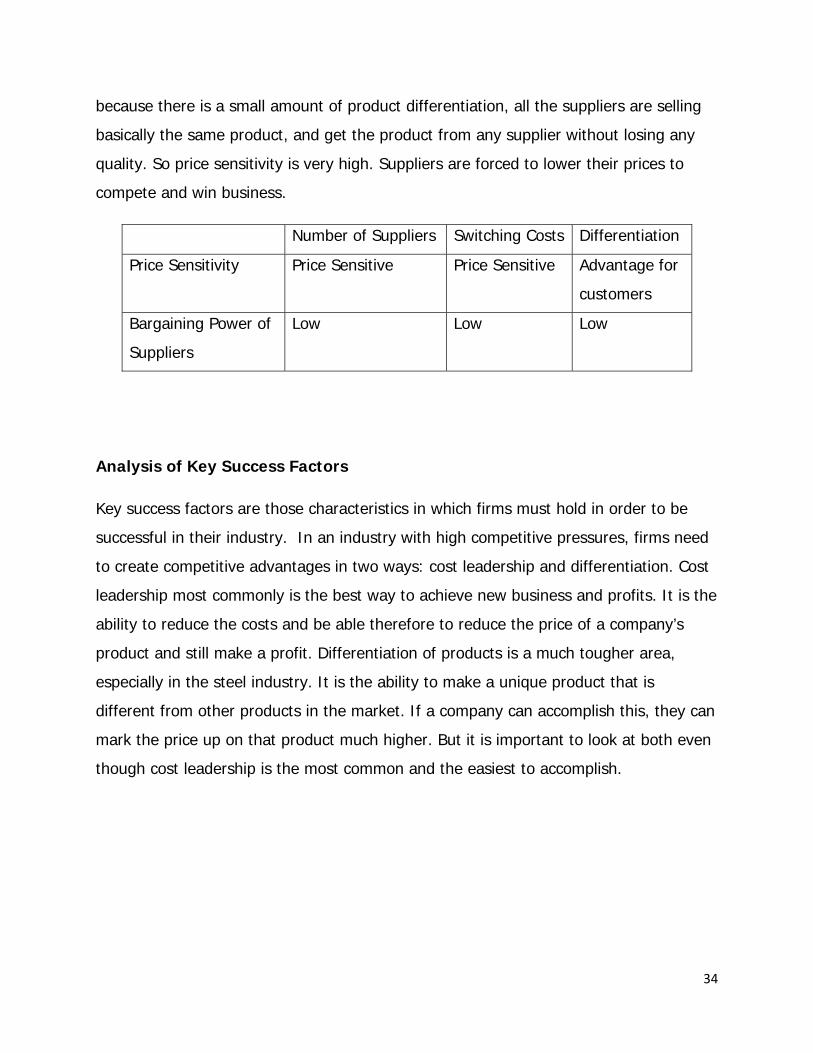
34
because there is a small amount of product differentiation, all the suppliers are selling
basically the same product, and get the product from any supplier without losing any
quality. So price sensitivity is very high. Suppliers are forced to lower their prices to
compete and win business.
Number of Suppliers Switching Costs Differentiation
Price Sensitivity Price Sensitive Price Sensitive Advantage for
customers
Bargaining Power of
Suppliers
Low Low Low
Analysis of Key Success Factors
Key success factors are those characteristics in which firms must hold in order to be
successful in their industry. In an industry with high competitive pressures, firms need
to create competitive advantages in two ways: cost leadership and differentiation. Cost
leadership most commonly is the best way to achieve new business and profits. It is the
ability to reduce the costs and be able therefore to reduce the price of a company’s
product and still make a profit. Differentiation of products is a much tougher area,
especially in the steel industry. It is the ability to make a unique product that is
different from other products in the market. If a company can accomplish this, they can
mark the price up on that product much higher. But it is important to look at both even
though cost leadership is the most common and the easiest to accomplish.

35
Cost Leadership
In a highly competitive industry, like the steel industry, firms must compete on price in
order to be successful. To be profitable, firms must be able to increase profit margins
by controlling and minimizing their costs. In order for the industry to be successful,
employing cost leadership strategies is vital. A company must be very efficient and
continually looking for new ways to be able to do the same thing in a cheaper manner
to reduce costs. This means finding a way to make the same product with less material,
or a new shape that is more efficient. This is the primary focus of steel companies.
They run on very tight budgets and stiff cost control. One can reduce costs a number of
different ways, such as economies of scale, cost control, recycling material,
transportation costs, and more efficient product design.
Economies of Scale:
The use of economies of scale refers to the lowering of average costs per unit due to
a larger production capacity. Firms that have the resources to produce with larger
economies to scale will have the advantage in this industry. With lower production
costs, larger firms can offer their products at a lower price than their smaller
competitors. The bigger a firm is, the more they can make at a lower costs, every single
product is not as important as it would be to a firm that makes half of what the bigger
firm produces. So the bigger a company gets, the more advantage they have over a
smaller company. More costs come with a larger company, but can produce more,
supply more, and win more business by lowering their prices.
Cost Control:
Cost control is the most important part of the steel industry. The steel processing
industry is highly competitive on price as well as the quality of their products. To be
profitable, firms need to cut costs as much as they can. The ability to manage and
reduce costs is required for any firm to stay competitive in this industry. By centralizing

36
organizational chores, which help in the managing and maintaining of inventory
efficiently, a firm can have a huge advantage over their competitors. Firms who are
able to control these factors will be able to lower their average cost per unit and in turn
increase their margins. Firms who are inefficient and cannot control costs will have a
hard time surviving in this industry.
Another big part of cost control is trying to be as resourceful in making every individual
product. If a company can reduce the amount of products that are produced that are
not quite right, variable costs, this can lower costs, because of the extra expense of
having to go back and redo a product that costs have occurred on.
Brand advertising in the industry is a minor expense and does not help sell any more
than one would sell if not advertised as heavily. By eliminating the amount of marketing
and advertising costs, this can help be able to lower the price of the product without
losing profits.
Reduced Transportation Costs:
Being able to reduce transportation costs can help drastically. If fuel prices are $3.00
like this previous summer, having suppliers and customers very close is very important.
Like stated earlier, Worthington built a plant that was adjacent to their supplier. This
will reduce costs drastically. Not having hardly any costs at all, rather than driving
trucks to transport many tons of steel from one location to another. This is not playing
as huge a roll currently with fuel prices dropping by 50%, but if energy prices spike
again, this will become very important once again. Worthington is not the only
company. According Wall Street Journal, in July, oil was selling for $145 a barrel, but in
early December was closing for as low as $46.96 a barrel.
( http://online.wsj.com/article/SB122822915071272421.html) This is a unexpected
lowering in transportation costs. In Gibraltar’s 2007 10-K, they state that “Increases in
energy and freight prices will increase our operating costs, and we may be unable to
pass all
37
these increases on to our customers in the form of higher prices for our products.”
Reducing transportation costs is imperative for all companies throughout the steel
processing industry.
Differentiation
A firm that can differentiate their products from the rest of the industry will be able to
have more power in dictating price. Just like Apple has the unique item of the iPod,
they can charge much higher prices than the costs. While most of the steel processing
industry follows a cost control strategy, many firms have created a new segment to
differentiate themselves. Differentiation in the steel processing industry requires a
specialized product designed for a small number of customers.
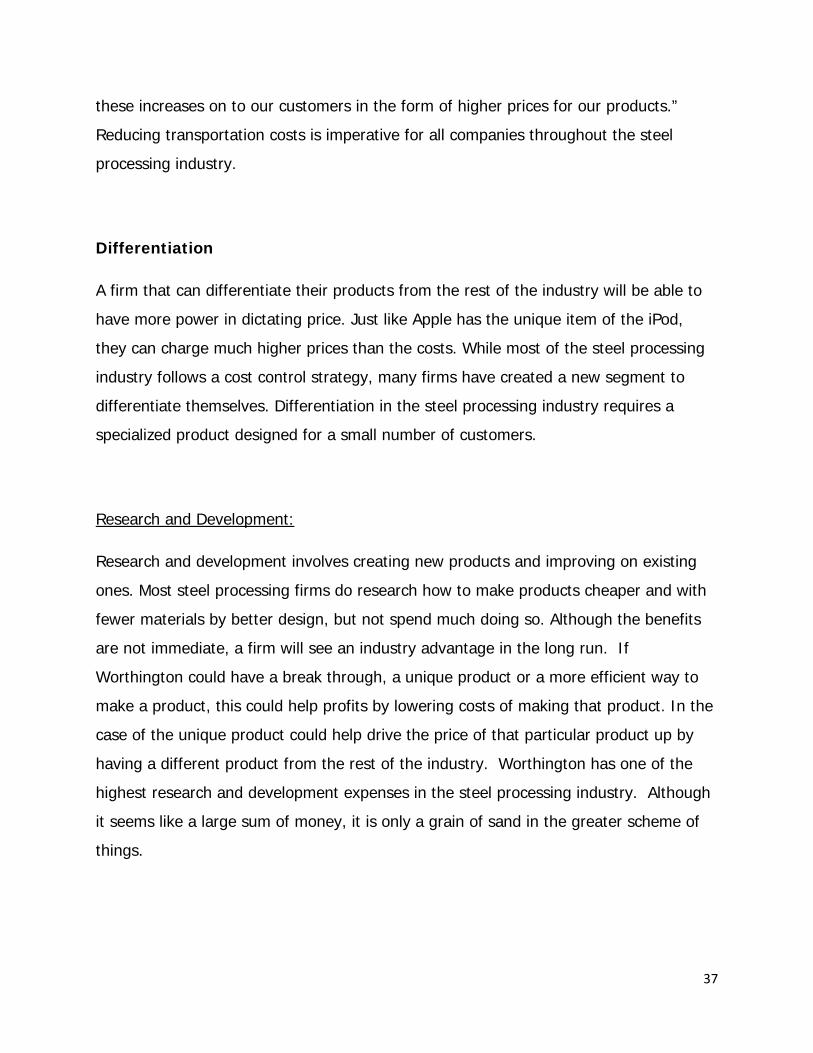
Research and Development:
Research and development involves creating new products and improving on existing
ones. Most steel processing firms do research how to make products cheaper and with
fewer materials by better design, but not spend much doing so. Although the benefits
are not immediate, a firm will see an industry advantage in the long run. If
Worthington could have a break through, a unique product or a more efficient way to
make a product, this could help profits by lowering costs of making that product. In the
case of the unique product could help drive the price of that particular product up by
having a different product from the rest of the industry. Worthington has one of the
highest research and development expenses in the steel processing industry. Although
it seems like a large sum of money, it is only a grain of sand in the greater scheme of
things.
38
2007 Research and Development Expenses
Incurred
Worthington Steel $3,734,000
Gibraltar Steel $0
AK Steel $8,000,000
Olympic Steel $0
As the graph above shows, R&D costs are very low in comparison to overall costs that
amount in the hundreds of millions. Also, notice that two of Worthington’s competitors
do not do any R&D. This could be because they do not have the funds or find it
irrelevant and unprofitable.
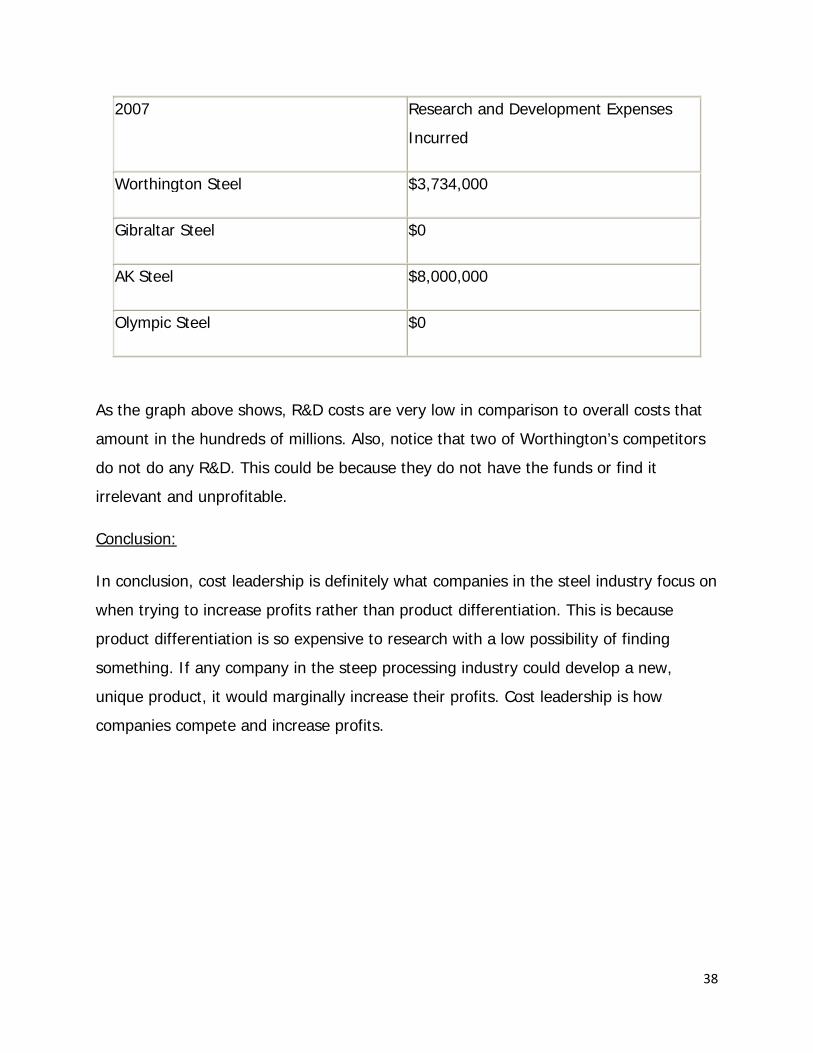
Conclusion:
In conclusion, cost leadership is definitely what companies in the steel industry focus on
when trying to increase profits rather than product differentiation. This is because
product differentiation is so expensive to research with a low possibility of finding
something. If any company in the steep processing industry could develop a new,
unique product, it would marginally increase their profits. Cost leadership is how
companies compete and increase profits.
39
Firm Competitive Advantage Analysis
Cost Leadership:
In any industry where many competitors producing near-identical products exist, cost
leadership is crucial to staying profitable. Anything firms can do to reduce costs is very
helpful. This comes in many different areas, but cost control is the most important.
With energy costs dropping so severally in the past few months, this helps firms in the
steel processing industry free some cash up to put in different areas, or lower prices of
their products.
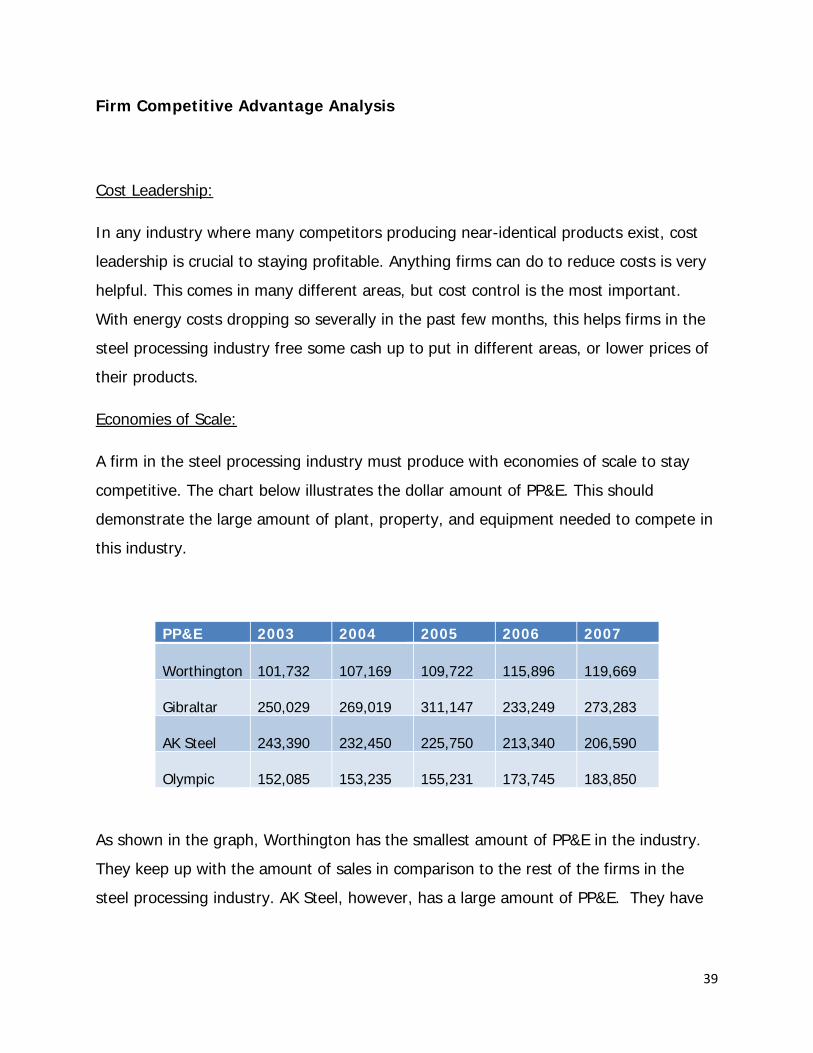
Economies of Scale:
A firm in the steel processing industry must produce with economies of scale to stay
competitive. The chart below illustrates the dollar amount of PP&E. This should
demonstrate the large amount of plant, property, and equipment needed to compete in
this industry.
PP&E 2003 2004 2005 2006 2007
Worthington 101,732
107,169
109,722
115,896
119,669
Gibraltar 250,029
269,019
311,147
233,249
273,283
AK Steel 243,390
232,450
225,750
213,340
206,590
Olympic 152,085
153,235
155,231
173,745
183,850
As shown in the graph, Worthington has the smallest amount of PP&E in the industry.
They keep up with the amount of sales in comparison to the rest of the firms in the
steel processing industry. AK Steel, however, has a large amount of PP&E. They have

40
had trouble in the past translating PP&E into profit. AK Steel’s large facilities can not
influence how well a company manages their expenses.
Cost Control:
Since the steel processing industry cannot dictate prices, the firms in the industry must
control their costs to make a profit. Looking to cut costs, Worthington shut down five
insignificant metal framing plants while increasing product price. This resulted in an
increased gross margin from 12.7% to 15.1%. “Across the company, we have been
focused on cutting costs, expanding our market reach through new products and
services and steering through a volatile and demanding steel pricing environment,” said
Chairman and Chief Executive John P. McConnell.(WSJ Online Jun 26, 2008). Steel used
by these firms is purchased in large quantities at regular intervals from both domestic
and foreign producers in the open market. Worthington uses multi-year contracts to
limit the impact of pricing fluctuations. By purchasing materials through multi-year
contracts Worthington is able to receive discounts which helps lower the costs of
materials. AK Steel also uses multi-year contracts as stated in their 2007 10-K. AK
Steel claims that, “To the extent that multi-year contracts are available in the
marketplace, the Company has secured adequate sources of supply to satisfy other key
raw materials needs for the next three to five years.”
Reduced Transportation Costs:
If fuel prices are high, firms would be wise to decrease transportation expense.
Worthington accommodates for this by negotiating multi-year contracts for both
incoming and outgoing products. Worthington also reduces transportation expenses by
shipping to other regional facilities when available. But if fuel prices are unexpectedly
low like currently, then transportation costs are not high, because Worthington has
expected them to be much higher than now. Gibraltar is also finding ways to reduce
freight costs. It is crucial to be able to reduce variable costs in a cost leadership
41
industry. In Gibraltar’s 2007 10-K, Gibraltar even believes that, “During periods of
higher freight and energy costs, we may not be able to recover our operating cost
increases through price increases without reducing demand for our products.”
Transportation is an industry-wide factor.
Differentiation
In an effort to maintain profitability, some steel processing firms have created a new
segment to differentiate themselves. Worthington has created a steel cylinder segment
that focuses on making specialty products based on exact customer specifications.
Worthington’s gross margin for its pressure cylinder segment was 24.5%, compared to
only 10.1% for steel processing. As a result of having a slightly different product than
normal does help Worthington drastically in profits. Gibraltar is developing patents in
order to gain a competitive advantage through a small type of differentiation. Gibraltar
is trying to put their name on the roof vent world. Gibraltar’s 2007 10-K states that,
“While not material, we do believe one of our patents related to a roof vent sold in our
Building Products segment, scheduled to expire in November 2009, gives us a
competitive advantage with regard to that product.”
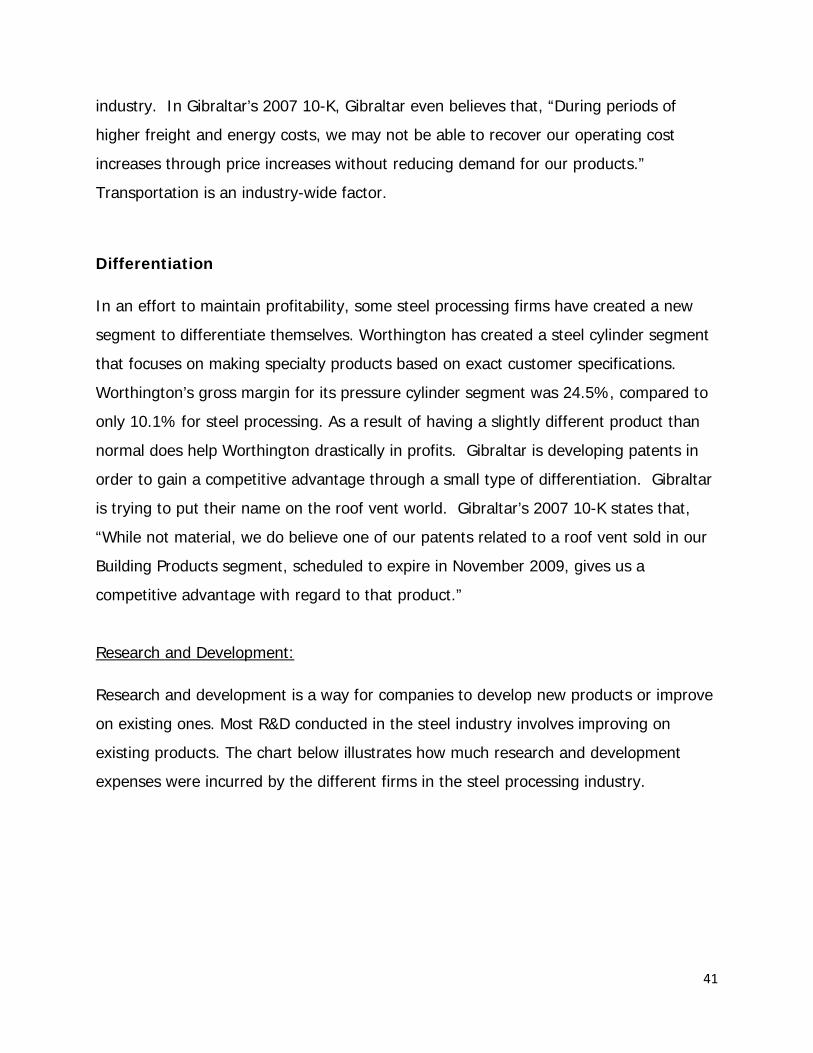
Research and Development:
Research and development is a way for companies to develop new products or improve
on existing ones. Most R&D conducted in the steel industry involves improving on
existing products. The chart below illustrates how much research and development
expenses were incurred by the different firms in the steel processing industry.
42
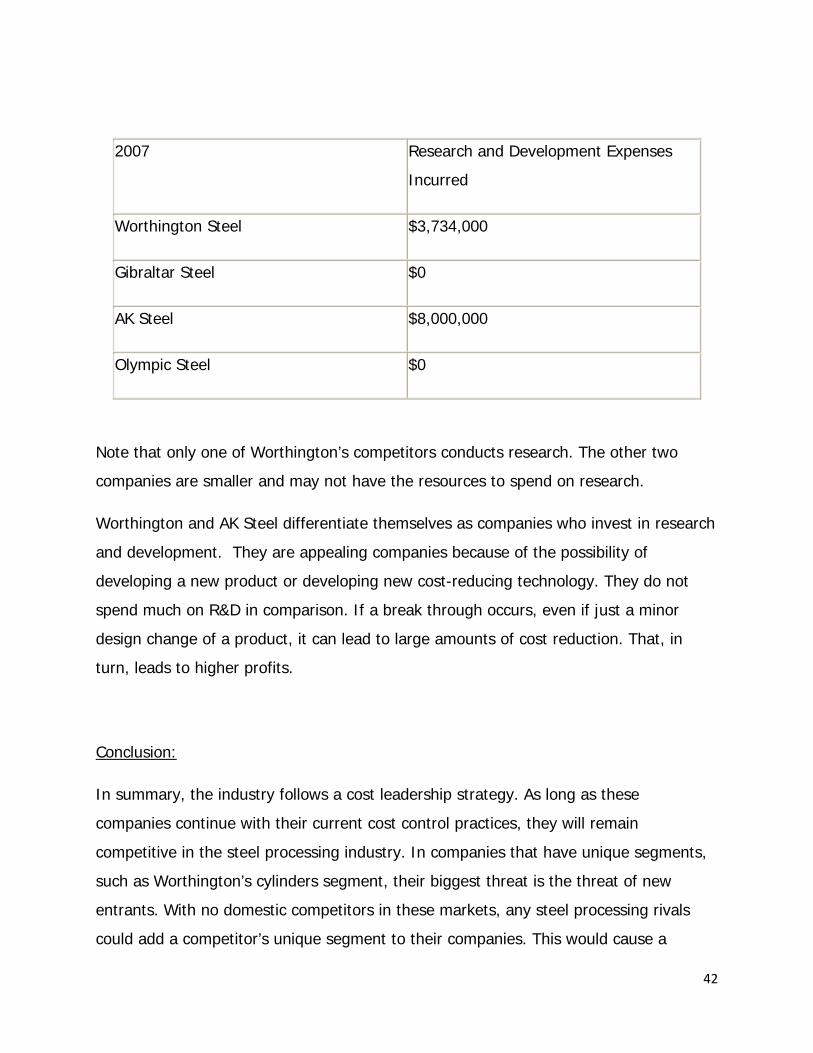
2007 Research and Development Expenses
Incurred
Worthington Steel $3,734,000
Gibraltar Steel $0
AK Steel $8,000,000
Olympic Steel $0
Note that only one of Worthington’s competitors conducts research. The other two
companies are smaller and may not have the resources to spend on research.
Worthington and AK Steel differentiate themselves as companies who invest in research
and development. They are appealing companies because of the possibility of
developing a new product or developing new cost-reducing technology. They do not
spend much on R&D in comparison. If a break through occurs, even if just a minor
design change of a product, it can lead to large amounts of cost reduction. That, in
turn, leads to higher profits.
Conclusion:
In summary, the industry follows a cost leadership strategy. As long as these
companies continue with their current cost control practices, they will remain
competitive in the steel processing industry. In companies that have unique segments,
such as Worthington’s cylinders segment, their biggest threat is the threat of new
entrants. With no domestic competitors in these markets, any steel processing rivals
could add a competitor’s unique segment to their companies. This would cause a
43
reduction in profits of these segments because customers could gain bargaining power
over the steel processing firms.
Key Accounting Policies
A company utilizes its key success factors to maintain profitability. They choose
certain accounting policies to emphasize these factors on paper. Even with GAAP
(Generally Accepted Accounting Principles), firms still have flexibility to distort figures
for their benefit. Since Worthington’s key success factor is cost leadership, we can
discern the accounting policies they use to emphasize this.
Operating Leases:
Operating leases allow the owner to give the right to operate the property to a
firm. This eliminates the risk involved with owning the property for the firm. Operating
leases are not listed on the balance sheet and allows firms to understate liabilities and
overstate retained earnings. In theory, the lease payments should be as much of a
liability as expenses on a capital lease.
Worthington acquires operating leases for certain property and equipment.
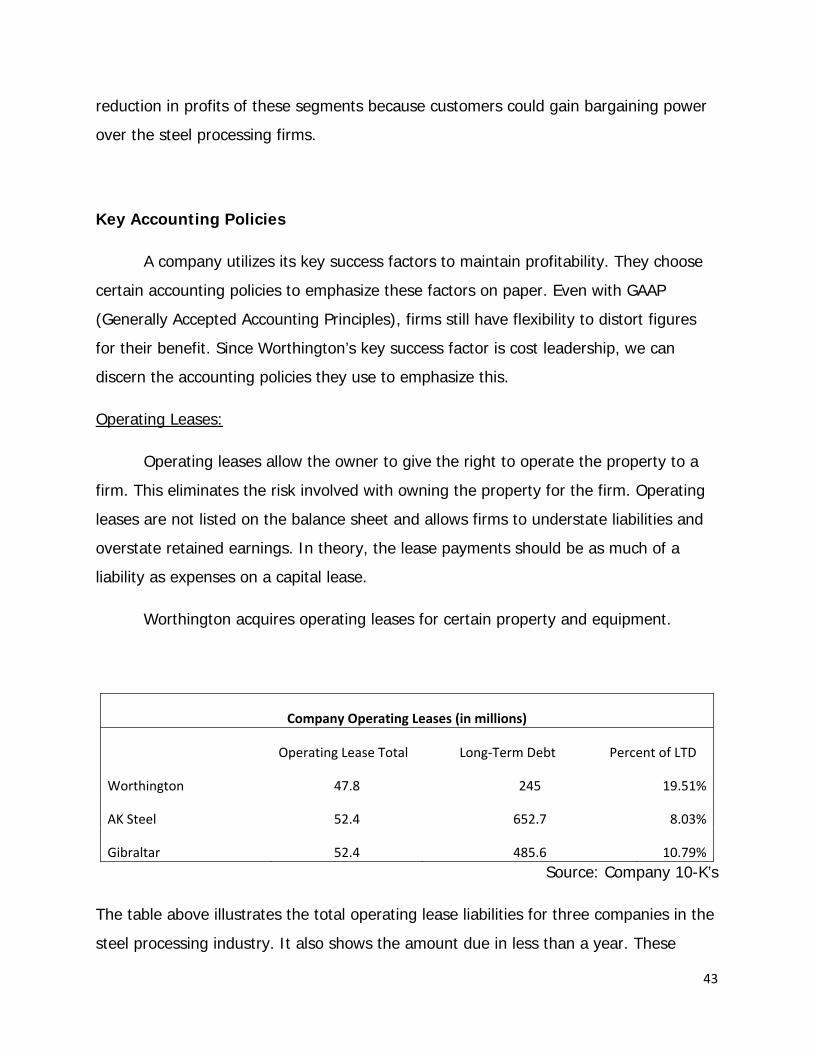
Company Operating Leases (in millions)
Operating Lease Total Long‐Term Debt Percent of LTD
Worthington 47.8 245 19.51%
AK Steel 52.4 652.7 8.03%
Gibraltar 52.4 485.6 10.79%Source: Company 10-K’s
The table above illustrates the total operating lease liabilities for three companies in the
steel processing industry. It also shows the amount due in less than a year. These
44
numbers would understate liabilities on the balance sheet for all three companies, while
overstating retained earnings. Steel processing firms are cost leaders and would view
this accounting policy as beneficial.
Pension Plans:
Pension plans were created to attract and keep good employees to a firm.
Worthington offers defined benefit and defined contribution plans to its employees. A
defined benefit plan requires no contribution by the employee and is based solely on
length of employment. A defined contribution plan requires the employee to contribute
a portion of their paycheck which the company will match up to a maximum point.
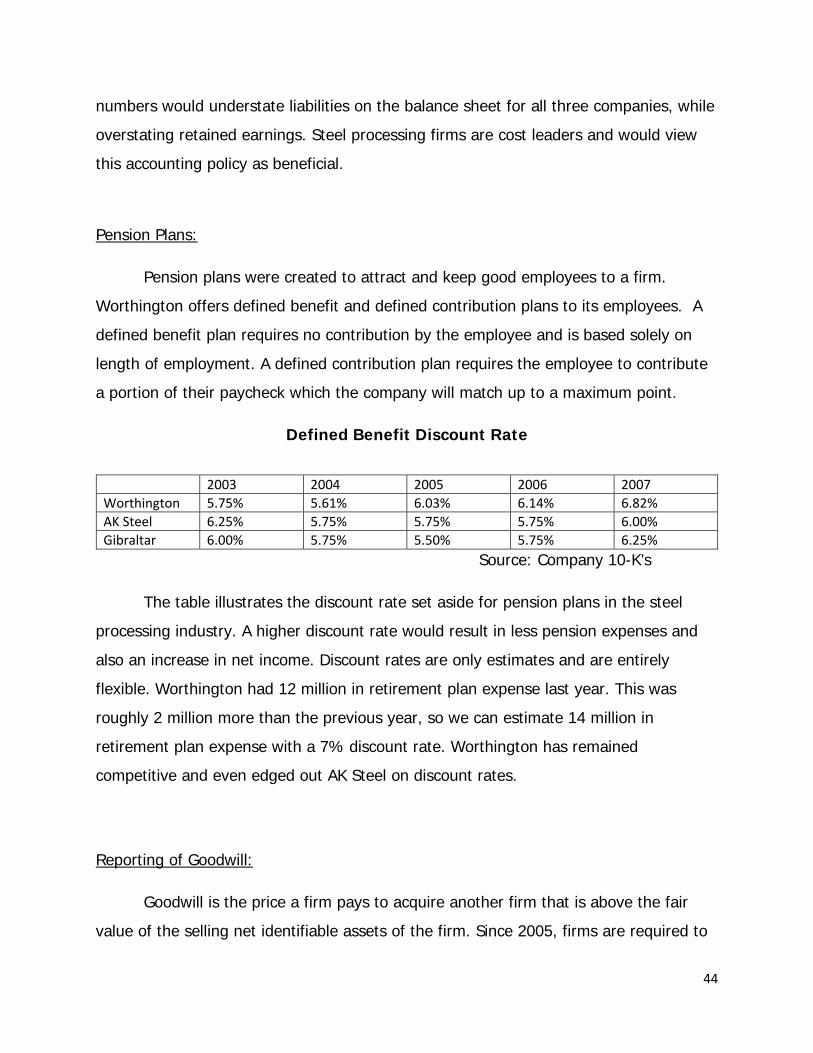
Defined Benefit Discount Rate
Source: Company 10-K’s
The table illustrates the discount rate set aside for pension plans in the steel
processing industry. A higher discount rate would result in less pension expenses and
also an increase in net income. Discount rates are only estimates and are entirely
flexible. Worthington had 12 million in retirement plan expense last year. This was
roughly 2 million more than the previous year, so we can estimate 14 million in
retirement plan expense with a 7% discount rate. Worthington has remained
competitive and even edged out AK Steel on discount rates.
Reporting of Goodwill:
Goodwill is the price a firm pays to acquire another firm that is above the fair
value of the selling net identifiable assets of the firm. Since 2005, firms are required to
2003 2004 2005 2006 2007 Worthington 5.75% 5.61% 6.03% 6.14% 6.82% AK Steel 6.25% 5.75% 5.75% 5.75% 6.00% Gibraltar 6.00% 5.75% 5.50% 5.75% 6.25%

45
perform a goodwill impairment check annually (FASB 142). This voids any flexibility
companies used to have regarding goodwill write-offs. Worthington had 182 million in
goodwill in 2008. The impairment test was used and no amount could be deducted.
However, in future years the value of Worthington’s goodwill may decrease and write-
offs will decrease retained earnings. This key accounting policy is used to prevent
rapidly inflating retained earnings in highly profitable years.
Source: Company 10-K’s
Goodwill as a Percentage of PP&E and Other Assets (in millions)
Goodwill Other Assets & PPE Percentage Worthington 182 733 24.83 AK Steel 37 2770.6 1.35 Gibraltar 453 287.9 157.35 Olympic 6 96.1 6.24
As the chart demonstrates, Worthington is near the 24% mark and AK Steel and
Olympic are fairly close to the same percentage. We can assume that Gibraltar has
recently expanded and acquired a large amount of goodwill. A high percentage of
goodwill is not necessarily detrimental, although investors must take into account its
effect on owner’s equity.
We amortized goodwill over a five year period and included the amount of
additional goodwill gained each year. According to FASB statement 142, companies are
not allowed to amortize goodwill on the balance sheet. However, companies amortize
goodwill on internal statements in order to get a more accurate net income number.
The increase in Worthington’s goodwill was due primarily to changes in foreign
exchange rates.

46
Foreign Currency Risk:
There is an additional risk when buying or selling in other countries. The foreign
currency values change every moment, resulting in an ever-changing cost of goods
sold. Under GAAP, little flexibility is allowed to manipulate foreign exchange rates.
However, Worthington imposes forward contracts to minimize exposure of both
favorable and unfavorable exchange rates. Because of these contracts, Worthington
believes a 10% change in the dollar value would not materially affect profitability. Also,
because of the assumption that rates change uniformly, this may overstate the impact
of foreign exchange rates on assets and liabilities. Foreign sales account for 9% of total
sales (see 10-K).
Evaluating Accounting Strategy
A firm’s accounting strategy can generally be broken down into two parts. The
first thing one must assess is the level of disclosure in the company’s financial reports.
The second step in evaluating the accounting strategy is to determine if the company is
conservative or aggressive in its accounting policies.
Level of Disclosure:
Worthington exhibits a medium to high level of disclosure. We determine the
amount of disclosure by looking at the company’s 10-K report and comparing the report
with our competitor’s 10-K reports. Worthington operates in three segments and
provides specific data regarding those segments. This makes it easier for an investor to
discern what segment of the company is contributing to the overall data. Most firms in
the steel processing industry operate in more than one segment. These firms also
report on these segments individually, leading us to believe that segment reporting
differentiation is recommended in this industry. Also, the SEC requires all companies to

47
disclose certain financial statements, as well as various other documents so that the
public can be as informed as possible.
A look into Worthington’s 10-K will also show that they segment their customers
into three categories: automotive, construction, and other. Another comparison to other
firms in the steel processing industry will show that a large number of firms also divide
their customers into a percentage of sales. In the 10-K Worthington discloses a large
amount of information regarding the sales breakdown of many aspects of the industries
they are involved in compared to the lack of information disclosed about research and
development
An item that prevents us from giving a high rating of disclosure is Worthington’s
disclosure of R&D. A search of Worthington’s 10-K will reveal a single line regarding
R&D. While they follow GAAP standards by reporting the amount expensed, the single
statement is towards the end of the 10-K and not itemized on the balance sheet. A
comparison to AK Steel will show the same approach in R&D reporting. This may echo
the low emphasis these cost-leadership firms put on R&D.
Aggressiveness of Accounting Policies:
The second step of evaluating an accounting strategy is to determine the level of
aggressiveness of their accounting policies. As Worthington is a cost leadership
company, it is no surprise that they are highly aggressive in their reporting methods.
Pension Plans:
Pension plans can represent a large expense to a company. Worthington
estimates future pension plan liability using a discount rate. A higher discount rate
would result in lower pension plan expense and a higher net income. Worthington is

48
continuously increasing discount rate for their pension plans. Worthington is also more
aggressive than its competitors in estimating pension plan expense.
Operating Leases:
Operating leases allow a firm to reduce the amount of liabilities on the books.
This is especially favorable for cost leadership companies to reduce costs shown on the
books. Although in theory the liability of a capital versus an operating lease is equal,
choosing to use an operating lease is inherently aggressive. We have compared the
present value of the firm’s operating lease payments to the total long term debt and
have determined that if the company had used capital leases it would not have a
material effect on retained earnings.
2009 2010 2011 2012 2013 2013+ TotalLease Payments $10,753 $9,804 $8,016 $6,349 $6,022 $6,903 $47,847Discount Rate 6.82% 1.0682 1.1411 1.2189 1.3020 1.3908 1.4856Present Value $10,066 $8,592 $6,577 $4,876 $4,330 $4,646 $39,088Total Long Term Debt $294,785 Operating Lease Percentage 13.26%
Goodwill:
Goodwill is the additional amount paid over book value to acquire another firm.
It makes up a significant amount of assets for Worthington. Goodwill is subject to an
early impairment test that compares fair value to book value. If book value is deemed
to be greater than fair value, impairment is used. This process requires a high degree of
estimation and allows Worthington to aggressively overvalue assets. There is cause for
concern since Worthington has not impaired goodwill over the last five years. Since we
49
are not impairing goodwill Worthington is overstating assets and net income. Also, by
overstating net income they are overstating retained earnings and shareholders’ equity.
Evaluating Quality of Disclosure
Qualitative Analysis:
A company’s 10-K is only as good as the quality of information it contains. A
financial report masked in obscurity but meets minimum GAAP requirements should be
looked at with a keen eye.
Pension Plans:
Worthington does a good job on disclosing pension plan data. A look at their
10-K will show a chart of pension plan expenses as well as a summary of how they
calculated their data. They disclose the discount rates used to determine the net
periodic pension cost. They even go so far as to disclose the amount invested in debt
and equity securities and forecast future pension payments.
The steel processing industry generally discloses the same amount of pension
plan data. Gibraltar goes as far as disclosing other retirement plan data while Olympic
Steel does a very poor job.
Goodwill:
Worthington does an excellent job of disclosing goodwill data. They explain how
they arrived at their numbers and identified the impairment test they used as the
present value technique. After the test for impairment was performed they decided
that the goodwill amount did not need to be impaired. They also give readers the extra
benefit of dividing their goodwill into the three segments they operate in.

50
Worthington’s competitors do not meet the quality standards on this subject.
While most made an adequate attempt, Olympic Steel simply states the amount of
goodwill on their balance sheet.
Operating Leases:
Worthington uses non-cancellable operating leases on a portion of their property
and equipment. They do a good job in the amount of disclosure regarding these leases.
Whereas the purpose of operating leases is to keep a large amount of liabilities off the
books, Worthington at least gives us ample information in their 10-K to recalculate their
balance sheet if capital leases had been used. They disclose the amount of these leases
as well as forecast payments up to 2013. After 2013, a standardized number is used to
forecast further.
Worthington excels in disclosure compared to the rest of the steel processing
industry. Other firms generally disclose only rent expenses incurred and occasionally
forecasted expenses. If they do disclose rent expenses it is not as a line item in the
balance sheet, but rather noted in a summary.
Currency Risk:
Worthington does a fairly good job at disclosing accounting policies related to
foreign currency risk. They state that although foreign currency translation poses some
risk to the company, the monetary difference is immaterial to affect their financial
position. They disaggregate comprehensive income and mention foreign currency
translation as a line item in the statement of owner’s equity. They also explicitly state
that they do not engage in currency speculation and ‘enter into derivatives only to
hedge specific interests.’
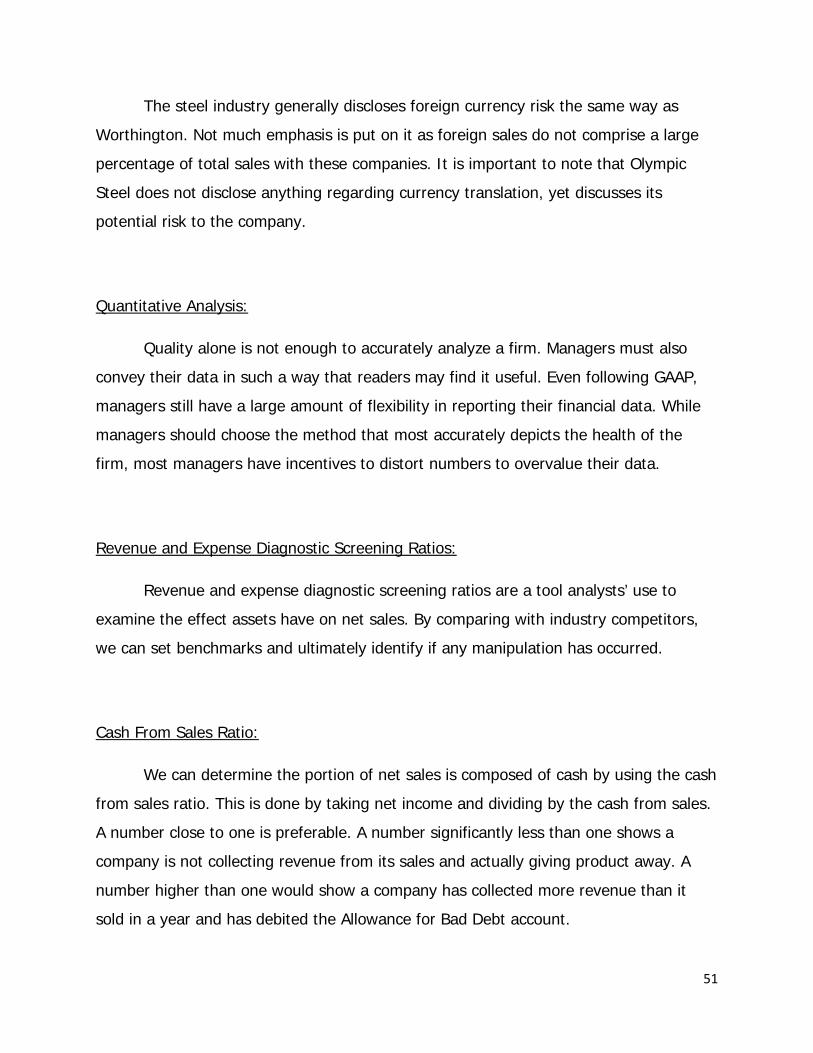
51
The steel industry generally discloses foreign currency risk the same way as
Worthington. Not much emphasis is put on it as foreign sales do not comprise a large
percentage of total sales with these companies. It is important to note that Olympic
Steel does not disclose anything regarding currency translation, yet discusses its
potential risk to the company.
Quantitative Analysis:
Quality alone is not enough to accurately analyze a firm. Managers must also
convey their data in such a way that readers may find it useful. Even following GAAP,
managers still have a large amount of flexibility in reporting their financial data. While
managers should choose the method that most accurately depicts the health of the
firm, most managers have incentives to distort numbers to overvalue their data.
Revenue and Expense Diagnostic Screening Ratios:
Revenue and expense diagnostic screening ratios are a tool analysts’ use to
examine the effect assets have on net sales. By comparing with industry competitors,
we can set benchmarks and ultimately identify if any manipulation has occurred.
Cash From Sales Ratio:
We can determine the portion of net sales is composed of cash by using the cash
from sales ratio. This is done by taking net income and dividing by the cash from sales.
A number close to one is preferable. A number significantly less than one shows a
company is not collecting revenue from its sales and actually giving product away. A
number higher than one would show a company has collected more revenue than it
sold in a year and has debited the Allowance for Bad Debt account.
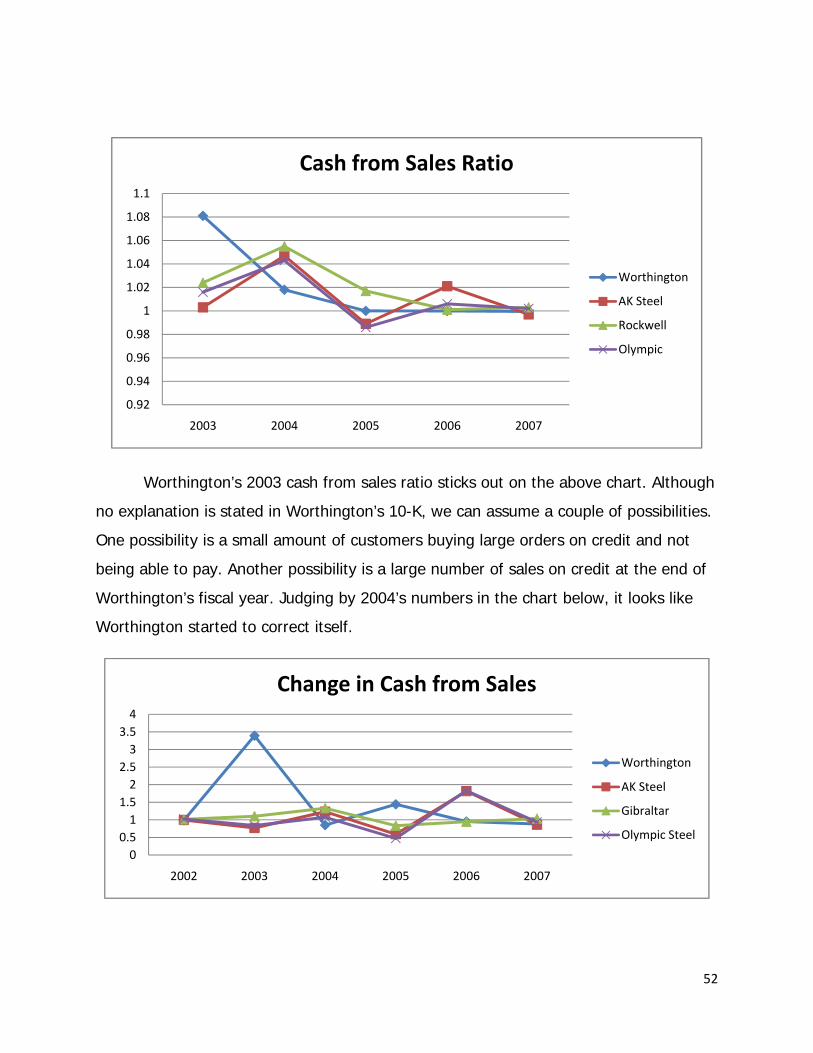
52
Worthington’s 2003 cash from sales ratio sticks out on the above chart. Although
no explanation is stated in Worthington’s 10-K, we can assume a couple of possibilities.
One possibility is a small amount of customers buying large orders on credit and not
being able to pay. Another possibility is a large number of sales on credit at the end of
Worthington’s fiscal year. Judging by 2004’s numbers in the chart below, it looks like
Worthington started to correct itself.
0.92
0.94
0.96
0.98
1
1.02
1.04
1.06
1.08
1.1
2003 2004 2005 2006 2007
Cash from Sales Ratio
Worthington
AK Steel
Rockwell
Olympic
00.51
1.52
2.53
3.54
2002 2003 2004 2005 2006 2007
Change in Cash from Sales
Worthington
AK Steel
Gibraltar
Olympic Steel

53
Account Receivable Ratio:
To determine how much of net sales are sold on credit (A/R), we use the
account receivable ratio. This is done by taking net sales and dividing it by accounts
receivable. The key thing to look for on this ratio is extremes of the numbers. If a
company’s ratio is very low it implies that a vast amount of their sales are done on
credit. If they are not collected in a timely manner, this could leave the company short
on cash. On the other hand, if the ratio is very high it implies that the company runs
primarily on cash. Firms desire a high accounts receivable ratio. It signifies to investors
that the company has a high liquidity rate and can convert assets quickly into cash if
need be.
In the graph above, Worthington was doing a great job converting over cash
quickly in 2002, but dropped down with the rest of the industry in 2003. This tells us
that during that year, Worthington had a larger amount of sales on credit. Olympic
Steel does the best job by keeping their ratio higher than their competitors.
0
2
4
6
8
10
12
14
2002 2003 2004 2005 2006 2007
Account Receivable Ratio
Worthington
AK Steel
Rockwell
Olympic Steel
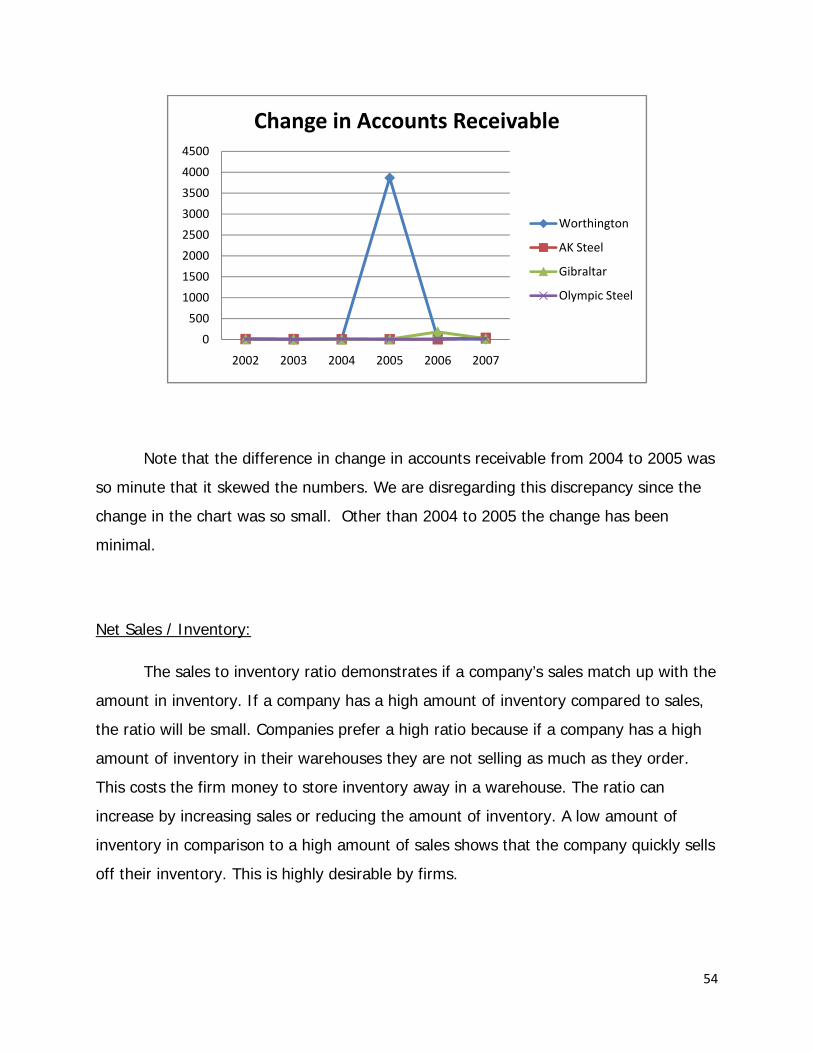
54
Note that the difference in change in accounts receivable from 2004 to 2005 was
so minute that it skewed the numbers. We are disregarding this discrepancy since the
change in the chart was so small. Other than 2004 to 2005 the change has been
minimal.
Net Sales / Inventory:
The sales to inventory ratio demonstrates if a company’s sales match up with the
amount in inventory. If a company has a high amount of inventory compared to sales,
the ratio will be small. Companies prefer a high ratio because if a company has a high
amount of inventory in their warehouses they are not selling as much as they order.
This costs the firm money to store inventory away in a warehouse. The ratio can
increase by increasing sales or reducing the amount of inventory. A low amount of
inventory in comparison to a high amount of sales shows that the company quickly sells
off their inventory. This is highly desirable by firms.
0
500
1000
1500
2000
2500
3000
3500
4000
4500
2002 2003 2004 2005 2006 2007
Change in Accounts Receivable
Worthington
AK Steel
Gibraltar
Olympic Steel
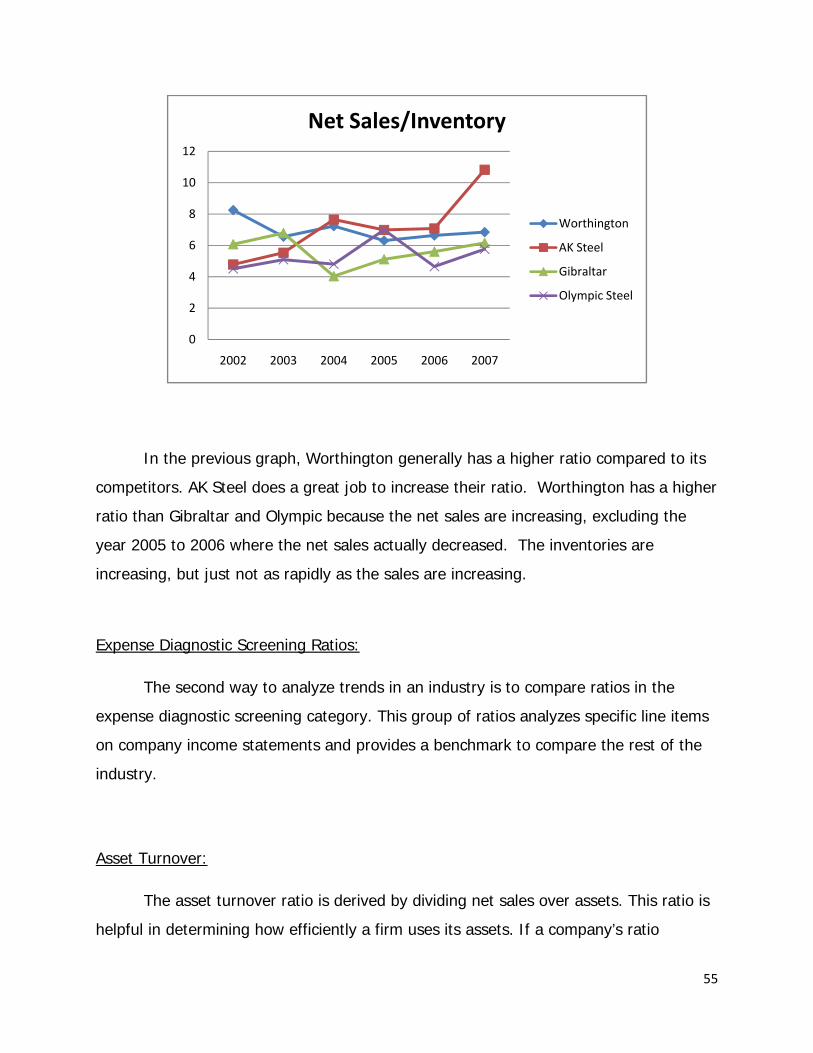
55
In the previous graph, Worthington generally has a higher ratio compared to its
competitors. AK Steel does a great job to increase their ratio. Worthington has a higher
ratio than Gibraltar and Olympic because the net sales are increasing, excluding the
year 2005 to 2006 where the net sales actually decreased. The inventories are
increasing, but just not as rapidly as the sales are increasing.
Expense Diagnostic Screening Ratios:
The second way to analyze trends in an industry is to compare ratios in the
expense diagnostic screening category. This group of ratios analyzes specific line items
on company income statements and provides a benchmark to compare the rest of the
industry.
Asset Turnover:
The asset turnover ratio is derived by dividing net sales over assets. This ratio is
helpful in determining how efficiently a firm uses its assets. If a company’s ratio
0
2
4
6
8
10
12
2002 2003 2004 2005 2006 2007
Net Sales/Inventory
Worthington
AK Steel
Gibraltar
Olympic Steel
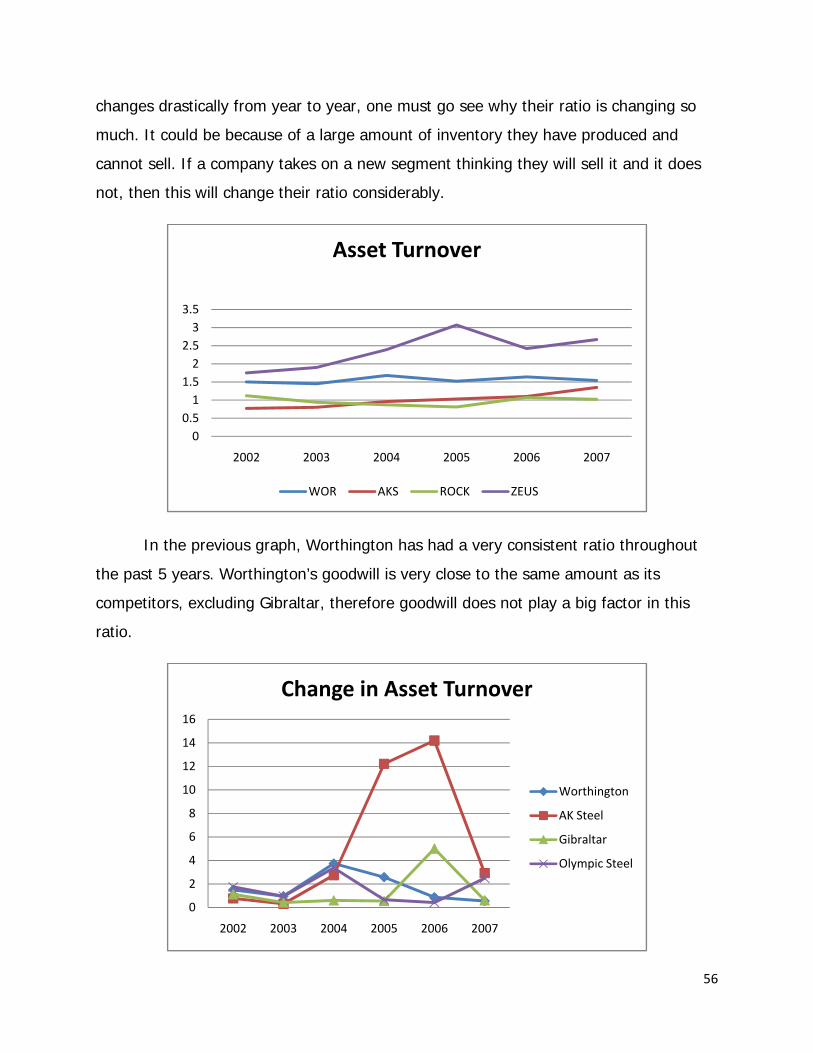
56
changes drastically from year to year, one must go see why their ratio is changing so
much. It could be because of a large amount of inventory they have produced and
cannot sell. If a company takes on a new segment thinking they will sell it and it does
not, then this will change their ratio considerably.
In the previous graph, Worthington has had a very consistent ratio throughout
the past 5 years. Worthington’s goodwill is very close to the same amount as its
competitors, excluding Gibraltar, therefore goodwill does not play a big factor in this
ratio.
00.51
1.52
2.53
3.5
2002 2003 2004 2005 2006 2007
Asset Turnover
WOR AKS ROCK ZEUS
0
2
4
6
8
10
12
14
16
2002 2003 2004 2005 2006 2007
Change in Asset Turnover
Worthington
AK Steel
Gibraltar
Olympic Steel
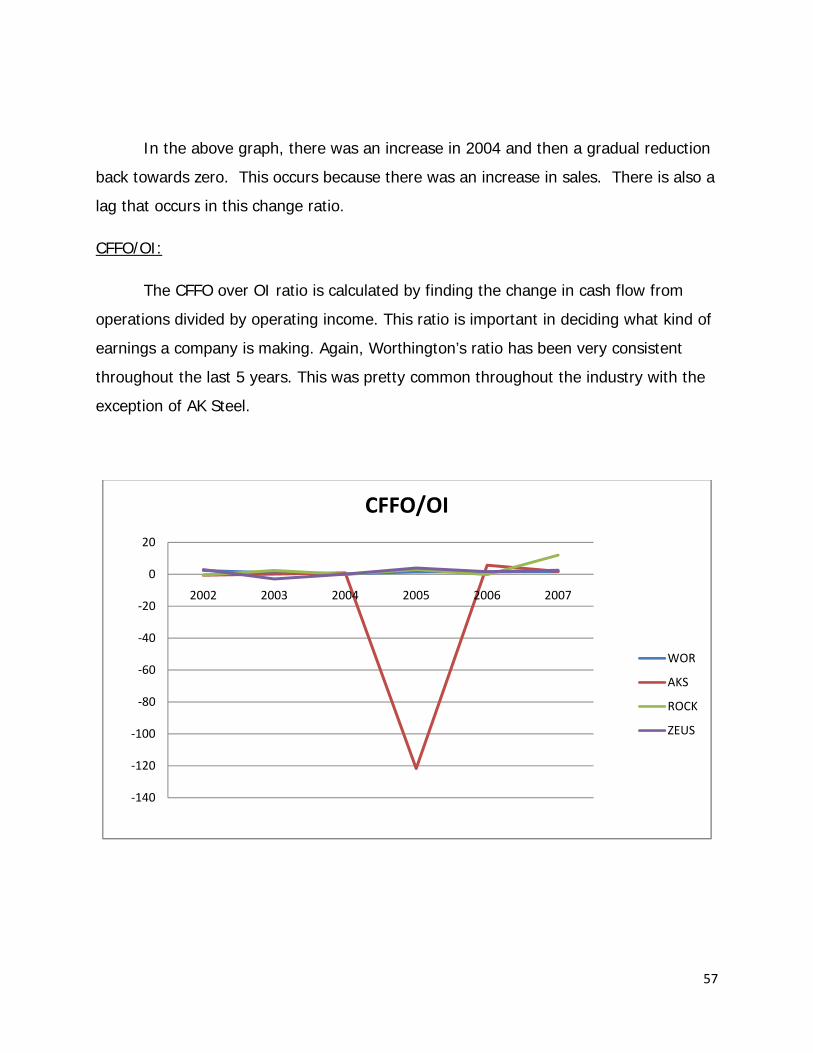
57
In the above graph, there was an increase in 2004 and then a gradual reduction
back towards zero. This occurs because there was an increase in sales. There is also a
lag that occurs in this change ratio.
CFFO/OI:
The CFFO over OI ratio is calculated by finding the change in cash flow from
operations divided by operating income. This ratio is important in deciding what kind of
earnings a company is making. Again, Worthington’s ratio has been very consistent
throughout the last 5 years. This was pretty common throughout the industry with the
exception of AK Steel.
‐140
‐120
‐100
‐80
‐60
‐40
‐20
0
20
2002 2003 2004 2005 2006 2007
CFFO/OI
WOR
AKS
ROCK
ZEUS
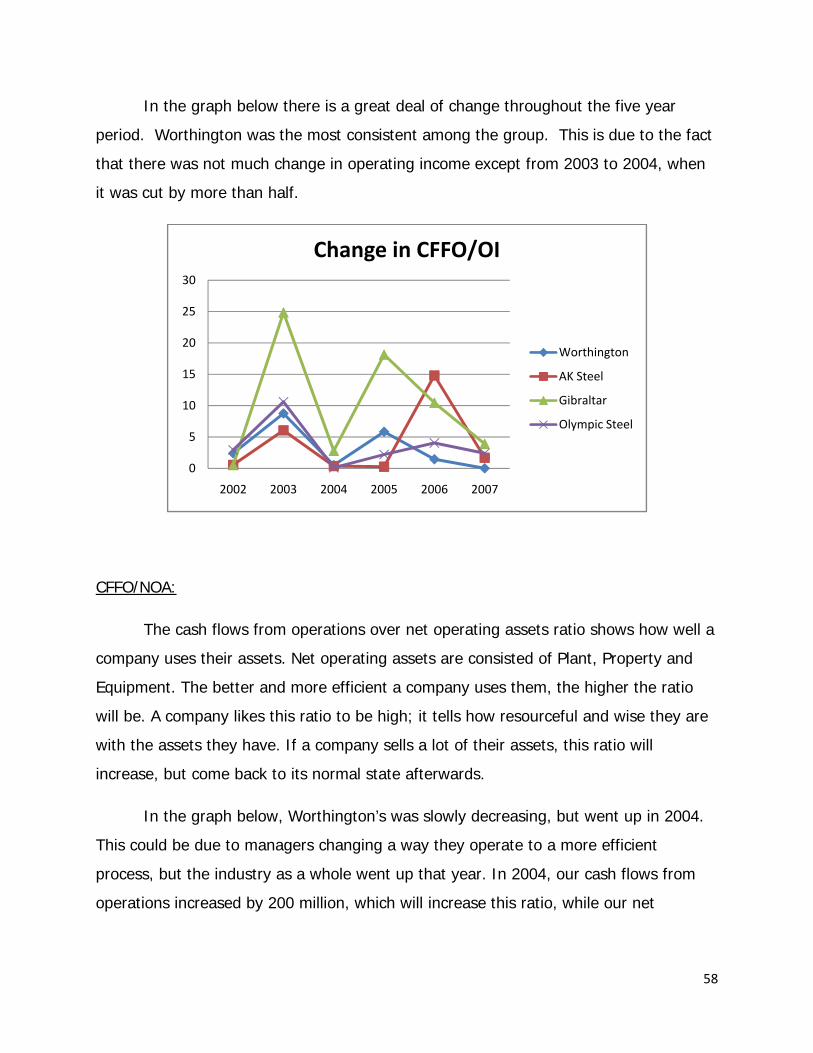
58
In the graph below there is a great deal of change throughout the five year
period. Worthington was the most consistent among the group. This is due to the fact
that there was not much change in operating income except from 2003 to 2004, when
it was cut by more than half.
CFFO/NOA:
The cash flows from operations over net operating assets ratio shows how well a
company uses their assets. Net operating assets are consisted of Plant, Property and
Equipment. The better and more efficient a company uses them, the higher the ratio
will be. A company likes this ratio to be high; it tells how resourceful and wise they are
with the assets they have. If a company sells a lot of their assets, this ratio will
increase, but come back to its normal state afterwards.
In the graph below, Worthington’s was slowly decreasing, but went up in 2004.
This could be due to managers changing a way they operate to a more efficient
process, but the industry as a whole went up that year. In 2004, our cash flows from
operations increased by 200 million, which will increase this ratio, while our net
0
5
10
15
20
25
30
2002 2003 2004 2005 2006 2007
Change in CFFO/OI
Worthington
AK Steel
Gibraltar
Olympic Steel

59
operating assets decreased only 8 million. So, the change in cash flows is the reason
why the CFFO/NOA ratio increased significantly over 2004.
In the graph below Worthington shows a great deal of change. This is because
cash flows in 2004 and 2005 went down drastically, while net operating activities were
pretty consistent. The company was able to bring this change down to the industry
over the next couple of years. The reason for this was that their net operating activities
was cut in half from 2005 to 2006.
‐0.4
‐0.2
0
0.2
0.4
0.6
0.8
1
1.2
2002 2003 2004 2005 2006 2007
CFF0/NOA
WOR
AKS
ROCK
ZEUS
0
10
20
30
40
2002 2003 2004 2005 2006 2007
Change in NOA
Worthington
AK Steel
Gibraltar
Olympic Steel
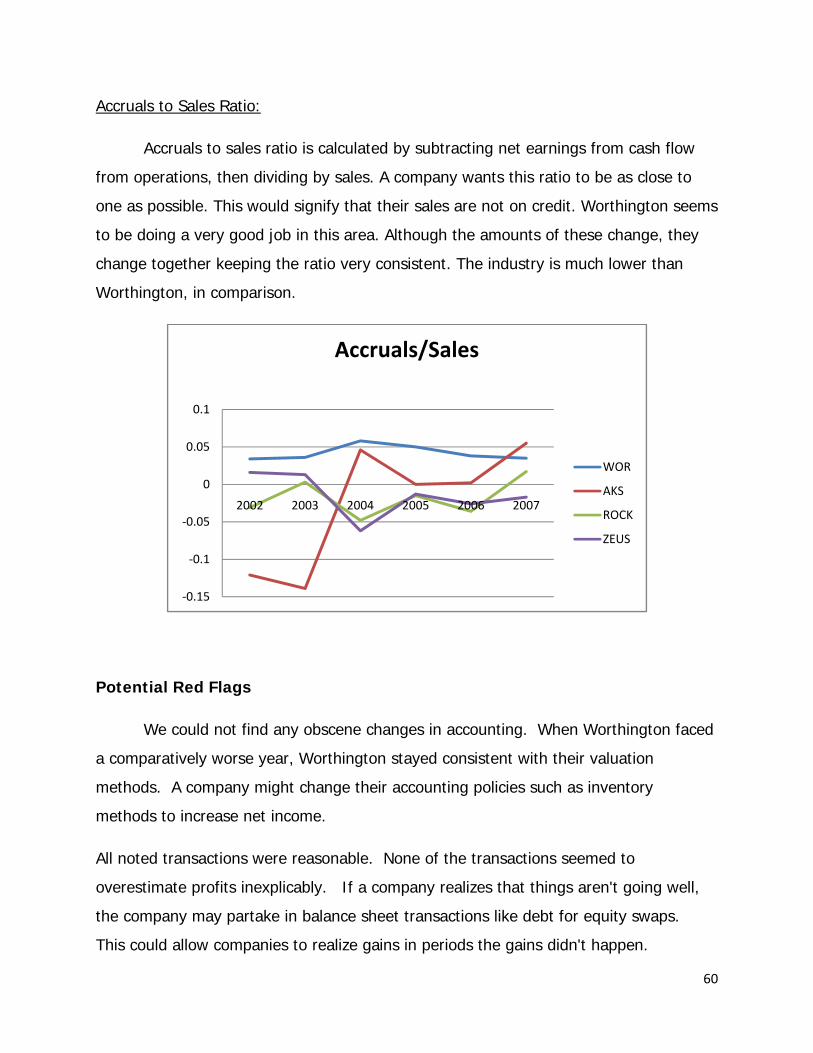
60
Accruals to Sales Ratio:
Accruals to sales ratio is calculated by subtracting net earnings from cash flow
from operations, then dividing by sales. A company wants this ratio to be as close to
one as possible. This would signify that their sales are not on credit. Worthington seems
to be doing a very good job in this area. Although the amounts of these change, they
change together keeping the ratio very consistent. The industry is much lower than
Worthington, in comparison.
Potential Red Flags
We could not find any obscene changes in accounting. When Worthington faced
a comparatively worse year, Worthington stayed consistent with their valuation
methods. A company might change their accounting policies such as inventory
methods to increase net income.
All noted transactions were reasonable. None of the transactions seemed to
overestimate profits inexplicably. If a company realizes that things aren't going well,
the company may partake in balance sheet transactions like debt for equity swaps.
This could allow companies to realize gains in periods the gains didn't happen.
‐0.15
‐0.1
‐0.05
0
0.05
0.1
2002 2003 2004 2005 2006 2007
Accruals/Sales
WOR
AKS
ROCK
ZEUS
61
Worthington's ratio of inventories to sales essentially stayed the same throughout the
last ten years. Although there were some slight changes, the ratio would correct and
stay within the trend of keeping the ratio close to the same. If the level of inventory is
not consistent with the amount of sales, it could suggest that the company has not
been selling as much of their product as they intended. The company could then be
forced to cut prices to move the product out the door. The company may also try to
write down inventory to remedy the problem.
While there may have been a gap between Worthington's reported income and their
cash flow from operating activities, the gap has not been growing. Everything has been
staying fairly consistent for some years. If a company has in increasing gap between
reported income and their cash flow from operating activities, there is a good possibility
that something is strange. The main source of any company's income comes from
operating activities. If the gap is increasing, it could be a sign that the income is
overstated. The income may have been boosted from a write off somewhere in
financing or investing activities. This is not a good measure of how a company is
performing.
There were no large fourth quarter adjustments. The changes in the fourth quarter
were consistent with each of the following quarters. The changes in income throughout
the year are in concordance with the cyclical buying patterns of the steel manufacturing
industries. At the end of the quarter, management might want to boost the numbers.
If the projected annual earnings are higher than the actual earnings, it would be
tempting for management to increase income through some sort of manipulation like
changes in estimates or valuation methods.
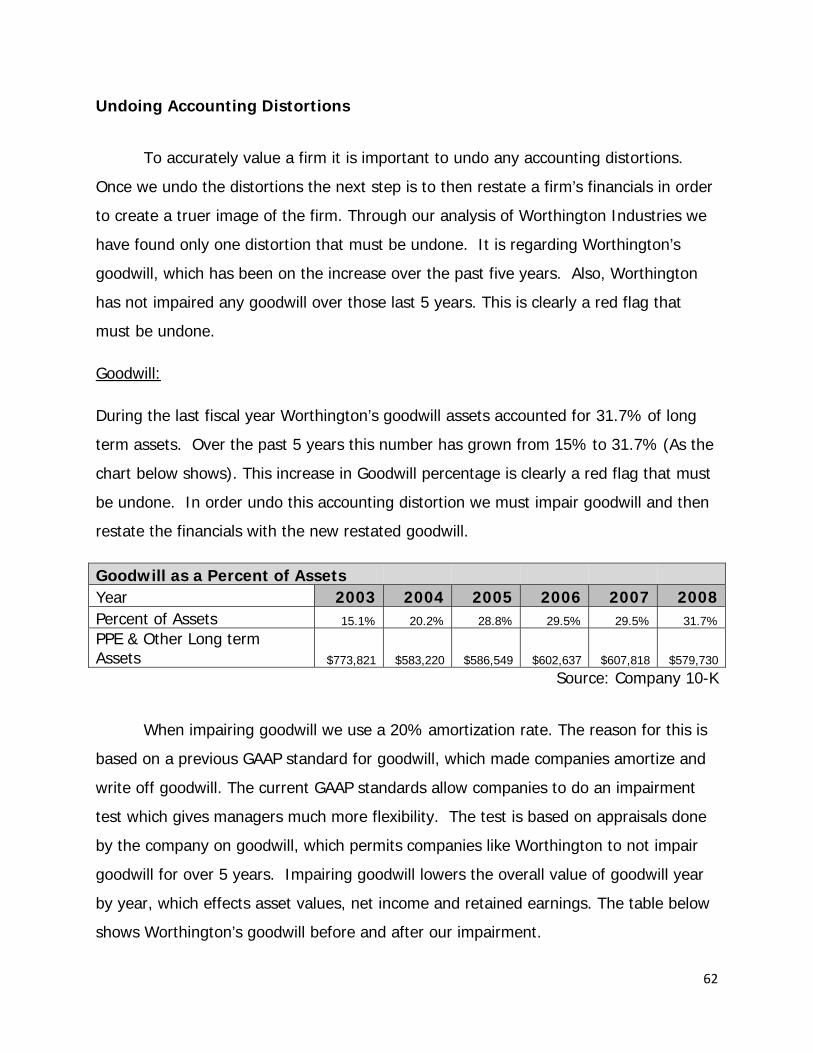
62
Undoing Accounting Distortions
To accurately value a firm it is important to undo any accounting distortions.
Once we undo the distortions the next step is to then restate a firm’s financials in order
to create a truer image of the firm. Through our analysis of Worthington Industries we
have found only one distortion that must be undone. It is regarding Worthington’s
goodwill, which has been on the increase over the past five years. Also, Worthington
has not impaired any goodwill over those last 5 years. This is clearly a red flag that
must be undone.
Goodwill:
During the last fiscal year Worthington’s goodwill assets accounted for 31.7% of long
term assets. Over the past 5 years this number has grown from 15% to 31.7% (As the
chart below shows). This increase in Goodwill percentage is clearly a red flag that must
be undone. In order undo this accounting distortion we must impair goodwill and then
restate the financials with the new restated goodwill.
Goodwill as a Percent of Assets Year 2003 2004 2005 2006 2007 2008Percent of Assets 15.1% 20.2% 28.8% 29.5% 29.5% 31.7%
PPE & Other Long term Assets $773,821 $583,220 $586,549 $602,637 $607,818 $579,730
Source: Company 10-K
When impairing goodwill we use a 20% amortization rate. The reason for this is
based on a previous GAAP standard for goodwill, which made companies amortize and
write off goodwill. The current GAAP standards allow companies to do an impairment
test which gives managers much more flexibility. The test is based on appraisals done
by the company on goodwill, which permits companies like Worthington to not impair
goodwill for over 5 years. Impairing goodwill lowers the overall value of goodwill year
by year, which effects asset values, net income and retained earnings. The table below
shows Worthington’s goodwill before and after our impairment.

63
Impairment of Goodwill
Year 2003 2004 2005 2006 2007 2008
Goodwill Before Impairment $116,781 $117,769 $168,867 $177,771 $179,441 $183,523
Goodwill After Impairment $93,425 $75,530 $101,303 $88,165 $74,868 $60,760
As you can tell from the table Worthington’s goodwill should be stated as 60,760 million
as opposed to the 183,523 million that they state it as. This is a difference of over
100million dollars that could negatively affect the value of this firm. The next table
shows Worthington’s asset value before and after impairment.
Asset Value Year 2003 2004 2005 2006 2007 2008Asset Value Before Impairment 1,478,069 1,643,139 1,830,005 1,900,397 1,814,182 1,988,031
Asset Value After Impairment 1,454,713 1,600,900 1,762,441 1,810,791 1,706,609 1,865,268
The first step in restating a firm’s financials starts with restating assets on the balance
sheet. This is done by taking the Worthington’s asset values and subtracting off the
impairment of goodwill year to year. Next, we must recognize the proper impairment
expense. By understating expenses throughout the years Worthington has effectively
overstated their net income. The next table shows what Worthington’s impairment
expenses should be.
Worthington's Impairment Expense
Year 2003 2004 2005 2006 2007 2008
Impairment Expense $23,356 $18,883 $25,326 $22,041 $17,967 $15,790
Now that we have an impairment expense for the past five years the next step is to see
how it affects net income. Worthington’s expenses have been undervalued, and now
that we have a truer higher expense value it should negatively affect net income. By
adding the new impairment expense we lower Worthington’s overall net income by the

64
added impairment expense year to year. The table below shows how the impairment of
goodwill has reduced net income over the past 5 years.
Net Income
Year 2003 2004 2005 2006 2007 2008
Before Impairment $75,183 $86,752 $179,412 $145,990 $113,905 $107,077
After Impairment $51,827 $67,869 $154,086 $123,949 $95,938 $91,287
As we can see from above, the impairment of goodwill has lowered Worthington’s net
income over the years by an average of 20 million a year. This is a concern because
net income directly effects the retained earnings on the balance sheet. The next step is
to restate retained earnings to see what the true value of the firm should be. The table
below shows how the retained earnings for Worthington has changed after expensing
goodwill.
Retained Earnings
Year 2003 2004 2005 2006 2007 2008
Before Impairment $520,072 $551,512 $672,982 $758,862 $745,912 $685,844
After Impairment $496,716 $509,273 $605,417 $669,256 $638,339 $562,481
After restating Worthington’s retained earnings throughout the years it is evident that
the restated value is significantly lower than the value Worthington states. The
difference is 123 million, which is nearly a 20% change in the retained earnings. The
lack of impairment for Worthington’s goodwill has obviously been done in an attempt to
skew the view of Worthington’s value by overstating retained earnings. Also one must
realized that our impairment of goodwill is based on estimates, having said that it is still
necessary that we take our estimates of goodwill into account when valuing
Worthington. Finally, it is obvious that Worthington assets were overstated due to a
65
lack of impairment expense recognized by the firm. The lack of impairment led to an
overstated net income and retained earnings, and the fact that the change is so
substantial will led us to recognizing Worthington’ s new restated financials when
valuing the firm further.
Financial Analysis
Financial Analysis is a way of determining where a firm stands financially and
exactly how healthy that firm looks. Financial analysis looks at the past, present, and
future of a firm by using various ratios, reports, and other useful financial information.
Most analysts tend to use ratios to determine the financial viability of a firm. Some of
the most common ratios used are the debt to equity ratio, asset turnover ratio, profit
margin, and the ratio of net working capital. Although there are many more ratios,
they are all broken down into three categories: liquidity, profitability, and capital
structure ratios. In the following pages, Worthington Industries will be compared
financially to three other firms in the steel processing industry by using about sixteen
ratios. The use of these ratios will help people see exactly how Worthington is doing,
not only amongst its industry, but within the business world in general. You will be able
to assess the viability of Worthington’s industry and come up with clear picture of how
healthy a level the firm is actually performing.
Liquidity Ratio Analysis
Liquidity Ratios measure a firm’s ability to pay off current liabilities if needed.
The liquidity ratios consist of current ratio, quick asset ratio, accounts receivable
turnover, days in accounts receivable, inventory turnover, days in inventory, and
working capital turnover. Lenders, such as banks, look at these ratios to determine the
ability and likelihood of a company paying a loan on time.

66
Current Ratio:
Computing the current ratio is calculated by dividing the current assets by the
current liabilities. The ratio is relevant because it demonstrates the amount of current
assets, such as cash and inventory, for every dollar of current liabilities. The ratio
shows how likely a company can easily pay off their current portions of debt. A lender
will be more willing to loan money at a lower interest rate to a company with a current
ratio well above 1.0; signifying the company has a higher chance of paying the loan
back.
Worthington’s current ratio, on average, is the lowest in the industry. However,
the ratio is relatively stable and always above 1.5. Worthington’s ratio has been
increasing over the past six years except for the industry-wide set back in 2008.
Worthington’s current ratio tells investors and lenders that Worthington is capable of
paying off their current liabilities with their current portion of Worthington’s assets.
0.0
0.5
1.0
1.5
2.0
2.5
3.0
3.5
4.0
2003 2004 2005 2006 2007 2008
Current Ratio
Worthington
Olympic
A K
Gibraltar
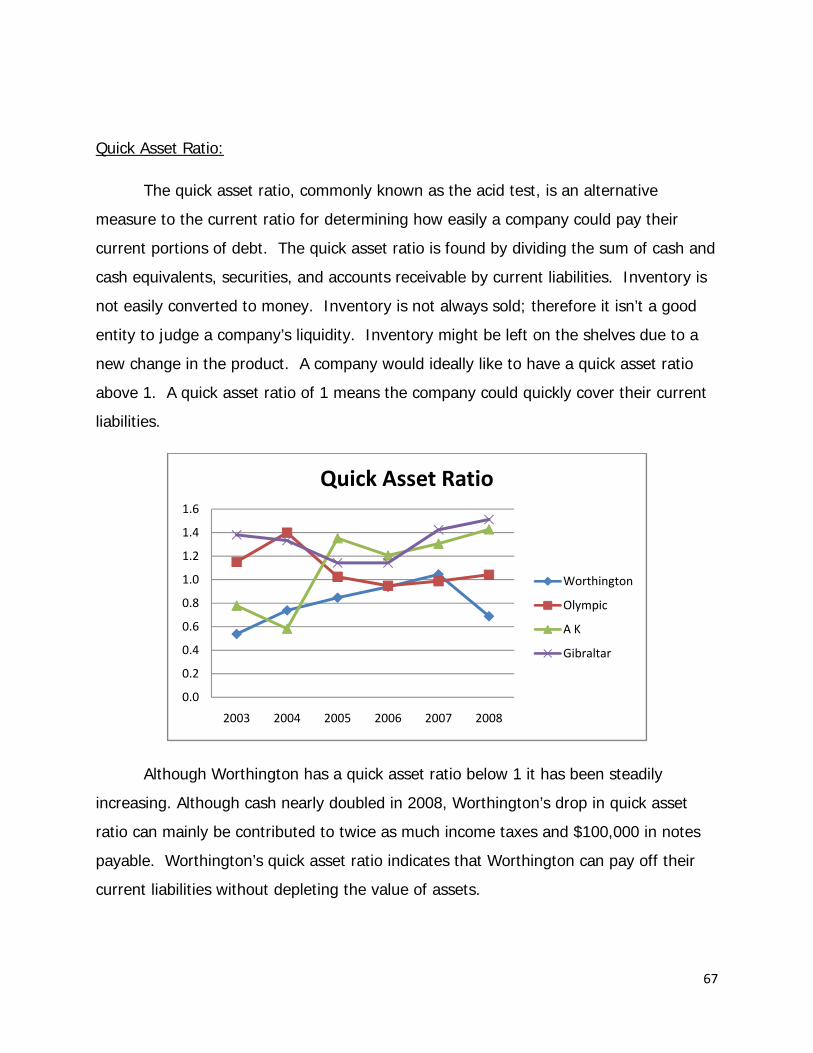
67
Quick Asset Ratio:
The quick asset ratio, commonly known as the acid test, is an alternative
measure to the current ratio for determining how easily a company could pay their
current portions of debt. The quick asset ratio is found by dividing the sum of cash and
cash equivalents, securities, and accounts receivable by current liabilities. Inventory is
not easily converted to money. Inventory is not always sold; therefore it isn’t a good
entity to judge a company’s liquidity. Inventory might be left on the shelves due to a
new change in the product. A company would ideally like to have a quick asset ratio
above 1. A quick asset ratio of 1 means the company could quickly cover their current
liabilities.
Although Worthington has a quick asset ratio below 1 it has been steadily
increasing. Although cash nearly doubled in 2008, Worthington’s drop in quick asset
ratio can mainly be contributed to twice as much income taxes and $100,000 in notes
payable. Worthington’s quick asset ratio indicates that Worthington can pay off their
current liabilities without depleting the value of assets.
0.0
0.2
0.4
0.6
0.8
1.0
1.2
1.4
1.6
2003 2004 2005 2006 2007 2008
Quick Asset Ratio
Worthington
Olympic
A K
Gibraltar

68
Accounts Receivable Turnover:
The accounts receivable turnover ratio measures how well a company collects on
their customer’s accounts. It is derived by dividing sales by accounts receivable. A high
A/R turnover ratio would signify a company lends credit for shorter periods of time. This
is desired as it demonstrates a firms’ efficiency in lending and collecting credit.
Worthington has had a relatively poor but stable A/R turnover ratio. The
reasoning behind the high 2003 turnover number is due to a large increase in sales
from 2002 without a corresponding increase in A/R. However in the following year, A/R
had increased tremendously which was followed up by a large amount of write-offs in
2005. This may have been caused by relaxing credit policies.
In conclusion, Worthington is appealing to its customers by relaxing credit
policies. The new policies are allowing customers to pay less money according to the
0.0
2.0
4.0
6.0
8.0
10.0
12.0
14.0
2003 2004 2005 2006 2007 2008
A/R Turnover
Worthington
Olympic
A K
Gibraltar
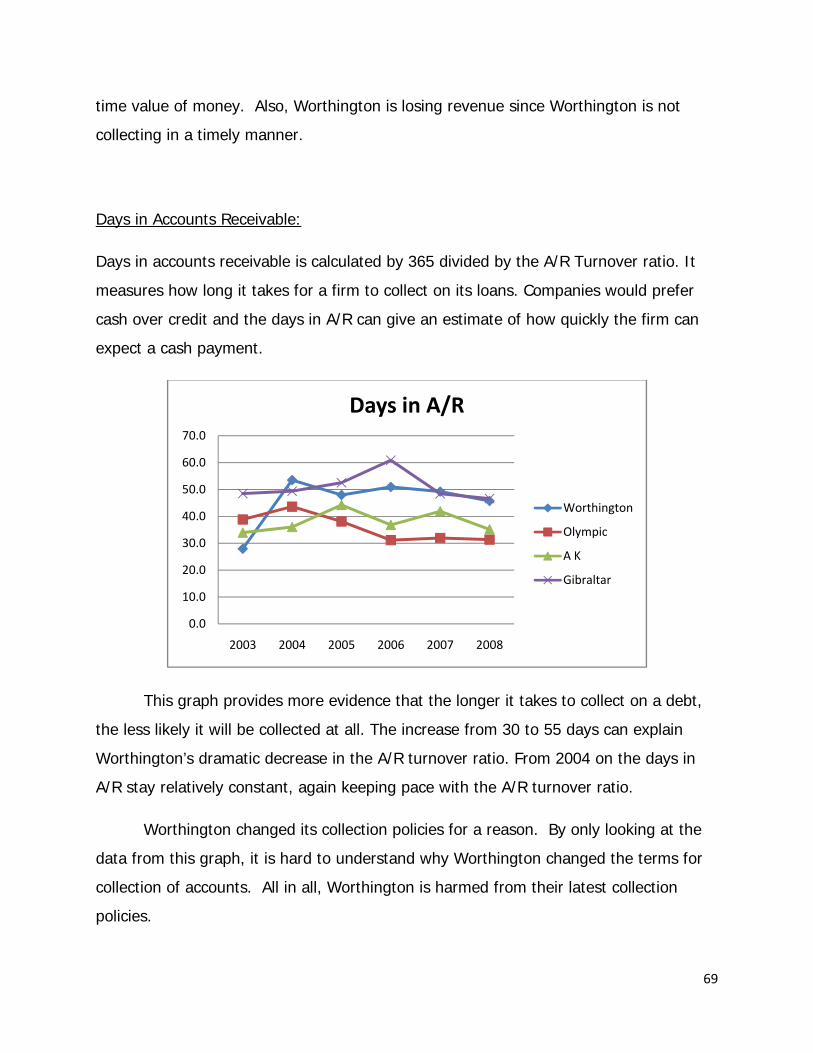
69
time value of money. Also, Worthington is losing revenue since Worthington is not
collecting in a timely manner.
Days in Accounts Receivable:
Days in accounts receivable is calculated by 365 divided by the A/R Turnover ratio. It
measures how long it takes for a firm to collect on its loans. Companies would prefer
cash over credit and the days in A/R can give an estimate of how quickly the firm can
expect a cash payment.
This graph provides more evidence that the longer it takes to collect on a debt,
the less likely it will be collected at all. The increase from 30 to 55 days can explain
Worthington’s dramatic decrease in the A/R turnover ratio. From 2004 on the days in
A/R stay relatively constant, again keeping pace with the A/R turnover ratio.
Worthington changed its collection policies for a reason. By only looking at the
data from this graph, it is hard to understand why Worthington changed the terms for
collection of accounts. All in all, Worthington is harmed from their latest collection
policies.
0.0
10.0
20.0
30.0
40.0
50.0
60.0
70.0
2003 2004 2005 2006 2007 2008
Days in A/R
Worthington
Olympic
A K
Gibraltar
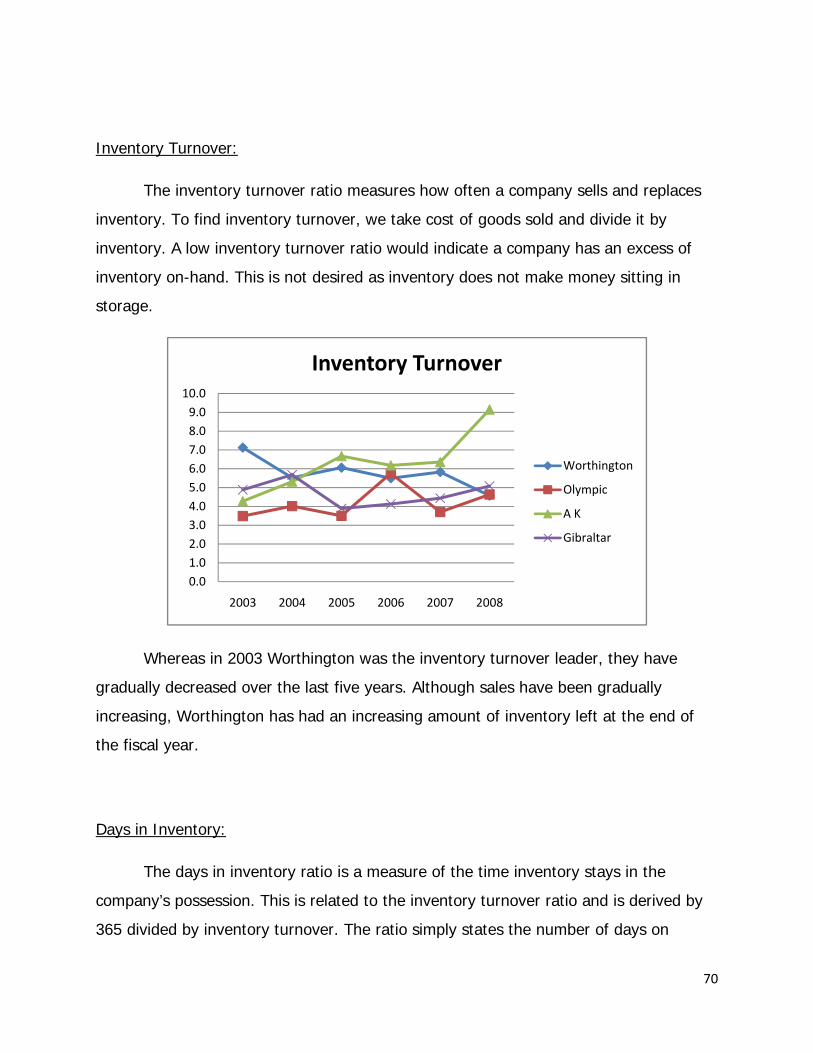
70
Inventory Turnover:
The inventory turnover ratio measures how often a company sells and replaces
inventory. To find inventory turnover, we take cost of goods sold and divide it by
inventory. A low inventory turnover ratio would indicate a company has an excess of
inventory on-hand. This is not desired as inventory does not make money sitting in
storage.
Whereas in 2003 Worthington was the inventory turnover leader, they have
gradually decreased over the last five years. Although sales have been gradually
increasing, Worthington has had an increasing amount of inventory left at the end of
the fiscal year.
Days in Inventory:
The days in inventory ratio is a measure of the time inventory stays in the
company’s possession. This is related to the inventory turnover ratio and is derived by
365 divided by inventory turnover. The ratio simply states the number of days on
0.01.02.03.04.05.06.07.08.09.0
10.0
2003 2004 2005 2006 2007 2008
Inventory Turnover
Worthington
Olympic
A K
Gibraltar
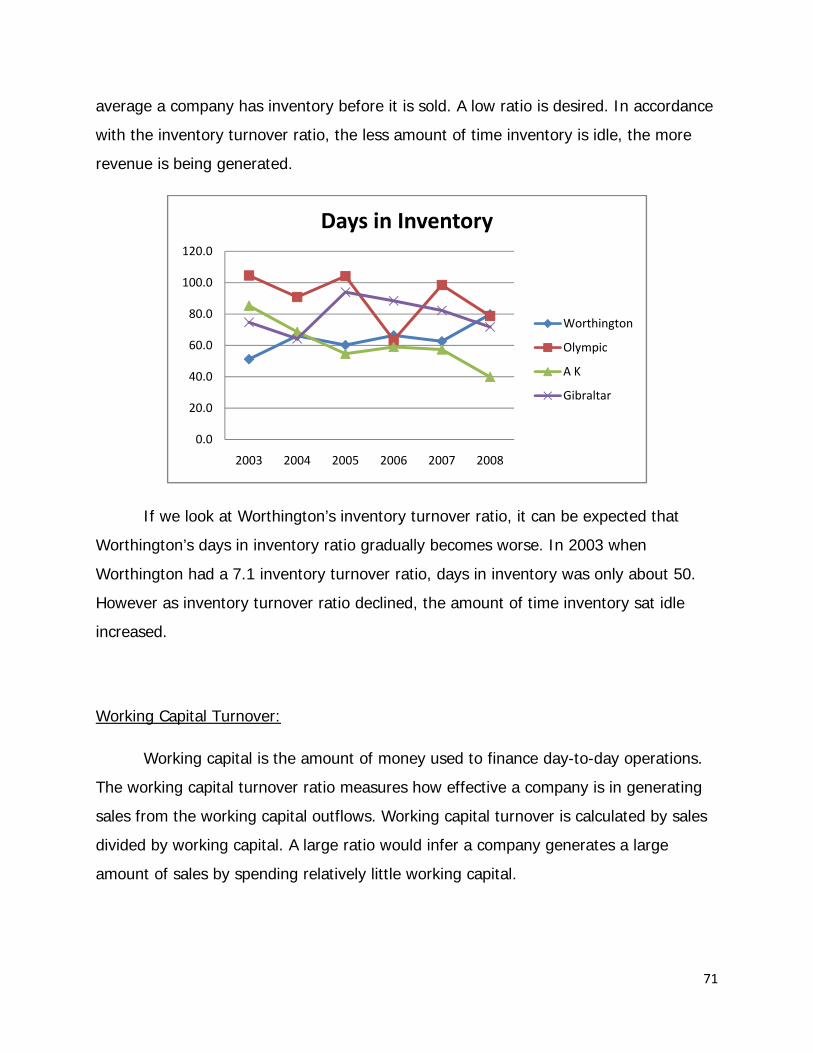
71
average a company has inventory before it is sold. A low ratio is desired. In accordance
with the inventory turnover ratio, the less amount of time inventory is idle, the more
revenue is being generated.
If we look at Worthington’s inventory turnover ratio, it can be expected that
Worthington’s days in inventory ratio gradually becomes worse. In 2003 when
Worthington had a 7.1 inventory turnover ratio, days in inventory was only about 50.
However as inventory turnover ratio declined, the amount of time inventory sat idle
increased.
Working Capital Turnover:
Working capital is the amount of money used to finance day-to-day operations.
The working capital turnover ratio measures how effective a company is in generating
sales from the working capital outflows. Working capital turnover is calculated by sales
divided by working capital. A large ratio would infer a company generates a large
amount of sales by spending relatively little working capital.
0.0
20.0
40.0
60.0
80.0
100.0
120.0
2003 2004 2005 2006 2007 2008
Days in Inventory
Worthington
Olympic
A K
Gibraltar
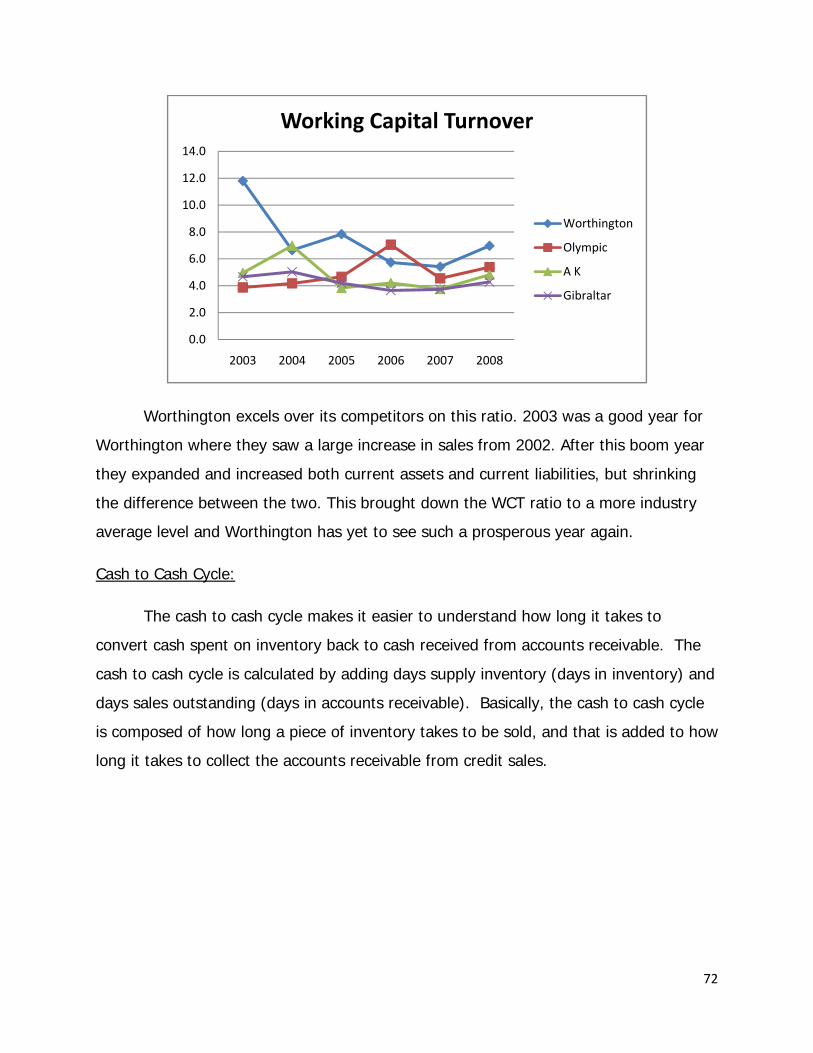
72
Worthington excels over its competitors on this ratio. 2003 was a good year for
Worthington where they saw a large increase in sales from 2002. After this boom year
they expanded and increased both current assets and current liabilities, but shrinking
the difference between the two. This brought down the WCT ratio to a more industry
average level and Worthington has yet to see such a prosperous year again.
Cash to Cash Cycle:
The cash to cash cycle makes it easier to understand how long it takes to
convert cash spent on inventory back to cash received from accounts receivable. The
cash to cash cycle is calculated by adding days supply inventory (days in inventory) and
days sales outstanding (days in accounts receivable). Basically, the cash to cash cycle
is composed of how long a piece of inventory takes to be sold, and that is added to how
long it takes to collect the accounts receivable from credit sales.
0.0
2.0
4.0
6.0
8.0
10.0
12.0
14.0
2003 2004 2005 2006 2007 2008
Working Capital Turnover
Worthington
Olympic
A K
Gibraltar

73
Worthington’s cash to cash cycle has been mediocre over the past 5 years. Their
cash to cash cycle started low and has since emerged into the middle of the industry.
Worthington’s cycle has been steadily increasing. This is due to a slack in accounts
receivables policy. Worthington has increased their flexibility with their credit sales
terms. The new terms appeal to customers and potential customers alike. This should
increase revenue if potential customers turn into customers. However, Worthington
now has a greater risk of not collecting payment. The impact of the increasing cash to
cash cycle is Worthington is losing liquidity. This could be a risk that lenders do not
like.
Conclusion:
After studying and analyzing the liquidity ratios, it is now appropriate to make a
judgment. There is no overarching pattern to the liquidity ratios. Worthington’s current
ratio, quick asset ratio, accounts receivable turnover, and days in accounts receivable
were all below the industry average. In fact, Worthington’s current ratio and quick
asset ratio were both the worst in the industry. This can be explained by Worthington’s
taxes and notes payable. In contrast, Worthington’s inventory turnover, days in
inventory, and working capital turnover all beat industry averages. There were not any
0.0
20.0
40.0
60.0
80.0
100.0
120.0
140.0
160.0
2003 2004 2005 2006 2007 2008
Cash to Cash Cycle
Worthington
Olympic
A K
Gibraltar
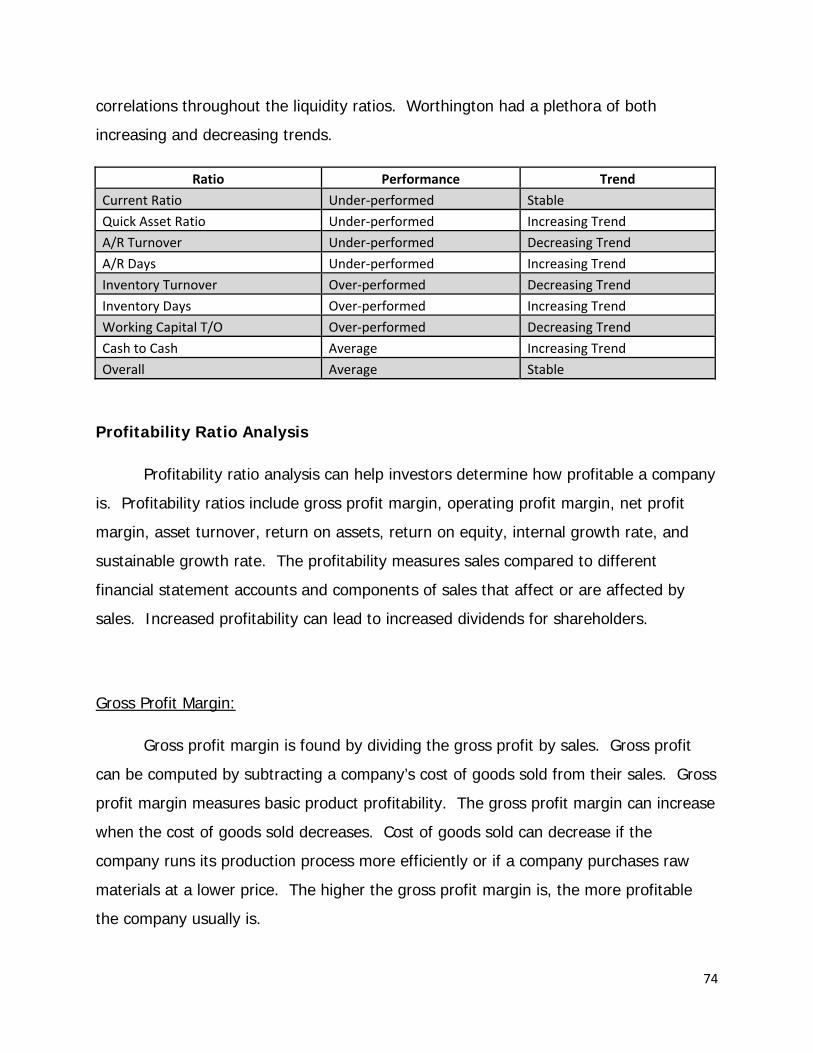
74
correlations throughout the liquidity ratios. Worthington had a plethora of both
increasing and decreasing trends.
Ratio Performance Trend
Current Ratio Under‐performed Stable
Quick Asset Ratio Under‐performed Increasing Trend
A/R Turnover Under‐performed Decreasing Trend
A/R Days Under‐performed Increasing Trend
Inventory Turnover Over‐performed Decreasing Trend
Inventory Days Over‐performed Increasing Trend
Working Capital T/O Over‐performed Decreasing Trend
Cash to Cash Average Increasing Trend
Overall Average Stable
Profitability Ratio Analysis
Profitability ratio analysis can help investors determine how profitable a company
is. Profitability ratios include gross profit margin, operating profit margin, net profit
margin, asset turnover, return on assets, return on equity, internal growth rate, and
sustainable growth rate. The profitability measures sales compared to different
financial statement accounts and components of sales that affect or are affected by
sales. Increased profitability can lead to increased dividends for shareholders.
Gross Profit Margin:
Gross profit margin is found by dividing the gross profit by sales. Gross profit
can be computed by subtracting a company’s cost of goods sold from their sales. Gross
profit margin measures basic product profitability. The gross profit margin can increase
when the cost of goods sold decreases. Cost of goods sold can decrease if the
company runs its production process more efficiently or if a company purchases raw
materials at a lower price. The higher the gross profit margin is, the more profitable
the company usually is.
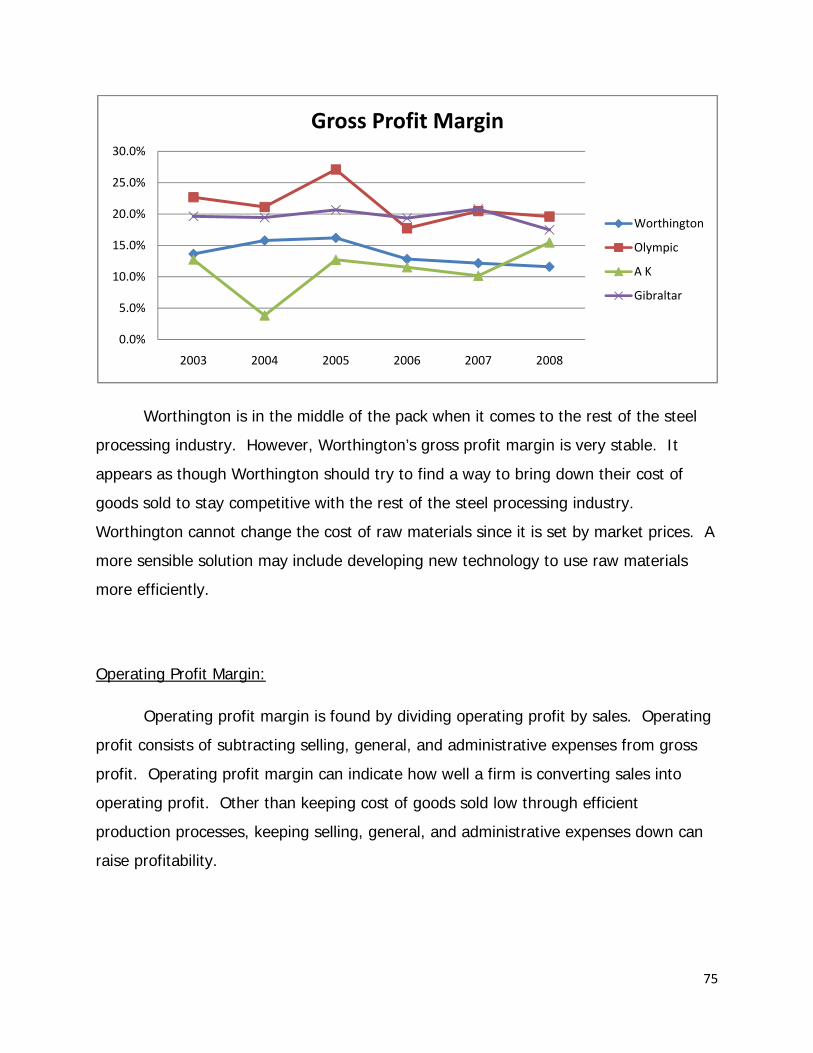
75
Worthington is in the middle of the pack when it comes to the rest of the steel
processing industry. However, Worthington’s gross profit margin is very stable. It
appears as though Worthington should try to find a way to bring down their cost of
goods sold to stay competitive with the rest of the steel processing industry.
Worthington cannot change the cost of raw materials since it is set by market prices. A
more sensible solution may include developing new technology to use raw materials
more efficiently.
Operating Profit Margin:
Operating profit margin is found by dividing operating profit by sales. Operating
profit consists of subtracting selling, general, and administrative expenses from gross
profit. Operating profit margin can indicate how well a firm is converting sales into
operating profit. Other than keeping cost of goods sold low through efficient
production processes, keeping selling, general, and administrative expenses down can
raise profitability.
0.0%
5.0%
10.0%
15.0%
20.0%
25.0%
30.0%
2003 2004 2005 2006 2007 2008
Gross Profit Margin
Worthington
Olympic
A K
Gibraltar
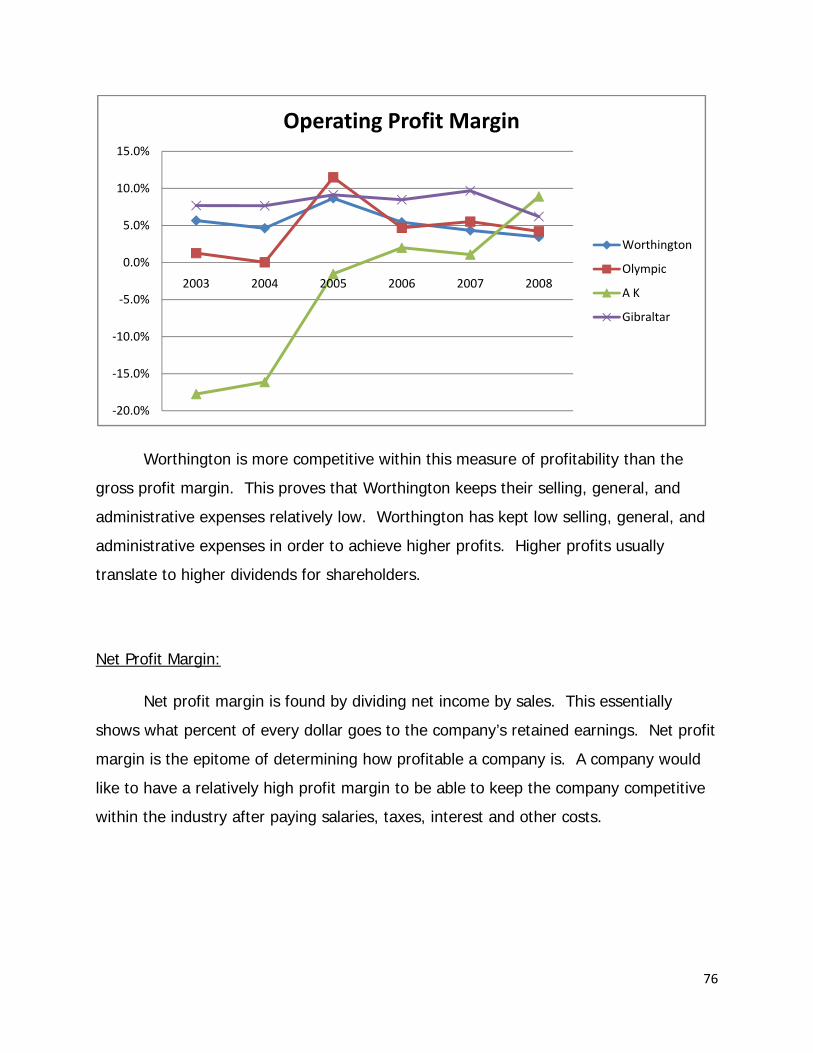
76
Worthington is more competitive within this measure of profitability than the
gross profit margin. This proves that Worthington keeps their selling, general, and
administrative expenses relatively low. Worthington has kept low selling, general, and
administrative expenses in order to achieve higher profits. Higher profits usually
translate to higher dividends for shareholders.
Net Profit Margin:
Net profit margin is found by dividing net income by sales. This essentially
shows what percent of every dollar goes to the company’s retained earnings. Net profit
margin is the epitome of determining how profitable a company is. A company would
like to have a relatively high profit margin to be able to keep the company competitive
within the industry after paying salaries, taxes, interest and other costs.
‐20.0%
‐15.0%
‐10.0%
‐5.0%
0.0%
5.0%
10.0%
15.0%
2003 2004 2005 2006 2007 2008
Operating Profit Margin
Worthington
Olympic
A K
Gibraltar

77
Worthington’s net profit margin is above average but not the top in the industry.
Gibraltar’s net profit margin has consistently outperformed Worthington’s margin.
Worthington has been the most stable of the industry. The steel processing industry
averages less than 5% every year. The rate is pretty low because the steel processing
industry is a low cost industry.
Asset Turnover:
Asset turnover can tell how efficiently a company is using its assets in
production. Asset turnover is found by dividing current sales by the previous year’s
total assets. The ratio effectively shows how many dollars of sales are produced from
every dollar of assets. A higher ratio indicates that a company is able to squeeze more
revenue out of the company’s assets.
‐15.0%
‐10.0%
‐5.0%
0.0%
5.0%
10.0%
2003 2004 2005 2006 2007 2008
Net Profit Margin
Worthington (Restated)
Worthington
Olympic
A K
Gibraltar
Average
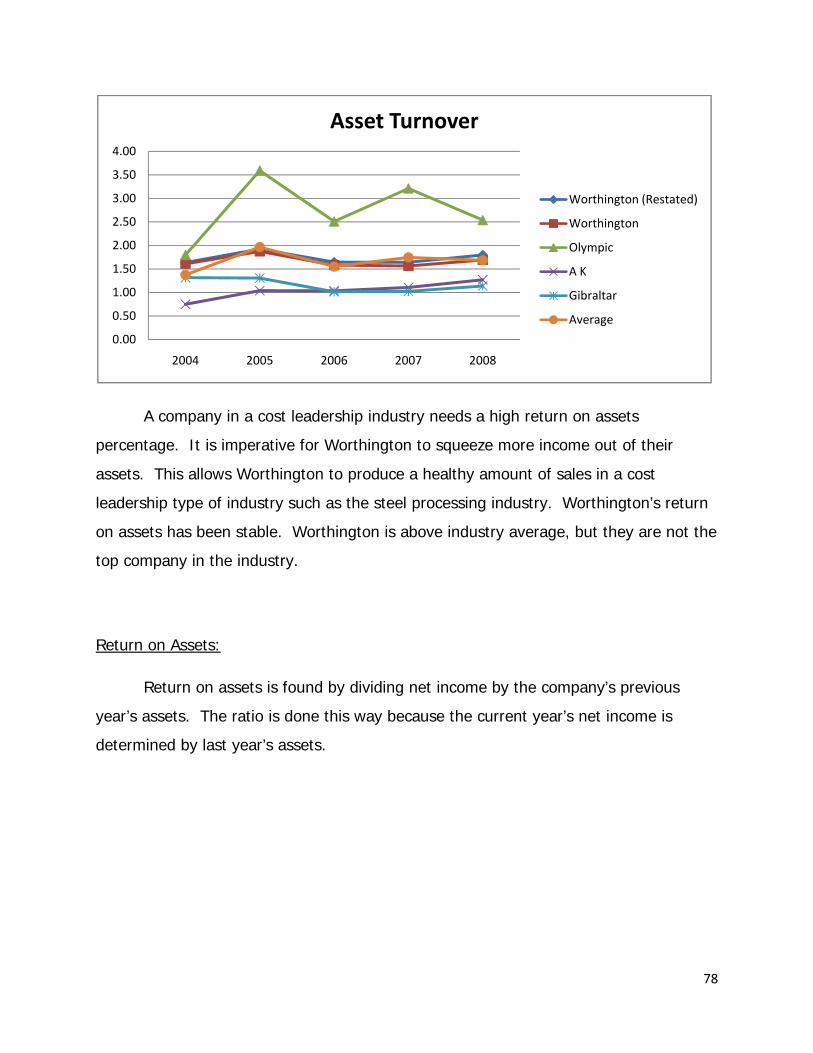
78
A company in a cost leadership industry needs a high return on assets
percentage. It is imperative for Worthington to squeeze more income out of their
assets. This allows Worthington to produce a healthy amount of sales in a cost
leadership type of industry such as the steel processing industry. Worthington’s return
on assets has been stable. Worthington is above industry average, but they are not the
top company in the industry.
Return on Assets:
Return on assets is found by dividing net income by the company’s previous
year’s assets. The ratio is done this way because the current year’s net income is
determined by last year’s assets.
0.00
0.50
1.00
1.50
2.00
2.50
3.00
3.50
4.00
2004 2005 2006 2007 2008
Asset Turnover
Worthington (Restated)
Worthington
Olympic
A K
Gibraltar
Average

79
A company in a cost leadership industry needs a high return on assets
percentage. It is imperative for Worthington to squeeze more income out of their
assets. This allows Worthington to keep revenues in retained earnings instead of
having to utilize their income to finance new expensive equipment. Worthington’s
return on assets has been stable. Worthington is above industry average, but they are
not the top company in the industry.
Return on Equity:
Return on equity is found by dividing net income by last year’s equity. Return on
equity is the cornerstone for analysis of the performance of a company. The ratio is
important because it measures how well the input from shareholders translates into net
income for the company.
‐15.0%
‐10.0%
‐5.0%
0.0%
5.0%
10.0%
15.0%
20.0%
25.0%
30.0%
2004 2005 2006 2007 2008
Return on Assets
Worthington (Restated)
Worthington
Olympic
A K
Gibraltar
Average
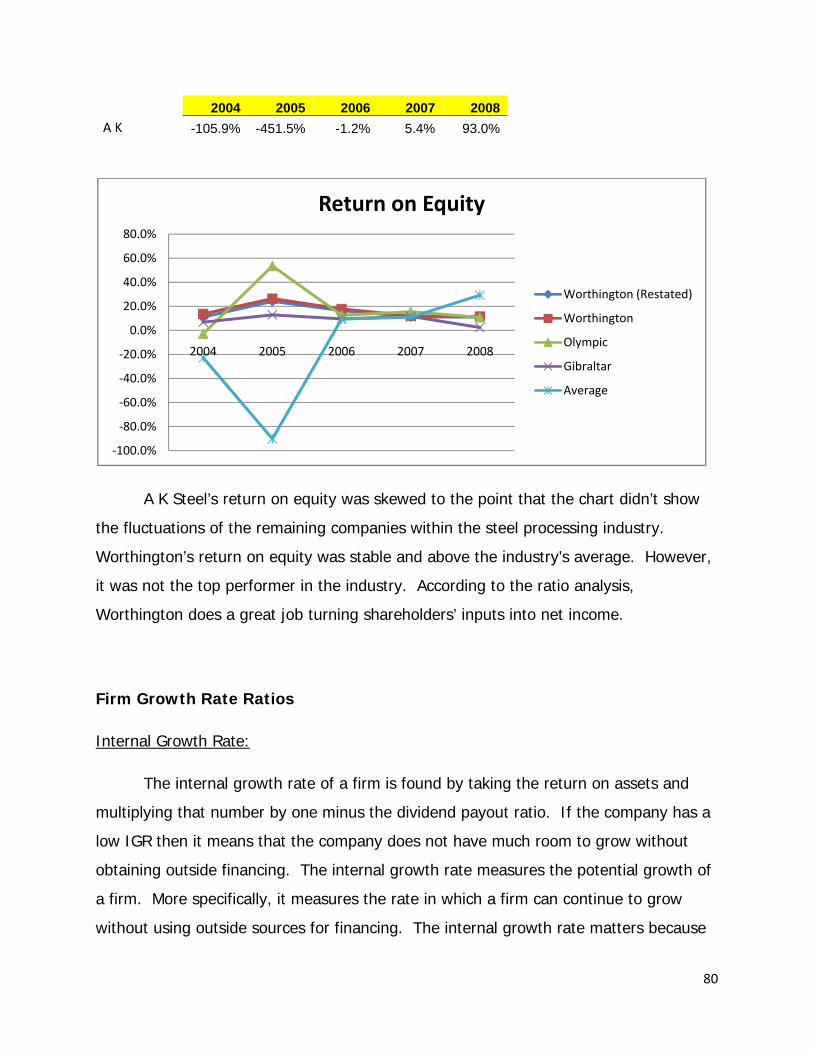
80
2004 2005 2006 2007 2008A K -105.9% -451.5% -1.2% 5.4% 93.0%
A K Steel’s return on equity was skewed to the point that the chart didn’t show
the fluctuations of the remaining companies within the steel processing industry.
Worthington’s return on equity was stable and above the industry’s average. However,
it was not the top performer in the industry. According to the ratio analysis,
Worthington does a great job turning shareholders’ inputs into net income.
Firm Growth Rate Ratios
Internal Growth Rate:
The internal growth rate of a firm is found by taking the return on assets and
multiplying that number by one minus the dividend payout ratio. If the company has a
low IGR then it means that the company does not have much room to grow without
obtaining outside financing. The internal growth rate measures the potential growth of
a firm. More specifically, it measures the rate in which a firm can continue to grow
without using outside sources for financing. The internal growth rate matters because
‐100.0%
‐80.0%
‐60.0%
‐40.0%
‐20.0%
0.0%
20.0%
40.0%
60.0%
80.0%
2004 2005 2006 2007 2008
Return on Equity
Worthington (Restated)
Worthington
Olympic
Gibraltar
Average

81
it gives current and potential shareholders a hypothetical indication of how well the firm
should be able to perform in the coming years.
Worthington Steel has an IGR of 2.09% in 2008 and an average IGR of 3.46%
from 2004-2008. This is a very low IGR. In this particular case it can be said that
Worthington will probably have to obtain some sort of outside financing if they would
like to take on projects to grow their business. With that being said, the more debt the
firm takes on, the more trouble the firm will have turning a profit. Firms that pay
dividends tend to have a higher IGR than firms that do not pay dividends. This means
that Worthington will have a lower IGR than the firms in their industry that do not pay
dividends.
Sustainable Growth Rate:
The sustainable growth rate is the maximum potential growth the firm can sustain
without having to increase financial leverage. After the firm has passed this rate it
means that they must obtain some sort of outside financing to continue growing their
operations. To find the SGR of a firm, take the IGR and multiply one plus the debt to
equity ratio.
‐15.00%
‐10.00%
‐5.00%
0.00%
5.00%
10.00%
15.00%
20.00%
25.00%
30.00%
2004 2005 2006 2007 2008
Internal Growth Rate
Worthington
Olympic
AK Steel
Gibraltar
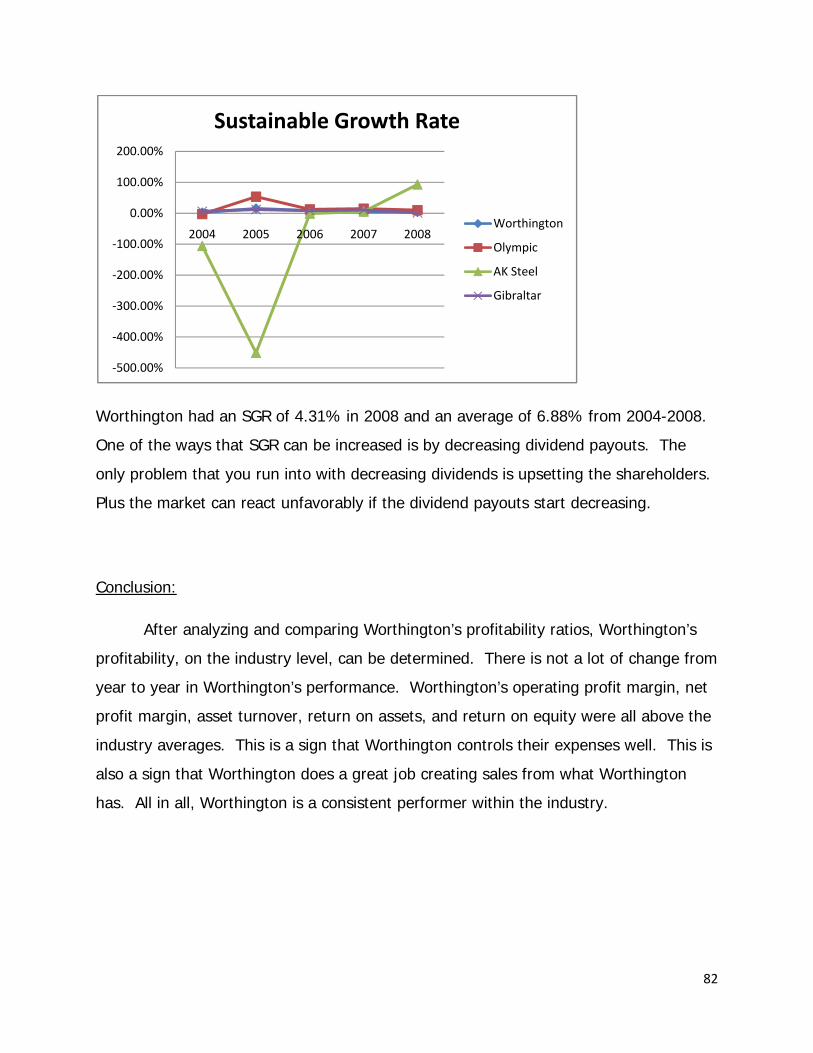
82
Worthington had an SGR of 4.31% in 2008 and an average of 6.88% from 2004-2008.
One of the ways that SGR can be increased is by decreasing dividend payouts. The
only problem that you run into with decreasing dividends is upsetting the shareholders.
Plus the market can react unfavorably if the dividend payouts start decreasing.
Conclusion:
After analyzing and comparing Worthington’s profitability ratios, Worthington’s
profitability, on the industry level, can be determined. There is not a lot of change from
year to year in Worthington’s performance. Worthington’s operating profit margin, net
profit margin, asset turnover, return on assets, and return on equity were all above the
industry averages. This is a sign that Worthington controls their expenses well. This is
also a sign that Worthington does a great job creating sales from what Worthington
has. All in all, Worthington is a consistent performer within the industry.
‐500.00%
‐400.00%
‐300.00%
‐200.00%
‐100.00%
0.00%
100.00%
200.00%
2004 2005 2006 2007 2008
Sustainable Growth Rate
Worthington
Olympic
AK Steel
Gibraltar
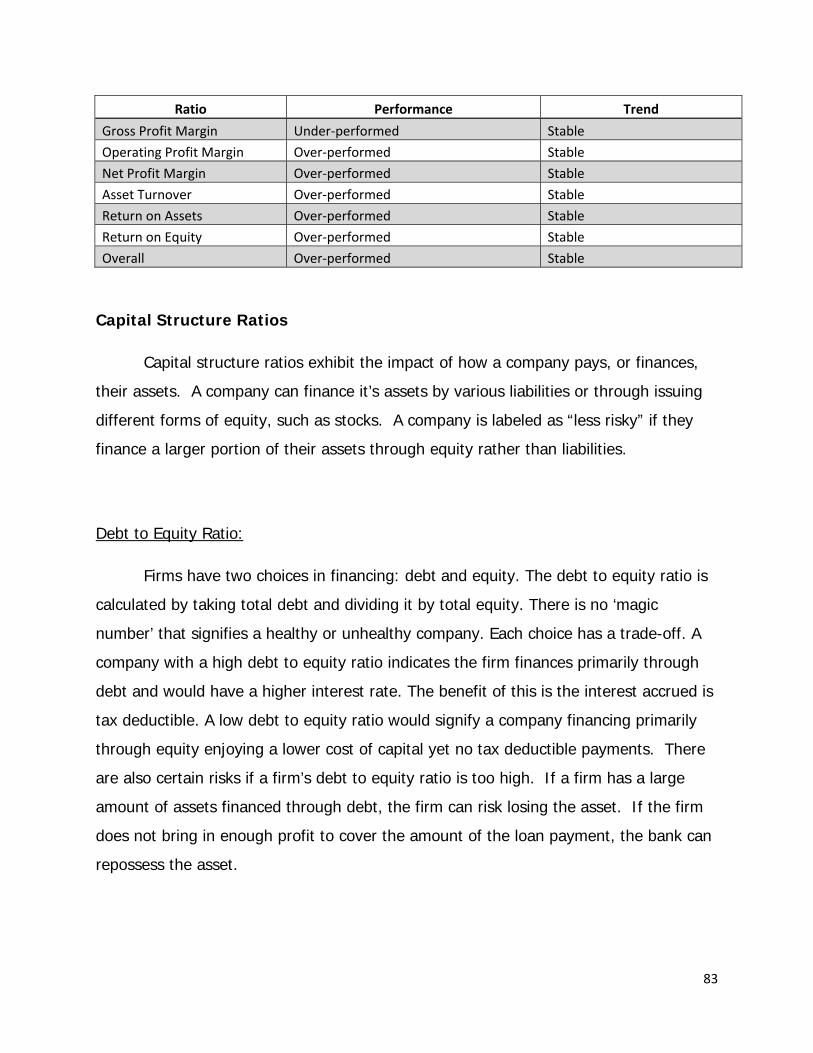
83
Ratio Performance Trend
Gross Profit Margin Under‐performed Stable
Operating Profit Margin Over‐performed Stable
Net Profit Margin Over‐performed Stable
Asset Turnover Over‐performed Stable
Return on Assets Over‐performed Stable
Return on Equity Over‐performed Stable
Overall Over‐performed Stable
Capital Structure Ratios
Capital structure ratios exhibit the impact of how a company pays, or finances,
their assets. A company can finance it’s assets by various liabilities or through issuing
different forms of equity, such as stocks. A company is labeled as “less risky” if they
finance a larger portion of their assets through equity rather than liabilities.
Debt to Equity Ratio:
Firms have two choices in financing: debt and equity. The debt to equity ratio is
calculated by taking total debt and dividing it by total equity. There is no ‘magic
number’ that signifies a healthy or unhealthy company. Each choice has a trade-off. A
company with a high debt to equity ratio indicates the firm finances primarily through
debt and would have a higher interest rate. The benefit of this is the interest accrued is
tax deductible. A low debt to equity ratio would signify a company financing primarily
through equity enjoying a lower cost of capital yet no tax deductible payments. There
are also certain risks if a firm’s debt to equity ratio is too high. If a firm has a large
amount of assets financed through debt, the firm can risk losing the asset. If the firm
does not bring in enough profit to cover the amount of the loan payment, the bank can
repossess the asset.
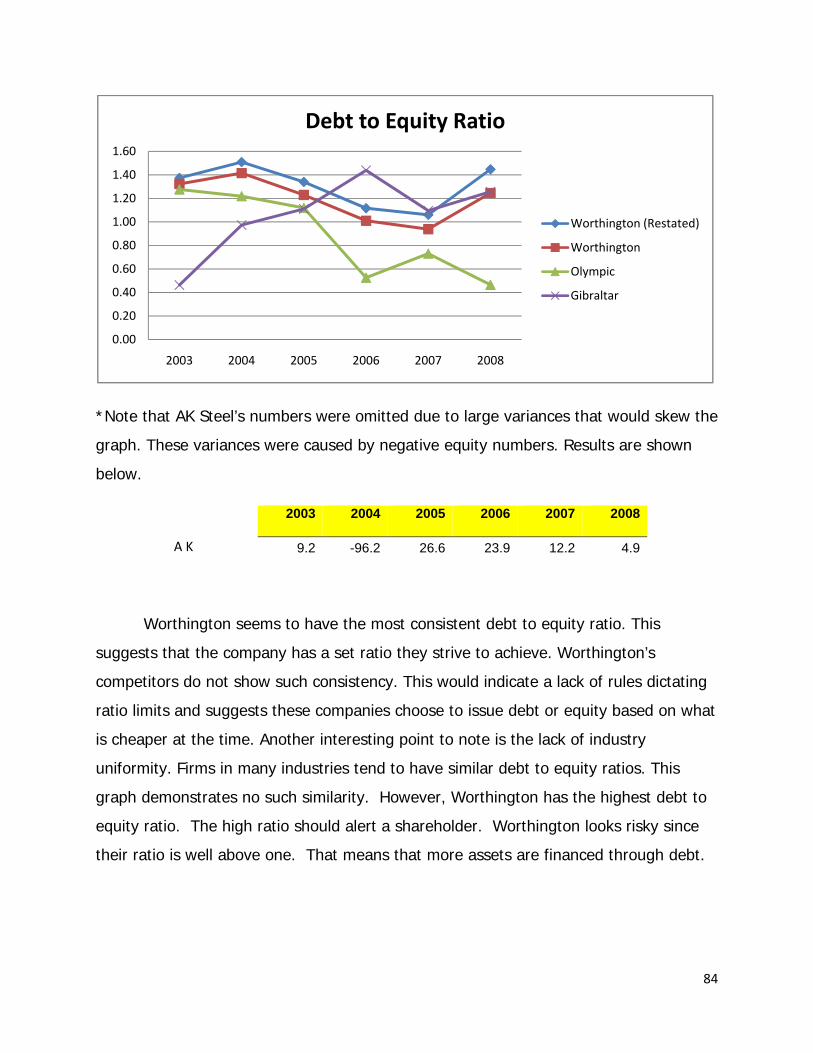
84
*Note that AK Steel’s numbers were omitted due to large variances that would skew the
graph. These variances were caused by negative equity numbers. Results are shown
below.
2003 2004 2005 2006 2007 2008
A K 9.2 -96.2 26.6 23.9 12.2 4.9
Worthington seems to have the most consistent debt to equity ratio. This
suggests that the company has a set ratio they strive to achieve. Worthington’s
competitors do not show such consistency. This would indicate a lack of rules dictating
ratio limits and suggests these companies choose to issue debt or equity based on what
is cheaper at the time. Another interesting point to note is the lack of industry
uniformity. Firms in many industries tend to have similar debt to equity ratios. This
graph demonstrates no such similarity. However, Worthington has the highest debt to
equity ratio. The high ratio should alert a shareholder. Worthington looks risky since
their ratio is well above one. That means that more assets are financed through debt.
0.00
0.20
0.40
0.60
0.80
1.00
1.20
1.40
1.60
2003 2004 2005 2006 2007 2008
Debt to Equity Ratio
Worthington (Restated)
Worthington
Olympic
Gibraltar
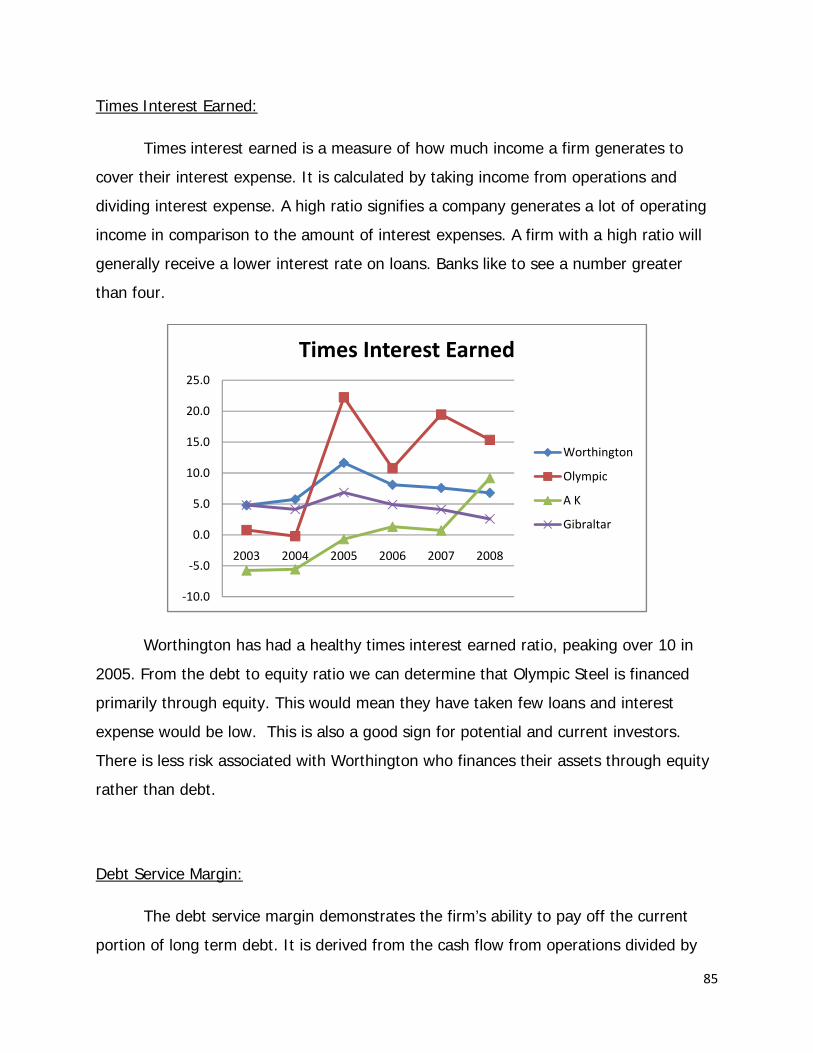
85
Times Interest Earned:
Times interest earned is a measure of how much income a firm generates to
cover their interest expense. It is calculated by taking income from operations and
dividing interest expense. A high ratio signifies a company generates a lot of operating
income in comparison to the amount of interest expenses. A firm with a high ratio will
generally receive a lower interest rate on loans. Banks like to see a number greater
than four.
Worthington has had a healthy times interest earned ratio, peaking over 10 in
2005. From the debt to equity ratio we can determine that Olympic Steel is financed
primarily through equity. This would mean they have taken few loans and interest
expense would be low. This is also a good sign for potential and current investors.
There is less risk associated with Worthington who finances their assets through equity
rather than debt.
Debt Service Margin:
The debt service margin demonstrates the firm’s ability to pay off the current
portion of long term debt. It is derived from the cash flow from operations divided by
‐10.0
‐5.0
0.0
5.0
10.0
15.0
20.0
25.0
2003 2004 2005 2006 2007 2008
Times Interest Earned
Worthington
Olympic
A K
Gibraltar
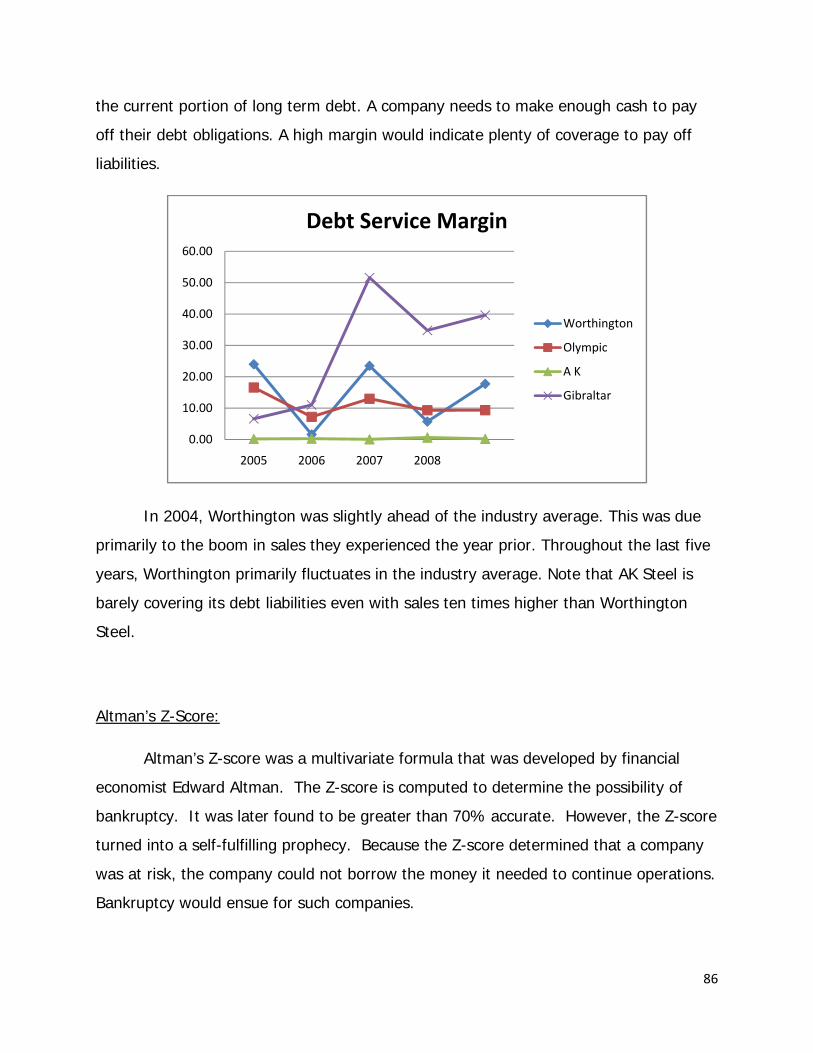
86
the current portion of long term debt. A company needs to make enough cash to pay
off their debt obligations. A high margin would indicate plenty of coverage to pay off
liabilities.
In 2004, Worthington was slightly ahead of the industry average. This was due
primarily to the boom in sales they experienced the year prior. Throughout the last five
years, Worthington primarily fluctuates in the industry average. Note that AK Steel is
barely covering its debt liabilities even with sales ten times higher than Worthington
Steel.
Altman’s Z-Score:
Altman’s Z-score was a multivariate formula that was developed by financial
economist Edward Altman. The Z-score is computed to determine the possibility of
bankruptcy. It was later found to be greater than 70% accurate. However, the Z-score
turned into a self-fulfilling prophecy. Because the Z-score determined that a company
was at risk, the company could not borrow the money it needed to continue operations.
Bankruptcy would ensue for such companies.
0.00
10.00
20.00
30.00
40.00
50.00
60.00
2005 2006 2007 2008
Debt Service Margin
Worthington
Olympic
A K
Gibraltar
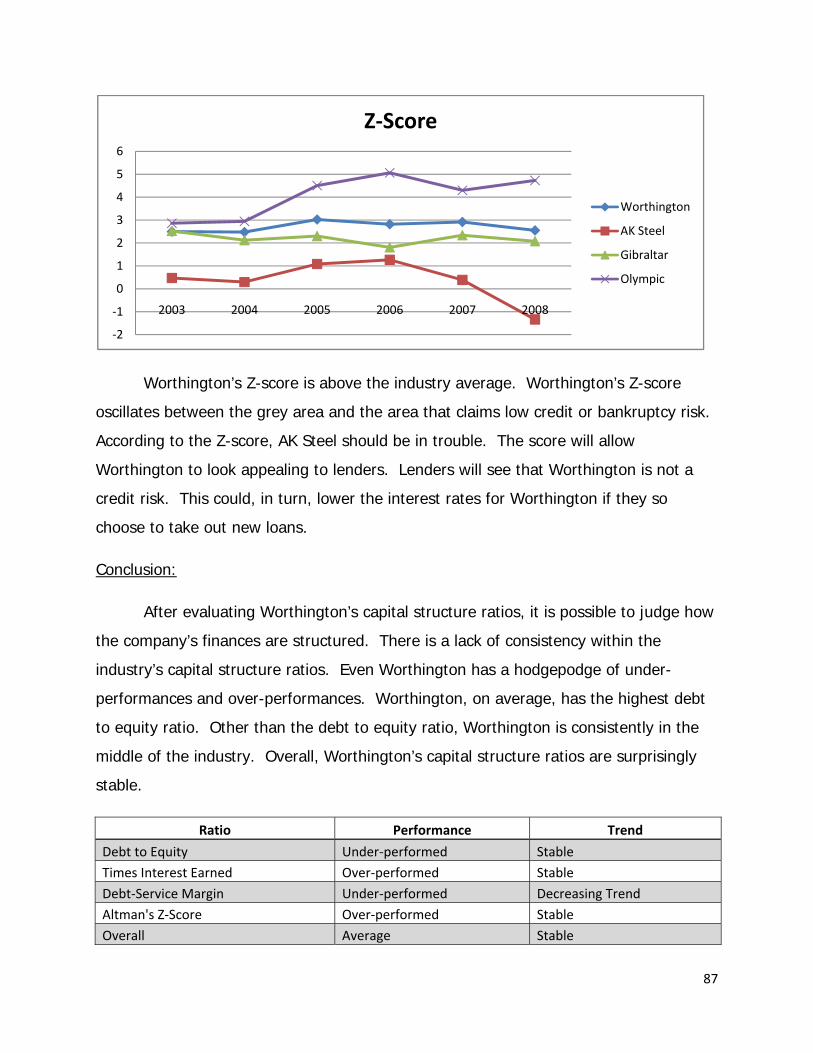
87
Worthington’s Z-score is above the industry average. Worthington’s Z-score
oscillates between the grey area and the area that claims low credit or bankruptcy risk.
According to the Z-score, AK Steel should be in trouble. The score will allow
Worthington to look appealing to lenders. Lenders will see that Worthington is not a
credit risk. This could, in turn, lower the interest rates for Worthington if they so
choose to take out new loans.
Conclusion:
After evaluating Worthington’s capital structure ratios, it is possible to judge how
the company’s finances are structured. There is a lack of consistency within the
industry’s capital structure ratios. Even Worthington has a hodgepodge of under-
performances and over-performances. Worthington, on average, has the highest debt
to equity ratio. Other than the debt to equity ratio, Worthington is consistently in the
middle of the industry. Overall, Worthington’s capital structure ratios are surprisingly
stable.
Ratio Performance Trend
Debt to Equity Under‐performed Stable Times Interest Earned Over‐performed Stable
Debt‐Service Margin Under‐performed Decreasing Trend Altman's Z‐Score Over‐performed Stable
Overall Average Stable
‐2
‐1
0
1
2
3
4
5
6
2003 2004 2005 2006 2007 2008
Z‐Score
Worthington
AK Steel
Gibraltar
Olympic
88
Forecasting
Forecasting is the fourth step in the valuation of the firm. Because future cash
flows and rates are uncertain and unknown, the analyst will make reasonable guesses
at what these numbers and rates might be. To be able to do this properly, one must
take into account past financial statements, industry trends, and the economy as a
whole. Taking all these things into account, one can make educated guesses at what
the future of the firm might be like. We will forecast the income statement, balance
sheet, and statement of cash flows of Worthington Industries in order to properly value
the firm.
Because of the economic crisis going on right now, growth rates and revenues
will be much lower than usual for a couple of reason. The first reason for this is the
recent crash in sales for the automobile industry. Chrysler fell 35%, GM fell 45%, and
Ford fell 30%. Plus all are currently asking the United States government for a bail out
due to the recent decreased sales.
“House Financial Services Chairman Barney Frank (D., Mass.) said Wednesday that he plans to hold a
hearing next Wednesday, during a lame‐duck session of Congress, with the chief executives of the Big
Three auto makers and the head of the United Auto Workers union. It is unclear whether the executives
will be grilled on the industry's problems, or asked to just formally present their requests for
money.”(http://online.wsj.com/article/SB122654044416323137.html)
According to Worthington’s 10-k report in 2007, 26 percent of their sales are to the
automobile industry, and this is among two of our segments, both flat rolled segment
and steel processing segment. 40% of our sales to automobiles is to the big 3 (Ford,
GM, Chrysler) and the other 60% is to non American automobile makers such as
Honda, Toyota, and others. Because these companies have fallen so drastically, we
believe that it will radically affect Worthington’s future sales to these companies. The
big 3 have fallen because of the credit crisis and the fact that oil and gas prices had
skyrocketed for the past couple of years. So many people have stopped buying cars

89
because of fear, lack of funds, or because they cannot get a loan. What one must do to
get a loan has changed so much in the last month. They have to have a much better
credit score and put down a larger down payment, when in the past, it was much easier
to get a loan to buy a car. Also, the Big 3 focus is much different than that of the
overseas companies, such as Honda and Toyota. They have been more concerned with
developing fuel efficient vehicles. So because of the price of fuel the over sea
companies, which is 60% of our automobile sales, will not see as big a hit as the Big 3
here in America.
Another massive part of our sales is the sales to construction companies. And
again, because of the economic and credit crisis, construction has decreased quite a bit.
New housing starts in the month of September fell 6.3% nationwide from 872,000 to
817,000. Although the unemployment rate has held steady through August and
September at 6.1%, the new reports for October will be released in a few days, which
are expected to increase the unemployment rate. Because of the unemployment rate
and fear in the economy, construction is expected to decrease as well. This will also
hurt Worthington’s future sales because construction is the largest percentage of their
total sales at 40%.
“In the past few weeks, several steelmakers, including ArcelorMittal and AK Steel
Holding Corp., have announced production curtailments and layoffs to better match
falling demand for automobiles, appliances and
construction.”(http://online.wsj.com/article/SB122826204920774031.html)
So in conclusion, we expect growth rates to drop for the next couple of years, than
increasing after the company takes the initial hit from this crisis, and the economy
stabilizes.
90
Year 1 Income Statement Forecast:
Worthington’s fiscal year ends on May 31 of each year. The most recent 10-K
was filed May 31, 2008 so this means there is one more quarter of newly reported data.
So to forecast year 2009 for Worthington it is only necessary to forecast three quarters
since one quarter has already been reported. Looking at Worthington’s 10-Q shows
that Worthington’s net sales increased but it was mainly due to price increase.
“Net sales increased $154.2 million from the prior year to $913.2 million. The most significant
reason for the improvement was the increase in average selling prices, which rose in response
to the soaring market price of hot-rolled steel, up over 100% from last year.”(Worthington 10-Q
08-2008)
This 10-Q shows how the recent recession has started to affect Worthington, and this is
only the beginning. We must now forecast for the worst part of this recession, and we
expect it to only get worse due Worthington’s major customer’s financial problems.
The first year of forecasts is the most important because errors have a greater effect in
earlier years as opposed to later years.
Income Statement:
To help forecast the future income statements, we have to look at past income
statements of both Worthington and the industry. From these statements, and what is
happening with the crisis in the economy, we can make a logical forecast of what these
outcomes might be. The net revenue forecasted growth rate was -15% for the first
year, -8% for the second, -3% for the third, than increasing to 1%, and a big change to
6%, and holding steady for the next 5 years. To help determine this rate, we have
taken in account what the percentages of sales to different industries (such as
automobiles) and what the broadcasted expectations were for these customers.

91
We computed Worthington’s cost of goods sold over the last five years to be
86% of total sales. We then multiplied the sales that were already forecasted by this
average to obtain Worthington’s forecasted cost of goods sold. We believe that
Worthington will have a reduction in their selling, general and administrative expenses,
because Worthington has recently cut 282 employees. The average SG&A expense has
been 7.67%, but will be reduced because of the cut in employment. Last we forecasted
Worthington’s net income using the historic average net profit margin of 3.5%. We
computed net income by multiplying sales by the net profit margin.
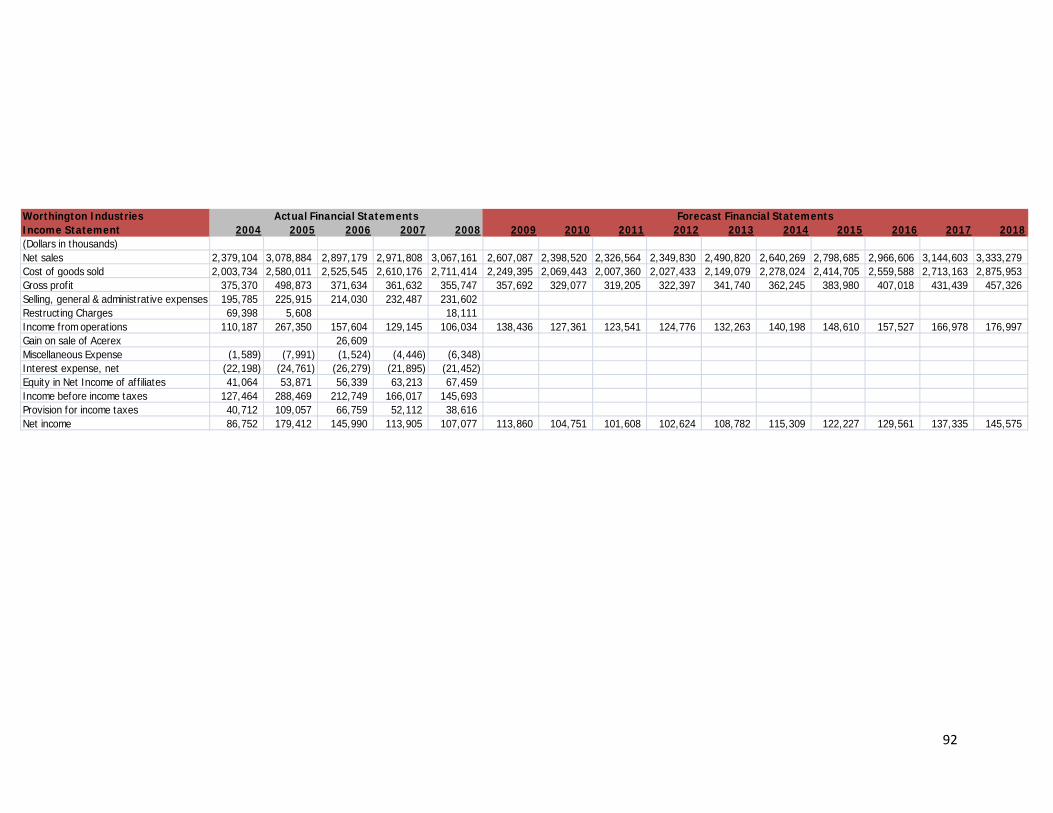
92
Worthington IndustriesIncome Statement 2004 2005 2006 2007 2008 2009 2010 2011 2012 2013 2014 2015 2016 2017 2018(Dollars in thousands)Net sales 2,379,104 3,078,884 2,897,179 2,971,808 3,067,161 2,607,087 2,398,520 2,326,564 2,349,830 2,490,820 2,640,269 2,798,685 2,966,606 3,144,603 3,333,279Cost of goods sold 2,003,734 2,580,011 2,525,545 2,610,176 2,711,414 2,249,395 2,069,443 2,007,360 2,027,433 2,149,079 2,278,024 2,414,705 2,559,588 2,713,163 2,875,953Gross profit 375,370 498,873 371,634 361,632 355,747 357,692 329,077 319,205 322,397 341,740 362,245 383,980 407,018 431,439 457,326Selling, general & administrative expenses 195,785 225,915 214,030 232,487 231,602Restructing Charges 69,398 5,608 18,111Income from operations 110,187 267,350 157,604 129,145 106,034 138,436 127,361 123,541 124,776 132,263 140,198 148,610 157,527 166,978 176,997Gain on sale of Acerex 26,609Miscellaneous Expense (1,589) (7,991) (1,524) (4,446) (6,348)Interest expense, net (22,198) (24,761) (26,279) (21,895) (21,452)Equity in Net Income of affiliates 41,064 53,871 56,339 63,213 67,459Income before income taxes 127,464 288,469 212,749 166,017 145,693Provision for income taxes 40,712 109,057 66,759 52,112 38,616Net income 86,752 179,412 145,990 113,905 107,077 113,860 104,751 101,608 102,624 108,782 115,309 122,227 129,561 137,335 145,575
Forecast Financial StatementsActual Financial Statements
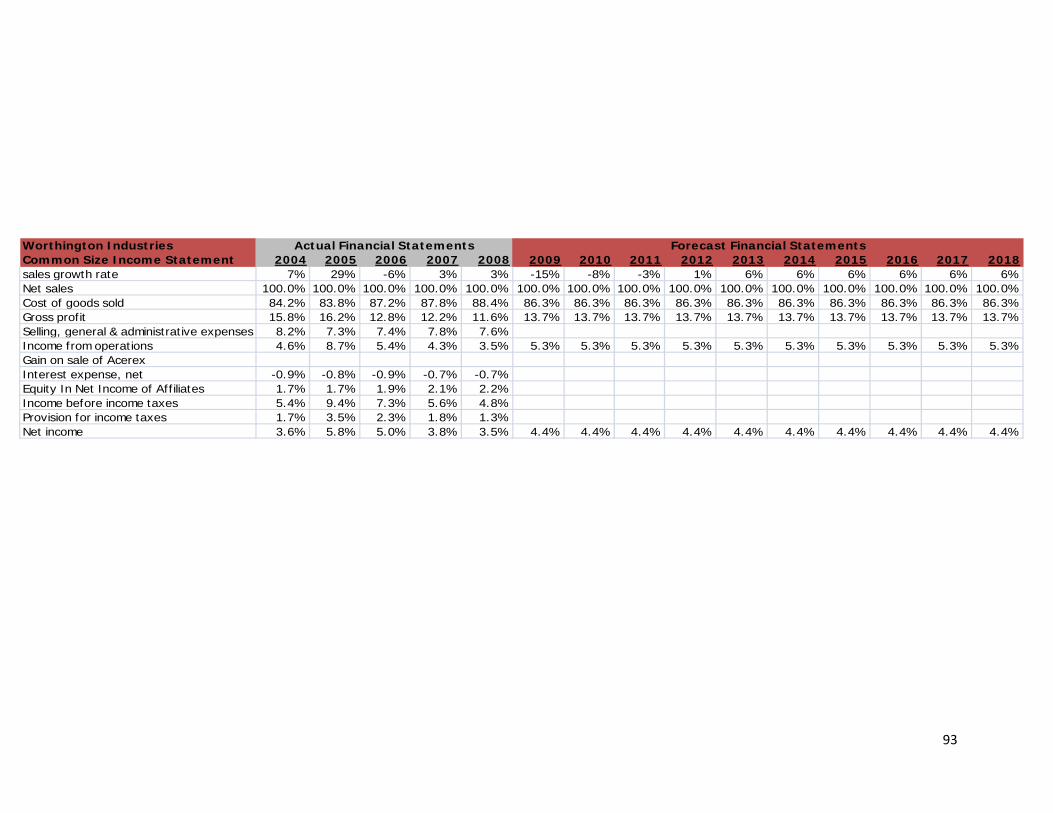
93
Worthington IndustriesCommon Size Income Statement 2004 2005 2006 2007 2008 2009 2010 2011 2012 2013 2014 2015 2016 2017 2018sales growth rate 7% 29% -6% 3% 3% -15% -8% -3% 1% 6% 6% 6% 6% 6% 6%Net sales 100.0% 100.0% 100.0% 100.0% 100.0% 100.0% 100.0% 100.0% 100.0% 100.0% 100.0% 100.0% 100.0% 100.0% 100.0%Cost of goods sold 84.2% 83.8% 87.2% 87.8% 88.4% 86.3% 86.3% 86.3% 86.3% 86.3% 86.3% 86.3% 86.3% 86.3% 86.3%Gross profit 15.8% 16.2% 12.8% 12.2% 11.6% 13.7% 13.7% 13.7% 13.7% 13.7% 13.7% 13.7% 13.7% 13.7% 13.7%Selling, general & administrative expenses 8.2% 7.3% 7.4% 7.8% 7.6%Income from operations 4.6% 8.7% 5.4% 4.3% 3.5% 5.3% 5.3% 5.3% 5.3% 5.3% 5.3% 5.3% 5.3% 5.3% 5.3%Gain on sale of AcerexInterest expense, net -0.9% -0.8% -0.9% -0.7% -0.7%Equity In Net Income of Affiliates 1.7% 1.7% 1.9% 2.1% 2.2%Income before income taxes 5.4% 9.4% 7.3% 5.6% 4.8%Provision for income taxes 1.7% 3.5% 2.3% 1.8% 1.3%Net income 3.6% 5.8% 5.0% 3.8% 3.5% 4.4% 4.4% 4.4% 4.4% 4.4% 4.4% 4.4% 4.4% 4.4% 4.4%
Forecast Financial StatementsActual Financial Statements
94
Restated Income Statement:
Since we have now forecasted Worthington’s income statement the next step
would be to forecast Worthington’s restated income statement. The only difference
between Worthington’s original income statement and their restated income statement
is the impairment of goodwill. The restated income statement takes into account the
impairment of goodwill that we calculated previously; We amortized the goodwill over
the last 5 years at a rate of 20 percent. By impairing goodwill we have lowered
Worthington’s net income for the last 5 years, but it will have no effect on our future
forecasts. The reason for this is because we amortized the goodwill from 2003 to 2008,
and since the majority of impairments have been written off for the last 5 years it will
have no impact on forecasted net income. This is why both the restated and original
income statements will have the same forecasted net incomes.
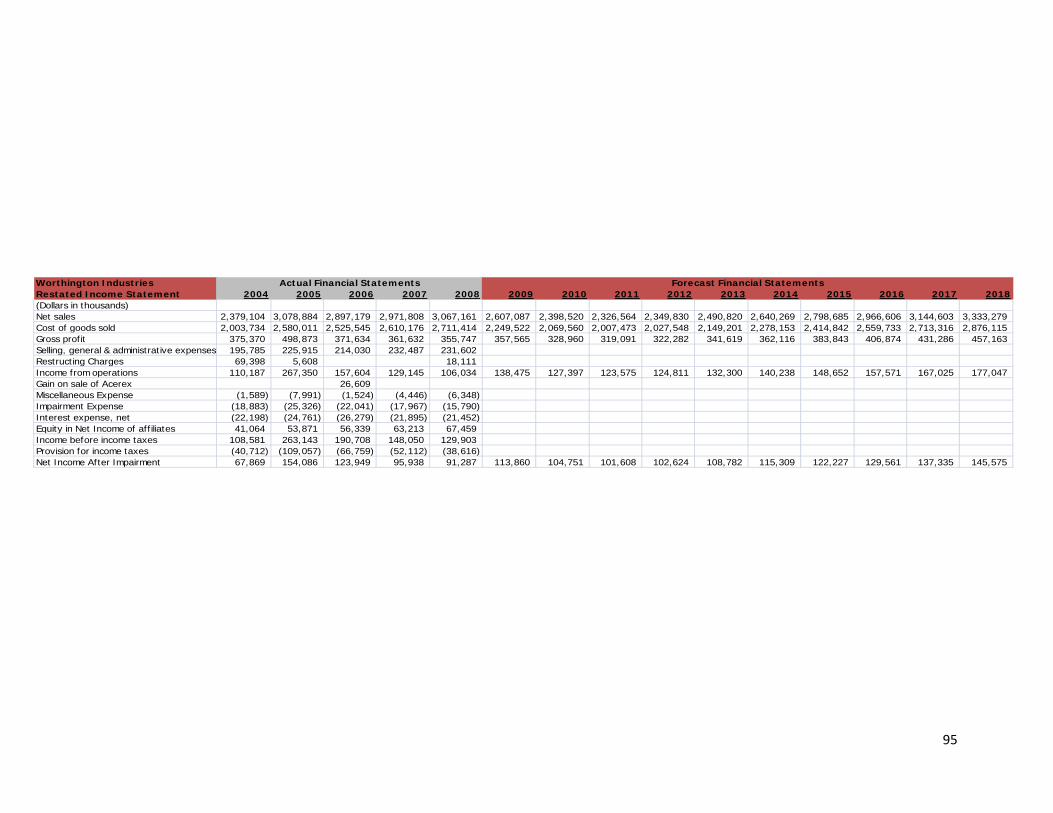
95
Worthington IndustriesRestated Income Statement 2004 2005 2006 2007 2008 2009 2010 2011 2012 2013 2014 2015 2016 2017 2018(Dollars in thousands)Net sales 2,379,104 3,078,884 2,897,179 2,971,808 3,067,161 2,607,087 2,398,520 2,326,564 2,349,830 2,490,820 2,640,269 2,798,685 2,966,606 3,144,603 3,333,279Cost of goods sold 2,003,734 2,580,011 2,525,545 2,610,176 2,711,414 2,249,522 2,069,560 2,007,473 2,027,548 2,149,201 2,278,153 2,414,842 2,559,733 2,713,316 2,876,115Gross profit 375,370 498,873 371,634 361,632 355,747 357,565 328,960 319,091 322,282 341,619 362,116 383,843 406,874 431,286 457,163Selling, general & administrative expenses 195,785 225,915 214,030 232,487 231,602Restructing Charges 69,398 5,608 18,111Income from operations 110,187 267,350 157,604 129,145 106,034 138,475 127,397 123,575 124,811 132,300 140,238 148,652 157,571 167,025 177,047Gain on sale of Acerex 26,609Miscellaneous Expense (1,589) (7,991) (1,524) (4,446) (6,348)Impairment Expense (18,883) (25,326) (22,041) (17,967) (15,790)Interest expense, net (22,198) (24,761) (26,279) (21,895) (21,452)Equity in Net Income of affiliates 41,064 53,871 56,339 63,213 67,459Income before income taxes 108,581 263,143 190,708 148,050 129,903Provision for income taxes (40,712) (109,057) (66,759) (52,112) (38,616)Net Income After Impairment 67,869 154,086 123,949 95,938 91,287 113,860 104,751 101,608 102,624 108,782 115,309 122,227 129,561 137,335 145,575
Forecast Financial StatementsActual Financial Statements

96
Worthington IndustriesCommon Size Income Statement 2004 2005 2006 2007 2008 2009 2010 2011 2012 2013 2014 2015 2016 2017 2018sales growth rate 7.2% 29.4% -5.9% 2.6% 3.2% -15.0% -8.0% -3.0% 1.0% 6.0% 6.0% 6.0% 6.0% 6.0% 6.0%Net sales 100.0% 100.0% 100.0% 100.0% 100.0% 100.0% 100.0% 100.0% 100.0% 100.0% 100.0% 100.0% 100.0% 100.0% 100.0%Cost of goods sold 84.2% 83.8% 87.2% 87.8% 88.4% 86.3% 86.3% 86.3% 86.3% 86.3% 86.3% 86.3% 86.3% 86.3% 86.3%Gross profit 15.8% 16.2% 12.8% 12.2% 11.6% 13.7% 13.7% 13.7% 13.7% 13.7% 13.7% 13.7% 13.7% 13.7% 13.7%Selling, general & administrative expenses 8.2% 7.3% 7.4% 7.8% 7.6%Income from operations 4.6% 8.7% 5.4% 4.3% 3.5% 5.3% 5.3% 5.3% 5.3% 5.3% 5.3% 5.3% 5.3% 5.3% 5.3%Gain on sale of AcerexInterest expense, net -0.9% -0.8% -0.9% -0.7% -0.7%Equity In Net Income of Affiliates 1.7% 1.7% 1.9% 2.1% 2.2%Income before income taxes 5.4% 9.4% 7.3% 5.6% 4.8%Provision for income taxes 1.7% 3.5% 2.3% 1.8% 1.3%Net income 3.6% 5.8% 5.0% 3.8% 3.5% 4.4% 4.4% 4.4% 4.4% 4.4% 4.4% 4.4% 4.4% 4.4% 4.4%
Forecast Financial StatementsActual Financial Statements
97
Balance Sheet:
The second step in forecasting is the Balance Sheet, which is a little more
difficult to forecast. To help forecast this, we will use ratios that link the already
forecasted income statement to the balance sheet. The Asset Turnover ratio is the best
link between the balance sheet and the income statement. Asset Turnover is sales
divided by the firm’s total assets of the previous year. So in order to forecast
Worthington’s assets we took the forecasted sales divided by Worthington’s average
asset turnover over the last 5 years to get forecasted assets. Next we forecasted non-
current assets by taking the average percentage of non-current assets to total assets
over the past five years. Non-current assets came out to be 48.29% of total assets, so
to forecast non-current assets we simply multiplied Worthington’s forecasted total
assets by the average portion of non-current assets of 48.28%. Now that we have the
total assets and non-current assets forecasted we can now forecast Worthington’s
current assets by simply subtracting non-current assets from total assets to get current
assets. Next using the current ratio we can now link assets forecasted current assets to
current liabilities. We found Worthington’s average current ratio to be 1.91 and then
multiplied this by the current assets for each forecasted year to come up with current
liabilities.
Next we forecasted the shareholder’s equity portion of the balance sheet.
When valuing a firm forecasting the shareholder’s equity correctly is much more
important than forecasting a firm’s liabilities correctly. To forecast Worthington’s
owner’s equity first we have to forecast retained earnings. And to forecast retained
earnings we used this formula: (Retained Earnings = Beginning Balance of Retained
Earnings + Net Income – Dividends). Once we have forecasted Worthington’s Retained
Earnings the next order of business is to forecast Worthington’s Shareholder’s Equity.
We forecasted Shareholder’s equity by adding the change in retained earnings to the
previous years shareholder’s equity. Now that we have the Shareholder’s Equity portion
of the Balance Sheet Forecasted we can now forecast Total Liabilities by subtracting
Worthington’s forecasted Shareholder’s Equity from the forecasted Total Assets.
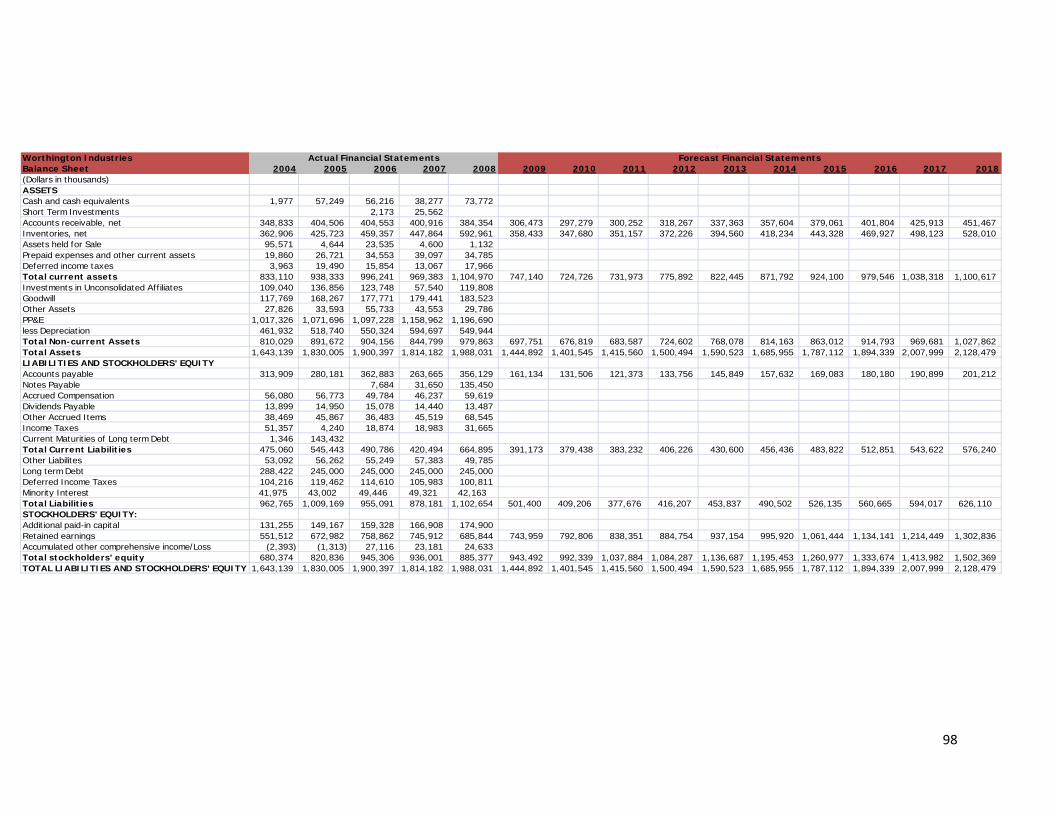
98
Worthington IndustriesBalance Sheet 2004 2005 2006 2007 2008 2009 2010 2011 2012 2013 2014 2015 2016 2017 2018(Dollars in thousands)ASSETSCash and cash equivalents 1,977 57,249 56,216 38,277 73,772Short Term Investments 2,173 25,562Accounts receivable, net 348,833 404,506 404,553 400,916 384,354 306,473 297,279 300,252 318,267 337,363 357,604 379,061 401,804 425,913 451,467Inventories, net 362,906 425,723 459,357 447,864 592,961 358,433 347,680 351,157 372,226 394,560 418,234 443,328 469,927 498,123 528,010Assets held for Sale 95,571 4,644 23,535 4,600 1,132Prepaid expenses and other current assets 19,860 26,721 34,553 39,097 34,785Deferred income taxes 3,963 19,490 15,854 13,067 17,966Total current assets 833,110 938,333 996,241 969,383 1,104,970 747,140 724,726 731,973 775,892 822,445 871,792 924,100 979,546 1,038,318 1,100,617Investments in Unconsolidated Affiliates 109,040 136,856 123,748 57,540 119,808Goodwill 117,769 168,267 177,771 179,441 183,523Other Assets 27,826 33,593 55,733 43,553 29,786PP&E 1,017,326 1,071,696 1,097,228 1,158,962 1,196,690less Depreciation 461,932 518,740 550,324 594,697 549,944Total Non-current Assets 810,029 891,672 904,156 844,799 979,863 697,751 676,819 683,587 724,602 768,078 814,163 863,012 914,793 969,681 1,027,862Total Assets 1,643,139 1,830,005 1,900,397 1,814,182 1,988,031 1,444,892 1,401,545 1,415,560 1,500,494 1,590,523 1,685,955 1,787,112 1,894,339 2,007,999 2,128,479LIABILITIES AND STOCKHOLDERS' EQUITYAccounts payable 313,909 280,181 362,883 263,665 356,129 161,134 131,506 121,373 133,756 145,849 157,632 169,083 180,180 190,899 201,212Notes Payable 7,684 31,650 135,450Accrued Compensation 56,080 56,773 49,784 46,237 59,619Dividends Payable 13,899 14,950 15,078 14,440 13,487Other Accrued Items 38,469 45,867 36,483 45,519 68,545Income Taxes 51,357 4,240 18,874 18,983 31,665Current Maturities of Long term Debt 1,346 143,432Total Current Liabilities 475,060 545,443 490,786 420,494 664,895 391,173 379,438 383,232 406,226 430,600 456,436 483,822 512,851 543,622 576,240Other Liabilites 53,092 56,262 55,249 57,383 49,785Long term Debt 288,422 245,000 245,000 245,000 245,000Deferred Income Taxes 104,216 119,462 114,610 105,983 100,811Minority Interest 41,975 43,002 49,446 49,321 42,163Total Liabilities 962,765 1,009,169 955,091 878,181 1,102,654 501,400 409,206 377,676 416,207 453,837 490,502 526,135 560,665 594,017 626,110STOCKHOLDERS' EQUITY:Additional paid-in capital 131,255 149,167 159,328 166,908 174,900Retained earnings 551,512 672,982 758,862 745,912 685,844 743,959 792,806 838,351 884,754 937,154 995,920 1,061,444 1,134,141 1,214,449 1,302,836Accumulated other comprehensive income/Loss (2,393) (1,313) 27,116 23,181 24,633Total stockholders' equity 680,374 820,836 945,306 936,001 885,377 943,492 992,339 1,037,884 1,084,287 1,136,687 1,195,453 1,260,977 1,333,674 1,413,982 1,502,369TOTAL LIABILITIES AND STOCKHOLDERS' EQUITY 1,643,139 1,830,005 1,900,397 1,814,182 1,988,031 1,444,892 1,401,545 1,415,560 1,500,494 1,590,523 1,685,955 1,787,112 1,894,339 2,007,999 2,128,479
Forecast Financial StatementsActual Financial Statements
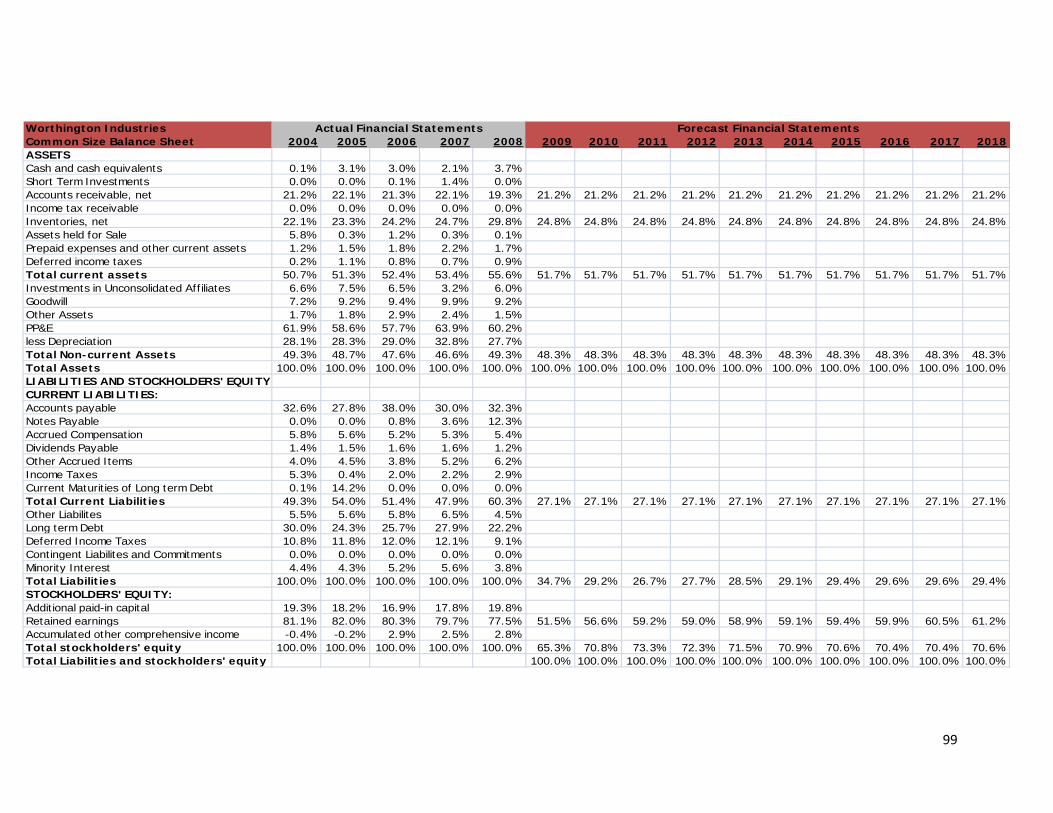
99
Worthington IndustriesCommon Size Balance Sheet 2004 2005 2006 2007 2008 2009 2010 2011 2012 2013 2014 2015 2016 2017 2018ASSETSCash and cash equivalents 0.1% 3.1% 3.0% 2.1% 3.7%Short Term Investments 0.0% 0.0% 0.1% 1.4% 0.0%Accounts receivable, net 21.2% 22.1% 21.3% 22.1% 19.3% 21.2% 21.2% 21.2% 21.2% 21.2% 21.2% 21.2% 21.2% 21.2% 21.2%Income tax receivable 0.0% 0.0% 0.0% 0.0% 0.0%Inventories, net 22.1% 23.3% 24.2% 24.7% 29.8% 24.8% 24.8% 24.8% 24.8% 24.8% 24.8% 24.8% 24.8% 24.8% 24.8%Assets held for Sale 5.8% 0.3% 1.2% 0.3% 0.1%Prepaid expenses and other current assets 1.2% 1.5% 1.8% 2.2% 1.7%Deferred income taxes 0.2% 1.1% 0.8% 0.7% 0.9%Total current assets 50.7% 51.3% 52.4% 53.4% 55.6% 51.7% 51.7% 51.7% 51.7% 51.7% 51.7% 51.7% 51.7% 51.7% 51.7%Investments in Unconsolidated Affiliates 6.6% 7.5% 6.5% 3.2% 6.0%Goodwill 7.2% 9.2% 9.4% 9.9% 9.2%Other Assets 1.7% 1.8% 2.9% 2.4% 1.5%PP&E 61.9% 58.6% 57.7% 63.9% 60.2%less Depreciation 28.1% 28.3% 29.0% 32.8% 27.7%Total Non-current Assets 49.3% 48.7% 47.6% 46.6% 49.3% 48.3% 48.3% 48.3% 48.3% 48.3% 48.3% 48.3% 48.3% 48.3% 48.3%Total Assets 100.0% 100.0% 100.0% 100.0% 100.0% 100.0% 100.0% 100.0% 100.0% 100.0% 100.0% 100.0% 100.0% 100.0% 100.0%LIABILITIES AND STOCKHOLDERS' EQUITYCURRENT LIABILITIES:Accounts payable 32.6% 27.8% 38.0% 30.0% 32.3%Notes Payable 0.0% 0.0% 0.8% 3.6% 12.3%Accrued Compensation 5.8% 5.6% 5.2% 5.3% 5.4%Dividends Payable 1.4% 1.5% 1.6% 1.6% 1.2%Other Accrued Items 4.0% 4.5% 3.8% 5.2% 6.2%Income Taxes 5.3% 0.4% 2.0% 2.2% 2.9%Current Maturities of Long term Debt 0.1% 14.2% 0.0% 0.0% 0.0%Total Current Liabilities 49.3% 54.0% 51.4% 47.9% 60.3% 27.1% 27.1% 27.1% 27.1% 27.1% 27.1% 27.1% 27.1% 27.1% 27.1%Other Liabilites 5.5% 5.6% 5.8% 6.5% 4.5%Long term Debt 30.0% 24.3% 25.7% 27.9% 22.2%Deferred Income Taxes 10.8% 11.8% 12.0% 12.1% 9.1%Contingent Liabilites and Commitments 0.0% 0.0% 0.0% 0.0% 0.0%Minority Interest 4.4% 4.3% 5.2% 5.6% 3.8%Total Liabilities 100.0% 100.0% 100.0% 100.0% 100.0% 34.7% 29.2% 26.7% 27.7% 28.5% 29.1% 29.4% 29.6% 29.6% 29.4%STOCKHOLDERS' EQUITY:Additional paid-in capital 19.3% 18.2% 16.9% 17.8% 19.8%Retained earnings 81.1% 82.0% 80.3% 79.7% 77.5% 51.5% 56.6% 59.2% 59.0% 58.9% 59.1% 59.4% 59.9% 60.5% 61.2%Accumulated other comprehensive income -0.4% -0.2% 2.9% 2.5% 2.8%Total stockholders' equity 100.0% 100.0% 100.0% 100.0% 100.0% 65.3% 70.8% 73.3% 72.3% 71.5% 70.9% 70.6% 70.4% 70.4% 70.6%Total Liabilities and stockholders' equity 100.0% 100.0% 100.0% 100.0% 100.0% 100.0% 100.0% 100.0% 100.0% 100.0%
Forecast Financial StatementsActual Financial Statements
100
Restated Balance Sheet:
Since Worthington had such a large portion of goodwill to long-term assets and
they hadn’t impaired any goodwill over the last 5 years. We felt it necessary to impair
Worthington’s Goodwill at 20% per year. Impairing goodwill causes Worthington’s total
assets to decrease along with net income, retained earnings, and shareholder’s equity.
We used the same methods previously used to forecast the original income statement
to forecast the restated income statement.
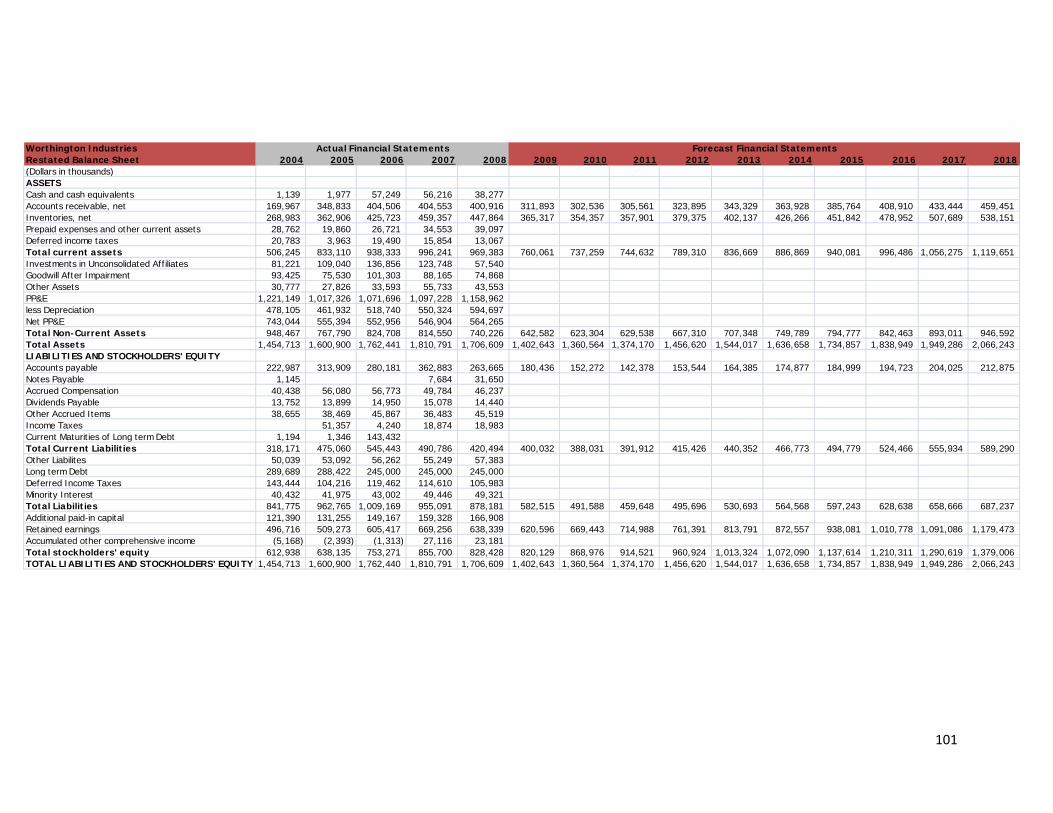
101
Worthington IndustriesRestated Balance Sheet 2004 2005 2006 2007 2008 2009 2010 2011 2012 2013 2014 2015 2016 2017 2018(Dollars in thousands)ASSETSCash and cash equivalents 1,139 1,977 57,249 56,216 38,277Accounts receivable, net 169,967 348,833 404,506 404,553 400,916 311,893 302,536 305,561 323,895 343,329 363,928 385,764 408,910 433,444 459,451Inventories, net 268,983 362,906 425,723 459,357 447,864 365,317 354,357 357,901 379,375 402,137 426,266 451,842 478,952 507,689 538,151Prepaid expenses and other current assets 28,762 19,860 26,721 34,553 39,097Deferred income taxes 20,783 3,963 19,490 15,854 13,067Total current assets 506,245 833,110 938,333 996,241 969,383 760,061 737,259 744,632 789,310 836,669 886,869 940,081 996,486 1,056,275 1,119,651Investments in Unconsolidated Affiliates 81,221 109,040 136,856 123,748 57,540Goodwill After Impairment 93,425 75,530 101,303 88,165 74,868Other Assets 30,777 27,826 33,593 55,733 43,553PP&E 1,221,149 1,017,326 1,071,696 1,097,228 1,158,962less Depreciation 478,105 461,932 518,740 550,324 594,697Net PP&E 743,044 555,394 552,956 546,904 564,265Total Non-Current Assets 948,467 767,790 824,708 814,550 740,226 642,582 623,304 629,538 667,310 707,348 749,789 794,777 842,463 893,011 946,592Total Assets 1,454,713 1,600,900 1,762,441 1,810,791 1,706,609 1,402,643 1,360,564 1,374,170 1,456,620 1,544,017 1,636,658 1,734,857 1,838,949 1,949,286 2,066,243LIABILITIES AND STOCKHOLDERS' EQUITYAccounts payable 222,987 313,909 280,181 362,883 263,665 180,436 152,272 142,378 153,544 164,385 174,877 184,999 194,723 204,025 212,875Notes Payable 1,145 7,684 31,650Accrued Compensation 40,438 56,080 56,773 49,784 46,237Dividends Payable 13,752 13,899 14,950 15,078 14,440Other Accrued Items 38,655 38,469 45,867 36,483 45,519Income Taxes 51,357 4,240 18,874 18,983Current Maturities of Long term Debt 1,194 1,346 143,432Total Current Liabilities 318,171 475,060 545,443 490,786 420,494 400,032 388,031 391,912 415,426 440,352 466,773 494,779 524,466 555,934 589,290Other Liabilites 50,039 53,092 56,262 55,249 57,383Long term Debt 289,689 288,422 245,000 245,000 245,000Deferred Income Taxes 143,444 104,216 119,462 114,610 105,983Minority Interest 40,432 41,975 43,002 49,446 49,321Total Liabilities 841,775 962,765 1,009,169 955,091 878,181 582,515 491,588 459,648 495,696 530,693 564,568 597,243 628,638 658,666 687,237Additional paid-in capital 121,390 131,255 149,167 159,328 166,908Retained earnings 496,716 509,273 605,417 669,256 638,339 620,596 669,443 714,988 761,391 813,791 872,557 938,081 1,010,778 1,091,086 1,179,473Accumulated other comprehensive income (5,168) (2,393) (1,313) 27,116 23,181Total stockholders' equity 612,938 638,135 753,271 855,700 828,428 820,129 868,976 914,521 960,924 1,013,324 1,072,090 1,137,614 1,210,311 1,290,619 1,379,006TOTAL LIABILITIES AND STOCKHOLDERS' EQUITY 1,454,713 1,600,900 1,762,440 1,810,791 1,706,609 1,402,643 1,360,564 1,374,170 1,456,620 1,544,017 1,636,658 1,734,857 1,838,949 1,949,286 2,066,243
Forecast Financial StatementsActual Financial Statements
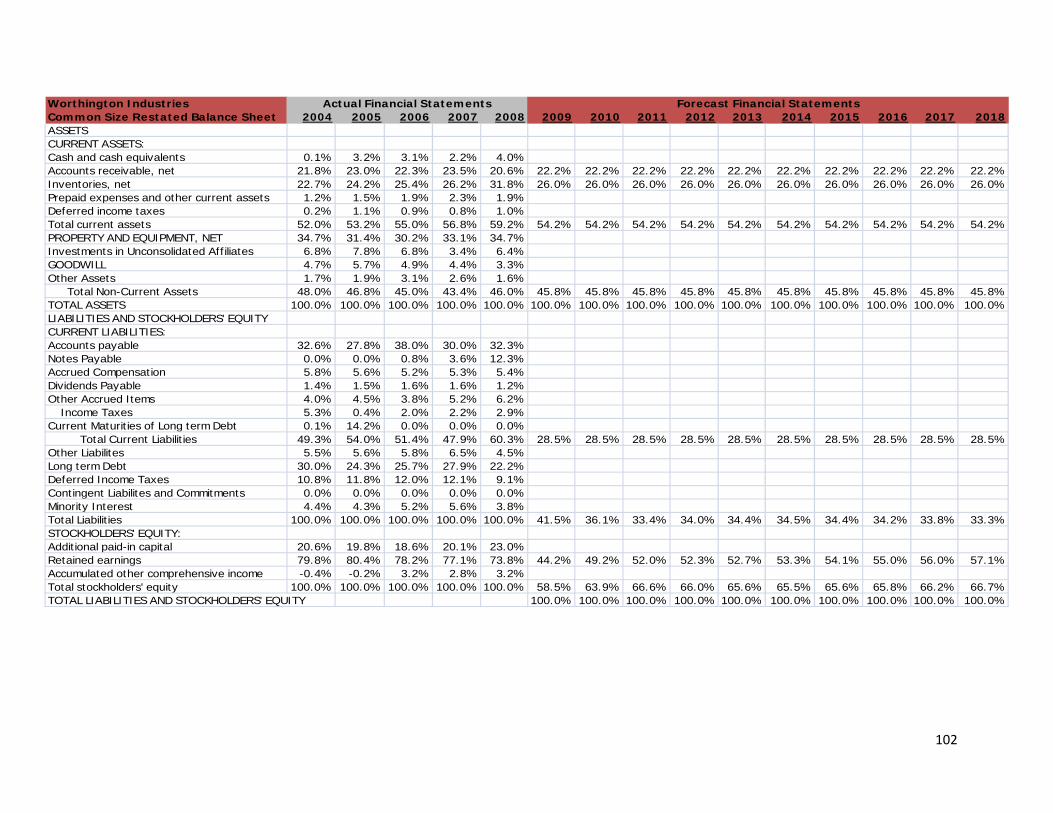
102
Worthington IndustriesCommon Size Restated Balance Sheet 2004 2005 2006 2007 2008 2009 2010 2011 2012 2013 2014 2015 2016 2017 2018ASSETSCURRENT ASSETS:Cash and cash equivalents 0.1% 3.2% 3.1% 2.2% 4.0%Accounts receivable, net 21.8% 23.0% 22.3% 23.5% 20.6% 22.2% 22.2% 22.2% 22.2% 22.2% 22.2% 22.2% 22.2% 22.2% 22.2%Inventories, net 22.7% 24.2% 25.4% 26.2% 31.8% 26.0% 26.0% 26.0% 26.0% 26.0% 26.0% 26.0% 26.0% 26.0% 26.0%Prepaid expenses and other current assets 1.2% 1.5% 1.9% 2.3% 1.9%Deferred income taxes 0.2% 1.1% 0.9% 0.8% 1.0%Total current assets 52.0% 53.2% 55.0% 56.8% 59.2% 54.2% 54.2% 54.2% 54.2% 54.2% 54.2% 54.2% 54.2% 54.2% 54.2%PROPERTY AND EQUIPMENT, NET 34.7% 31.4% 30.2% 33.1% 34.7%Investments in Unconsolidated Affiliates 6.8% 7.8% 6.8% 3.4% 6.4%GOODWILL 4.7% 5.7% 4.9% 4.4% 3.3%Other Assets 1.7% 1.9% 3.1% 2.6% 1.6% Total Non-Current Assets 48.0% 46.8% 45.0% 43.4% 46.0% 45.8% 45.8% 45.8% 45.8% 45.8% 45.8% 45.8% 45.8% 45.8% 45.8%TOTAL ASSETS 100.0% 100.0% 100.0% 100.0% 100.0% 100.0% 100.0% 100.0% 100.0% 100.0% 100.0% 100.0% 100.0% 100.0% 100.0%LIABILITIES AND STOCKHOLDERS' EQUITYCURRENT LIABILITIES:Accounts payable 32.6% 27.8% 38.0% 30.0% 32.3%Notes Payable 0.0% 0.0% 0.8% 3.6% 12.3%Accrued Compensation 5.8% 5.6% 5.2% 5.3% 5.4%Dividends Payable 1.4% 1.5% 1.6% 1.6% 1.2%Other Accrued Items 4.0% 4.5% 3.8% 5.2% 6.2% Income Taxes 5.3% 0.4% 2.0% 2.2% 2.9%Current Maturities of Long term Debt 0.1% 14.2% 0.0% 0.0% 0.0% Total Current Liabilities 49.3% 54.0% 51.4% 47.9% 60.3% 28.5% 28.5% 28.5% 28.5% 28.5% 28.5% 28.5% 28.5% 28.5% 28.5%Other Liabilites 5.5% 5.6% 5.8% 6.5% 4.5%Long term Debt 30.0% 24.3% 25.7% 27.9% 22.2%Deferred Income Taxes 10.8% 11.8% 12.0% 12.1% 9.1%Contingent Liabilites and Commitments 0.0% 0.0% 0.0% 0.0% 0.0%Minority Interest 4.4% 4.3% 5.2% 5.6% 3.8%Total Liabilities 100.0% 100.0% 100.0% 100.0% 100.0% 41.5% 36.1% 33.4% 34.0% 34.4% 34.5% 34.4% 34.2% 33.8% 33.3%STOCKHOLDERS' EQUITY:Additional paid-in capital 20.6% 19.8% 18.6% 20.1% 23.0%Retained earnings 79.8% 80.4% 78.2% 77.1% 73.8% 44.2% 49.2% 52.0% 52.3% 52.7% 53.3% 54.1% 55.0% 56.0% 57.1%Accumulated other comprehensive income -0.4% -0.2% 3.2% 2.8% 3.2%Total stockholders' equity 100.0% 100.0% 100.0% 100.0% 100.0% 58.5% 63.9% 66.6% 66.0% 65.6% 65.5% 65.6% 65.8% 66.2% 66.7%TOTAL LIABILITIES AND STOCKHOLDERS' EQUITY 100.0% 100.0% 100.0% 100.0% 100.0% 100.0% 100.0% 100.0% 100.0% 100.0%
Forecast Financial StatementsActual Financial Statements
103
Statement of Cash Flows:
The final and most difficult financial statement to forecast is the statement of
cash flows. Because cash flows of a firm can be very erratic, it makes estimation
difficult. So, since forecasting cash is difficult to do we will only forecast two line items
from the statement of cash flows. This being cash flows from operating activities and
cash flows from investing activities. Both of these items are necessary in the valuation
process because they determine free cash flows to the firm.
First we forecasted Dividends Paid, this was done by looking at the dividends
paid over the last 5 years and also taking the recent economic crisis into account we
came up with a growth rate of .28%. To forecast the cash flows from operating
activities the CFFO/OI ratio would be the best ratio to link Worthington’s income
statement to their statement of cash flows. We found Worthington’s average CFFO/OI
to be 1.25. By taking this number and multiplying it by Worthington’s operating income
we were able to forecast cash flows from operations over the next ten years.

104
Worthington IndustriesStatement of Cash Flows 2004 2005 2006 2007 2008 2009 2010 2011 2012 2013 2014 2015 2016 2017 2018Net Income 86,752 179,412 145,990 113,905 107,077 113,860 104,751 101,608 102,624 108,782 115,309 122,227 129,561 137,335 145,575Depreciation and amortization 67,302 57,874 59,116 61,469 63,413Restructing Charges, non-Cash 5,169Provision for deferred Income Taxes (22,508) (1,496) (12,645) (3,068) (3,228)Equity in Net Income of affiliates (28,912) (25,351) 702 68,510 (8,539)Impairment Charges 69,398 5,608Minority interest in Net Income of Consolidated Subsdiaries 4,733 8,963 6,088 5,409 6,969Net Loss on Sale of assets (3,127) 2,641 6,079 826 3,756Gain on Sale of Acerex (26,609)Stock Based Compensation 3,480 4,173Excess Tax Benefits- Stock based (2,370) (2,035) Recivables (175,290) (50,661) 11,616 8,312 6,967 Inventories (94,073) (59,236) (33,788) 19,588 (144,474) Prepaid Expenses and other current assets 12,841 (10,195) (9,186) (2,078) 8,252 Other Assets 90 (831) (563) 4,898 (1,546) Accounts Payable and accrued expenses 162,383 (72,933) 79,114 (99,283) 138,822 Other Liabilities (222) (1,524) 1,152 833 (4,255)Net Cash provided by Operating Activities 79,367 32,271 227,066 180,431 180,521 198,656 182,764 177,281 179,054 189,797 201,185 213,256 226,051 239,614 253,991Net Cash used in Investing Activities (24,427) (23,449) (37,683) (95,570) (70,756) (60,143) (55,331) (53,671) (54,208) (57,460) (60,908) (64,563) (68,436) (72,542) (76,895) Dividends Paid (55,167) (56,891) (59,982) (59,018) (55,587) (55,745) (55,904) (56,063) (56,222) (56,382) (56,542) (56,703) (56,864) (57,026) (57,188)Net Cash provided by Financing Activities (54,102) (57,249) (190,416) (102,800) (74,270)
Forecast Financial StatementsActual Financial Statements
105
Cost of Financing (Ke, Kd & WACC)
Cost of Equity (Ke):
The cost of equity (Ke) is the required rate of return demanded by the
shareholders of the firm. This number is important in valuing a firm because it to
calculate the cost of equity for Worthington we will use the Capital Asset Pricing Model
or CAPM. CAPM estimates a firms cost of equity by adding the current risk free rate to
the firm’s beta times the current market risk premium. The risk free rate most often
used in the United States is the U.S. Treasury bill rate. The firm’s Beta is the measure
of systematic risk, while the market risk premium is the rate above the risk free rate
that is required by investors.
Estimating Beta:
In order to properly value a firm one must calculate a firm’s beta rather than rely
on the published beta on Yahoo. The reason for not using the published beta is
because Yahoo! Finance does not disclose their methodology in regards to beta
estimates. Therefore we must calculate Worthington’s beta manually in order to control
and fully understand the assumptions of beta. We used regression analysis to calculate
beta by regressing Worthington’s monthly return (y-variable) to the market-risk
premium (x-variable). For our analysis we ran 25 regressions using 3-month, 2-year, 5-
year, 7-year and 10-year Treasury rates over periods of 72, 60, 48 and 24 Months. The
reason for running multiple regressions over different time periods is to find the beta
that gives us the highest explanation of the firm’s systematic risk, which is shown by
the adjusted r squared in the regressions.
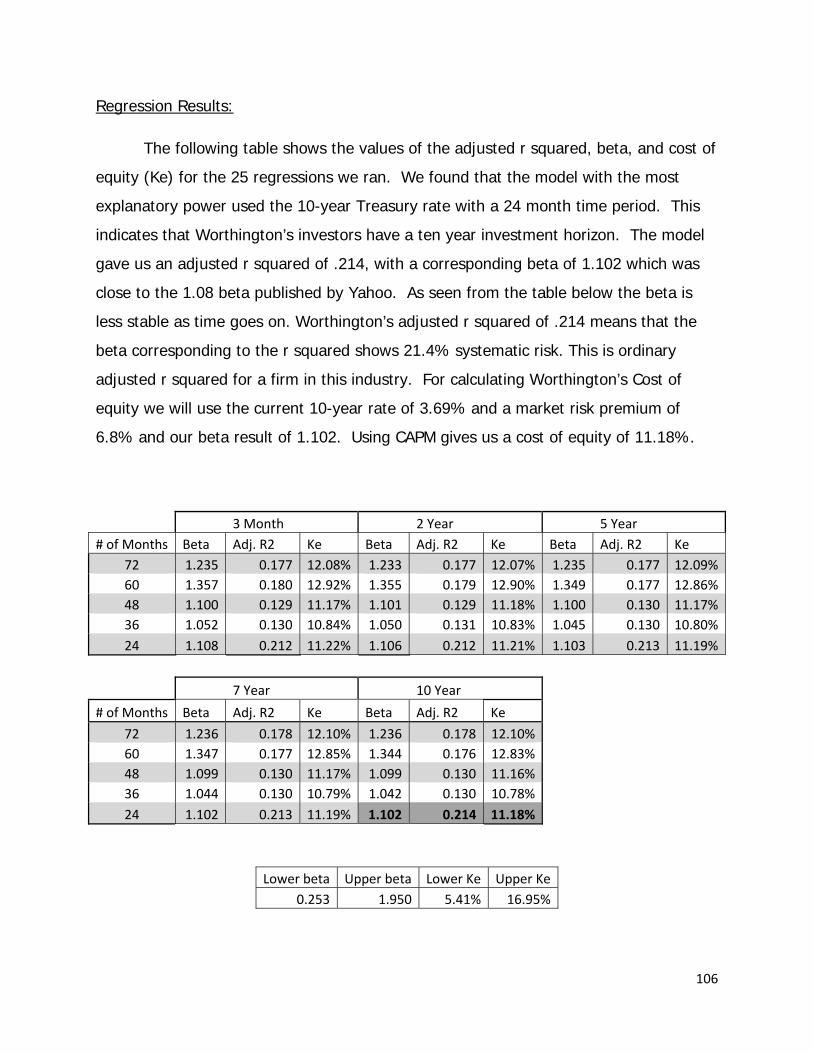
106
Regression Results:
The following table shows the values of the adjusted r squared, beta, and cost of
equity (Ke) for the 25 regressions we ran. We found that the model with the most
explanatory power used the 10-year Treasury rate with a 24 month time period. This
indicates that Worthington’s investors have a ten year investment horizon. The model
gave us an adjusted r squared of .214, with a corresponding beta of 1.102 which was
close to the 1.08 beta published by Yahoo. As seen from the table below the beta is
less stable as time goes on. Worthington’s adjusted r squared of .214 means that the
beta corresponding to the r squared shows 21.4% systematic risk. This is ordinary
adjusted r squared for a firm in this industry. For calculating Worthington’s Cost of
equity we will use the current 10-year rate of 3.69% and a market risk premium of
6.8% and our beta result of 1.102. Using CAPM gives us a cost of equity of 11.18%.
3 Month 2 Year 5 Year # of Months Beta Adj. R2 Ke Beta Adj. R2 Ke Beta Adj. R2 Ke
72 1.235 0.177 12.08% 1.233 0.177 12.07% 1.235 0.177 12.09%60 1.357 0.180 12.92% 1.355 0.179 12.90% 1.349 0.177 12.86%48 1.100 0.129 11.17% 1.101 0.129 11.18% 1.100 0.130 11.17%36 1.052 0.130 10.84% 1.050 0.131 10.83% 1.045 0.130 10.80%24 1.108 0.212 11.22% 1.106 0.212 11.21% 1.103 0.213 11.19%
7 Year 10 Year
# of Months Beta Adj. R2 Ke Beta Adj. R2 Ke
72 1.236 0.178 12.10% 1.236 0.178 12.10% 60 1.347 0.177 12.85% 1.344 0.176 12.83% 48 1.099 0.130 11.17% 1.099 0.130 11.16% 36 1.044 0.130 10.79% 1.042 0.130 10.78% 24 1.102 0.213 11.19% 1.102 0.214 11.18%
Lower beta Upper beta Lower Ke Upper Ke0.253 1.950 5.41% 16.95%
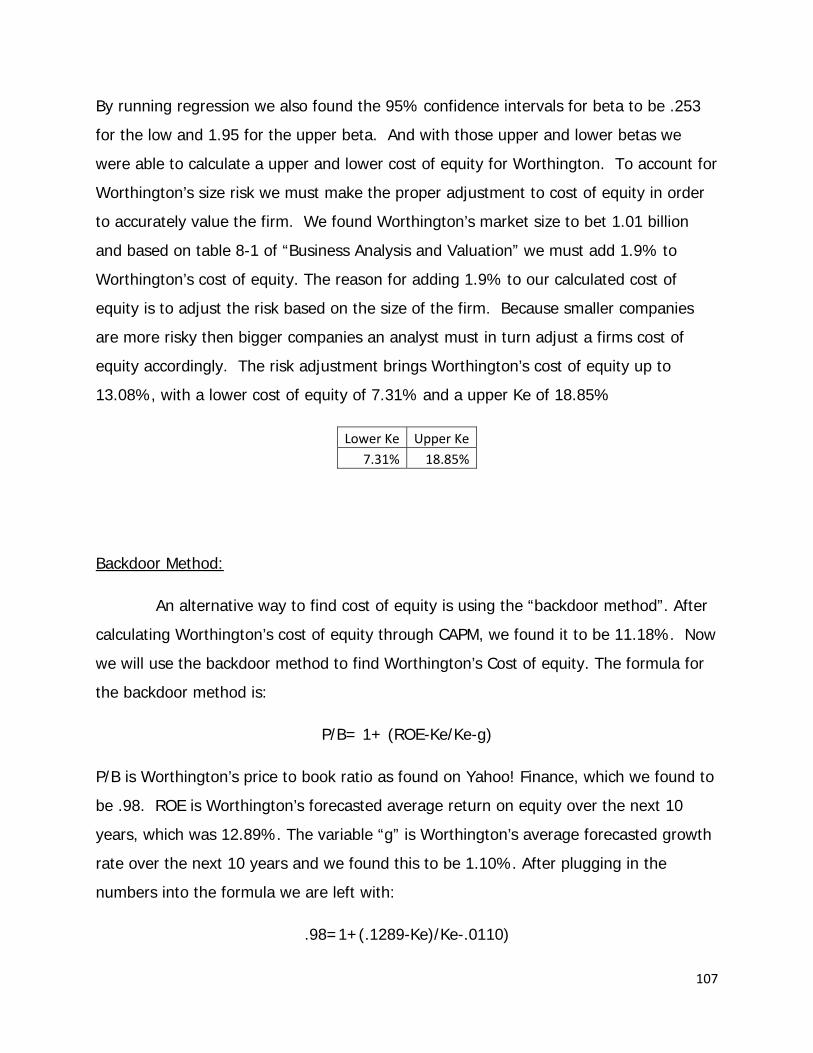
107
By running regression we also found the 95% confidence intervals for beta to be .253
for the low and 1.95 for the upper beta. And with those upper and lower betas we
were able to calculate a upper and lower cost of equity for Worthington. To account for
Worthington’s size risk we must make the proper adjustment to cost of equity in order
to accurately value the firm. We found Worthington’s market size to bet 1.01 billion
and based on table 8-1 of “Business Analysis and Valuation” we must add 1.9% to
Worthington’s cost of equity. The reason for adding 1.9% to our calculated cost of
equity is to adjust the risk based on the size of the firm. Because smaller companies
are more risky then bigger companies an analyst must in turn adjust a firms cost of
equity accordingly. The risk adjustment brings Worthington’s cost of equity up to
13.08%, with a lower cost of equity of 7.31% and a upper Ke of 18.85%
Lower Ke Upper Ke7.31% 18.85%
Backdoor Method:
An alternative way to find cost of equity is using the “backdoor method”. After
calculating Worthington’s cost of equity through CAPM, we found it to be 11.18%. Now
we will use the backdoor method to find Worthington’s Cost of equity. The formula for
the backdoor method is:
P/B= 1+ (ROE-Ke/Ke-g)
P/B is Worthington’s price to book ratio as found on Yahoo! Finance, which we found to
be .98. ROE is Worthington’s forecasted average return on equity over the next 10
years, which was 12.89%. The variable “g” is Worthington’s average forecasted growth
rate over the next 10 years and we found this to be 1.10%. After plugging in the
numbers into the formula we are left with:
.98=1+(.1289-Ke)/Ke-.0110)

108
And after using basic algebra we calculated Worthington’s cost of equity to be 13.18%
using the alternative backdoor method. This is very close to the CAPM estimation of
Worthington’s cost of equity of 13.08%
Cost of Debt (Kd):
The cost of debt is the rate at which a firm must pay on borrowed funds. Also,
because debt holders are paid before equity holders, it costs more for equity holders
than debt holders because of the risk of defaulting.
To calculate cost of debt, you find the weighted average of each liability item
on the balance sheet and then multiple the weight by the corresponding interest rate.
The interest rate we used for accounts payable, dividends payable, and other accrued
items was the current commercial paper rate for nonfinancial firms of 2.11%. We used
the 2 month commercial paper rate for nonfinancial firms found on the St. Louis Fed
website. We chose the two month rate because it matched up with Worthington’s 60
day collection. Worthington stated their notes payable rate on the 10-K as 3.16%. For
the Accrued Compensation and contributions to employees benefit plan we used a
6.82%, as stated on Worthington’s 10-K. Now for the income taxes and deferred
income taxes we used the current 10-year risk-free rate of 3.69%. Last we computed
Worthington’s average long term debt rate and found it to be 6.11% which was found
by adding the weighted rates due at 2010 and 2014(shown in the next table). After
adding all the weighted rates together we came up with a weighted average cost of
debt for Worthington of 3.75%.
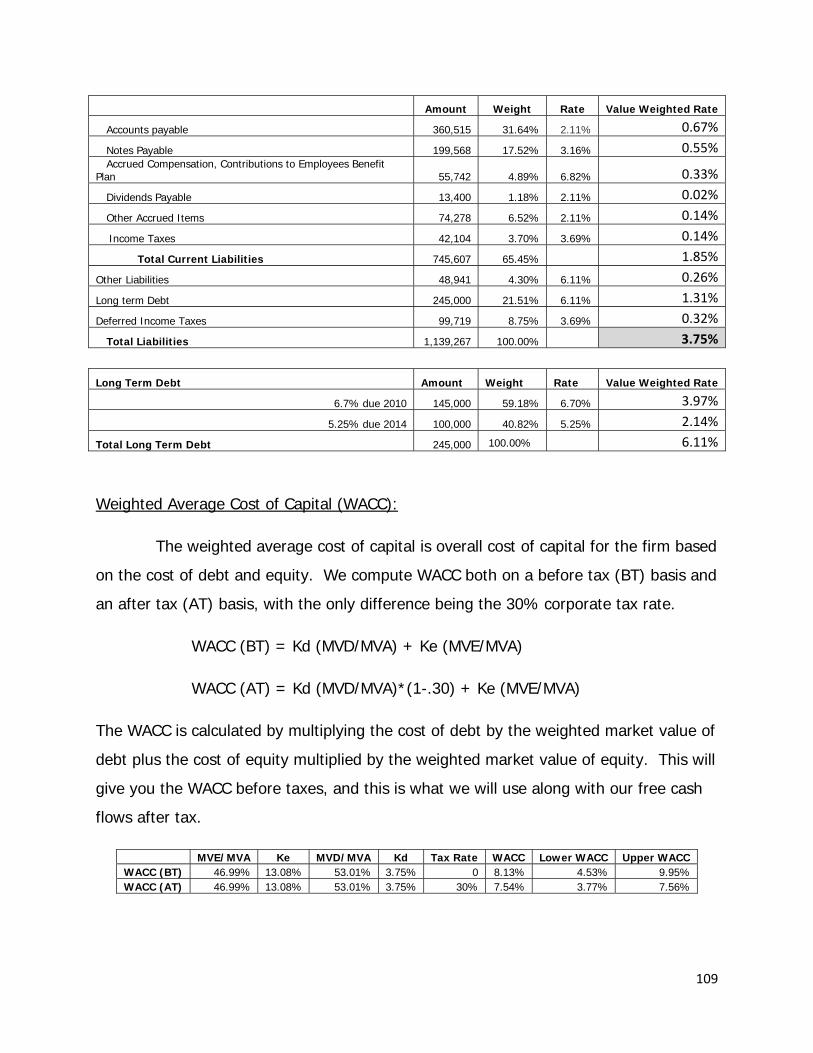
109
Amount Weight Rate Value Weighted Rate
Accounts payable 360,515 31.64% 2.11% 0.67%
Notes Payable 199,568 17.52% 3.16% 0.55%Accrued Compensation, Contributions to Employees Benefit
Plan 55,742 4.89% 6.82% 0.33%
Dividends Payable 13,400 1.18% 2.11% 0.02%
Other Accrued Items 74,278 6.52% 2.11% 0.14%
Income Taxes 42,104 3.70% 3.69% 0.14%
Total Current Liabilities 745,607 65.45% 1.85%
Other Liabilities 48,941 4.30% 6.11% 0.26%
Long term Debt 245,000 21.51% 6.11% 1.31%
Deferred Income Taxes 99,719 8.75% 3.69% 0.32%
Total Liabilities 1,139,267 100.00% 3.75%
Long Term Debt Amount Weight Rate Value Weighted Rate
6.7% due 2010 145,000 59.18% 6.70% 3.97%
5.25% due 2014 100,000 40.82% 5.25% 2.14%
Total Long Term Debt 245,000 100.00% 6.11%
Weighted Average Cost of Capital (WACC):
The weighted average cost of capital is overall cost of capital for the firm based
on the cost of debt and equity. We compute WACC both on a before tax (BT) basis and
an after tax (AT) basis, with the only difference being the 30% corporate tax rate.
WACC (BT) = Kd (MVD/MVA) + Ke (MVE/MVA)
WACC (AT) = Kd (MVD/MVA)*(1-.30) + Ke (MVE/MVA)
The WACC is calculated by multiplying the cost of debt by the weighted market value of
debt plus the cost of equity multiplied by the weighted market value of equity. This will
give you the WACC before taxes, and this is what we will use along with our free cash
flows after tax.
MVE/MVA Ke MVD/MVA Kd Tax Rate WACC Lower WACC Upper WACC WACC (BT) 46.99% 13.08% 53.01% 3.75% 0 8.13% 4.53% 9.95% WACC (AT) 46.99% 13.08% 53.01% 3.75% 30% 7.54% 3.77% 7.56%
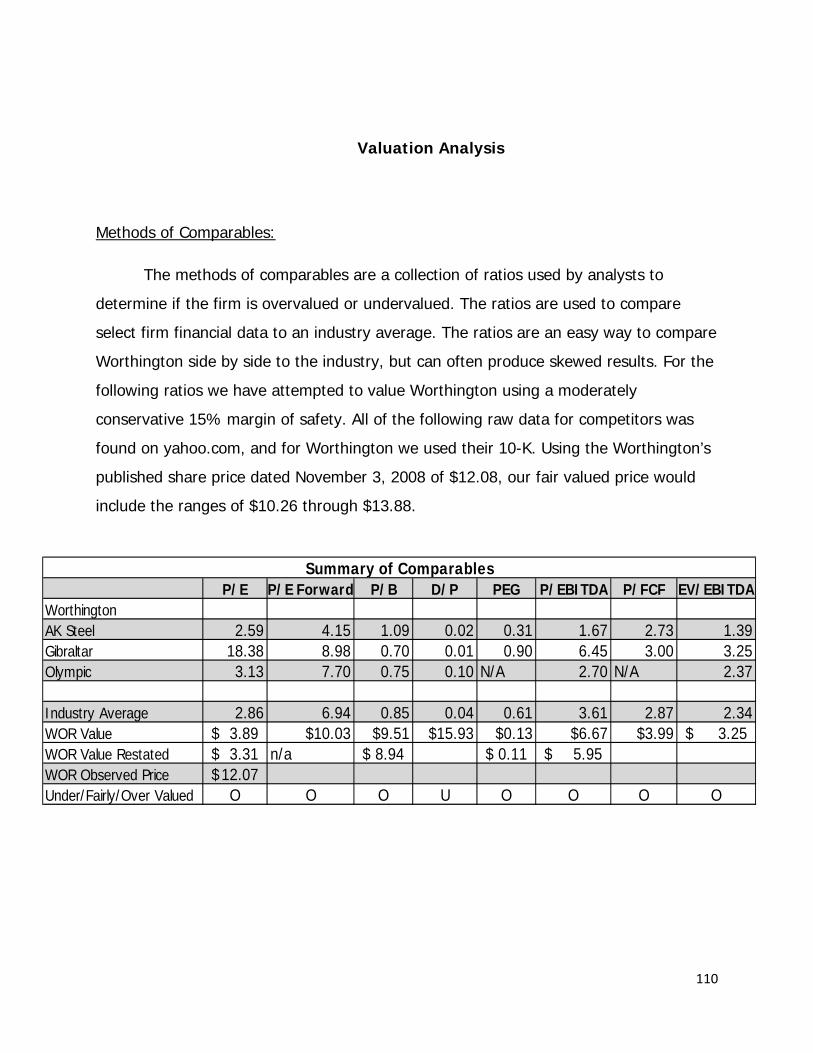
110
Valuation Analysis
Methods of Comparables:
The methods of comparables are a collection of ratios used by analysts to
determine if the firm is overvalued or undervalued. The ratios are used to compare
select firm financial data to an industry average. The ratios are an easy way to compare
Worthington side by side to the industry, but can often produce skewed results. For the
following ratios we have attempted to value Worthington using a moderately
conservative 15% margin of safety. All of the following raw data for competitors was
found on yahoo.com, and for Worthington we used their 10-K. Using the Worthington’s
published share price dated November 3, 2008 of $12.08, our fair valued price would
include the ranges of $10.26 through $13.88.
P/E P/E Forward P/B D/P PEG P/EBITDA P/FCF EV/EBITDAWorthingtonAK Steel 2.59 4.15 1.09 0.02 0.31 1.67 2.73 1.39Gibraltar 18.38 8.98 0.70 0.01 0.90 6.45 3.00 3.25Olympic 3.13 7.70 0.75 0.10 N/A 2.70 N/A 2.37
Industry Average 2.86 6.94 0.85 0.04 0.61 3.61 2.87 2.34WOR Value 3.89$ $10.03 $9.51 $15.93 $0.13 $6.67 $3.99 3.25$ WOR Value Restated 3.31$ n/a 8.94$ 0.11$ 5.95$ WOR Observed Price 12.07$ Under/Fairly/Over Valued O O O U O O O O
Summary of Comparables
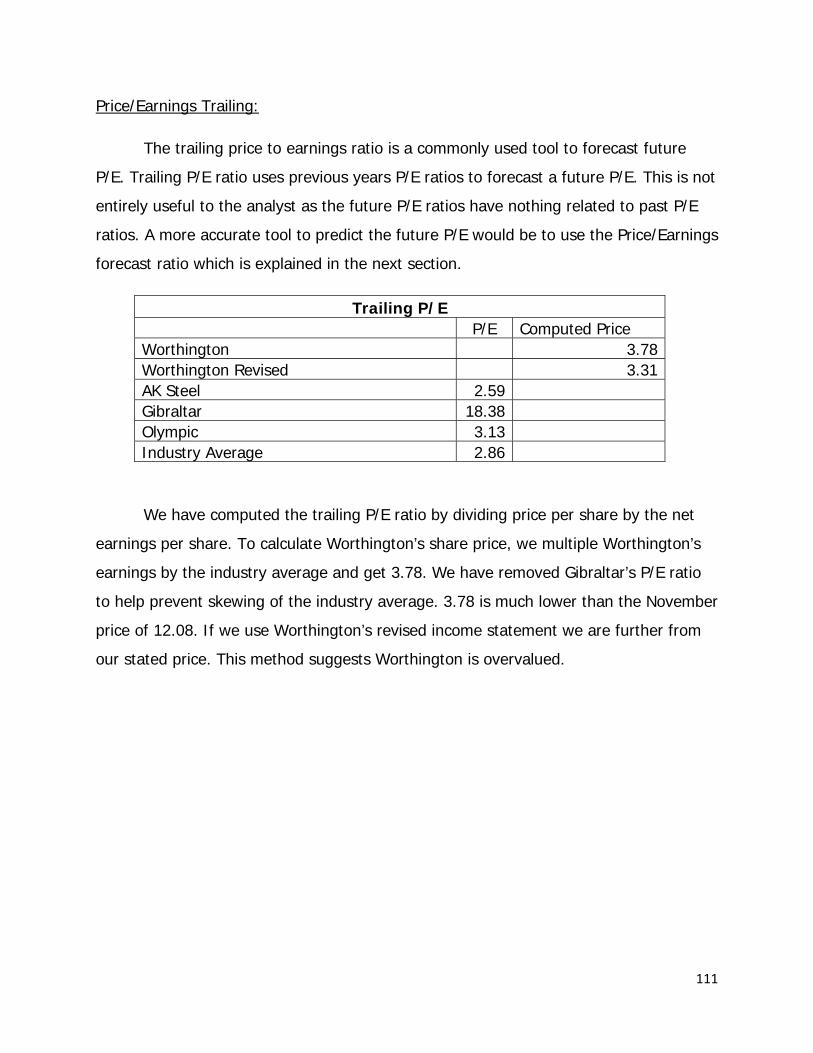
111
Price/Earnings Trailing:
The trailing price to earnings ratio is a commonly used tool to forecast future
P/E. Trailing P/E ratio uses previous years P/E ratios to forecast a future P/E. This is not
entirely useful to the analyst as the future P/E ratios have nothing related to past P/E
ratios. A more accurate tool to predict the future P/E would be to use the Price/Earnings
forecast ratio which is explained in the next section.
Trailing P/E P/E Computed Price Worthington 3.78Worthington Revised 3.31AK Steel 2.59 Gibraltar 18.38 Olympic 3.13 Industry Average 2.86
We have computed the trailing P/E ratio by dividing price per share by the net
earnings per share. To calculate Worthington’s share price, we multiple Worthington’s
earnings by the industry average and get 3.78. We have removed Gibraltar’s P/E ratio
to help prevent skewing of the industry average. 3.78 is much lower than the November
price of 12.08. If we use Worthington’s revised income statement we are further from
our stated price. This method suggests Worthington is overvalued.
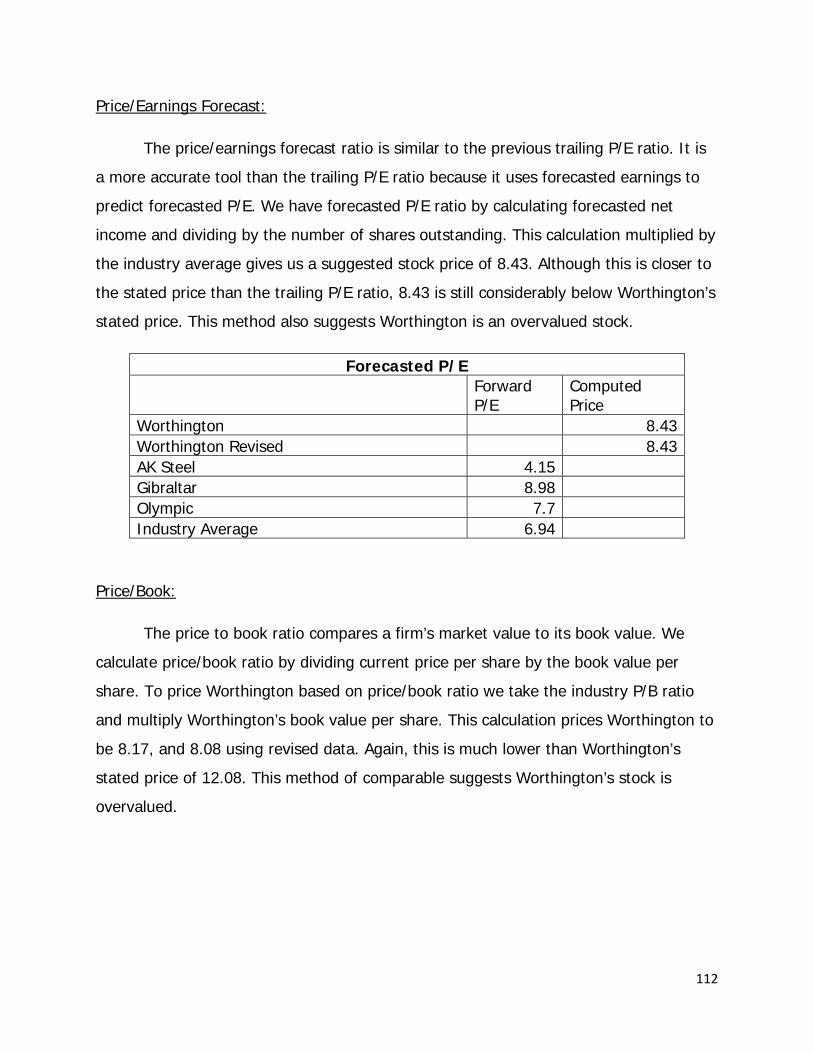
112
Price/Earnings Forecast:
The price/earnings forecast ratio is similar to the previous trailing P/E ratio. It is
a more accurate tool than the trailing P/E ratio because it uses forecasted earnings to
predict forecasted P/E. We have forecasted P/E ratio by calculating forecasted net
income and dividing by the number of shares outstanding. This calculation multiplied by
the industry average gives us a suggested stock price of 8.43. Although this is closer to
the stated price than the trailing P/E ratio, 8.43 is still considerably below Worthington’s
stated price. This method also suggests Worthington is an overvalued stock.
Forecasted P/E
Forward P/E
Computed Price
Worthington 8.43Worthington Revised 8.43AK Steel 4.15 Gibraltar 8.98 Olympic 7.7 Industry Average 6.94
Price/Book:
The price to book ratio compares a firm’s market value to its book value. We
calculate price/book ratio by dividing current price per share by the book value per
share. To price Worthington based on price/book ratio we take the industry P/B ratio
and multiply Worthington’s book value per share. This calculation prices Worthington to
be 8.17, and 8.08 using revised data. Again, this is much lower than Worthington’s
stated price of 12.08. This method of comparable suggests Worthington’s stock is
overvalued.

113
Price to Book Ratio P/B Computed Price Worthington 8.17Worthington Revised 8.08AK Steel 1.09 Gibraltar 0.7 Olympic 0.75 Industry Average 0.85
Price Earnings Growth (P.E.G.):
P.E.G. Ratio PEG Computed Price Worthington 0.13 Worthington Revised 0.17 AK Steel 0.31 Gibraltar 0.9 Olympic N/A Industry Average 0.61
Growth Rate = .016
The P.E.G. ratio is calculated by dividing the P/E ratio by a logical growth
rate. This method of comparable allows analysts to price a firm’s stock based on the
growth rate of future earnings. A logical growth rate for Worthington was calculated to
be .016. We obtained this calculation by dividing Worthington’s P/E ratio by their
expected five year growth. We then multiplied this calculation by the industry average
to price Worthington’s stock at only .13, or .17 using revised numbers. We didn’t have
any extreme P.E.G. ratios that would skew our average, however Olympic Steel did not
report enough information for us to calculate their P.E.G. ratio. This comparable
suggests that Worthington’s stock is extremely overvalued at 12.08.

114
Price/EBITDA:
Analysts obtain the price/EBITDA ratio by taking the market capitalization rate
and dividing it by earnings before interest, taxes, depreciation, and amortization. After
finding the Price/EBITDA for Worthington’s competitors, we multiplied the industry
average by Worthington’s EBITDA and obtained a price of 5.53. Although Gibraltar’s
P/EBITDA ratio was slightly higher than others, we felt it was still relevant in computing
the industry average. Even with this higher industry average the 5.53 computed price
falls well short of Worthington’s November stated price.
Price/EBITDA
P/EBITDA Computed Price
Worthington 5.53
Worthington Revised 5.53
AK Steel 1.67
Gibraltar 6.45
Olympic 2.7
Industry Average 3.61
EV/EBITDA:
The enterprise value/EBITDA has an advantage over using P/E ratios—it ignores
the capital structure of a firm, thus leveling out the playing field. Firms value debt
differently and it can be difficult to compare. We have computed enterprise value by
taking book value of liabilities minus cash and investments and adding it to the market
value of equity. We then divide this enterprise value by EBITDA. After calculating this
ratio for our competitors we compute an industry average and use this to price
Worthington at -8.08. The negative stock price is due to Worthington’s sum of cash and

115
investments totaling greater than their book value of liabilities. This is obviously a poor
method of comparing in this industry.
EV/EBITDA
EV/EBITDAComputed Price
Worthington -8.08 Worthington Revised -8.08 AK Steel 1.39 Gibraltar 3.25 Olypmic 2.37 Industry Average 2.34
Price to Free Cash Flows:
The price to free cash flows ratio measures how easily a firm’s cash flows can
support its equity value. It is calculated by dividing the market capitalization by the
firm’s cash flows. After we calculated and found an industry average for our
competitors, we then multiply the average by Worthington’s free cash flows to price
Worthington at -1.07. This negative is due to Worthington paying off some of its debt in
2008, causing a negative cash flow. This is another example of how these methods of
comparables can sometimes give an inaccurate view on a firm and needs to be studied
in context.
Price/FCF Ratio P/FCF Computed Price Worthington -1.07 Worthington Revised -1.07 AK Steel 2.73 Gibraltar 3 Olympic N/A Industry Average 2.87
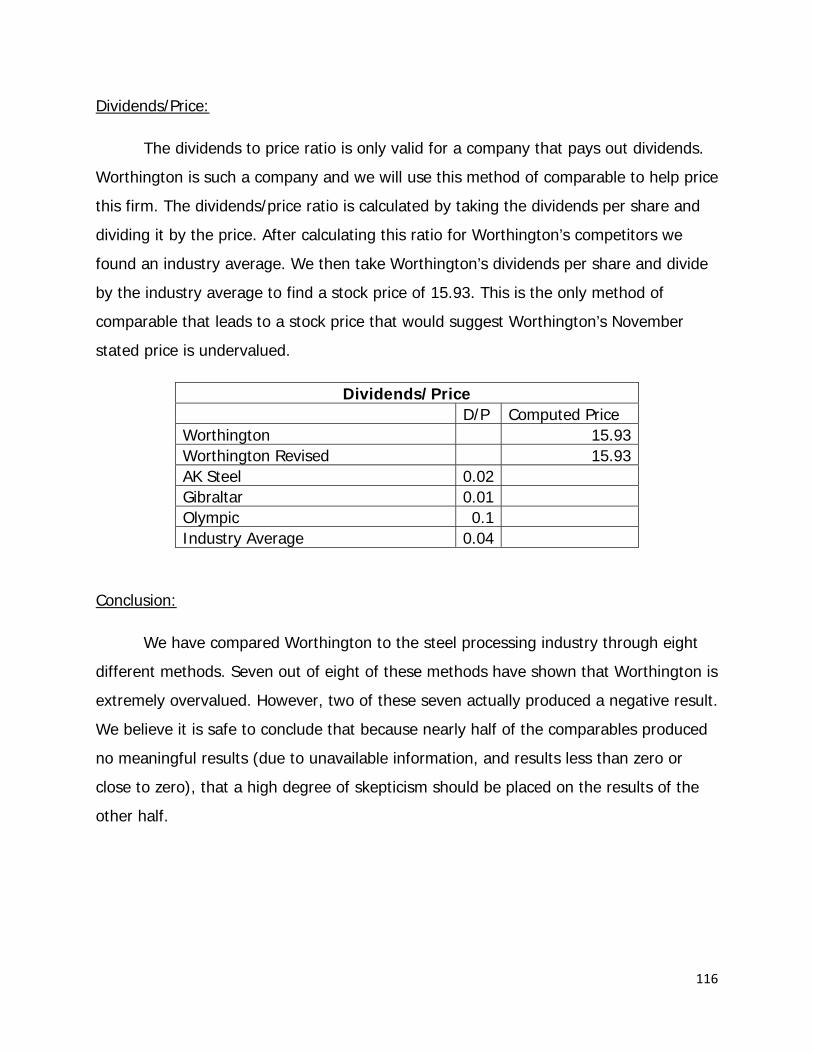
116
Dividends/Price:
The dividends to price ratio is only valid for a company that pays out dividends.
Worthington is such a company and we will use this method of comparable to help price
this firm. The dividends/price ratio is calculated by taking the dividends per share and
dividing it by the price. After calculating this ratio for Worthington’s competitors we
found an industry average. We then take Worthington’s dividends per share and divide
by the industry average to find a stock price of 15.93. This is the only method of
comparable that leads to a stock price that would suggest Worthington’s November
stated price is undervalued.
Dividends/Price D/P Computed Price Worthington 15.93 Worthington Revised 15.93 AK Steel 0.02 Gibraltar 0.01 Olympic 0.1 Industry Average 0.04
Conclusion:
We have compared Worthington to the steel processing industry through eight
different methods. Seven out of eight of these methods have shown that Worthington is
extremely overvalued. However, two of these seven actually produced a negative result.
We believe it is safe to conclude that because nearly half of the comparables produced
no meaningful results (due to unavailable information, and results less than zero or
close to zero), that a high degree of skepticism should be placed on the results of the
other half.
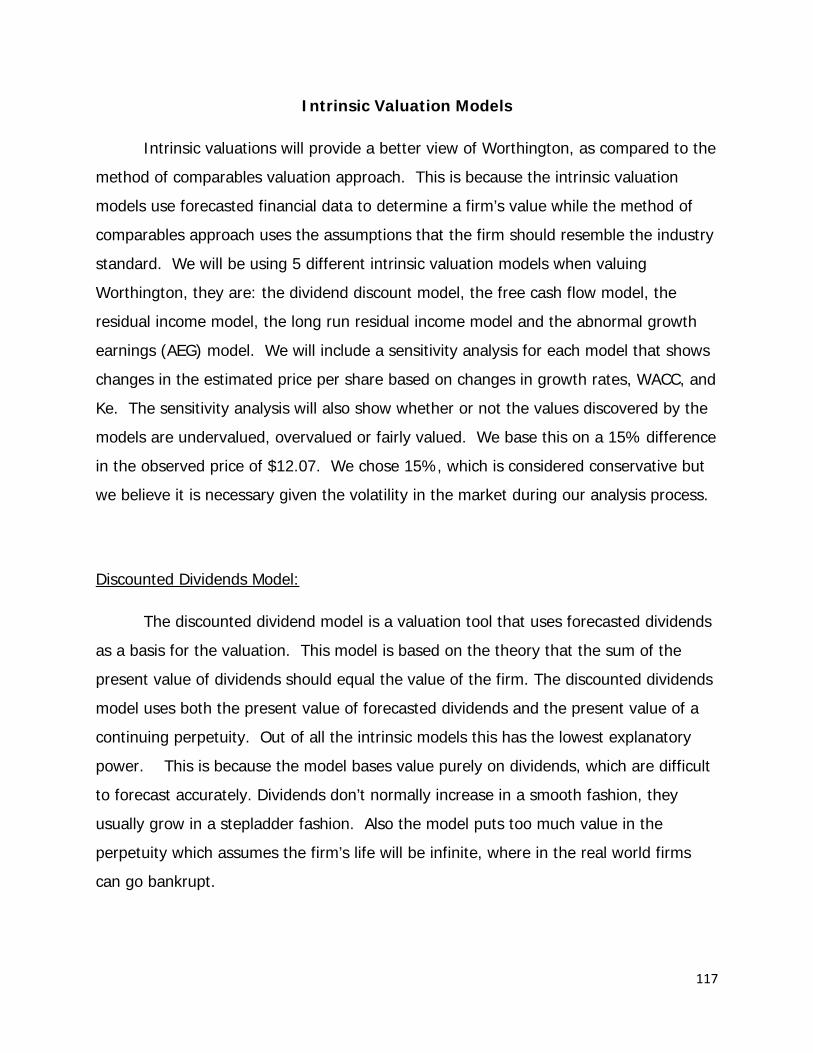
117
Intrinsic Valuation Models
Intrinsic valuations will provide a better view of Worthington, as compared to the
method of comparables valuation approach. This is because the intrinsic valuation
models use forecasted financial data to determine a firm’s value while the method of
comparables approach uses the assumptions that the firm should resemble the industry
standard. We will be using 5 different intrinsic valuation models when valuing
Worthington, they are: the dividend discount model, the free cash flow model, the
residual income model, the long run residual income model and the abnormal growth
earnings (AEG) model. We will include a sensitivity analysis for each model that shows
changes in the estimated price per share based on changes in growth rates, WACC, and
Ke. The sensitivity analysis will also show whether or not the values discovered by the
models are undervalued, overvalued or fairly valued. We base this on a 15% difference
in the observed price of $12.07. We chose 15%, which is considered conservative but
we believe it is necessary given the volatility in the market during our analysis process.
Discounted Dividends Model:
The discounted dividend model is a valuation tool that uses forecasted dividends
as a basis for the valuation. This model is based on the theory that the sum of the
present value of dividends should equal the value of the firm. The discounted dividends
model uses both the present value of forecasted dividends and the present value of a
continuing perpetuity. Out of all the intrinsic models this has the lowest explanatory
power. This is because the model bases value purely on dividends, which are difficult
to forecast accurately. Dividends don’t normally increase in a smooth fashion, they
usually grow in a stepladder fashion. Also the model puts too much value in the
perpetuity which assumes the firm’s life will be infinite, where in the real world firms
can go bankrupt.
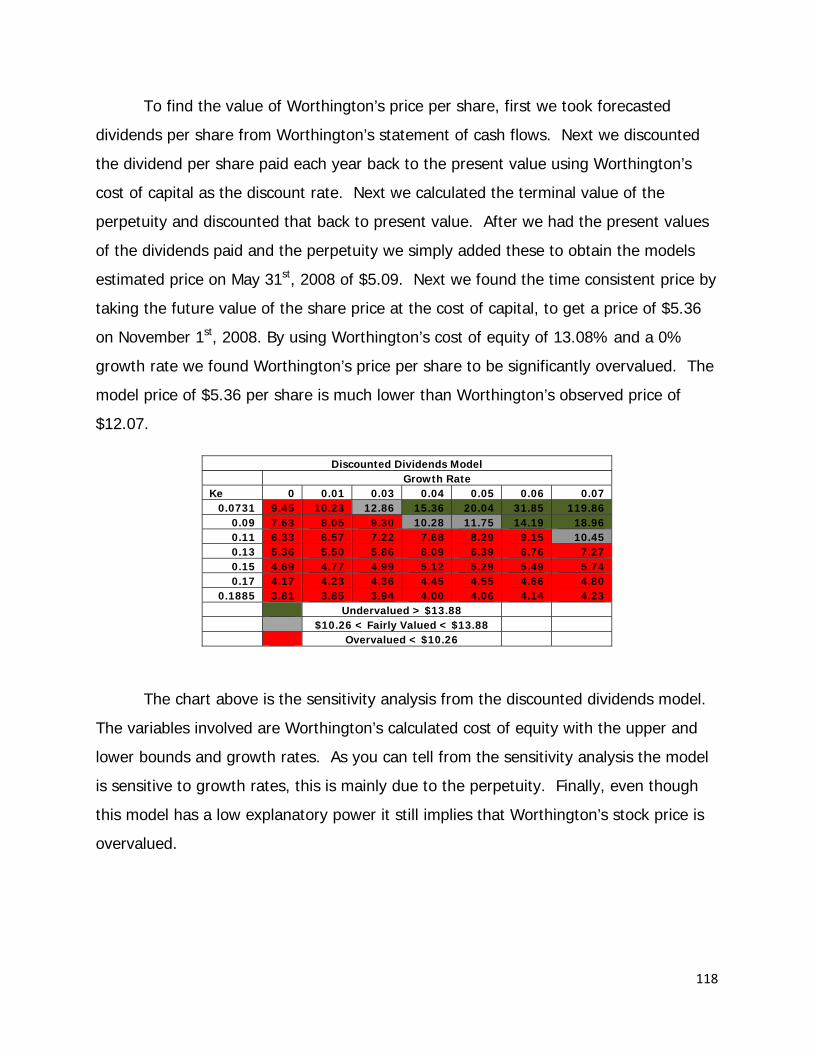
118
To find the value of Worthington’s price per share, first we took forecasted
dividends per share from Worthington’s statement of cash flows. Next we discounted
the dividend per share paid each year back to the present value using Worthington’s
cost of capital as the discount rate. Next we calculated the terminal value of the
perpetuity and discounted that back to present value. After we had the present values
of the dividends paid and the perpetuity we simply added these to obtain the models
estimated price on May 31st, 2008 of $5.09. Next we found the time consistent price by
taking the future value of the share price at the cost of capital, to get a price of $5.36
on November 1st, 2008. By using Worthington’s cost of equity of 13.08% and a 0%
growth rate we found Worthington’s price per share to be significantly overvalued. The
model price of $5.36 per share is much lower than Worthington’s observed price of
$12.07.
Discounted Dividends Model Growth Rate Ke 0 0.01 0.03 0.04 0.05 0.06 0.07
0.0731 9.45 10.23 12.86 15.36 20.04 31.85 119.86 0.09 7.63 8.05 9.30 10.28 11.75 14.19 18.96 0.11 6.33 6.57 7.22 7.68 8.29 9.15 10.45 0.13 5.36 5.50 5.86 6.09 6.39 6.76 7.27 0.15 4.69 4.77 4.99 5.12 5.29 5.49 5.74 0.17 4.17 4.23 4.36 4.45 4.55 4.66 4.80
0.1885 3.81 3.85 3.94 4.00 4.06 4.14 4.23 Undervalued > $13.88 $10.26 < Fairly Valued < $13.88 Overvalued < $10.26
The chart above is the sensitivity analysis from the discounted dividends model.
The variables involved are Worthington’s calculated cost of equity with the upper and
lower bounds and growth rates. As you can tell from the sensitivity analysis the model
is sensitive to growth rates, this is mainly due to the perpetuity. Finally, even though
this model has a low explanatory power it still implies that Worthington’s stock price is
overvalued.
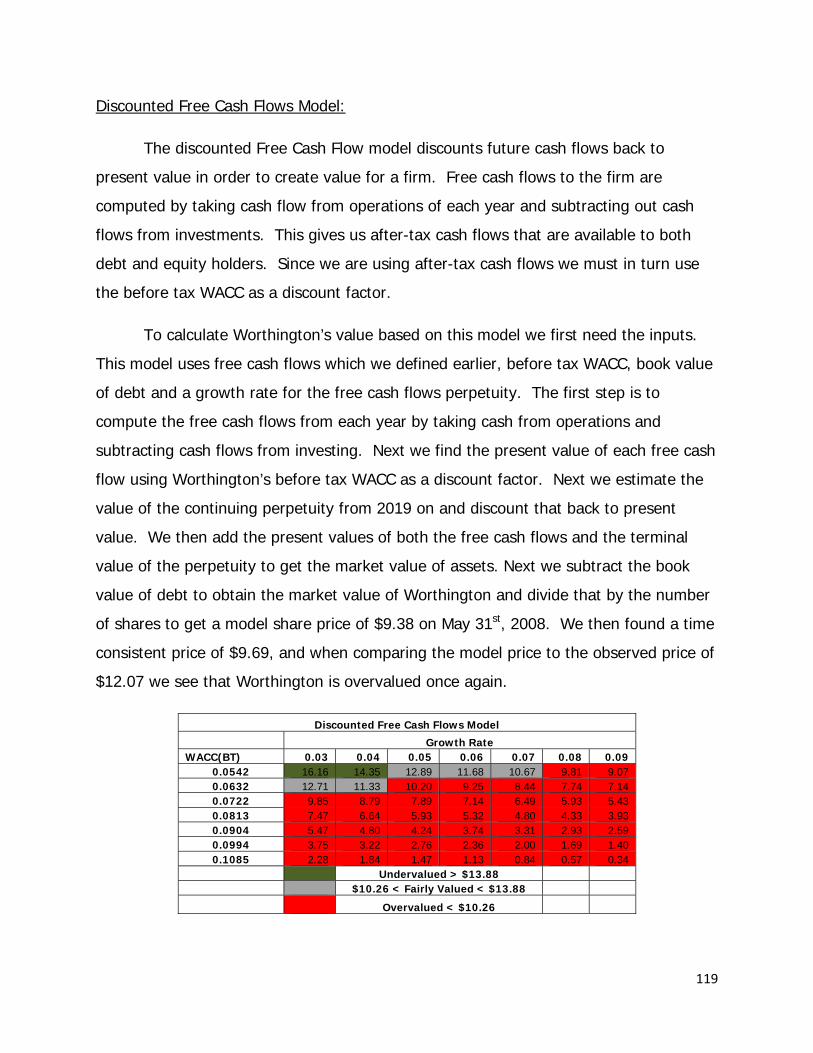
119
Discounted Free Cash Flows Model:
The discounted Free Cash Flow model discounts future cash flows back to
present value in order to create value for a firm. Free cash flows to the firm are
computed by taking cash flow from operations of each year and subtracting out cash
flows from investments. This gives us after-tax cash flows that are available to both
debt and equity holders. Since we are using after-tax cash flows we must in turn use
the before tax WACC as a discount factor.
To calculate Worthington’s value based on this model we first need the inputs.
This model uses free cash flows which we defined earlier, before tax WACC, book value
of debt and a growth rate for the free cash flows perpetuity. The first step is to
compute the free cash flows from each year by taking cash from operations and
subtracting cash flows from investing. Next we find the present value of each free cash
flow using Worthington’s before tax WACC as a discount factor. Next we estimate the
value of the continuing perpetuity from 2019 on and discount that back to present
value. We then add the present values of both the free cash flows and the terminal
value of the perpetuity to get the market value of assets. Next we subtract the book
value of debt to obtain the market value of Worthington and divide that by the number
of shares to get a model share price of $9.38 on May 31st, 2008. We then found a time
consistent price of $9.69, and when comparing the model price to the observed price of
$12.07 we see that Worthington is overvalued once again.
Discounted Free Cash Flows Model
Growth Rate WACC(BT) 0.03 0.04 0.05 0.06 0.07 0.08 0.09
0.0542 16.16 14.35 12.89 11.68 10.67 9.81 9.07 0.0632 12.71 11.33 10.20 9.25 8.44 7.74 7.14 0.0722 9.85 8.79 7.89 7.14 6.49 5.93 5.43 0.0813 7.47 6.64 5.93 5.32 4.80 4.33 3.93 0.0904 5.47 4.80 4.24 3.74 3.31 2.93 2.59 0.0994 3.75 3.22 2.76 2.36 2.00 1.69 1.40 0.1085 2.28 1.84 1.47 1.13 0.84 0.57 0.34
Undervalued > $13.88 $10.26 < Fairly Valued < $13.88
Overvalued < $10.26

120
Above is the sensitivity analysis of the discounted free cash flow model. The
variables in the analysis are the growth rate and the before tax WACC of Worthington.
As you can see from the chart most of the inputs find Worthington’s price to be
overvalued. We base whether or not the value of the firm is over or under valued on a
15% difference in observed share price.
Residual Income Model:
The residual income model is the most accurate of the intrinsic valuation models
because it provides the largest adjusted R squared compared to the other models. Like
the other models the residual income model discounts cash flows in order to compute a
firm’s value. The cash flow used for this model is residual income, which is the amount
of income that a firm gains minus the firm’s benchmark earnings that a firm should
earn given its cost of equity. The present value of these residual earnings will provide
an intrinsic value for a firm. Inputs used for this model include: book value of equity,
cost of equity, forecasted earnings, forecasted dividends and a perpetuity growth rate.
To value Worthington using the residual income model first you must find
residual income for each year. This is done by subtracting the benchmark forecasted
income from the forecasted net income for each year. We computed Worthington’s
benchmark income by taking their previous year’s equity and multiplying it by
Worthington’s cost of equity. For year 2009 we calculated a benchmark income of $115
million by taking year 2008 book value of equity of $885 million and multiplying it by
13.08%. As seen in the model, Worthington’s forecasted net income was $1.9 million
less than their benchmark. This tells us that based on our forecast and cost of equity
we derived, Worthington is destroying value because they are not meeting their
benchmark earnings. Over the next 9 years Worthington continues to underperformed
their benchmark and in turn destroy firm value.
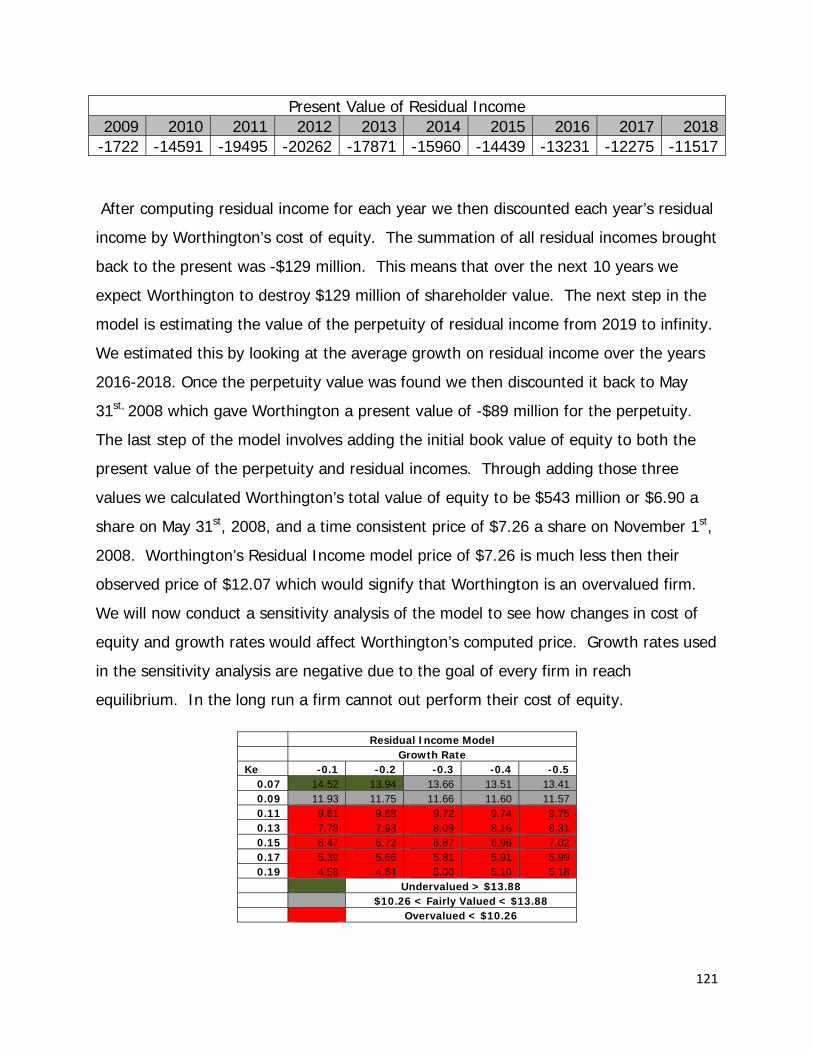
121
Present Value of Residual Income 2009 2010 2011 2012 2013 2014 2015 2016 2017 2018
-1722 -14591 -19495 -20262 -17871 -15960 -14439 -13231 -12275 -11517
After computing residual income for each year we then discounted each year’s residual
income by Worthington’s cost of equity. The summation of all residual incomes brought
back to the present was -$129 million. This means that over the next 10 years we
expect Worthington to destroy $129 million of shareholder value. The next step in the
model is estimating the value of the perpetuity of residual income from 2019 to infinity.
We estimated this by looking at the average growth on residual income over the years
2016-2018. Once the perpetuity value was found we then discounted it back to May
31st, 2008 which gave Worthington a present value of -$89 million for the perpetuity.
The last step of the model involves adding the initial book value of equity to both the
present value of the perpetuity and residual incomes. Through adding those three
values we calculated Worthington’s total value of equity to be $543 million or $6.90 a
share on May 31st, 2008, and a time consistent price of $7.26 a share on November 1st,
2008. Worthington’s Residual Income model price of $7.26 is much less then their
observed price of $12.07 which would signify that Worthington is an overvalued firm.
We will now conduct a sensitivity analysis of the model to see how changes in cost of
equity and growth rates would affect Worthington’s computed price. Growth rates used
in the sensitivity analysis are negative due to the goal of every firm in reach
equilibrium. In the long run a firm cannot out perform their cost of equity.
Residual Income Model Growth Rate Ke -0.1 -0.2 -0.3 -0.4 -0.5
0.07 14.52 13.94 13.66 13.51 13.41 0.09 11.93 11.75 11.66 11.60 11.57 0.11 9.61 9.68 9.72 9.74 9.75 0.13 7.78 7.98 8.09 8.16 8.31 0.15 6.47 6.72 6.87 6.96 7.02 0.17 5.39 5.66 5.81 5.91 5.99 0.19 4.58 4.84 5.00 5.10 5.18
Undervalued > $13.88 $10.26 < Fairly Valued < $13.88 Overvalued < $10.26

122
For the restated residual income model the only difference was in the initial book
value of equity. Since we impaired goodwill, equity was lowered causing Worthington’s
benchmark net income to be lower. This in the reason why the restated results yield a
higher price per share of $8.84, but it is still significantly lower than Worthington’s
observed price of $12.07.
Restated Residual Income Model Growth Rate Ke -0.1 -0.2 -0.3 -0.4 -0.5
0.07 15.61 14.91 14.58 14.39 14.26 0.09 13.13 12.83 12.69 12.60 12.54 0.11 10.90 10.88 10.86 10.86 10.85 0.13 9.15 9.27 9.34 9.38 9.40 0.15 7.90 8.08 8.19 8.25 8.30 0.17 6.87 7.08 7.20 7.28 7.33 0.19 6.10 6.31 6.44 6.52 6.58
Undervalued > $13.88 $10.26 < Fairly Valued < $13.88 Overvalued < $10.26
Long Run Residual Income Model:
The long run residual income model uses methods of the residual income model
along with a perpetuity equation in order to value a firm. The model uses a firms cost
of equity, their book value, long run return on equity, and long run growth on equity.
The equation for the model is stated below.
MVE=BVE X (1+(ROE-Ke/Ke-g))
We found Worthington’s long run return on equity to be 11% over the forecasted 10
year period, as seen below.
2009 2010 2011 2012 2013 2014 2015 2016 2017 2018 AVG 12.56% 10.98% 10.24% 9.99% 10.23% 10.44% 10.60% 10.73% 10.82% 10.87% 11%
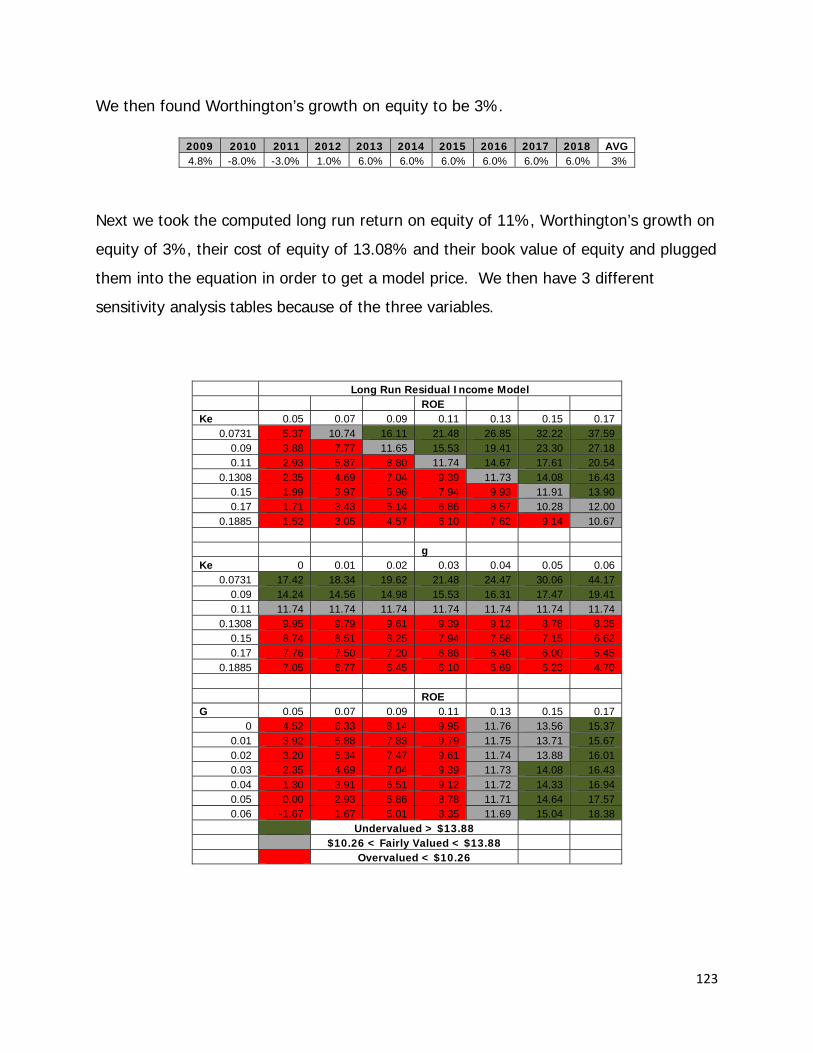
123
We then found Worthington’s growth on equity to be 3%.
2009 2010 2011 2012 2013 2014 2015 2016 2017 2018 AVG 4.8% -8.0% -3.0% 1.0% 6.0% 6.0% 6.0% 6.0% 6.0% 6.0% 3%
Next we took the computed long run return on equity of 11%, Worthington’s growth on
equity of 3%, their cost of equity of 13.08% and their book value of equity and plugged
them into the equation in order to get a model price. We then have 3 different
sensitivity analysis tables because of the three variables.
Long Run Residual Income Model ROE Ke 0.05 0.07 0.09 0.11 0.13 0.15 0.17
0.0731 5.37 10.74 16.11 21.48 26.85 32.22 37.59 0.09 3.88 7.77 11.65 15.53 19.41 23.30 27.18 0.11 2.93 5.87 8.80 11.74 14.67 17.61 20.54
0.1308 2.35 4.69 7.04 9.39 11.73 14.08 16.43 0.15 1.99 3.97 5.96 7.94 9.93 11.91 13.90 0.17 1.71 3.43 5.14 6.86 8.57 10.28 12.00
0.1885 1.52 3.05 4.57 6.10 7.62 9.14 10.67 g Ke 0 0.01 0.02 0.03 0.04 0.05 0.06
0.0731 17.42 18.34 19.62 21.48 24.47 30.06 44.17 0.09 14.24 14.56 14.98 15.53 16.31 17.47 19.41 0.11 11.74 11.74 11.74 11.74 11.74 11.74 11.74
0.1308 9.95 9.79 9.61 9.39 9.12 8.78 8.35 0.15 8.74 8.51 8.25 7.94 7.58 7.15 6.62 0.17 7.76 7.50 7.20 6.86 6.46 6.00 5.45
0.1885 7.05 6.77 6.45 6.10 5.69 5.23 4.70 ROE G 0.05 0.07 0.09 0.11 0.13 0.15 0.17
0 4.52 6.33 8.14 9.95 11.76 13.56 15.37 0.01 3.92 5.88 7.83 9.79 11.75 13.71 15.67 0.02 3.20 5.34 7.47 9.61 11.74 13.88 16.01 0.03 2.35 4.69 7.04 9.39 11.73 14.08 16.43 0.04 1.30 3.91 6.51 9.12 11.72 14.33 16.94 0.05 0.00 2.93 5.86 8.78 11.71 14.64 17.57 0.06 -1.67 1.67 5.01 8.35 11.69 15.04 18.38
Undervalued > $13.88 $10.26 < Fairly Valued < $13.88 Overvalued < $10.26
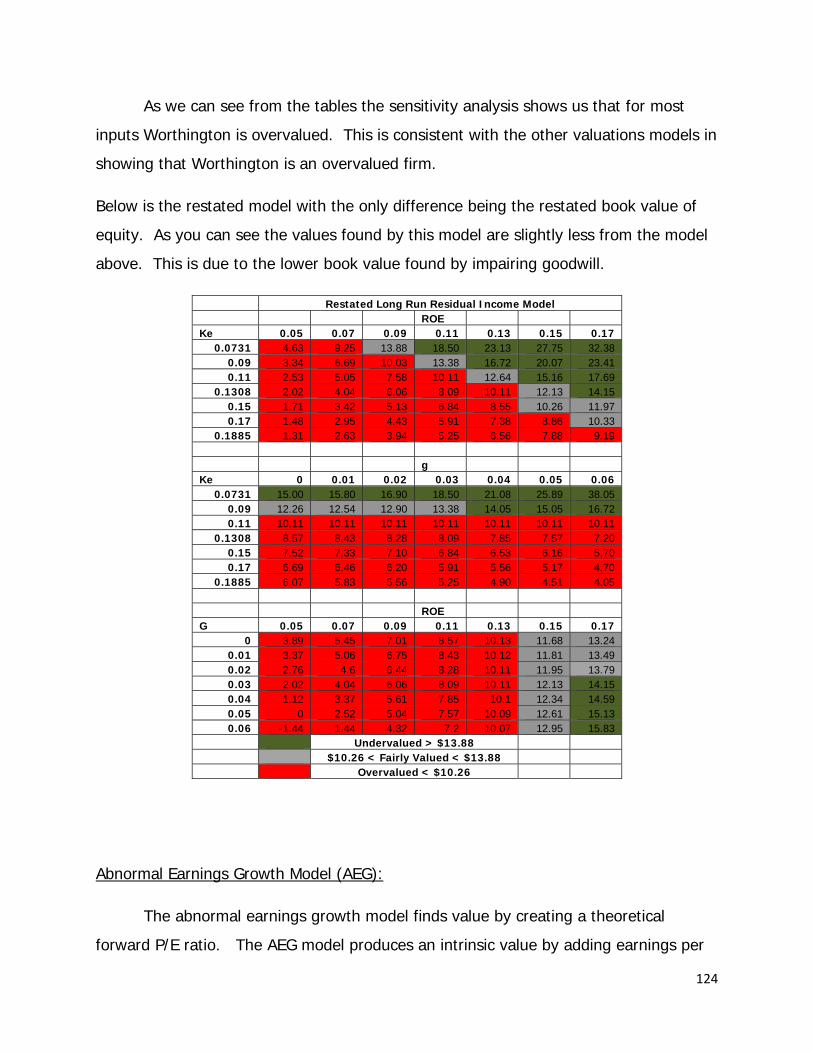
124
As we can see from the tables the sensitivity analysis shows us that for most
inputs Worthington is overvalued. This is consistent with the other valuations models in
showing that Worthington is an overvalued firm.
Below is the restated model with the only difference being the restated book value of
equity. As you can see the values found by this model are slightly less from the model
above. This is due to the lower book value found by impairing goodwill.
Restated Long Run Residual Income Model ROE Ke 0.05 0.07 0.09 0.11 0.13 0.15 0.17
0.0731 4.63 9.25 13.88 18.50 23.13 27.75 32.38 0.09 3.34 6.69 10.03 13.38 16.72 20.07 23.41 0.11 2.53 5.05 7.58 10.11 12.64 15.16 17.69
0.1308 2.02 4.04 6.06 8.09 10.11 12.13 14.15 0.15 1.71 3.42 5.13 6.84 8.55 10.26 11.97 0.17 1.48 2.95 4.43 5.91 7.38 8.86 10.33
0.1885 1.31 2.63 3.94 5.25 6.56 7.88 9.19 g Ke 0 0.01 0.02 0.03 0.04 0.05 0.06
0.0731 15.00 15.80 16.90 18.50 21.08 25.89 38.05 0.09 12.26 12.54 12.90 13.38 14.05 15.05 16.72 0.11 10.11 10.11 10.11 10.11 10.11 10.11 10.11
0.1308 8.57 8.43 8.28 8.09 7.85 7.57 7.20 0.15 7.52 7.33 7.10 6.84 6.53 6.16 5.70 0.17 6.69 6.46 6.20 5.91 5.56 5.17 4.70
0.1885 6.07 5.83 5.56 5.25 4.90 4.51 4.05 ROE G 0.05 0.07 0.09 0.11 0.13 0.15 0.17
0 3.89 5.45 7.01 8.57 10.13 11.68 13.24 0.01 3.37 5.06 6.75 8.43 10.12 11.81 13.49 0.02 2.76 4.6 6.44 8.28 10.11 11.95 13.79 0.03 2.02 4.04 6.06 8.09 10.11 12.13 14.15 0.04 1.12 3.37 5.61 7.85 10.1 12.34 14.59 0.05 0 2.52 5.04 7.57 10.09 12.61 15.13 0.06 -1.44 1.44 4.32 7.2 10.07 12.95 15.83
Undervalued > $13.88 $10.26 < Fairly Valued < $13.88 Overvalued < $10.26
Abnormal Earnings Growth Model (AEG):
The abnormal earnings growth model finds value by creating a theoretical
forward P/E ratio. The AEG model produces an intrinsic value by adding earnings per
125
share to discounted abnormal earnings and dividing by the cost of equity. Abnormal
earnings are computed by adding forecasted earnings to the dividend reinvestment
income (DRIP) minus the normal benchmark earnings. The main difference between
the AEG model and the residual model is that the AEG model discounts back to year
one instead of year zero. This is the most accurate of all the valuation models and is
directly linked to residual income.
To calculate Worthington’s value based on this model we first had to find
Worthington’s cumulative dividend income by adding forecasted earnings to the drip
income. Drip income can be found by multiplying the previous year’s dividends paid by
the firm’s cost of equity. Once we have found Worthington’s cumulative dividend
income we then need to compare it to the firm’s normal “benchmark” income.
Worthington’s benchmark income was found by taking the previous year’s income and
multiplying that by one plus Ke. Now that we have Worthington’s benchmark income
we can now find Worthington’s annual abnormal earnings by taking the cumulative
dividend income minus the benchmark income of that year. We then discount each
year’s computed abnormal earnings back to year one by multiplying it by the present
value factor, which is the firms cost of equity. Once we found the present values of
abnormal earnings we added all of these together to get the total present value of AEG.
Next we then found the value of the perpetuity in order to account for the years out to
infinity. To find this we forecasted the abnormal earnings growth for year eleven based
on the growth pattern of the previous year’s abnormal earnings growth. Then we took
the estimated year eleven AEG and used the perpetuity equation of:
Perpetuity = year 11 AEG/(Ke-g)
This gave us Worthington’s terminal value of the perpetuity which then needed to be
discounted back by multiplying it by the year 10 present value factor. Now that we
have the present value of the annual AEG and the perpetuity we then needed to find
Worthington’s core earnings. This was found by adding the forecasted earnings in 2008
to the present value perpetuity and the sum of the present value of abnormal earnings

126
growth. Next we took the core earnings and divided it by Worthington’s cost of equity
to find their value of equity. Last we divided Worthington’s intrinsic value of equity by
the number of shares outstanding to get a share price of $6.29 on May 31st of 2008.
We then had to get a time consistent price in order to compare it to the observed price
on November 1st 2008. We did this by growing the model price by Worthington’s cost
of equity for five months to get a price of $6.62 on November 1st 2008. Based on this
model Worthington’s share price is overvalued.
As shown above the restated AEG model yields a higher price per share. This is
due to the lower net income used in year zero which in turn lowers the benchmark
income for the next year. A lower benchmark gives Worthington higher abnormal
earnings for year one, which gives Worthington a higher share value. But even with
this price increase Worthington is still an overvalued company according to the model.
Ke -0.1 -0.2 -0.3 -0.4 -0.50.0731 20.18 19.65 19.40 19.26 19.710.0900 14.77 14.63 14.57 14.53 14.500.1100 10.95 11.00 11.02 11.03 11.040.1308 8.50 8.61 8.67 8.70 8.730.1500 7.01 7.12 7.19 7.23 7.260.1700 5.91 6.01 6.08 6.12 6.150.1885 5.16 5.25 5.31 5.35 5.37
Overvalued < $13.88$10.26 < Fairly Valued > $13.88
Undervalued > $10.26
Growth RateRestated AEG Model
Ke -0.1 -0.2 -0.3 -0.4 -0.5
0.0731 18.58 17.93 17.64 17.47 17.350.0900 12.46 12.33 12.26 12.22 12.200.1100 9.05 9.09 9.12 9.13 9.140.1308 6.96 7.06 7.12 7.14 7.180.1500 5.59 5.71 5.77 5.81 5.840.1700 4.65 4.76 4.82 4.86 4.890.1885 3.97 4.07 4.12 4.16 4.18
AEG ModelGrowth Rate
Overvalued < $13.88$10.26 < Fairly Valued > $13.88
Undervalued > $10.26
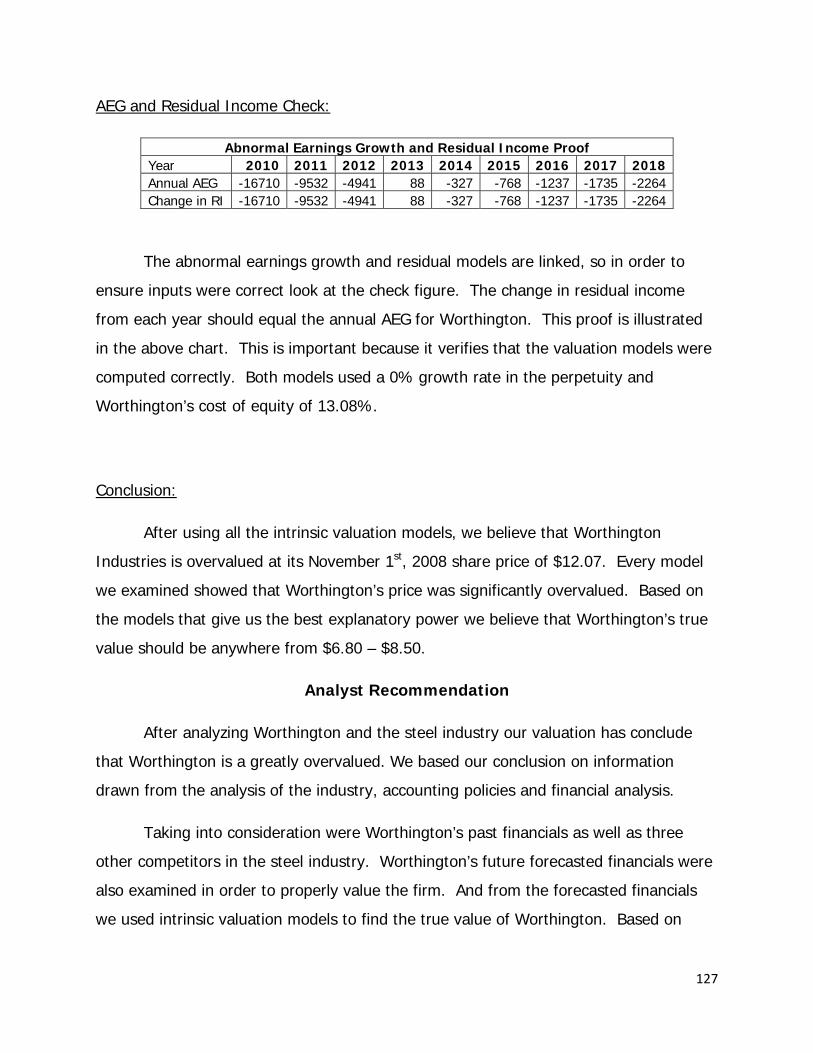
127
AEG and Residual Income Check:
Abnormal Earnings Growth and Residual Income Proof Year 2010 2011 2012 2013 2014 2015 2016 2017 2018Annual AEG -16710 -9532 -4941 88 -327 -768 -1237 -1735 -2264Change in RI -16710 -9532 -4941 88 -327 -768 -1237 -1735 -2264
The abnormal earnings growth and residual models are linked, so in order to
ensure inputs were correct look at the check figure. The change in residual income
from each year should equal the annual AEG for Worthington. This proof is illustrated
in the above chart. This is important because it verifies that the valuation models were
computed correctly. Both models used a 0% growth rate in the perpetuity and
Worthington’s cost of equity of 13.08%.
Conclusion:
After using all the intrinsic valuation models, we believe that Worthington
Industries is overvalued at its November 1st, 2008 share price of $12.07. Every model
we examined showed that Worthington’s price was significantly overvalued. Based on
the models that give us the best explanatory power we believe that Worthington’s true
value should be anywhere from $6.80 – $8.50.
Analyst Recommendation
After analyzing Worthington and the steel industry our valuation has conclude
that Worthington is a greatly overvalued. We based our conclusion on information
drawn from the analysis of the industry, accounting policies and financial analysis.
Taking into consideration were Worthington’s past financials as well as three
other competitors in the steel industry. Worthington’s future forecasted financials were
also examined in order to properly value the firm. And from the forecasted financials
we used intrinsic valuation models to find the true value of Worthington. Based on
128
numerous findings we can conclude that Worthington’s value does not meet the market
expectations and would suggest that current shareholders sell their stock.
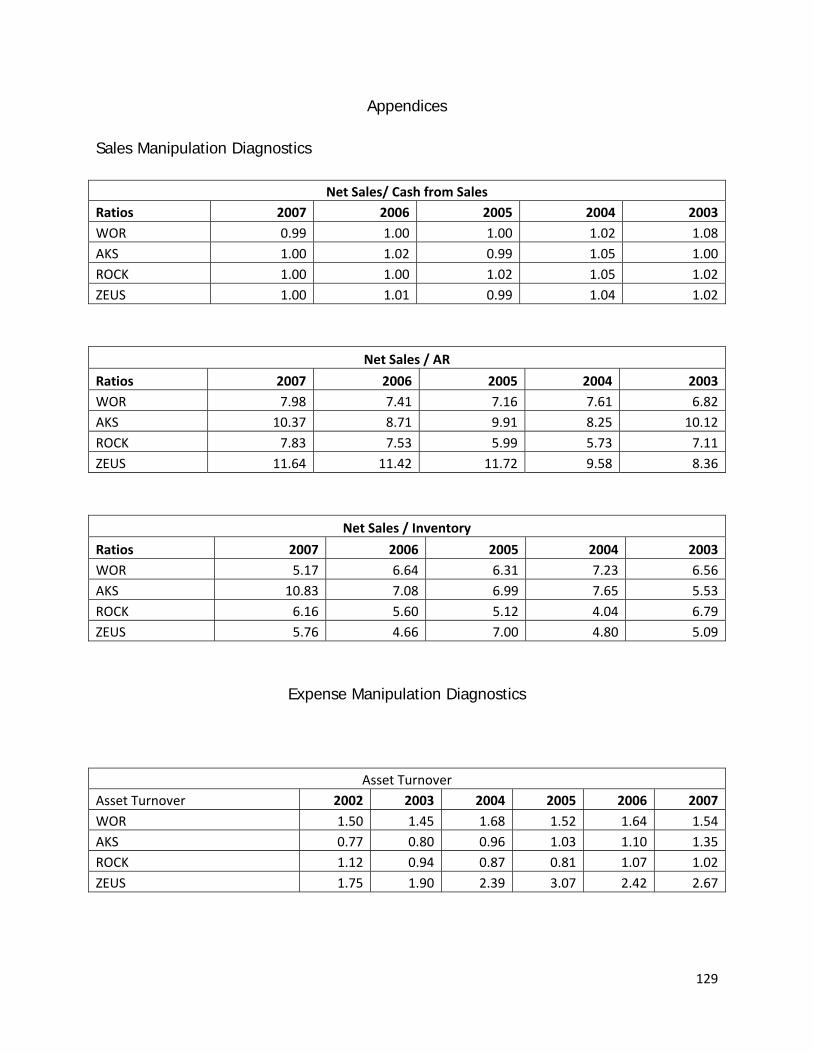
129
Appendices
Sales Manipulation Diagnostics
Net Sales/ Cash from Sales Ratios 2007 2006 2005 2004 2003WOR 0.99 1.00 1.00 1.02 1.08AKS 1.00 1.02 0.99 1.05 1.00ROCK 1.00 1.00 1.02 1.05 1.02ZEUS 1.00 1.01 0.99 1.04 1.02
Net Sales / AR
Ratios 2007 2006 2005 2004 2003WOR 7.98 7.41 7.16 7.61 6.82AKS 10.37 8.71 9.91 8.25 10.12ROCK 7.83 7.53 5.99 5.73 7.11ZEUS 11.64 11.42 11.72 9.58 8.36
Net Sales / Inventory
Ratios 2007 2006 2005 2004 2003WOR 5.17 6.64 6.31 7.23 6.56AKS 10.83 7.08 6.99 7.65 5.53ROCK 6.16 5.60 5.12 4.04 6.79ZEUS 5.76 4.66 7.00 4.80 5.09
Expense Manipulation Diagnostics
Asset Turnover Asset Turnover 2002 2003 2004 2005 2006 2007WOR 1.50 1.45 1.68 1.52 1.64 1.54AKS 0.77 0.80 0.96 1.03 1.10 1.35ROCK 1.12 0.94 0.87 0.81 1.07 1.02ZEUS 1.75 1.90 2.39 3.07 2.42 2.67

130
CFFO / OI (Raw) 2002 2003 2004 2005 2006 2007WOR 2.40 0.91 0.18 1.56 1.58 1.69
AKS ‐0.56 0.13 0.90 ‐121.74 5.68 1.81
ROCK ‐0.51 2.40 ‐0.03 3.01 ‐0.23 12.01
ZEUS 2.94 ‐2.93 0.06 3.94 1.64 2.56
CFFO / OI (Change) CFFO/OI 2007 2006 2005 2004 2003 2002WOR -0.01 1.45 -5.83 -0.51 -8.76 2.40
AKS 1.69 -14.81 -0.27 0.36 6.06 -0.56
ROCK -3.91 -10.46 -18.14 -2.79 24.85 -0.51
ZEUS -2.40 -4.05 -2.20 -0.10 10.61 2.94
CFFO / NOA 2002 2003 2004 2005 2006 2007WOR 0.24 0.14 0.06 0.42 0.32 0.33AKS 0.11 ‐0.03 0.09 0.12 0.03 0.34ROCK ‐0.05 0.26 ‐0.01 0.42 ‐0.06 0.58ZEUS ‐0.17 0.11 0.04 1.12 0.58 0.72
Accruals / Sales Ratio 2002 2003 2004 2005 2006 2007WOR 0.034 0.036 0.058 0.05 0.038 0.035AKS ‐0.121 ‐0.139 0.046 0 0.002 0.055ROCK ‐0.031 0.003 ‐0.048 ‐0.015 ‐0.036 0.017ZEUS 0.016 0.013 ‐0.062 ‐0.013 ‐0.026 ‐0.017
Liquidity Ratios
WOR LIQUIDITY 2003 2004 2005 2006 2007 2008Current Ratio 1.6 1.8 1.7 2.0 2.3 1.7Quick Asset Ratio 0.5 0.7 0.8 0.9 1.0 0.7A/R Turnover 13.1 6.8 7.6 7.2 7.4 8.0A/R Days 27.9 53.5 48.0 51.0 49.2 45.7Inventory Turnover 7.1 5.5 6.1 5.5 5.8 4.6
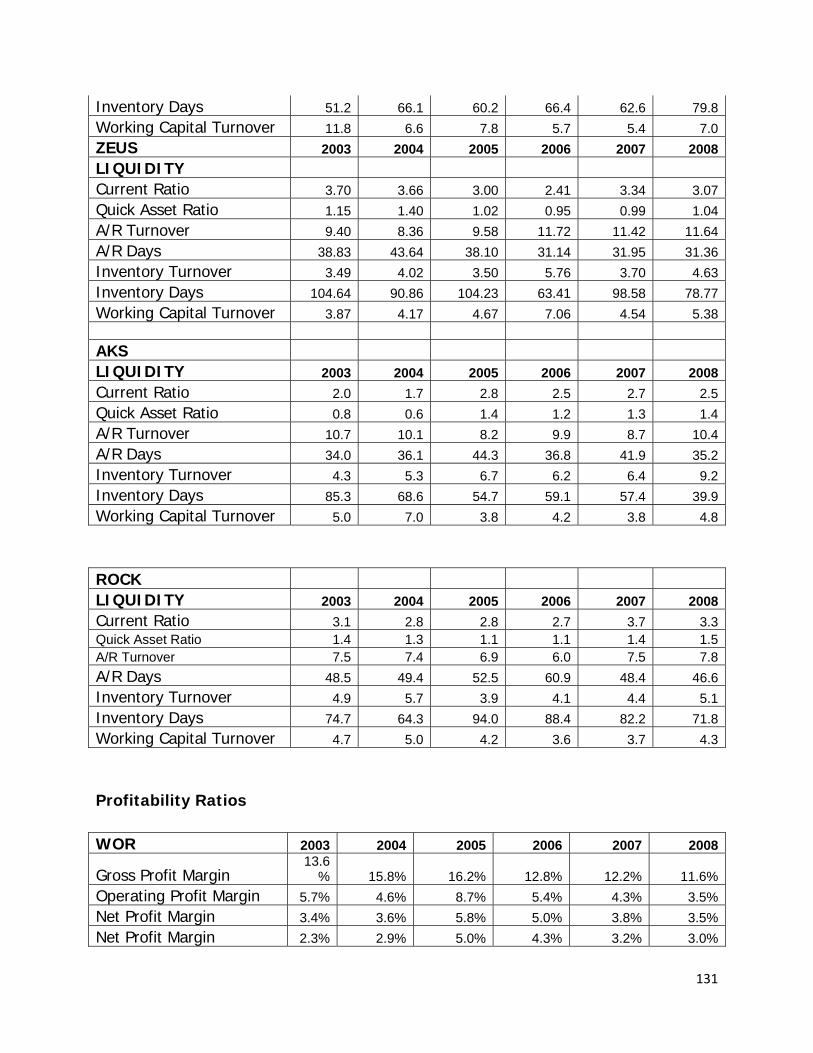
131
Inventory Days 51.2 66.1 60.2 66.4 62.6 79.8Working Capital Turnover 11.8 6.6 7.8 5.7 5.4 7.0ZEUS 2003 2004 2005 2006 2007 2008LIQUIDITY Current Ratio 3.70 3.66 3.00 2.41 3.34 3.07Quick Asset Ratio 1.15 1.40 1.02 0.95 0.99 1.04A/R Turnover 9.40 8.36 9.58 11.72 11.42 11.64A/R Days 38.83 43.64 38.10 31.14 31.95 31.36Inventory Turnover 3.49 4.02 3.50 5.76 3.70 4.63Inventory Days 104.64 90.86 104.23 63.41 98.58 78.77Working Capital Turnover 3.87 4.17 4.67 7.06 4.54 5.38 AKS LIQUIDITY 2003 2004 2005 2006 2007 2008Current Ratio 2.0 1.7 2.8 2.5 2.7 2.5Quick Asset Ratio 0.8 0.6 1.4 1.2 1.3 1.4A/R Turnover 10.7 10.1 8.2 9.9 8.7 10.4A/R Days 34.0 36.1 44.3 36.8 41.9 35.2Inventory Turnover 4.3 5.3 6.7 6.2 6.4 9.2Inventory Days 85.3 68.6 54.7 59.1 57.4 39.9Working Capital Turnover 5.0 7.0 3.8 4.2 3.8 4.8
ROCK LIQUIDITY 2003 2004 2005 2006 2007 2008Current Ratio 3.1 2.8 2.8 2.7 3.7 3.3Quick Asset Ratio 1.4 1.3 1.1 1.1 1.4 1.5A/R Turnover 7.5 7.4 6.9 6.0 7.5 7.8A/R Days 48.5 49.4 52.5 60.9 48.4 46.6Inventory Turnover 4.9 5.7 3.9 4.1 4.4 5.1Inventory Days 74.7 64.3 94.0 88.4 82.2 71.8Working Capital Turnover 4.7 5.0 4.2 3.6 3.7 4.3
Profitability Ratios
WOR 2003 2004 2005 2006 2007 2008
Gross Profit Margin 13.6
% 15.8% 16.2% 12.8% 12.2% 11.6%Operating Profit Margin 5.7% 4.6% 8.7% 5.4% 4.3% 3.5%Net Profit Margin 3.4% 3.6% 5.8% 5.0% 3.8% 3.5%Net Profit Margin 2.3% 2.9% 5.0% 4.3% 3.2% 3.0%
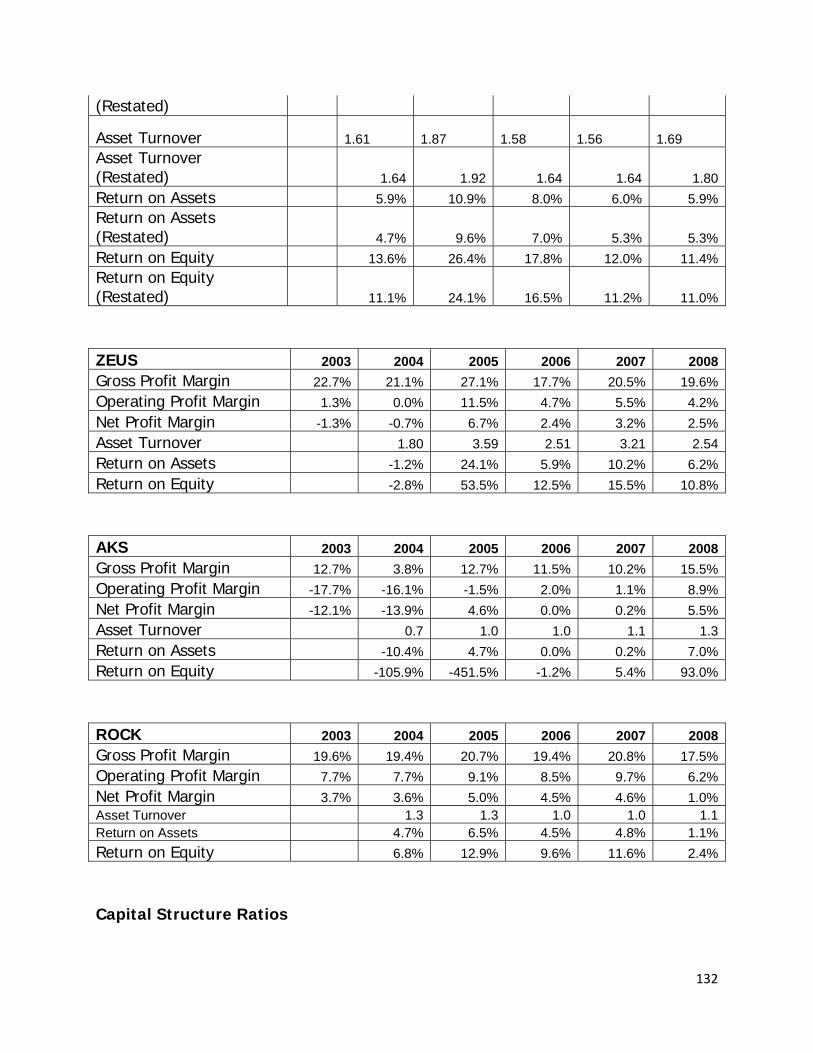
132
(Restated)
Asset Turnover 1.61
1.87
1.58
1.56
1.69
Asset Turnover (Restated) 1.64 1.92 1.64 1.64 1.80Return on Assets 5.9% 10.9% 8.0% 6.0% 5.9%Return on Assets (Restated) 4.7% 9.6% 7.0% 5.3% 5.3%Return on Equity 13.6% 26.4% 17.8% 12.0% 11.4%Return on Equity (Restated) 11.1% 24.1% 16.5% 11.2% 11.0%
ZEUS 2003 2004 2005 2006 2007 2008Gross Profit Margin 22.7% 21.1% 27.1% 17.7% 20.5% 19.6%Operating Profit Margin 1.3% 0.0% 11.5% 4.7% 5.5% 4.2%Net Profit Margin -1.3% -0.7% 6.7% 2.4% 3.2% 2.5%Asset Turnover 1.80 3.59 2.51 3.21 2.54Return on Assets -1.2% 24.1% 5.9% 10.2% 6.2%Return on Equity -2.8% 53.5% 12.5% 15.5% 10.8%
AKS 2003 2004 2005 2006 2007 2008Gross Profit Margin 12.7% 3.8% 12.7% 11.5% 10.2% 15.5%Operating Profit Margin -17.7% -16.1% -1.5% 2.0% 1.1% 8.9%Net Profit Margin -12.1% -13.9% 4.6% 0.0% 0.2% 5.5%Asset Turnover 0.7 1.0 1.0 1.1 1.3Return on Assets -10.4% 4.7% 0.0% 0.2% 7.0%Return on Equity -105.9% -451.5% -1.2% 5.4% 93.0%
ROCK 2003 2004 2005 2006 2007 2008Gross Profit Margin 19.6% 19.4% 20.7% 19.4% 20.8% 17.5%Operating Profit Margin 7.7% 7.7% 9.1% 8.5% 9.7% 6.2%Net Profit Margin 3.7% 3.6% 5.0% 4.5% 4.6% 1.0%Asset Turnover 1.3 1.3 1.0 1.0 1.1Return on Assets 4.7% 6.5% 4.5% 4.8% 1.1%Return on Equity 6.8% 12.9% 9.6% 11.6% 2.4%
Capital Structure Ratios
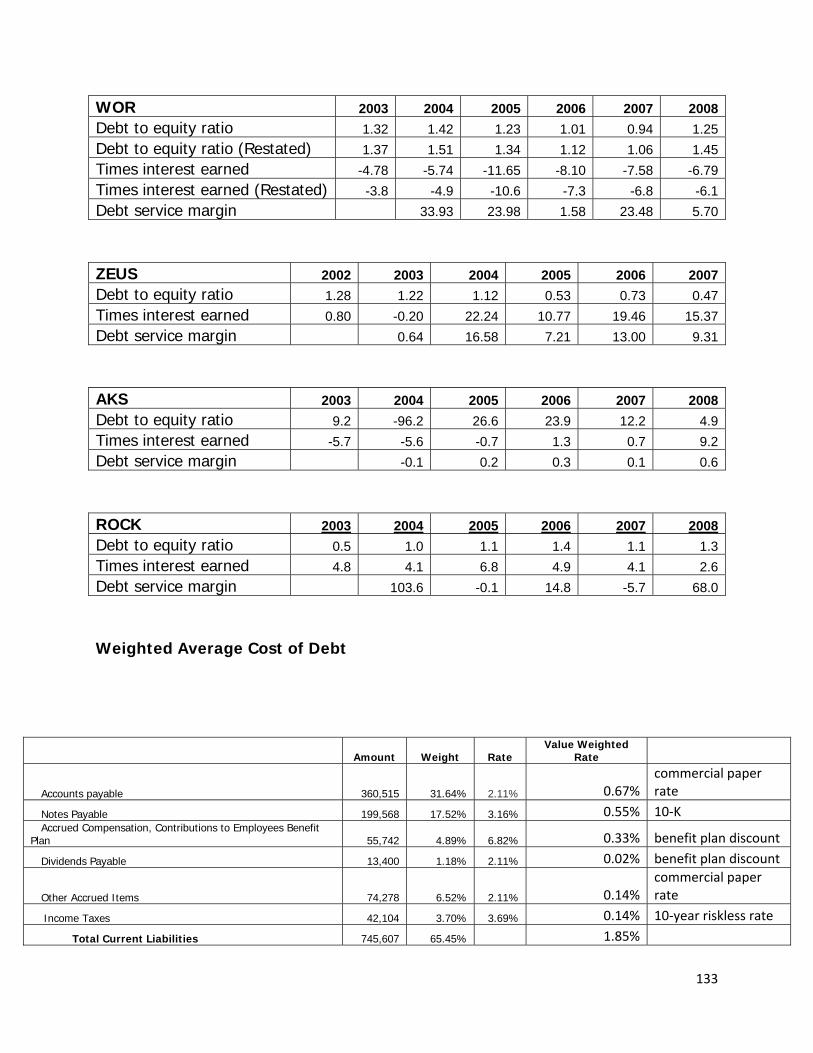
133
WOR 2003 2004 2005 2006 2007 2008Debt to equity ratio 1.32 1.42 1.23 1.01 0.94 1.25Debt to equity ratio (Restated) 1.37 1.51 1.34 1.12 1.06 1.45Times interest earned -4.78 -5.74 -11.65 -8.10 -7.58 -6.79Times interest earned (Restated) -3.8 -4.9 -10.6 -7.3 -6.8 -6.1Debt service margin 33.93 23.98 1.58 23.48 5.70
ZEUS 2002 2003 2004 2005 2006 2007Debt to equity ratio 1.28 1.22 1.12 0.53 0.73 0.47Times interest earned 0.80 -0.20 22.24 10.77 19.46 15.37Debt service margin 0.64 16.58 7.21 13.00 9.31
AKS 2003 2004 2005 2006 2007 2008Debt to equity ratio 9.2 -96.2 26.6 23.9 12.2 4.9Times interest earned -5.7 -5.6 -0.7 1.3 0.7 9.2Debt service margin -0.1 0.2 0.3 0.1 0.6
ROCK 2003 2004 2005 2006 2007 2008Debt to equity ratio 0.5 1.0 1.1 1.4 1.1 1.3Times interest earned 4.8 4.1 6.8 4.9 4.1 2.6Debt service margin 103.6 -0.1 14.8 -5.7 68.0
Weighted Average Cost of Debt
Amount Weight Rate Value Weighted
Rate
Accounts payable 360,515 31.64% 2.11% 0.67% commercial paper rate
Notes Payable 199,568 17.52% 3.16% 0.55% 10‐K Accrued Compensation, Contributions to Employees Benefit
Plan 55,742 4.89% 6.82% 0.33% benefit plan discount
Dividends Payable 13,400 1.18% 2.11% 0.02% benefit plan discount
Other Accrued Items 74,278 6.52% 2.11% 0.14% commercial paper rate
Income Taxes 42,104 3.70% 3.69% 0.14% 10‐year riskless rate
Total Current Liabilities 745,607 65.45% 1.85%
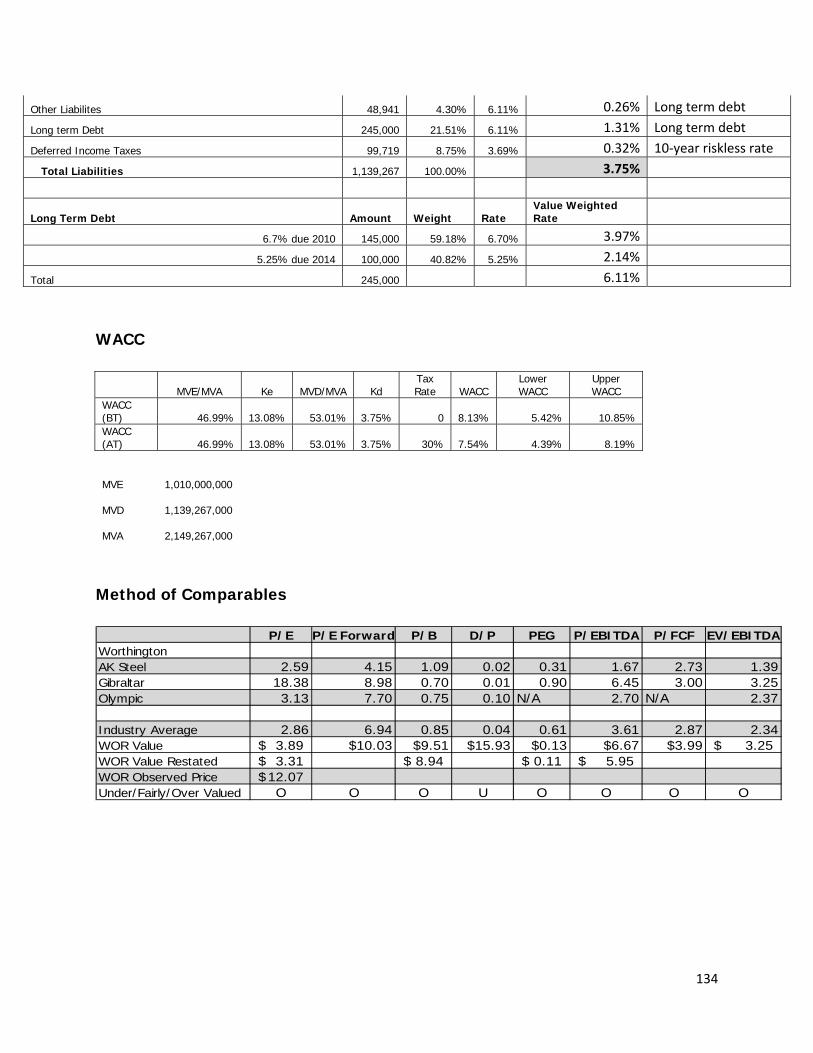
134
WACC
MVE/MVA Ke MVD/MVA Kd Tax Rate WACC
Lower WACC
Upper WACC
WACC (BT) 46.99% 13.08% 53.01% 3.75% 0 8.13% 5.42% 10.85% WACC (AT) 46.99% 13.08% 53.01% 3.75% 30% 7.54% 4.39% 8.19%
MVE 1,010,000,000
MVD 1,139,267,000
MVA 2,149,267,000
Method of Comparables
P/E P/E Forward P/B D/P PEG P/EBITDA P/FCF EV/EBITDAWorthingtonAK Steel 2.59 4.15 1.09 0.02 0.31 1.67 2.73 1.39Gibraltar 18.38 8.98 0.70 0.01 0.90 6.45 3.00 3.25Olympic 3.13 7.70 0.75 0.10 N/A 2.70 N/A 2.37
Industry Average 2.86 6.94 0.85 0.04 0.61 3.61 2.87 2.34WOR Value 3.89$ $10.03 $9.51 $15.93 $0.13 $6.67 $3.99 3.25$ WOR Value Restated 3.31$ 8.94$ 0.11$ 5.95$ WOR Observed Price 12.07$ Under/Fairly/Over Valued O O O U O O O O
Other Liabilites 48,941 4.30% 6.11% 0.26% Long term debt
Long term Debt 245,000 21.51% 6.11% 1.31% Long term debt
Deferred Income Taxes 99,719 8.75% 3.69% 0.32% 10‐year riskless rate
Total Liabilities 1,139,267 100.00% 3.75%
Long Term Debt Amount Weight Rate Value Weighted Rate
6.7% due 2010 145,000 59.18% 6.70% 3.97%
5.25% due 2014 100,000 40.82% 5.25% 2.14%
Total 245,000 6.11%
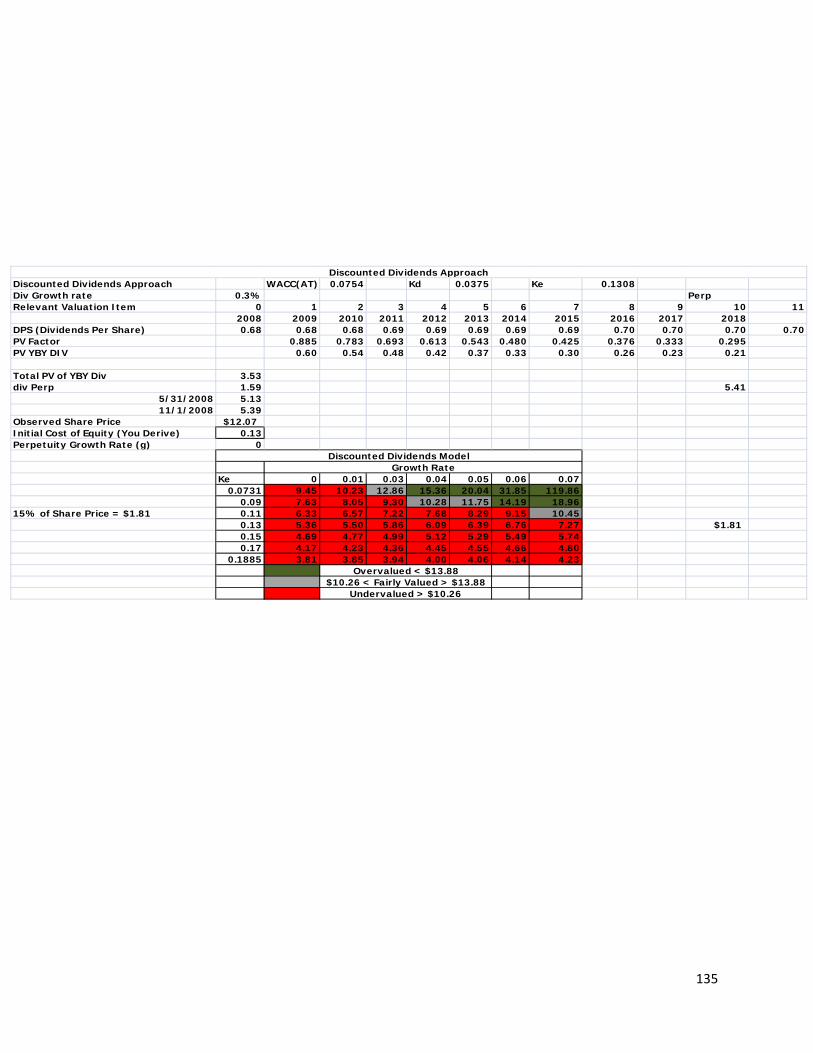
135
Discounted Dividends Approach WACC(AT) 0.0754 Kd 0.0375 Ke 0.1308Div Growth rate 0.3% PerpRelevant Valuation Item 0 1 2 3 4 5 6 7 8 9 10 11
2008 2009 2010 2011 2012 2013 2014 2015 2016 2017 2018DPS (Dividends Per Share) 0.68 0.68 0.68 0.69 0.69 0.69 0.69 0.69 0.70 0.70 0.70 0.70PV Factor 0.885 0.783 0.693 0.613 0.543 0.480 0.425 0.376 0.333 0.295PV YBY DIV 0.60 0.54 0.48 0.42 0.37 0.33 0.30 0.26 0.23 0.21
Total PV of YBY Div 3.53div Perp 1.59 5.41
5/31/2008 5.1311/1/2008 5.39
Observed Share Price $12.07Initial Cost of Equity (You Derive) 0.13Perpetuity Growth Rate (g) 0
Ke 0 0.01 0.03 0.04 0.05 0.06 0.070.0731 9.45 10.23 12.86 15.36 20.04 31.85 119.86
0.09 7.63 8.05 9.30 10.28 11.75 14.19 18.9615% of Share Price = $1.81 0.11 6.33 6.57 7.22 7.68 8.29 9.15 10.45
0.13 5.36 5.50 5.86 6.09 6.39 6.76 7.27 $1.810.15 4.69 4.77 4.99 5.12 5.29 5.49 5.740.17 4.17 4.23 4.36 4.45 4.55 4.66 4.80
0.1885 3.81 3.85 3.94 4.00 4.06 4.14 4.23
Growth RateDiscounted Dividends Model
Overvalued < $13.88$10.26 < Fairly Valued > $13.88
Undervalued > $10.26
Discounted Dividends Approach
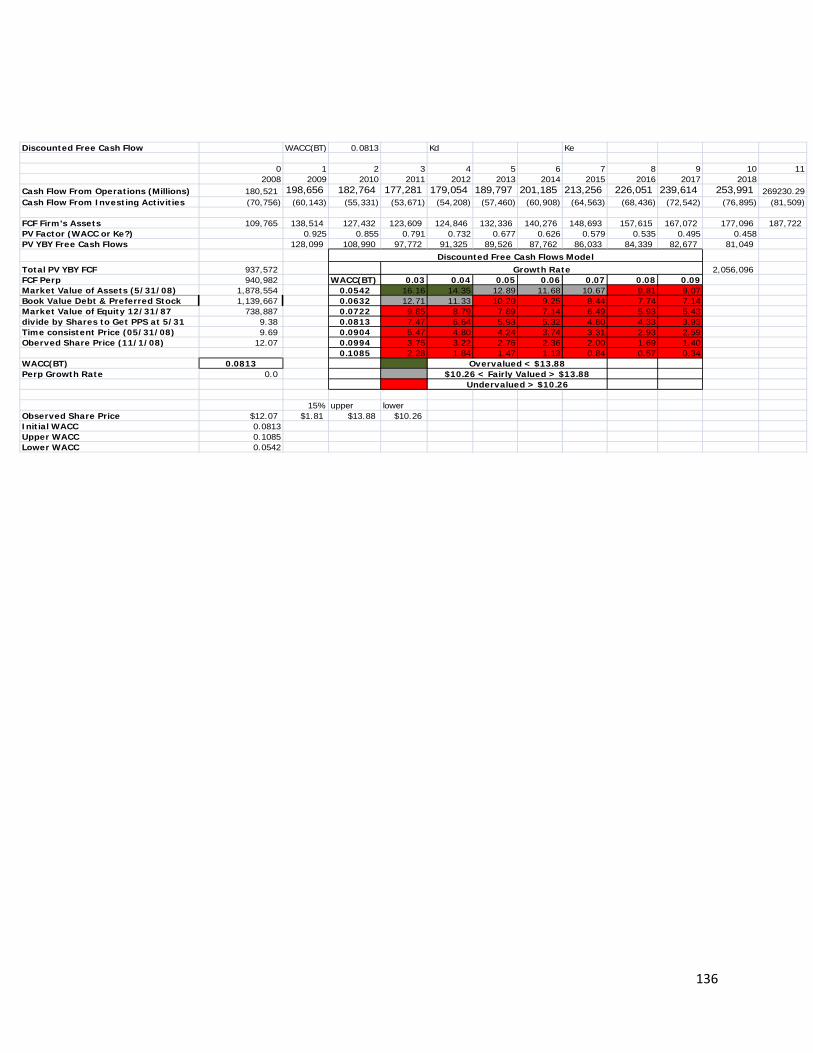
136
Discounted Free Cash Flow WACC(BT) 0.0813 Kd Ke
0 1 2 3 4 5 6 7 8 9 10 112008 2009 2010 2011 2012 2013 2014 2015 2016 2017 2018
Cash Flow From Operations (Millions) 180,521 198,656 182,764 177,281 179,054 189,797 201,185 213,256 226,051 239,614 253,991 269230.29Cash Flow From Investing Activities (70,756) (60,143) (55,331) (53,671) (54,208) (57,460) (60,908) (64,563) (68,436) (72,542) (76,895) (81,509)
FCF Firm's Assets 109,765 138,514 127,432 123,609 124,846 132,336 140,276 148,693 157,615 167,072 177,096 187,722 PV Factor (WACC or Ke?) 0.925 0.855 0.791 0.732 0.677 0.626 0.579 0.535 0.495 0.458PV YBY Free Cash Flows 128,099 108,990 97,772 91,325 89,526 87,762 86,033 84,339 82,677 81,049
Total PV YBY FCF 937,572 2,056,096 FCF Perp 940,982 WACC(BT) 0.03 0.04 0.05 0.06 0.07 0.08 0.09Market Value of Assets (5/31/08) 1,878,554 0.0542 16.16 14.35 12.89 11.68 10.67 9.81 9.07Book Value Debt & Preferred Stock 1,139,667 0.0632 12.71 11.33 10.20 9.25 8.44 7.74 7.14Market Value of Equity 12/31/87 738,887 0.0722 9.85 8.79 7.89 7.14 6.49 5.93 5.43divide by Shares to Get PPS at 5/31 9.38 0.0813 7.47 6.64 5.93 5.32 4.80 4.33 3.93Time consistent Price (05/31/08) 9.69 0.0904 5.47 4.80 4.24 3.74 3.31 2.93 2.59Oberved Share Price (11/1/08) 12.07 0.0994 3.75 3.22 2.76 2.36 2.00 1.69 1.40
0.1085 2.28 1.84 1.47 1.13 0.84 0.57 0.34WACC(BT) 0.0813Perp Growth Rate 0.0
15% upper lowerObserved Share Price $12.07 $1.81 $13.88 $10.26Initial WACC 0.0813Upper WACC 0.1085Lower WACC 0.0542
Growth RateDiscounted Free Cash Flows Model
Overvalued < $13.88$10.26 < Fairly Valued > $13.88
Undervalued > $10.26

137
BVE 885,377 2009 2010 2011 2012 2013 2014 2015 2016 2017 2018 AVGROE 0.11 12.56% 10.98% 10.24% 9.99% 10.23% 10.44% 10.60% 10.73% 10.82% 10.87% 11% ROEKe 0.1308g 3% 4.8% -8.0% -3.0% 1.0% 6.0% 6.0% 6.0% 6.0% 6.0% 6.0% 3% g in NI
MVE 702,680 number of shares 78785model price 5/31/08 8.92 time consistent Price @ 11/1/08 9.39
ROEKe 0.05 0.07 0.09 0.11 0.13 0.15 0.17
0.0731 5.37 10.74 16.11 21.48 26.85 32.22 37.59 upper lower0.09 3.88 7.77 11.65 15.53 19.41 23.30 27.18 $13.88 $10.260.11 2.93 5.87 8.80 11.74 14.67 17.61 20.54
0.1308 2.35 4.69 7.04 9.39 11.73 14.08 16.430.15 1.99 3.97 5.96 7.94 9.93 11.91 13.900.17 1.71 3.43 5.14 6.86 8.57 10.28 12.00
0.1885 1.52 3.05 4.57 6.10 7.62 9.14 10.67
gKe 0 0.01 0.02 0.03 0.04 0.05 0.06
0.0731 17.42 18.34 19.62 21.48 24.47 30.06 44.170.09 14.24 14.56 14.98 15.53 16.31 17.47 19.410.11 11.74 11.74 11.74 11.74 11.74 11.74 11.74
0.1308 9.95 9.79 9.61 9.39 9.12 8.78 8.350.15 8.74 8.51 8.25 7.94 7.58 7.15 6.620.17 7.76 7.50 7.20 6.86 6.46 6.00 5.45
0.1885 7.05 6.77 6.45 6.10 5.69 5.23 4.70
ROEg 0.05 0.07 0.09 0.11 0.13 0.15 0.17
0 4.52 6.33 8.14 9.95 11.76 13.56 15.370.01 3.92 5.88 7.83 9.79 11.75 13.71 15.670.02 3.20 5.34 7.47 9.61 11.74 13.88 16.010.03 2.35 4.69 7.04 9.39 11.73 14.08 16.430.04 1.30 3.91 6.51 9.12 11.72 14.33 16.940.05 0.00 2.93 5.86 8.78 11.71 14.64 17.570.06 -1.67 1.67 5.01 8.35 11.69 15.04 18.38
Overvalued < $13.88$10.26 < Fairly Valued > $13.88
Undervalued > $10.26
Long Run Residual Income Model
BVE 762614 2009 2010 2011 2012 2013 2014 2015 2016 2017 2018 AVGROE 0.11 12.56% 10.98% 10.24% 9.99% 10.23% 10.44% 10.60% 10.73% 10.82% 10.87% 11% ROEKe 0.1308g 3% 4.8% -8.0% -3.0% 1.0% 6.0% 6.0% 6.0% 6.0% 6.0% 6.0% 3% g in NI
MVE 605,249 number of shares 78785model price 5/31/08 7.68 time consistent Price @ 11/1/08 8.09
ROEKe 0.05 0.07 0.09 0.11 0.13 0.15 0.17
0.0731 4.63 9.25 13.88 18.50 23.13 27.75 32.38 upper lower0.09 3.34 6.69 10.03 13.38 16.72 20.07 23.41 $13.88 $10.260.11 2.53 5.05 7.58 10.11 12.64 15.16 17.69
0.1308 2.02 4.04 6.06 8.09 10.11 12.13 14.150.15 1.71 3.42 5.13 6.84 8.55 10.26 11.970.17 1.48 2.95 4.43 5.91 7.38 8.86 10.33
0.1885 1.31 2.63 3.94 5.25 6.56 7.88 9.19
gKe 0 0.01 0.02 0.03 0.04 0.05 0.06
0.0731 15.00 15.80 16.90 18.50 21.08 25.89 38.050.09 12.26 12.54 12.90 13.38 14.05 15.05 16.720.11 10.11 10.11 10.11 10.11 10.11 10.11 10.11
0.1308 8.57 8.43 8.28 8.09 7.85 7.57 7.200.15 7.52 7.33 7.10 6.84 6.53 6.16 5.700.17 6.69 6.46 6.20 5.91 5.56 5.17 4.70
0.1885 6.07 5.83 5.56 5.25 4.90 4.51 4.05
ROEg 0.05 0.07 0.09 0.11 0.13 0.15 0.17
0 3.89 5.45 7.01 8.57 10.13 11.68 13.240.01 3.37 5.06 6.75 8.43 10.12 11.81 13.490.02 2.76 4.6 6.44 8.28 10.11 11.95 13.790.03 2.02 4.04 6.06 8.09 10.11 12.13 14.150.04 1.12 3.37 5.61 7.85 10.1 12.34 14.590.05 0 2.52 5.04 7.57 10.09 12.61 15.130.06 -1.44 1.44 4.32 7.2 10.07 12.95 15.83
Overvalued < $13.88$10.26 < Fairly Valued > $13.88
Undervalued > $10.26
Restated Long Run Residual Income Model
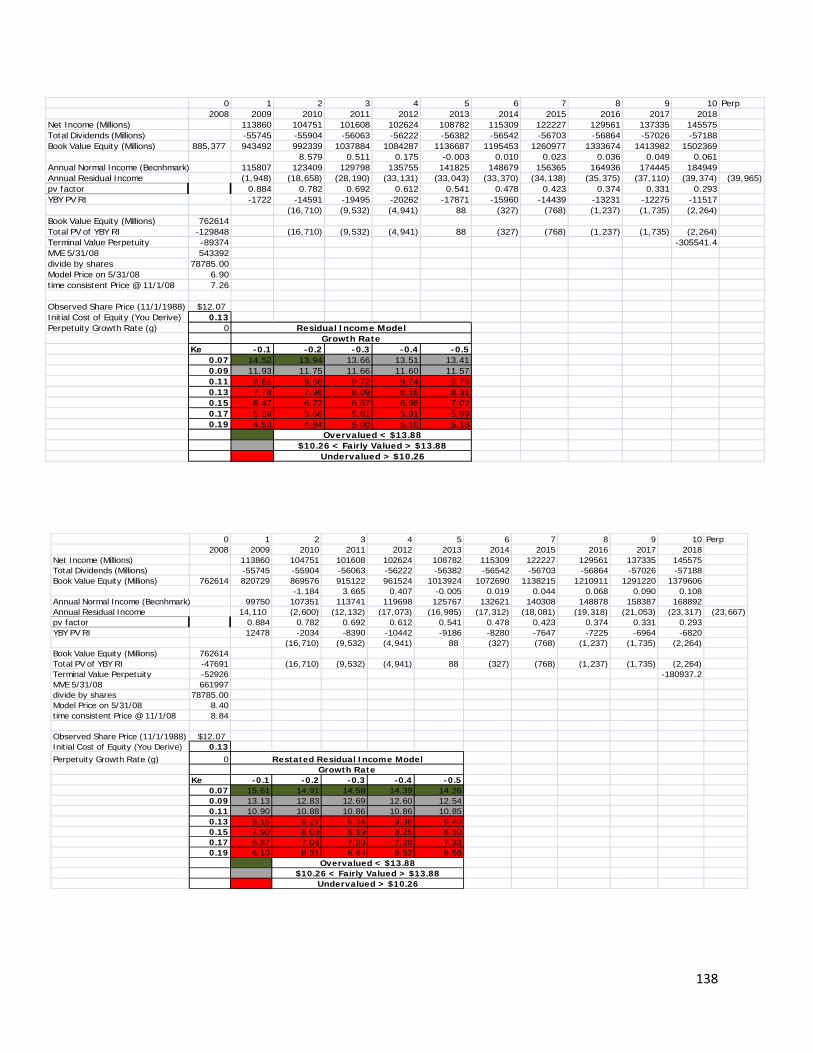
138
0 1 2 3 4 5 6 7 8 9 10 Perp2008 2009 2010 2011 2012 2013 2014 2015 2016 2017 2018
Net Income (Millions) 113860 104751 101608 102624 108782 115309 122227 129561 137335 145575Total Dividends (Millions) -55745 -55904 -56063 -56222 -56382 -56542 -56703 -56864 -57026 -57188Book Value Equity (Millions) 885,377 943492 992339 1037884 1084287 1136687 1195453 1260977 1333674 1413982 1502369
8.579 0.511 0.175 -0.003 0.010 0.023 0.036 0.049 0.061Annual Normal Income (Becnhmark) 115807 123409 129798 135755 141825 148679 156365 164936 174445 184949Annual Residual Income (1,948) (18,658) (28,190) (33,131) (33,043) (33,370) (34,138) (35,375) (37,110) (39,374) (39,965) pv factor 0.884 0.782 0.692 0.612 0.541 0.478 0.423 0.374 0.331 0.293YBY PV RI -1722 -14591 -19495 -20262 -17871 -15960 -14439 -13231 -12275 -11517
(16,710) (9,532) (4,941) 88 (327) (768) (1,237) (1,735) (2,264) Book Value Equity (Millions) 762614Total PV of YBY RI -129848 (16,710) (9,532) (4,941) 88 (327) (768) (1,237) (1,735) (2,264) Terminal Value Perpetuity -89374 -305541.4MVE 5/31/08 543392divide by shares 78785.00Model Price on 5/31/08 6.90time consistent Price @ 11/1/08 7.26
Observed Share Price (11/1/1988) $12.07Initial Cost of Equity (You Derive) 0.13Perpetuity Growth Rate (g) 0
Ke -0.1 -0.2 -0.3 -0.4 -0.50.07 14.52 13.94 13.66 13.51 13.410.09 11.93 11.75 11.66 11.60 11.570.11 9.61 9.68 9.72 9.74 9.750.13 7.78 7.98 8.09 8.16 8.310.15 6.47 6.72 6.87 6.96 7.020.17 5.39 5.66 5.81 5.91 5.990.19 4.58 4.84 5.00 5.10 5.18
Overvalued < $13.88$10.26 < Fairly Valued > $13.88
Undervalued > $10.26
Growth RateResidual Income Model
0 1 2 3 4 5 6 7 8 9 10 Perp2008 2009 2010 2011 2012 2013 2014 2015 2016 2017 2018
Net Income (Millions) 113860 104751 101608 102624 108782 115309 122227 129561 137335 145575Total Dividends (Millions) -55745 -55904 -56063 -56222 -56382 -56542 -56703 -56864 -57026 -57188Book Value Equity (Millions) 762614 820729 869576 915122 961524 1013924 1072690 1138215 1210911 1291220 1379606
-1.184 3.665 0.407 -0.005 0.019 0.044 0.068 0.090 0.108Annual Normal Income (Becnhmark) 99750 107351 113741 119698 125767 132621 140308 148878 158387 168892Annual Residual Income 14,110 (2,600) (12,132) (17,073) (16,985) (17,312) (18,081) (19,318) (21,053) (23,317) (23,667) pv factor 0.884 0.782 0.692 0.612 0.541 0.478 0.423 0.374 0.331 0.293YBY PV RI 12478 -2034 -8390 -10442 -9186 -8280 -7647 -7225 -6964 -6820
(16,710) (9,532) (4,941) 88 (327) (768) (1,237) (1,735) (2,264) Book Value Equity (Millions) 762614Total PV of YBY RI -47691 (16,710) (9,532) (4,941) 88 (327) (768) (1,237) (1,735) (2,264) Terminal Value Perpetuity -52926 -180937.2MVE 5/31/08 661997divide by shares 78785.00Model Price on 5/31/08 8.40time consistent Price @ 11/1/08 8.84
Observed Share Price (11/1/1988) $12.07Initial Cost of Equity (You Derive) 0.13Perpetuity Growth Rate (g) 0
Ke -0.1 -0.2 -0.3 -0.4 -0.50.07 15.61 14.91 14.58 14.39 14.260.09 13.13 12.83 12.69 12.60 12.540.11 10.90 10.88 10.86 10.86 10.850.13 9.15 9.27 9.34 9.38 9.400.15 7.90 8.08 8.19 8.25 8.300.17 6.87 7.08 7.20 7.28 7.330.19 6.10 6.31 6.44 6.52 6.58
Overvalued < $13.88$10.26 < Fairly Valued > $13.88
Undervalued > $10.26
Growth RateRestated Residual Income Model
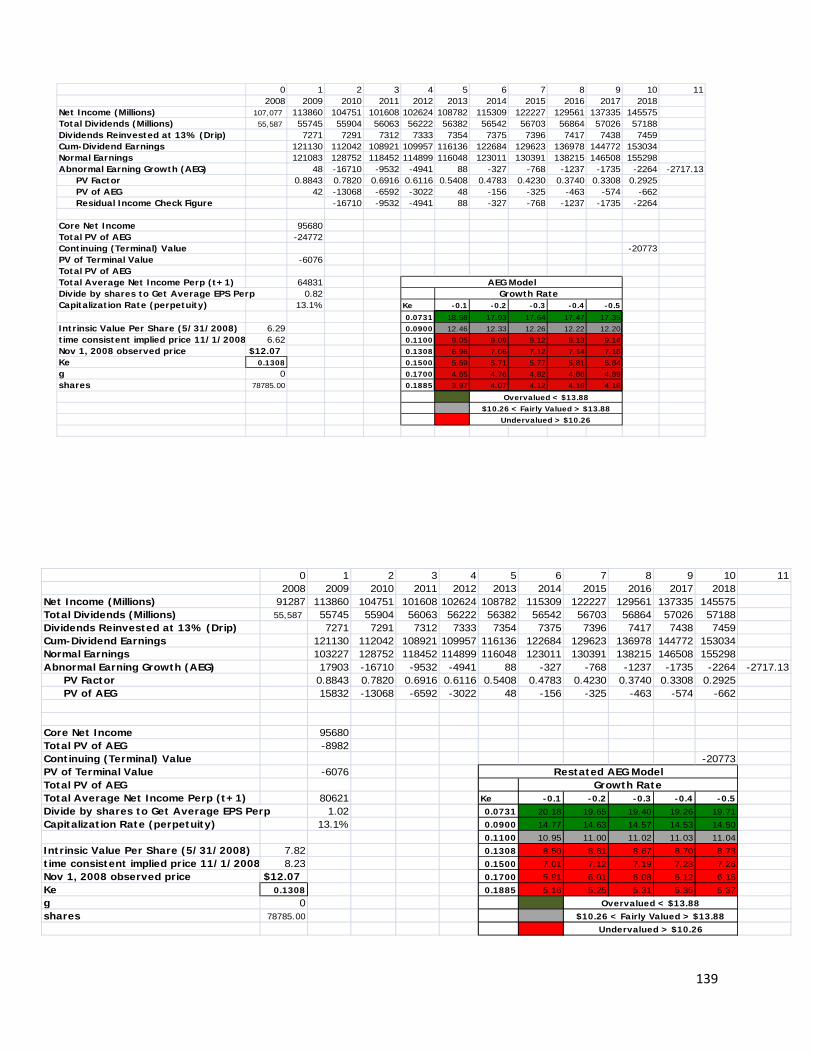
139
0 1 2 3 4 5 6 7 8 9 10 112008 2009 2010 2011 2012 2013 2014 2015 2016 2017 2018
Net Income (Millions) 107,077 113860 104751 101608 102624 108782 115309 122227 129561 137335 145575Total Dividends (Millions) 55,587 55745 55904 56063 56222 56382 56542 56703 56864 57026 57188Dividends Reinvested at 13% (Drip) 7271 7291 7312 7333 7354 7375 7396 7417 7438 7459Cum-Dividend Earnings 121130 112042 108921 109957 116136 122684 129623 136978 144772 153034Normal Earnings 121083 128752 118452 114899 116048 123011 130391 138215 146508 155298Abnormal Earning Growth (AEG) 48 -16710 -9532 -4941 88 -327 -768 -1237 -1735 -2264 -2717.13
PV Factor 0.8843 0.7820 0.6916 0.6116 0.5408 0.4783 0.4230 0.3740 0.3308 0.2925PV of AEG 42 -13068 -6592 -3022 48 -156 -325 -463 -574 -662Residual Income Check Figure -16710 -9532 -4941 88 -327 -768 -1237 -1735 -2264
Core Net Income 95680Total PV of AEG -24772Continuing (Terminal) Value -20773PV of Terminal Value -6076Total PV of AEGTotal Average Net Income Perp (t+1) 64831Divide by shares to Get Average EPS Perp 0.82Capitalization Rate (perpetuity) 13.1% Ke -0.1 -0.2 -0.3 -0.4 -0.5
0.0731 18.58 17.93 17.64 17.47 17.35Intrinsic Value Per Share (5/31/2008) 6.29 0.0900 12.46 12.33 12.26 12.22 12.20time consistent implied price 11/1/2008 6.62 0.1100 9.05 9.09 9.12 9.13 9.14Nov 1, 2008 observed price $12.07 0.1308 6.96 7.06 7.12 7.14 7.18Ke 0.1308 0.1500 5.59 5.71 5.77 5.81 5.84g 0 0.1700 4.65 4.76 4.82 4.86 4.89
shares 78785.00 0.1885 3.97 4.07 4.12 4.16 4.18
AEG ModelGrowth Rate
Overvalued < $13.88$10.26 < Fairly Valued > $13.88
Undervalued > $10.26
0 1 2 3 4 5 6 7 8 9 10 112008 2009 2010 2011 2012 2013 2014 2015 2016 2017 2018
Net Income (Millions) 91287 113860 104751 101608 102624 108782 115309 122227 129561 137335 145575Total Dividends (Millions) 55,587 55745 55904 56063 56222 56382 56542 56703 56864 57026 57188Dividends Reinvested at 13% (Drip) 7271 7291 7312 7333 7354 7375 7396 7417 7438 7459Cum-Dividend Earnings 121130 112042 108921 109957 116136 122684 129623 136978 144772 153034Normal Earnings 103227 128752 118452 114899 116048 123011 130391 138215 146508 155298Abnormal Earning Growth (AEG) 17903 -16710 -9532 -4941 88 -327 -768 -1237 -1735 -2264 -2717.13
PV Factor 0.8843 0.7820 0.6916 0.6116 0.5408 0.4783 0.4230 0.3740 0.3308 0.2925PV of AEG 15832 -13068 -6592 -3022 48 -156 -325 -463 -574 -662
Core Net Income 95680Total PV of AEG -8982Continuing (Terminal) Value -20773PV of Terminal Value -6076Total PV of AEGTotal Average Net Income Perp (t+1) 80621 Ke -0.1 -0.2 -0.3 -0.4 -0.5Divide by shares to Get Average EPS Perp 1.02 0.0731 20.18 19.65 19.40 19.26 19.71
Capitalization Rate (perpetuity) 13.1% 0.0900 14.77 14.63 14.57 14.53 14.500.1100 10.95 11.00 11.02 11.03 11.04
Intrinsic Value Per Share (5/31/2008) 7.82 0.1308 8.50 8.61 8.67 8.70 8.73time consistent implied price 11/1/2008 8.23 0.1500 7.01 7.12 7.19 7.23 7.26Nov 1, 2008 observed price $12.07 0.1700 5.91 6.01 6.08 6.12 6.15
Ke 0.1308 0.1885 5.16 5.25 5.31 5.35 5.37
g 0shares 78785.00
Overvalued < $13.88$10.26 < Fairly Valued > $13.88
Undervalued > $10.26
Growth RateRestated AEG Model

140
References
1. Worthington Industries website: www.worthingtonindustries.com
2003-2008 10-K
2. AK Steel’s website: www.aksteel.com
2002-2007 10-K
3. Olympic Steel’s website: www.olysteel.com
2002-2007 10-K
4. Gibraltar Industries website: www.gibraltar1.com
2002-2007 10-K
5. WSJ Online http://online.wsj.com/article/SB122826204920774031.html
6. Yahoo Finance: www.finance.yahoo.com
7. WSJ Online http://online.wsj.com/article/SB122654044416323137.html
8. http://findarticles.com/p/articles/mi_m0EIN/is_/ai_16934172
9. http://xnet3.uss.com/auto/steelvsal/cost.htm
10. WSJ Online http://online.wsj.com/article/SB122697117526435811.html
11. WSJ Online http://online.wsj.com/article/SB122822915071272421.html
12. Business Analysis & Valuation (Palepu & Healy)