Embed Size (px)
Citation preview
WORLD MILITARY EXPENDITURES AND
ARMS TRANSFERS 1966-1975
This publication is based on information available as of December 15, 1976. The data presented in this report are the best estimates present sources permit. It should be noted, however, that national data are not of equal reliability . Some are subject to a considerable margin of error, especially for countries having a restrictive data disclosure policy or a developing national statistical sys tern. The value data were converted to dollars using exchange rates unadjusted for purchasing power parities, and thus prec ise comparisons between countries are not valid.
Comments and queries regarding this publication are welcomed. They may be directed to Colonel Norman M. Smith, Arms Transfer Division, (202) 632-0613.
WORLD MILITARY EXPENDITURES AND ARMS TRANSFERS
1966-1975
U.S. ARMS CONTROL AND DISARMAMENT AGENCY
WASHINGTON. D.C. 20451

·-------
CONTENTS
Page
FoREWoRD................................. .. ...................... v
INTRODUCTION 0 0 0 0 0 0 0 0 0 0 0 0 0 0 0 0 0 0 0 0 0 0 0 0 0 0 0 0 0 0 0 0 0 0 0 0 0 0 0 0 0 0 0 0 0 0 0 0 0 0 0 0 0 0 1
STATISTICAL NOTES. 0 0 0 0 0 0 0 0 0 0 0 0 0 0 0 0 0 0 0 0 0 0 0 0 0 0 0 0 0 0 0 0 0 0 0 0 0 0 0 0 0 0 0 0 0 0 0 0 0 6
Sources and Definitions ...................................... . Military Expenditures ...................................... . Gross National Product ............. .... .. ... . .. ... .. ...... . Population ................................................ . Armed Forces .............. . ............. .. ............... . Arms Transfers ............................................ .
Coverage and Grouping of Countries ............ . ...... .. .... . .
COMPUTATIONAL PROCEDURES
6 6 7 8 8 8 9
Non-Communist Countries . . . . . . . . . . . . . . . . . . . . . . . . . . . . . . . . . . . . 9 Communist Countries.. . . . . . . . . . . . . . . . . . . . . . . . . . . . . . . . . . . . . . . . 11
STATISTICAL TABLES
I. Military Expenditures, GNP, Population, and Armed Forces by Group and Region by Year . . . . . . . . . . . . . . . . . . . . . . . . . . . . 14
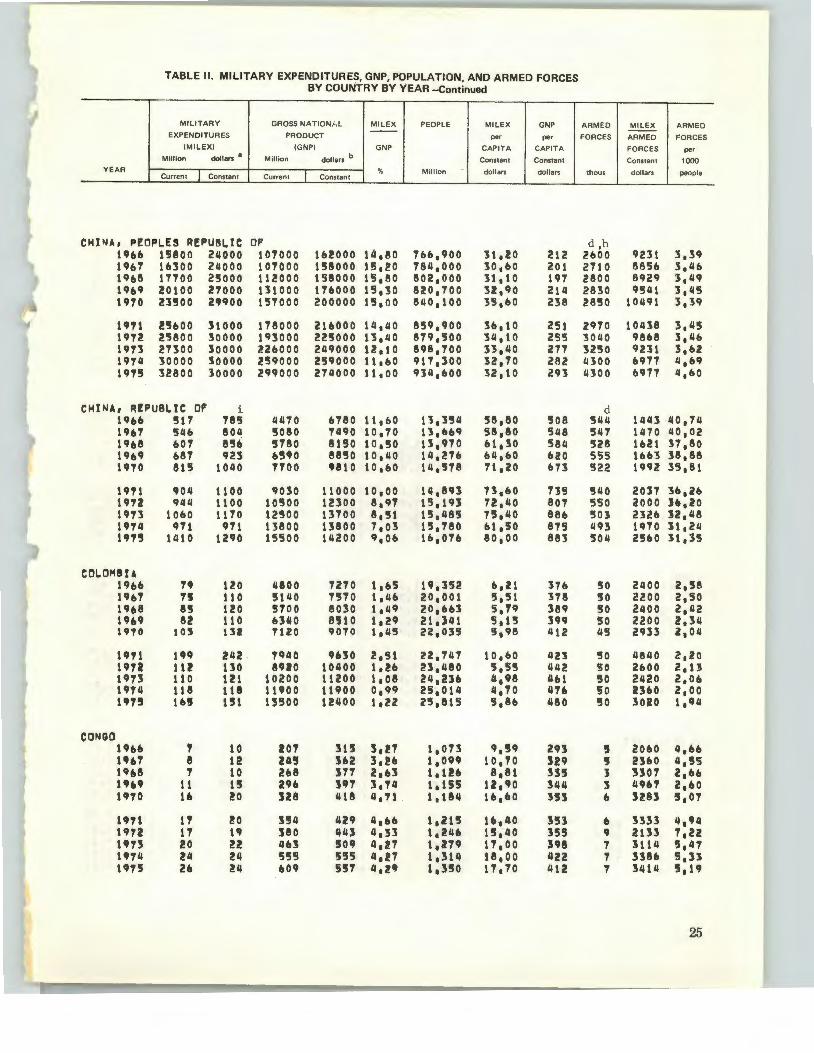
II. Military Expenditures, GNP, Population, and Armed Forces by Country by Year . . . . . . . . . . . . . . . . . . . . . . . . . . . . . . . . . . . . . 19
III. Arms Transfers by Group and Region by Year . . . . . . . . . . . . 56 IV. Arms Transfers by Country by Year........... . .......... 58 V. Total Arms Transfers of Major Suppliers from 1966-1975 by
Recipient Country. . . . . . . . . . . . . . . . . . . . . . . . . . . . . . . . . . . . . . . 77 VI. Exports of Major Weapons to Developing Regions, by Major·
Suppliers, Cumulative, 1971-1975 . . . . . . . . . . . . . . . . . . . . . . . . . 81 VII. Imports of Major Weapons by Recipient Regions, by Major
Suppliers, Cumulative, 1971-1975 . . . . . . . . . . . . . . . . . . . . . . . . . 83
iii
FOREWORD
International trade in conventional arms is flourishing. Its rapid growtb during the past several years has refocused attention on the need to encourage restraint in arms transfers. A primary concern is the degree to which weapons transfers may increase regional tensions and the likelihood of open war. Further, the arms trade conflicts with economic development in several areas of the world.
Curbing the flow of conventional arms is a U.S. policy objective, particularly in areas of tension. But, effective control will require international cooperation in the face of the strong political and economic motives which cause arms producers to furnish military equipment, and customer nations to acquire it.
This report presents knowledge about the extent and trends of worldwide military expenditures and arms transfers, which is a necessary first step to cooperation for restraining the flow of arms. It is intended to contribute to the understanding of the general public, scholars, and government leaders concerned with possible arms control measures.
This report, the ninth and most extensive of the annual series, provides statistical information on national military spending, armed forces, and international transfers of conventional arms. This year it has been expanded to include data on transfers of major weapons systems by type, in addition to the customary dollar values -for all categories of arms transfers.
We recognize our limitations in achieving reliability and comparability of the new weapons data with the data in dollar values; but we believe this information will prove valuable despite the qualifications which must be made.
Many countries do not disclose information on their military programs, so it is necessary to use various means of estimating data. In addition, it is difficult to compare military spending, forces, and activities among countries. Nevertheless, we continue to strive to improve these comparisons.
This publication will help focus attention on the nature and magnitude of the problems of global military expenditures and worldwide arms transfers, and on the possibilities for bringing about more effective controls.
c. FRED C. IKLE
WORLD MILITARY EXPENDITURES AND ARMS TRANSFERS
1966-1975
INTRODUCTION
This report is intended to provide a comprehensive overview of the world's total military expenditures, armed forces, and arms transfers,
$Billions (Constant 74)
350
I ~ ~ WORLD ~ """""""
300 --v DEVELOPED
--~ ,_fill' ·-~- ...... l ....... ~-1-i-.......
~ 250
200
150
100
DEVELOPING ...... ...... till ~IIIII 11 .....
, ........ •••••• •••• ,,,,,, 50
0
1966 67 68 69 70 71 72 73 74 75
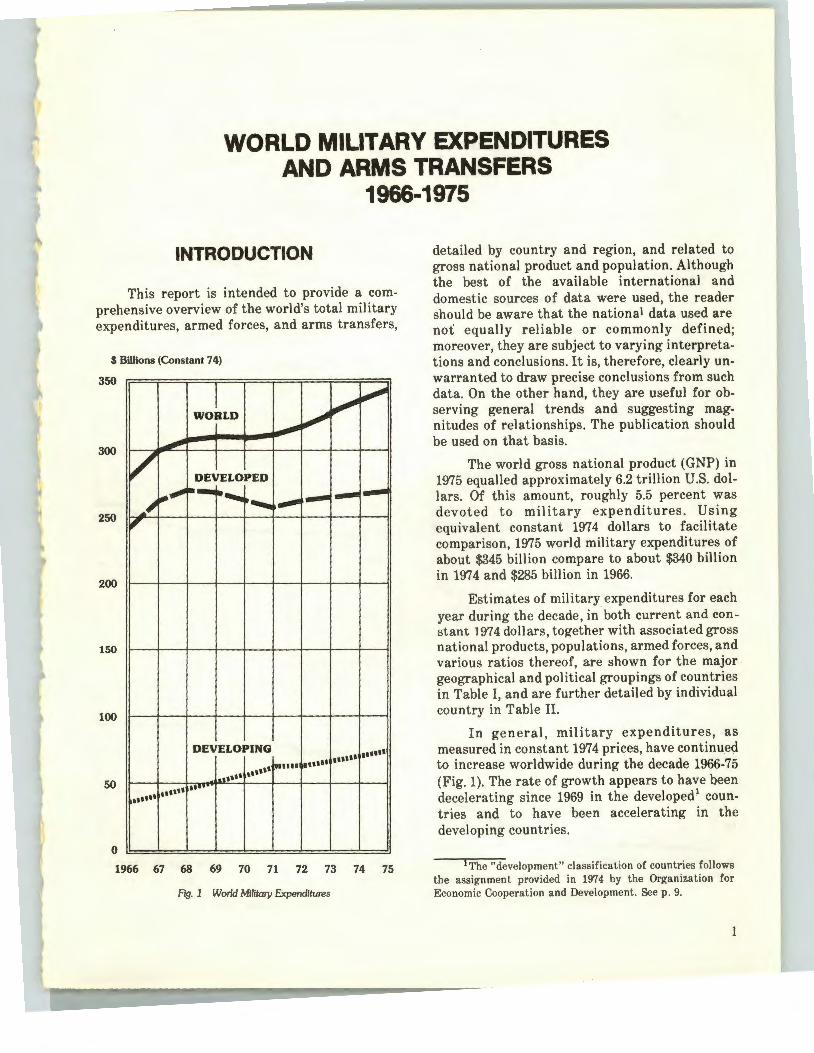
Fig. 1 World Military Expenditures
detailed by country and region, and related to gross national product and population. Although the best of the available international and domestic sources of data were used, the reader should be aware that the national data used are not equally reliable or commonly defined; moreover, they are subject to varying interpretations and conclusions. It is, therefore, clearly unwarranted to draw precise conclusions from such data. On the other hand, they are useful for observing general trends and suggesting magnitudes of relationships. The publication should be used on that basis.
The world gross national product (GNP) in 1975 equalled approximately 6.2 trillion U.S. dollars. Of this amount, roughly 5.5 percent was devoted to military expenditures. Using equivalent constant 197 4 dollars to facilitate comparison, 1975 world military expenditures of about $345 billion compare to about $340 billion in 1974 and $285 billion in 1966.
Estimates of military expenditures for each year during the decade, in both current and constant 1974 dollars, together with associated gross national products, populations, armed forces, and various ratios thereof, are shown for the major geographical and political groupings of countries in Table I, and are further detailed by individual country in Table II.
In general, military expenditures, as measured in constant 1974 prices, have continued to increase worldwide during the decade 1966-75 (Fig. 1). The rate of growth appears to have been decelerating since 1969 in the developed 1 countries and to have been accelerating in the developing countries.
I The "development" classification of countries follows the assignment provided in 1974 by the Organization for Economic Cooperation and Development. Seep. 9.
$Billions (Constant 74)
160
150
140
130
120
110
/ -
"' NATO l""'''lllo. ...........
.... ,,, us .... '••· 100 "~~-1---+---+-~k-~~~---+---+~
"' '•• 90 ., ..... ... ,, ...... ,, ,, 80
1966 67 68 69 70 71 72 73 74 75
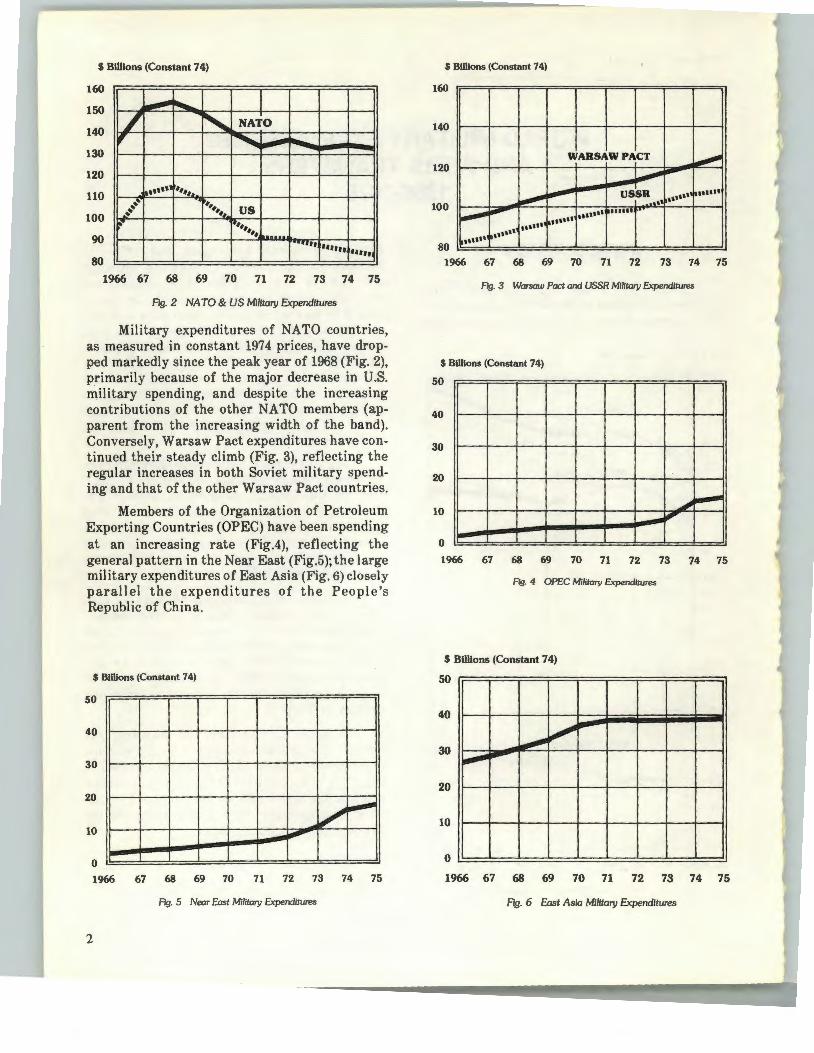
Fig. 2 NATO & US Military Expenditures
Military expenditures of NATO countries, as measured in constant 1974 prices, have dropped markedly since the peak year of 1968 (Fig. 2), primarily because of the major decrease in U.S. military spending, and despite the increasing contributions of the other NATO members (apparent from the increasing width of the band). Conversely, Warsaw Pact expenditures have continued their steady climb (Fig. 3), reflecting the regular increases in both Soviet military spending and that of the other Warsaw Pact countries.
Members of the Organization of Petroleum Exporting Countries (OPEC) have been spending at an increasing rate (Fig.4), reflecting the general pattern in the Near East (Fig.5); the large military expenditures of East Asia (Fig. 6) closely parallel the expenditures of the People's Republic of China.
$Billions (Constant 74)
50
40
30
20
10 _.....,.. 0
1966 67 68 69 70 71 72 73 74 75
Fig. 5 Near East Military Expenditures
2
$Billions (Constant 74)
140 11---1---1--+--+--+--+--+--+--~
WAR 120
100 I ___........~ ''''''' en•n ,..........- ,,,,,, ,. ...... ,,,,,, ,,,,,,
80 1966 67 68 69 70 71 72 73 74
Fig. 3 Warsaw Pact and USSR Military Expenditures
$Billions (Constant 74)
50
40
30
20
10
0
75
1966 67 68 69 70 71 72 73 74 75
Fig. 4 OPEC Military Expenditures
$ Billions (Constant 74)
50
40
20
10
0 t.=~===~=======:::::!!::=:=::::!::=::::=::::!==.l
1966 67 68 69 70 71 72 73 74 75
Fig. 6 East Asia Military Expenditures
$Billions (Const~nt 74)
6
5
.....,
.....-/' 4
3
2 -v -1
0
1966 67 68 69 70 71 72 73 74 75
Fig. 7 Africa Military Expenditures
$Billions (Constant 74)
6
5 ~ l/ ~
4 ~ ........
3 II""'
2
1
0
1966 67 68 69 70 71 72 73 74 75
Fig. 8 Latin America Military Expenditures
$Billions (Constant 74)
6
5
4 .., """"""" --3
2
1
0
1966 67 68 69 70 71 72 73 74 75
Fig. 9 South Asia Military Expenditures
$Billions (Constant 74) 12
....., . 10
~-··· ·~ ~ WORLD
'#~
'r.l•• 111111 ''"!.'''"• ,. ..... EXPORTS - DEVELOPED
8
6
4 IMPORTS - DEVELOPED
~. ~· ~-~--- ........ """""" .....
......._~ 2
0
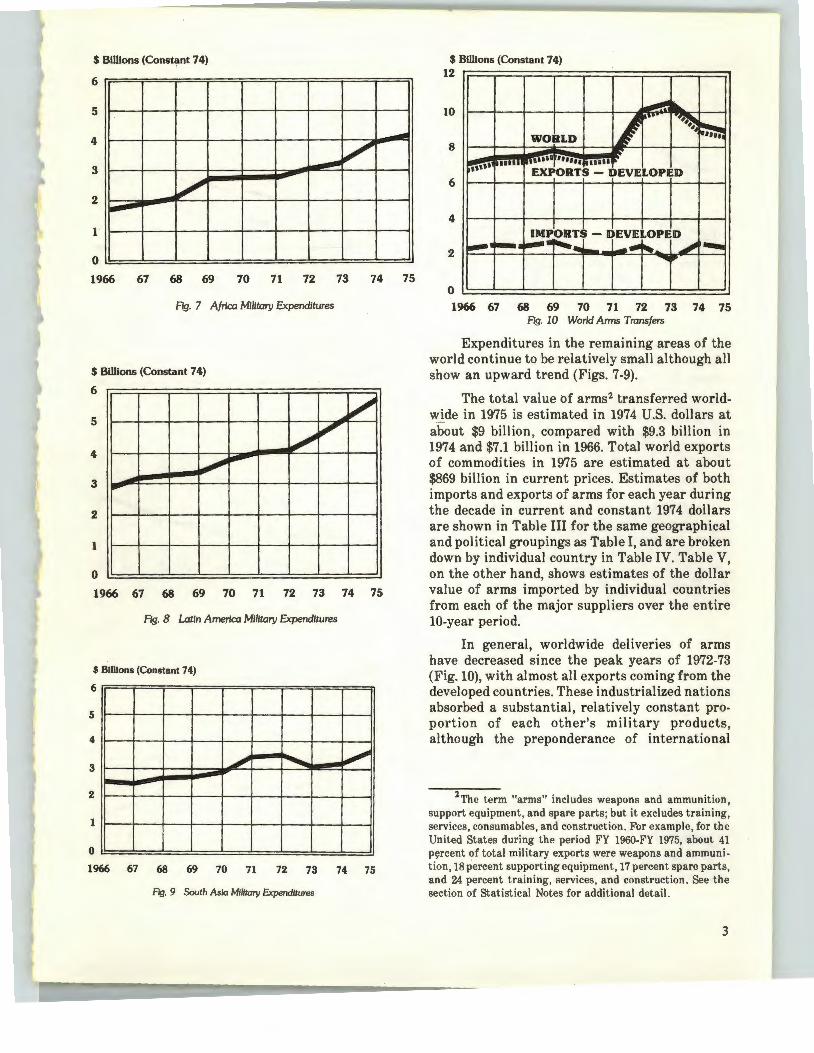
1966 67 68 69 70 71 72 73 74 75 Fig. 10 World Arms Transfers
Expenditures in the remaining areas of the world continue to be relatively small although all show an upward trend (Figs. 7-9).
The total value of arms2 transferred worldwide in 1975 is estimated in 1974 U.S. dollars at about $9 billion, compared with $9.3 billion in 1974 and $7.1 billion in 1966. Total world exports of commodities in 1975 are estimated at about $869 billion in current prices. Estimates of both imports and exports of arms for each year during the decade in current and constant 1974 dollars are shown in Table III for the same geographical and political groupings as Table I, and are broken down by individual country in Table IV. Table V, on the other hand, shows estimates of the dollar value of arms imported by individual countries from each of the major suppliers over the entire 10-year period.
In general, worldwide deliveries of arms have decreased since the peak years of 1972-73 (Fig. 10), with almost all exports coming from the developed countries. These industrialized nations absorbed a substantial, relatively constant proportion of each other's military products, although the preponderance of international
2 The term "arms" includes weapons and ammunition, support equipment, and spare parts; but it excludes training, services, consumables, and construction . For example, for the United States during the period FY 1960-FY 1975, about 41 p~rcent of total military exports were weapons and ammunition, 18 percent supporting equipment, 17 percent spare parts, and 24 percent training, services, and construction . See the section of Statistical Notes for additional detail.
3

$Billions (Constant 74) $Billions (Constant 74)
7 7
EX~RJS ~ ~ 6 ~ ~
~ ' , 5 5
/ ~ -4 ~ 3 """""'
..... 3 ~
' EXPORTS1..11
IMPORTS II""'" I 2
•••••• ..... •••••• """ ...... 1 ..., ..... ... ,,, ~····"
..... I IIIII I IIIII ...... ,, 1
0
0 1966 67 68 69 70 71 72 73 74 75
1966 67 68 69 70 71 72 73 74 75 Fig. 12 Warsaw Pact A rms Transfers
Fig. 11 NATO Arms Transfers
arms transfers represented imports by the developing countries (as indicated by the area $Billions (Constant 74) between the top and bottom curves of Fig. 10).
7
Over the decade, arms transfers from the NATO countries grew both in gross value (Fig. 11) and in net value (as indicated by the exports and 5
imports curves). The 10-year trend exhibited by the Warsaw Pact countries was relatively con-stant (Fig. 12). 3
Arms imports have been increased by coun-tries in OPEC (Fig. 13). Near East arms imports 1 peaked immediately following the 1973 Arab- ... Israeli War (Fig. 14). The arms imports by East 0
Asian nations have dropped in the last 3 years 1966 67 68 69 70 71 72 73 74 75
(Fig. 15) because of the winding down and subse- Fig. 13 OPECAnns quent cessation of the war in Southeast Asia.
Imports
$Billions (Constant 74) $Billions (Constant 74)
7 7
5 5
J~
3 I '\ - 3
1/ , -
..... 1
_ __..... 1
~ 0 0
1966 67 68 69 70 71 72 73 74 75 1966 67 68 69 70 71 72 73 74 75
Fig. 14 Near East Arms Imports Fig. 15 East Asia Arm s Imports
4
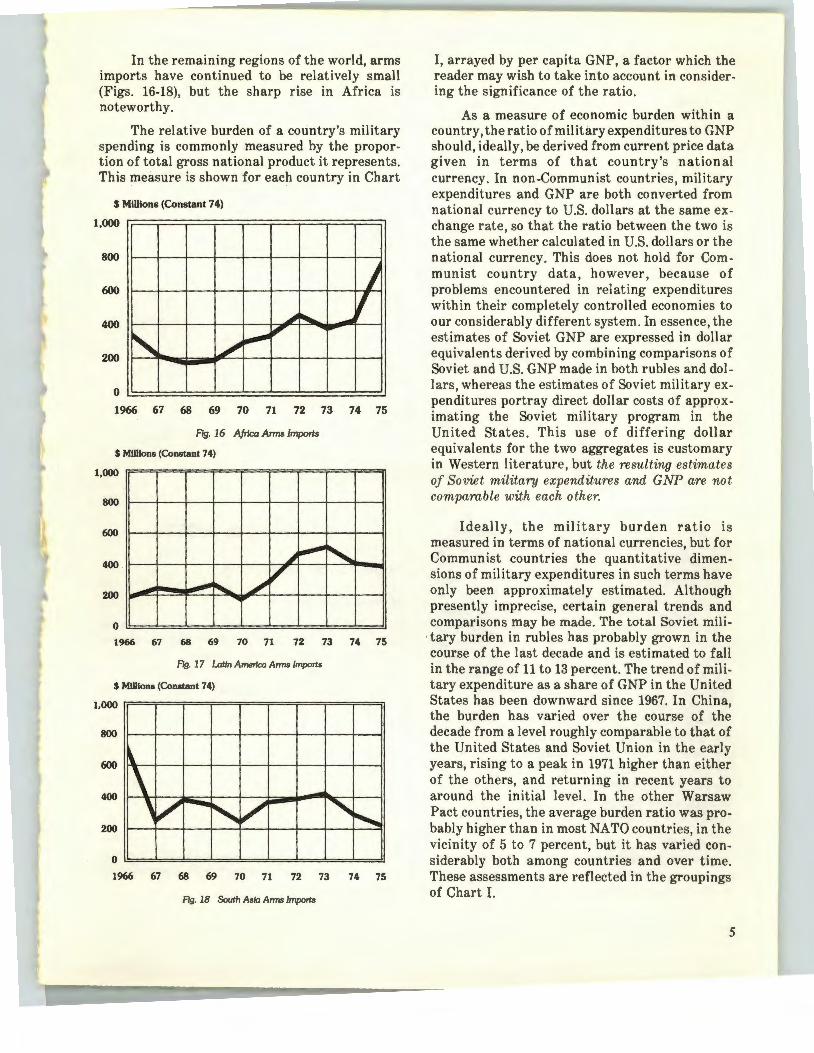
In the remaining regions of the world, arms imports have continued to be relatively small (Figs. 16-18), but the sharp rise in Africa is noteworthy.
The relative burden of a country's military spending is commonly measured by the proportion of total gross national product it represents. This measure is shown for each country in Chart
$Millions (Constant 74)
1,000
800
I _., ~ ....... If
' ~ ~ """" /
600
400
200
0
1966 67 68 69 70 71 72 73 74 75
Fig. 16 Africa Arms Imports
$ Millions (Constant 74)
1,000
800
600 _ .....
~ """" ' .., ........ _/ , 400
200
0
1966 67 68 69 70 71 72 73 74 75
Fig. 17 Latin America Anns Imports
$ MIUions (Constant 74)
1,000
800
~
\ -' , -~ / "" ...........
600
400
200
0
1966 67 68 69 70 71 72 73 74 75
Fig. 18 South Asia Anns Imports
I, arrayed by per capita GNP, a factor which the reader may wish to take into account in-considering the significance of the ratio.
As a measure of economic burden within a country, the ratio ofmilitaryexpenditures to GNP should, ideally, be derived from current price data given in terms of that country's national currency. In non-Communist countries , military expenditures and GNP are both converted from national currency to U.S. dollars at the same exchange rate , so that the ratio between the two is the same whether calculated in U.S. dollars or the national currency. This does not hold for Communist country data, however, because of problems encountered in relating expenditures within their completely controlled economies to our considerably different system. In essence, the estimates of Soviet GNP are expressed in dollar equivalents derived by combining comparisons of Soviet and U.S. GNP made in both rubles and dollars, whereas the estimates of Soviet military expenditures portray direct dollar costs of approximating the Soviet military program in the United States . This use of differing dollar equivalents for the two aggregates is customary in Western literature, but the resulting estimates of Soviet military expenditures and GNP are not comparable with each other.
Ideally, the military burden ratio is measured in terms of national currencies, but for Communist countries the quantitative dimensions of military expenditures in such terms have only been approximately estimated. Although presently imprecise, certain general trends and comparisons may be made. The total Soviet mili-
. tary burden in rubles has probably grown in the course of the last decade and is estimated to fall in the range of 11 to 13 percent. The trend of military expenditure as a share of GNP in the United States has been downward since 1967. In China, the burden has varied over the course of the decade from a level roughly comparable to that of the United States and Soviet Union in the early years, rising to a peak in 1971 higher than either of the others, and returning in recent years to around the initial level. In the other Warsaw Pact countries, the average burden ratio was probably higher than in most NATO countries, in the vicinity of 5 to 7 percent, but it has varied considerably both among countries and over time. These assessments are reflected in the groupings of Chart I.
5
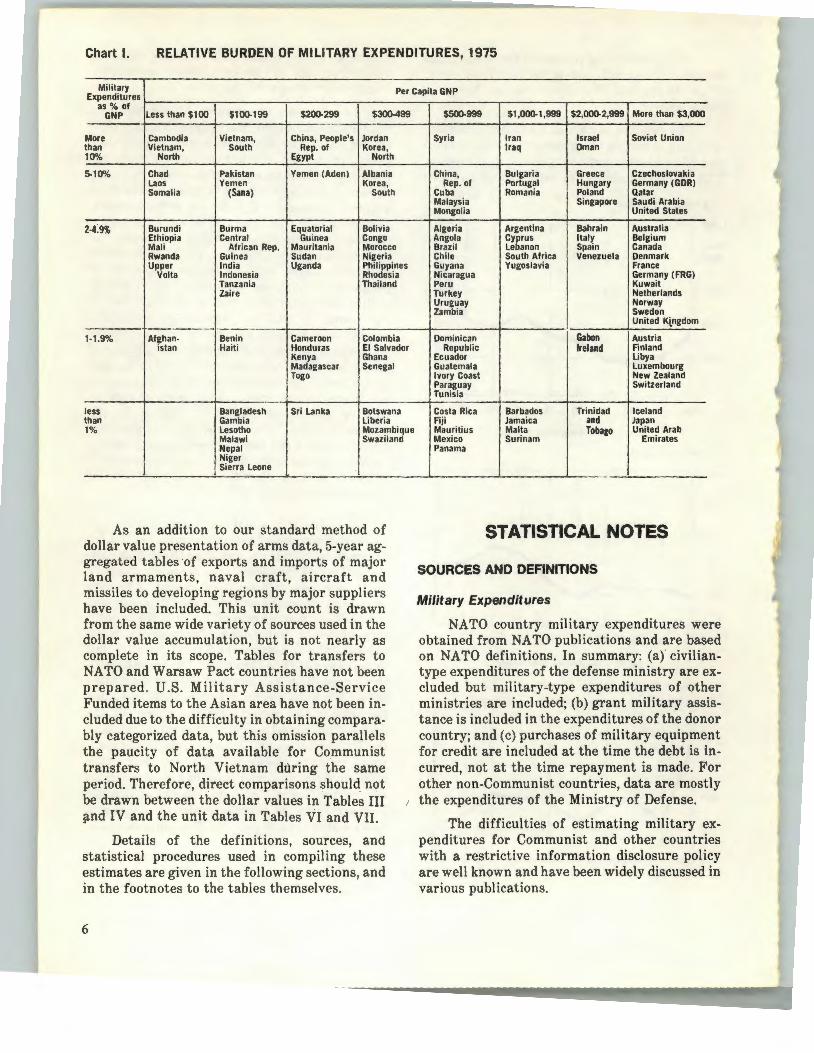
Chart I. RELATIVE BURDEN OF MILITARY EXPENDITURES, 1975
Military Per Capita GNP Expenditures
as% of GNP less than $1 00 $100-199 $200-299 $300-499
More Cambodia Vietnam, China, People's Jordan than Vietnam, South Rep. of Korea, 10% North Egypt North
5-1 0"/o Chad Pakistan Yemen (Aden) Albania Laos Yemen Korea, Somalia (Sana) South
2-("' Burundi Burma Equatorial Bolivia Ethiopia Central Guinea Congo Mali African Rep. Mauritania Morocco Rwanda Guinea Sudan Nigeria Upper India Uganda Philippines
Volta Indonesia Rhodesia Tanzania Thailand Zaire
1-1.9% Afghan- Benin Cameroon Colombia istan Haiti Honduras El Salvador
Kenya Ghana Madagascar Senegal Togo
less Bangladesh Sri Lanka Botswana than Gambia liberia 1% Lesotho Mozambique
Malawi Swaziland Nepal Niger Sierra Leone
--
$500-999 $1,000-1,999 $2,000-2,999 More than $3,000
Syria Iran Israel Soviet Union Iraq Oman
China, Bulgaria Greece Czechoslovakia Rep. of Portugal Hungary Germany (GDR)
Cuba Romania Poland Qatar Malaysia Singapore Saudi Arabia Mongolia United States
Algeria Argentina Bahrain Australia Angola Cyprus Italy Belgium Brazil lebanon Spain Canada Chile South Africa Venezuela Denmark Guyana Yugoslavia France Nicaragua Germany (FRG) Peru Kuwait Turkey Netherlands Uruguay Norway Zambia Sweden
United Ktngdom
Dominican Gabon Austria Republic Ireland Finland
Ecuador libya Guatemala Luxembourg Ivory Coast New Zealand Paraguay Switzerland Tunisia
Costa Rica Barbados Trinidad Iceland Fiji Jamaica and Japan Mauritius Malta Tobago United Arab Mexico Surinam Emirates Panama
STATISTICAL NOTES
SOURCES AND DEFINITIONS
Military Expenditures
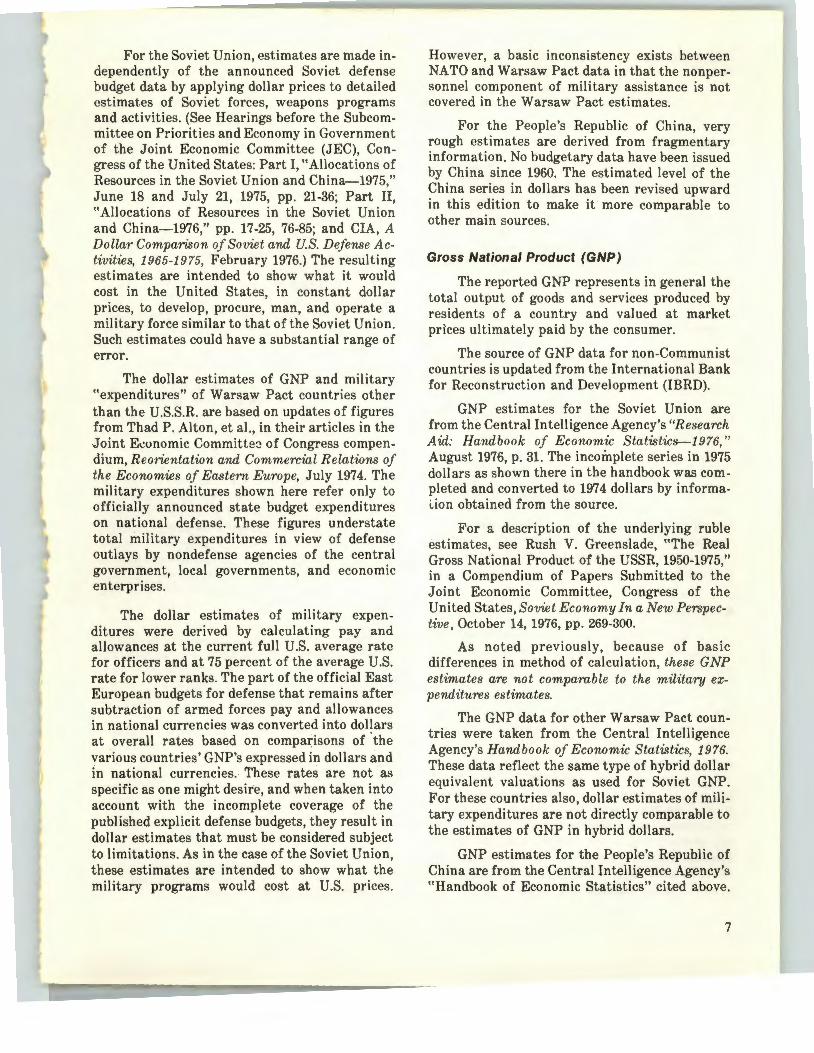
NATO country military expenditures were obtained from NATO publications and are based on NATO definitions. In summary: (a) civiliantype expenditures of the defense ministry are excluded but military-type expenditures of other ministries are included; (b) grant military assistance is included in the expenditures of the donor country; and (c) purchases of military equipment for credit are included at the time the debt is incurred, not at the time repayment is made. For other non-Communist countries, data are mostly
As an addition to our standard method of dollar value presentation of arms data, 5-year aggregated tables ·of exports and imports of major land armaments, naval craft, aircraft and missiles to developing regions by major suppliers have been included. This unit count is drawn from the same wide variety of sources used in the dollar value accumulation, but is not nearly as complete in its scope. Tables for transfers to NATO and Warsaw Pact countries have not been prepared. U.S. Military Assistance-Service Funded items to the Asian area have not been included due to the difficulty in obtaining comparably categorized data, but this omission parallels the paucity of data available for Communist transfers to North Vietnam during the same period. Therefore, direct comparisons should not be drawn between the dollar values in Tables III 51-nd IV and the unit data in Tables VI and VII.
1 the expenditures of the Ministry of Defense.
Details of the definitions, sources, and statistical procedures used in compiling these estimates are given in the following sections, and in the footnotes to the tables themselves.
6
The difficulties of estimating military expenditures for Communist and other countries with a restrictive information disclosure policy are well known and have been widely discussed in various publications.
For the Soviet Union, estimates are made independently of the announced Soviet defense budget data by applying dollar prices to detailed estimates of Soviet forces, weapons programs and activities. (See Hearings before the Subcommittee on Priorities and Economy in Government of the Joint Economic Committee (JEC), Congress of the United States: Part I, "Allocations of Resources in the Soviet Union and China-1975," June 18 and July 21, 1975, pp. 21-36; Part II, "Allocations of Resources in the Soviet Union and China-1976," pp. 17-25, 76-85; and CIA, A Dollar Compamon of Soviet and U.S. Def ense Activities, 1965-1975, February 1976.) The resulting estimates are intended to show what it would cost in the United States, in constant dollar prices, to develop, procure, man, and operate a military force similar to that of the Soviet Union. Such estimates could have a substantial range of error.
The dollar estimates of GNP and military "expenditures" of Warsaw Pact countries other than the U.S.S.R. are based on updates of figures from Thad P. Alton, et al., in their articles in the .Joint Et:onomic Committe~ of Congress compendium, Reorientation and Commercial R elations of the Economies of Eastern Europe, July 197 4. The military expenditures shown here refer only to officially announced state budget expenditures on national defense. These figures understate total military expenditures in view of defense outlays by nondefense agencies of the central government, local governments, and economic enterprises.
The dollar estimates of military expenditures were derived by calculating pay and allowances at the current full U.S. average rate for officers and at 75 percent of the average U.S. rate for lower ranks. The part of the official East European budgets for defense that remains after subtraction of armed forces pay and allowances in national currencies was converted into dollars at overall rates based on compaz:isons of ·the various countries' GNP's expressed in dollars and In national currencies. These rates are not as specific as one might desire, and when taken into account with the incomplete coverage of the published explicit defense budgets, they result in dollar estimates that must be considered subject to limitations. As in the case of the Soviet Union, these estimates are intended to show what the military programs would cost at U.S. prices.
However, a basic inconsistency exists between NATO and Warsaw Pact data in that the nonpersonnel component of military assistance is not covered in the Warsaw Pact estimates.
For the People's Republic of China, very rough estimates are derived from fragmentary information. No budgetary data have been issued by China since 1960. The estimated level of the China series in dollars has been revised upward in this edition to make it more comparable to other main sources.
Gross National Product (GNP)
The reported GNP represents in general the total output of goods and services produced by residents of a country and valued at market prices ultimately paid by the consumer.
The source of GNP data for non-Communist countries is updated from the International Bank for Reconstruction and Development (IBRD).
GNP estimates for the Soviet Union are from the Central Intelligence Agency's "Research Aid: Handbook of Economic Statistics-1976," August 1976, p. 31. The incomplete series in 1975 dollars as shown there in the handbook was completed and converted to 1974 dollars by informai.ion obtained from the source.
For a description of the underlying ruble estimates, see Rush V. Greenslade, "The Real Gross National Product of the USSR, 1950-1975," in a Compendium of Papers Submitted to the Joint Economic Committee, Congress of the United States, Soviet Economy In a New Perspective , October 14, 1976, pp. 269-300.
As noted previously, because of basic differences in method of calculation, these GNP estimates are not comparable to the military expenditures estimates.
The GNP data for other Warsaw Pact countries were taken from the Central Intelligence Agency's Handbook of Economic Statistics, 1976. These data reflect the same type of hybrid dollar equivalent valuations as used for Soviet GNP. For these countries also, dollar estimates of military expenditures are not directly comparable to the estimates of GNP in hybrid dollars.
GNP estimates for the People's Republic of China are from the Central Intelligence Agency's "Handbook of Economic Statistics" cited above.
7
JEC compendium: China: A Reassessment of the Economy, July 10, 1975. Estimates for Albania, Cuba, Mongolia, North Korea, and North Vietnam are rough approximations.
Population
Population estimates given are for midyear and are supplied by the International Statistical Program Center, Bureau of the Census, U.S. Department of Commerce. Data on the People's Republic of China are midyear estimates prepared by the Foreign Demographic Analysis Division, Bureau of Economic Analysis, U.S. Depart-. ment of Commerce.
Armed Forces
Armed forces refer to active-duty military personnel, including paramilitary force!'\ where those forces resemble regular units in their organization, equipment, training, or mission. Reserve forces are not included unless specifically noted.
Figures for the United States represent midyear totals and are from "Active Duty Military Personnel by Selected Periods," U.S. Department of Defense, Office of the Assistant Secretary of Defense (Comptroller), July 23, 1975. Estimates of the number of men under arms for other countries were provided by U.S. Government sources.
Arms Transfers
Arms transfers represent the international transfer under grant, credit, or cash sales terms of military equipment usually referred to as "conventional," including weapons of war, parts thereof, ammunition, support equipment, and other commodities considered primarily military in nature. Among the items included are tactical guided missiles and rockets, military aircraft, naval vessels, armored and nonarmored military vehicles, military communications and electronic equipment, artillery, infantry weapons, small arms, ammunition and other ordnance, parachutes, and uniforms. Also included are transfers of equipment for defense industries. Excluded by definition are nuclear, chemical, and biological weapons, and strategic missile systems. Also excluded are foodstuffs, medical
8
equipment, and other items potentially useful to the military but with alternative civilian uses. Training and technical services are not included. The statistics published here are estimates of the value of goods actually delivered during the reference year, in contrast to the value of programs, agreements, contracts, or orders which may result in a future transfer of goods. Furthermore, the data represent arms transfers to governments and do not include the value of arms obtained by subnational groups.
For U.S. figures, ACDA used official trade statistics on arms transfers compiled by the U.S. Bureau of the Census and information provided by the U.S. Department of Defense.3 For data on foreign countries, ACDA used official U.S. Government sources. The difficulties in collecting information on the full scope of Soviet deliveries and in placing a value on them make it possible that the Soviet figure is understated.
Close comparisons are not warranted between the values shown for arms transfers and the estimates of GNP and military expenditures. The disparities among national economic systems generate differences in the extent to which weapons prices represent true production costs in different nations. In particular, the relative economic value of arms to supplier and recipient may be considerably different. Furthermore, much of the international arms trade involves barter arrangements, multiyear loans, discounted prices, third-party payments, and partial debt forgiveness. Thus, acquisition by a nation of some given quantity of armaments does not necessarily impose the burden on its economy
3The data for the Military Assistance Program, Foreign Military Sales, and commercial sales components of U.S. arms exports prior to 1974, wh·ich were compiled under contract for ACDA by the U.S. Department of Com: merce, may vary from the data compiled by the Departments of State and Defense under those categories for the following reasons:
(1) All arms transfer data in this publication are by calendar year, whereas the Departments of State and Defense data are compiled by fiscal year;
(2) The ACDA data reflect exports of military equipment only, while the Department of Defense data include the value of training, services, and POL; and
(3) The ACDA data include some categories of dual civil-military use equipment, e.g., certain categories of transportation and communications equipment, that are not on the U.S. Munitions Control List and thus are not included in the Departments of State and Defense data.
that is implied by the estimated equivalent U.S. dollar value of the shipment . Therefore, the economic value of arms imports should not be related to detail to the local economies.
COVERAGE AND GROUPING OF COUNTRIES
This report lists data for 142 countries.
Of the present U.N. membership of 149, the following are not included: the Byelorussian and Ukrainian Soviet Socialist Republics (constituent republics of the Soviet Union, both included within totals for the Soviet Union), and the Bahamas, Bhutan, Cape Verde, Grenada, the Maldives, Seychelles, and S~o Tome and Principe (developing nations for which data are not generally available). Nine other independent states with a combined total1975 population of approximately 2.3 million are also excluded.
Of those countries that are not members of the United Nations, seven are included: the Republic of China, the two Koreas, Switzerland, Southern Rhodesia, and the two Vietnams. (Both Vietnams are listed due to the yearly coverage.)
Of the reported countries, 15 became independent after 1966. Data for them are normally shown in the tables beginning with the first year in which they were independent for more than 6 months. However, imputations have been made for earlier years, where appropriate, in calculating regional totals.
The regional country groupings shown are conventional except as follows: "North America" consists only of the United States and Canada; Mexico is included with Central and South America as "Latin America." Also, Egypt is assigned to the "Near East" rather than to "Africa." "Oceania" includes only Australia, New Zealand, and Fiji.
For the political groupings, NATO (North Atlantic Treaty Organization) consists of the North American nations plus European NATO: Belgium, Denmark, France, West Germany, Greece, Iceland, Italy, Luxembourg, Netherlands, Norway, Portugal, Turkey, and the United Kingdom. The Warsaw Pact consists of Bulgaria, Czechoslovakia, East Germany, Hungary, Poland, Romania, and the Soviet Union. OPEC (Organization of Petroleum Exporting Countries) is made up of Iran, Iraq, Kuwait, Qatar, Saudi Arabia, and
the United Arab Emirates in the Near East; Indonesia in East Asia; Algeria, Gabon, Libya, and Nigeria in Africa; and Ecuador and Venezuela in Latin America.
The 28 countries classed as "developed" in this publication are all those included in North America; in Oceania (except Fiji); in European NATO except Greece and Turkey; and in the Warsaw Pact except Bulgaria; plus Austria, Finland, Ireland, Japan, South Africa, Sweden, and Switzerland. All other nations are classed as "developing." For non-Communist countries, assignment to one or the other category follows the practice previously employed by the Development Assistance Committee (DAC) of the Organization for Economic Cooperation and Development (OECD). This assignment is based partly on GNP per capita, but also reflects factors such as national literacy, mortality rates, levels of industrialization, and terms of trade.
Most of the data shown represent expenditures during calendar years. For some countries, however, the figures are for the fiscal year containing the most months in that calendar year; e.g., a fiscal year of April1975 to March 1976 would be included as 1975. July-June fiscal years were shown in either the column for the first half or the second half of the fiscal year, depending on the availability of data. GNP figures of those countries for which calendar year data are not available were included in the same manner.
A listing of the countries comprising each region or group can be found in Table V, and developed countries are denoted there with an asterisk.
COMPUTATIONAL PROCEDURES
NON-COMMUNIST COUNTRIES
Prices
Widespread inflation and sharp price swings in primary commodities over the past decade introduce significant distortions into the data when expressed in current prices. The armaments procurable for a million U.S. dollars at the prices prevailing in 1966 cost considerably more
9
dollars at prices prevailing in 1975. Thus, the reporting of annual purchases only in prices prevailing in each year, or current prices, would present an impression of growth in military expenditures and arms transfers which would seriously misrepresent the trend in total outlay for defense goods and services and the physical acquisition of armaments. Yet no simple adjustment for prices is entirely valid. Inflation rates vary among nations; in particular, they often differ between supplier and recipient for a given series of arms transfers . Furthermore, the inflation rate for a nation's economy as a whole is not necessarily representative of those economic sectors particularly involved in the production of armaments. Unfortunately, no general basis exists for separating out the special impact of inflation on the armament-related sectors of different nations' economies .
Nevertheless, inflation is clearly a very significant factor in analyzing the trend of military expenditures, arms transfers, and GNP over the last decade .. For this reason, in addition to showing trends in current prices, the trends of military expenditures, arms transfers, and GNP are also shown in constant prices, i.e., expenditures in each year valued at 1974 prices.
Estimates of the values of arms transfers for all countries as shown in Tables III and IV were made initially in terms of current U.S. dollars, so the implicit deflator for U.S. GNP data was used to derive arms transfers in constant 1974 prices as follows:
1966 = 65.94 1967 = 67.88 1968 = 70.93 1969 = 74.50 1970 = 78.48
1971 = 82.48 1972 = 85.90 1973 = 90.89 197 4 = 100.00 1975 = 109.31
The source ·data for military expenditures and GNP, however, were obtained in terms of local currencies. Approximate compensation for the effects of inflation was made by "deflating" the current local currency values to constant 1974 local currency values and then converting to U.S. dollar equivalents.
For non-Communist countries, national accounts data were available in local currency in current prices and in constant prices of varying base years. The constant price figures were shifted from the country base year to the 1974 base year with the underlying trend maintained.
10
GNP price indices (deflators) were then derived for each country and used to deflate military expenditures to constant prices with the following ex~eptions:
a) For OPEC countries, use of the GNP deflator created distortions because of the atypical oil price increases, so special deflators were developed for the non-oil sectors of the economy of each country.
b) Israel has experienced a high rate of inflation in recent years, but its large arms purchases in the United States were subject to less severe inflation. A special deflator was derived by applying the index of prices of U.S. Government purchases of durable goods to Israel's foreign arms purchases and the Israel GNP deflator to domestic arms purchases.
Conversion to Dollars
Since constant price data for GNP and military expenditures are given with 1974 as the base year, a 1974 exchange rate was used to convert the constant price national currency data to dollars in all years. In general the rates used are the 1974 average par/market exchange rate as supplied by IBRD.
An example may help in understanding this process:
1966 Austrian MILEX = 3474 million 1966 schillings (AS)
1966 Austrian GNP deflator ("price index") = 65.3
1974 Austrian deflator = 100.0 1966 Austrian MILEX = 3474 X 100.0 ...,... 65.3 ·= 5320 million 1974 AS
1974 Austrian/U.S. exchange rate = 18.69 AS per US $1
1966 Austrian MILEX = 5320 + 18.69 285 million 1974 U.S. dollars
For some purposes it may be desirable to have e·stimates of the military exp_enditures and GNP for each country in terms of current U.S. dollars. That is, in terms of the example, one might wish to know Austrian 1966 military expenditures in terms of 1966 U.S. dollars. At first glance it would seem to be necessary only to apply the appropriate 1966 exchange rate to obtain the desired value. That was in fact the method used in early editions of this publication. Unfortunately, this approach produces distortions in
countries where there is a lag between the time the currency becomes over- or under-valued and the time the exchange rate is changed.
A different method for estimating current dollar equivalents of foreign military expenditures and GNP is used here. The constant 1974 dollar values derived as described above have been "re-inflated," using the U.S. GNP deflators in reverse fashion, to generate equivalent current U.S. dollar values for each year. Thus, the successive yearly "current dollar" values include not only the change in real terms, but the effects of general inflation in the United States.
Again using the example of 1966 Austrian military expenditures to illustrate the computational process:
1966 Austrian MILEX = 285 million 1974 U.S. dollars
1966 U.S. deflator (1974 = 100) = 65.94
1966 Austrian MILEX = 285 X 65.94 + 100.0 = 188 million 1966 U.S. dollars
COMMUNIST COUNTRIES
For the Soviet Union and other Warsaw Pact countries, available estimates were already in terms that took account of domestic price changes and had been converted to constant 1974 dollars by the sources using estimated purchasing power parities, rather than official exchange rates . Such series were further converted to current dollar prices prevailing in the United States for each year by use of the U.S. implicit GNP deflator series.
·The previously described problems inherent in comparing arms transfer data with GNP and military expenditure estimates for any countries are particularly significant for transfers between Communist and non-Communist economies, because of the computational differences employed in the two cases.
11
STATISTICAL TABLES
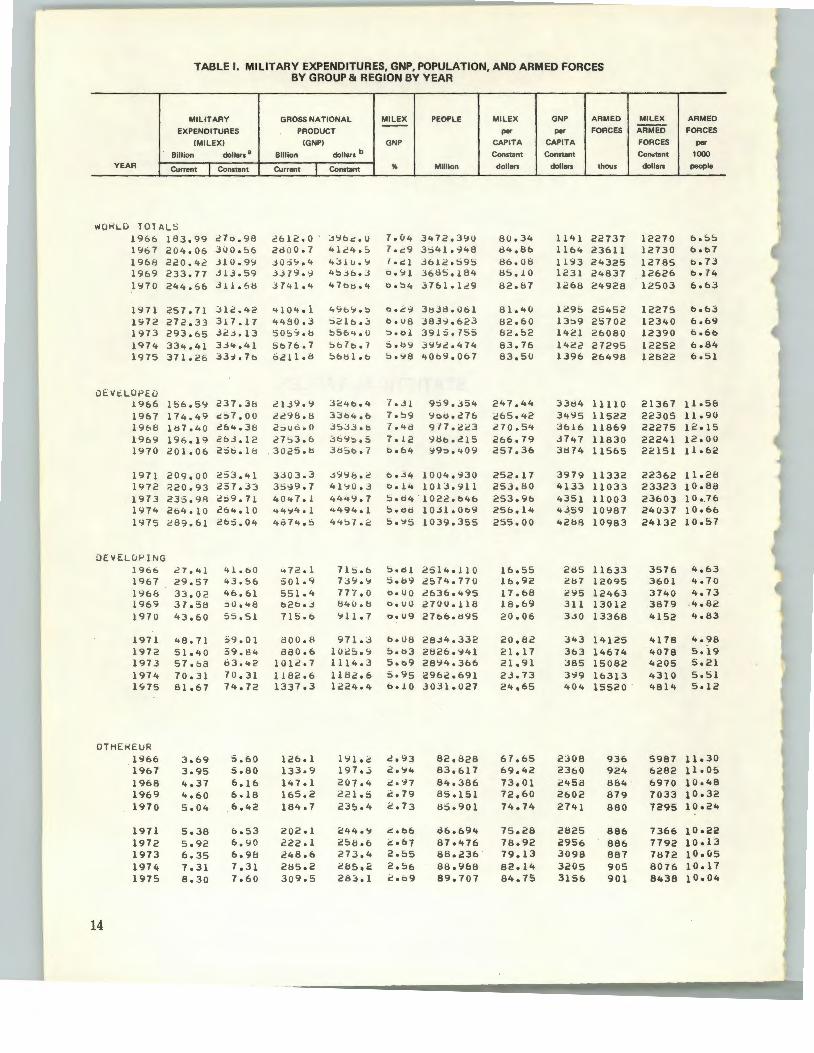
TABLE I. MILITARY EXPENDITURES, GNP, POPULATION, AND ARMED FORCES BY GROUP & REGION BY YEAR
MILITARY GROSS NATIONAL MILEX PEOPLE --EXPENDITURES PRODUCT
(MIL EX) (GNP) GNP
Billion dollars 8 Billion dollars b
YEAR Current J Constant Current I Constant % Million
>'i(JHL U TOlALS 1966 183.99 27d,98 2612 .0 . :,<:~&c:.o 7.04 34 7 2 .390 1 9t>7 2 0 4.06 3uO.S6 2dQ0.7 4124.5 7 • .::9 3~41.948
1968 220.42 3 1 0 . 9':1 3 0:5.,. .4 '+ j1u . ':l I • C: 1 J61d.~9S 1969 233.77 J l3. 59 3379 .':1 4!:>.jb.3 o•'='1 J6ClS.184 1970 244.66 J 11. ">tl 3741.4 47bt>.'+ Oo!:>4 3761.129
1971 257 .71 J12.42 '+104.i <t':tb;,.:, o.c:-i/ 3tJJd.u61 1 9 7 2 272.33 317.17 '+480.3 ::>21b.::S o.u8 383':1.623 197 3 293.65 3cJ.l3 so:,'>.b !:>S6<t , O ::lod1 391::> .7 5:. 1 9 74 334.41 334,41 ':5b76.7 !:>b7b , 7 ~.()~ 3992..474 19 7 5 371.26 ::SJ-:i.7b 6211. l:l Sbt.Jl.b !:>.':78 4069.067
uEVt.LCiPE.u 1966 1:.6.59 23 7. 3B 2139.9 J2<tb o4 ·r .J 1 9~9.354
1967 174.49 C:.-:J7, 00 22':lB.8 3364 ,6 7 .!:> 9 ':iod.276 1968 1 1:l7 .4 0 264.38 2::;uo.o ..l5.:J3.b (. '+8 9 l7.C:c.3 1969 196.19 263.12 27:,3.6 3 b':l:,,5 7.12 ':ll:lb.215 1970 201.06 2~b.l 8 3025.tl Jtl:,b • . , bob4 -;9::>.<t09
1971 209.00 233,41 3303.3 ..l9':i8.2 6 • .j4 1004.':130 1972 220.93 237.33 35-,19.7 41':70.3 b. 14 101:3.911 1973 235 .98 .:!::>9.71 4047.1 444':!.7 !:>od4 "102 2 o646 1974 264.10 264.10 '+4':74.1 '+494.1 :J.d d 1031.069 197 5 289 .61 265,04 4ci74.'=> 4'+!:>(.<::: 5.':15 103':1 .• 355
DEVELCiPING 1966 27 ,41 41.60 '+72 .1 71!:>.6 !:>od1 2514.110 1967 29 .57 43.56 :501.9 739.~ ':5.tl9 2574.770 196& 33.02 46.61 551 .4 1rr. o o.uo 2636.495 1969 37,58 ::>0.'+ 8 62b·j b'+U .& o.vo 270U.118 1970 4 3.60 :.s.s1 715.6 ':111.7 o.u9 2766.b95
1971 48.71 59.01 800 . 8 971,.j b.us 28.:J4.332 1972 51.40 39.!34 aao.6 1025.':1 Sob3 2b26.941 1973 57.68 b3.42 1012.7 1114.3 5.t>9 28':!4.366 1974 70.31 70.31 1182.6 1182.6 5.95 2962.691 1975 81.67 74.72 133-1.3 1224.4 bo! O 3031.027
OTHEKEUR 1966 3.69 5.60 126.1 19l.C: .:!.93 82.828 1967 3.95 s.8o 133.9 197.~ 2.':74 83.617 1968 4.37 6.!6 147.1 20-(.4 co97 84.386 1969 4.60 6.18 165,2 221.5 2.79 85 .!51 1970 5.04 6,42 184.7 235.4 2.73 85.901
1971 5.38 6.53 202·1 244.':1 2.66 d6.694 1972 5.92 6,'10 222.1 258.6 2·67 87.476 1973 6.35 6.9!! 248.6 273 .4 2.55 88.236 1974 7.31 7.31 285 . 2 285,2 2.56 88.Yb8 1975 8.30 7.60 3Q9.5 283.1 2.b9 89.707
14
MILEX GNP
per per
CAPITA CAPITA
Constant Constant
dollars dollars
80.34 1141 d4.8b 1164 86 . 08 1193 85,10 1231 82.B7 1268
81.40 12 9:> 82.60 13::>9 B2.S2 1421 83.76 1422 83 .50 1396
247.44 3384 265.42 3'+95 270.54 3616 266.79 3747 257.36 3tH4
252.17 3979 253,80 4133 253.96 4351 256.14 43.59 255.00 42b8
16.55 21:!5 16.92 287 17.68 295 1 8 .69 311 20.06 3..lO
20.82 343 21.17 363 21,91 385 23.73 399 24.65 404
67.65 2308 69.42 23oo 73.01 2458 72.60 2602 74.74 2741
75.28 2825 78.92 2956 79,13 3098 82.14 3205 84.75 3156
ARM EO
FORCES
thous
22 "737 23611 24325 24837 2492 8
2545 2570 2608 2729 2649
1111 1152 1186 1183 1156
1133 1103 1100 10':18 1098
1163 1209 1246 1301 1336
1412 1467 1508 1631 1552
93 92 88 87 88
88 88 88 90 90
2 2 0 5 8
0 2 9 0 5
2 3 3 7 3
3 5 3 2 8
5 4 2 3 0
6 4
4 9 0
6 6 7 5 1
MIL EX ARMED
ARMED FORCES
FORCES per
Conlitant 1000
dollars people
12270 b.'S:. 12730 6.b7 12785 b.73 12626 bo74 12503 6.63
12275 6.63 12340 6.69 12390 6.66 12252 6.84 12822 6.51
21367 11.58 22305 11.9\.i 22275 12.15 22241 12.00 22151 11.62
22362 11.28 23323 10.88 23603 10 •. 76 24037 10.66 24132 10.57
3576 4.63 3601 4.70 3740 4.73 3879 .4. 82 4152 4.83
4178 4.98 4078 5.19 4205 5.21 4310 5.51 4814 5.12
5987 11o30 6282 11.05 6970 10.48 7033 10.32 7295 10.24
7366 10.22 7792 10o13 7872 10.05 8076 10.17 8438 10.04

TABLE I. MILITARY EXPENDITURES, GNP, POPULATION, AND ARMED FORCES BY GROUP & REGION BY YEAR-Continued
YEAR
r.AT O::.Ut< U 1':1 6 b 1-Jb7 1 '~6 8 1':169 1':17 0
NEA l<
1 9 71 197 2 1973 19 74 197 5
t.AST 1966 1' 96 7
196' 8 196':1' 1970
1971 1972 1':173 1974 1975
AFRICA 1966 1'f67 196 8 1969 197\l
1971 1972 1973 1974 1975
EUKOP~
19 6 6 1967
MILITARY
EXPENDITURES
(MILEX)
Billion dollars a
Current
25 . 2 7 27.1 'i 2 7. :39 211 .7 9 Ju.7 2
33. 83 37.? 2 40.1 <> 4 6 . 03 !:; 0. 8 8
1. 86 2.43 2. 8 8 3.64
\ "·54
5.40 6 . 4 5 9.90
16. t 1:1 1 <>. 15' 1
1.09 1.30 ). 5 3 2.0" 2.16
2.31 2.69 2,98 3.95 ... 67
Constant
Jb.34 4U, 0 3 3 8 , ..;~
38. 6 '1 3".1 ~
41. (J 1 <+3. J o 44. 20 46,03 '+6.44
~. 8 2
3.57 4,06 4.9u 5.78
6. ~ 5
7 •. !::>2 10.89 15. 18 17.52
1. bb 1. eli?
~. 1 b 2. 8 1 2.75
2.80 3.13 3.28 3.95 4,27
90,78 13 1'.64 96,87 142,74
1968 1 04,80 147,70 1969 112.54 1 ~ 1.10 1970 120 , 91 1 5 4,11
i971 131. 67 1 ~ 9.67 1912 140. 81 164,01 }973 154.9 170.53 1974 17S.i3 17o,l3 1975 '.9'? 67 179,05
GROSS NATIONAL
PRODUCT
(GNP)
Billion dollars b
Current
57bo'+ o1co7 o f'-·" h3o3 o 3tt.U
9i) 7.b ~ h b.i::
11uc.7 1234.5 1320.2
39. 8 4"·0 so.o 57.0 65.0
Constant
d73.3 ':luu. J '> ~l.'+
1011. 3 1Ut>-Jo5
11u0.7 ll4',;,t> 1211.1 lc3t,,5 12 'J 7. '+
o O .~
b4.<;, 7().~
7 6 .b bC:, B
':11.9 103.':> 117.2
MILEX
GNP
'to3 9 ~.4 :,
4.0~
..lod3
..JeOb
_,. "( 3
3. I 7 ..,.o:, _,. 1 _,
3.d~
'+.otj ~.:;o
'=>·17 boJ':I bo':i8
-, •• 2
7o'c7 -;,,c:_g
75o!:l 813.':1
1Qb.b 134.9 150.1
134,\1 12oUO 137.6 J.2.74
;:,7,:,
b2o3 6b!9 7bo6 8 8 .4
9"1'. 7 1 0 5 •. 8 117. \;r 139.0 154.4
1184.7 1271.5 1386.2 1528.0 1700.9
1856.9 2007.3 2251·1 2553.8 2790.7
I
87.2 91.7 ':17.2
105.6 110::.7
1lb.4 123.3 129.6 13'i7o0 141.1
,0"':1':>. 3 Hl71,0 1954.0 2u5!o1 216b.O
2251o8 2338.2 2'+74.4 2':>53.8 2!::>52.7
),':;\)
coU9 ~.22
cobb Ce'+4
C:oJ6 c.54 Co~3
Cod4 ~.02
7 ob7 -,. 3
1. ~6 7.J7 7.11
7.09 -,. 0 1 bo!:l9 bob6 7. (J 1
PEOPLE
Million
2':1~.':121
29d.210 j (/ 1),473 303.070 JO::>.ol::J
3u o .343 31u.8':16 313.o20 31,.728 317.724
':10,762 93,384 96.071 9!:l,783
10lo557
104,388 107.311 110.364 ll3o'+79 116.712
283.179 290.441 298,037 305.912 314.072
322.562 331.402 3<+0.5130 350.079 359,896
712ob39 718.738 724.924 ?31.112 737.269
743.1\50 750 . 044 756.288 762,264 71:>7 . 969
MIL EX
per
CAPITA
Constant
dollars
129.51 134,24 129.39 127.66 12d,09
133,00 139,47 1'+0,99 145.79 146,1b
31.06 38,24 42.30 49,56 56.96
62,70 70 ol 0 913,67
142.60 150,11
5,86 6,60 7.24 9.17 8,7b
8,68 9,44 9,64
11.29 11.85
193.13 198,60 203.75 206,68 209.02
214.68 218.67 225.48 229.75 233.15
GNP ARMED MILEX ARMED
per FORCES ARMED FORCES
CAPITA FORCES per
Constant Con;~tant 1000
dollars
2':1~1
3U19 31b7 333 '7 34tl0
3~ -r o 3698 3db3 3':110 3&00
664 b95 733 776 !:l16
tl!:lO 964
1062 1189 1179
308 316 326 3<+5 359
367 372 ::!80 397 392
2519 2603 2695 2805 2941
3028 3117 3272 3350 :J324
thous
3117 3157 3151 ::1146 3146
3211 3291 3241 3236 3046
813 844 841 914 988
1138 1248 1283 1406 1684
544 564 635 686 764
914 949 936 965
1003
9160 9268 9407 9459 9596
9789 9871 9890 9957 9925
dollars people
12301 )0.53 12681 10.:>9 12339 )0.49 12298 )0.38 12443 10.2':1
12772 )Uo41 13175 )0,5':1 13639 10.34 14224 10.25 15246 9.59
3467 4231 4832 5356 5855
8,96 9oll4 8.75 9.2~
9.73
5752 )0.90 6027 1lo63 8487 11ob3
11509 )2.39 10403 14.43
3050 3398 3396 4090 3602
3063 3297 3509 4095 4252
1o92 1o94 2ol3 2.24 2.43
2.83 2.86 2.75 2.76 2,79
15026 )2.85 15401 )2.89 15701 )2.98 15974 12.94 16059 13.02
16311 13.16 16616 13.16 17242 13.08 17588 13.06 18041 12.92
15
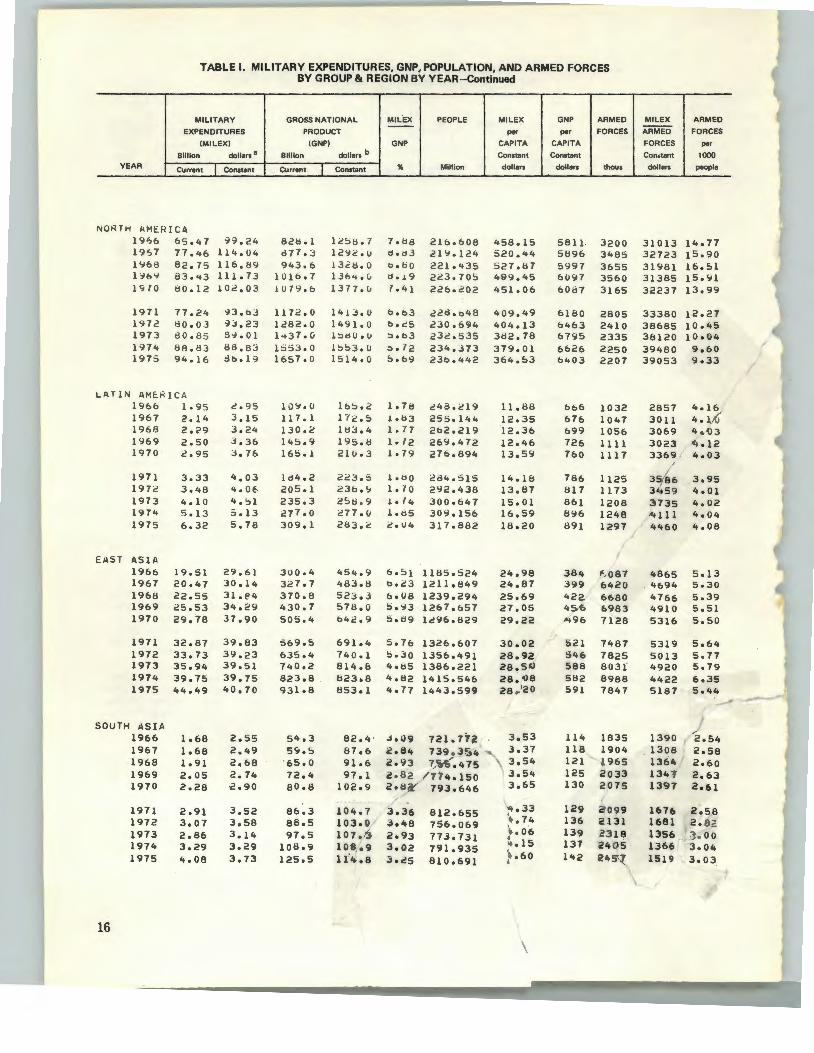
TABLE I. MILITARY EXPENDITURES, GNP, POPULATION, AND ARMED FORCE s
MILITARY
EXPENDITURES
(MILEXI
Billion dollars 8
YEAR Current I Constant
NORrH AMERICA 1966 65 .47 99 . 24 19?7 77.46 lilt. 04 1':168 82 .7 5 116.H9 1 '::16'1 83 .43 111.73 1'i70 80.12 102.03
1971 77.24 -:13.bj 1972 80 . 03 93.23 1973 80 . 85 5':1.01 1':174 138 . 83 88 . 83 1975 94. 16 tlb.19
LAriN AMERIC A 1966 lo95 2.95 1967 2. 14 3 .15 1968 2.?9 3.24 1':169 2.50 3.36 1970 2.95 3. '76
1971 3.33 '+.03 1972 3.48 <+.06 1973 4.10 '+.51 1974 5.13 5.13 197 5 6.32 5.78
EAST ASIA 1966 19.51 29.61 1967 20.47 30.14 1968 22.55 3l.e4 1969 25.53 34.2\1 1970 29.78 37.90
1971 32.87 39.83 1972 33.73 39.23 1973 35.94 39.51 1974 39.75 39.75 1975 44.49 40.70
SOlJTH ASIA 1966 1.68 2.55 1967 1.68 2.49 1968 1o91 2.68 1969 2.05 2.7 .. 1970 2.28 ·2 . 90
1971 2.91 3.52 1972 3.07 3.58 1973 2.86 3.14 1974 3.29 3.29 1975 4o08 3. 73
16
BY GROUP & REGION BY YEAR-Continued
GROSS NATIONAL MILEX PEOPLE MILEX --PRODUCT per
(GNPI GNP CAPITA
Billion dollars b Constant
Current I Constant " Million dollars
82tlo1 1~5H.7 7.Ha 216.608 458.15 8 '77. 3 129~.\J d od3 21':1.124 S20.'+4 943.6 132b.O Ool:iO 221.435 527.1H
1016o7 1364oV do!9 223.705 499.45 1079.6 1317.\J 7. 41 226.202 451.06
117~.0 1'+!3.0 bo63 22d.o48 409.49 1282.0 1491.0 6.~5 230.694 404.13 1 .. 37 .0 1::.dUo\J :>ob3 232.535 3!:!2.78 1:353.0 1=>:,3.u :;, • 7 2 234.373 379.01 1657.0 1514.0 5.69 23bolt42 364.53
1()':1.0 16:,.2 1.78 248.219 11.88 117. 1 1-, 2. 5 !ob3 255.144 12.35 130.2 11:!3.<+ l. ( 7 262.219 12.36 145.9 195.8 1 . ( 2 269.472 12.46 165.1 2l\J o 3 1.79 276.894 13.59
184.2 2<::3 . 5 l o!jO 284 . 515 14.18 205.1 23b .<;. 1.70 292.438 13.1:!7 235.3 25!:!.9 1. 7 4 300o647 15.01 277.0 277 .u 1.!j5 309.156 16.59 309 .1 283 . 2 i:'oU4 317.882 18.20
300.4 45<+.9 6o51 1185.524 24.98 327.7 <t83o8 bo23 1211.849 24.87 370.8 523 .3 6oU8 1239.294 25.69 430.7 578.0 5.93 1267.657 27.05 505.4 b42.9 5.!j9 1296.829 29.22
569 .5 691.4 5o76 1326.607 30.02 635.4 740.1 5o30 1356.'+91 28.92 7<+0.2 814.b 4otl5 1386.221 28. 5'J 823.8 823.8 '+o82 1415.546 28.<08 93lo8 853.1 '+o77 1<+'+3.599 28 r '20
54.3 82.4 · .joU9 721.772 3.53 59.5 87.6 2.84 739.3":.4 3.37
' 65. 0 91.6 2.93 7 ~o.47s 3.54 72.4 97.1 2 o82 / 774.150 3.54 80.8 102.9 2. tiC' 793.646 3.65
86.3 10'+.7 3.36 812.655 -<~ .33
88.5 103.0 / 3.48 756.069 .4. 74
97.5 107.') 2o93 773.731 · .•• 06
108o9 108.9 3.02 791.935 ~.15 125.5 11'4-.8 3o25 810.691 ·~ . 60
'
GNP
per
CAPITA
Constant
dollars
5811. 5H96 5997 6097 6087
6180 6463 6795 6626 6403
bo6 676 699 726 760
786 817 861 896 891
384 399 422. 4$.6 '-+96
521 54 6 588 582 591
114 118 121 125 130
129 136 139 137 142
A RMED
ORCES F
t hous
3 200 3 485 3 655 3 560 3 165
2
2 2
2805 410
2335 250 207
1 032 1 047 1 056 1 111 1 117
1 125 1 173 1 208 1 248 1 297
,. , 087 6420 6680 6983 7128
7487 7825 8031' 8988 7847
1835 1904
965 2033 2075
~
2 i? 2 2
~099
131 318 405 457
MIL EX ARMED
ARMED FORCES
FORCES per
Con~tant 1000
dollars people
31013 14o77 32723 15.90 31981 16.51 31385 15o\11 32237 13.99
33380 12.27 38685 10.45 38120 10o0'+
/ 39480 9.60 39053 9.33
2857 '+o16 3011 4.1 3069 .. .. 03 3023 4.12 3369 , 4.03
35; 86 3.95 3'+59 '+o01 :)735 4.02 4111 4o04 4460 4.08
I
4865 Sol3 '+694 So30 4766 5.39 4910 s.51 5316 5.50
5319 5.64 5013 So77 4920 5o79 4422 6.35 5187 5.44 -1390 '2. 54 1308 2.58 1364 2o60 134 1 2.63 1397 2o61
1676 2o58 1681 2.8 _ 1356 ; .oo 1366 3o04 1519 3.03

TABLE I. MILITARY EXPENDITURES, GNP, POPULATION, AND ARMED FORCES BY GROUP & REGION BY YEAR-Continued
MILITARY
EXPENDITURES
(MILEX)
Billion dollars 8
YEAR Current Constant
0Ct.J.<N1A 1966 1967 1968 196':1 1970
1. 66 l. 71 l. 71 1. 99 1.93
2 . 52 2 . 52 2.41 2 . 6 7 2.45
NATU
OPE<.;
PACT
19 71 1972 1973 1974 1975
1.98 2 .07 2 .04 2. 16 2.74
2.40 2 . 4 1 2 . 25 2 .1 6 2.51
1 966 90.74 1~r.so
1967 104. 61 15~.07
1968 110.34 1~5.77 1969 112.22 150.42 197 0 110. ~4 141.1 8
1971 111.07 134.64 197 2 117. 25 1Jb. 59 1973 1 2 1.03 133.21 197 4 134.86 134.86 197 5 14 5 .04 1~2.63
1966 1967 19 68 1969 1970
1971 1972 1973 1974 1975
1966 1967 1968 1969 1970
1971 1972
1.38 2.02 2.38 3.19 3.41
4.11 4.96 6.20
13.14 15.01
61.81 65.78 72.85 79.15 85.15
2. 10 2 .97 3.36 4.2b '+ .33
4.9C:,O s. ·r 8 b.82
13.14 13.73
93.69 96.90
102.66 10b.23 10d.54
92.46 112.13 97.67 113.75
1973 108.44 11~.34 1974 121.79 121.79 1975 136.49 125.01
GROSS NATIONAL
PRODUCT
(GNP)
Billion dollars b
Current
Jb.2 41.4 44.6 ~0 .7
~b . 2
6 1. 7 67 .4 l4.4 u6 . 3 ':13 . 2
1404.:. 1490 . 0 1b1b.!::> 1770.0 1 'H3.6
2079.6 2268.2 2539.7 27!37.5 2977.2
63.8 69.9 7<;.7 ~O.I:l
104.7
117.9 134.0 159.7 199.1 222.0
4BC!.3 524.8 564 •. 3 609.5 682.2
7<+7.3 799.0 899.9
1034.1 1161.0
Constant
5b . (J 0 l ' • ..,
62.':i cc; .u 1 1 • ·r
7 <+.7 7b ... l:ll . b do.~
o:..1
21Jc:.u 2192 .3 2279 ... 237:;,., 2440.5
25L:> . 7 2o<+O.B 2791~1 2H37 . :_ C:72}.4
96.7 103.1 11C:.2 122.0 13J.3
1<+3.0 15bd 17'::>.7 }C,.9.1 203.~
730.1::1 77".;.4 79':> •• l:llb.2 b6".1
YOo.~
929.8 990.0
1034.1 1062.2
MILEX
GNP
..... .,4
... q ~.b ..
-'·'='3 .Je'+2
.JeC:}
..>.()7 c:..75 c:.=>u C:e':15
b.'+:i
/e\JJ o.d3
b·~3
;::) • ( d
"·"b !:>ol7 4.17 '+ebit
'+e07
C:ol7 2.88 :.;.oo 3.51 3.25
3.49 -'·11 3.88 b.6o b. '16
c
PEOPLE
Million
1<+.761 15.u12 !':>.263 1 5 .:>4 2 1:..d35
16.1.37 16.403 !b.64b 1b.':12b 17.1 91
MILEX
per
CAPITA
Constant
dollars
17 0 .63 16 7 •• 6:. 15d.21 172.u9 1~!:>.03
148.66 146.74 1->5.23 127.31 146.07
512.:>29 268.44 517 .334 297.1$2 :>21.908 . 298.46 52o.775 531.tH7
536.991 541.590 :0>46.055 5~0.}01
!::>:5'+.!66
2.3-'·027 2JY.079 2'+5.324 251.738 258.282
264.967 271.937 279.162 286.666 2':1<+.«62
3.33.890 336.911 340.065 342.891 345.753
348.713 351.672 354.532 357.548 .360 .·538
285.55 265.46
250.73 252.20 243.96 24S.15 239.33
8.99 12.42 13.71 17.00 16.77
11:l.84 21.27 2<+.43 45.83 46. 63.
280.60 287.62 301.88 309.l:l1 313.92
321.55 323.45 336.61 340~6$ 346 .• 73
GNP ARMED MILEX ARMED
per FORCES ARMED FORCES
CAPITA FORCES per
Constant Con•tant 1000
dollars
3':121:'1 4058 4124 4318 4!::>27
4630 4777 '+914 ::>U99 4':1!:>1
41b0 42~8
4.368 4509 '+5d9
461H 4876 :0111 :.Ob7 4911
415 431 457 4d5 516
540 574 629 695 b90
2189 2296 2338 2386 2514
2599 2644 2792 2892 2946
thous
72 85 93 96
100
100 100
l:l4 81 83
b317 6642 6806 6706 6311
6016 5701 5576 5486 5253
884 895 969
1021 1141
1301 1299 1280 1284 1399
5107 5187 5372 5434 5570
5692 5694 5762 5816 5978
dollars
34982 29609 25965 27B61 24549
23988 24069 26798 26605 30254
peopla
... as S.b6 b.09 b.1b b.32
6.20 6.10 5.05 4.78 4.i:lJ
21780 12.33 23197 12.8'+ 22887 13.04 22431 12.73 22370 11ot:i7
22380 11.20 23959 10.53 23890 10.21 24582 9.97 25248 9.48
2370 3318 3471 4192 3796
3837 4452 5329
10232 9815
3.79 3.74 3.95 4.06 4.42
4.91 4.78 4.59 4.4d 4.75
18345 15.30 18682 15.40 19110 15.80 19549 15.85 19487 16.11
19700 16.32 19977 16.19 20712 16.25 20941 1b.27 20912 16.58
17

YEAR
18
TABLE I. MILITARY EXPENDITURES, GNP, POPULATION, AND ARMED FORCES BY GROUP & REGION BY YEAR-Continued
MILITARY GROSS NATIONAL MIL EX PEOPLE MILEX GNP ARM EO
EXPENDITURES PRODUCT per per FORCES
(MILEX) (GNP) GNP CAPITA CAPITA
Billion
Current
dollars a Billion dollars b Constant Constant
Constant Current Constant % Million dollars dollars thous
a) For conversion methodology, see Statistical Notes.
b) For conversion methodology, see Statistical Notes.
c) Military Expenditures and GNP as calculated are not fully comparable due to the use of different types of dollar conversion rates for the two variables. The estimated range is a more valid measure (see Statistical Notes.).
MIL EX ARMED
ARMED FORCES
FORCES per
Con111tant 1000
dollars people
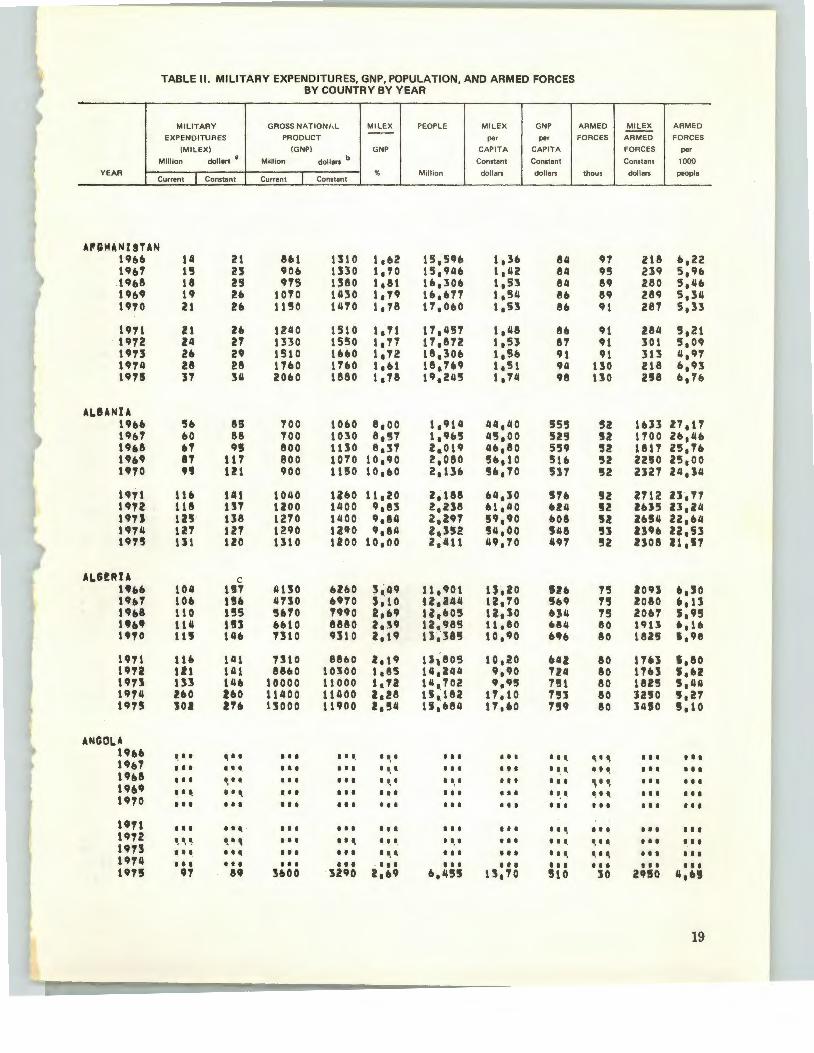
TABLE II. MILITARY EXPENDITURES, GNP, POPULATION. AND ARMED FORCES BY COUNTRY BY YEAR
MI LITAR Y GROSS NATI ONt, L MI LEX PEOPLE MILEX GNP ARM EO MILEX ARMED --EXPENDITURES PROD UCT per per FORCES ARM ED FORCES
IMILE XI !GNP) GNP CAPITA CAPIT A FORCES per
Mill ion dollars a Million dollars b Constant Constant Constant 1000
YEAR Current I Constant I
% Million dollars dollars thous dollars people Current Cons tant
Af!';HANUTAN 19tlfl 14 21 8bl 1310 1,b2 15,591> 1, 3b 84 91 218 &,22 191)7 15 n 90& 1:530 1,70 15,941> 1,42 84 95 239 5,9b 191)8 18 25 975 1380 1,81 l&,:SOb 1,53 84 89 280 5,411 191)9 19 2& 1010 1430 1,79 1&,&11 1,54 8& 89 289 5,34 1970 21 h 11!!0 1470 1,78 11, 0&0 t,Sl 8& 91 287 5,33
1911 u 2ft 1240 1510 1,71 17,451 1,48 86 91 284 5,21 U72 24 27 1330 1550 1,71 11,812 1,53 87 91 101 5,09 1913 2b ZCJ 1510 1&&0 1,72 18,301> 1,5& 91 91 313 4,91 1974 28 28 1Tb0 thO t,u 18aH9 1,51 94 1!0 218 b,9 l 1915 3'T 34 20b0 1880 1,78 19,245 1,74 98 130 258 "• 7b
AI.BANU 19U 5& 85 TOO 10l>O e,oo 1,914 44,40 555 !!2 1&33 27,17 19()7 &0 88 700 1030 8,57 1,9()5 4!5,00 525 52 1100 26,4& 19118 fiT IJI 800 1130 8,37 2a019 46,80 559 52 1811 25,1() 19()9 17 tt'l' 800 1010 10,90 2,080 5&,10 516 '52 Zl!JO 25,00 1970 n tU 900 11!SO 10,110 2,13& 5i> 1 TO sn 52 2327 24,14
1 9'f1 11& 141 1040 U60 11,20 2,188 64,30 5'16 52 2112 Zl,71 1972 118 U7 uoo 1400 9,83 z,as8 &1,40 U4 !It! hJ5 U 1 l4 un 125 138 1270 1400 9,84 2,UT '59,90 608 '52 U!l4 22,&4 1"74 1Z7 lZ7 1290 U90 9,84 2,352 !!4,00 !148 !!J 2396 u,s:s 19.,"5 U1 120 1110 1200 10,00 2,411 49,70 497 52 uo8 U,S'T
AI.G!RU c uu 104 U7 4UO UbO ,~49 11,901 u,2o 126 7!! a on &,so 1h'T 106 lU a no U'TO :s,'1o U,244 12 1 70 !lb9 7!1 2080 •• u 19U 110 1!!5 !1610 79CJO 2,&9 U,&O'!S u,:so U4 1!1 i!OU 5,95 ~'•• 114 1!11 6fll0 8880 2,39 12. 98!1 11,80 684 80 11Hl •• u 1•10 lU 14& n1o U10 z. t9 u,· n~ 10,90 Ub 80 1825 1,98
1911 116 t41 7!10 881)0 2,19 1h805 10,20 642 80 1763 s,eo 1972 Ul 141 88&0 lOJOO 1,85 14,244 9,90 724 80 1'7&3 I,U 197) t:n 14& 10000 11000 t,n 141,'702 9,CJ5 '7!11 eo 1825 1,44 1974 260 uo 11400 11400 2,28 U~182 1'1'110 1'51 eo l250 !J,Z'T t9'7!! SOl 2'761 uooo 11900 1,!!4 u,·6e4 1'T 160 759 !10 1450 s,to
ANCOI.A 1"&6 ~I I •••• t I I t It I I , I t t I I I I I t I, • .... I I t I I I 1961 ' .. It. . ' . I t I t It I I t I t It t I I, . . ~ I I t I I I 19U t I I
~ ·· ••• t I I ' ~ . I I, I ••• . ' ' \ .. , ••• I I I 19119 .. ' Ill, I I I I I I t t I I I t t I I . • ... I, I I, I I I I I I 1970 t I I I I I ••• I t I I t I I t I t I I t I I ••• t I I t I I
1911 t t I • • • ••• I I I t I t t I I t t I . .. , . . ~ ••• I I t 1972 '· •. '= 1, I\ ••• .. '· I I I, I t , I I I I t I I , 1, I • ••• t I I un ' . •. .. ' • • • Itt . • .. • • • I I I . . • . t , ••• ••• . '. 1974 I t I • • • • •• ttl . t I I ••• It I • • • • •• ••• • •• un . ., !19 !bOO !290 2,69 6,455 13 1 'TO 510 :JO 2'1!10 41 U
19

YEAR
ARG!NTINA 1qbb 1qb1 19&8 19b9 1970
1q11 1972 1913 19711 1975
AUSTRAl. !A 191tb 191>7 19#)6 19#)9 1970
1971 1972 1913 1974 1'75
AUSTRIA 191!6 1"61 U&6 19b9 1970
1971 1972 191:5 1974 1U5
BAHIUhl 19b& 19&1 1CJU 1•6• 1970
U71 1972 un 19111 1975
20
TABLE II. MILITARY EXPENDITURES, GNP, POPULATION, AND ARMED FORCES BY COUNTRY BY YEAR -Continued
MILITARY GROSS NATIONhL MILE X PEOPLE MIL EX GNP
EXPENDITURES PR ODUCT per pe r
IMILEX) I GNP) GNP CAPITA CAPITA
Million dollars a
Million dollars b Constant Constant
% Million dollars dollars Current Constant Curre nt Constant
337 510 15500 23500 2,17 22,710 22,110 1030 328 1183 1bll00 211200 2,00 23.118 20,90 1050 350 11911 1noo 25200 1 1 90 n.11os 21. 10 1070 :sqo 532 20400 211100 1194 23,611 22.30 1150 409 521 2!b00 26800 1a81 24.15b 21,50 1190
lU 4H 211qoo 30200 1a115 211.500 1'7,90 1230 358 41b 26800 11!00 11 :511 24.6115 1bl80 1250 11413 488 30000 33100 1,118 25,19b 19,110 1310 581 581 35200 35200 1 1 1)5 25,551 22,70 1360 8b0 787 37100 B900 2.n 25. en 1 30,110 1310
1510 2290 31200 4TIIOO 11,811 11.'599 196.00 11060 15b0 2300 :511200 501100 11,5b 11.799 195,00 11270 15b0 2210 11000 52200 11,22 12.009 1611.00 11350 18110 21170 112300 5b800 IJ,35 12,2&3 202.00 llb30 1150 2230 117000 59900 3, 73 12,507 179,00 11790
1600 i!180 51700 b2b00 3,119 12.75b 171,00 11910 1880 2190 '5&200 U400 :5,35 11!,959 1b9 1 00 5050 1no 20110 b2l00 b81100 2,96 13,132 1!55,00 U10 1920 1920 1Zb00 72&00 2,b5 1:s, :n8 1411,00 S440 2480 2270 78200 71 !500 3d7 13.510 168,00 5290
166 285 111500 21900 1,30 7.291 39,10 3010 1n no 15200 znoo 1,!9 7,3!3 J9,70 3070 207 2t2 1&600 2!500 1.n 7,:UO :59,70 3190 223 JOO 18500 24800 1,21 7,393 110 1 b0 33M Ull 2'6 !1000 2UOO 1 ,11 7,42b 40,10 SbOO
235 284 2:1200 28200 1,01 7,115b 38,10 3760 158 301 l!ITOO 30000 1,00 7,1187 40,20 4000 'l71 305 26800 31700 0 1 9b .,,.521 110,!50 4210 316 Hf> :53000 nooo 1,02 7,548 441,~0 4370 151 1!7 351100 JliiOO 1,01 7 ,·540 43,30 4290
••• .. .. I I I . . •. . • .. I 1., I I I I .. ~ ••• • .... I I I I I I I , . • ... I I I • • • . . .. ••• • •• ~I I I I I , I I , I • • • • • • . ... '·. ~ •, .. • • • ... ., . • .. I t. I ••• . . ~ • • • • •• • • • • • • • • • • • • • • • • ••
II 15 209 zn l,t1 o,a1e 20,60 1160 4 4 202 2J!i z,oo o,-224 19,20 10,0 4 5 210 i!l2 2 1 tb 0 ,Z!1 19,50 1000 5 5 555 555 1,!6 0,231 22,40 UIIO
14 13 564 !116 2,117 0 1 Z411 5Z 1 20 2110
ARM ED MIL EX I'RME D
FORCES ARMED FORCES
FORCES per
Constant 1000
thous doll ars people
1b0 3186 7,03 1M lO 1q b,92 1b0 3068 bl82 1M 3:525 b,72 1110 3721 !5,60
1110 3tH 5171 1110 2971 5,b3 1b0 3050 b,3!! 150 3873 5,87 1b0 4919 b 1 11
d 59 :58614 5,09 72 319411 b 1 10 80 27b25 b,bb 82 10122 b,b9 Bb 25930 b,86
86 253119 6,74 Bb n11os b,bil 71 281)2 5,111 66 28235 5,10 70 UIIZ9 5,18
55 15182 7,54 60 46H 8,19 55 5309 7,47 55 51155 7,114 55 5418 '7,41
60 4733 8,0'5 bO 1011 1,01 60 5083 1,98 bO '5b00 7,95 50 6!5110 6,b3
~·~ ••• I I , I
I I t ••• • t •
• ••• ••• • •• ..... ••• • •• • •• ••• • ••
2 22!50 9,11 J 1433 11,39 3 1500 12,99 4 1l2S U1 1 88 5 2!140 l0 1 119
Y EAR
BANGI,.AO f' SM Uo& Ub1 19&8 19&9 1910
tnt 1912 11JT:5 !IJ14 1915
BARBADOS U&& U&T 1h8 19&9 1910
19'11 1912 19'1:5 19'14 1915
BEl.Gl UM 196& 19&1 19U 19&9 19YO
1911 19U 197:5 1914 191!1
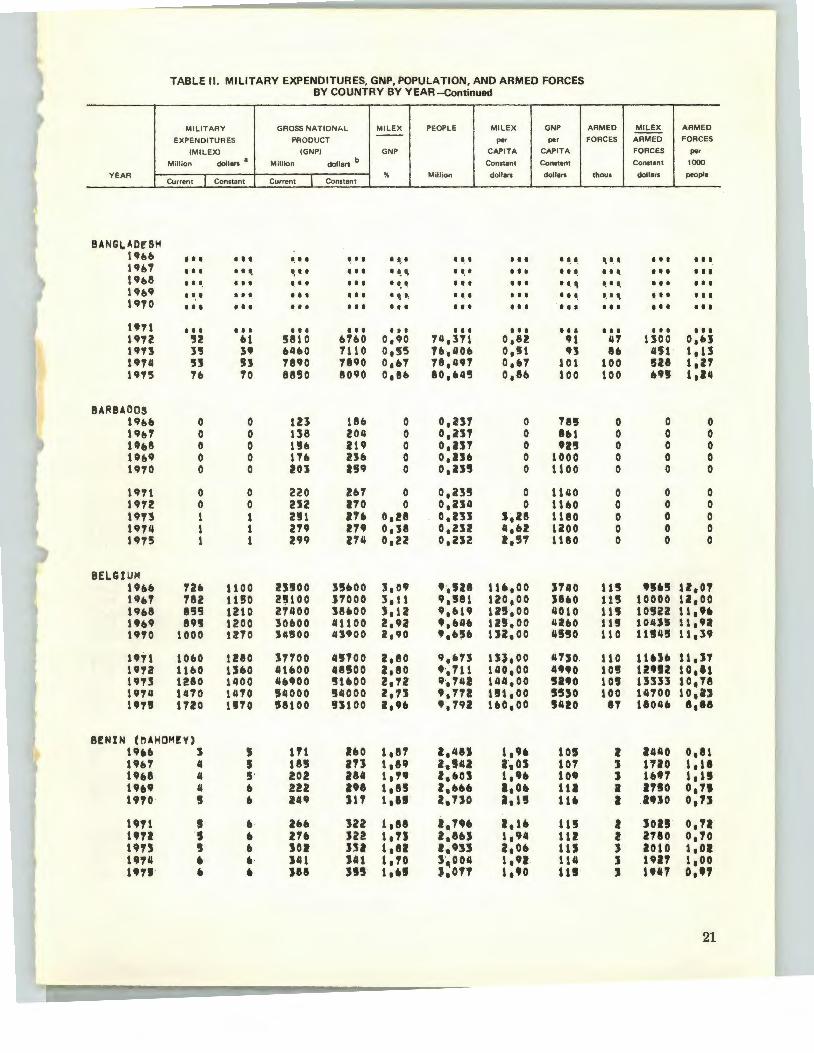
TABLE II. MILITARY EXPENDITURES, GNP, POPULATION, AND ARMED FORCES BY COUNTRY BY YEAR -Continued
MILITARY GROSS NATIONt,L MILE X PEOPLE MI L EX GNP
EXPENDI TURES PRODUCT per per
IM ILE XI I GNP) GNP CAPITA CAPITA
M i ll ion dollars 8 Million dollars b Constant Co nstant
% Million doll ars dollars Current Constant Current Constant
••• ••• I , I I ~ .. . ~ .. I I I I I I . •. ~ I I I I I I,
~ ·· I I I . • . ., I I , I ••• .. . .. .. •, I I I I . I I I I I I I, I, I I I I I I I I I, . .. . I I I ••• I I I I ~ 11 .... I I I ....
I I I I I I ••• I I I I I I I I I ••• ••• I I I • • • ••• ••• . ' ' I I I I I I ••• 52 Itt 5810 &1&0 0,90 1~,311 0182 91
3'! n &4&0 7110 0,55 1&,40& 0. !It qs 5J n 1890 1890 0 • ,., 18. 4CJ1 0. ft'T 101 1b TO 8850 8090 o,a& 80,845 o,u 100
0 0 1U 18& 0 0,23'1 0 TU 0 0 ue !04 0 o,n? 0 1&1 0 0 U& U9 0 o,an 0 9!!!J 0 0 th Z:Sb 0 O,IJ& 0 1000 0 0 101 259 0 o,n5 0 1100
0 0 220 267 0 01 i!35 0 1140 0 0 nz 110 0 o,nu 0 11&0 1 1 Z'J1 11& 0,28 o,z·n s,z8 1180 1 1 219 zn o,n o,zn 41 U 1200 1 1 299 ZT4 0,22 0,232 1,51 1180
12& uoo znoo 3'5600 3,09 • .• Sl8 116,00 J140 182 11!10 2,100 11000 3, t1 9,!181 120,00 38&0 855 1210 21400 18&00 3,12 9,&19 U!!J, 00 4010 89'$ 1200 30600 41100 2,92 9,&4• 12!1, 00 42&0
1000 UTO 5~!100 43900 z,qo .,,,6 uz.oo 45'50
10&0 1280 lT100 4!!1100 2,80 9,&13 U),OO 41SO. 1160 U&O 4UOO 4UOO 2,80 9·,111 140,00 u•o 1280 1400 4h900 '5'1&00 2,12 , ., '742 144,00 5190 1410 14YO 84000 84000 z,n 9,'7'1! 1!11,00 ,,0 1120 1810 58100 !IS100 1,96 •,nz uo,oo 'J4!0
BENIN (OAMOM~Y) 19411411 3 s 111 24110 1,81 1 1 4U •••• 10!5 19U 4 5 18! zn t,n l,S42 z,os 101 19&8 4 !5 ' 202 284 1,.,, 21 603 t,•• 109 19&9 4 , 222 I'll s,n z,&u a,o• HI 1910 ! • 249 )l'f t,u· z,no a.t! 1U
1911 ' •• Zh :522 1,118 z, 19& '·'' 1U 1911 ' 6 zu 322 1,n 2,11U 1,94 11Z 19U ' • SOl na 1,112 1.9SS z,o• llS 19'f4 • • J41 J41 11 'f0 J~004 1,91 114 1911' • • see J!! 1,.S J,on 1,90 11!
ARMED MIL EX ARM ED
FORCES ARMED FORCES
FORCES per
Constant 1000
thous dollars people
... , • • • • •• . '· .. ••• ••• I, I I, I I I ••• I, I\ I , •• • •• • •• I It I I I
••• I I I • •• 41 1:500 o,u u 451 1,u
100 528 1 ~21 100 U!l 1,14
0 0 0 0 0 0 0 0 0 0 0 0 0 0 0
0 0 0 0 0 0 0 0 0 0 0 0 0 0 0
115 •!In U,O? 115 10000 u,oo 1U 10!122 11, •• 11!5 l04JI 11,92 t10 11!14!1 11,39
110 11U6 u.n 10'5 12912 10,11 lOS 13333 10, '78 100 14100 1o,n
81 11104411 11,ae
2 U40 0,111 :J 1110 1,11 J 1411t1 1,11 I a no o,n I auo o,n
I sou 0 • ., 2 2180 01 10 J 2010 1,01 s 1921 1,oo J 1941 o,,.,
21
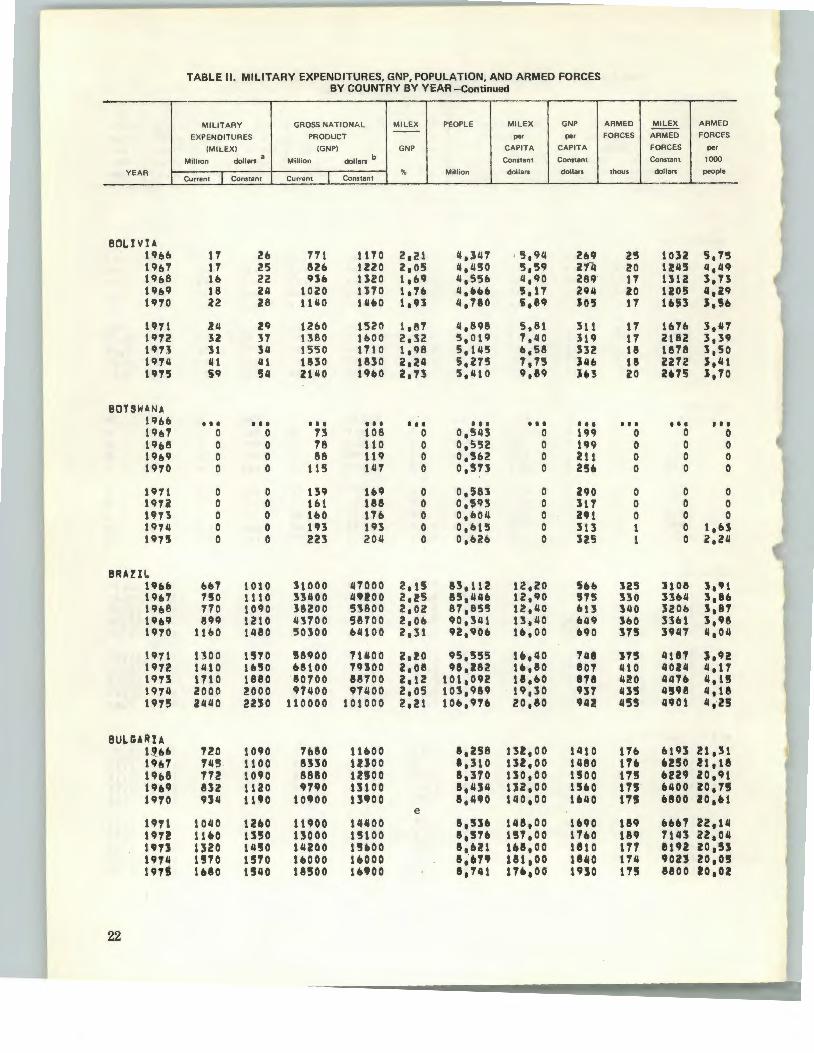
TABLE II. MILITARY EXPENDITURES, GNP, POPULATION, AND ARMED FORCES BY COUNTRY BY YEAR-Continued
MILITARY GROSS NATIONI,L MILE X PEOPLE MILE X GNP --EXPENDITU R ES PRODUCT per per
IM ILEX) I GNP) GNP CAPITA CAPITA
Million dollars a Million doll ars b Constant Consta nt
YEAR Cu rrent I Constant I
% Million dollars dollars Current Constant
BOI.IVIA 19&& 11 i!e 771 1110 2,21 '1,347 5,9'1 2&9 19&7 17 25 82o 1220 z,os '1,'150 5,59 2111 19&8 to 22 9le U20 1,&9 4,55& 4,90 289 19&9 18 24 1020 1110 1,7& 4,oa& 5.17 294 1970 il2 Z8 1140 111410 1,91 4,180 i,89 J05
1911 l4 29 12b0 1520 1, !1 7 '1,698 5,61 311 l'l1l! 32 31 138 0 !bOO 2,32 5,019 7,40 119 1913 ll 34 1550 1110 1,98 5,145 o,58 Hi! 1974 41 Ill 1830 1830 2,24 5,275 7,75 Uo 1915 S9 54 2140 UoO z,n 5,"10 9,89 hl
BOT5 WANA t%b • • • • • • • • • • • • ••• ••• t I I I I I
19&7 0 0 73 108 0 o,S43 0 199 19&8 0 0 18 110 0 0,552 0 199 19&9 0 0 88 1 19 0 o,!ei! 0 ~11 1970 0 0 tiS 147 0 0,513 0 25&
1971 0 0 U9 U9 0 o,se1 0 290 1972 0 0 1&1 188 0 0,593 0 111 1913 0 0 1&0 17& 0 0,&04 0 2191 1914 0 0 193 !93 0 0 1 b15 0 313 191§ 0 0 223 204 0 o,o2o 0 l25
BRAZil. Ubb bbT 1010 11000 47000 2,15 81,112 12,20 So& 19&7 750 1110 H400 auoo 2,25 85,114& 12,90 575 19&8 110 1090 38200 518 00 2,02 87,855 12,40 &13 19&9 899 1210 43700 58700 2,0& 90 ,lilt 13,40 &49 1970 11&0 1'180 _50300 b4100 2,31 92,90& 1&,00 &90
1CJT1 1300 1510 58900 11400 2,!0 95,555 1&,40 1118 1972 1410 1&50 &8100 19SOO 2,08 90,282 u,8o 807 19U 1110 1880 80700 88100 2.12 101,092 te,&O 818 1914 2000 2000 9'7400 91400 2,05 101,989 19 ,lO 9:17 1 9'75 24110 22:50 110000 101000 2,21 10&,97& 20,80 942
BU\.GARU 1.t&& ·no 1090 7&80 11&00 8,258 11! 1 00 1410 19&7 745 1100 eno 1UOO 8,310 1U,OO 1480 19&8 772 1090 8880 12!50 0 8,310 uo,oo 1500 19&9 832 1120 97"0 13100 8,4:54 uz,oo U&O 1910 934 1UO 10900 13900 8,4'10 140,00 1UO
e 1971 1040 12&0 1 uoo 14400 8 1 53& 148,00 1&90 1912 11&0 U!IO 13000 15100 8,'57& 1!!11,00 11&0 un D20 14!!10 14200 1!!1&00 e,&zt 1&8 1 00 1810 1914 1!!170 1!!110 uooo uooo e,·&n 181,00 1840 197!1 1&80 1!40 18500 1noo e, 741 11&,00 1UO
22
-
A RM ED
ORCES F
thous
2'5 i!O 17 zo 17
17 17 18 18 lO
t I t
0 0 0 0
0 0 0 1 1
125 330 340 uo 315
11!1 410 4i!O 435 455
11& 110 11'5 1 , . 11!!1
189 189 117 114 11!!1
MI L EX ARMED
ARMED FOR CES
FORC ES per
Constant 1000
dollars peo ple
1032 5,75 124'5 4,49 Uti! 3,73 U05 4,29 lUl J,h
1&7b 3,47 2182 3,39 1878 1,so 2212 J,41 UTS J,7o
I I I ••• 0 0 0 0 0 0 0 0
0 0 0 0 0 0 0 l,&S 0 2,24
l108 l 1 'H 33&11 3,8& 320& 1,81 33bl 1,98 3947 4,04
4187 s.•z 4014 4,17 447fl 4 1 U 4'598 4,18 41901 4,2!
6191 21,31 &2!!10 l!t,l8 un 20 1 'H &1100 zo,n &800 ao,•1
&bOT 22,14 7141 22,04 81'2 zo ,s:s •on 20 1 0!!1 8800 10,02
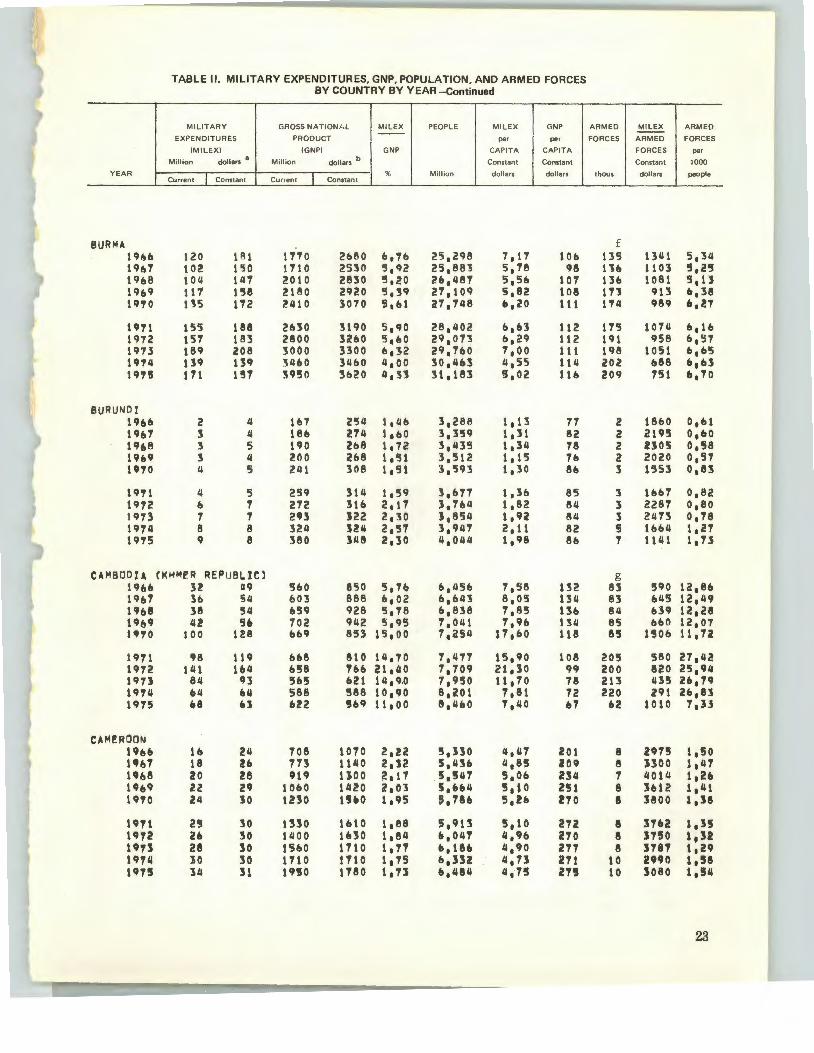
TABLE II. MILITARY EXPENDITURES, GNP, POPULATION , AND ARMED FORCES BY COUNTRY BY YEAR -Continued
MI LI T A R Y GROSS NATION/, L MI LE X PEOPLE MILE X GNP A RMED MIL EX ARMED --EXPENDITURES PRO DUCT per per FO RCES ARMED FOR CES
IM ILE X} I G NP} GNP CAPITA CAPITA FO RCE S per
M illio n dollars 8
Mill ion doll ars b Constant Constant Constant 1000
EAR Cu rrent j_ Co nsta nt I
% Mill ion doll ars doll a rs thous do ll ars peo ple Curre nt Constant
y
BURM A f 19~b 120 181 1170 2b80 b,1b 25,298 7,17 lOb 135 13(11 5 .. 3(1 19&7 102 150 1710 25!0 '3 ,92 25,883 5,78 98 1'\b 1103 5,2~ 1968 104 147 2010 2830 s,zo 2& 1 ti87 s,se 107 1Jb 1081 5,13 19&9 117 156 2180 2920 5,'59 27,109 5,62 108 113 913 &,38 1970 1'55 172 2410 3070 5,&1 27,148 e,2o 111 1'14 989 &,27
1911 155 188 2&30 3190 5,90 28,402 &,&3 112 17'3 1074 &,1& 1972 151 183 2800 32&0 s,&o 29,073 &,29 112 191 958 &,57 1973 189 208 3000 :BOO &,32 29,700 7,00 111 198 1051 &,&5 1914 tH 139 34&0 34&0 4,00 30,463 4,5'5 114 202 &88 &,OJ 191!1 111 157 '5950 '5620 4,53 31,183 5,02 11& 209 151 &,10
BUR U NO! 19&& 2 4 1&7 254 l,tlb 3,288 1, 13 77 2 18&0 0 ,&1 19&1 3 4 18& Z74 1,&0 3,359 1,31 82 2 2195 o,&o 19&8 3 5 190 2b8 1,72 3,435 1. 34 16 2 2305 0,56 19&9 3 4 200 2&8 1,51 3,512 1. 1 s 7& 2 2020 0,57 1970 4 5 241 308 1,51 3,593 1,30 8& J 1551 o,u 1911 (I 5 25CJ 314 1,59 3,&71 1,3& 85 3 1bb1 0,82 1912 b ., 272 31& 2.11 3,7&1! 1,82 84 3 228'1 o,eo 1973 7 7 2fJ3 :522 2,30 1,854 1,92 84 3 2473 0,78 1974 8 8 324 324 2,57 3,94'1 2,11 82 !i 1&04 1,21 1975 9 8 380 J/.111 2,30 4,0114 1,98 8& ., 1141 1,13
CAMB ODlA CKHM!'R REP lJ Bl.lC) g 19&& 3! 1!9 5&0 850 5,7& b 1 1.15b 7,58 132 83 590 ll 1 8& 19&'1 3b 51.1 &03 888 &,02 &,&113 8 1 05 ~~~~ n &45 12,49 1CJoe 38 54 &59 928 5,78 &,838 7,85 1~& 811 b39 12,28 l9o9 42 511 702 942 5,95 7,041 1,9b 131.1 85 &bO 1Z 1 07 1970 100 128 bb9 853 1'5,00 1,as4 17,&0 118 85 150b 11,7Z
19'11 98 119 bb8 810 111,70 7,1.171 15,90 108 205 !i80 27,42 1972 I II 1 1&4 &58 1bb 21,40 7,709 21,10 99 200 8i!O 25,94 19'fl 84 93 '305 &21 14. 9.0 7,950 11,70 78 213 415 2&,79 1CJ74 oil b4 588 588 10,90 8,201 '1,81 72 220 291 lb 1 83 1975 &8 &:1 &22 §b9 11,00 8,4&0 1,40 b1 &2 1010 1,l.S
CAM!! ROON 19ee to 24 '108 1070 2,22 s,uo 11,47 201 8 2915 1,so t•o'f 18 lb 113 11110 2,12 s,no 4,8'5 209 8 )300 1,117 1'&8 lO !8 CH9 uoo 2,17 5,547 S,O& 2J4 1 4014 1,2. ttto9 u 29 1060 1420 2,03 5,&&4 5,10 251 8 lbl2 1,41 1tt70 24 10 12:SO tseo 1,95 5,78& 5,2& 2'10 8 1800 l,U
ttt1l 2'!1 :so tHO 1&10 1,88 5,91~ 5,10 2U 8 31&2 1,15 1912 2• 30 1400 U:\0 1,84 &,04'1 4,9o no 8 :nso 1 ,l2 un 28 30 15&0 1'110 1,11 &,18& 4,90 2'17 8 3781 1,29 19'111 :so 30 1'110 1'110 1,75 &,332 4,13 271 10 2990 1,!18 19'15 311 31 1910 1180 1,13 11,484 4,'15 215 10 S080 1,14
23
J

TABLE II. MILITARY EXPENDITURES, GNP, POPULATION, AND ARMED FORCES BY COUNTRY BY YEAR-Continued
MILITARY GROSS NATION/, L M ILEX PEOPLE MILEX GNP --EXPENDITURES PRODUCT pe r pe r
IM ILE XI IGNPJ GNP CAPITA CAPITA
Mill ion dollars a Million dollars b Constan t Constant
Y EAR Current J Consta nt I
% Mill ion dollars do llars Current Constant
CANADA 19&& 1870 <!8110 65100 98700 2,87 20, 048 142,00 11920 1%7 20&0 ~OliO &9:500 1020 00 2,98 20,1112 149,00 5000 1%8 2050 2890 70600 10MOO 2,&7 20,729 139,00 5210 19119 20'50 n:so 8£1700 1140 00 2,£10 21,028 130,00 5410 19'70 2220 2830 91& 00 11'7000 2,42 21,3211 1:n,oo 54'70
1971 23110 2830 1020 00 123000 2 ,30 21,595 131,00 5710 1972 21130 2830 11200 0 131000 2. 11 21,8118 1'50,00 5980 1913 2550 2810 127000 1400 00 2,(')1 22,125 127,00 1>310 19711 2930 2930 143(')00 14 3000 2, (') 5 22,479 130,00 6360 19'75 31&0 2890 15700 0 1440 00 2, 01 22,811 127,00 6310
CENTRAL AFRICAN REP UB ~IC tCJ&6 2 4 162 246 1,44 1 ~198 2,53 11ft 19&7 :5 5 !65 2£13 2._02 1,427 3,114 170 1CJ&8 4 0 190 2&7 2,:50 1,451 4,22 18'5 19&9 5 1 213 286 2,52 1 .. 489 4,85 192 1970 5 1 229 292 2,34 1, 522 11,119 192
1911 6 1 243 295 2, 11 6 1, 557 11,66 18CJ 1972 5 6 255 29'7 2,09 1,5911 '5,CJO 187 1911 0 1 277 305 2,34 1,632 II ,31 187 19711 1 1 '508 308 2,30 1,67& 11 1 Z2 184 19'75 8 7 3113 Jill 2,28 1, 713 4,18 183
CEY LDN (~EI! SRI l. ANKA)
CHAO 19&& 11 11 lb3 39CJ 11.18 3,380 11,93 118 19&7 11 to 263 387 11 ,!3 3,457 4,74 112 19&8 12 17 284 1100 4,30 3,5 :H 4,8& 113 19&9 12 t o 303 407 3,82 3,o19 4,30 112 1970 15 19 10'7 391 4,18 3,70& 5,011 105
1971 1& 20 320 388 5,05 :s,79o 5,1& 102 1972 11 20 300 349 5,59 3,888 S,01 90 1913 111 19 312 343 5 ,&5 3,983 4,86 86 191ll 20 20 3o2 3&2 '5,&3 11 1 019 11,99 89 U75 23 21 417 381 5,&2 4,178 5. 1'5 91
C:HIL!: 19&& 92 140 a no 65&0 2.t:5 8,899 15,70 738 1901 93 1:51 4550 &100 2,05 9,112 15,00 735 19&8 100 141 1!900 &900 2,04 9,320 15,10 7111 1'~~9 101 11111 5320 1140 2,02 9,523 15,10 7119 1970 ta~ 1811 5850 1450 2,54 9,709 19,50 1&1
1911 159 193 &110 81110 2,31 11,884 19,50 823 1912 19& 228 1030 8180 2,78 10,055 22,&0 8111 1CJ'T1 222 211'5 'f!SO 7810 3,11 10,229 23,110 7&9 1974 433 4:53 8210 8UO !,l!8 10,405 111,'70 789 197§ $31 30! 1&50 fQ OO 4,5! 10,585 28,&0 &&1
24
,.
ARM ED
CES FOR
t ho us
1 t 0 1 OS 1 OS 1 00 95
85 90 85 80 11
2 2 2 ?. 2
2 ! 3 3 3
5 5 b 5 1
8 10 t 0 10 11
&5 10 10 70 10
70 75 15 90
1 10
MILEX AR MED
AR MED FORCES
FORCES per
Constant 1000
dolla rs peo ple
25818 5,119 28952 5,1ll 27S2ll 5,01 27300 1.1171, 29789 a,4&
33l!94 3,9a 314llll 4,12 33059 3,811 3&&25 3,56 37'332 3,38
1710 1,43 24SO 1,110 3075 1,37 3&10 1,3ll 3415 1,31
3&25 1,28 2013 1,88 2377 1,84 2357 1, 79 2381 1,75
33ll0 1,1.18 3280 1,45 211o7 1,70 3100 1,38 2o71 1,89
2450 2,11 1950 2,57 1940 2,51 2040 2,45 19ll5 2,&3
2154 7,30 1957 7 1 CI8 2014 7,51 2057 7,35 l'TOO 7,l1
2757 7,08 30110 1,4& 3U1 1,33 4811 a,u 21'55 10,311
' TABLE II. MILITARY EXPENDITURES, GNP, POPULATION, AND ARMED FORCES
BY COUNTRY BY YEAR -Continued
MILITAR Y GROSS NATIONt, L MI LEX PEOPLE M IL EX GNP A RMEO M IL EX A RMEO EXPENDITURES PRODUCT -- per pe• FO RCES ARMED FORCES
(MILEXI (GNP) GNP CAPITA CAP IT A FORC ES per Mill ion dollars 8
Million dollars b Constant Constant Constant 1000 YEAR
Current I Constant I % Mill ion dollars dollars thous doll ars people Current Constant
t
t CHI~A, ,EO~LES R!~UBLIC OF d ,h 1966 15800 211000 107000 1&1!000 1il,eo 766,900 31,20 212 2600 9231 3,39 1967 16300 211000 107000 158000 15,l!O 7841,000 30,&0 201 2710 8856 3,41&
• 19&8 17700 25000 112000 158000 1!!1,80 1102,000 31 • 1 0 197 21100 8929 1,419 19&9 20100 27000 1:51000 1 TbOOO 15,30 820,700 32,90 214 2830 95411 3,45
J l 1970 21500 29900 157000 200000 15,00 840,100 35,&0 2:58 2850 101191 3,39
( tnt U&OO :uooo 178000 2UOOO 111,110 1159,900 36,10 2!!11 2970 1041l8 3,45 1972 251!00 30000 193000 225000 1'5,40 879,500 341,10 255 3040 9868 3,416 1973 27300 30000 226000 249000 12 .t 0 898,700 33,40 277 3250 9231 3,62 1974 30000 30000 259000 259000 11,60 917,300 n, 10 282 4300 &911 41,&9 1915 32800 30000 299000 274000 11.00 934,600 32,10 293 4300 6971 4,&0
CHINA, ~!~UBLIC 01' i d 1966 517 185 44170 6780 11,&0 13,354 58,80 508 5414 1443 40,74 1967 54& 11041 50110 7490 10,70 13,&69 58,80 548 547 1470 40,02 1968 bOT 856 5780 8150 10,50 11,970 &1,30 584 528 1621 n ,eo 1969 687 923 65.0 8850 10,40 14,276 64. ftO b20 555 1663 38,88 1910 815 1040 noo n1o 10,60 14,578 71,20 &n 522 1992 35,81
1911 904 1100 9030 11000 10,00 141,893 n,&o 735 540 20S7 36,26 1972 944 1100 10500 12300 8,97 15. 19J 72,410 801 550 2000 1&,20 1913 10&0 1110 12500 13700 8,51 15,4185 7!5,40 88& 503 2326 32,411 1'14 971 971 13800 U800 7,03 15,780 61,50 875 493 1970 31,24 1915 1410 1290 15500 14200 CJ,06 1&,076 80,00 883 504 2560 11,3'5
COLOM81A 19&6 ,. 120 11800 7270 1,65 19,352 &,21 376 50 2400 2,58 1961 n 1111 5140 7570 1,46 20,001 5,51 3'18 50 2200 2,50 19U n 120 5700 8030 1,49 20,&U 5,79 389 50 2400 2,42 1'&9 112 110 6340 8'$10 1,29 21,:S41 5,15 399 50 2200 2,34 1910 103 131 1120 9070 1,115 22,035 !5 ,98 1112 45 2933 Z1 04
l ~71 tn 242 '1'940 UJO 2,!!!1 22,147 10,&0 11n !JO 4840 2,20 uu 112 130 n1o 10400 1 .u 23,480 5,55 442 so 2600 2,13 11173 110 1U 10200 1 uoo 1,08 24,236 41,118 41ft! 150 2420 2,0& 1'741 118 118 11900 11900 0,99 25,0141 4,10 416 50 2!60 z,oo un tU U1 13500 12400 1,22 2'5,815 5,8& 480 50 3020 l, 94
CONGO 19&6 ' 10 207 315 3,27 1,073 9,'!19 293 5 2060 4,&6 1961 8 12 !4!$ JU 3,1!6 1,099 10,70 sn 5 2360 4,55 19&8 ., 10 268 377 2,63 1,1!6 8,81 3H 1 3301 2,66 1'69 lt 1!5 296 n1 3,'1'4 1,155 12,90 3114 J 4967 2,60 1.,0 u 20 :U8 418 4,T1 1,1811 16,60 355 6 3!83 -5,07
1911 11 i!O J!Sjj 429 4,&6 1,215 16,40 l5l 6 3333 4,94 1912 11 19 380 4413 41,33 1,246 15,40 355 9 i!Ul 7,22 1'75 20 22 4&1 509 4,~7 1,219 17,00 398 1 3114 '.5,47 1974 24 Z4 '555 555 4,27 1,314 111,00 422 7 338ft 5,31 1975 26 24 609 557 4,!9 1,350 11 '70 412 7 34141 s,u
25
-'

YEAR
COSTA RICA 1~~~ 1~b1 1Qb8 196~ 1'10
1Q71 UTl! 1975 1974 UT5
CUBl 19ft6 1961 1968 t••~ 1910
1911 1U2 UTJ 1974 1915
CYPRUS 1966 1967 1968 1Qb9 1Q70
1911 1912 1973 1974 1'75
TABLE II. MILITARY EXPENDITURES, GNP, POPULATION, AND ARMED FORCES BY COUNTRY BY YEAR -Continued
MILITAR Y GROSS NATIONA L MILE X PEOPLE MIL EX GNP EXPENDITURES PRODUCT -- per per
IMILEXI I GNP) GNP CAPITA CAP ITA M ill ion dollars 8
Million dollars b Constant Constant
Current I Constan t Current I % Constant
Million d ollars dollars
0 0 n• 955 0 11545 0 618 0 0 619 1000 0 11594 0 lt!T 0 0 162 1070 0 1 1 fl4! 0 6!14 0 0 845 11 !O 0 11U1 0 ft71 0 0 ~'!8 1l20 0 t,n~ 0 702
0 0 tOTO uoo 0 11186 0 12T 0 0 1200 1400 0 1,833 0 164 0 0 U60 1'!00 0 1,818 0 He 0 0 1b00 11100 0 1,922 0 no 0 0 1180 1UO 0 1,~.., 0 8Z1
140 212 35110 5400 !,n 71881 26,QO 118'5 170 2'50 39110 !IUO 4,29 8,054 31,10 124 213 300 )Q80 51110 5,!'5 e,zot 311,110 684 186 2!50 ueo 15740 4,3!5 81:U7 n,9o u~ 228 291 4100 wno 4,85 8,41'12 34 1 JO 707
zs• 290 4680 5470 !I ,11 8,!J~Q n, 10 660 24~ 2~0 4720 !!1490 5,28 81771. n,oo 112ft 291 320 bi!!5 0 11880 4,611 81916 :55190 711 !40 140 uoo 6100 5,57 .,090 31140 671 393 3&0 11400 '58 '50 6114 912'52 38190 633
7 11 402 IIO' l 18Z 01fl01 18140 1010 8 u 416 701 1178 01611 20,50 11'50 8 11 '526 742 1,44 o,u8 t 7·, 'JO 1200 1 to 610 819 1e19 01U!I u,•o 1310 q 11 ft!IQ 1140 1,u o,•n 17 •• o tHO
11 u 111 941 1141 olu9 20170 1470 11 13 861 1000 1,21 01 64!1 U 1&o 1!1'!50 11 u •n 1010 1,12 o~n• 111!50 15110 18 18 8!13 ns z,u 0,1166 27,60 1280 Zt 19 14'5 U1 z,u 0 1.., 1 ze, 10 1020
C!ECHOSl.OVAKIA 1966 1720 2610 24!00 37100 14,2l4 us,oo 2610 U61 1860 1140 zuoo !8700 14,117 192,00 2110 1h8 1940 2740 28700 40,00 u,ns 191,00 I ISO 19119 2010 uoo :50800 4UOO 14,284 tn,oo 1890 1970 1990 1!140 35000 4!100 14,)19 l7T 1 00 2940
e 1971 U70 !UO suoo UTOO 14,Jt0 191,00 S040 1912 uso 2810 nooo 4!5400 14,46! tU,OO suo s•n 1610 ,.40 41100 UIOO ...... 1 201,00 SilO 1974 1000 sooo u•oo 4 .. 00 t4 1 U6 104,00 nto UTI JUO UlO S4'500 41'900 14,104 191,00 S$10
26
ARM ED MILEX ARMED --FORCES ARMED FORCES
FORCES per
Constant 1000
thous dollars people
2 0 1,2~ 2 0 112!5 2 0 1,22 2 0 1118 I 0 l1U
2 0 t,U 2 0 1109 2 0 1,06 2 0 1,04 z 0 1, 02
110 1927 u.~s 110 227:5 U,66 110 21l7 U 1 41 140 1186 16, T9 140 1019 16 1U
140 2071 111,28 140 2071 ts,•~~ 140 2286 1!5110 140 24Z9 15,40 uo lOOO u,n
16 6Q4 u,se 1!1 an 14. 5'5 14 764 Z2,U u 1!1 20180 u 8!S4 20,!14
11 uoo 11,21 u 1 ou 18160 11 1 05!5 16,69 11 161S 16,11 20 96! n,81
2!JCJ 10017 18,11 U9 10579 18,14 2!10 10960 u,n 210 UU7 14 1 TO zzz 11441 11,10
222 usn u~u us 1171!1 u,u us lJll4 u,ss 118 snu 14,14 110 1 Jll'f 14,1.
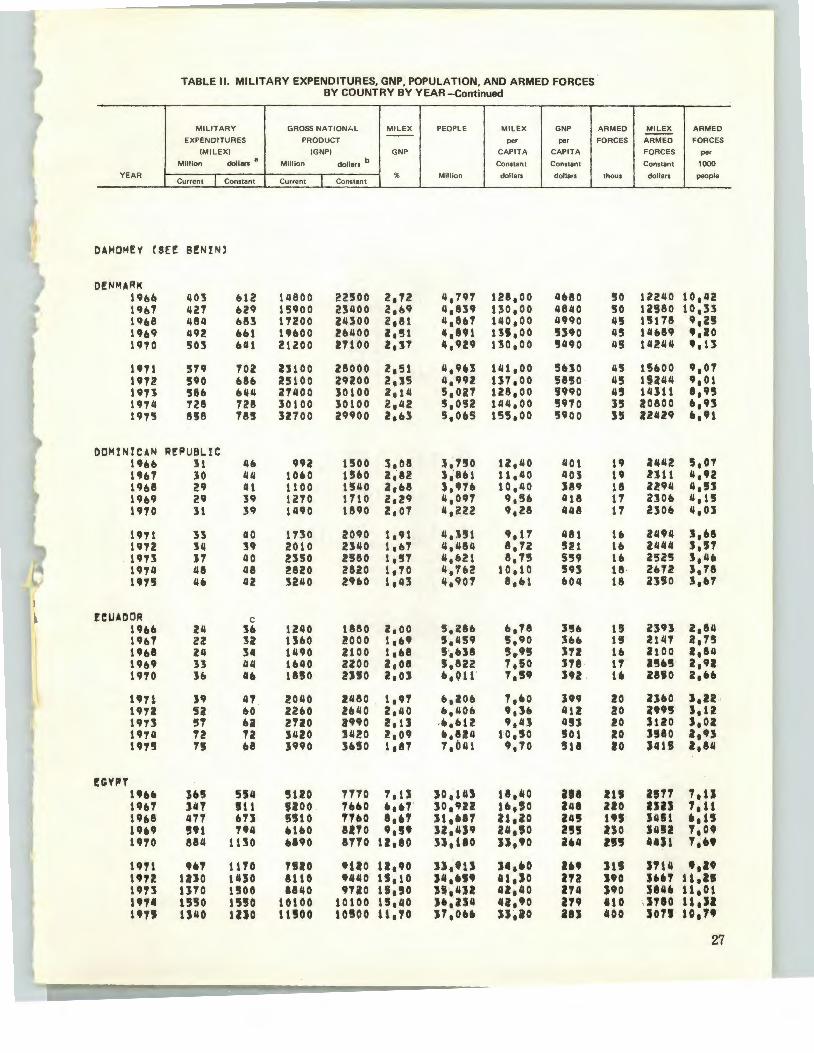
YEAR
TABLE II. MILITARY EXPENDITURES, GNP, POPULATION, AND ARMED FORCES BY COUNTRY BY YEAR -Continued
MILITARY GROSS NATIONhL MIL EX PEOPL E MI L EX GNP
EXPENDITUR ES PRODUCT per per
(MILEX) (GNP) GNP CAPITA CAPITA
M ill ion dollars 8 Mill ion dollars b Constant Constant
% Mil l ion dolla rs do llars Curren t Constant Current Constant
OAMOME:Y CSEE B!NIN>
O!NMARI< 19&& 40~ 612 111800 22500 2,72 11 1 797 128,00 11680 1967 1127 629 15900 231.100 2,69 1.1,839 130,00 4840 19118 1181.1 683 11200 ~4:$00 2,81 11,8&1 140,00 1.19110 1969 1.192 bflt 191100 20400 Z1 51 11,n1 1:51,00 !SIJO 1970 503 041 21200 21100 1,31 4,929 uo,oo 51.190
11J71 5711 702 23100 28000 2,51 41 9U 11.11,00 5UO 1912 590 Ub 25100 29200 2,15 1.1 1 992 U7,00 5850 1911 58fl fl44 21400 }0100 2,14 5,021 ue,oo n9o 1974 728 128 30100 30100 2,42 5,052 144.00 5910 197'5 858 185 32700 29900 2,U 51 0115 155,00 5900
DOMINICAN REPUBL.IC lhb Jl Q& 992 1500 l,08 :~.no 12,40 401 1967 JO 1.14 lOU thO 2,82 1 1'861 11,40 403 1968 29 Ill 1100 1540 2,118 1 1 '111 10,40 J89 19&9 29 39 1270 1110 2a29 41 091 9 1 511 418 1970 31 39 1490 1890 2,07 11,222 9,28 448
1971 3~ 40 1730 2090 1,91 4,1§1 9,11 481 1972 14 3IJ 2010 2340 1,117 4,484 8,12 521 1973 31 40 2350 2580 1,57 4,b21 8,75 559 19'7'4 48 48 2820 2820 1,70 4,7112 10,10 593 19'7'5 4& 42 3240 i!IJIIO 1,43 4,90'7' 8,&1 &01.1
t'I:UAOOR c 1911& 24 3b 1240 1880 2,00 5,2811 11,'78 3!11 19fl'7 22 ~2 13&0 2000 t,n 5,459 5,90 lfl& l9&8 24 311 1490 2100 1,118 ! ·,U8 5,95 3'7'2 19119 3J 114 lfi'IO 2200 z,oa !1~,822 '7,50 ST8 1910 Jfl lib 1810 2UO 2,03 t., Q11 1,!59 sn 1971 n 111 !OliO 2480 1,9'7' &~,20& 1,&o :599 19'72 52 flO 22110 21140 2,40 t. 1 4011 9,36 412 19'7'3 51 u 2110 291JO 2,U .&,U2 9,43 IISJ 1974 '72 12 S420 Sll20 2,09 &,~24 1'0 t so !SOl 19'1! '7!5 &8 3990 suo 1,81 1,041 9,10 !518
~GYIIT 191tt. ,., 5S4 IJUO '71'70 1,U so,sn 11,110 an 19111 JilT 111 noo TbbO &,U so,uz U 1 !50 au 19ft8 1111 U3 nto ThO a,u s1,•n 21,10 an 19&9 !SIJl 194 &1&0 8110 9,!19 32,439 24 1 !SO 2!!5 1910 884 1130 &890 8110 u,ao :n,uo :n,•o zu U'!'l ,., 1110 nzo 9120 u,to u,•u u,•o ... 1912 UJO 14SO 8110 9440 1!1,10 u,•n 41,10 an 19'73 UTO 1!500 8840 9120 1!J. !50 31~412 41,40 114 19'74 1550 155'0 10100 10100 1!5,40 U~UII 112,90 an un UIIO lUO HSOO 10!100 11 1 TO n,·ob• ss,ao an
ARMED MILEX ARMED
FORCES ARMED FORCES
FORCES per
Constant 1000
thous dollars peo ple
!0 12240 10,42 50 12580 1o,:n 45 15118 9,2!1 1.15 14689 •,zo 1.15 14241.1 •.u 45 15b00 9,01 45 15244 9,01 45 14311 8,95 35 20800 b,93 :n 22429 &,91
19 2442 5,01 19 U11 4,92 18 2!94 4,SJ 17 21011 4 1 U 11 230b 4,01
lb 24U :J,U 1b 2444 '·" 1& 2525 3,4& 18 2&72 3,'78 18 zno l, fiT
1!J 2393 2,84 1! 214'7 a,Ts 111 2100 2,84 1'7' 25U z,•z 1b 2810 z,u !0 ZlbO s,u 20 2995 s,u !0 suo :s, 02 20 nao 2,93 20 3111!1 2,84
2U 1511 T,U no un T,lt us Jllll •• u no :usz ., ,09 II! 44S1 ,, .. su S114 .... no ,.., l&,ZI no SUb 11,01 110 .JUO U,SI 400 son so,?•
27
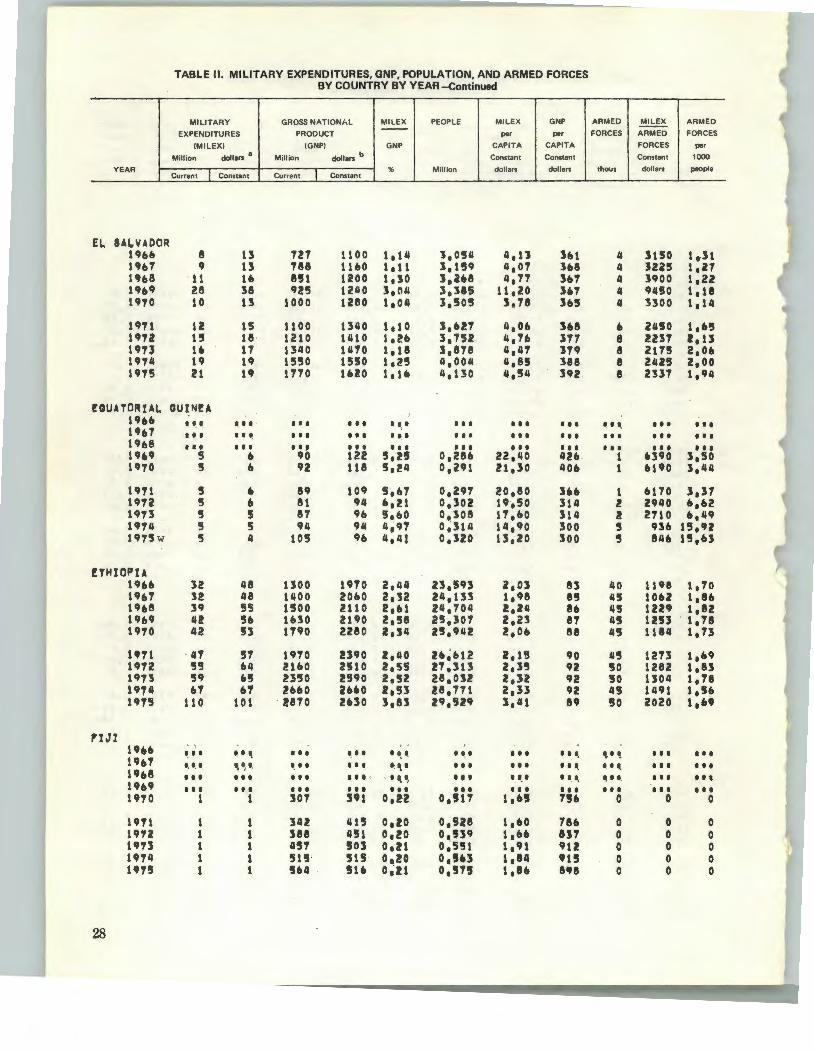
TABLE II. MILITARY EXPENDITURES, GNP, POPULATION, AND ARMED FORCES BY COUNTRY BY YEAR -Continued
MILITARY GROSS NATIONhL MILEX PEOPLE MILEX GNP ARMED MILE X ARMED --EXPENDITURES PRODUCT per per FORCES ARMED FORCES
IMILEXI IGNPI GNP CAPITA CAPITA FORCES per
Million dollar1 a Million dollars b Constant Constant Constant 1000
YEAR % Current I Constant Current I Constant
Million dollars dollars thous dollars people
EL SAI.VAOOR 1CJ&& 8 13 727 tlOO 1,14 3,0!!4 4,11 h1 4 suo 1,11 19&7 9 13 7&8 11&0 loll 1,1!19 4,07 368 4 :S.U5 1,l7 19&8 11 1& 8!51 1200 1,10 1,268 4,17 1n 4 3900 1,22 19&9 28 !8 925 1240 3,04 3,185 11,!0 3U 4 94SO 1,18 1970 10 u 1000 12&0 1,04 3,505 3,78 365 4 3300 1,14
1971 12 15 1100 1340 lelO J,U7 4,0. lU • Z450 1,., 1972 15 18 1210 1410 1,2. 3,7'52 4,1b 377 8 2237 a,u 1973 u 11 1340 11170 1,18 3,818 4,47 :sn 8 2175 2,0. 1974 19 19 1'550 15'50 1,25 4,004 4. 8!S 388 8 24Z5 z,oo 1975 21 19 1170 1UO 1,1. 4,130 4,54 392 & 2337 1194
EQUATDIHAL OUtNI!A 19&fl . • .. I I I I t I ••• . • .. . I t I I I I I t I 1 . • I . 19&7 I I I I I\ ••• • •• ••• • • • • •• • •• • • • 19&8 I I I • • • .. ' ••• I I I ••• I I I I I I •••
I I I • •• • •• I I I
I I I • •• 19&9 5 & 90 122 5,26 0128& 22,40 42. 1 &390 l,So 1910 5 b 92 118 5124 01291 21130 40. 1 •s•o 3,44
1911 5 • 89 109 51&7 0,297 20,80 ,.. 1 6170 3,37 1 IJ'Tl '5 • 81 IJ4 .121 01 lOZ 19150 314 2 2940 •• u 1 IJ'T3 5 5 87 9& ~.&o 0,308 17 ,•o 114 2 2710 .149 1974 5 5 94 94 4,CJ7 01 314 14 1 1JO 100 5 93. 15,92 11J75w 5 4 105 9& 4,41 0,320 u,zo 300 5 84ft 15,U
fTMIDF'U 19&& 32 48 uoo 1970 2,44 231!JCJ3 z,o:s 83 40 1l 9& 1,70 19&7 32 48 1400 20&0 2,32 24,133 1,98 8!! 45 lOU 1,8. 19&8 39 55 1500 U10 2,&1 24,704 2,24 8. 45 llliJ 1,82 19&9 42 ,. 1&30 2190 2158 251307 2,23 81 45 un 1,1& 1910 42 n 1790 2280 2114 25,942 z,o• 88 45 1184 1173
U11 47 57 1970 2390 2140 2•,•12 2,1!5 IJO 45 1213 1,n 1972 55 b4 UbO 2'51 0 2,55 27,113 2,35 92 50 1282 1,83 197! 59 u 2350 2590 2,52 2810l2 2132 IJ2 50 1304 1,18 1974 u .., 2&60 26fl0 2153 2&1771 2133 qz 45 1491 liS. 11J15 110 101 . 2&70 2UO 3183 U,!i!IJ 3,41 89 50 2020 l 1U
I'IJI 1966 . ' ' . .
• • • ~·~ ••• • ... . • ... I I I • •• . ... ~·~ 19&7 '· '·. '· I, ~ '· .. • •• .. • .. I I I ••• . . ' '· . ., 1968 • • • I I I ••• ••• .... ~ I I I I I I I t . I, ~. '· 19&9 • • • • • • ••• • •• • •• I I I ••• I I I •••
••• I t I
Ill ••• ••• • •• I I I I I t
1970 1 1 307 n1 01!2 01517 t,U 756 0 0 0
U71 1 1 342 41'5 o,ro 0,!128 t 1•o 786 0 0 0 1912 1 1 388 4!1 o,zo o,U9 1, •• 837 0 l9U 1 1 U'T !103 o,u 0~551 1,91 9tZ 0
0 0 0 0
1974 1 1 515 515 01.20 olsu 1,84 '15 0 0 0 11J75 1 l ,64 516 o.-u 015n l,U n8 0 0 0
28

YEAR
FtNL.AND 19U UH 19118 19&9 1910
1911 1912 1913. 1914 191'5
,-IUNC! 19U 1901 Uo8 U6CJ 1970
1911 1912 un lUll 1CJ75
IUBON 19&6 19&1 19ft8 19&9 1~10
1971 uu un 19'14 19U'
GAMBIA, TM! · l9o& 190'1 l968 .... u;o
1•11 19U 191) 1914 UT!
TABLE II. MILITARY EXPENDITURES, GNP, POPULATION, AND ARMED FORCES BY COUNTRY BY YEAR -Continued
MILITARY GROSS NATIONA L MILEX PEOPLE MILEX GNP --EXPENDITURES PRODUCT per per
IMILEXI I GNP) GNP CAPITA CAPITA
Million doll an • Million dollars b Constant Constant
% Million dollars dollars Current I Constant Current I Constant
1!1 239 9!140 14!100 1,U 4,!181 !12,10 U&O 158 233 10100 14800 1,,8 4,60& !10,70 3220 181 2&4 10800 HI ZOO 1,14 4,62& ~7,00 :sz8o 177 238 12!500 U700 1,42 4~U4 U 1 40 :Sb!O 191 2,0 14200 18100 1,38 4,60& 54,40 3930
U4 212 U300 18!500 1 ~ 47 4,&12 '58,90 4020 26!1 309 11000 19800 la'JO 4,640 flft 1 !S 0 4210 216 303 1CJ100 21000 1, 44 4,605 u,oo 4'500 303 303 21800 21800 1,59 4,682 64,80 4660 348 319 23900 21800 1,46 4,702 .., • 70 4UO
n4o- 8'700 114000 173000 5,02 49,194 111,00 3520 U10 CJUO 124000 182000 ~.o:s 49,569 185,00 3670 6!510 9110 U'!IOOO 1''1000 4,80 49,932 184,00 3820 6410 uoo 1nooo zo•ooo 4~18 50.3'50 111,00 4080 1UO 9090 171000 218000 4,17 !10,784 1'19,00 4190
1'580 CJ190 189000 229000 4.01 ~51.183 1 n,oo 44'70 8110 9!HO 210000 24'5000 3,1!9 !H • 7:5& 184,00 4130 8870 91&0 233000 2'56000 :$,81 '!12,11:5 181,00 4900 94120 9CJ20 26&000 206000 3,13 U,577 sn,oo !!lObO
11400 10400 !84000 260000 4,00 '52,876 191,00 4910
c J IS 301 !!1118 1,38 0,4111 10,40 1100 l '5 :S85 5U 1,26 0,418 9,12 1190 3 4 408 '51'5 1,16 o,4n 8,96 1190 !S b 419 &Ill 1,!12 0,488 u,oo 13!0
' 1 §46 045 1,!51 o,us u,eo 1410
6 8 U& 1!5~ 1,59 0,.495 U,ftO t!J20 1 8 no 8!10 leU 0,'503 16,&0 1ft90 • 10 845 9!!50 1,!11 0. !108 19,10 1UO ll ll 1020 1020 t,oll 0,514 20,70 ueo 14 u 1190 1090 1, 18 o,!IU 25,20 2100
0 0 39 n 0 o;4u 0 ue 0 0 41 61 0 0~440 0 140 0 0 44 u 0 0,44CJ 0 140 0 0 !1 •• 0 0,418 0 Ul 0 0 48 u 0 0,46'1 0 u:s 0 0 u ., 0 0,416 0 U8 0 0 ., 18 0 0,486 0 tu 0 0 10 '11 0 0,49! 0 1!b 0 0 IJ2 IJ2 0 0,'50'5 0 181 0 0 106 .., 0 o,su 0 188
ARMED MIL EX ARMED
FORCES ARMED FORCES
FORCES per
Constant 1000
thous dollars people
40 5975 e' n 40 '5825 8,&8 40 &bOO 8,6!1 40 59 50 8,6'5 40 U!IO e,•8
40 6800 8,67 40 172'5 8,62 40 7'575 e,s8 40 7575 8,54 40 797!5 8,51
580 1'5000 11, n 595 1!3318 12,00 !ITO 10088 11,112 570 15088 11,32 S70 15941 11,22
56!! 162ft5 11,02 560 16982 10,02 5ft0 17429 10,13 '!180 11101 11,0J '57'5 18087 10,87
4910 2,11 4&50 1,09 4330 2,01 &340 z,os 6820 2iO:S
1 7150 2,01 2 4105 :S,98 2 490'5 J,94 z 5300 l,8CJ 3 4361 5,18
0 0 0 0 0 0 0 0 0 0 0 0 0 0 0
0 0 0 0 0 0 0 0 0 0 0 0 1 0 t,U
29
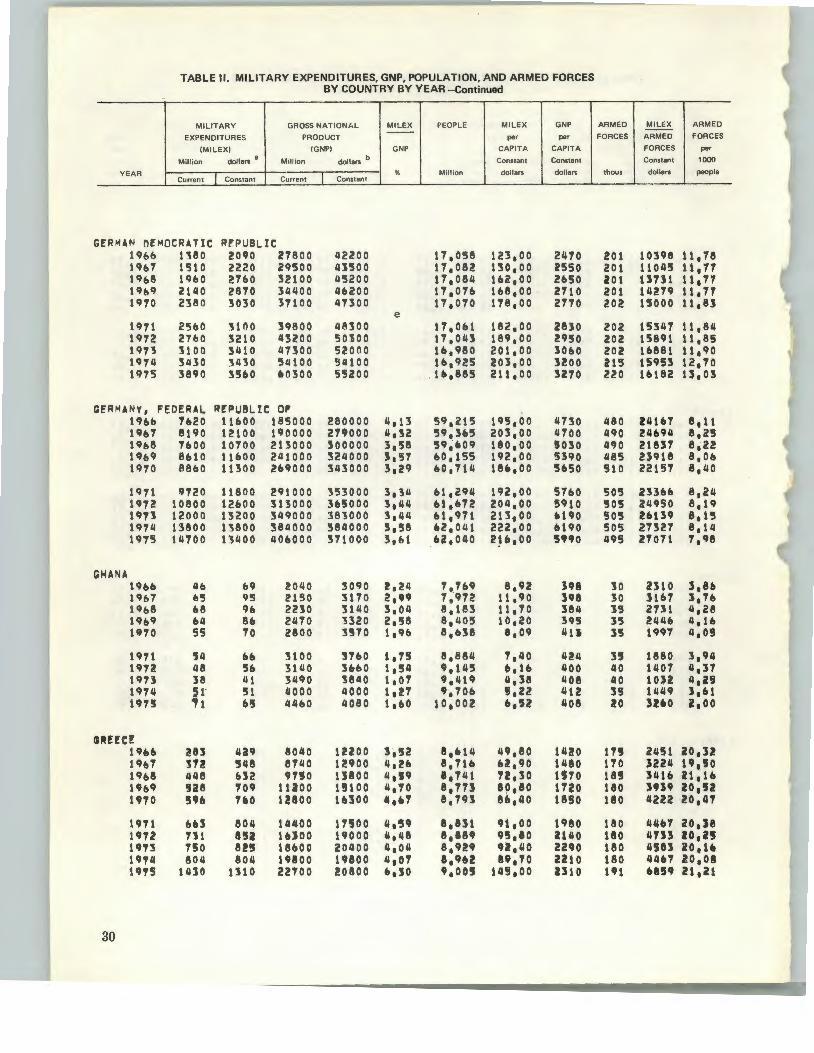
TABLE II. MILITARY EXPENDITURES, GNP, POPULATION, AND ARMED FORCES BY COUNTRY BY YEAR -Continued
MILITA RY GROSS NATIONhL MILEX PEOPLE MILEX GNP
EXP ENDITURES PRODUCT per per
(M ILE XI (GNP) GNP CAPIT A CAPITA
Mill ion dollars a
Million dollars b Constant Constant
Y EAR % Million dollars dollars Cu rrent Constant Current Constant
GERMA N DEM OCRATIC R!'P UB LIC 19bb 1'580 ~090 27800 42~00 11,058 12l, 00 2470 19&7 1'510 2220 29500 41500 11,082 130,00 2550 19&8 19&0 27b0 :52100 45200 11,084 1112,00 21150 19!19 2140 2870 34400 4&200 11,01& 1&8,00 2710 1970 2380 3030 311 00 47:500 11,010 178,00 2710
e 1971 25&0 '51 no 39800 48300 17,0&1 182,00 2830 1972 271> 0 3210 43200 50300 17,043 189,00 2950 11~73 3100 3410 47300 52000 1&,980 201,00 3060 19'14 3430 ~430 54100 5U1 00 1&,925 203,00 noo 19'15 3890 35110 60300 55200 16,885 211,00 3210
GER MANY, FEDERAL. REPUBLIC 0!" 19&& 1&20 11&00 185000 280000 4,13 59,215 195,00 4730 19&7 8190 12100 190000 2!19000 4,32 59,3&5 203,00 4700 19(1,8 1&00 10700 213000 300000 3 1 58 59,609 180,00 '!5030 ~~~69 8610 11600 21.11000 3211000 J,57 &0,155 192,00 5J90 1970 88&0 11300 269000 343000 3,29 &0,714 18&,00 5&50
19'11 9720 11800 29 1000 353000 3,3'1 &1,2911 192,00 57&0 1972 10800 12&00 313000 3&5000 3,44 &1,&'12 204,00 !5910 191l 12000 13200 349000 383000 3,411 &1,971 213,00 •uo 19'74 13800 1'5800 384000 384000 5,58 &2,041 222,00 &190 1975 111'100 131100 40&000 311000 3,&1 U,040 2~&,00 s••o
GHA NA 1911& 4& &9 201.10 :5090 !, ! II 7,'7&9 8,92 H8 1qb1 &~ 95 2150 3170 2,99 7,972 11,90 H8 19&8 &8 9& 2230 3140 :5,04 8,183 11,70 384 19&9 &II 8& 21170 3320 2,58 8,405 10,20 395 19'10 55 10 2800 :5'510 1,9& 8,6:58 8,09 411
19'!'1 !54 && :'1100 n&o 1,75 8,884 1,110 11211 1912 118 5& 3140 311&0 1,54 9,145 et,lb 400 l'JU J8 1.11 31190 3840 1,0'!' 9,419 11,38 408 19711 ~r 51 11000 4000 t.n .,70& !1,22 412 19'1§ &5 4460 11080 1,&0 10,002 &,52 408
UHC! 19ft& i!83 UCJ 8040 12ZOO 3,!52 8,1114 49,80 14!0 19&7 11! '118 87110 12!900 4,2& 8, 71& 112 1 CJO 1480 1968 448 &12 91150 U8oo 4,19 8,141 '12,30 U1o l9b9 !128 '709 1 taOO 15100 4,70 8, 713 80,80 l'!'U 19'!'0 '!I 'HI HO 12800 1UOO 41,&7 8,193 8&,40 18!0
19'!'1 &113 804 14400 l'!'SOO "·'9 8,831 91,00 1980 19'12 U1 8!12 1UOO 19000 4,118 8,889 9!5,80 U410 19'!'3 no 8!!5 18&00 20400 4,04 8,929 92,40 ~l90 19711 804 804 19800 19800 4,07 8,1JU n,1o 2210 19'f5 1430 U10 22100 20800 &,so 9,005 14!!1,00 U10
30
A RMED MI L EX ARME D
FORCES ARMED FOR CES
FORCES per
Constant 1000
thous dollars peo ple
201 10398 11, 7e 201 11045 11,11 201 13131 11,71 201 14279 11,71 202 15000 11, 8J
202 15347 11,84 202 15891 11,85 202 1&881 11,90 215 15953 12,70 220 16182 1$,03
480 241 &1 8,11 490 241194 8,25 490 218J7 8,22 485 n9t8 8,06 510 22157 8,40
505 233&& 8,24 505 24950 8,19 50'5 U139 8,15 505 27327 8,1 II 495 27071 '7,98
30 2110 3,8& 30 3101 :S,H 35 2111 4,28 35 2114& 4, u 3!5 199'1 11,0!5
35 1880 1,94 40 1407 4,31 40 lOU 4. 2!1 3!5 1t1119 J,61 !0 JUO z,oo
11!1 2451 20,32 170 ;5224 19,!0 18!5 34111 21 1 16 180 nn zo,n 180 4222 20,47
180 44111 zo,u 180 4Ul u,n 180 4$83 20,1& 180 IIIIU ao,o8 191 un 21,21
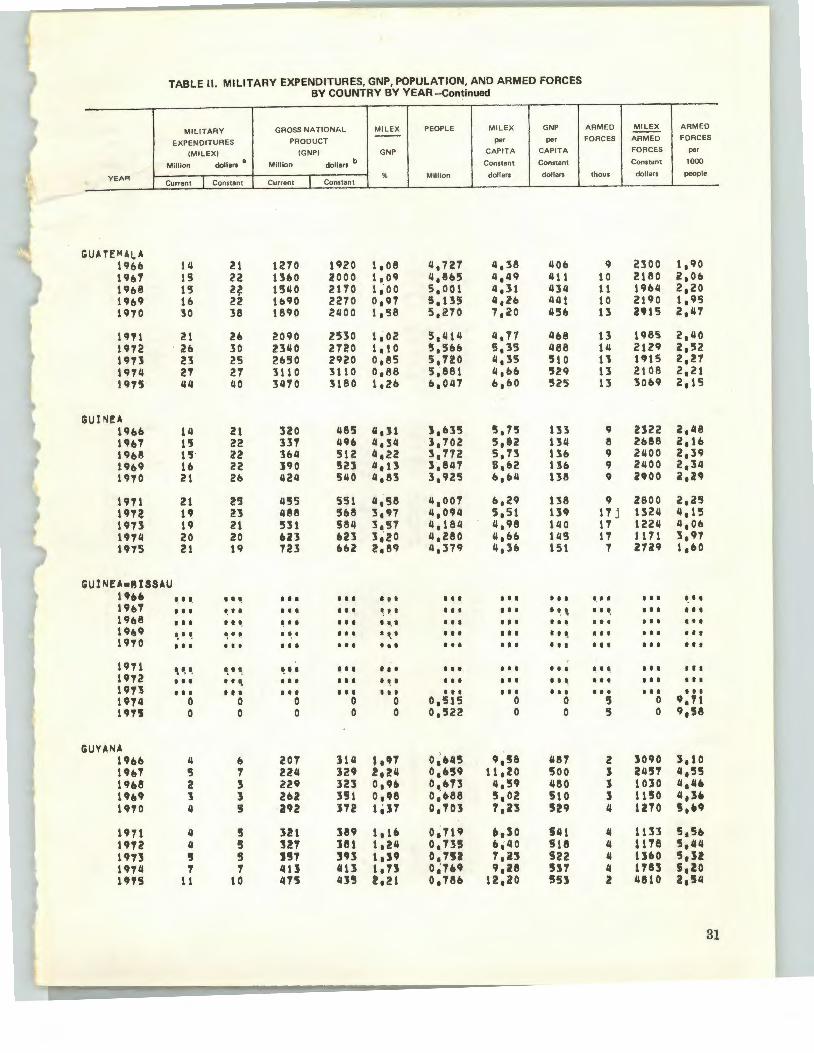
YEA R
GUHE M4LA 196b 19eT 19!!8 19b9 1970
1971 1972 1911 1974 1915
GUINE:A 19bl» 1967 1968 19&9 19'10
1971 19'12 1973 U'74 197'5
TABLE II. MILITARY EXPENDITURES, GNP, POPULATION, AND ARMED FORCES BY COUNTRY BY YEAR -Continued
MILITARY G ROSS NATI ONI.L MIL EX PEOPLE MILEX GN P
EXP EN D ITUR ES PRO DUCT per per
IMILE XI I G NP) G NP CAP ITA CAPITA
Million dollars 8 M ill io n dollars b Constant Constant
% Mill ion dollars do llars Current Constant Cu rrent Constant
1Q !1 1270 1920 1108 111727 11138 IIOb 15 22 1360 ii!OOO 1,09 4,8&5 4,11q 411 1!5 2? 1540 2170 1 •· 00 51001 41:51 434 16 22 1690 2270 0,97 51135 4,26 441 30 38 1890 21100 1,58 5,270 7,20 456
21 26 2090 2530 1102 5,414 4177 468 2b 30 !340 2720 1 • t 0 515611 15,35 488 23 25 2650 2920 0,85 51 TZO 4,35 510 2'1 27 3110 3110 0, 88 5,881 4166 529 44 40 3470 3180 1126 6,04'1 &,60 525
14 21 320 485 Ci 1 J1 J,b35 5,75 133 15 22 337 496 4,34 1,702 5,82 134 15 22 364 512 4,22 3, 772 5173 136 16 22 190 523 u, 13 3,847 61&2 136 21 26 U24 540 4183 3192'5 6,611 118
21 25 455 5'51 4,58 11,007 &1 29 138 19 23 488 '568 3,97 4,094 5,51 119 19 21 531 584 31'57 11,184 4,98 140 20 20 6Z3 U3 3,20 41280 4,6& 145 21 19 723 bb2 2,89 4,379 4136 151
GUINEh8ISSAU U&& • ... ••• I I I I I I I I I I I I I I I I I I
19b7 I I I I t I I t I t I t ~ ·-. I I I I I I I I t 1968 I I t .. ·~ ~ t I I I I I 1, I I I I I I I I I t
19&9 ~· ~ ~. I ~ '·. I I I .... I I I ••• •• I ,
19'10 I I I I t I I I I I t I t I t ' ' ' .. ' I I I
19'11 ~ •. •. • • • ~ .. • •• . . ' I I I ' ' ' t I I
19'12 . ' I I I I I ~ I I I I I I . ~. I I I I I t I I I ,
19.,3 ••• I I I ' ' . I I I I I I I I I .. ' I I I
197'1 0 0 0 0 0 0,51'5 0 0 1'75 0 0 0 0 0 01522 0 0
GUYANA 1966 4 b 201 11'1 1a91 o;u5 9158 1181 1961 5 1 224 129 2,211 o,o59 11,20 soo 19&8 2 3 229 123 0,9& o,u:s 11159 '180 19&9 l l 2b2 351 0 1 CJ8 o;oe8 5,02 510 1970 II 5 292 l'12 1 iJT 0 1 101 7123 529
1911 " '!! 321 189 1,1& 0,119 &,so 541 1972 4 5 l!T 181 1,24 o.n5 6,40 518 191J '!I !I ,1 3U 1,39 0,752 1,23 522 1974 ., 1 1113 4113 1.n 0~1&9 9,28 5$7 1'75 11 10 '175 us !,21 0,18& 12,20 553
ARM EO MI LE X A RM EO
FO RCES A RM ED FO RCES
FORCES per
Constant 1000
thous dollars people
q 2300 1190 t 0 2180 z,o& 11 1964 2,20 10 2190 1,95 13 2'15 2,47
t3 1985 2140 14 2129 2,52 n 1915 2,27 t:S 2108 2,21 13 301>9 2,15
q 2322 2148 8 2688 2116 q 2400 2,39 9 2400 2,34 9 z•oo 2,U
9 2800 2,25 17 j 1:524 4,15 17 1224 4,0& 17 1171 3197
7 ii!7il9 1,oo
I I I I I I I I I .. •. I I I I I I
t I t I t t t I I
I I t I I I I I I
I I I I I I I I I
t I ~ I I I I I I
I I t I I I I I I
I I t t I I t t I
5 0 9 I 'f1 5 0 9,58
2 3090 3,10 1 2457 4,55 J 1030 4 1 1141 :s 1150 ll,lb II 1270 5,&9
4 1133 s,so 4 1178 51414 II 13&0 5,:U 4 1783 1,20 2 4810 2,54
31

TABLE II. MILITARY EXPENDITURES, GNP, POPULATION, AND ARMED FORCES BY COUNTRY BY YEAR -Continued
MILITARY GROSS NATIONI, L MIL EX PEOPLE MILE X GNP ARM ED MILEX ARM EO ----EXPENDITURES PRODUCT per per FORCES ARM EO FORCES
IMILE Xl IG NPI GN P CAPITA CAP ITA FORCES per
M i ll ion dollars a Mill ion dollars b Constant Constant Cons\ant 1000
YEAR Current I Constant I
% Mill ion dollars dollars thous dollars people Cu rren t Constant
I.UlTI k 19&& 1 t 1 3'17 ~72 11 'n ~.271 2,58 13U 10 1100 2 1 3U 1 9~)7 1 11 381 561 1,96 4,J50 !,52 1~9 n 8~& 2.99 19&8 8 11 ~10 578 1o9& 4 1 U25 2,56 131 12 uz z,11 19&9 8 11 447 &00 1,86 ~.soz z.~a 133 12 933 2,b7 1970 9 12 U13 603 1,91 ~.sao l 1 51 132 12 958 2,&2
1911 11 1~ 530 &43 2.12 4,b61 2,92 138 12 1153 !,57 11JT2 12 ·~ '5'37 &48 2.18 ~.751 2,98 13b 12 1175 2,53 19H 10 11 '576 634 1, 73 ~.847 2,27 131 12 917 2,48 197~ 9 9 709 709 1,31 ~.9~9 1,88 1~3 61 1553 1,21 1915 9 9 774 708 1,20 5,05~ 1,68 140 6 1418 1. 19
HONOUR A~ 19&6 b 9 U66 707 l,H 2,355 3,96 300 5 18b& 2,12 1CJ&7 1 1 0 502 739 1, 33 2,~36 41,0'3 303 5 1972 2,05 1968 6 9 557 785 1,09 2,520 3,~o 312 5 1712 1,98 1969 1l 18 595 799 2.2~ 2,607 6,82 307 6 2967 2,30 1970 7 8 649 827 1o02 2,697 3,12 JOb 6 1403 2,22
1971 q 11 705 85~ 1,32 2, 791 ~.o:s 30& 8 1UOO 2,87 1972 12 1~ 7b1 886 1,&0 2,889 il,90 307 12 1175 4,15 19H til 1~ 8U7 932 1,~6 2,992 4,55 312 12 1133 4,01 197~ 13 13 955 IJ55 1,37 3,098 4,21 308 10 1300 3,23 1975 18 17 1020 937 1,78 3,209 5,19 292 12 D83 :S,74
HUNGARY 19bb &1U 1020 11700 17100 10,185 100,00 1740 156 6538 15,12 1967 &74 993 12'7'00 18700 10,223 97,10 1830 156 6365 15,26 19&8 743 t050 13500 19000 10,26~ 102,00 1850 14& 7192 1~,22 19&9 82/J tltO 11J600 19& 00 10,303 10,7 ,oo 1900 146 ao3 11J,17 1970 969 1230 15100 1CJ3 00 10,H8 119,00 1870 11J6 81125 11.1,12
e 1971 1030 1250 1&700 20300 10,3&8 120,00 19&0 1~& 8562 11.1,06 1972 107() 1250 17900 20800 10,398 uo,oo zooo 14& 6562 141,04 1971 1150 1270 191.100 21300 10,1J32 121,00 20~0 140 9071 n,uz 1914 1:\20 1320 22&00 22600 10,413 12&,00 2160 125 105&0 11,9~
1975 11J20 1JOO 25500 233 00 10,5411 123,00 Ut 0 118 11017 11,19
tCEI.A ND 19&& 0 0 707 1070 0 0,19& 0 5il10 0 0 0 19&7 0 0 714 10'!10 0 0,199 0 !280 0 0 0 19&8 0 0 701 988 0 0,201 0 ~920 0 0 0 19&9 0 0 762 1020 0 o,Z03 0 !i040 0 0 0 1970 0 0 8~8 1080 0 0,2041 0 5300 0 0 0
1"' 1 0 0 982 1190 0 0,206 0 5780 0 0 0 1972 0 0 1080 1260 0 0,209 0 6010 0 0 0 1913 0 0 1210 1330 0 0 1 l12 0 6280 0 0 0 1974 0 0 1370 U10 0 0,21' 0 6390 0 0 0 1975 0 0 11.190 1370 0 0,218 0 U10 0 0 0
32
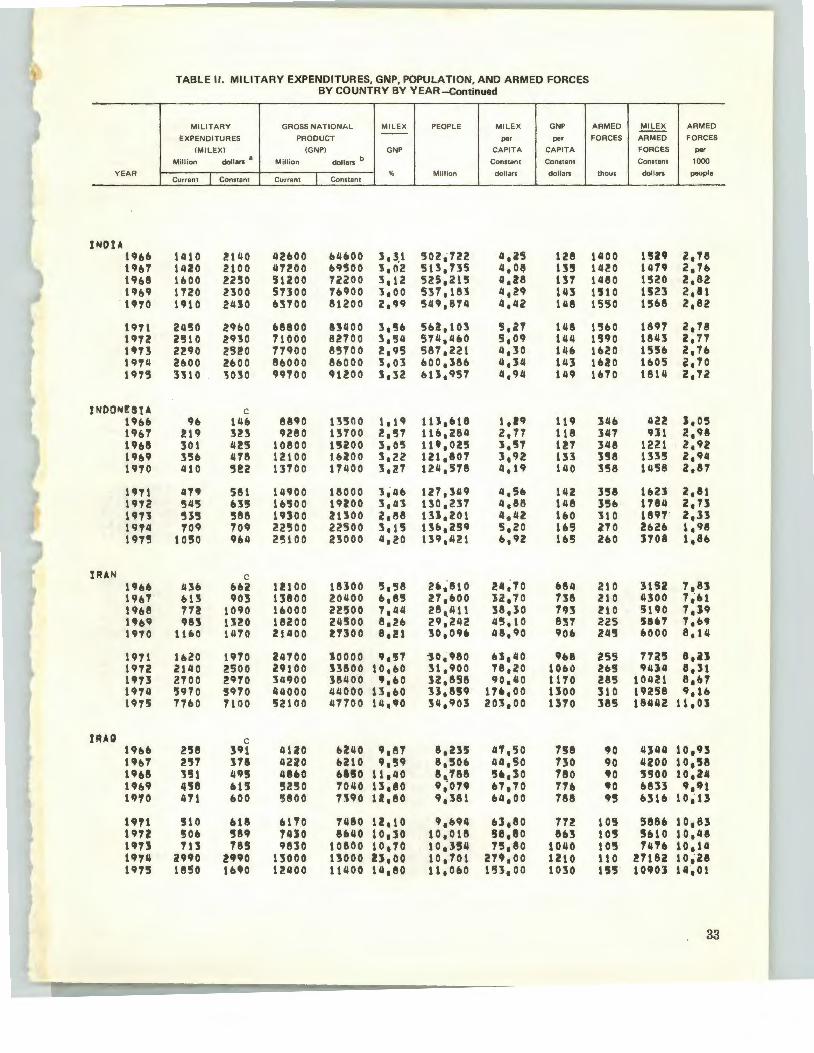
TABLE II. MILITARY EXPENDITURES, GNP, POPULATION, AND ARMED FORCES BY COUNTRY BY YEAR -Continued
MILITARY GROSS NATIONhL MILEX PEOPLE MILEX GNP ARM EO MILE X ARM EO ----EXPENDITURES PRODUCT per per FORCES ARMED FORCES
(MILEXI (GNP) GNP CAPITA CAPITA FORCES per
Million dollars a Million dollars b Constant Constant Constant 1000
YEAR % Million dollars dollars thous dollars people Current I Constant Current I Constant
INDU 1~&6 11110 21110 42&00 &11&00 313,1 502,722 4,25 128 1400 1!29 l,18 1~&'7 1420 2100 111200 &9'500 l,nz 513,135 4,06 135 11120 111'19 2,'7& 19&8 1&00 22'50 51200 12200 3,12 525,215 4,28 13'7 1480 1520 2,82 19&9 1120 BOO snoo 1&90 0 3,00 531,183 4,29 143 1110 1!l23 2,81 1•10 1•1o zno 63700 81200 2,99 549,814 11,42 1118 1550 15&8 2,82
19'1'1 2450 29&0 &8800 83400 3,!& 5&2,103 5,21 148 15&0 1891 2,18 1912 2510 2930 11000 82100 :5,511 5'1'li 1 4U 5,09 1411 15~0 1841 2,71 UT3 2290 2520 11900 85700 !,95 587,221 11,30 146 1&20 1556 2,76 19111 2&00 Z&OO 8&000 8&000 '5,03 &00,38& 4,14 143 16!0 1&05 l,10 1915 3310 l030 99100 ~1200 S,32 &13,951 4,94 1119 1&10 18111 2,12
lNOON!S!A c 19&& 9& 14& 8890 13500 1,19 1 tl,&18 1,19 119 34& 422 1,05 19&1 21~ 323 9280 13100 !,51 11&,284 2,77 118 147 ~11 2,98 1~&8 301 425 10800 1'!1UO 3,05 11',02'5 1,51 127 348 1221 2,92 1~&q 35& 478 12100 1&200 3,22 121,807 1,92 133 3!18 1H5 2,94 1910 410 522 13700 111100 J,27 1211,578 4,19 140 356 1458 l,81
11f71 liTIJ 581 14900 18000 3i4& 127,149 4,5& 1112 358 1621 2,81 1912 545 &35 U500 19200 3,41 t:SO 1 237 4,88 148 3'56 1184 2,73 191l '535 '588 1UOO 21300 z,e8 13l,201 4,42 uo 310 1897 2,33 19'7'4 109 709 22"300 22500 3.t5 13&,259 5,20 165 210 262& 1,1J8 1975 10'50 964 25100 23000 4,20 139,421 &,'H~ 1&5 260 1708 1,8&
HUN c 1~6& 43& 6U 12100 18100 5,58 2.,.810 24~70 684 210 3152 7,81 1961 61'S 903 13800 201100 &,85 27,600 lil 1 70 138 iHO 4300 7~61 19~8 112 1090 16000 ~2,00 7,1141 ~8,4111 :58,30 H3 uo 5190 7 1 H 1·~9 98~ 13!0 18200 24500 8,2& 29,242 45,10 837 225 un 7,69 1970 11&0 14'7'0 21400 n:soo 8,!1 30 1 0C'f~ 48,90 90b 245 &000 8,14
1971 uzo 19'10 24700 JOOOO 9,51 10,.980 &J 1 4o 9&8 255 11a'5 e,u 1972 2140 2500 29100 J3800 10,60 31,900 78,20 10bil !65 94)4 8,11 nn 2100 !970 34900 38400 .,60 3Z,858 90,40 1170 285 101121 8,67 1974 5970 !970 44000 44000 n,6o 33,8!59 u•.oo llOO ~10 19258 9 ,1& 1975 71&0 711)0 52100 47100 14,90 34,903 201,00 1370 385 18442 11,01
liUQ c 19&b 258 391 4120 U40 9,81 8. 235 47,50 1!18 ~0 4344 10,93 U&7 !57 318 4220 b210 9,'59 8,!506 44,50 130 90 4200 10,!58 19&8 351 495 4UO u~o 11,110 8~,788 5•,30 780 •o 5500 10,24 19b9 458 &U 5250 7040 13,80 9,07' 61,70 11& •o 6833 9,1Jl U10 411 600 5800 H9o u,eo 9,181 64,00 788 9'5 &316 10~13
uu 510 &18 6110 1480 1!,1 0 9,&94 u,8o 172 105 5886 10,83 197! 506 58tf 74JO 8640 l0,$0 10,018 '!8,80 8&3 10'! 5&10 10,48 1•n 713 16! 9830 10800 10,70 10,3,41 75,80 1040 105 141& 10,14 1974 2990 !990 uooo uooo n,oo 10,701 zn,oo 1210 110 21182 10,Z8 11J15 1850 1&90 12400 11400 14,80 11,060 153,00 1030 155' 10901 14,01
33
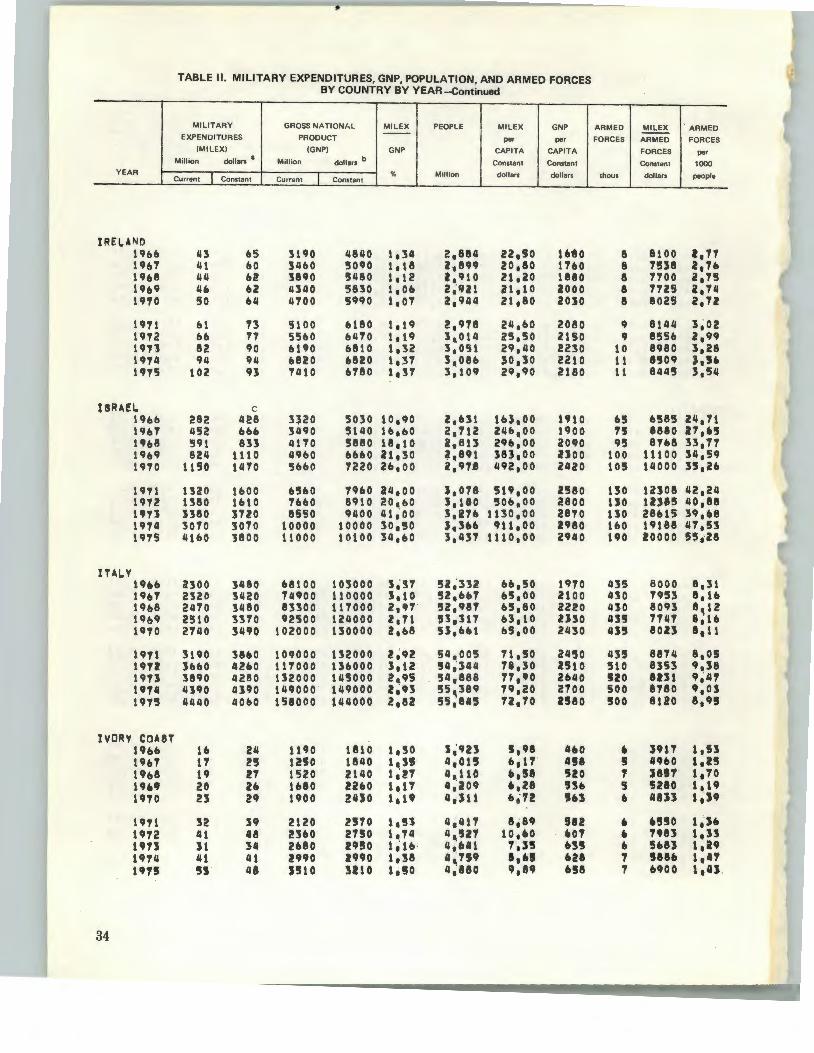
YEAR
l REI. 4 NO 19bb 19(17 19&8 19(19 1970
1911 1912 191l 19111 11J15
lSRAE:L. 19&6 1967 llf68 19&9 19TO
1971 1912 uu 1914 1975
ITAI.V 19U t9tt7 1968 19&9 u7o
1971 19U 1973 1914 1915
IVORY COA8T 19&& th1 19&8 19&19 11910
19T1 1'12 19U 119111 119TI
34
•
TABLE II. MILITARY EXPENDITURES, GNP, POPULATION, AND ARMED FORCES BY COUNTRY BY YEAR -Continued
MILITAR Y GROSS NATION A L MI L EX PEOPLE MIL EX GNP EXPENDITUR ES PRODUCT per per
IMILEX) I GNP) GNP CAP ITA CAPI TA Million dollars 8
Million dollars b Constant Co nstant
Cu rrent Constant Current Co nstan t % Mil lion dolla rs dollars
113 &5 31'~0 48110 1, 311 2,8811 22,50 U8o 111 60 311&0 5090 1e18 Z1 899 20,80 11&0 1111 b2 3890 !51180 1.12 1.910 21.20 1880 lib u 113110 5830 1,0& 2~921 21,10 2000 50 till 4100 §990 1 1 01 2,91111 21,80 2030
b1 13 5100 &180 1 1 19 2.978 211.&0 2080 ,, 11 55&0 61110 1,19 3._0111 25,50 2150 82 90 &190 &810 1,32 3,051 29,110 2230 911 911 6820 &820 1,37 3.086 30,30 2210
102 93 71110 6180 l, 31 3 ~ 109 29,90 2180
c 282 1128 3320 5030 10 1 1JO 2 1 631 16).00 1'10 452 &&o 31190 51110 16,60 2,712 2116,00 1900 591 en 111'10 5880 lA ,1 0 2.813 29~,00 2090 8211 1110 11960 bb60 21,30 ~.891 383,00 lJOO
1150 11110 56&0 7220 21> 1 00 i ,91.8 1192,00 21120
1320 11100 &'5&0 TIJbO 211 1 00 5,078 su,oo 2580 1380 1&10 7&60 8910 20,&0 1.uo 506 1 00 2800 3380 3120 8550 9400 41~00 :5,2711 1130,00 2810 3070 3010 10000 10000 30,50 hlo& 911,00 neo lltbO 3800 11000 10100 311,&0 3,1131 1110,00 29110
1!300 31180 b8100 103000 3,37 sz : :n2 &&,50 1970 2320 31120 711900 110000 J,10 52,&67 65,00 2100 21170 31180 83300 117000 2,91 52,981 115,80 2220 2510 n1o 92500 1211000 2,71 !S3,317 63,10 2HO 2140 3490 102000 130000 2,&8 53,&&1 65,00 2430
3190 38&0 109000 lJ2000 2,92 511,005 11,50 21150 lbbO lli!&O l 11000 13&000 3,12 !41~3411 18,30 2!11 0 3890 11280 132000 1115000 2,195 511,888 77 ,•o 2&110 11390 IIHO 149000 1119000 Z~l93 55~389 79,20 2700 411110 110&0 158000 1114000 2,82 55,841!!1 u, 10 2!580
16 24 1190 1810 1,50 J~923 s,u 4&0 11 25 U!SO 18410 1 e, 3!S 11,01!1 &,11 458 19 21 1520 2140 1,27 11,110 6,51 s:to 20 lb 1680 noo ltl'T 4~209 6,28 n• 23 219 uoo uso 1~119 11,;111 bi72 !SU
32 H 2120 2510 1,n lli411 11189 582 111 118 2360 21!10 11 111 4 ., '521 10,&0 ftOT 31 34 2&80 neo 1 ~ t b · 11,641 T"1 3!5 6S!I lit 41 21990 29190 1,38 4~1'519 a,u 628 n 118 n1o )210 1;'!0 41,1180 19,89 .,8
ARMED MI LEX ARMED
FORCES ARMED FORCES
FORCES per
Constant 1000
thous dollars people
8 8100 i, 71 8 7558 2,h A 1700 2,75 8 1725 l,14 8 8025 2,72
9 811111 3,02 9 85S& a.99
10 8980 1,28 11 UOIJ ,,,. 11 84115 3,511
&5 &!585 211,71 1! 8880 17 1 U 95 8'1&8 33,71
100 11100 34.59 105 14000 35,211
130 12J08 112.211 uo 1U1!5 110,88 uo 28615 H,U 1b0 19188 117,5:'5 190 20000 !55,28
1135 8000 8,31 11:'50 7953 8,1& 1110 8093 8~12 43§ 7147 1,16 43!!1 eon e,u 435 8874 a,os 510 8353 19,38 szo BtU 9~4., 500 8180 19,03 !100 8120 8,195
• nu 1,SJ 5 119&0 1,25 1 Ul'f' 1,70 5 5210 1,19
• 4833 s,SI9
6 65!50 1, Sit
• 1•n 1,33 b 5&83 1,29 ., sea• 1,4'1 1 41900 1,43
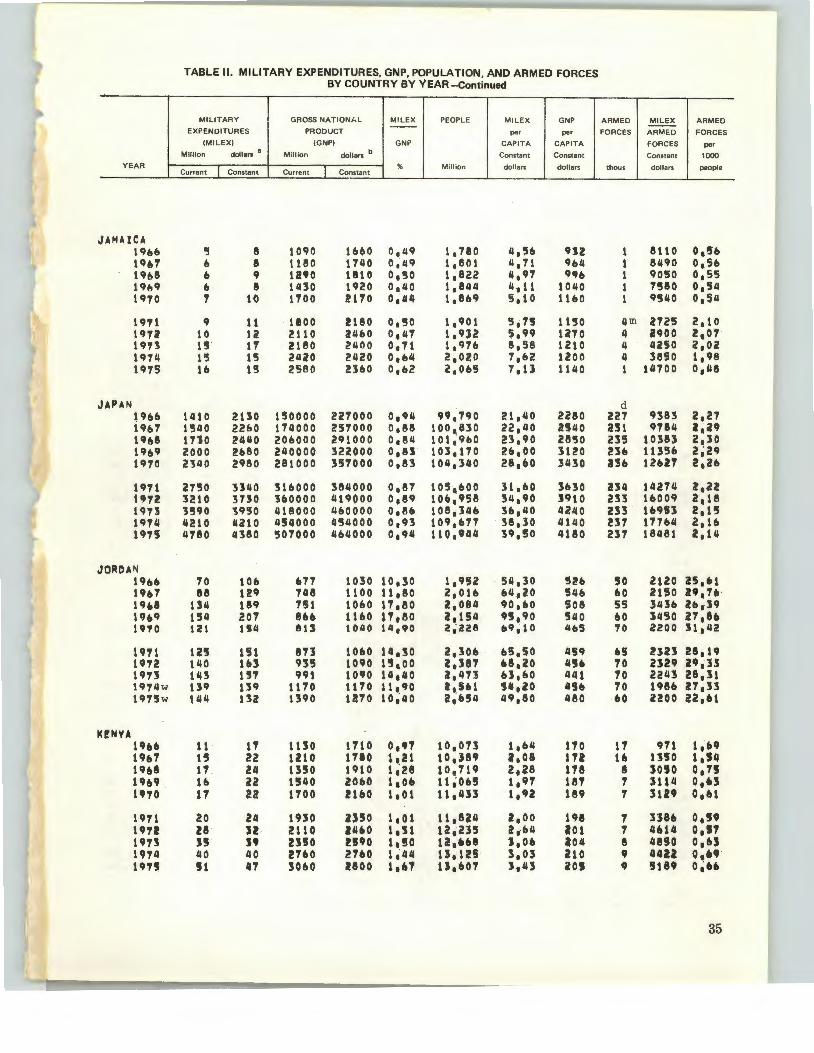
YEAR
JAMAICA 19&& 19b'r 19&8 19&9 1970
1911 19U 191'$ 1974 1975
JAPAN 19&& i9&7 1'&8 19&9 1970
19'11 un 1973 1911.1 1915
JORDAN 19ee 19&7 lCJU 19&9 1910
19'r1 1'72 191J 1974 w 1 975 w
K!N't'A 1966 19&7 19U U69 U70
19'rl 1912 un 11J14 un
TABLE II. MILITARY EXPENDITURES, GNP, POPULATION, AND ARMED FORCES BY COUNTRY BY YEAR -Continued
M ILIT ARY GROSS NATIONAL MI LEX PEOPLE MILEX GNP --EXPENDITURES PRODUCT per pe r
IMILEX) I GNP) GNP CAPITA CAPIT A
M illion dollars 8
Mill ion dollars b Constant Constant
I T % Mill ion dollars doll ars Current Constant Current Cons tant
5 8 1090 1&60 0,49 1, 780 4,'5e 9U b 8 1180 1740 0,49 1,801 4,71 964 b 9 12'0 litO 0,50 1,822 1.1,97 9CJe 6 8 11.130 1920 0,1.10 1,81.14 1.1,11 101.10 ., 1-() t'TOO !110 0,'1.14 1,8&9 5,10 1160
9 11 1100 2180 0,50 1,901 5,1'J 1150 to 12 2110 !1.16 0 0,47 1,932 5,99 1i70 15 1'r 2180 24~0 0,71 t,97e 8,58 1210 1'3 15 2420 2420 o,u 2,020 7,&2 uoo 1& 15 2580 2360 0,62 2,065 7,11 111.10
1410 i!UO 1'50000 227000 0,91.1 CJ•.no 21,1.10 2280 151.10 22&0 174000 257000 0,88 100.830 22,1.10 2~40 1110 24"0 20&000 291000 0,84 101 ~ 960 23,90 28'30 2000 2&80 240000 322000 o,n 103,170 2&,00 3120 231.10 2980 281000 35'7000 0,83 101.1,31.10 28,(»0 3430
2'750 33UO 31&000 381.1000 0,87 105 , &00 31.60 3630 3210 3730 3(»0000 419000 0,89 10#1,958 34,90 J910 '3'!190 'SCJSO 418000 4&00 00 0,8& 108,346 3&,40 4240 4210 4210 454000 454000 0,93 109,677 38,30 4140 l.l'r80 4380 507000 404000 0,94 110,944 39,!10 1.1180
70 10& 671 1030 10,30 1,952 . 54.30 5i!b 88 t29 '7118 1100 11,80 2,016 e1.1,2o 54&
1311 189 1St lObO 11 ,eo 2 1 084 90,.0 508 154 201 806 1UO 1'T,80 a,ts" 9!5,90 540 121 U4 eu 1040 14,90 2,' 2215 ft9i10 4.5
U!l 151 8'73 tOfiO 14,U 2,30& &5,50 '1§9 140 1U 935 1090 1'Ja00 2,187 u,zo I.IU 11.13 U'T 991 1090 14,'10 11,'111 &1,60 441 139 139 11'70 1110 11,90 a.ut 511,20 I.IU 144 132 tHO 12'70 10 ~ 40 a.es4 49,80 480
11 11 t 110 1'71 0 o,n 10,071 1,64 110 1'5 22 UlO 1710 1 ~21 10,389 a,os lU u 24 13'50 1910 1,211 10~'719 2,28 118 1& za 1540 20110 t,o• 11~oe! 1,9'7 181 1'r u 1'700 2160 1,01 11, '133 1,CJZ 189
20 24 1910 a) 50 1,01 11,824 a,oo us u u 2110 u•o 1,Sl 12i235 2,64 201 n n ZJ\!50 nto 11 50 u,•u J,O& 204 '10 40 2760 2'760 1,'14 13,12!5 1,03 210 !1 111 3060 1800 1,61 u,e01 3,43 201
ARMED M ILE X ARMED
FORC ES ARMED FORCES
FORCES per
Constant 1000
thous dollars people
8110 0,!56 8490 o,se 9050 0,55 7580 0,51.1 951.10 o,Sll
/.lffi 2725 2,10
" noo 2,0T 4 1.1250 2,02
" 3850 1,98 1 11.1700 0,1.18
d 227 9383 2,27 2S1 9184 1~29 23'3 10383 2,30 236 1135& 2~29 au 12U'1 2,2&
a:u 14214 z,;u 233 1&009 z,te Z33 1e9U 2,15 237 17764 2,1ft 217 18481 2. 11.1
50 2120 zs,et bO 2150 n,u 55 31.13& 2&,39 60 3450 21,h 10 2200 !1,412
n uu 28,1' 10 2329 l9i:U 10 2241 28,lt 10 1986 27,33 60 2200 Z2,et
17 971 1,09 16 U50 1,"'
8 $090 o,n 1 lll4 o,u ., JUt o,6t
., 3l86 o,,. ., 4U4 o,n 8 4850 o,u • 4412 o,u· 9 !5189 0~06
35
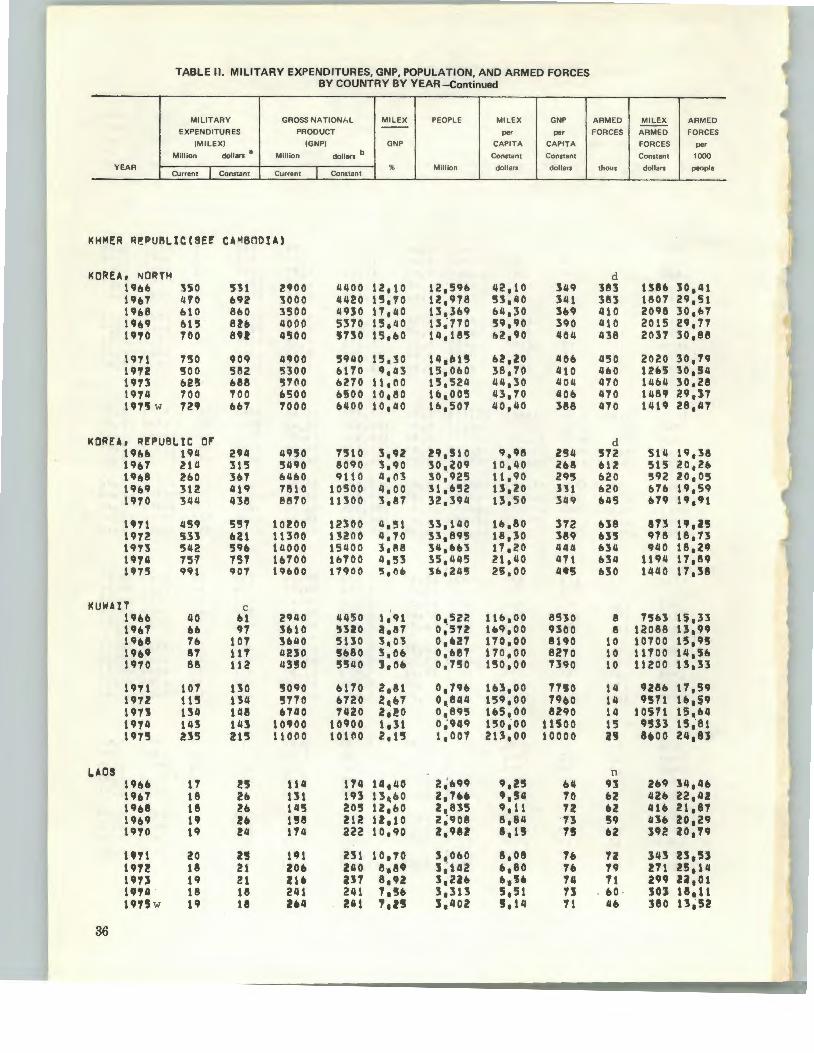
TABLE II. MILITARY EXPENDITURES, GNP, POPULATION, AND ARMED FORCES BY COUNTRY BY YEAR -Continued
MILITARY GROSS NATIONAL MIL EX PEOPLE MILEX GNP
EXPENDITURES PRODUCT per per
(MILEXI (GNP) GNP CAPITA CAPITA
Million dollars a Million dollars b Constant Constant
YEAR % Million dollars dollars Current Constant Current Constant
KHMER R€PUB~ICCSEf CAMBOOU)
KOREA, t<~ORTH 19&& 350 511 2900 11400 12.10 12,59& 42,10 349 19&'7 /J10 &92 3000 4420 1!1,'70 12,978 !13,40 341 19&8 &10 8&0 3500 4 9',5 0 11,110 13,369 &4,30 3119 19&9 111'5 8l6 11000 5370 15,40 13~770 59,90 390 1970 700 au 11500 n:so 15,&0 14,185 &Z,90 404
1971 750 909 4900 591.10 15,30 14 1 bU lli! 1 i!O 406 1912 500 582 5300 6170 9,1J3 15,060 38,70 410 1913 62'5 688 5700 6270 11,00 15.5211 114,30 404 1974 700 'TOO &500 &500 10,80 1&,005 43,70 406 1975 w 7211 667 1000 61100 10,110 1&,507 110,40 388
KOR~A, REPUB~IC Of 1116& 1911 294 111150 7510 3,92 i!9,510 9,98 l~ll 196'7 214 315 5490 8090 3,90 30,~09 10,40 2U t«J&8 260 367 &11&0 9110 11,03 30,925 11,90 295 1969 3ta 419 71110 10500 ti,OO 31,652 13,20 H1 1970 3tltl 438 88'70 11300 3,8'7 32,Hil 13,50 3119
1471 459 557 10200 12300 4,51 33,140 16,80 3'72 1972 533 621 11300 13i!OO tl,10 33.895 18,30 389 1913 51l2 596 14000 15400 3,88 34,663 17,20 444 19741 '751 757 16100 1&700 4,53 35,4tl5 21,110 471 1975 991 907 19600 17900 5,06 3&.2115 25.00 t19S
KUWAIT c 1q6& 40 &1 2940 4tl50 1,91 o,szz 11&,00 8530 196'7 &6 9'7 :suo onao 2,11'7 0~57l 169,00 9300 1968 76 107 3&40 5110 3,03 O,U7 170,00 8190 19b9 8'1 117 4:!10 !!b80 3,06 0,&87 170,00 82'70 1970 88 112 11350 5'!140 3,06 0,'750 1'50,00 7390
1971 101 130 '!1090 &170 2,81 o, 79& 163,00 7150 1972 11'!1 134 5710 &'720 2e,67 0~!14tl 15q,oo 79&0 191l 134 1118 &'740 7UO 2,!0 0,895 1&5,00 8290 19T4 143 1113 10900 10900 1,31 0~949 150,00 llSOO 1975 235 215 11000 10100 2.15 1,00'7 213,00 10000
~AOS 19&& 17 !5 114 1141 14,110 2 ~ fl99 9,2'5 b4 1967 18 2& 131 193 13a60 Z,'TU 9,541 10 19&8 18 2& 145 20'5 t2;6o 2,835 9.11 72 19&9 11t 2ft 1!18 21i! 1!,1 0 2~908 8,8tl 73 1970 19 24 1711 222 10,90 l,9U a ,t'!l 75
U71 20 Z5 191 2:51 10,70 3,060 8,08 7& 1972 18 21 206 Z40 8,89 l,ttl2 &,80 76 un t«J 21 a a l3'T 8,92 3,21& 6,5& 74 1'14 18 18 241 241 7,5& 3,:513 5,51 73 1915 w 19 18 2U 2111 7,U 1,402 !,14 11
36
ARMED MILEX ARMED
FORCES ARMED FORCES
FORCES per
Constant 1000
t hous doll a rs people
d 381 138& 30,41 383 1807 29,51 410 20911 30,11'7 410 2015 29,71 tl38 2037 30,88
1150 2020 30,19 11&0 uu 30,54 4'70 1464 30,28 470 1489 29,17 470 1419 28,47
d '572 514 19,3!1 612 515 20,26 620 592 20,05 &20 67& 19,59 645 6'79 1",111
U8 !113 111 1 U 635 9'78 18173 634 940 18,2q 6311 11911 1'7,89 &30 14£10 11,38
8 '7'5&3 15,33 II 12088 13,99
tO 10700 15~95 10 11700 14,5& 10 11200 13,33
ttl 9211& 17,59 14 9511 1&,~9 14 1 05'71 15,&4 15 9533 1'!1,81 n 8•oo 24 1 U
n 93 269 l4,41& &2 tllb 22,42 u til& 21,81 '5q Ill& 20,29 &2 392 l0,19
12 343 U 1 '53 79 271 25,14 11 299 u,o1 &0 . 303 18al1 4& 380 13,52
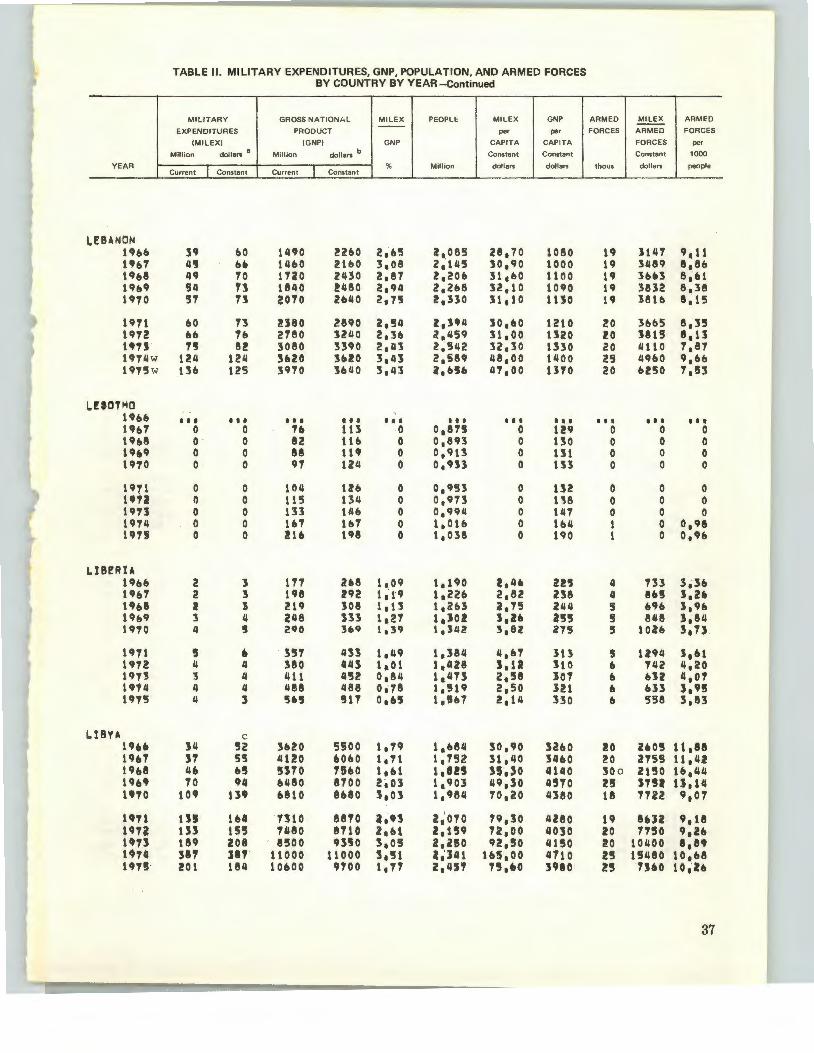
~ TABLE II. MILITARY EXPENDITURES, GNP, POPULATION, AND ARMED FORCES I BY COUNTRY BY YEAR -Continued
MILITAR Y GROSS NATIONAL MIL EX PEOP L E MIL EX GNP ARM EO M ILEX ARM EO --EXPENDITURES PRODUCT per per FORCES ARMED FORCES
(MILEX I (G NP) GN P CAPITA CAPI T A FORCES per
Mill ion dollars a
M illion dollars b Constant Constant Constant 1000
YEAR % M ill ion dollars dollars thous dollars peo ple Current I Constant Current I Constant
LEBANON 19&& )9 60 1490 2260 2,65 Z1085 28,70 1080 19 1147 9,11 1CJ&'7 "' 6. 1460 2160 3,08 21145 30,90 1000 19 3489 8,86 1968 49 10 1720 2430 2187 !,206 31,&0 1100 19 36.3 8~&1 1969 54 '3 1840 1!480 2a94 212&8 H,to 1090 19 3812 8138 1970 57 13 2070 2640 2,75 2.:no 31,10 1UO 19 381b 8,15
• 1971 60 13 2180 2890 2,54 z,n4 30160 1210 20 36b5 813'5 I 1972 &b 1& 2780 3240 213& 21459 31,00 1320 u 3815 8,U
t 1•n 75 8Z 3080 :sno 21n 21542 32130 1330 20 41110 7187 1974W 124 124 :suo :suo 3,41 21§89 48100 1400 25 4960 9,&6 1975 w 136 125 3970 3640 3,43 2,&'!56 U7 ,oo 1170 20 6250 1,~3
LUOT~O 1'66 I I I I I I I I I I t I It I I I t I I I I I I I I I I I I I I I
1'67 0 0 , 113 0 o,8n 0 129 0 0 0 1968 0 0 82 11& 0 0,893 0 130 0 0 0 19&9 0 0 88 1 1CJ 0 0,913 0 131 0 0 0 i'TO 0 0 97 till 0 o,9H 0 133 0 0 0
1971 0 0 104 12& 0 0,953 0 liZ 0 0 0 1'72 0 0 115 134 0 0 1 913 0 1'58 0 0 0 19U 0 0 133 1IHI 0 01994 0 147 0 0 0 1974 0 0 167 1b7 0 1,01b 0 1&4 1 0 0,98
t 1•n 0 0 z 1f• 198 0 11038 0 190 1 0 0,96
LIB!RU 19&6 2 3 117 Z68 11 09 11190 !,46 2!'! 4 133 3136 1967 2 3 ue 2'2 11.1'9 11226 2 1 82 238 4 86! 3126 1968 2 3 219 308 11cs 112&3 2175 244 5 69& 3196 19&9 3 4 l48 Sl3 1,27 t. ;10! l 1 U a 55 s 848 )184 1970 II 5 290 H9 1,39 11 342 :5 182 Z75 ' 10h :s,n 1971 !J 6 H1 4H 1149 11384 4,61 313 ' U94 3,111 1972 4 4 380 II 'IS la01 111428 JIU l10 b 742 11,20 1973 3 II 411 4!52 0184 1,1113 2158 307 & 632 4107 1974 4 4 488 488 0178 11519 2150 321 6 633
'. 9!1 U7'5 4 3 5U 517 016'J 1,!167 i!,l4 330 b 558 3183
LIBYA c l9bfl 14 52 36i!O 5'500 1,79 1,b84 30,90 3a6o 20 2605 11,88 l9b7 31 55 111i!O 60b0 1111 11752 31,110 34b0 20 2755 11142 19b8 lib 6!5 5370 '7560 1,61 118!5 SS,30 11140 30 o 2150 16,44 19b9 10 94 6480 8700 2101 1,903 n,:so 11570 n 3151 U 114 u,.o 109 13' 6810 8UO 3,03 1,984 10120 4380 18 77Z2. 9,01
1911 U!l 164 B10 8810 a,u 21010 79130 4280 19 8&)2 9,18 19U Ul 1§5 7480 8710 2,61 Z,U9 12100 4030 20 11'50 9126 19n 189 208 8500 93'50 3,o'!! 21250 92,50 4150 20 10400 8 1 89 1~74 :sn :sn · 11000 11000 3,51 a,·l41 1U 100 4710 25 15480 10168 191!5' 201 184 10600 9'700 1111 21 411 151ft0 3980 25 n&o 10,26
37
I
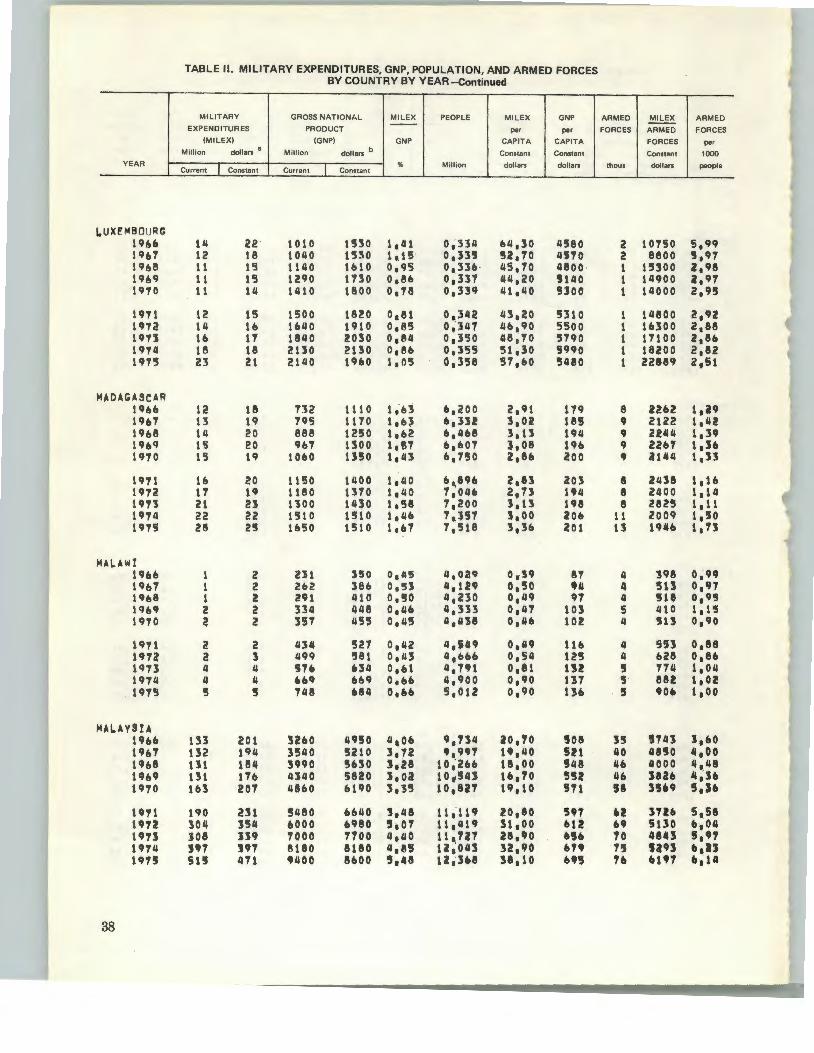
YEAR
I.UXEMB OU RG 19U 1967 19&8 19&9 1970
1911 1972 1913 1974 1915
MADAGASCAR 1966 19&7 19&8 19&9 1970
1971 1972 1973 19'74 1975
MALA WI 19&& 1967 1968 1969 1970
1971 1912 1913 19'7'4 1975
MAL.AYSU 19&6 1967 19&8 19&9 1970
19'71 19'7'! 19U 19'7'4 19'75
38
TABLE II. MILITARY EXPENDITURES, GNP, POPULATION, AND ARMED FORCES BY COUNTRY BY YEAR -Continued
MILITAR Y GROSS NAT IONA L MILE X PEOPLE MIL EX GNP
EXPENDITURES PRODUCT per per
(M ILEXI (GNP) GNP CAPITA CAPITA
Mill ion dollars 8 Million dolla rs b Constant Constant
Cu rrent Co nstant Curre nt Co nstant % Mill ion do ll ars dolla rs
111 22" 1010 l'HO 1141 01334 &4130 4'580 12 18 10140 15:'10 1 •. us 01H5 5i,TO UTO 11 15 1140 1610 0,95 0 1 3Je· 45,70 4800 11 15 1290 1130 0,86 01337 44,20 !i140 11 14 11110 1800 0178 0,339 41,40 SlOtt
12 15 1500 1820 o,81 0,3112 43120 5310 14 16 1640 1910 0,85 01.347 46,90 5500 1& 17 1840 2030 01811 01350 48,70 '5HO 18 18 21l0 21:50 018fl 0,155 51130 5990 23 21 2140 1960 1,05 01358 57 160 '5480
12 18 132 1110 1,63 &,200 2 11H 119
13 19 795 1170 1,&~ &,3u :s,oz 18S 14 20 88B 1250 1,&2 &,468 31 1:5 194 15 20 96T 1300 1. !!T &,&01 l 1 08 19& 15 19 10&0 U50 1,43 &,750 2,8& 200
16 20 11!50 1400 1,40 &~,896 2,81 ZOJ 17 19 1180 1310 1140 7,04& 2, 7J 194 21 l!3 !'SOO 1430 1,58 71200 3,13 148 22 22 1510 1510 1146 7 ,l§7 1 100 ZOo 28 25 1&50 1510 1,&1 71518 3136 201
1 2 231 350 0145 4,029 o.:s• !11 1 2 2&2 38& 0,53 11,1U 0,50 '" l 2 nt 410 0,130 41Z30 0,49 97 2 2 334 4/.18 0,46 11,333 0,117 103 2 2 357 455 01115 11,ne o,"o 102
2 2 434 521 0142 a,sn 0,"9 11& a 3 499 581 0143 4,o&o 0,54 125 4 4 57& &34 0101 41791 0,81 lU /j II ooCJ 6&9 0,&& 11,900 0,90 137 5 13 7118 &84 0,&6 5,012 0,90 lJ6
tB 201 52&0 119!50 4,06 CJ, 134 20 1?0 508 132 194 35110 5210 1,72 • 199T uluo !IU 111 184 3990 5650 3,28 10;26& 18,00 548 131 11& 43110 5820 :s,oa 10,'J43 U,To 552 163 207 4860 6UO 3135 10,821 1'~.10 STl
190 211 '5480 &&40 !,48 11,119 ao,eo 597 3011 354 ftOOO 6980 5,0'7' 111419 51,00 612 308 JJq 7000 1TOO 4,40 1111~'7' 28,90 U& J91 "'' 8180 8180 11,85 lZ~OU 32190 on su 471 IJ400 8600 5,48 U 1l&8 n,to U5
ARMED MILEX ARMED
FORCES ARMED FORCES
FORCES per
Cons tant 1000
thous dollars people
2 10750 5,99 2 8800 5,97 1 15300 2198 1 14900 a,97 1 14000 2195
14800 21CJ2 16300 2188 17100 Z1 8& 18200 2,82 22sn 2,51
8 22&2 1,it9 9 2122 1,42 9 2244 t,n 9 22&7 11:1&
• iUU 1,31
8 21.138 1,1& 8 2400 1114 8 282'5 l 1 11
11 2009 1,'50 1l 1946 l,'fl
4 H8 0,99 4 5U 01'97 4 S18 o 1 95 5 410 1115 4 5U o,CJo
4 553 0,88
" 028 0186 !! 7111 1104 5 882 l, oz 5 90& 1,oo
35 1743 111.!0 40 uno 4100 116 4000 4,48 116 S826 ~~~·h 58 S5 .. !I,J&
u 3Uft 5,58 &9 suo &,ou 10 48113 !1,97 1IJ sus •• u .,. un &,111
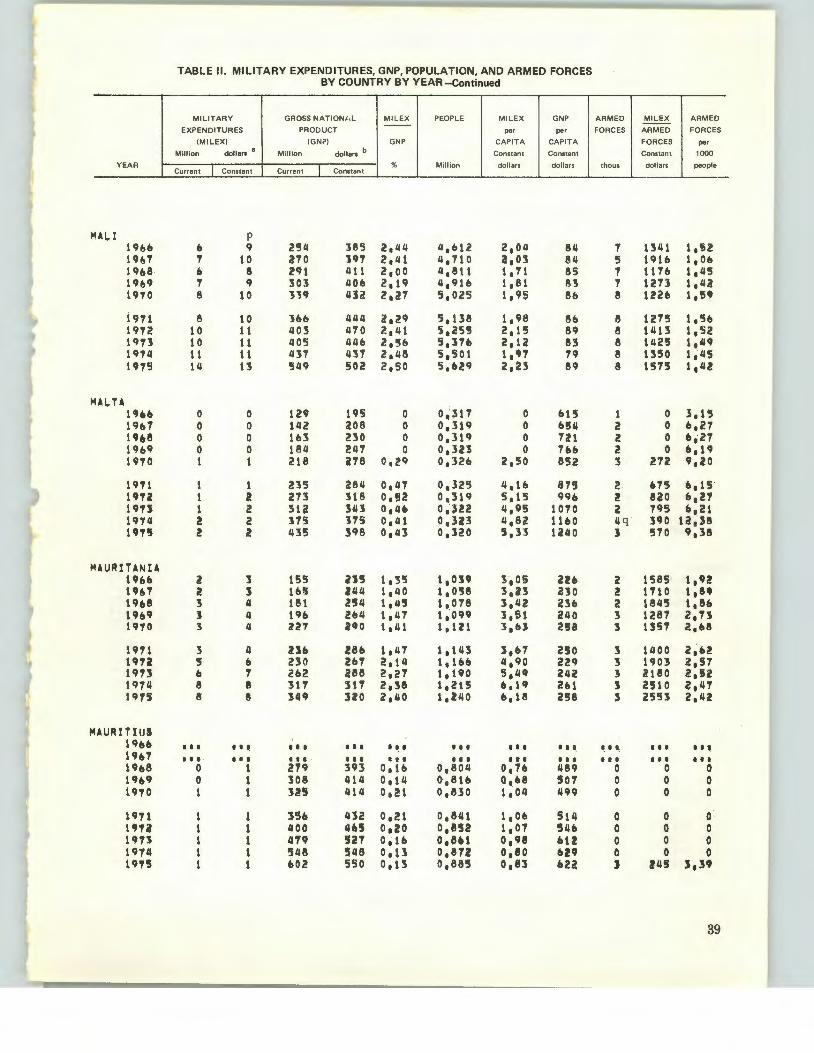
YEAR
MALI 196& 19&7 19&8 19&9 1970
i971 1972 1973 1974 197'3
MALTA 19&6 19&7 1968 19&9 1910
1911 1912 1913 1974 19'r!l
MAURITANIA 19&6 1961 1h8 1CJ&9 1970
1971 1972 1913 19111 1975
MAURITIUS 19&& 19&7 1968 19&9 1970
1971 11JU 1973 1974 1915
TABLE II. MILITARY EXPENDITURES, GNP, POPULATION, AND ARMED FORCES BY COUNTRY BY YEAR-Continued
MILITARY GROSS NATIONh L MIL EX PEOPLE MILEX GNP --EXPENDITURES PRODUCT pe r per
(MILEX) (GNP) GNP CAPITA CAPITA
Million dollars a Million dollars b Constan t Co nstant
I I % Mi llion doll ars dolla rs
Curren t Constant Current Constant
p b 9 <!54 :§55 2,44 4,o12 2,04 84 1 10 210 197 2,41 4,710 2,03 84 b 8 291 411 2,00 4,811 1,71 85 1 9 303 40& 2,19 4,91& 1,61 83 6 10 JH U2 z,a7 5,025 1,95 eo
8 10 Jbb 444 a,H 5,138 1,98 6b 10 11 403 470 2,41 5,255 <!,15 89 10 11 405 446 2,5& 5,17& 2,12 n 1t 11 437 1,1:§7 2,48 5,501 1,97 19 14 13 549 502 2,50 5,629 2,23 89
0 0 129 195 0 0~317 0 &15 0 0 142 208 0 0,319 0 &!!" 0 0 1&3 230 0 0,319 0 721 0 0 184 247 0 0,323 0 hb 1 1 218 278 o,a9 0,32& 2,50 852
1 1 235 284 0,47 0,325 4,1& 875 1 2 213 :518 o,s2 0,319 5,15 99& t 2 312 3"3 0,4fl 0 .· ~!2 4,95 1070 2 2 175 115 0,41 0 ,3Z3 4,82 11&0 2 2 435 398 0,43 0,120 5,33 1240
l! 3 155 ~15 1,35 1,on 3,05 2l6 2 l 1&8 244 1,40 1,058 3,U 230 3 " 181 <!54 1,45 11078 3,42 236 J 4 19b 2b4 1,117 1 •· 099 :s,et 240 3 4 227 21JO 1,1.11 1 1 Ut l,f>) 258
3 II ill& !So 1,47 1,143 :s,o7 2!50 !J 0 230 2&7 2,14 1,1oo 11190 229 b 7 2b2 288 2,27 1,190 5,119 2"2 8 8 317 317 2,38 1,215 f> 11 q 2&1 8 8 :549 320 2,40 1,240 6,18 258
I I I .. ~ ••• I t t . •.' • • • I I I '. • . t I I • • • ••• I I I ••• • • • ••• . ' .
0 1 219 393 0,1& 0,804 o, 7& 489 0 1 308 414 0,14 D-,81& 0,68 '501 1 1 325 41/.1 0,21 0,830 1,04 1199
1 1 356 432 0 ,l!1 0,841 1,06 514 1 1 400 405 o,ao 0,852 1,07 54& 1 1 419 !21 0,1& 0,801 0,98 btl! 1 1 '.548 548 0,13 0,872 o,eo 629 1 1 602 550 o,u 0,885 0. 8:5 oza
ARM EO MIL EX ARM EO --FORCES ARMED FORCES
FORCES per
Constant 1000
thous do ll ars people
1 1341 1. sz 5 191o 1,0& 1 117& 1,45 7 1273 1,42 8 1226 1,5.
8 1275 1,5& 8 1413 1,52 8 1425 1,49 8 1350 1~45 8 1575 1,42
1 0 3,15 2 0 &,2'1 2 0 0127 2 0 o 1 19 3 272 9,20
2 us &,15 2 820 b,l1 ?. 795 &,21 (lq )90 ta,l8 J 570 9,}8
2 1585 1,92 2 1710 1,89 2 1845 1,86 3 1287 2,13 3 1!51 a,•8
3 1400 2,fl! 3 1903 2,57 3 2180 a,u 3 2510 2,47 :5 255:5 2,42
• .. ' • • • ... • •• • • • • •• 0 0 0
0 0 0 0 0 0
0 0 0 0 0 0 0 0 0 0 0 0 J 24!3 3,39
39

Y EAR
MfXtCO 14&& 196T 19&8 1969 1910
1911 1 9'1l! l'TJ 1914 1975
MONGOI.U 19&6 1967 1968 1'09 19.,.0
1911 1972 197 :5 1971l 19T5 w
MOROCCO 1'66 19b1 11~68 19&9 1910
1971 1972 1'73 1914 1915
MOZAM8%QUI! 19bb 1967 11tb8 U&~ 19TO
1911 19Ti! 191~ 19TG 1915
40
TABLE II. MILITARY EXPENDITURES, GNP, POPULATION, AND ARMED FORCES BY COUNTRY BY YEAR -Continued
M ILITARY GROSS NAT IONI,L MIL EX PEOPL E M IL EX GNP
EXPENDITU RES PRODUCT per per
(MILEXI (GNP) GNP CAPITA CAPITA
M ill ion dollars a
Million dollars b Constant Co nstant
I I % Million doll ars do llars
Current Constant Current Constant
1&2 i!4& 21400 ~2400 0,1& 113,742 5,62 742 U2 · 2J9 23400 '\4400 0,69 45,2 :57 5,28 7b1 185 261 26400 3'7200 0,10 46,108 s ,s9 195 204 213 29500 39500 0 1 iJCJ 48,347 s,6~ 818 220 281 33100 422 00 0,61 49,969 '3,62 844
252 306 16000 43100 0,10 51,623 5. 93 846 295 311J 40200 4&900 o,n 53,371 b,43 818 323 355 45100 50300 0,71 55,250 6,113 910 310 310 53000 5)000 0,10 571222 6,47 926 528 483 60100 55000 o,88 59,1!~8 8,15 929
15 23 uo us 2,46 1 ,119 20,·30 821 20 30 650 958 3,08 1,1n 25160 831 25 35 650 916 3,85 1~181 ~9,80 116 H 44 110 953 4,&5- 1,i14 36,50 785 37 41 1110 943 s,oo 1,'248 37,80 .,6
4! 5i 710 H4 5,45 1,283 39,70 128 48 56 800 951 5,91 1,321 42,10 705 53 58 8115 uo 6,U 1 1 JfiO U 1 90 684 65 65 860 8&0 7,56 1,1102 4&,40 •u Til u 815 800 8 ; 1l6 1, 444 ll6,90 5'34
81 123 2810 ll~60 2184 13;1le5 q ,1 b :Si!3 'H 133 3190 4700 2',84 u,eu 9,62 339
110 156 3130 521>0 2,96 14,270 10,90 369 119 160 5~90 5350 211t8 tll,blt1 10,90 1114 u o 166 4440 suo 2,93 U,Uit 11100 Hll
147 119 1!940 59.0 2,9!1 15,575 u,so 185 171 200 51110 uoo 3117 16,036 12,40 $9:$ <!09 no 5920 b'510 3,53 16,511 U,9o 394 19b 196 7150 TUO 2,14 11 1 001 u. '50 4!0 25 3 231 IlOilO nso 3,,14 17,504 u,zo 420
I _ I I
~ ·· t t I I I I . '·. I I I t I I • !, ' ·
I I I I I l • ... I I I I , I I . ~. I I t •••• I I I I I I_ .. .. I I I ~-. · I I I .... I I I
••• .... ~ ··
I I I . \ •. I ~ I I I I .. .. I I I I I I t I I I t I t It I I I I I I I I I
I ~ I . I t • I I I I I I . • .. I t I I I I I I I
~ ·· • .... ~ .. . ·-•. ·~ --I \I t I I I I t ,
• ... " 1. I, I I I t I I .... ·~·
I I I .. .. t I I t I t ••• I I I I I I I I t t I I I I I
0 0 U20 ~uo 0 9,060 0 3U
ARMED MILEX ARMED
FORCES ARMED FORCES
FORCES per
Constant 1000
thous do llars people
T\5 :n8o 1,11 80 2988 1,11 75 1480 1,60 1! 3640 1,!i5 eo 3513 1,60
80 382\5 1,55 80 4288 1,50 eo 4438 1,115 85 4353 1,49 95 5084 1,6o
0 0 0 0 0 0 0 0 0 0 0 0 0 0 0
0 0 0 0 0 0 c 39 11l95 28,68
ll1 1383 33,51! u 1881 24 1 U
65 1892 ll,82 b5 2046 4,b9 10 2229 4 1 91 10 22U II, a 65 2554 4,:50
65 2U4 4,17 n 1071 4,0'5 69 :5538 3,94 ItS 301!1 3,8l 75 :so eo 4,211
~ ~·\ I I I ~I I
I , I \ t I I I I I .. • . • •• I I I
I l ~ I I I ~ .. I I I I t I I I I
~ ... I It I I I
• ... I _ I I ~ .. ~. •, I I t
~·· I I I ••• I I I
20 0 2,Jl

• YEAR
NEPAl. 19b~ Ub1
• 19b8 19~9 1910
1911 ~ 1912
' 19'71 t91ll 19'75
NETHERLANDS 196ft 19111 19b8 19~9 19'70
1971 19'7! 1913 19711
it 1915 ~
NEW ZhLAND Ubb 1967 1968 19o9 1970
1911 1912 19U 1914 1CJ75
NICARAGUA uu 19b7 19418 1969 1UO
1911 19'72 19'7! 1914 19'7'5
TABLE II. MILITARY EXPENDITURES, GNP, POPULATION, AND ARMED FORCES BY COUNTRY BY YEAR -Continued
MILITARY GROSS NATION A L M I LE X PEOPLE MI L E X GNP --EXPENDITURES PRODUCT per per
(MILEXl (GNP) GNP CAPITA CAP ITA
M ill ion dollars 8 Million dollars b Constant Co nstant
% Mill ion dollars dollars Cu rrent I Constant Current I Co nstant
3 5 ~91 tOoO 01 ll'5 10 ~385 o,uo 102 4 0 101 1040 0 1 b2 10,b04 O,b1 98 !J , 7113 10':'50 0 1 b1 10,8!1 o,59 91 '5 1 817 1100 0 1 b0 11,007 0,59 99 5 b 88& 1130 0,'5'7 11,311 o,5& 100
b '7 930 1130 o,o3 11,502 o,&1 98 0 1 988 11!50 o,u 11,819 0 1 S9 97 1 1 1010 1110 o,u 12,082 0,59 .., 8 8 1250 U!50 O,bt 12.351 o,~2 102 9 8 tliOO 1Z80 0,&5 1!,&33 o,ob 10!
1150 1140 30~00 4~400 3,75 12.455 1ll0 1 00 1720 1300 ueo 33200 49000 3 1 tH 12,598 152,00 3890 13ll0 1890 3'7000 52100 3,U 12,'730 149,00 ll090 11190 2000 111500 55o00 3 1 b0 l2,87S t5s.oo 4UO 1o10 2050 4b500 59300 3,115 13,032 157,00 4550
11'50 !130 51000 o1800 3,411 13. 19ll 101,00 llo8o 1810 2110 55300 b4300 3,38 13,330 1&3,00 4830 2010 2210 &1300 b7400 3, ! 8 13,1138 1&5,00 5020 2330 2330 o9&00 &9o00 3,'54 n,5111 172,00 51110 2bb0 2430 75300 &8900 3, '!5 3 1l,o57 178,00 50ll0
1':'50 228 6110 1noo 2,22 2,.8'7 84,80 3820 147 21& o9SO 10200 2,11 2.728 n,zo 31&0 14'5 204 1380 101100 1,9& 2,759 73,90 3170 152 204 81110 10900 1,87 2,773 13,,0 3940 1'1b 2211 6920 111100 11 97 2,611 79,70 4050
180 218 9&20 11100 t. 81 z.,8SJ 7o,SO 4090 186 216 10800 12'500 1,12 2,90'5 74,40 4310 191 210 11700 12900 1,U z,·CJU 70,90 41'50 234 U4 U200 13!00 1, 77 3,02'7 '7'7,20 43410 2bi! 240 14400 13100 1 ~83 3,09. '77. 50 4UO
p 9 1ll ue 9!53 1,51 1,71!1 8,38 5'55
11 u ns 10!0 1,58 1, 76!5 9,13 !518 11 1!1 Th 1020 1,!11 1,8U 8,li1J !SU 12 u 812 1090 1,48 1,811 8,64 !18:5 l4 11 867 1100 1;!16 1,921 8,96 575
t1 eo 956 1160 1,14 1,984 10,20 584 1!1 l'7 1010 1180 1, 4'7 2,049 8,49 !SU 17 19 1130 1240 1,!15 z. 11o 9,06 586 22 22 1410 1410 1,56 2,18o 10,10 646 l! 29 1!510 1440 a,o4 2,260 13,00 656
A RM ED
ACES FO
t hous
22 22 22 29 29
29 32 32 32 32
I 20 1 20 1 20 1 20 I 15
1 10 1 1'5 1 15 1 0§ 1 12
u 13 13 111 14
14 14 u n 1l
6 6 6 41 · 6
b 6 6 6 !S
MIL EX
ARMED
FORCES
Cons tant
dollars
211 1!95 292 22'7 220
243 217 224 240 2&2
14!100 16000 15750 1bb67 17U&
19364 18870 19211 22190 2169b
17538 1&615 15692 14571 16000
15!571 15429 16154 18000 18462
21100 2U3 2561 2700 2861
3310 2900 3200 :su:s 5880
ARMED
FORCES
per
1000
people
2,12 2,07 2,03 2,62 2,5o
2,51 2,71 2.&5 2,59 2,53
9,63 9,53 9,43 9, :52 8,82
8,34 8,ol 8,!56 7 ,1'5 8 1 20
4,84 4. '71 4,71 5,05 4,CJ8
4,91 4,82 4,19 4,l9 4,20
1,50 3,40 3,!0 1,21 S,12
J,O! 2,93 2,84 z,u 2,21
41

Y EAR
NIGER 19eb 19e7 t9U 19#)9 1910
1911 1972 191:1 19111 1915
NIGERIA 19ee 19b7 19e8 19e9 1910
U71 1972 1913 19711 1915
NORWAY 19&& 19&7 1968 Ub9 1910
1911 191a 1973 1914 1915
OMAN 19ftb 1961 1968 1969 1910
1911 19'!'2 1913 1914 un
42
TABLE II. MILITARY EXPENDITURES, GNP, POPULATION, AND ARMED FORCES BY COUNTRY BY YEAR -Continued
M I LI TAR Y GROSS NATIONI.L MI LEX PEOP LE MIL EX GNP - -EXPEN DITURES PR OD UCT per per
(MILEX} (GNP} GNP CAP IT A CAPITA
Mill ion dollars 8 Million dollars b Constant Constant
Current I Constant Current I % Constant
Million dollars dollars
2 II }lib 525 0,70 3 t 5411 1,03 lll8 :5 !S leO 530 o,se 3,045 1,2!J 145 4 5 387 545 0,95 3, 7111 ' 1. 58 1111J II 5 370 497 0,97 3,85i! 1,211 1.29 s II 1103 5111 0,17 3,9110 1,00 130 , II tiS! 5211 0,15 11,071 0,91 129 ,
" 1141 521 o,&e 11,18b 0,85 1211 J ] l8Z 421 0 I '17 4,}04 0,15 98 3 3 499 1199 01 118 4 1 4Zb 0,77 113 4 3 557 509 0 1 114 4,551 0,71 112
c 711 112 1980 12100 1,2'5 49,882 2,24 243
195 285 81110 12000 3,22 51,11b 5,51 23!1 310 U7 8200 11600 '5,12 5Z,38b 8,3!!1 221 bill 8&1 9950 t:\1100 &,T3 5}, 702 1&,00 249 54b &9b 12600 16100 5,87 55,0711 12,&0 U2
470 570 14800 18000 4,25 5fi 1 U1 10,10 Jt& &Ol! 101 15&00 18200 5,23 58,020 12,10 314 702 773 11900 19700 5,02 59,&07 13,00 330 84& 811& 22400 221100 3,78 &1,275 13,80 lU
1070 977 2UOO 23100 4,111 · U 1 0i!Z 15,50 1&1
388 589 10700 lUOO :5,62 3~7511 157,00 113110 1113 &09 11700 l 'Tl!O 0 3,'.54 },186 1bl,OO 4!140 llfl3 ,, 12700 1'1900 3,b4 3,819 171,00 4690 !Hl &88 111100 18900 3,e3 1,851 178,00 4900 518 68CI 15300 19.00 3,51 3,877 177,00 'J040
571 699 16800 20400 3 1 U 3,903 119,00 IJUO 612 112 18UOO 21400 3,33 3 1 93! 181,00 !1410 &113 708 20200 22200 :5,18 ;5,9.2 119,00 !5610 711 711 22900 22900 1,10 :5,987 118.00 !HO 841 771 25900 2:1100 3,n 4,010 193,00 ,910
c ,p 0 0 1110 212 0 0,582 0 JU 0 0 255 31'5 0 0,600 0 &25 0 0 38'5 !J43 0 0,&18 0 819 0 0 3U 494 0 o,n1 0 7h
40 51 4!1 544 14,10 o,~>U n,zo au 53 b4 646 184 15,30 o,U8 94,80 tUO 93 108 808 940 25,00 0,699 1'54,00 l:UO
U6 1119 oo• 9'7 33,40 0,721 201,00 U80 400 400 1400 1400 28,60 0.14:1 !138,00 1880 65!1 199 1no 1100 36 1 60 o, 7U 782,00 2210
ARMED MI L EX ARM ED
FORCES ARMED FORCES
FORCES per
Constant 1000
t hous dollars people
3 l2U 0,8!1 J 1!H7 o,sz 4 1295 1, 01 II 1198 1,011 II 993 1,01
4 985 0,98
" 888 0,9& II 813 0,93 II en 0,90 4 813 o,88
30 3133 o,11o 15 81113 0 1 118 8!5 'Jl 111 1,112
110 7827 2,05 200 31180 1,113
no 1181 '5,0& 30!5 zn8 5,26 305 ZSS4 !5,12 JOO 2UO q,·9o 270 ,619 4,a8
35 1b8Z9 9,32 3'5 17400 9,24 J!S UU7 9,1& 35 19&00 9,09 35 19b00 ,,OS 35 19971 8,97 J!l ZO:S43 e,•o n 20!29 8,8:5 3!5 20Sl4 8, 78 :55 22tlll a,n
J 0 5 1 U ' J 0 s,oo 4 0 6,41 4 0 6,28 4 UfiTI 11,09
4 16075 5,90 4 17000 1~12 8 1UU u, to
to 110000 U 1 4b u 4"11 u,n
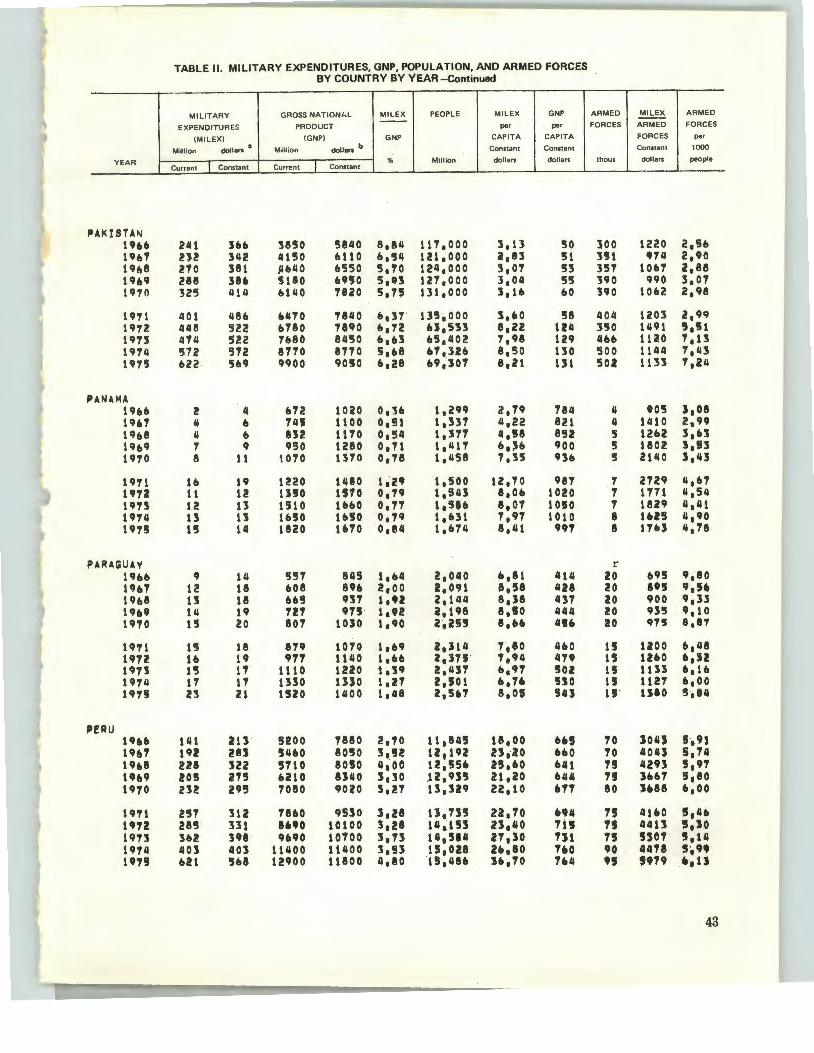
YEAR
F'AI<ISTAN 1uo 1~~1 1~&8 1~#)9
1970
1971 1~7! 1973 1974 1 9'75
PANAMA 1966 19U 1~&8 19&~ UTO
1 ~'11 UTZ 1973 1~74 19TS
PARA(;UAV 1h6 1~&1 19ft8 19&9 1~70
U71 197l un 19711 19T!i
PERU uu 1h7 1968 19ft9 1970
1971 1~7! 1973 1974 un
TABLE II. MILITARY EXPENDITURES, GNP, POPULATION, AND ARMED FORCES BY COUNTRY BY YEAR ~ontinued
M ILITARY GROSS NATI ONJ. L MILEX PEOPLE MILE X GNP --EXPENDITURES PRODUCT per per
IMILEXI IGNPI GNP CAPITA CAPITA
M ill ion dollars 8 Mill ion do llars b Constant Constant
I % Million dollars do llars
Cu rrent I Co nstant Current Constant
241 :1&6 :5850 5840 8,84 117,000 l 1 1l 50 232 342 4150 &110 b,tJ4 121 1 000 2,83 51 210 381 Jj640 &550 5,10 124,000 3,01 53 288 n• 51110 &no 5,03 127,000 3,04 55 325 414 U40 1820 5,15 131,000 3,16 60
401 48& UTO 7840 &,37 135,000 S1 60 58 448 522 b780 7890 &,72 U,5U 8,22 124 474 522 7680 8450 &,&3 65,402 7,98 129 572 5U !1710 !1710 5,&8 &7,3211 8,50 130 622 5119 9900 90!10 &,28 119,307 8,21 131
2 4 672 1020 0,3& 1,299 2,79 784 II b 74'5 1100 0. !!1 1, 337 4,22 821 4 b en 1110 0,54 1,371 4,!58 852 1 9 ~50 1280 0,11 1,41T &,;J6 900 8 11 \010 1170 0,78 1,458 7,35 936
16 19 1220 1480 1,z• 1,500 U, TO 987 11 12 UIIJO 1!170 o," 1, 5113 8,06 1020 12 13 1510 16&0 0,11 1,51& 8,01 1010 13 13 1650 1&50 0,19 1,&31 7,97 1010 15 14 18ZO 1&70 0,84 1,674 8,41 997
9 14 557 845 1,64 2,040 6,e1 414 12 18 608 8~6 2,00 2,091 8,58 428 u 18 &&5 '1:51 1,t2 2,144 8,38 4:51 111 19 U7 ..,, 1,t2 a,u8 8,10 444 15 20 801 lOlO 1,~0 Zlii!U 8,U Ill&
u 18 819 1010 1,&9 2,:114 1,80 460 16 19 ~., 1140 1,ftft z,ni · 7',94 4n 1' 11 1110 1220 1,~9 2,431 ft,CJT !Ol 11 17 1330 lUO 1,21 2,501 ll,16 !SO l:5 Z1 1520 1400 1,48 z.5u 8,01 541
1111 u::s- !!200 7880 2,70 11,845 18,00 ft&$ 192 UJ !460 80!50 3,!52 u,1n u,ao 6&0 ua 322 5110 80!50 11~00 121 ~56 U,6o U1 !05 215 UtO U40 3,30 .12,9!5 21,20 644 U! 2'5 1080 9020 s,u 13,329 u, 10 . .,., 2!1 ::su 78ft0 9530 3,28 u,ns 22,10 U4 28! 331 8690 10100 s,u 14,153 23,410 1i!l 362 398 9690 10700 ::s,n 111,514 27 ,so 1St IIO:S 403 11400 11400 ::s,n 1!1,028 26,80 760 021 IJU 12900 11800 4,80 1!1,486 :1ft • ., 0 h4
ARMED MILE X ARM ED
FORCES ARMED FORCES
FORCES per
Constant 1000
thous dollars people
300 1220 2,56 3S1 n4 2,90 351 1067 2,88 no ~90 3,01 390 1062 Z1 98
401.1 1203 2,99 350 1491 '5,51 46& 1120 7,13 500 1144 7,43 501! 1133 7,24
4 t05 3,08 4 14110 2,99 5 1262 :s,u 5 1802 l,Bl 5 2140 3,43
1 2729 4,61 1 1171 4,54 1 18Z9 4,41 8 1U5 4,90 8 11U 4,18
r 20 &95 '1,80 20 en 9 1 1Ut 20 900 ,,:u 20 935 9,10 20 975 8,87
15 uoo &,48 u lUO 6,U 1S 1133 6,16 15 1127 tt,oo 11' uao '5,84
10 lOU S·, 91 10 404J 5,74 1! 429:1 5,97 n 3bft'1 s,ao 80 3U8 6,00
1' 41b0 !5,116 n 44U !,JO n 5SOT '5 ,14 90 4418 !S•" ., ,.19 •• u
43
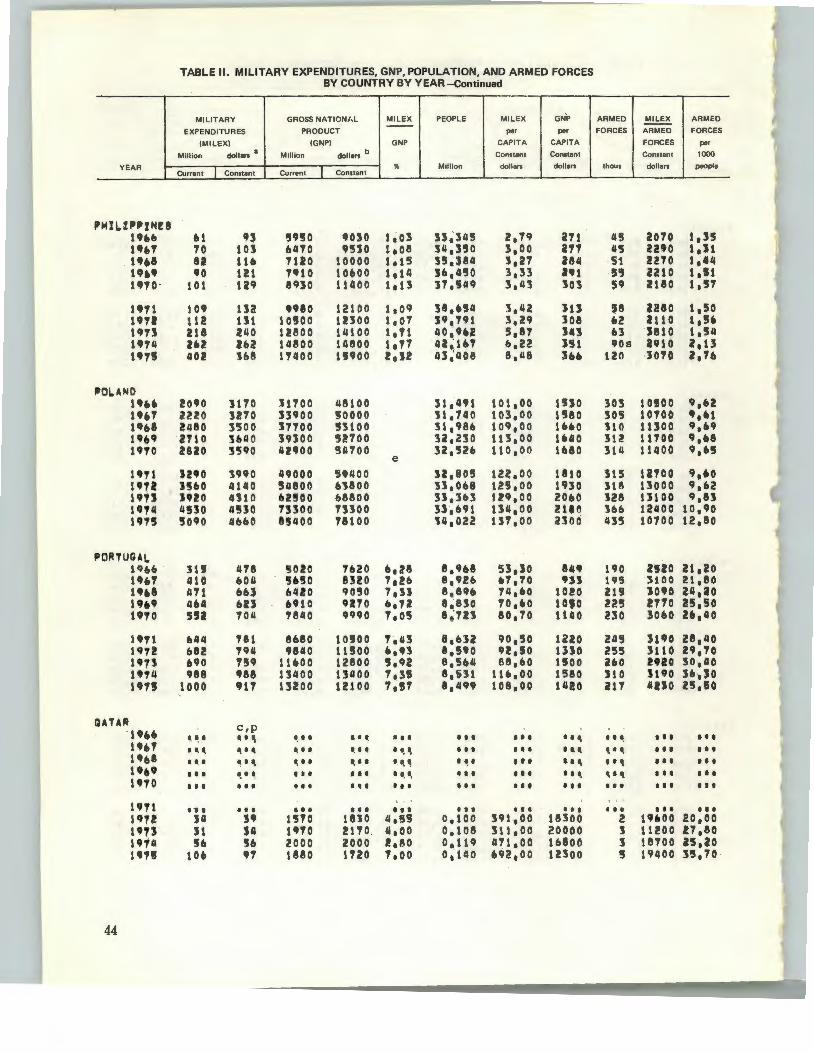
YEAR
Pl111.lPI'tNU 19&6 uu 19~8 1969 UTO ·
1t'r1 1911 un 1974 un
ltOI.ANO 19&6 U&T uu 19&9 19'10
1971 1·~· 19U 1914 197!S
PORTUGAl. 19&b 1961 1h8 n•• 1970
1971 1912 tns 19'P4 19U
IUUR 19.6 19fl1 uu 1'•' 1910
1911 uu 191S 19T4 191!
44
TABLEII. M ILITARY EXPENDITURES, GNP, POPULATION, AND ARMED FORCES
MILITARY
EXPENDITURE
IMILEX)
s
Million dolla " 8
Current Cons tant
u n 70 03 82 16 •o 21
101 29
tOt 1 32 112 1 J1 218 2 40 zu z &2 402 3 68
2090 31 '10 UlO 32 10 !/.Ill 0 35 00 uto 3& 40 2820 35 90
u•o H 90 JIJ&O 41 110 JUO 4S 10 4530 45 lO '5090 46 &0
lU 4 78 410 b 04 411 b u 4&41 b n 5'51 ., 011
&44 ., 81 U2 ., 94 no 1 '59 988 9 88
1000 • 11
,p
·~· ., . ~. . ' . • .. I t.
tit I I
I t I I t
... . •• J4 J9 31 :u 56 !b
106 ..,
BY COUNTRY BY YEAR -Continued
GROSS NATIONI•L MIL EX PEOPLE MILEX GNP --PRODUCT per per
I GNP) GNP CAPITA CAPITA
Million dollars b Constant Constant
I % Million dollars dollars
Current Constant
59 !50 tno 1,03 U,34! 2,79 211 b410 9530 1,oa 31.1,)50 3,00 211 1110 10000 1,15 35,184 :s,n au 1910 10600 1,14 3&,450 3,33 291 8930 11400 1113 37,549 3,43 303
9980 12100 t,ot 38,054 3,42 JU 10500 lUOO 1,07 391'191 31!9 108 ueoo 14100 11tl 40~'U 5187 14'5 14800 14800 1,71 U~lfi'P b. 2i! 151 11400 snoo zl :u 43~408 8,418 3flb
31100 48100 31.491 101100 uso 33900 !50000 U 1140 103,00 1!180 !1'700 !J3100 :u ,98& 109,00 1UO 1~300 5!'100 32,230 113100 1UO 41!900 541100 32,52& 110,00 1680
e 49000 5UOO U18oe 122.00 1810 !541100 &3800 n~ou 12§100 1930 U!OO &8800 n.:se-3 tn.oo 20fl0 13300 7:5300 :U,tttt 134100 Ultl 81!400 18100 141022 137100 uoo
1!1)020 'Pb!O 11128 11,,68 53130 an '5UO 8)20 1,26 8192& U,70 •n &410 90!50 1,:U 8189& 741&0 10!0 nso 9110 •lu 81830 701.0 10,0 7840 ~9~0 710!5 8~7n 80170 1140
8UO 10500 7,43 8,6Jl 901'50 1l20 9840 11!100 &,.3 81!190 92,!10 1UO
11&00 12800 ,,92 81504 88,&0 1!500 13400 13400 7,,35 als :u 11&.00 1580 13200 1UOO 1,91 8,499 108,00 1420
I t t I a I t I I I I I I I I .... ~I I t , I I I I, \ I I I I I I I I,' ~ .. ... 1 I I I
' ' I ~I I I t ....
I I t I I I I I , I. I I I ••• •• I,
••• I t t t I t I I I t I I I I t . I I t I I I Ill ••• ••• t t I
15'PO 1810 11155 0,100 391,00 18300 1no 2110 1.1,00 0,108 311100 20000 2000 2000 !,eo 0,119 4171,00 16800 1880 1120 1,00 0,140 1192,00 12300
ARMED MIL EX ARMED
FORCES ARMED FORCES
FORCES per
Constant 1000
thous dollars people
45 2070 1. S!i 4'5 u•o 1,11 51 1210 1,44 55 lltO 1,51 59 2180 11'57
$8 uao 1,50 &2 U10 l,U 63 1810 1154 90s 2910 zlu
llO 3070 Z176
303 10600 9 1&2 305 10700 •,u 110 1 uoo 9 1 U J1l 1l100 9 I ft8 314 11400 t,n
315 UTOO 9,.0 !18 1]000 9,U
~ Ji!S 1)100 9183 Jtttt 12400 10190 435 10100 12,&0
190 U20 21120 195 3100 21180 215 :~o•o u,ao 22! 2110 n,so 230 :sou 26,40
245 :suo 28140 255 lllO n,To liiO !920 !0,40 I
uo suo 361)0 ll1 uuo zslso
t I I I I I I I I
t·~ I I t I I I
I I\ I I I I I I
\II!, I I I • •• ••• t I I I I I
• •• t I I I I I
2 t•e.oo 20100 3 11200 U18o 3 18700 UIIO '5 19400 n11o
I

YEAR
ROM4NU uu uu 1~68 19o9 U10
U11 U'TZ 19.,3 1,74 191!1
RWAN04 Uoo 1~61
"" 196~
1'70
1911 1~12 1913 1914 1~15
S4UOl U48U 1466 1~67 1968 196' 1910
1911 nu ltU 1914 un
IIEN!GAL. 1h6 l9tl'7 1968 1969 UTO
lt'T1 1911 1913 1914 un
TABLE ILMTLITARY EXPENDITURES, GNP, POPULATION, AND ARMED FORCES BY COUNTRY BY YEAR -Continued
MILITARY GROSS NATIONhL MILEX PEOPLE MILEX GNP
EXPENDITURES PRODUCT per per
(MILEX) (GNP) GNP CAPITA CAPITA
M ill ion dollen 1 Million dollars b Constant Constant
1(, Mill ion dollars dollars Current Constant Current Constant
1130 1110 1'T~O 0 21100 19,141 89150 1420 1010 1580 19100 28200 191285 81110 1460 1150 10!0 20400 28800 191721 82,20 1460 1330 1no 22600 30300 20,010 n,zo U20 1400 1800 24200 30800 201253 91,~0 1520
e 1410 1180 28~00 3UOO 20,470 81110 1 'T1 0 1110 1990 32100 31400 2016U 96,30 1810 1180 1~60 nooo 38500 20,8!8 ~4,00 1850 1940 1940 40500 40500 !1,030 9l,20 1no 2230 2040 4&800 42800 21,245 9b 1 00 2010
• • ue ao• 4, t1 3~30& !15. n 3 4 15Z 224 1,84 3aH3 1121 66 4 !I 169 238 2123 3~485 1152 68 II '5 191 2611 l,'f1 3,582 1,41 14 !I 6 !U nz 2,02 1.,683 1,60 ., !I • 145 291 2,15 31788 11ft~ n
' 5 255 i!97 1,81 3,8~6 1.:18 u 8 8 21~ 101 2,14 41008 2110 11 1 1 310 310 2,19 41123 1 • ft'5 15 1 1 351 Uft a,oo 4,141 1 1'54 .,.,
c 150 228 6410 9720 ft,29 4,814 41,10 ZOtO 312 459 1330 10800 11,40 4,~55 92170 2110 !OJ 186 e:no 11.,00 6~39 5,092 5ftl20 2300 241 332 9400 12600 6,84 5~236 63,30 2410 U6 326 10100 uuo ftl21 !1, 18ft 60,50 2UO
uo 412 tzqoo 15600 6~41 5,54J 14 I JO 2.110 406 41! 1!!400 18000 6,41 $~70ft U 190 3150· uo 104 U600 21100 1,18 !5 ·,816 120100 )660
11!10 1110 24100 24.,00 4,64 •i051 190,00 4o•o 1 1'5 0 1600 21400 21100 !I,U 6,Ul 2!!1,00 40)0
1!1 u 835 1210 1,83 :11519 6 1 ft0 360 u z• Btl U10 1•" l;oo:s 1124 364 u 21 •n uoo 1,04 :s.uo 1,11 ~u 19 lb •n 1310 2\00 s,uo .,91 lU 21 26 1010 U90 Z10!1 s18U •• u :nz u 21 1220 1480 1,8, ,, .. 8 6,86 l'TI 2! z• 1190 ueo 1,89 41061 6,41 )40 Z4 u uoo 1UO 1, e:s a,sn 6,26 :142 I! n 1UO 1UO t,u 4,an 1,14 3U u IT 1820 lftbO 1,60 4,JU .,0'5 379
ARMED MILE X ARMED
FORCES ARMED FORCES
FORCES per
Constant 1000
thous dollars people
212 80&6 11108 190 8110 ~185 1~0 8'520 ~~n uo ~421 .,,o 211 8815 10,42
218 8165 10,65 2UI 9U8 10,55 U2 10208 9122 218 88~~ to ~n 220 9213 101 J6
3 U57 0191 3 1310 0188 4 1U8 1,15 4 1U3 1,12 4 1478 1,09
4 15~8 1,06 4 1348 1,03 4 2105 1,oo 4 1700 0,~1 4 1630 0194
45 50ft1 9,33 !0 •uo to,o• 60 4761 11,78 60 55!3 11, 4ft ., !015 u,o1
'' u~:s U,!l! n 6J0'7 u,u 1'!1 9U1 12,16 80 14315 13,22 n 16842 15,25
1 3314 11" 1 $129 t, 94 1 3186 1,90 1 3129 t,n 1 :1111 1,81
7 388ft 1 • ., 1 3129 111J 1 312' 1168 7 S500 1,64
' l1h t,•o
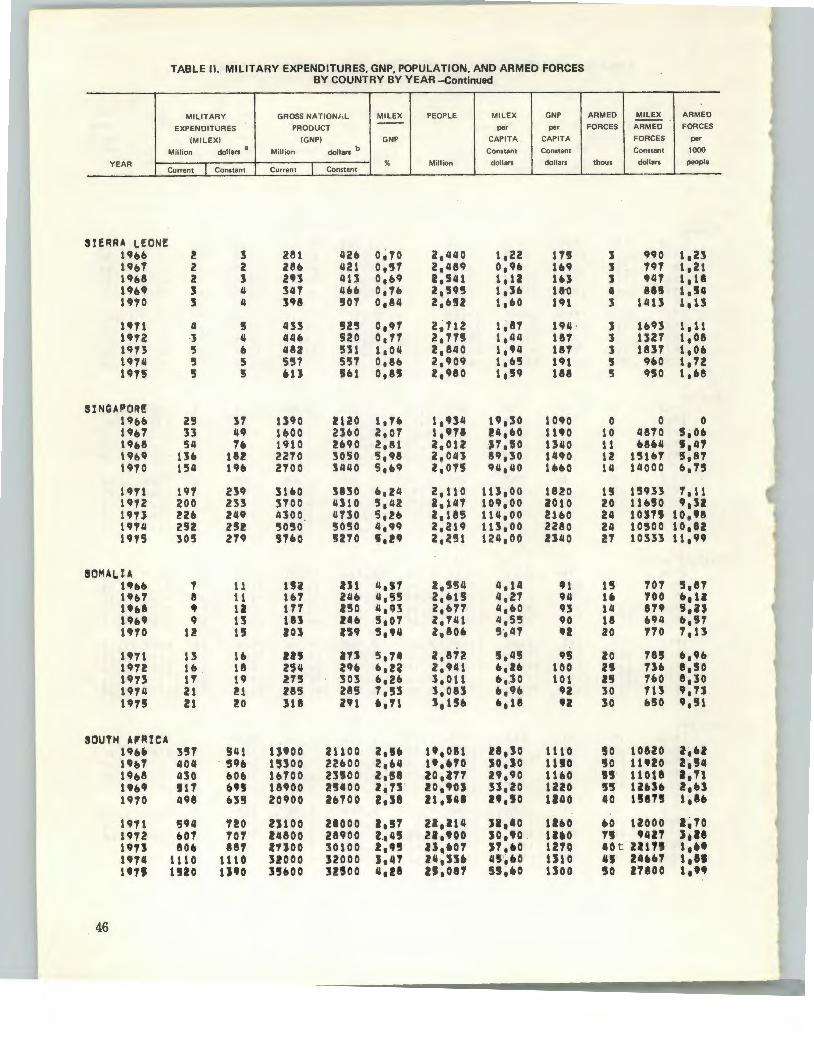
TABLE II. MILITARY EXPENDITURES, GNP, POPULATION, AND ARMED FORCES BY COUNTRY BY YEAR -Continued
MILI TARY GROSS NATI ONJ,L MILE X PEOPLE MILEX GNP ARME D MIL EX AR MED --
EXPENDITURES PRODUCT per pe r FORCE ARMED FORCES
{MI LE X) {GNP) GNP CAPITA CAPI TA FORCES per
Mill ion dollars a
Million dollars b Constant Consta nt Constant 1000
YEAR Current I Constant I
% Million dollars dollars thous Current Constant
dollars peo ple
SIERRA LEON!: 1966 ! 3 2111 426 0~10 2,440 1,22 l1!!1 3 990 1,2:5 11~61 2 2 2116 421 0,51 2,489 0,96 169 3 191 1,21 1968 2 ] 2193 413 o,n Z,541 1,12 lU J '14'1 1,18 11969 3 4 347 46& 0,16 2~'595 t,:so 1&-0 4 t!J'TO ' 4 3911 !101 0,811 2,&52 1,&0 191 3
818 l,U l4U 1 1 13
U11 4 5 453 !12'5 0,97 2.712 1,87 Ull · 3 1&93 1,11 1H2 ·3 4 4116 !120 o, 11 2,1n 1,44 187 l U2'1 1,011 1973 5 6 482 '531 1,04 2,840 1,'11 1117 3 18S'T 11 0ft 19Tll 5 5 557 557 0,86 2,909 1,6'5 191 5 9110 1,12 un 5 !!I •u su 0. 8'5 2,980 1,'59 188 5 950 1,118
SlNGAPOR! 1966 25 31 1390 ltlO 1,,. 1,934 19,30 lOtiO 0 0 0 itllt'T 31 49 1600 2,60 2,07 1,•n u,•o 11190 10 11870 '5,0& 19&8 511 7ft 1910 2690 2,81 ie 1 01Z )1,50 1340 11 6864 ,,41 19619 11& 1!12 2270 3050 5,98 2,0111 89,30 1490 1l 1 '516'1 5,87 1970 154 196 2700 J440 5,&9 2,075 911,40 thO 111 14000 6,75
1911 19'T zn 3160 5830 &,24 2,110 113,00 1820 u 15933 1,11 1972 200 233 3700 4:UO '!1,42 a,u1 109,00 2010 20 uno '•31 1973 226 2119 4300 4130 5,!6 2,185 114,00 2160 24 10JU 10,911 1914 252 zsz 50 '50 50 '50 4,99 2,219 1 u,oo 2280 211 10'500 10,82 1975 305 279 !1&0 !1270 s·,!• 2, 251 124,00 2340 21 10333 11,"
SO,..AI.U l'U 1 11 1U n1 4 1 U 2,'!1~4 4,14 IJ1 15 101 5,87 1967 I! 11 HIT 246 4,';5 2,615 4,2'7 94 u 700 tt, u 1'&8 • u 171 2'50 4,CJ3 z,&T'T 4,&0 93 111 en 5,2:$ 19&9 9 u tn 1116 5,07 z. 741 11,5'5 90 18 694 6,U 19'70 12 1!5 103 U9 '5. 94 2,806 5,47 ., 20 110 7,1:5
1911 13 16 U'J an 5,74 2,872 5,45 95 20 78'5 6,,. 1972 16 18 ZH 29ft &,u 2,'41 6,16 100 n 136 8,50 1973 H 19 27'5 303 6,26 :s, 011 6,,30 101 Z5 '160 e,:so 1974 21 21 285 285 7,53 :s,on 11,96 92 30 1U 9,1J 1915 21 20 318 2'1 •• 11 1 1 1511 o,u •z 30 &SO •,st
SOUTH AP'RICA 19116 357 541 uqoo 21100 2,!50 19,0111 211, so 1110 50 1'1117 404 59b 15300 ZZIIOO 2,64 u,uo JO,SO 1UO 1!0
10820 z,u 111920 2,!4
19611 uo 606 lb?OO 23500 z,n 20 1 ZH 2CJ,CJO 1160 !5'5 11011 a,n 1'&~ '511 on 111•oo !5400 ZITS Z0 1 90J 53,20 1220 5'5 UUII 21 U 19?0 498 635 zoqoo 26100 z,se U,UI U,IO 1140 40 1!1175 1,11&
1971 594 '720 zuoo 21000 1,!1 22,214 U 1 40 u•o oo uooo a,10 1972 601 101 24800 211900 2.,4'5 21,'00 $0,.0 . lUO 11 tqn 110ft II liT znoo 30100 2,t!l n,•o1 u,•o 12'10 110
9411 s.u t zun ,, ..
1'74 1110 1 tt 0 3!000 J2000 3,41 Z4 1 U6 u·~•o UtO Ill 211&&7 ,, ... un 1!120 u•o 3!600 :snoo 4,18 u,on 55,60 uoo 50 Z'TIIOO '·"
46

TABLE II. MILITARY EXPENDITURES, GNP, POPULATION, AND ARMED FORCES BY COUNTRY BY YEAR -Continued
MILITARY GROSS NATIONhL MILEX PEOPLE MILEX GNP EXPENDITURES PRODUCT -- per per
CMILEX) (GNP) GNP CAPITA CAPITA Million dollars 8
Million dollars b Constant Constant YEAR
I I % Million dollars dollars Current Constant Current Constant
SOUTHP,RN RM~Qfil4 Ubb iU !1 11 7 II 1'180 1,7& 4183& &145 3&7 19b7 i-!4 35 1310 1930 1,81 41995 &199 38& 19&8 ~0 n 1400 1980 1,11& 5,172 7,12 3BZ 19f:t9 33 4S 1&90 2270 1,97 5,356 el:u 424 1970 '9 J7 1640 23'JO l 157 5,§4& &,&4 1123
1911 ,i,U tlil 2150 2&10 1 1 &O 5,155 7,28 455 U12 S$ 41 2420 2820 t ttl 0 5 1 9H 6,94 475 t9n "~ 49 2&&0 Z930 1,f:t7 &,155 1, 1Hl 476 UT4 119 &9 1250 3250 2ot2 o,l&l.l 10,80 511 1915 jj~ 74 3500 3200 2,32 &,579 11,l0 487
SOVl!T UNtOr. 1960 ~"~00 82(')00 361000 §1.17000 2:53,533 351,00 2140 1967 )77uo 85000 '595000 582000 2351991.1 3&0,00 21.170 1966 ~~~600 6CI900 423000 59&000 238, :317 377,00 250(') 19&9 c9~00 95000 458000 61'5000 240,5'51.1 387,00 2560 19TO ./'lf.!OO 95100 519000 &&1000 242,757 392,00 2720
e uu ttoeoo 98000 '565000 68'!5000 !45,083 400,00 2800 19Til oli)OOO 9(1(')00 599000 697000 24714~CJ 1100,00 2820 1CJU lf4lf;OO 104000 679000 7117000 249,747 41&,00 2990 19111 lCJ~OOO 106000 779000 7HOOO 252,064 1121100 3090 1911$ 119000 109000 870000 790000 2'54,300 1128,00 3130
SPAIN 19U fl7b 1480 34&00 52500 2,62 32.393 n, 1o 1&20 19b7 U70 1720 37200 54800 3,\3 321 7}/.1 52,50 1680 19U 140(1 1970 lit tOO 57900 3oll0 331079 59,50 1750 19()9 6410 !920 11&1.100 112300 3,08 :53,1.127 57,40 1860 1910 1S90 20~0 51600 uooo 3,01 33,719 59,~0 19SO
' 1911 HIIO 2110 ~11 00 61Jl00 3,!14 3/.I,UII 61,70 20:10 19'12. ~910 2230 &4500 75100 2,9& 34,494 &1.1,50 2160 191$ 1980 2180 71.1200 81&00 2,b7 :'14,857 62140 2340 19T4 i)iO 2380 85700 85700 2,77 351225 &7,40 2430 19U· ~BiO !580 CJ4/.IOO 8&400 2,98 35,S9& 72,110 21.130
SRI I.ANI<A (Cin.or·n 19U ., 18 151.10 i:s:JO 0,18 11,:H8 1,&1 i!Ob lhT u 18 1UO l!/.170 0 1 14 11,570 1, 5'1 214 1968 u 19 1860 261!0 0,72 11,826 11&0 222 19.9 15 20 2070 2780 0 .u 12,091 t,U 230 \910 &7 21 2100 2930 o,n 12,160 1. 'TZ 237
191l 33 40 2390 noo 1,:18 12,63! 3,17 zn 19U u 3f:t 2560 2980 1,19 12,910 z,a 211 19U:
·~ 27 26~0 3180 0,86 t:S,UO 2,08 241
1n1+ ib 2.6 :Si!10 3Z10 0,80 Ua416 1,•o ''" un i3 21 lbiiO 3310 o,u t:S, 718 1,'51 241
ARMED MILE X ARMED
FORCES ARMED FORCES
FORCES per
Constant 1000
tho us dollars people
1 0 3120 2,07 10 3490 a,oo 11 3350 21U 11 1.10&0 2,05 1l ll50 1,•M
11 3790 1. 92 1 1 3740 1,85 11 4450 1,19 15 1.1590 2,3& 15 4.50 2,28
3800 21&00 1&,30 3900 21800 Ut 1 SO 4100 21900 17.20 4200 22100 17150 4300 22100 17,70
44(')0 22300 18,00 4400 22500 17,80 4500 23100 18,00 I.I'JOO il600 17,90 4600 23100 1811(')
375 H50 11,60 370 1.1&50 11,30 370 5320 11,20 '5&5 5260 10,90 365 551.10 10,80
365 5770 10,70 lb5 &100 10,60 365 5960 10,50 375 &330 10,&0 315 &870 10,$0
10 1Bl0 o,ee 10 1840 o,a• 10 1890 0,85 10 1990 o,e:s 10 zuo 0,81
10 1.1010 0 ,1«1 16 2230 1,24 18 1520 1,36 18 11110 1,:14 16 1110 1 1 U
47

TA BLE II. MILITARY EXPENDITURES, GNP, POPULATION, AND ARMED FORCES
MILITARY
EX PENDITURES
(MILEXI
Mill ion dollars a
YEAR ent I Constant Curr
SUDAN 19&11 1967 1h8 19&9 1910
1911 1 9'12 1 9'Tl 1 91'1 1975
SURINAM 19&& 1967 1968 1969 1910
1911 19TZ 19't'~ 1914 19'r5
SWAZI I. AND 196& 1967 19&8 1969 1970
1911 11'T2 19U 1974 1CJ15
SW!DEN 1966 11 19&T 11 1968 11
42 49 61 &9 96
19 20 111 13 21
I I
• • I I
• t
• •
• • • • • • •• 0
• • • • • • 0 0
0 0 0 0 0
20 30 'TO
19U 12 20
48
1970 1~
U't't 111 1972 til un u UT4 18 1'75 19
'TO
50 80 80 10 110 ,
611 13 8& 93
122
1114 1110 126 113 110
• • • ••• 0 t I
• t t
••• . . ~ • • • I I I
• • • 0
I I I
• •• I
••• 0 0
0 0 0 0 0
1700 1bb0 16!0 tbiiO 1150
tHO 1840 18110 181!0 1810
BY COUNTRY BY YEAR-Continued
GROSS NATIONhL MILEX PEOPLE MIL EX GNP --PRODUCT per per
(GNP) GNP CAPITA CAPITA
Million dollars b Constant Constant
I % Million dollars dollars Current Constant
t'T&O <!680 z~31 13,922 4151 192 1870 2150 2163 111,350 5105 192 2010 2920 21911 1111193 5,81 198 2310 3100 2,99 15,251 &,09 ~03
2330 2910 11,11 15,725 1,75 189
2570 3110 4,62 u,,2u 8,88 192 2770 3220 4,35 1&,721 8,39 193 3090 :B90 3,70 17,244 7,29 197 3!3&0 3§60 3,18 17,787 &,31 200 11670 11210 2,58 1813117 &,02 233
• • • • • • • •• • •• ••• • •• • • t ••• • • • • •• • • • • •• ••• • • • ••• ••• • • t •• t
••• t •• • •• • • • • •• ••• • • • • • • • •• • •• t •• ••• t •• • •• I ~I • • • ••• • •• • •• • •• . ~. I I, I ••• I t I,
••• • •• ••• . ~. • • • • •• . ' . • • • ••• ' . ' I I I ••• 0 0 0 0. 41& 0 0
I I t I I I . '· . ••• I t I ••• • •• • •• • • • • •• • •• ••• • •• • • • ••• • •• • •• I I I
n 98 0 0,410 0 141 99 12& 0 0,422 0 300
112 135 0 0,4l! 0 l11 133 155 0 01449 0 346 152 161 0 011163 0 361 188 188 0 01478 0 Hll 238 218 0 0,493 0 442
28000 42400 4,00 7,808 217100 5430 29700 113800 3,79 7,8&8 211,00 5570 3!300 lll'&OO 3,61 7,912 208,00 57 eO 35100 41900 3,45. 1,9&2 20b 100 6020 H500 50300 3,118 8,046 218,00 &250
41800 'SO bOO 3,48 •~sos zu,oo uso 44fl00 stqoo 315'5 81127 2~7100 &~•o 118.00 ,5800 :5,113 8,1:58 221 1 00 6610 56000 56000 :5,1!6 81157 2211100 b610 6UOO 5UOO 31 U 8111Hi 221,00 6870
ARMED MIL EX ARMED --FORCES ARMED FORCES
FORCES per
Constant 1000
thous dollars people
20 3180 1,44 20 3625 t,H 20 4300 1,35 25 3112 1,611 t 25 11880 1,'59 J
35 11114 a,u 35 4000 2,09 35 3600 2,03 35 1229 1,97 50 2200 2. 7:5
• •• • •• • •• • •• ••• I I I
• •• ••• • •• • •• • •• I I I
• •• • •• • •• ••• • •• • •• • •• ••• • •• c • •• ••• I I I
• •• • •• . . ' 1 0 2,40
I I I , ••• ••• I. I I • • • • •• • •• I I I • •• 0 0 0 ~
0 0 0
0 0 0 0 0 0 0 0 0 ' 1 0 2,09 1 0 a,u
10 2Uh 8,97 'TO U'Tt4 8,90 T5 nooo 9,48 75 21861 9,112 15 U3H 9 1 U
n UII&T 9,25 75 2453:5 •,n 1!1 2un •~u 75 242•7 q,u 75 !4U3 ',u
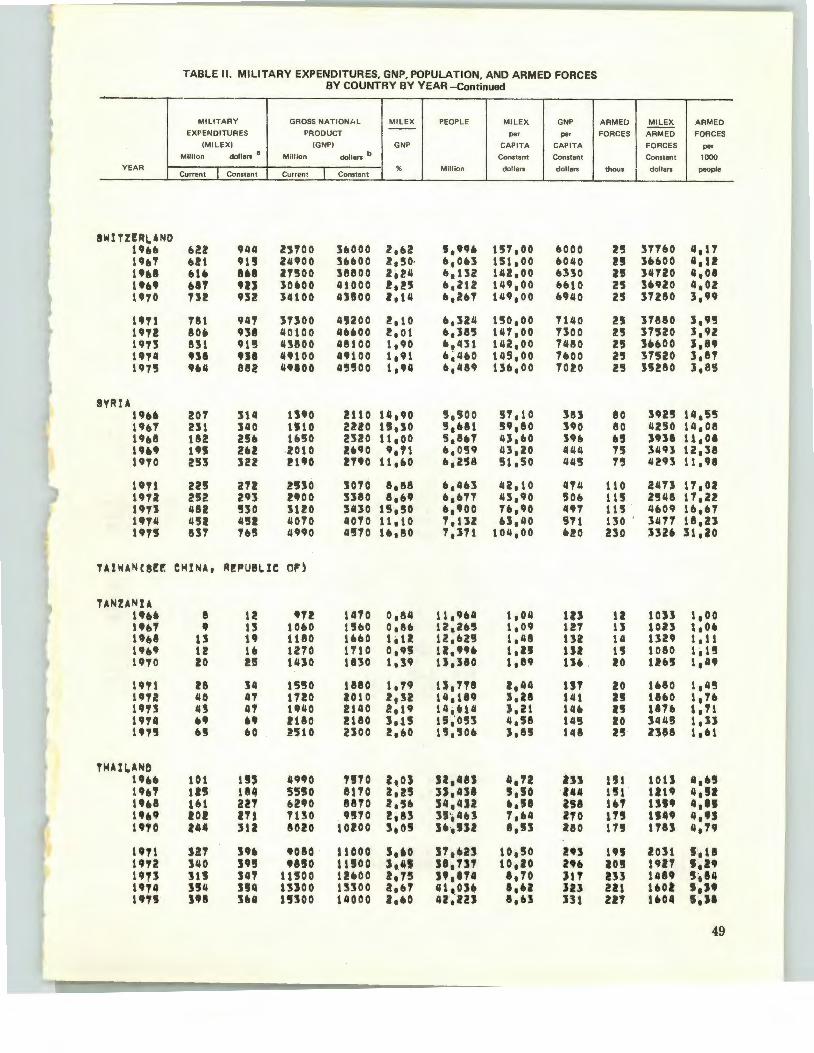
Y EAR
SWlTZ!RLANO 196& 1h1 thl ~'•' 19TO
1'11 UT2 UTS 1'T4 1975
SYRIA Uftft 19ft7 19&8 19U 1970
UTl 1972 un 19T4 un
TU WAN(S!!
TANUNU 19&& 1•n l'U lCJ&9 1•10
UTl nu UTS 1914 un
TI'IAII..NO 1'&6 19&' 19&8 u •• 19TO
19'71 19'12 un 19;4 ttU
TABLE II. MILITARY EXPENDITURES, GNP, POPULATION, AND ARMED FORCES BY COUNTRY BY YEAR -Continued
MILITARY GROSS NATIONA L MILE X PEOPL E MI L EX GNP --EXPENDITURES PRODUCT per per
(MILEX) (GNP) GNP CAPITA CAPITA
M illion dollars 8 Million dollars b Constant Constant
I Constant I % Mill ion do llars dolla rs
Current Cu rrent Constan t
&~2 9114 25100 36000 z,u 1,9U 1!57,00 6000 Ut 9U 24900 3&1»00 2,!!0· &,ou 151,00 &040 &1& 8&8 21~00 38800 2i24 &,1!2 142,00 UlO UT UJ lOUO 41000 !,!5 &,212 149,00 &&10 13! 932 14100 4J!IOO z,u & • zu 149,00 1»940
181 94T 31300 45200 2,10 &,324 150,00 1140 80ft 931 40100 4&eoo z,o1 fl,le5 141,00 1300 eu 91!5 45800 48100 1,90 &,431 14Z 1 00 7480 na ua 4'100 49100 t~•H 6~4b0 145,00 T&OO 9U 882 4.SOO 45'500 1,94 &,489 13b 1 00 TO!O
20T :514 1j90 u to 14,90 5,500 !1,1 0 383 231 340 1110 22!0 U 1 10 s,&u 59,eo no 182 ne 1b50 2120 11,00 5,861 43,60 39b l'JI zu -2010 2&90 9,11 6,0!!9 43,20 444 253 322 !190 zno 11,60 &i2'58 51,50 44!!5
22! 212 2!!30 3070 e,e8 6 1 4U 42,10 474 252 293 noo 5380 e,&9 11,611 43,90 50& 482 !!530 3120 3430 1!!.~0 ••• oo 1&,90 4., 4'52 4'51 40'10 4070 11,10 7,132 &3,40 571 en 7&15 4990 4!!170 1&,80 7. 311 104,00 620
CHtNA, R!PUBLIC 01")
8 12 nz 1470 0,84 1l,h4 1,04 us 9 u 10&0 1!1&0 o,ee 12. i!&!l 1,09 127
u 19 1180 l&&O le1Z l2,U!J 1,48 132 12 16 1270 1710 o,n u.••• 1,n 1U 20 u 1430 1830 1,39 u,:no 1,89 U6 .
211 l4 1550 1880 1,79 1$,778 2,114 UT 40 41 1720 2010 2,_u 14,189 J. 211 141 4J 4T 1940 2140 2,19 14,.14 J,l1 14&
" &9 2180 2180 ~.J5 15~0'53 4,5e 14!1 n flO 2'!510 noo 2,110 1!1 1 '50& J ,8!1 148
101 1!3 4990 7!1 '7 0 1.n u,us 4. '72 in tU 184 55!10 8110 2~U 3),4:51 ,,,o •u U1 U'7 62'10 8870 2,5& U 1 4U .. ,. ~\II IOi 211 1130 9570 z,u 31'1 4U 7,&4 210 244 :su 8010 lOZOO s,o!l n,su 8,!13 2eo
32T :n& 9010 11000 s,•o n.us 10,!10 an 340 :'59!1 •no 11!100 J,4S S8. 7:11 10,10 29& lU l4T t t!SO 0 1!&00 2,15 "·'"' I I 'TO J1T 3!14 JU 13300 UJOO a,n 41,036 .. ., lU ,.. su 1 !ISOO 14000 2,&0 u;zu 8,U 331
ARM EO MILEX ARM ED --FORCES ARMED FORCES
FORCES per
Constant 1000
thous dollars people
~~ 37160 4,11 n 3UOO 4,11 n 34120 4,011 25 3&920 4,02 2'5 31280 3,99
2S 178&0 1,9!!5 2'5 31520 J,9Z 25 lfteOO :s,n 25 37520 3,87 2!! 35280 3,85
80 392'5 14,55 eo 4250 14,08 u JU8 u,oa 15 3493 12,38
" 4293 11,98
110 2473 11,02 115 2548 17,22 11'5 4&09 1&,61 130 . 3477 18,23 no 332& :H,lO
u ton 1,00 tJ lOZJ l 1 U 14 1329 1,11 1; 1080 1i1!1 10 1!&!1 1,49
20 U80 1,4~ n 18&0 1,, n U'Te 1." 20 344!1 1, 3J l~ nee 1,61
111 lOU 416!1 1!11 lU9 4,11 U'7 un 4,11 l'n U49 4,95 17!1 1 T8J 4 I '79
195 2031 !J ·, u 20!1 U21 '·" Ul 1489 s,u 211 uoa '·" 2U 1604 ,,JI
49
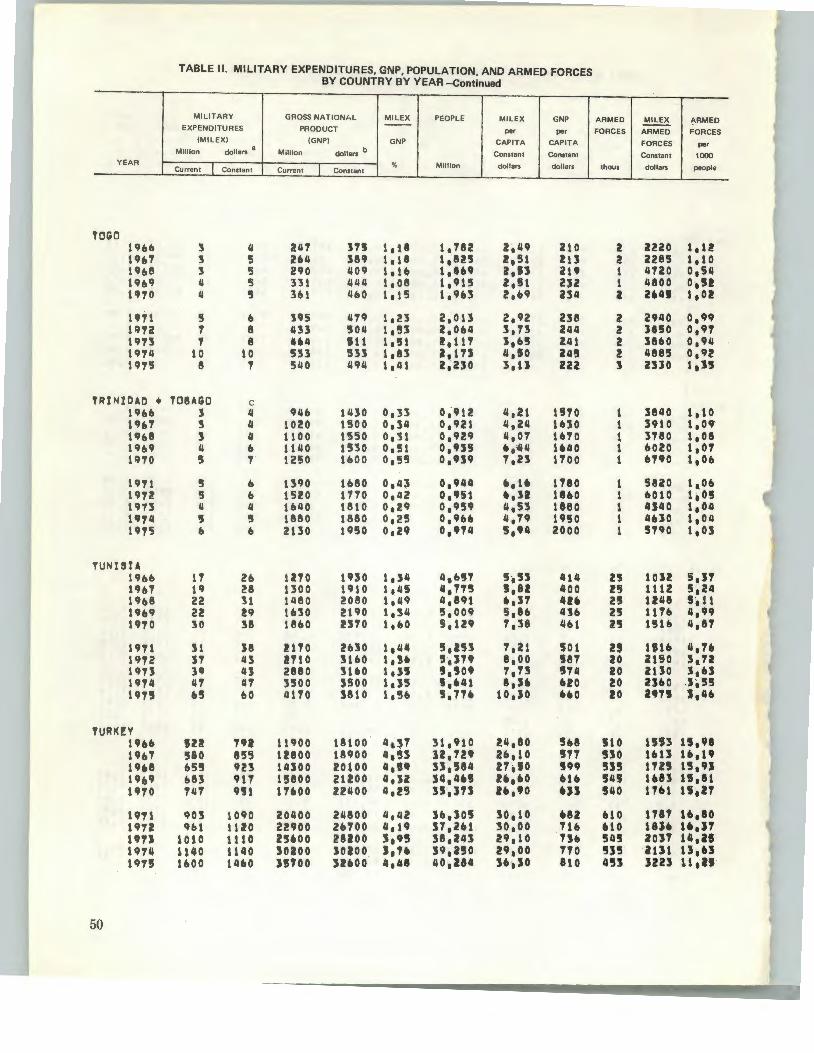
Y EAR
TOGO 19bb 19&7 1CJ&8 19&9 1970
u;1 19'TZ 1975 19T4 1975
TRINIDAD + 19&& 1'161 t~Jo8 1'1&9 1970
1971 1972 1973 1911.1 1975
TUNISIA 19bb 19&7 19&8 19&9 1970
1911 1912 19TJ 19T4 1915
TURI<fY 1966 1961 1968 1969 1910
1911 1912 lOU 1914 19'75
50
TABLE II. MILITARY EXPENDITURES, GNP, POPULATION, AND ARMED FORCES BY COUNTRY BY YEAR -Continued
MILITAR Y GROSS NATIONh L MILE X PEOPLE MILE X GNP EXPENDITURES PRODUCT per per
(M ILEX} (GNP} GNP CAPITA CAPITA a
dollars b Mill ion dollars Mill ion Constant Constant
Current Co nstant Current Constan t % Mill ion do llars do llars
3 (j 241 :sn t ,18 1,182 2,49 210 3 5 2U ;589 1. t8 1,825 2,51 2U 3 5 290 1.109 1 • 16 1,8119 z,n zn II 5 331 41.111 1,08 1,915 2. !it U2
" 5 3&1 1.1&0 1,15 1, 9&3 z.o9 234
5 b ns 419 1,23 2,013 2,92 238 1 8 4:53 504 t,n 2,064 :s.n 244 1 8 U4 Ill 1,'51 2,111 1,65 2.41
10 10 533 533 1,83 z,sn 4,So 245 8 1 51.10 1.191.1 1, 41 2,2:10 l,U 222
TOBAGO c 3 4 94& 1430 0,33 0~9U 4,21 1!10 3 4 1020 1500 0,34 0,921 1.1,24 l&JO 3 4 1100 1550 o,:s1 0,929 11,01 1&10 1.1 b 111.10 1530 0,51 o,us • ,-u 1UO 5 1 1250 1000 0,55 0,919 1,23 1100
5 b 1390 1660 0,1.13 0,944 •• u 1180 5 b 1520 1710 0,112 0 1 95t •• u lUO 1.1 1.1 16110 1810 0,29 0,959 4,53 1880 5 5 18110 1880 0,25 0,9bb 4,19 1950 b b 2130 1950 0,29 o,•11.1 s,u 2000
17 Zb 1!10 1UO 1,34 4,&!11 5,53 414 19 28 1300 1910 1,45 4, 1T5 1,81 400 22 31 11180 2080 1,1.19 4,U1 •• :n 4U 22 n 1&30 2190 1,34 !5,009 5,8& 4lb 10 38 1860 2!10 1,60 !3,129 7 1 18 461
31 38 2110 UlO 1,114 5,253 1,21 '501 $1 113 !110 U60 1, :u !5,379 8,00 581 H IIJ 2880 :UftO l,l'J !1,!109 1' 1l 'T4 41 1.11 3500 ~500 1 '35 I,Ul 1,)6 uo 115 flO 11170 3810 1,56 ,,7.,. lO,JO .. 0
na 791 11900 18100 4,31 31,910 24,80 5U 580 855 1!800 18900 4,53 JZ,T29 2&,10 ,.,., &55 923 1UOO 20100 4,1' 33,584 21,10 !199 683 911 15800 21200 4,U :S4 1 4U h,•o &16 11.11 951 11600 22400 4,25 :SS,JTJ 1&,90 •n 903 1090 20400 24800 11,42 311' )05 30,10 U2 961 tli!O 22900 2&100 II, 19 31 ,2&1 30,00 116
toto t 110 251100 uzoo 3,9!5 38.243 29,10 ,.,. 1140 1140 soaoo JOIOO ,,,. 39,250 29,00 1'70 11100 14110 JUOO :suoo 4,41 40,114 :u' so 8t0
ARMED MIL EX 1\RMED
FORCES ARMED FORCES
FORCES per
Constant 1000
thous dollars people
2 azzo 1,12 2 2285 1,10 1 1.1120 0,54 t 4800 o,5z l ZUI 1 'oz 2 zuo 0,99 2 JSSO o,u 2 1860 0,94 2 4885 0,92 l zno s,n
1 3840 1,10 1 3910 1,09" 1 3180 1,08 1 6020 1,01 1 &no 1,06
1 5820 1,, 06 1 6010 1,os 1 4S40 1 '04 1 4UO 1,011 1 5190 l,OJ
n ton s,n Z!l 111Z 5,24 21 12411 5,11 25 1176 4,99 25 15U 4' 8'1
n Ulfl 4,76 lO auo s.u 20 UJO J,U 20 UfiO ,J. 55 io un S,4fl
510 15$3 u,u no uu U,19 53! 1125 15,9) 545 an U,ll '540 11&1 u,u 1110 1111 16,10 •so 181' u,n 51.15 a on 14,U 535 iUl u,u 453 un u,n
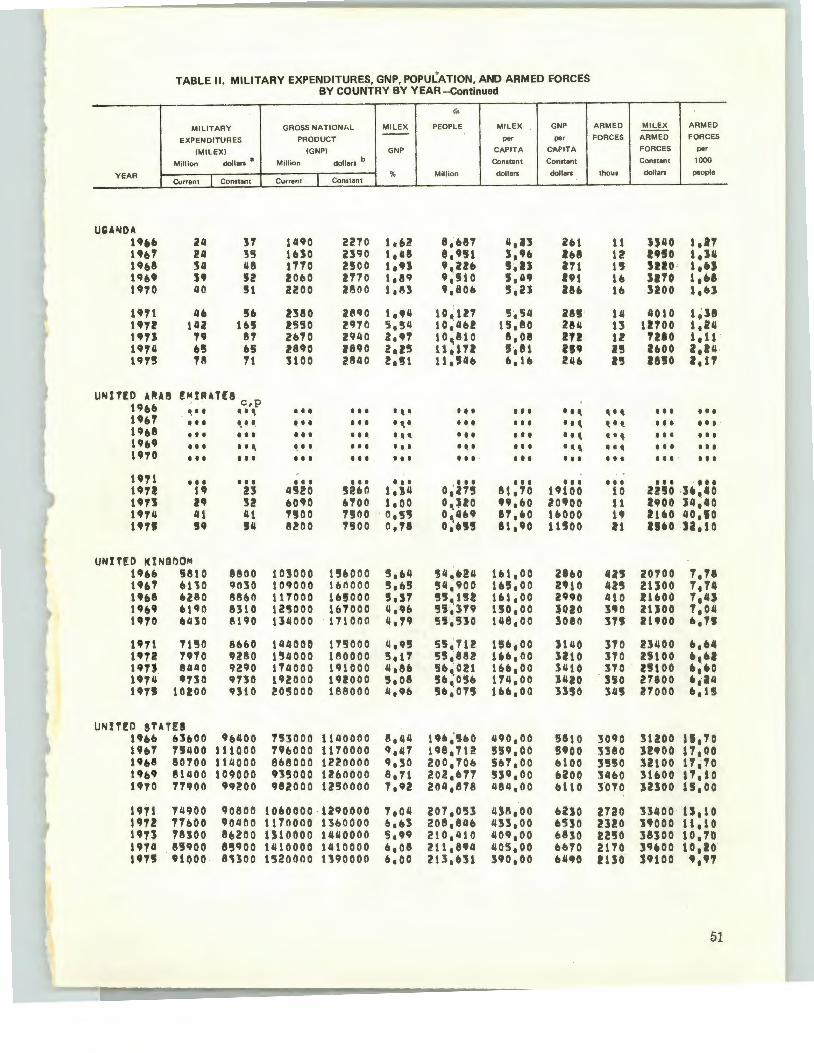
TABLE II. MILITARY EXPENDITURES, GNP, POPULATION, AND ARMED fORCES BY COUNTRY BY YEAR -Continued
" MILITARY GROSS NATIONAL MILEX PEOPLE MILEX GNP --
EXPENDITURES PRODUCT per per
(MILEX) (GNP) GNP CAPITA C'APITA
Million dollars a
Million dollars b Constant Constant
YEAR % Million dollars dollars Current ( Constant Current I Constant
UGANDA uu 241 n 1no 2270 1162 8,687 "·" 201 U61 211 35 1UO 23QO 11418 81951 3,h 268 U68 54 418 1170 noo 11n ~.U6 s~n au 196' n 52 2060 2170 1,n 9,!510 '!lin Ut 1910 410 u 2200 2800 1183 9,80#) '!1,2J zu 1971 416 '!16 2580 2890 1,,41 101127 !5,541 28!1 U12 142 1()5 !550 2970 5154 10 .. 4&2 15,80 2841 1913 n 87 2610 2940 2,91 101810 8108 211 1914 6'5 65 2890 1890 z,z! ll~tU !S,Bl as• 197'!1 78 71 3100 2840 z~~l 111S4o 6,10 2U
UNITED UUB !M!RU!S 19&6 c,p
~I t .. , • • • • • • . ~ . I ~ I ••• .. , 1961 I I I • ... • • • ••• . , . • •• Ill I I\ 19&8 I I I I I I ••• . ' . I I. t . I I I I I I II' 19ft9 • • • . . .. • • • • • • . ... . ... ••• .., 1970 ••• • •• ••• . ' . • •• • •• t I I • •• 1911 ••• I t I t I I I I I I I I I I I I I I ••• un 19 23 4520 5260 1,J4 01'215 81,10 19100 un 29 32 6090 uoo t,oo o,uo n,6o zo•oo 19741 411 Ill noo 1!100 0,55 o;u• n,eo 16000 1971 59 'II 8200 1500 0,78 o,·u'!l 81,90 tUOO
UN!TEO !<lN!lDOM 1966 !i810 8800 103000 156000 5164 54,fJ24 101,00 2860 1"6., 6110 9030 109000 1&11000 '31&5 541,900 16!5,00 2910 1968 6~80 ~860 1 uooo 1615000 5,31 551152 1U 100 zqqo 11J&9 e190 8310 12~000 167000 11,96 5S ~319 1!10,00 )020 1910 41130 8190 134000 171000 11,19 55~'n0 1418,00 3080
11J71 7150 86&0 144000 175000 11195 55,.712 15&,00 l140 19!2 1910 CJ280 154000 180000 51 !1 55,882 Ub,OO JatO un 84110 qzqo 1711000 191000 4,86 5ft,021 166,00 )410 1914 •no 9730 192000 11J2000 5108 561"0511 114,00 1420 un 10!00 Q310 205000 188000 11,96 56~015 166,00 31!0
UN!T!D suns 11~61:1 01600 9(,400 '153000 1140000 8,44 u•,'s6o 1190,00 58 to 1961 1!11100 111000 796000 1170000 9,41 tQ8,712 559,00 s•oo 1968 80700 114000 868000 122001)0 ~J,:so 2001706 SOT, 00 6100 1961J 811100 109000 CJ'J5000 1Z60000 8,11 2021671 5J9,00 6200 1910 1TQOO 99200 982000 1250000 7,92 2041,878 4811,(10 6110
1911 711900 9oeoo !060000 ·1290000 1,04 207,053 438,00 6210 1'12 11600 9(')4(10 11711000 1360000 &,63 208,8116 433,00 11530 1913 18100 86200 U10000 14110000 5,99 210,410 40Q 1 00 6830 1914 85900 8'3900 1410000 14110000 bl08 i!t1,894 110§ 100 6610 1971 91000 8Uoo 1520000 1 HOOOO b,OO 213,631 390,00 0490
ARM EO MILEX ARM EO --FORCES ARMED FORCES
FORCES per
Constant 1000
thous dollars people
11 lJ40 1,21 1! r•so 1,34 1'!1 suo 1,U 16 suo 1,u. 16 3200 $,03
141 41010 t~l8 13 tUOO 1124 l2 1280 1,11 n uoo 2,241 !'!I zno Z,11
, ... I It I I I
•• • •• Ill ••• tl' I I I I I I . . ' ••• . ~ . • •• Ill ••• ••• ••• ••• 10 2250 U 1 40
11 uoo 14,40 u IUO 40,10 Zt auo u,to
lla5 20700 1,11 425 2UOO 1,14 4l0 21600 1,4J 3.0 UJOO 1,04 31! 2UOO II ,1!1
:no 23400 6,64 310 25100 6,62 310 UlOO ••• o no 27800 •• 24 345 nooo 6,l!l
3090 31200 15,10 :neo lUOO 17,00 3550 32100 11,10 3460 31600 l1,to n1o 32300 15100
2720 11400 u,to 23!0 :nooo 11,10 2250 38300 10,10 2170 39600 10,20 u:so SCHOO .,,1
51
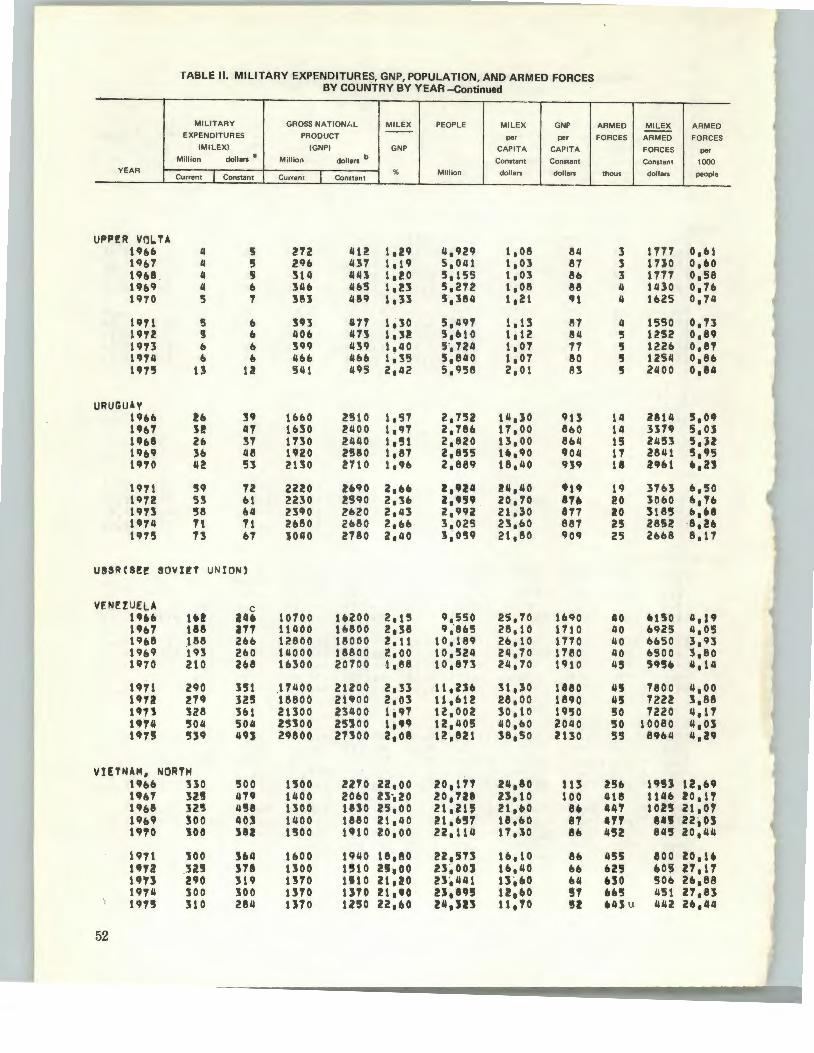
TABLE II. MILITARY EXPENDITURES, GNP, POPULATION, AND ARMED FORCES BY COUNTRY BY YEAR -Continued
MILITAR Y GROSS NATIONI,L M IL EX PEOPLE MI LEX GNP ARMED MI LE X A RMED EXPENDITURES PRODUCT -- per per FORCE s ARMED FOR CES
(MILEX) (GNP) GNP CAPITA CAPI TA Mill ion dollars a Million dollars b Constant Constant
FORCES per
Constant 1000 YEAR
Current f Constan t I % Mill ion do ll ars dollars t hous Current Constant dollars peop le
UPP!R VOL. TA 19&6 II 5 ~72 1112 1,29 11 1 929 1,08 84 3 1777 0,61 1967 II 5 21J6 1131 1,19 5,0111 1, OJ 87 l 1UO 0,60 1968 . II !i :'S111 411~ 11 !0 5,155 1,03 86 J 1777 0,58 1969 II 6 3116 465 1, 23 5,272 1,08 e8 II 11130 0,76 1910 5 7 383 489 1,31 5,1811 1,21 91 II 1625 0,1~
1971 5 6 JQ3 1111 1,30 5,1197 1 ,13 81 II 1550 0,13 l9T2 '!5 6 1106 473 1,3! 5,610 l. 12 8'1 5 1252 0,89 1973 6 6 3<19 1139 1,110 5·, 724 1, 01 71 5 1226 0,87 11t74 6 b 466 466 1~35 5,8110 1,07 80 5 12511 o,8t. 1975 13 u 541 495 2,42 5,958 2,01 83 5 2400 0. 811
URUGUAY 19U u H 1660 Z!HO 1,57 2,752 111,30 913 14 2814 5,09 1967 u 47 1630 2400 1,97 2,786 17.00 860 14 3379 S,OJ 1 9#l8 2ft n 1730 2440 1, ~u 2,820 13,00 8611 15 2453 5,)l 1969 36 48 1920 Z!J80 1,87 2,855 U 1 90 904 17 2841 5,95 19TO Ill! 53 2130 2'110 1,96 2,889 18,110 939 l8 lU1 II,ZJ
1CJT1 59 TZ 2220 2"0 2,66 z,ua 24,40 •u 19 3763 6,50 19Tl 53 61 2230 2590 2,~6 z,n• 20,70 816 20 1060 6,76 19U 58 u ~no 21120 2,113 z,qqz 21.30 877 zo 3185 11 1 68 19711 71 71 261'10 2680 2,66 3,025 23,60 81'11 25 28!i2 8,26 1915 73 61 lOUO 2780 2,40 1,059 21,80 909 25 2668 8,17
USSRCS!! SOVI!T UNION)
VENEZ UELA c 1966 1U 246 10700 16ZI'l0 2,15 9,550 25,70 1690 40 •uo "··· 1961 188 U7 11400 U8oo 2 1 38 9~865 28,10 1710 110 b925 11,05 1968 188 266 1281'l 0 18000 2.t1 10,189 26,10 1710 40 6650 3,93 1969 193 260 111000 18800 2,00 10,5~4 24,70 1780 110 6500 :S,8o 1<170 210 268 16300 20700 1,88 10,87J 211,70 1910 11'5 5•st. 41,14
1971 290 351 171100 21200 2,33 11,236 31,30 1880 Ll!l 7800 11,00 19U 2n 32!1 18800 21900 2,03 11,&12 28,00 1890 45 7222 3,88 19U 328 361 21300 231100 1 I CJ7 12,002 30,10 1950 50 7220 4,17 1974 '.504 504 2'5300 25SOO 1,n 12,40!5 110,60 20LIO '.50 10080 4,0J 197'5 '.5 :n ns 29800 2UOO a,oe 12,821 38,50 2130 5!3 89611 ta,a•
VIETNA~, NORTM 1966 330 !SOO 1500 2270 22,00 20,177 211,80 1U 256 1953 12,119 1 96'7 U!l "" 1400 2060 u -.zo 20 ,ne n,1o 100 418 1968 121! 458 uoo 1830 25,00 21,lU 21,b0 8b 4117
1146 20,17 102'5 21,0'
19419 ~00 403 1400 1880 21,110 21,657 18,b0 87 .,, eu Z2,0S 19'!'0 !Oil JU 1'500 1•10 20,00 22,11" 17,30 86 La '52 845 20,ta4
19T1 100 lU 1600 19110 18,80 22,573 1&,10 8b 455 800 zo,a 19'12 32'5 378 1300 1510 n,oo 23~003 16,40 66 U5 605 27,17 197:1 !90 319 U70 1110 21,!0 2l,L1111 13,60 u uo 506 26,88 19711 300 100 1STO 1370 21,•o U,8" U 1 60 !17 665 1151 27,83 1975 310 2811 1170 uso 22,60 u,sn 11,70 !I II tal u 11112 26,1111
52
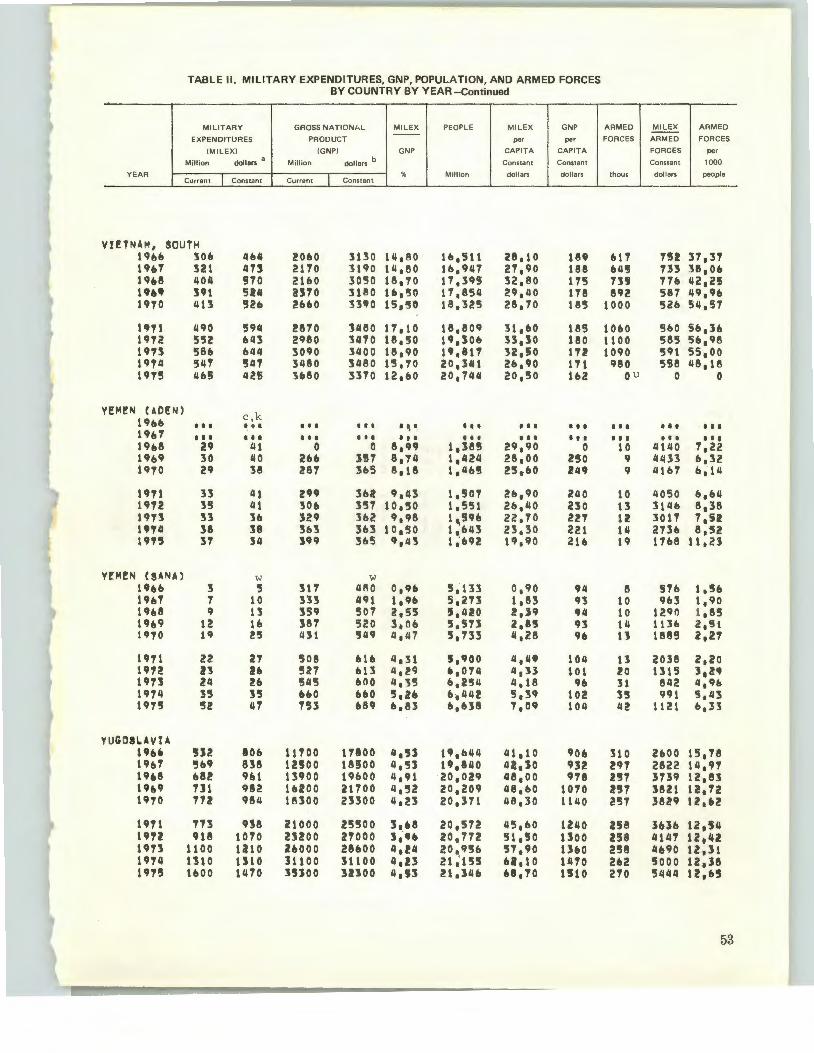
I' TABLE II. MILITARY EXPENDITURES, GNP, POPULATION, AND ARMED FORCES BY COUNTRY BY YEAR -Continued
t MILITAR Y GROSS NATIONh L MIL EX PEOPLE MILEX GNP ARMED M IL EX A RMED --- -EXP ENDITURES PRODUCT per pe r FORCES ARMED FORC ES
IM ILE XI I GNP) GNP CAPITA CAPITA FO RCES per
Million dollars a Million dollars b Constant Constant Constant 1000
t Y EAR Current f Constant I
% Mill ion dollars do ll ars thous dolla rs people Curre nt Constan t
VIETNAM, SOUTH 1966 ~06 4611 2060 ~130 14. 80 1&1511 28.10 18' 611 1U 3'7,37 1 9b'7 ~21 IIU 2170 3190 111.80 1&.947 27.90 188 645 '733 J8 1 0& 1968 4011 570 2160 3050 18170 17.395 32 1 80 175 735 77& 42.25 U69 591 5!11 a no 3180 16,50 17.8511 29,40 178 892 587 49,9b 1970 1113 '526 2660 33'0 15,50 18.325 28,70 185 1000 526 54,57
1971 490 594 28'70 31180 11,10 18.809 31.60 185 1060 560 56.36 19'72 552 643 29110 3470 18,50 19,SOb n,so 180 1100 585 56,98 1CJ75 58& 6114 3090 3400 18,90 19.117 32.150 172 1090 591 ss,oo 1974 54'7 5117 3480 54 80 15.70 20. ~ 41 2&.90 171 980 558 118,18
~ 1975 11&5 1125 3680 :53'70 12,60 20.7411 20.50 162 ou 0 0
YEM~N (ADEN) c,k 196& ••• ~ .. • • • • •• I \ I I I I f I I I I I • •• ••• t I t
19417 I I I I It I I I t t I I t f I I I • • • ••• It I I I I t I I
1968 29 41 0 0 8.99 1.38!1 29.90 0 10 4140 7,22 19&9 30 40 2b& U7 8,74 1,11211 28,00 250 9 4433 6,32 19'70 29 38 287 365 8,18 1,4Ml 25.&0 2119 9 41&7 &.14
1911 B 41 299 3U 9,113 1,507 2&.90 240 10 4050 &1 b4 1972 35 111 30& 357 1o.so 1,551 26,40 230 13 3146 8 1 38 , 1973 33 36 129 36Z 9 1 98 1,596 22,70 227 1Z 3011 7,52 U74 l8 38 363 3&3 10,50 1, &113 23.30 221 111 21lb 8,52 19Y5 37 34 H9 3b5 9,113 1,' &92 19.90 216 19 17&8 11,23
YEM~N (SANA) w w 19&6 3 5 317 480 0 1 96 s.n:s 0,90 911 8 57& 1,56 1967 7 10 333 491 1o9& s.zn 1,83 en 10 9b3 1,90
• 1968 9 13 359 507 2,55 ,,420 2,l9 94 10 1290 ,85 1969 12 1& 387 520 3,11& s. 5n 2.85 n 14 1136 2,'31 19'7'0 19 i!S 1131 5119 11,1.17 5, 733 4,28 9() 1J 1885 z ,2'7
1 9 '1'1 22 27 508 &1& 4,31 1,900 11,4CJ 104 13 2038 2,20 11J12 u :!6 527 &l~ 4,29 1>,011.1 4,33 101 211 1315 3,29 1913 24 26 !545 600 4, ·n &,254 4.18 96 31 81.12 4,96 1974 n 35 &bO &60 5,24 6,1.14! 5,3CJ 102 3'5 991 s.4:s 1975 52 47 753 489 6 1 83
• 4 1 US 1,09 1011 42 1121 &,33
YUGOSL.AVU U6e U2 806 11700 1'7800 4,'Jl 19,641.1 41,10 906 310 2&00 15,78 1967 5&9 838 1noo 1li!SOO 1.1,53 19,840 42,30 932 297 2822 14,97 1948 ()81! 961 13900 t9ooo 4,91 20,029 48,00 916 251 3'739 12,8J 1949 111 982 1UOO Z1700 11,52 20,209 48,b0 1010 ,., 3821 u, 72 1970 '712 984 18300 23300 4, 23 20,371 48,30 11110 257 3829 12,&2
• 1971 713 938 21000 25500 3,68 20,572 45,60 1240 258 JU& 12 1 54 1912 918 1010 2J200 21000 3,., 20,772 51,!50 tlOO 258 41117 12,42 1973 1100 U10 Z6000 2hOO 4,U 20.951> 51,90 1360 2!18 4&90 12,31 1974 lllO 1310 31100 31100 4,U 21~15'5 u,1o 1410 262 5000 l2,J8 1915 1000 1470 35100 32300 4,13 21.1116 68,10 1510 270 '511411 12. 6'5
t 53 u

-
TABLE II. MILITARY EXPENDITURES, GNP, POPULATION, AND ARMED FORCES BY COUNTRY BY YEAR -Continued
MIL ITAR Y GROSS NATION A L MILE X PEOPLE MILEX GNP ARMED MI LEX ARMED --- -EXP ENDITU RES PRODUCT per per FORCES ARMED FORCES
(M ILE X) (GN P) GNP CAPITA CAPITA FORCES per
Mill ion dollars a Million dollars b Constant Constant Constant 1000
YEAR Current I Co nstant I
% Million dollars doll ars thous Current Constant
doll ars people
HIRE 19&& 8& 1:51 11.11.10 2190 5,9q 17,130 .,,.'5 1!8 25 521.10 1,4&
19&7 b1 99 1480 2180 4,52 17,h0 5 1 61 121.1 35 2814 1, 99
19118 '57 80 1610 2270 3, 53 17,99& 4,4& 12b so U17 1,01
19&9 . ., 90 1840 2410 3,114 18,430 4,89 1:34 1.15 2002 2,44
1970 113 141.1 21/.10 2720 ~.30 18,8&1 7,&5 144 115 3200 2,39
19'11 108 t11 2/.110 2920 4,118 1•,n1 &,18 151 45 2911 2,!3
1972 109 121 2540 UbO 1.1,!9 19,747 .,43 1 ~0 ' 4'5 2822 2,28
1973 8'5 9/.1 2890 3180 2,91.1 20,214 4,b2 1'57 b') v 1438 3,22
19711 1&7 1b1 3330 JllO 5 ,02 20,095 8,07 lb1 bO 2783 2,90
1915 143 131 3550 3250 4,0:3 l1,191 ~.t8 153 55 2382 2,60
!At-4 8 IA 19bb 22 33 1330 2020 1,b4 3, 773 8,79 53& t1 SOl8 z,•z 1h'T 20 2'1 \U!50 2140 1,3'5 3,88'5 1,4b 551 10 uoo 2,57
19&8 Zb n 1'570 2210 li118 3,999 9,2& 553 11 }3&4 2,75
19&9 1!! 2/.1 1130 !320 1,02 4,118 '1, 72 5&3 11 21lb 2,01
19'10 Jb lib uoo 21130 1,89 11,240 10,80 '572 12 38 .'53 2,83
1 9'11 92 111 19/.10 2350 4,'1:3 1.1 ~ 3&7 25,1.10 538 13 8538 2,98
1972 115 1311 UIIO 21190 5,3& 4,!00 29,10 5511 \1.1 9511 3,11
1973 1b !!4 2310 2540 3 ,31 CI,6H 18,10 148 1b 5250 3,45
19711 90 90 2710 2710 3 ,31 1.1,18£1 18,'10 !ibb 1b 59911 lil/.1
19'15 911 8b 28/.10 2&00 3,31 1.1,93& 17,1.10 527 1b 5515 J ,1!1.1
54
....______
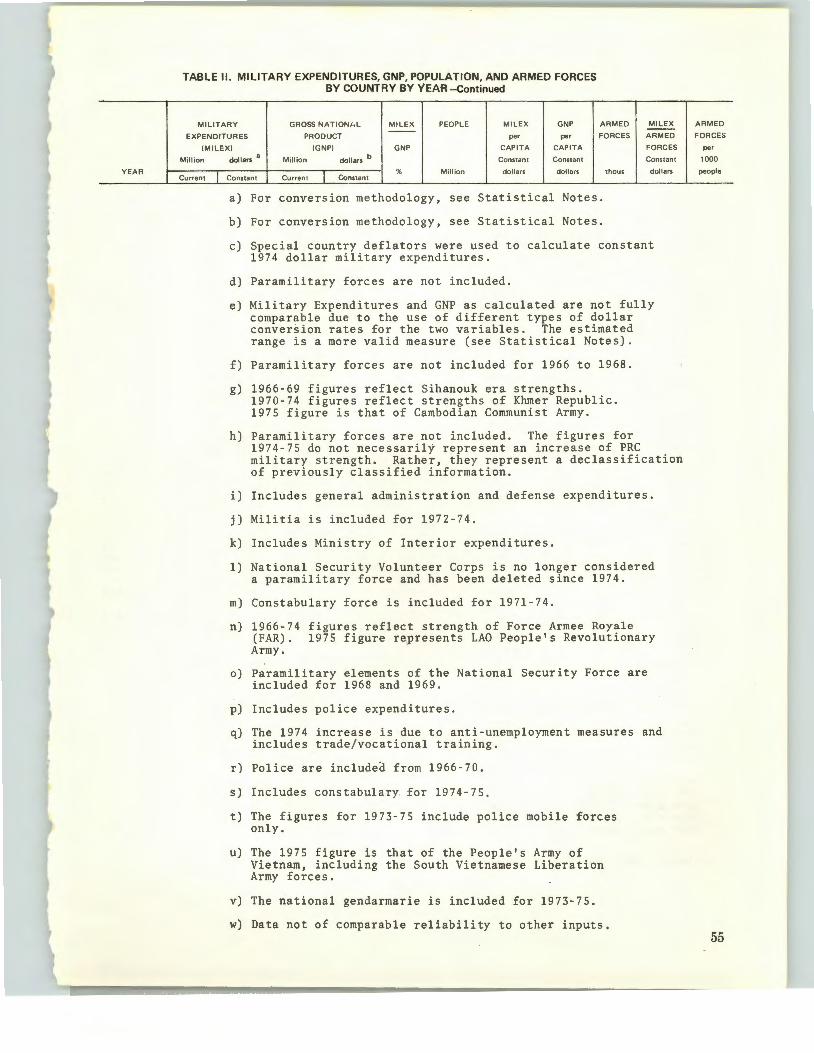
' I
YEAR
TABLE II. MILITARY EXPENDITURES, GNP, POPULATION, AND ARMED FORCES BY COUNTRY BY YEAR -Continued
MILITARY GROSS NATION/, L MILE X PEOPLE MILEX GNP ARMED MILEX --EXPENDITURES PRODUCT pe r
CAPITA
Constant
dollars
per
CAPITA
Constant
dollars
FORCES ARMED
IMILEX) I GNP) GNP FORCES
Constant
dollars
Million
Current I
dollars a Million dollars b
I %
Constant Current Constan t thous Million
a) For conversion methodology, see Statistical Notes.
b) For conversion methodology, see Statistical Notes.
c) Special country deflators were used to calculate constant 1974 dollar military expenditures.
d) Paramilitary forces are not included.
e) Military Expenditures and GNP as calculated are not fully compara?le due to the use of different types of dollar convers1on rates for the two variables. The estimated range is a more valid measure (see Statistical Notes).
f) Paramilitary forces are not included for 1966 to 1968.
g) 1966-69 figures reflect Sihanouk era strengths. 1970-74 figures reflect strengths of Khmer Republic. 1975 figure is that of Cambodian Communist Army.
h) Paramilitary forces are not included. The figures for 1974-75 do not necessarily represent an increase of PRC military strength. Rather, they represent a declassification of previously classified information.
i) Includes general administration and defense expenditures.
j) Militia is included for 1972-74.
k) Includes Ministry of Interior expenditures.
1) National Security Volunteer Corps is no longer considered a paramilitary force and has been deleted since 1974.
m) Constabulary force is included for 1971-74.
n) 1966-74 figures reflect strength of Force Armee Royale (FAR). 1975 figure represents LAO People's Revolutionary Army.
o) Paramilitary elements of the National Security Force are included for 1968 and 1969.
p) Includes police expenditures.
q) The 1974 increase is due to anti-unemployment measures and includes trade/vocational training.
r) Police are included from 1966 -7 0.
s) Includes constabular~ for 19 74- 75.
t) The figures for 1973-75 include police mobile forces only.
u) The 1975 figure is that of the People's Army of Vietnam, including the South Vietnamese Liberation Army forces.
v) The national gendarmarie is included for 1973-75.
w) Data not of comparable reliability to other inputs.
ARMED
FORCES
per
1000
people
55

TABLE Ill. ARMS TRA~ERS BY G~OUP AND REGION B_Y YEAR (Millions of dollars) .
EXPORTS IMPORTS
YEAR Current l Constant dollars dollars
Current l Constant dollars dollars .
WORLD TOTALS 1966 4660 7070 4660 7070 1967 5050 7440 5050 7440 1968 5310 7490 5310 7490 1969 5850 7850 5850 7850 1970 5850 7450 5850 7450
1911 6350 7700 6350 7700 1972 8700 10130 8700 10130 1973 9570 10530 9570 10530 1-}74 9290 9290 9290 9290 197!3 9720 8890 9720 8890
DEVELOPED 1966 4460 6770 1490 2260 1967 4860 7160 1670 2460 1968 5120 7220 1690 2380 1.969 5680 7620 1970 2640 1970 5620 7160 1720 2190
1971 6070 7360 1670 2030 1972 8240 9590 2080 2420 1973 9250 10180 1510 1660 19H 8830 8830 2620 2620 1975 9270 s480 2600 2380
DEVELOPING 1966 200 300 3170 4810 1967 190 280 3380 4980 1968 190 270 3620 5110 1969 170 230 3880 5210 1970 230 290 4130 5260
1971 280 340 4680 5670 1972 460 540 6620 7710 1973 320 350 8060 8870 1974 460 460 6670 6670 1975 450 450 1120 6510
wARSAW PACT 1966 1979 300'+ 737 1119 1967 2270 3346 732 1078 '1968 1803 2547 601 849 1969 1385 1859 621 833 1970 1798 2291 621 791
1971 1913 2318 621 753 1972 2653 3091 1029 1198 1973 3030 3337 505 556 1974 3034 3034 1320 1320 1975 2846 2666 1230 1126
Totals do not add due to rounding.
56
-------.----------.-~--------· EXPORTS
YEAR Current 1 Constant
dollars ( dollars.
OTHI:.R EUROPEAN 1966 49 74 1967 6 9 1968 31 44 1969 14 19 1970 25 32
1971 84 102 1972 96 112 1973 70 '77 1974 91 91 1975 239 219
NATO EUROPE 1966 515 781 1967 285 420 1968 501 706 1969 574 711 1970 509 649
1971 518 629 1972 t214 1413 1973 1085 1194 1974 146b 1466 1975 1370 1253
NEAR EAST 1966 3 5 1967 a · 12 1968 13 18 1969 12 1o 1970 6 8
1911 2 2 1972 11 13 1973 31 34 1974 80 .eo 1975 98 90
AFRICA 1966 0 0 1967 5 7 1968 0 0 1969 2 3 1970 0 0
1971 1 1972 4 5 1973 0 0 1974 2 2 1975 3 3
IMPORTS
Current l c:~~::-dollars d~lars
107 ' 162 195 288 169 239 117 157 158 201
169 205 306 356 196 216 223 223 278 255
700 1062 812 1196 967 1364
1234 1656 1016 1296
1224 1484 1242 1447
868 956 1275 1275 1289 1179
314 476 556 820 624 sao 825 1107
1246 1588
1166 1413 1351 1573 4075 4483 3050 3050 3242 2970
227 3'+4 140 205 123 172 144 192 231 293
277 333 393 455 348 381 428 426 837 859
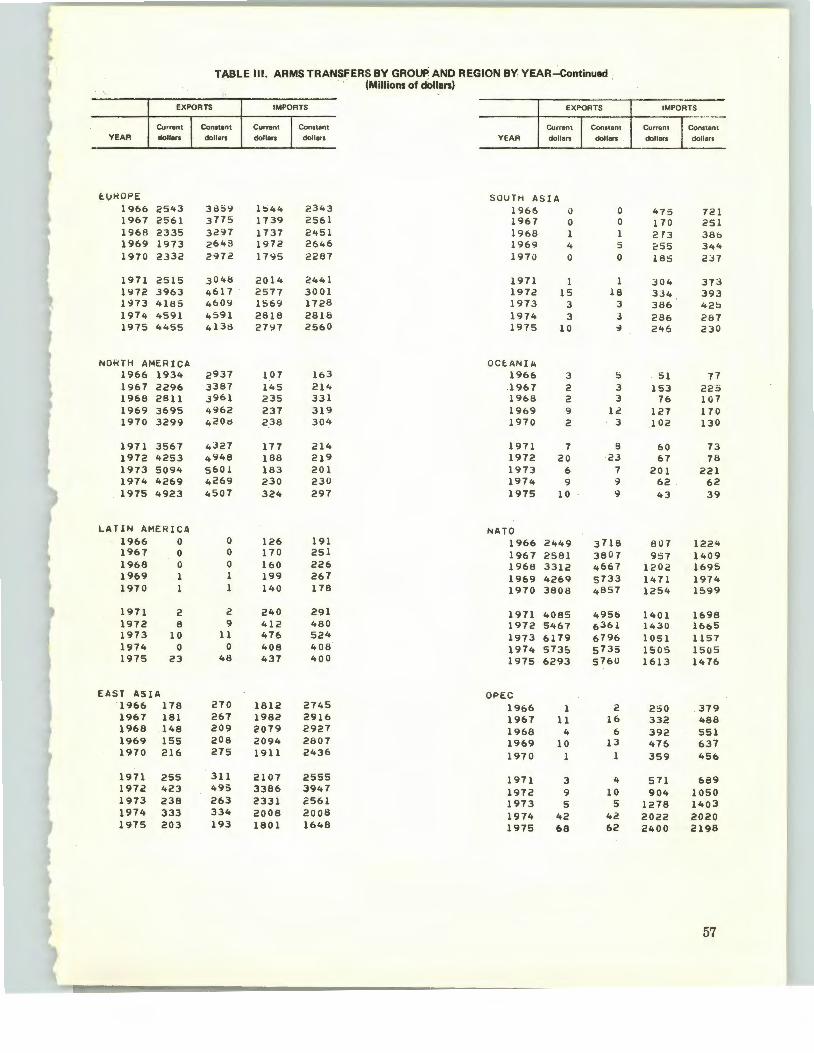
t ..
TABLE Ill. ARMS TRANSFERS BY GROUP AND REGION BY YEAR-Continued (Millions of dOllars)
EXPORTS IMPORTS EXPORTS IMPORTS
YEAR Current I Constant dollars dollars
Current I Constant dollars dollars YEAR
Current I Constant dollars dollars
Current I c:;::-dollars dollars
-
~ t:.lHWPE SOUTH ASIA
1966 2543 385':1 1~44 2343 1966 0 0 475 721 1967 2561 3775 1739 2561 1967 0 0 170 251 1968 2335 32':17 1737 2451 1968 1 1 2 73 38b 1969 1973 2643 1972 2646 1969 4 5 255 344 1970 2332 2972 17':15 2287 1970 0 0 185 237
1971 2515 3048 2014 2441 1971 1 1 304 373 1':172 3963 4617 2577 3001 1972 15 18 334 393 1973 4185 4609 1569 1728 1973 3 3 386 42S 1974 4591 4591 2818 2818 1974 3 3 286 287 1975 4455 4138 27':17 2560 1975 10 ., 246 230
NORTH AMERICA OCE.ANlA 1966 1934 2937 107 163 1966 3 5 51 71 1967 2296 3387 145 214 1967 2 3 153 225 1968 2811 3961 235 331 1968 2 3 76 107 1969 3695 4962 237 319 1969 9 ld 127 170 1970 3299 420d 238 304 1970 2 3 102 130
1971 3567 4327 177 214 1971 7 B 60 73 1972 4253 4948 188 219 1972 20 23 67 78 1973 5094 560! 183 201 1973 6 7 201 221 1974 4269 4269 230 230 1974 9 9 62 62 1975 4923 4507 324 297 1975 10 9 43 39
LATIN AMERICA NATO 1966 0 0 126 191 1966 2449 3718 807 1224 1967 0 0 170 251 1967 2581 3807 957 1409 1968 0 0 160 226 1968 3312 4667 1202 1695 1969 1 1 199 267 1969 4269 5733 1471 1974 1970 1 1 140 178 1970 3808 4857 1254 1599
' 1971 2 2 240 291 1971 4085 4956 1401 1698 1972 8 9 412 480 1972 5467 6361 1430 1665 1973 10 11 476 524 1973 6179 6796 1051 1157 1974 0 0 408 408 1974 5735 5735 1505 1505 1975 23 48 437 400 1975 6293 576ll 1613 1476
EAST ASIA 'OPEC 1966 178 270 1812 2745 1966 1 2 250 379 1967 181 267 1982 2916 1967 11 16 332 488 1968 148 209 2079 2927 1968 4 6 392 551 1969 155 208 2094 2807 1969 10 13 476 637
t 1970 216 275 1911 2436 1970 1 1 359 456
1971 255 311 2107 2555 1971 3 4 571 689 1972 423 495 3386 3947 1972 9 10 904 1050 1973 238 263 2331 2561 1973 5 5 1278 1403 1974 333 334 2008 2008 1974 42 42 2022 2020
~ 1975 203 193 1801 1648 1975 68 62 2400 2198
~
l 57
L___
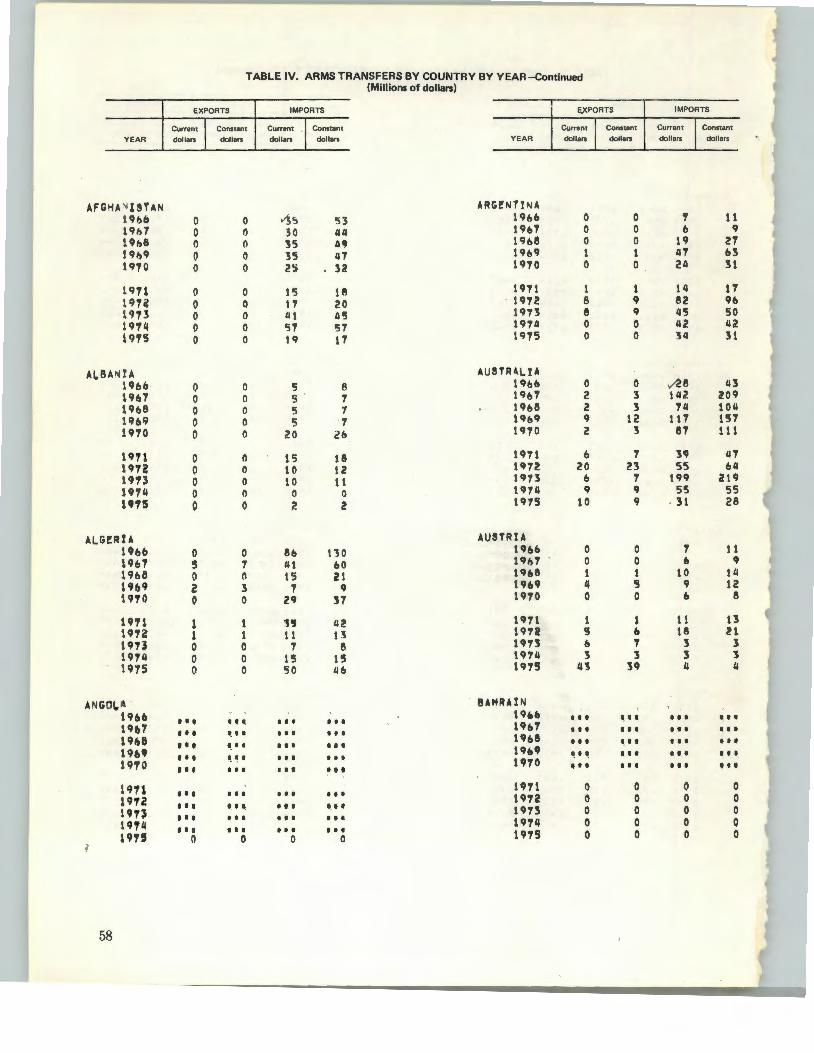
YEAR
AFGHA '.I l!UN 1960 19&7 19&6 19tJ9 1970
1971 197~ 1973 191'1 19T5
AI.BAIIIU 196& 1967 1968 19&9 1910
19'11 1'112 1'113 19711 UTS
ALGERIA 1ho 19&7 19&8 l9o9 19'10
19'7'1 191~ 19-rJ 1914 1915
ANGOI.~ 19bb 19&7 19&15 196' 1910
19'11 l91l 19U 1914 l9U
58
TABLE IV. ARMS TRANSFERS BY COUNTRY BY YEAR-Continued (Millions of dollars)
EXPORTS
Current I Constant dollars dollars
0 0 0 0 0 0 0 0 0 0
0 0 (l 0 0 0 (l 0 0 0
0 0 0 0 0 0 0 II 0 ()
0 0 0 0 0 0 0 0 0 0
0 0
' 7 0 0 z 3 0 0
1 1 1 1 0 0 0 0 0 0
I I t I f t
• • • '· .. ' .. ~·· ' .. ~~· • • • f I I
I I I ••• I It I , I I. I I I I t t
t I I I I I
0 0
IMPORTS
Current I Constant dollars dollars
113 :. 53 30 il4 35 II. 35 47 2S 32
15 Ul 1 ., 20 lit 45 ~1 57 19 11
5 8 5 7 5 7 5 1
20 2&
15 18 10 12 10 11
0 0 2 z
8& no 41 &0 15 Z1
7 9 29 37
n 4! 11 tl
7 8 15 1'5 so llfl
••• f I f
• •• • •• It I .,. I I I ••• t I t ••• t t I t I I
I I I "' .. f I t t I f
I I I I I I
0 0
!;.X PORTS
YEAR Current I Constant dollars dollars
ARG!!NT!fllA 19&& 0 0 19&7 0 0 19&8 0 0 19&9 1 l 1970 0 0
1911 1 1 1972 8 9 1913 8 9 19711 0 0 1975 0 0
AU!TR4L!A 19&6 0 0 19&7 2 3 19&8 2 3 19&9 9 12 1970 2 3
1971 b 7 1972 20 23 1973 b 7 19711 9 9 1975 1 0 9
AUSTRU 19&& 0 0 19&7 0 0 19&8 t 1 un II 5 1970 0 0
1971 t 1 1912 5 0 19U 0 1 19'74 '5 3 1975 43 39
BAHRAIN 19&fl • • • -.. 19fl7 I It t I t
19&8 I I I I, t I
19&9 I, I \ f I t
1970 • • • ••• 1911 0 0 1972 0 0 1913 0 0 1 9T4 0 0 1975 0 0
IMPORTS
Current I Constant dollars dollars
, 11 b 9
19 27 117 &3 211 31
14 11 82 9& 115 50 112 42 34 31
\1'28 43 1112 209
74 1011 117 157
87 111
39 117 55 ou
199 219 55 55
' 31 28
1 t 1 b 9
10 1ll 9 12 b e
1 t 13 18 21
3 3 3 3 II 4
• •• • •• I t I ••• ••• • •• I t I I I I
• •• • •• 0 0 0 0 0 0 0 0 0 0
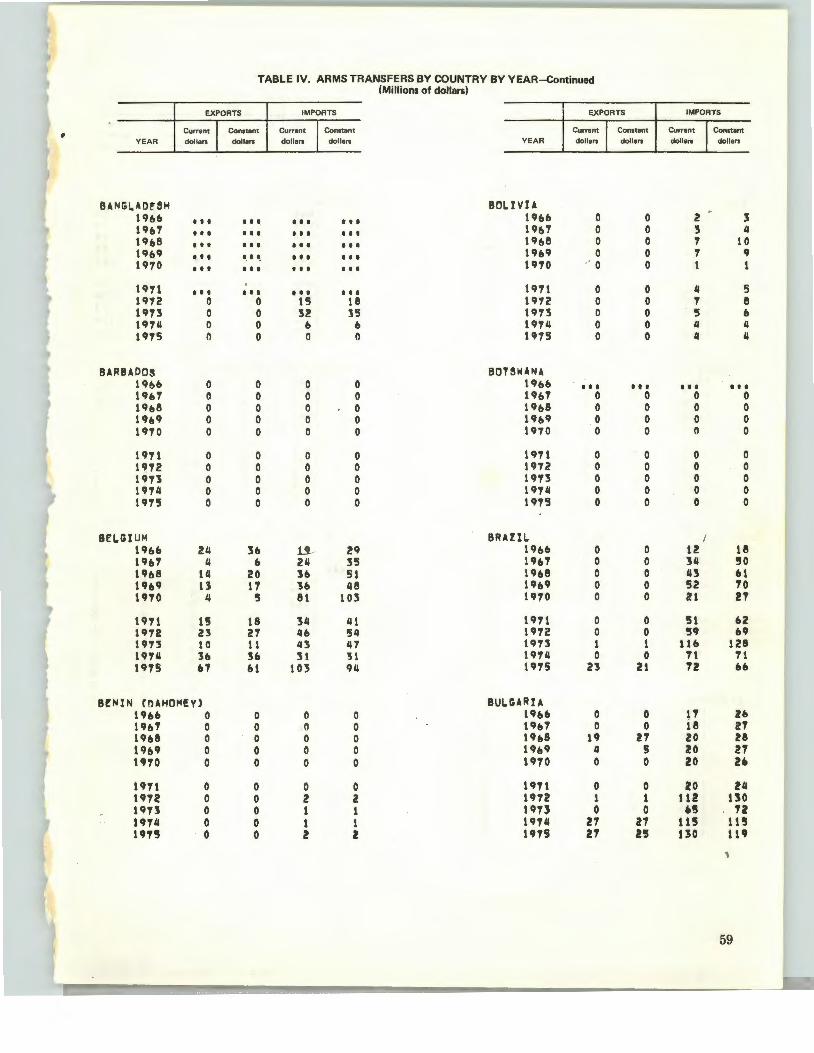
• YEAR
BANGL.AO~SH 19&& 19&7 19&8 t9o9 1970
1971 1972 1973 1974 19'15
BARBAOO~ 19&0 19&7 19&8 19&9 1970
1971 1972 1973 1974 1975
BE.'L.QIUM 19&& 19&7 19&8 19&9 19'10
1971 1912 1973 19'14 1915
TABLE IV. ARMS TRANSFERS BY COUNTRY BY YEAR-Continued (Millions of dollars)
EXPORTS
Current I Constant dollars dollars
I I I I I I
I I I I I I
t t I I I I
I I I I I I
••• t I I
••• I t t
0 0 0 0 0 0 0 0
0 0 0 0 0 0 0 0 0 0
0 0 0 0 0 0 0 0 0 0
24 3& 4 0
14 20 13 17
4 5
1'J 18 Z3 27 10 11 30 3& u 01
IMPORTS
Current I Constant dollars dollars
I I I I I I
t I I I I I
I I I I I I
I I t ••• ••• t t I
I I t t t I
15 18 32 35
b b 0 0
0 0 0 0 0 0 0 0 0 0
0 0 0 0 0 0 0 0 0 0
U- 29 24 35 3& 51 3& 48 81 103
34 41 4& 54 43 47 31 31
103 94
E..XPORTS
YEAR Current I Constant dollars ~Iars
BOLIVIA 19&0 0 0 19o7 0 0 19&8 0 0 19o9 0 0 1970 · o 0
1971 0 0 1972 0 0 1973 0 0 1914 0 0 1975 0 0
BOT~WANA 19&& t t I ••• 19o7 0 0 19&8 0 0 19&9 0 0 1970 0 0
1971 0 0 1972 0 0 1973 0 0 1974 0 0 1975 0 0
BRHIL. 19&o 0 0 19o7 0 0 19&8 0 0 19&9 0 0 1910 0 0
1911 0 0 1972 0 0 1973 1 1 1974 0 0 1975 23 u
BENIN (OAHOM!Y) BUL.GARU 19o& 0 0 0 0 19o& 0 0 19&7 0 0 0 0 1907 0 0 19&8 0 0 0 0 19&8 19 27 19b9 0 0 0 0 19&9 4 s U70 0 0 0 0 1970 0 0
19'11 0 0 0 0 1911 0 0 19'7'2 0 0 2 2 1912 1 1 19U 0 0 1 1 19U 0 0 1974 0 0 1 1 1974 21 l1 1975 0 0 2 2 1915 21 !5
IMPORTS
Current I Constant
dollars t dollars
2 3 3 4 7 10 7 9 1 1
4 5 1 8 5 0 4 4 4 4
I I I I t I
0 0 0 0 0 0 0 0
0 0 0 0 0 0 0 0 0 0
I 12 18 34 !50 43 &1 52 10 21 21
51 &Z 59 09
116 128 71 71 12 00
l7 26 i8 27 20 28 zo 27 20 2•
zo Z4 112 uo os n
115 115 uo 119
59
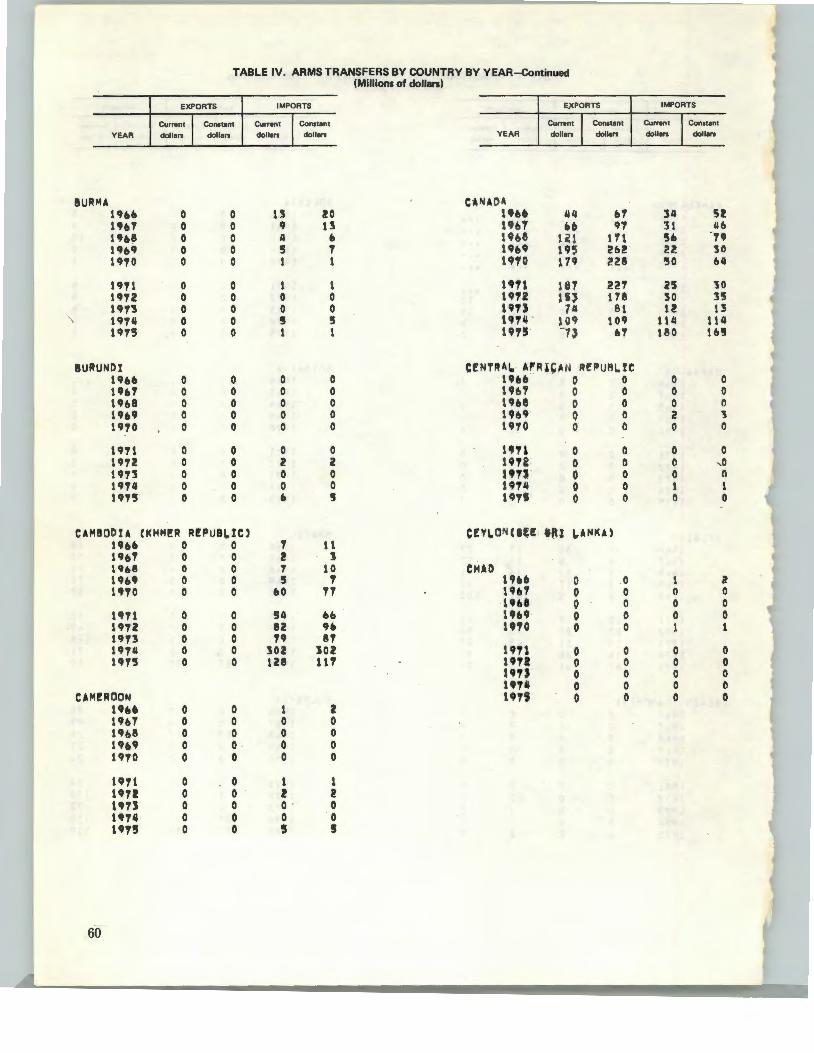
-
YEAR
BURMA ll?~~ uu 11?&8 19~9 11?70
11?11 19'72 1913 11?111 1915
BURUNDI 11?Mt 196'7 19~8 19&9 1910
1911 11?12 11?13 1914 1915
EXPORTS
TABLE IV. ARMS TRANSFERS BY COUNTRY BY YEAR-Continued (Millions of dollan)
IMPORTS E)( PORTS
Current I Constant dollars dollars
Current l Constant dollars dollars YEAR
Current l Constant dollars dollars
C~NA()A 0 0 1! 20 u~• '14 "' 0 0 q 13 19U 0~ . ., 0 0 4 ~ 11?b& 1,1 111 0 0 5 ., 1h9 195 C!~l! 0 0 1 l 11?10 179 228
0 0 1 1 1911 1U1 221 0 0 0 0 l9U ,,, 178 0 0 0 0 un 711 81 0 0 5 5 1U4 · )09 109 0 0 1 1 1915 -n b1
C!NTRA~ A~Rl~A N R~~ UB ~tC 0 0 0 0 19U 0 0 0 0 0 0 19&1 0 0 0 0 0 0 uu 0 0 0 0 0 0 1969 Q 0 0 0 0 0 tUO 0 0
0 0 0 0 lUl 0 0 0 0 2 z un; 0 0 0 0 0 0 sn~ · 0 0 0 0 0 0 lfiT4 0 0 0 0 ~ 5 191,. 0 0
CAMBODIA (KMM!R RfPUB~IC) CEY~ON (Ir;f! i{'U !,.ANI< A) 19bb 0 0 1 11 1961 0 0 2 J Utt8 0 0 1 10 tHAD 11?&1? 0 0 5 1 1Ub 0 0 1910 0 0 60 11 lhT 0 0
lh8 0 0 1911 0 0 54 66 un 0 0 19'72 0 0 82 96 U10 0 0 un 0 0 19 81 1914 0 0 302 102 sn1 0 0 11?15 0 0 128 111 19?2 0 0
19TS 0 0 19141 0 0
CAM!ROON un 0 0 1966 0 0 1 2 19&1 0 0 0 0 19&8 0 0 0 0 19 •• 0 0 0 0 UTO 0 0 0 0
11?11 0 0 1 l li?U 0 0 2 2 s•n 0 0 0 0 1'T4 0 0 0 0 11?1! 0 0 5 !I
60
IMPORTS
Current l Constant dollars dollars
34 52 31 ~~~
50 "' 2l 50 50 ~~~
as 10 50 35 12 13
1111 ttll teo t&!
0 0 0 0 0 0 2 l 0 0
0 0 0 , o 0 0 1 1 n 0
1 il 0 0 0 0 0 0 1 1
0 0 0 0 0 0 0 0 0 0
I
,
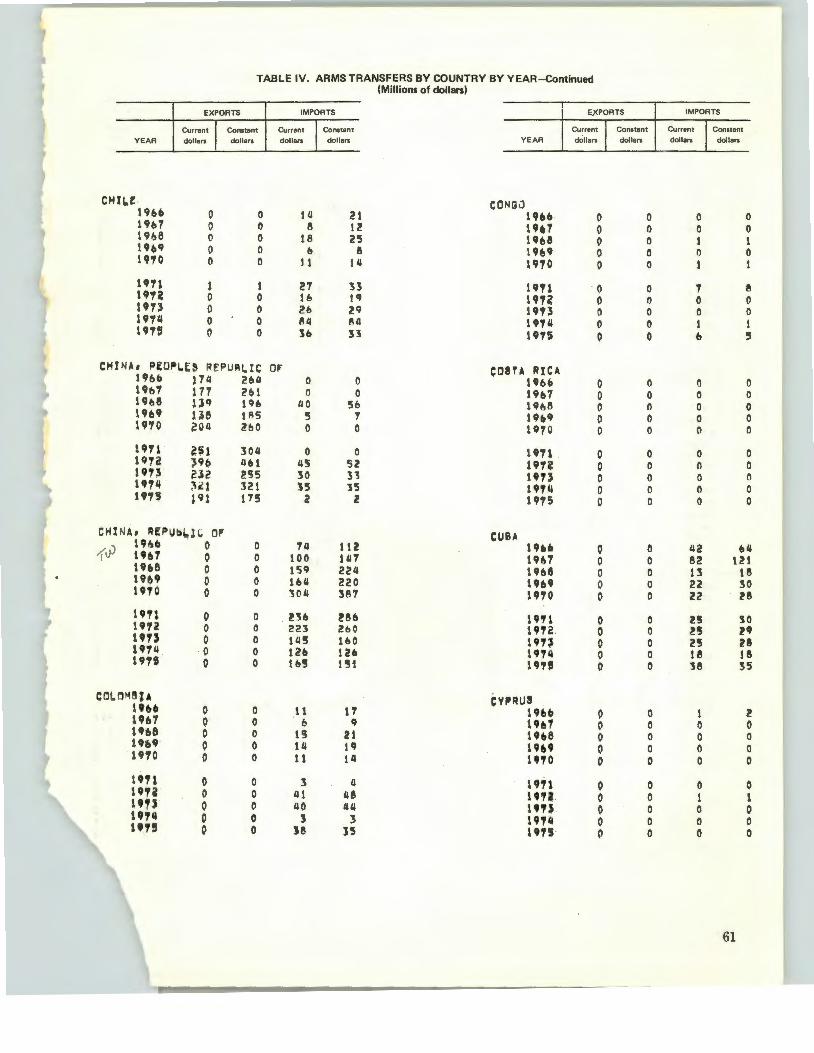
TABLE IV. ARMS TRANSFERS BY COUNTRY BY YEAR-Continued (Millions of dollars)
EXPORTS IMPORTS EXPORTS
Current I Constant Current J Constant Current Constant
dollars dollars dollars dollars YEAR dollars dollars YEAR
CMIL.f CONCh) 1966 0 0 111 21 19~0 0 0 1h7 0 0 8 tl! 1h7 0 I) 1%8 0 0 te 25 1CJ6& 0 0 1CJ6CJ 0 0 6 8 1969 0 0 1910 0 0 ! 1 14 1910 0 0
1911 1 1 27 !3 1911 0 0 uu 0 0 16 t<t un 0 0 191:S 0 0 2& 29 1913 0 0 1CJT4 0 0 811 811 1914 0 0 191S 0 0 Jo H U1S 0 0
CMINA, ~£0~~,~ REPUR~IC Of eosu 'HCA 196& P4 i!bll 0 0 Ubb 0 0 19b1 177 261 0 0 1967 0 0 19&8 lH 1116 110 Sb 19&8 0 () 19b9 U6 tFIS 5 ., 1969 0 0 1910 ~04 ilbO 0 0 1970 0 0
1971 ~51 304 0 0 1911 0 0 1972 )9(1 Llttl LIS 52 19U 0 0 19U ~lZ 255 30 3"5 un 0 0 1914 ~'1 321 15 35 19111 0 0 un ~91 175 2 z 1915 0 0
CHI NA, ~EPUo~lC Of CUBA 1966 0 0 711 ttl 1h6 0 0 { tiJ thT 0 0 100 147 19117 0 0 1h8 0 0 159 224 19b8 0 0 19~9 0 0 164 220 1969 0 0 1910 0 0 ,04 387 1910 0 0
1911 0 0 . 2:56 ~86 1'11 0 0 uu 0 0 223 2&0 1912. 0 0 un 0 0 14!1 too l9T~ 0 0 1914 . 0 0 126 126 1974 0 0 19, 0 0 16! 1~1 un 0 0
COLOMBIA r;VfJ~US uu 0 0 1 t 17 uu 0 0 1967 0 0 6 9 1h7 0 0 19b8 0 0 ts 21 1968 0 0 19(19 0 0 14 1CJ 19U 0 0 1910 0 0 t 1 111 UTO 0 0
19Tl 0 0 3 Ll UT1 0 0 19U 0 0 41 118 t•n · 0 0 UT) 0 0 40 114 un 0 0 19T4 0 0 l :s UT14 0 0 uu 0 0 )8 J5 11175· 0 0
IMPORTS
Current Constant dollars dollars
0 0 0 0 1 1 0 0 1 1
., 8 0 0 0 0 1 1 6 5
() 0 0 0 0 0 0 0 0 0
0 0 0 0 0 0 0 0 0 0
42 u 82 121 13 18 22 30 22 ze
2!1 lO l!5 29 2~ 28 18 18 '58 35
1 z 0 0 0 0 0 0 0 0
0 0 1 1 0 0 0 0 0 0
61
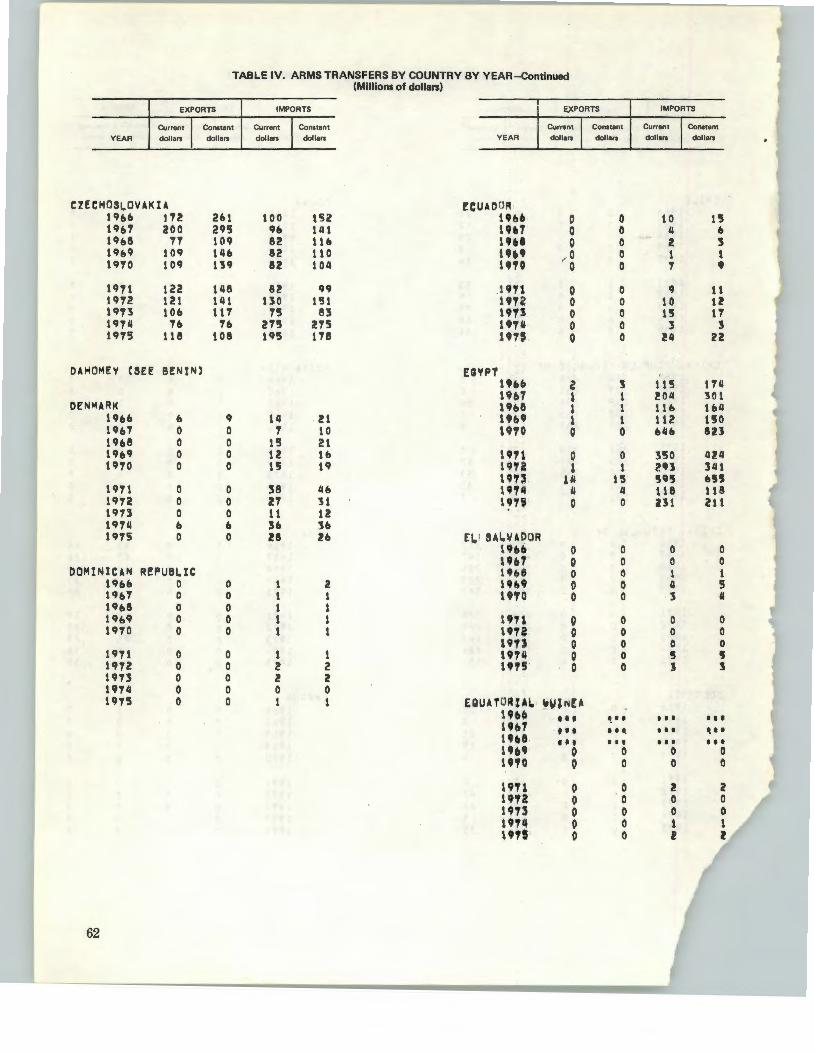
TABLE IV. ARMS TRANSFERS BY COUNTRY BY YEAR-Continued (Millions of dollars)
EXPORTS
YEAR Current I Constant dollars dollars
CZECMOSLOVAKU t9~o 112 2b1 19~1 200 295 19&8 71 109 19&9 109 14& 1970 109 139
U71 122 148 1972 121 141 19'73 10o 111 1974 1& 1& 1975 118 108
DAMOMEV CSEE BP:NtN)
DENMARK 19&o 0 C)
19&1 0 0 19&8 0 0 Uo9 0 0 1970 0 0
19'71 0 0 1912 0 0 1913 0 0 1974 0 0 1975 0 0
DOMINICAN RfPU8LIC 19o& 0 0 19&1 0 0 1CJoe 0 0 19&9 0 0 19'70 0 0
1911 0 0 1972 0 0 1913 0 0 19111 0 0 1975 0 0
62
IMPORTS
Current I Constant dollars dollars
100 152 CJo 141 82 11o 82 110 82 104
82 C) C) 130 1'51
15 83 215 215 195 178
14 21 1 10
15 21 12 to 15 19
38 4o 2'7 :u 11 12 3ft 3& 28 2&
2 1 1 1 1
1 1 2 2 2 2 0 0 1 1
EXPORTS
YEAR Current 1 Constant dollars dollars
fCUAO OR uo• 0 0 1 .. ., 0 0 1 ... 0 0 1969 ,.. 0 0 19'10 0 0
1'11 0 0 un 0 0 19U 0 0 l9TII 0 0 un 0 0
EGVP'!' 1 .. 0 z J 1U1 1 1 19o8 1 1 190' 1 1 1970 0 0
1911 0 n 1972 1 1 191) lU 1!5 1974 u 4 1~11 0 0
El, ! SAI.VAOOR lhfJ 0 0 lhT 0 0 19&8 0 0 19U 0 0 1UO 0 0
un 0 0 ltU 0 0 19U 0 0 l97'1 0 0 1915' 0 0
EQUUORUI. !J~%NEA 196(1 t I I ~·· 1hT ••• . . ·-191)8 I I I I I I
""' 0 0 1no 0 0
19'11 0 0 tna 0 0 1~U 0 0 19'CI 0 0 1tU· 0 0
IMPORTS
Current I Constant dollan dollars
10 15 4 0 2 5 1 1 1 9
C) 11 10 u 15 11
3 5 24 zz
115 114 ~04 301 110 104 112 uo uo 8U
350 424 (!93 ]41 !'5 o~s 118 118 l31 211
0 0 n 0 1 1 4 5 3 " 0 0 0 0 0 0 5 ~ 3 :1
I I I I I t
I I I , .. I I I Ill
0 0 0 0
2 2 0 0 0 0 1 1 2 z

,
t t
' t
' ' t
~ t
• • ~
TABLE IV. ARMS TRANSFERS BY COUNTRY BY YEAR-Continued (Millions of dollars)
EXPORTS IMPORTS EXPORTS
Current I Constant Current I Constant Current I Constant
YEAR dollars dollars dollars dollars YEAR dollars dollars
GABO~ ETHIOPIA 19&6 0 0 0 0 19&6 0 0 196'7 0 0 0 0 196'7 0 0 1968 0 0 0 · 0 1968 0 0 1969 0 0 0 0 1969 0 0 1970 0 0 0 0 1970 0 0
1971 0 0 1 1 1911 0 0 1972 0 0 2 a 1972 0 0 1973 0 0 0 0 1973 0 0 19111 0 0 0 0 191" 0 0 19'15 0 0 1 1 1975 0 0
GAMBIA, THE I'JJI 1966 0 0 0 0 191!1) ••• I I I 19&1 0 0 0 0 1967 ••• I , t I 1968 0 0 0 0 19&8 • • • I . I I 1969 0 0 0 0 1969 ••• • •• 1970 0 0 0 0 1970 0 0
1971 0 0 0 0 1911 0 0 1972 0 0 0 0 1972 0 0 197~ 0 0 0 0 197~ 0 0 19711 0 0 0 0 1974 0 0 1975 0 0 0 0 19'15 0 0
GERMAN DEMOCRATIC R!PUBioiC G~ f'tNioANO 1966 5 8 1611 2119 1966 0 0 1941'1 s '7 1111 217 1967 0 0 19&8 6 8 126 1'78 1968 0 0 1969 6 8 126 169 1969 0 0 19'70 6 8 126 161 19'TO 0 0
1971 5 , U6 151 1 9'T1 0 0 1912 z 2 ~20 31J 19'72 0 0 un 1 1 105 lU 19'T3 0 0 19'74 2 2 1110 410 19711 1 1 19'7! 8 . '7 3'10 338 19'T5 2 2
G!RMANY, l'fOI!:RAio R!ltUBioiC 011: G~
I'RANC! t«J66 68 103 ~02 106 1966 21tY 326 196'7 58 85 189 278 19&'7 8b 127 19&8 911 138 8'7 1U 19&8 181 255 1969 1 01 136 210 28Z 1969 216 290 1970 189 2111 211 269 U70 198 252
1971 130 U8 3!!10 4211 1911 154 18'7 19n 226 263 2611 312 1972 5SII 622 1913 26 n 21T 305 1913 !!1611 1121 19'TII i!U 221 4'70 11'7'0 U'74 !561 561 -: 1975 2!!1'7' 235 1183 11112 191!!1 5011 4U
IMPORTS
Current I Constant dollars dollars
11 1'7 13 19 19 2'7 12 16 13 17
12 15 15 18 10 t1 111 !'II 32 29
I I I I I I
I I I ••• ••• • •• I f I ••• 0 0
0 0 0 0 0 0 0 0 0 0
16 211 u 22 15 21 15 !0 15 19
10 12 10 12
1 1 Zb 26 15 111
z~ 35 22 Jl 15 21 15 !0 10 u
9 11 18 21 15 1'7 u 23 Z9 2'7'
63

YEAR
GHANA 19b& 19&7 1968 19&9 1970
1971 1972 19'73 1974 197'5
GREECE 19&& 19&7 19&8 19&9 1910
1911 197~ 1913 1974 1915
GUATEMALA 19&& 19&7 1'Jb8 19&9 1970
1971 1972 1913 1974 1975
GUINEA 19&& 19&7 19&8 19&9 1970
1911 1912 1973 1914 1915
64
TABLE IV. ARMS TRANSFERS BY COUNTRY BY YEAR-continued (Millions of dollars)
EXPORTS
Current I Constant dollars dollars
0 0 0 0 0 0 0 0 0 0
0 0 0 0 0 0 0 0 0 0
0 0 0 0 0 0 0 0 0 0
0 0 0 0 0 0 0 0 0 0
0 0 0 0 0 0 0 0 0 0
0 0 0 0 0 0 0 0 0 0
0 0 0 0 0 0 0 0 0 0
0 0 0 0 0 0 0 0 0 0
IMPORTS
Current I Constant dollars dollar$
1 2 0 0 b 8 0 0 0 0
0 0 ~ 2 2 2 1 1 5 5
51 77 b'1 99 57 eo
139 187 155 198
2&9 32b 201 241
49 54 1&9 1&9 194 171
1 2 z 3 1 1 2 3 1 1
11 13 l l 4 4 ~ 2 7 b
2 3 2 l 0 0 0 0 0 0
b ., 9 11 ., 8, b • 11 1b
E)( PORTS
YEAR Current I Constant dollars dollars
GUINEA-BISSAU 19&& t I t .. f I
19&7 I t I I t I
19&8 I I t t I I
19&9 I t I • ... 1970 I t t I I t
1971 ~I I I I I
19T2 t I I t,t~
1913 I I I I I I
1974 0 0 1975 0 0
GUYANA 19&& 0 0 19&7 0 0 19&8 0 0 19&9 0 0 1910 0 0
1911 0 0 1912 0 0 1973 0 0 1914 0 0 1915 0 0
HAl TI-19&& 0 0 19&7 0 0 19bB 0 0 1969 0 0 1910 0 0
1911 0 0 1912 0 0 1913 0 0 1914 0 0 1915 0 0
HONOUR AS 19&& 0 0 19117 0 0 19&8 0 0 19&9 0 0 1910 0 0
1911 0 0 1972 0 0 1913 0 0 19741 0 0 1915 0 0
IMPORTS
Current I Constant dollars dollars
• • • ••• ••• t t I
I t t t I t
t I t I I I
I I I I t I
I I I I I I
••• t f I
f I I I I I
0 0 5 5
0 0 0 0 0 0 0 0 0 0
0 0 0 0 0 0 0 0 2 ~
0 0 0 0 0 0 0 0 0 0
0 0 1 1 1 1 0 0 0 0
1 2 1 1 1 1 b 8 1 1
0 0 1 1 1 1 1 1 3 s
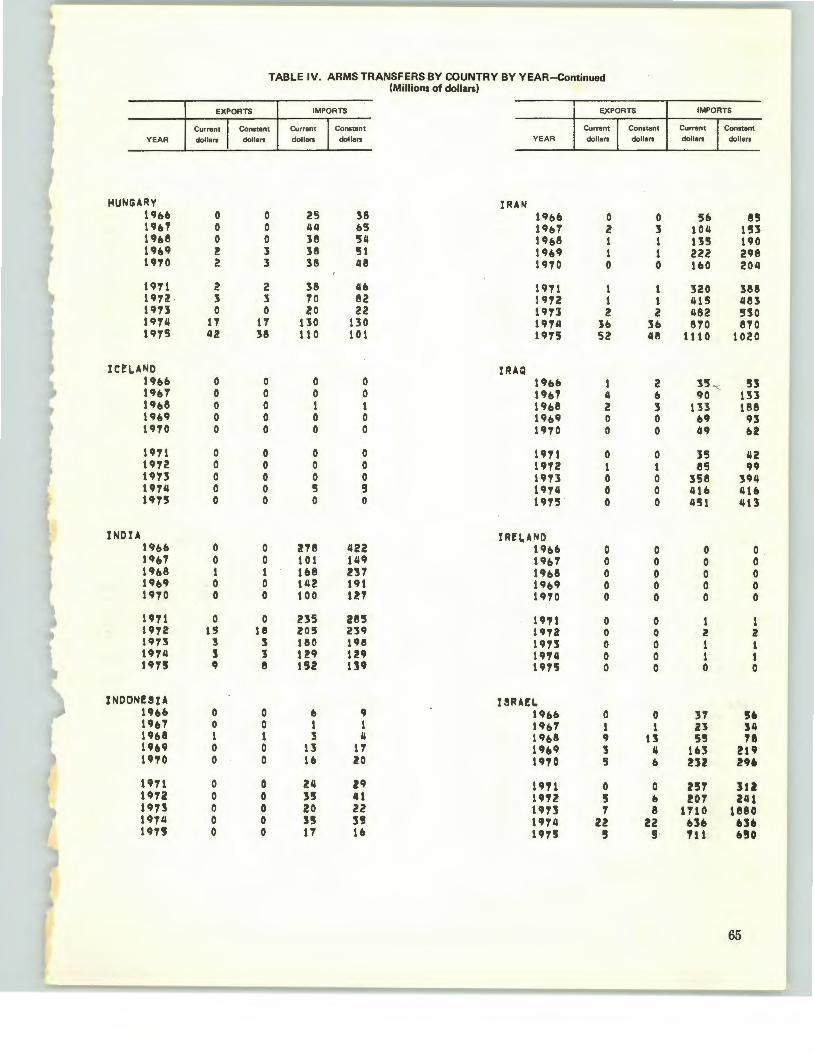
YEAR
HUNGARY 19bb 19&'7 19&8 19&9 19'70
1911 19'12 19'73 19'7'4 19'75
I CEL.ANO 19&& 19b'7 19&8 19&9 19'70
19'71 19'72 19'73 19'74 19'75
INDIA 1 96(, 19b7 19&8 1969 1970
1 9'71 19'72 19'1'3 1974 un
INDONeSIA 19&6 1CJ67 19&8 19&9 1CJ10
1971 19'72 191! 1974 un
TABLE IV. ARMS TRANSFERS BY COUNTRY BY YEAR-Continued (Millions of dollars)
EXPORTS
Current I Constant dollars dollars
0 0 0 0 0 0 i! 3 2 3
2 2 3 3 0 0
1'7 11 42 38
0 0 0 0 0 0 0 0 0 0
0 0 0 0 0 0 0 0 0 0
0 0 0 0 1 1 0 0 0 0
0 0 1!1 te
3 3 3 3 9 8
0 0 0 0 1 1 0 0 0 0
0 0 0 0 0 0 0 0 0 0
IMPORTS
Current 1 Constant
dollars I dollars
25 38
"" &5 38 54 38 51 38 48
38 46 '70 82 20 22
130 130 110 101
0 0 0 0 1 1 0 0 0 0
0 0 0 0 0 0 5 5 0 0
2'78 422 101 149 168 237 142 191 100 1!1
235 285 Z05 239 180 198 129 129 !52 U9
6 9 1 1 3 4
13 11 16 20
24 29 3!5 41 20 22 35 ss 17 1b
EXPORTS
YEAR Current I Constant dollars dollars
IRAN 19bb 0 0 19&7 2 3 19&8 1 1 19&9 1 1 19'7'0 0 0
1911 1 1 19'72 1 1 19'71 2 i! 19'74 36 3& 19'75 52 48
IRAQ 19&& 1 2 19ts'7 " b 19&8 2 3 19&9 0 0 19'70 0 0
19'11 0 0 19'7 2 1 1 1913 0 0 19'74 0 0 19'75 0 0
IREL,ANO 19&6 0 0 19ts'7 0 0 1968 0 0 1969 0 0 1970 0 0
1911 0 0 197Z 0 0 un 0 0 19'14 0 0 1915 0 0
ISRAH 19&& 0 0 1967 1 1 1968 9 13 1969 3 4 1910 5 b
1911 0 0 1912 5 b 1973 '7 8 1974 22 22 1975 ' !l·
IMPORTS
Current I Constant dollars dollars
5& 85 104 153 us 190 222 298 160 204
320 388 415 483 482 530 8'70 8'70
1110 1020
35 - 53 90 tll
133 188 69 93 49 62
35 42 85 qq
358 394 41& 416 451 413
0 0 0 0 0 0 0 0 0 0
1 1 z 2 1 1 1 1 0 0
31 ,. 23 S4 55 18
163 219 2U 296
251 3U 201 241
1'71 0 1880 636 u• Ttl 6!!0
65
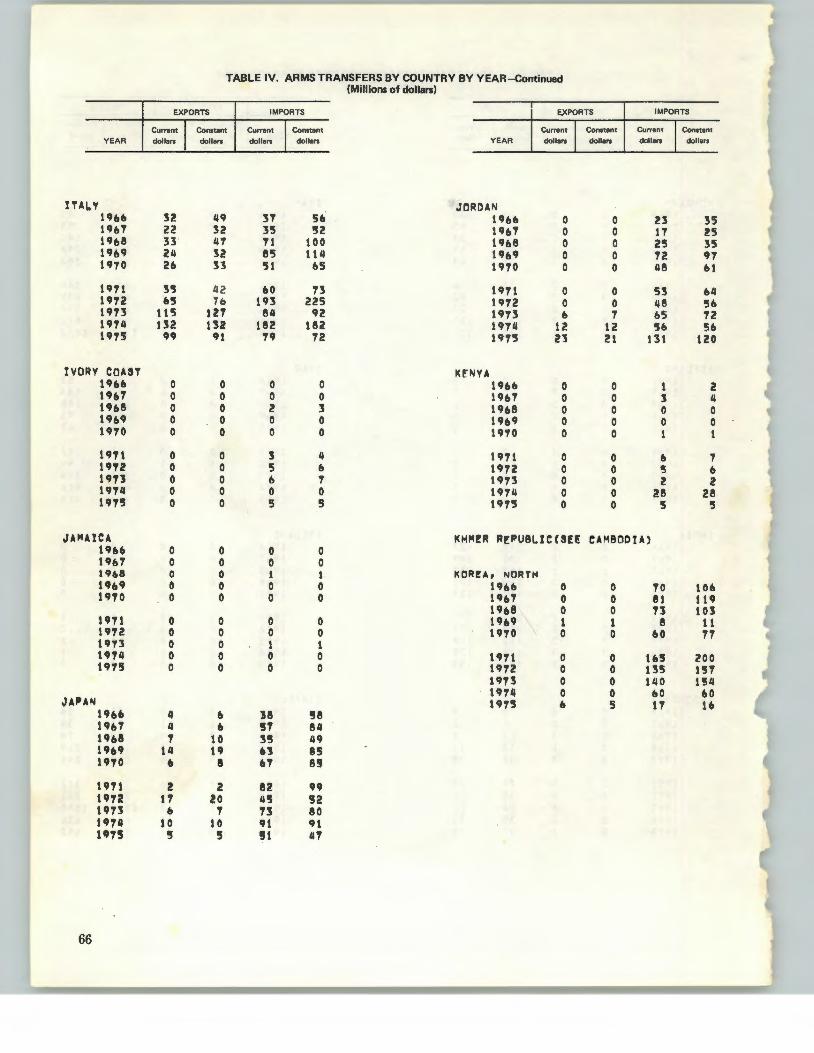
YEAR
ITAL.Y 19U 19&7 19&8 19&9 1910
1911 197l 1913 1974 1915
IVORY COAST 19&& 1CJ&7 1968 1969 1910
1911 un 1973 1974 1975
JAMAICA 1966 1 96'T 19&8 19&9 1970
1911 197l 19'7'3 1974 1915
JAPA"l uu 1967 19ft8 1969 19'70
19'7'1 1912 1973 1914 1915
66
EXPORTS
TABLE IV. ARMS TRANSFERS BY COUNTRY BY YEAR-Continued (Millions of dollars)
IMPORTS E;,XPORTS IMPORTS
Current I Constant dollars dollars
Current I Constant dollars dollars YEAR
Current I Constant dollars dollars
Current I Constant dollars dollars
JORDAN 32 49 31 56 19lt6 0 0 23 35 22 32 35 52 1967 0 0 11 25 33 47 71 100 19&8 0 0 25 35 24 32 85 114 19lt9 0 0 72 97 2& 33 51 bS 1970 0 0 48 &1
35 42 60 73 1971 0 0 53 64 65 7o 193 225 1912 0 0 48 '5&
11'5 121 84 92 1913 6 1 &5 T2 U2 132 182 162 19'1'4 12 12 5& 56 99 91 n 12 1CJ'75 l3 21 131 120
KENYA 0 0 0 0 19&6 0 0 1 2 0 0 0 0 1 9b'T 0 0 3 4 0 0 2 3 1966 0 0 0 0 0 0 0 0 1969 0 0 0 0 0 0 0 0 1970 0 0 1 1
0 0 3 4 1911 0 0 & 1 0 0 5 6 1 9'T2 0 0 '5 6 0 0 6 ., 1973 0 0 2 2 0 0 0 0 1974 0 0 28 28 0 0 5 5 1CJ75 0 0 5 5
K~M!R R~PUBLICCSEE CAMBODIA) 0 0 0 0 0 0 0 0 0 0 1 1 KOR!A, NORTH 0 0 0 0 11h& 0 0 10 10& 0 0 0 0 1CJ6 7 0 0 81 119
1968 0 0 '73 103 0 0 0 0 1969 1 1 8 11 0 0 0 0 19'7'0 0 0 60 17 0 0 1 1 0 0 0 0 lCJ71 0 0 U5 200 0 0 0 0 1972 0 0 us 1!57
un 0 0 140 1!54 1974 0 0 60 60 1975 b 5 17 16
4 6 38 58 4 & 57 84 7 10 35 49
14 19 u e5 6 8 u 85
2 2 82 99 17 !O 45 52
6 ' n 80 10 10 91 4H
5 !5 !IJl 41

YEAR
TABLE IV. ARMS TRANSFERS BY COUNTRY BY YEAR-continued (Millions of dollars)
EXPORTS IMPORTS ~<)(PORTS
Current I Constant dollars dollars
Current Constant Current Constant dollars dollars dollars dollars YEAR
KOREA, REPUBLIC 0, Lt:80TI10 1'1»6 0 0 1•n 2:51 U66 I I t I I I
un 0 0 lHT 320 1h1 0 0 1~U 0 0 323 115'5 1968 0 0 196~ 0 0 1129 5T6 19ts~ 0 0 1970 1 1 1'50 191 UTO 0 0
1911 1 1 223 210 1911 0 0 uu 2 2 '510 ~94 un 0 0 1973 0 0 152 1U 19U 0 0 19711 0 0 1111 1111 sn11 0 0 197'5 0 0 182 16ft 19,.5 0 0
KUWAIT LtBERU 196ft 0 0 1 2 Utsfl 0 0 19ft1 0 0 3 II 19&7 0 0 1968 0 0 0 0 19&8 0 0 1969 3 II 2fl 3!i 19&4 0 0 1970 0 0 1 1 UTO 0 0
1911 0 0 II 5 U1l 0 0 1912 0 0 26 30 UTI 0 0 19U 0 0 l 2 un 0 0 19711 0 0 2 2 19111 0 0 191'5 0 0 3! 29 un 0 0
LAOS I.~BVA 196ft 0 0 u 65 19h 0 0 1961 0 0 87 us U&,. 0 0 1968 0 0 T2 102 U68 0 0 1969 0 0 55 Til 19&9 0 0 1970 0 0 n 88 \910 0 0
1911 0 0 111 135 l9Tl .0 0 UT2 0 0 1n 121 1972 ;3 3 uu 0 0 ., 106 un 0 0 t 9'111 0 0 u u UTII 0 0 19,.'5 0 0 2Z zo UT'5 ~ J
L!ISANON L.UX!f'490URG 1961) 0 0 2 s 1'166 0 0 1961 0 0 0 0 Utt1 0 0 uu 0 0 311 48 1961 0 0 U&9 0 0 20 !1 U61J 0 0 19'10 0 0 II !I 19'1'0 0 0
SCJ,.l 0 0 3 4 1911 0 0 un 0 0 28 33 un 0 0 t~'I':S 0 0 u u uu 0 0 l9T4 0 0 ll 13 "'" 0 0 un 0 0 10 9 ttTS 0 0
IMPORTS
Current I Constant dollars dollars
I I I ••• 0 0 0 0 0 0 0 0
0 0 0 0 0 0 0 0 0 0
0 0 0 0 0 0 0 0 1 l
0 0 0 0 0 0 0 0 1 1
20 ;50 8 lZ 3 4
19 26 60 17
91 ttl! 1,. <!08 ztO U1 U9 159 361 no
0 0 0 0 0 0 0 0 0 0
0 0 0 0 0 0 1 1 8 1
67

YEAR
MADAGASCAR 196& 19&7 19&8 19&9 1970
1971 1972 1973 19711 1975
MALAWI 19&& 19&7 19&8 19&9 1970
1911 1912 1973 19111 U75
MALAYSIA 19&6 19&7 i'Jb8 1969 1910
U71 1912 1 91:5 1974 1975
MALI 1966 19(,'7 19&8 1969 19T0
1911 1912 nn 1CJT 4 1915
68
EXPORTS
TABLE IV. ARMS TRANSFERS BY COUNTRY BY YEAR-Continued (Millions of dollars)
IMPORTS ~PORTS
Current I Constant dollars dollars
Current I Constant dollars dollars YEAR
Current [ Constant dollars dollars
MALTA 0 0 0 0 19&b 0 0 0 0 0 0 19&7 0 0 0 0 1 1 19&8 0 0 0 0 0 0 19&9 0
" 0
0 0 0 0 1970 0 0
0 0 0 0 1971 0 0 0 0 0 0 1972 0 0 0 0 0 0 1973 0 0 0 0 0 0 19711 0 0 0 0 0 0 1975 0 0
MAURITANIA 0 0 0 0 19&6 ·o 0 0 0 0 0 19&7 0 0 0 0 0 0 19&8 0 0 0 0 0 0 19&9 0 0 0 0 0 0 1970 0 0
0 0 0 0 1911 (, 0 0 0 0 0 0 1912 0 0 0 0 0 0 197l 0 0 0 0 0 0 19711 0 0 0 0 2 2 U15 0 0
MAURITIUS 0 0 27 111 19&6 \I I ~I I.
0 0 e u 19&'7 I I I ••• 0 0 12 17 19&8 0 0 0 0 22 JO 19&9 0 0 0 0 5 b 1970 0 0
0 0 2& :sz 19'11 0 0 0 0 }9 115 1912 0 0 0 0 34 31 1975 0 0 0 0 211 24 1974 0 0 0 0 56 51 1975 0 0
MEXICO 0 0 2 l 1966 0 0 0 0 0 0 U6'7 0 0 0 0 0 0 1968 0 0 0 0 0 0 19&9 0 0 0 0 0 0 1970 0 0
0 0 1 1 1971 0 0 0 0 0 0 1912 0 0 0 0 1 1 1971 0 0 0 0 0 0 1914 0 0 0 0 8 ., 191!' 0 0
IMPORTS
Current I Constant dollars dollars
0 0 0 0 0 0 0 0 0 0
0 0 0 0 0 0 0 0 0 0
0 0 0 0 0 0 0 0 0 0
1 1 0 0 0 0 0 0 0 0
I I I ••• • • • • ••
0 0 0 0 0 0
0 0 0 0 0 0 0 0 0 0
1 2 1 1 2 J 5 '7 J 4
4 5 l J ., 8 ., .,
21 19

Y EAR
I>IO NGOl.tA nt~o 19b1 19ft! 19&9 1910
1911 197~ 1913 19'74 1915
MOR OCC O 19&& 19&7 19&8 19&9 19T O
19'11 197il 1973 19'74 1915
MO:zA r1 fi J Q U~ 19&& 19&7 19&8 19&9 1UO
1911 19'1~ 19'13 19'14 19'15
NEPAl. \ 96(1 19bT 19U 1h9 19'70
1911 191Z 19'13 19'14 19 '1!i
TABLE IV. ARMS TRANSFERS BY COUNTRY BY YEAR-Continued (Millions of cloiiM'I)
EXPORTS
Current I Constant dollars dollars
0 0 0 0 0 0
0 0 0 0
0 0 0 0 0 0 (I 0 0 0
0 n 0 0 ~ 0 0 0 0 0
0 0 0 0 0 0 l z 0 0
••• • •• I I I I 0 I
f If ••• ttl I I I!
It I ••• I t I , .. ••• I f I
t o I ••• ••• o o I
0 0
0 0 0 0 0 0 0 0 0 0
0 0 0 0 I) 0 0 0 0 0
IMPORTS
Current I Constant dollars dollars
0 0 0 0 , 0 0 0 0 0
0 0 0 0 0 0 0 0 0 0
1& 24 2& 38 15 Zt
b e 1 0 13
5 b ll 5 b 1
19 19 52 48
• •• I t I
••• I , I I . ... I I I
If I I , I I
t I I I o I
~I t ••• ••• • •• • • 0 • 0 •
•• 0 ••• 0 0
1 2 0 0 0 0 0 0 0 0
0 0 0 0 0 0 1 1 0 0
EXPORTS
YEAR Current I Constant dollars dollars
Nf.THERLANDS 19&& 2 3 19&7 10 15 19&8 12 11 19&9 18 24 19')'0 b 8
1971 3 4 1912 45 52 1973 34 3'7 1974 18 18 1915 &3 58
NEW ZEALAND 19&& 3 5 19&7 0 0 19&8 0 0 19&9 0 0 1970 0 0
1971 1 1 197'2 0 0 19'73 0 0 19'74 0 0 1975 0 0
NICARAG UA 19&& 0 0 19&'7 0 0 19&8 0 0 19&9 0 0 19'70 0 0
1 9'71 0 0 1972 0 0 19'75 0 0 19'74 0 0 19'75 0 0
NIGER 19&& 0 0 19&7 0 0 19&8 0 0 19&9 0 0 19'70 0 0
1971 0 0 19'72 0 0 1913 0 0 19'74 0 0 1915 0 0
IMPORTS
Current I Constant dollars dollars
81 123 28 41 28 40 55 '74 98 125
78 95 80 9;5 11 19 33 33 32 29
2 35 1 t 1&
2 :\ tO 1! 1'5 19
21 2& 12 14
2 2 7 7
12 11
0 0 1 1 0 0 0 0 1 1
1 1 1 1 5 b 0 0 2 2
0 0 0 0 0 0 1 1 0 0
0 0 0 0 0 0 0 0 0 0
69
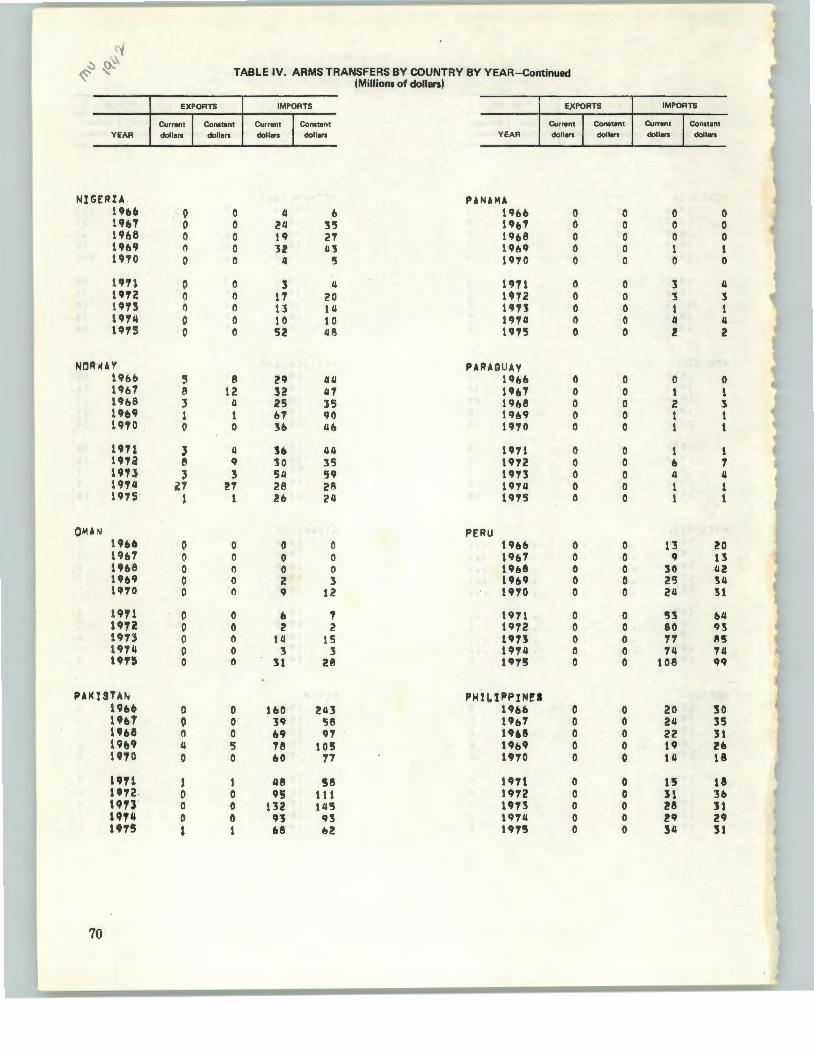
YEAR
NIGERIA U&b 191)7 19b8 191:19 1910
1911 191~ 19'73 19'14 19'15
NOR !Ol AV 19bb 19b7 19b8 Uo9 1970
19'71 t9'7a 1911 1914 1915
Qt.U N 19oo 1967 1h8 Uo9 1910
1911 UTZ 1913 1974 191'!!
PAl< I STAN 1960 1CJb7 Uo& Uo9 19'70
19'71 1912 t9U 19'74 19'75
70
EXPORTS
TABLE IV. ARMS TRANSFERS BY COUNTRY BY YEAR-Continued (Millions of dollars)
IMPORTS EXPORTS
Currant I Constant dollars dollars
Current I Constant dollars dollars YEAR
Current 1 Constant dollars dollars
PANAMA 0 0 /J b 196b 0 0 0 0 24 35 l9f,1 0 0 0 0 19 27 19&8 0 0 0 0 u /J3 l9t.9 0 0 0 0 1.1 '5 1970 0 0
0 0 3 II 1971 0 0 () 0 17 20 1972 0 0 0 n 13 111 19'1J 0 0 0 0 10 1 0 19'711 0 0 0 0 52 Q8 1U5 0 0
PARAG UAy
' 8 j!Q 1111 19bb 0 0 8 12 32 117 19~7 0 0
' /J 25 35 19&8 0 0 l 1 b"T 90 19&9 0 0 0 0 3& lib 1970 0 0
;J 4 u 1111 1971 0 0 e q 10 35 1972 0 0 ~ 3 511 59 1913 0 0
i.7 ~., 28 211 19711 0 0 1 1 2b 211 1975 0 0
PERU 0 0 0 0 19bb 0 0 0 0 0 0 19&'7 0 0 0 n 0 0 19&8 0 0 0 0 2 3 1969 0 0 0 0 9 12 1970 0 0
0 0 0 1 1971 0 0 0 0 2 2 1972 0 0 0 n 111 !5 uu 0 0 0 0 3 3 19'711 0 0 0 0 31 28 1975 0 0
PHII.tPPtNtl 0 0 160 2113 19&41 0 0 0 0 39 58 19417 0 0 0 0 n 9'7 u.s 0 0 II 5 78 105 1h9 0 0 0 0 410 77 1970 0 0
1 1 ll8 58 1911 0 0 0 0 95 111 1972 0 0 0 0 132 1/J"'l 19?3 0 0 0 0 <n 93 1974 0 0 1 1 68 &2 19'75 0 0
IMPORTS
Current I Constant dollars dollars
0 0 0 0 0 0 1 1 0 0
3 II 3 3 1 1 II II ~ 2
0 0 1 1 2 3 1 l 1 1
1 1 b 7 II II 1 1 1 1
13 20 9 13
30 112 2'5 34 211 31
53 bli 80 93 71 85 '711 '711
108 99
20 30 24 35 22 31 19 lb 14 18
15 18 31 341 28 :u 29 29 3ll 31
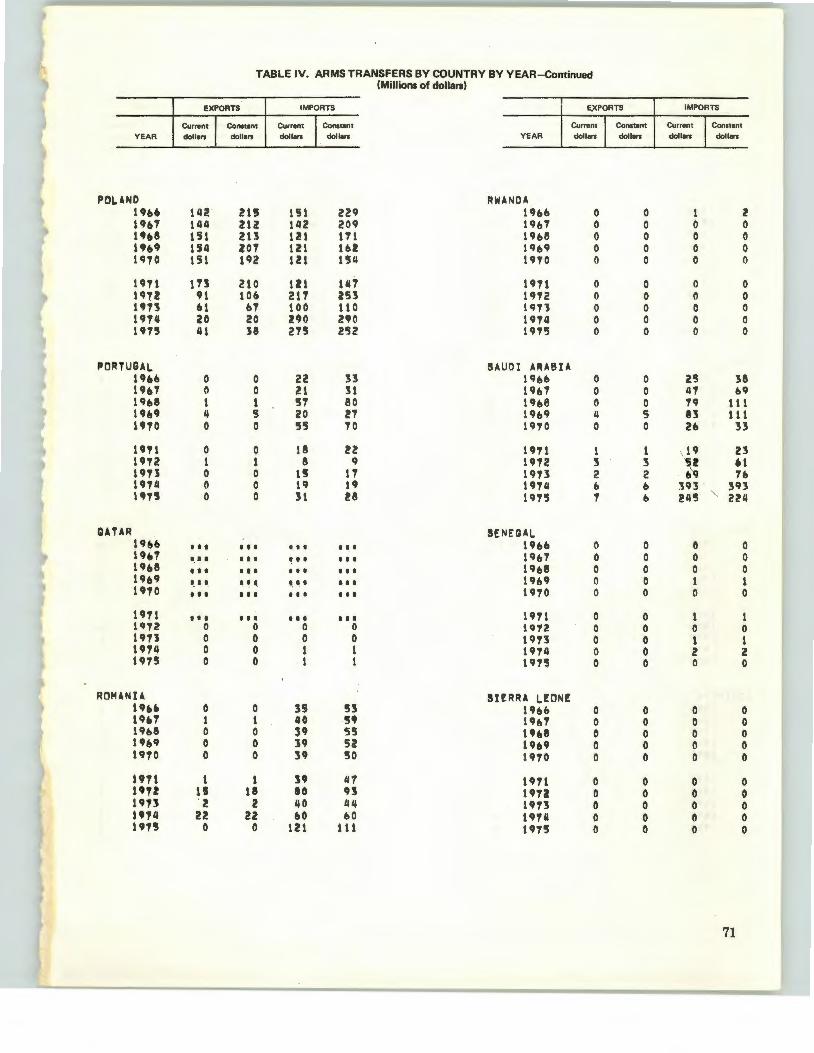
YEAR
POL. AND t~U U&T 19&8 1'&9 1970
1971 197! 1'13 1974 1975
PORTUGAL l9oo 1h7 19&8 1969 1970
1'71 1972 un 1974 197'5
QATAR l96b lh7 19o8 19&9 1970
1911 1972 1973 1971.1 1975
ROMANIA 196b lhT 1968 19&9 1970
1911 un 1913 1971.1 1975
EXPORTS
TABLE IV. ARMS TRANSFERS BY COUNTRY BY YEAR-Continued (Millions of dollars}
IMPORTS ~PORTS
Current I Conatent dollars doll1n
Current I Constant dollars dollars YEAR
Current l Constant dollars dollars
RWANDA 11.12 21!5 151 229 19&b 0 0 141.1 0!12 11.12 209 t9o7 0 0 151 213 121 111 19&8 0 0 Ul.l 207 121 U2 11~o9 0 0 151 192 121 1'54 UTO () 0
tn 210 121 147 1971 0 0 91 lOb 217 253 1972 0 0 61 fiT 100 110 1913 0 0 zo 20 no 2~0 1971.1 0 0 41 38 275 2'52 1975 0 0
SAUDI UABIA 0 0 22 33 19oo 0 0 0 0 21 !1 19b7 0 0 1 l 57 80 1968 0 0 1.1 5 20 27 1969 4 5 0 0 55 10 1970 0 0
0 0 18 !2 1911 t 1 t 1 8 q 1~72 ~ 3 0 0 u 17 1973 2 2 0 0 19 19 1974 b 0 0 0 31 !8 1975 ., b
SENEGAL I I I I I I t . t I I I I 19oo 0 0 I I I I It I I I I I I 1967 0 0 Ill I I I I I I ••• 1968 0 0 I_ II ~ t I , 1. I I I I I 19b9 0 0 I I I I I I I I t I I I 1970 0 0
••• I I I I I I I I I 1971 0 0 0 0 0 0 1972 0 0 0 0 0 0 1913 0 0 0 0 1 1 1974 0 0 0 0 1 1 1975 0 0
SURRA LEON[ 0 0 35 53 1966 0 0 1 1 40 59 19fl7 0 0 0 0 39 55 1968 0 0 0 0 l9 52 19&9 0 0 0 0 ~~ 50 1970 0 0
1 l n 41 1911 0 0 u 111 80 n 1972 0 0 ·z 2 40 1.11.1 1973 0 0 22 22 60 flO 1914 0 0
0 0 121 111 1975 0 0
IMPORTS
Current I Constant dollars dollars
1 z 0 0 0 0 0 0 0 0
0 0 0 0 0 0 0 0 0 0
25 38 47 b9 79 111 83 111 2b B
i: 23 u To
393 . 393 21.15 '.. 224
0 0 0 0 0 0 1 1 0 0
1 1 0 0 1 1 2 2 0 0
0 0 0 0 0 0 0 0 0 0
0 0 0 0 0 0 0 0 0 0
71

TABLE IV. ARMS TRANSFERS BY COUNTRY BY YEAR-Continued (Millions of dollan)
EXPORTS IMPORTS ~PORTS IMPORTS
Current I Constant Current I Constant Curnont I Constant Current I Constant
) YEAR dollars dollars dollars dollars YEAR dollars dollars dollars dollars
~
UNGVORE SOVU!!T UNlO !'t 19&& 0 0 0 0 19&& I bOO ;!51!0 1!45 nz 19&7 0 0 0 0 19&'7 lfi~O !830 !45 U1 19&8 0 0 0 0 19&8 ''50 2190 11'5 24'7 19&9 0 0 9 12 1969 1110 1490 111'5 !&2 19'70 0 0 18 u 19TO •~:.o 1950 195 248
1971 0 0 19 23 19'11 lblO 1950 195 23& 1972 & ., 49 5'7 191~ ~~h~O 2820 100 11& 19U 0 0 2& 29 UT3 'eoo 3150 100 110 19'74 2 a u u 19TII c870 1!870 40 40 1915 0 0 14 13 19T5 'b10 2390 29 21
SOMAl. !A SPAIN 19&& 0 0 5 8 1hb 0 9 12 18 19H 0 0 0 0 Ub1 u b l!8 41 ) 19&8 0 0 4 0 ~9&8 9 13 30 42
~ 19b9 0 0 b 8 19b9 ~ ., 24 S2
19'70 0 0 ., 9 19TO 0 8 .,., 98
19'71 0 0 1 1 1971 c1 2& 90 109 1972 0 0 T 8 l9Ti . 0 ., 12'7 148 19'73 0 0 17 19 un HI 20 105 11& 19'74 0 0 40 40 1974 i1 21 n 8J 19'75 0 0 50 "' 19'75 "b 42 122 11Z
SOUTH A'RICA $Rl I.ANKA t.Cit;YI,,ON> 19&& 0 0 52 .,. 19&6 0 0 1 2 19&7 0 0 14 21 1h7 0 0 0 0 lh8 0 0 l2 l'1 19b8 0 0 1 1 19&9 0 0 u u 1969 0 0 0 0 19'70 0 0 39 50 19'70 0 (I 0 0 I
19'71 0 0 30 S& 19T1 0 0 b ., 19'72 0 0 b! '7& 1912 0 0 2 2 1973 0 0 u "' 1 "'~ 0 0 1 1 19'74 0 0 4& 4& 1914 0 0 0 0 19'75 0 0 '70 64 191~ ' (I 0 ., b
SOUTH!RN RHOD!SIA $UOA N 19&& 0 0 0 0 19U 0 0 4 ~ 19&'7 0 0 0 0 19&7 0 0 l 4 19&8 0 0 0 0 1h8 0 0 10 14 19&Q 0 0 0 0 19b9 0 0 18 24 19'70 0 0 0 0 1910 0 0 40 51
I 1911 0 0 0 0 l9T1 0 0 4 '5 19'7~ () 0 0 0 un 0 0 3 3
J 1 9'73 0 0 0 0 un 0 0 5 b 19'74 0 0 0 0 lU4 0 0 12 12 ) 19'75 0 0 0 0 1915 0 0 0 0
72
I
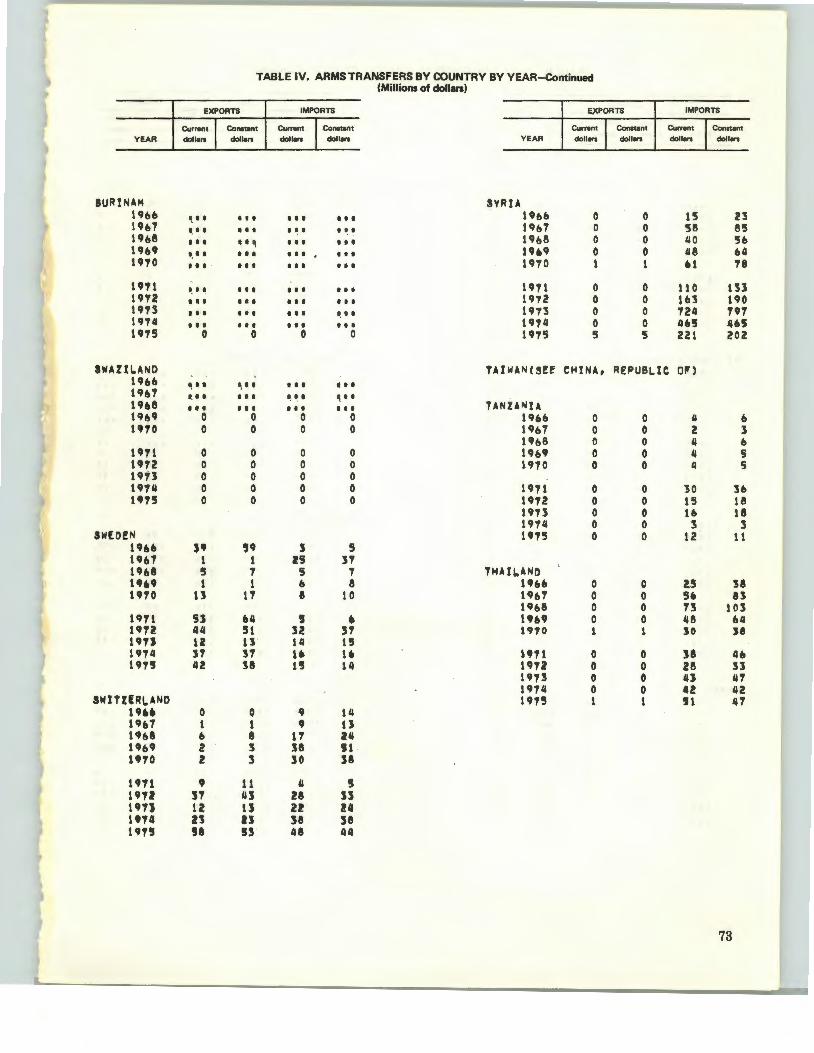
YEAR
IURtN•M 19&6 1967 19~e 19U 19'70
1911 19'72 1 9'fl 19'74 1'75
S~AllL.UoiD 19bb Ub1 1h8 19&9 t9'70
uu 1Cf'72 Utl 19'74 U75
SWEO!N lCfU 196'7 1968 ltU U70
1971 1912 un 19"f4 1915
SW!TURI,..ND u •• 19b7 1Cfel 1Cf&Cf 1Cf70
197 1 un 19U 1t'74 un
TABLE IV. ARMS TRANSFERS BY COUNTRY BY YEAR-Continued (Millions of dollan)
EXPORTS
Current I CoNunt dollars dollars
'.II I I I
I , I I I I I
I I I I I~
I, I I t I I
••• • •• I . •• I I I
I I I I I t
t t I I t I
I I I t I I
0 0
IMPORTS
Current I Conatllnt doll.,. dollars
••• I I I . ~ . . ~. I I I I I I
I I t ••• I I I I t I
I I I ttl
I I t I t I
1. I I t,tl
til til
0 0
EXPORTS
YEAR eu,.,..n. I Consunt dolton doll.,.
SVRU 19bb 0 0 19&7 0 0 19b8 0 0 19fl9 0 0 1970 1 1
1911 0 0 19'72 0 0 19'73 0 0 19'14 0 0 19'75 5 5
IMPORTS
Current I Constant dotters dollars
15 23 se 8!5 40 5& 48 b4 .1 18
110 tn 163 190 '724 191 U!i 4U 221 202
TAIW.N(S!E CHIN., REPUBLIC 0!")
~·· .. .. • •• • ••
·- .. l ••• t . I I ~I I
It I t t I ••• • •• UNUI\jU 0 0 0 0 1966 0 0 4 6 0 0 0 0 19b7 0 0 2 l
tt,68 0 0 4 b 0 0 0 0 19&Cf 0 0 4 s 0 0 0 0 1970 0 0 4 5 0 0 0 0 0 0 0 0 1911 0 0 30 3& 0 0 0 0 1912 0 0 15 18
1913 0 0 u u U74 0 0 3 3 19'75 0 0 12 11
~· $9 3 5 1 1 n 31 '!I 7 5 7 Tld!L.ANO 1 1 6 8 1t&& 0 0 !.5 38
13 17 • 10 196'1 0 0 5. n 19&8 0 0 1:S 101
!13 64 ' • 1Cfll9 0 0 48 b4 44 51 3Z :57 19'70 1 1 JO J8 12 u 14 1'!1 31 !1 t• 1. U71 0 0 l8 4& 42 38 115 14 19'7l 0 0 28 n
19U 0 0 u 41 1 Cf'7 4 0 0 42 42 19 '715 1 1 " 41
0 0 ~ 114 1 1 • 13 e 8 11 24 2 3 :$8 IJ1 2 3 :so 31
• 11 41 ' ,., 4:1 u u 12 u 21! !4 n n 38 sa !I !I~ 48 44
73
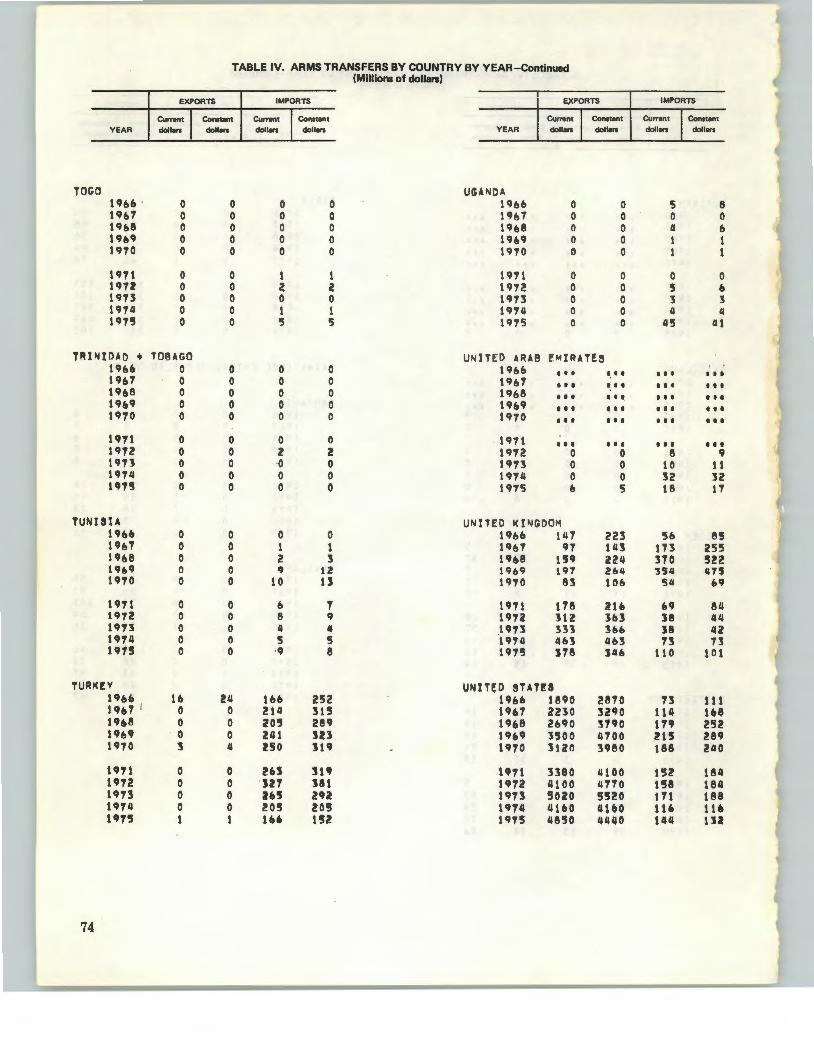
TABLE IV. ARMS TRANSFERS BY COUNTRY BY YEAR-Continued (Millions of dollan)
IMPORTS ~
EXPORTS IMPORTS EXPORTS
Current I Conotllnt Current I Conotllnt Current I Conotllnt Current I Conltant ~ YEAR dollan clollan clollan dollan YEAR dollon dollan clollon dollon
c
TOGO UGANDA U&b 0 0 0 0 19&6 0 0 'S 8 19&7 0 0 0 0 19&7 0 0 0 0 19&8 0 0 0 0 19&8 0 0 II b 19&9 0 0 0 0 19&9 0 0 1 1 ) 1970 0 0 0 0 1970 0 0 1 1
1971 0 0 1 1 1971 0 0 0 0 197Z 0 0 ~ a 1972 0 0 5 b 19'73 0 0 0 0 U73 0 0 3 3 19711 0 0 1 1 19711 0 0 II II 197'5 0 0 5 5 1975 0 0 45 Ill
TRINIDAD + TOBAGO UNITED ARAB EMIRATE! 19611 0 0 0 0 19&& ••• ~ .. • • • • •• 1967 0 0 0 0 19&7 ••• ••• • • t • •• 19&8 0 0 0 0 19&8 ••• • t • • •• • t. 19&9 0 0 0 0 19&9 I t I ••• I I t ••• ) 1970 0 0 0 0 1970 t I t • • • • • • ••• U71 0 0 0 0 1971 • • • • • • ••• It I
t 1972 0 0 2 2 1972 0 0 8 9 1913 0 0 ·0 0 un 0 0 10 11 1974 0 0 0 0 1974 0 0 :52 32
~1 1915 0 0 0 0 1975 & 5 18 17
TUNISU UNlTED KlNGDO~ l j 19&6 0 0 0 0 19&& 147 223 56 85
19&7 0 0 1 1 19117 91 111:5 113 255 19&8 0 0 2 3 19&8 U9 ll4 no '5!2 \, 19lt9 0 0 9 12 19&9 197 2&4 3!i4 47S 1970 0 0 10 u 1970 83 10& 54 69
' 1971 0 0 b 7 1971 178 216 69 811 1972 0 0 8 q 1972 JU 3b3 18 44 1913 0 0 II 4 l'J73 331 lob }8 Ill 1914 0 0 5 5 19111 11&3 4&3 13 13 191'5 0 0 9 8 1975 118 l4b 110 101
TURKfV UNITED STATU 19&6 1b 24 16& 252 Ubb 1890 2870 13 111 1967 . 0 0 21ll 315 19&7 2210 :5290 1tll 1&8 19&8 0 0 20'5 289 1968 2&90 3190 1n 252 19&9 I) 0 241 :Ul U&9 3'500 4700 U! 289 1970 :5 (j 250 lU 1970 uan 3980 188 2ll0
1911 0 0 2U 319 1971 3180 11100 152 184 1972 0 0 Jl1 181 1972 ll100 4710 1'38 184 1913 0 0 165 1!'2 1913 5020 5520 111 188 1974 0 0 20'5 20'!1 1914 4160 4lb0 1U tU 1975 1 1 lU 1'52 1975 ll850 4440 144 U2
74
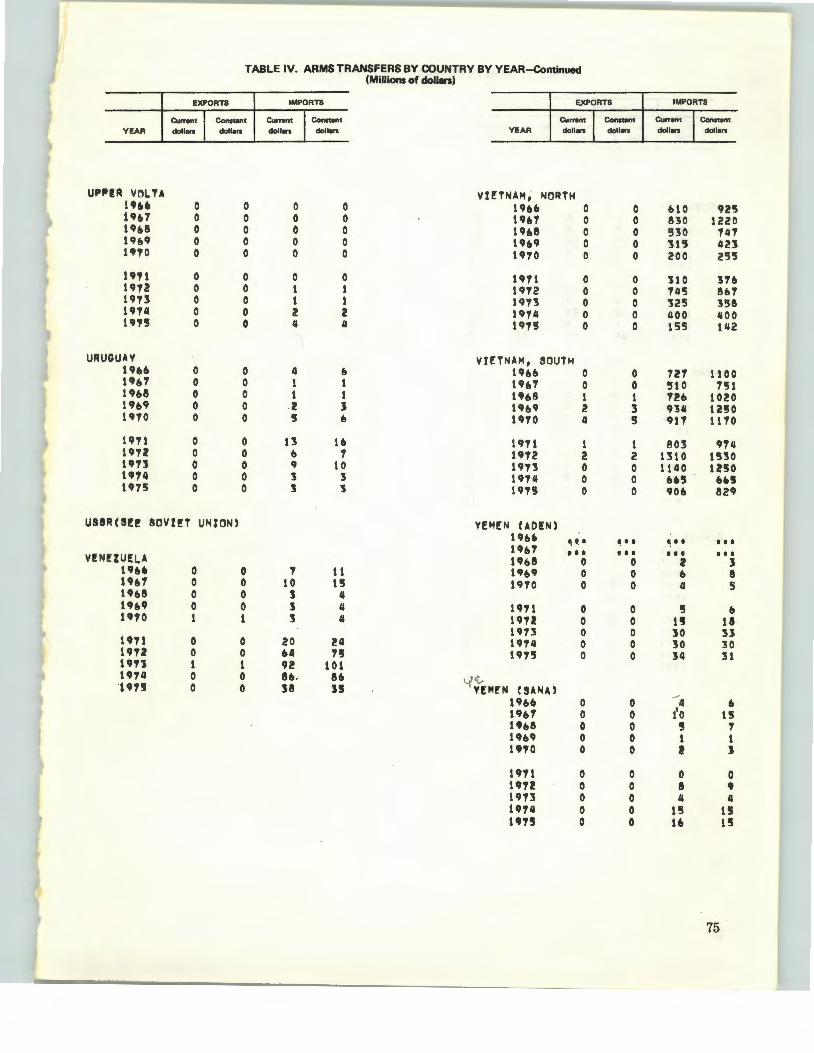
I <
TABLE IV. ARMS TRANSFERS BY COUNTRY BY YEAR~ntinued (Millions of dollars)
EXPORTS IMPORTS EXPORTS IMPORTS
YEAR Current I Co-t dollon dollon
Current l Conount doll.. dollon YEAR
Current -~ Constant doll.. dollon
Current I Constant doll.. dollars
Ull'fiiR VOLTA V!!TNAfi4, NORTH Ull. 0 0 0 0 19blt 0 0 610 925 19ft7 0 0 0 0 19f!1 0 0 !130 1220 19ft8 0 0 0 0 19ft8 0 0 530 141 uu 0 0 0 0 i'JfJ9 0 0 JU 1123 1970 0 0 0 0 1970 0 0 200 25'5
~''1 0 0 0 0 19'7'1 0 0 310 31ft 19'7'2 0 0 1 1 U72 0 0 '7'115 8&7 1913 0 0 1 1 1n1 0 0 325 358 19'7'11 0 0 2 2 19711 0 0 400 4100 19U 0 0 4 4 un 0 0 155 142
URUGUAY VIf'n.UM, SOUTH tUft 0 0 4 ft 1966 0 0 121 t 1 0 0 19ft7 0 0 1 1 1961 0 0 510 751 19118 0 0 1 1 19ft8 1 1 12b 1020 19ft9 0 0 -2 J 19#,9 2 3 9311 12'SO 1970 0 0 ' ft 1970 4 5 911 1110
1971 0 0 13 1ft 1911 1 1 803 974 uu 0 0 ft 1 1972 2 2 1310 1530 un 0 0 9 10 1973 0 0 1140 1!50 1974 0 0 3 J i'JT4 0 0 ftft5 h5 19'7'5 0 0 3 J 197!5 0 0 906 1129
USSR(S!! SOV!!T UN JON) V!M!N (AD!N) 196.
~-· ~·· • • • • •• 1h1 ••• • • • ••• I I I V!N!ZUELA 1968 0 0 2 l uu 0 0 1 11 19biJ 0 0 ft 8 19117 0 0 10 1!1 1910 0 0 4 5 uu 0 0 3 II 1969 0 0 J 4 1971 0 0 5 6 1970 1 1 3 4 uu 0 0 u 18
1973 0 0 10 ll 19'7'1 0 0 20 24 1974 0 0 30 30 1912 0 0 u 1!5 19'7''5 0 0 34 31 un 1 1 92 101 19'7'4 0 0 8ft . !16
'{~EME'N (SANA) un 0 0 sa n 19&6 0 0 _..4 • un 0 0 1' 0 15 uu 0 0 ' 1 1969 0 0 1 1 1970 0 0 I J
1971 0 0 0 0 1912 0 0 8 " 1973 0 0 4 4 1974 0 0 15 15 lt'1!1 0 0 16 t!l
75
'-------
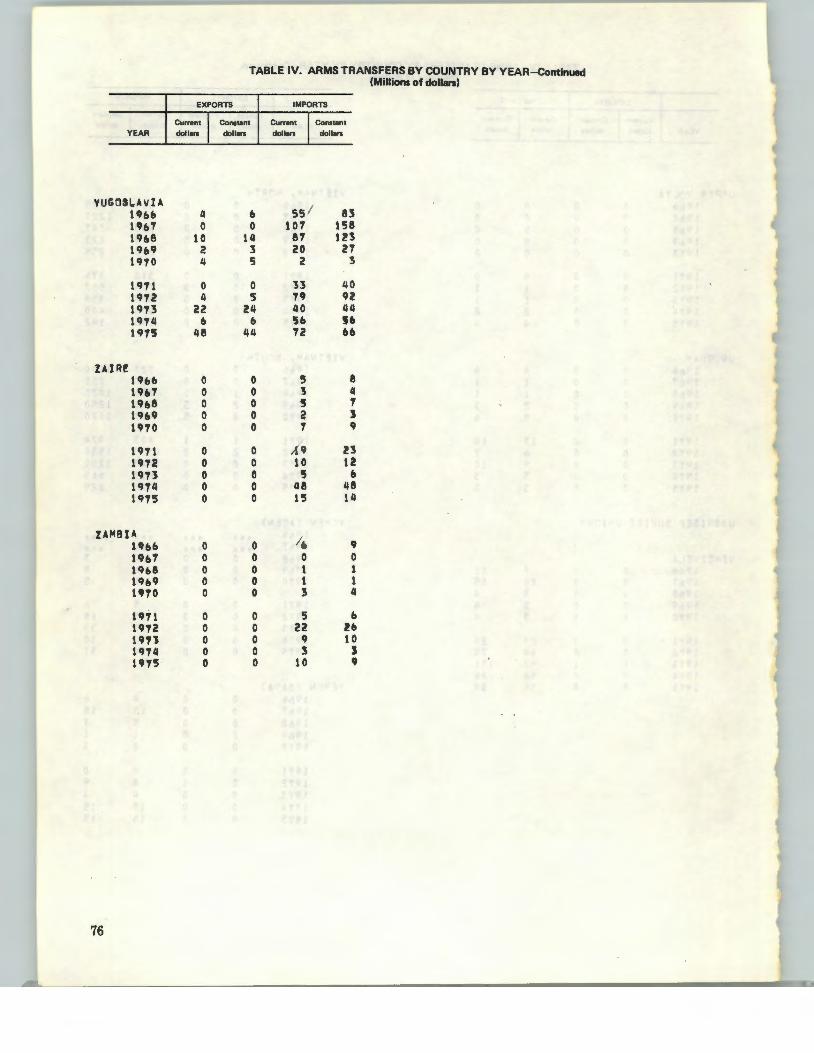
YEAR
VUGOSI.AVU 1'&& 19&7 19&8 19&9 1970
1971 1972 1973 1914 1117§
lAlRf 19&b 111&7 19&8 1CJ&9 1970
1911 1912 1911 1974 1915
ZAMBIA U&b 19b7 19&8 19&9 U10
1911 1972 un 1974 U15
76
TABLE IV. ARMS TRANSFERS BY COUNTRY BY YEAR-Continued (Millions of dollan)
EXPORTS
Current I Constant dollars dollors
4 & 0 0
tO 14 2 3 4 5
0 0 4 5
22 24 & b
48 44
0 0 0 0 0 0 0 0 0 0
0 0 0 0 0 0 0 0 0 0
0 0 0 0 0 0 0 0 0 0
0 0 0 0 0 0 0 0 0 0
IMPORTS
Current I Const•nt dollars dollars
ss l 83 107 158
87 1!3 20 27
2 3
33 40 n •z 40 "" 5& §b 72 &6
5 8 3 4 !!I 7 a J 1 9
/19 23 10 12
lS 6 48 48 15 14
l e, q 0 0 1 1 1 1 3 4
5 b 22 Z&
q 10 3 J
10 '
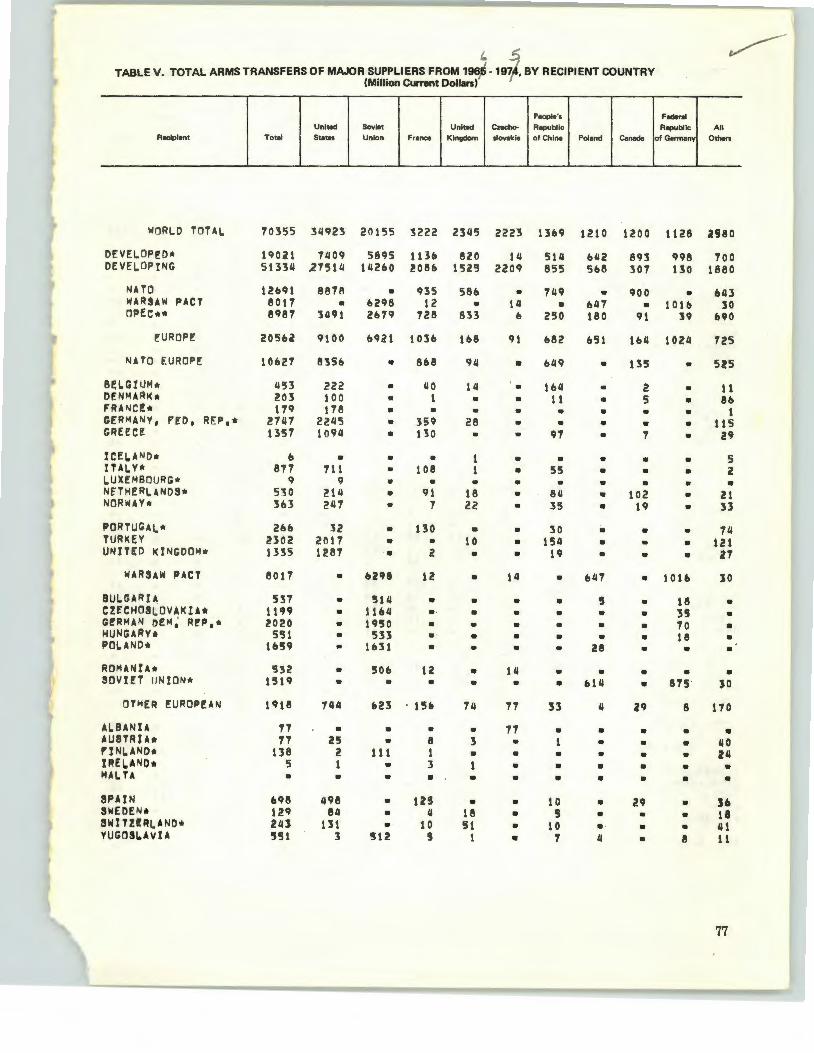
I. s. TABLE V. TOTAL ARMS TRANSFERS OF MAJOR SUPPLIERS FROM 196fl • 197 , BY RECIPIENT COUNTRY
(Million Current Dollars)
Recipient
WORLD TOTAL
DEVELOPED* DEVELOPING
NATO WARSAW PACT DPECu
E.'UROPE
NUO EUROPE
BELGIUM• DEN~ ARK• FRANCh GER~ANV, PED 1 REP 1 * GREECe:
ICEL,A ND• ITA(. V* LUXEMBO URG• NETHERLANDS* NORWAY.
PORTUGAl.* TURKEV UNITED KINGDOM•
WARSAW PACT
BULGARIA CZECHOSLOVAKIA• G!RMAN DEM: REF',• HUNGAAV. POl. AND•
ROMANih SOVIET UNION1!
OTHER EUROF't!AN
A(. BANtA AUSTRih f'INL.AND• I~EL.iANO• MALTA
SPAIN SWEDEN• SWITZI!RI.AND• VUGOSI.AVIA
Unitod Totol StotH
70355 34923
19021 7409 513311 275111
12&91 8878 8017 • 8987 3491
2osoa 9100
10&27 835&
1153 203 179
27117 1357
0 871
9 530 3b3
Zoo 2302 1335
8017
537 1199 2020
551 1659
IIJ3<! 1519
1918
77 17
1'.58 5 •
698 129 2113 551
222 100 1711
22115 10911
• 711
9 2111 2111
3Z 2011 1287
•
• • • • •
• •
744
• 25
2 1 •
498 811
131 l
Soviet United Czocho-Union France Kingdom slovakia
20155 3222 23115 2223
5895 113& ezo 14 1112&0 ~086 15Z5 2209
• 935 58& • 6298 12 • 111 2&19 728 8'.53 0
&921 to:so 168 91
• 8&8 94 •
• • • • • • • • • •
• • •
5111 1U4 1950
533 1U1
50b
• 023
• •
111 • • • • •
110 1 •
359 130
• 108
• 91
7
130 • 2
12
• • • .. •
• 15&
• 8 1 3 •
125 II
10 s
14 • •
28 •
• 18 22
• 1 0 • • • • • • •
• •
14
• 3 •
• •
18 51
l
• • • • •
• • • • •
• • •
14
• • • • •
• 77
11 • • • • • • • •
People's
Republic
of China
13&9
5111 855
749 •
250
682
toll t 1 • •
97
• 55 •
84 35
30 1511
19
• • • • • •
• •
33
• • • •
10 s
10 .,
Poland
1210
bll2 5&8
• 6117 180
651
•
• • • • • • • • • •
• • •
&47
5 • • •
28
• &14
II
• • • • •
• • • 4
F-rol Ropublic All
Canada of Germany Others
1200 1128 asso
893 307
998 700 130 1880
900 • &43 • 101& 30
H 690
1011 10211 125
135
2 5
• 525
• • 1
• • • • •
• • • • • •
102 • 19 •
• • • • • • • 101ft
• 1 e • 35 • 10 • 18 • •
• • • 875
29 8
• • • • • • • • • •
29 • • • • • • 8
11 eo
1 115
29
5 2 •
u 53
111 121 l1
30
• • • • •
• 30
110
• 40 211 • •
]b
1& 41 t1
77

- 'I > TABLE V. TOTAL ARMS TRANSFERS OF MAJOR SUPPLIERS FROM 1966-197 , BY RECIPIENT COUNTRY-Continued
(Million Current Dollars)
People's Fodlrol United Soviet United Czocho- Republic Republic All
Roclp'-nt Totol Stetn Union France Kingdom slovekie of China Pol end Canedo of Germany Others
EAST ASIA
BURl! A CAMBOOU CHI~A, PfOPL~IS REP 0 CHINA, REPUBLIC OF !NOONS'! I A**
JAPAN* KOREA, NORTH KOREA, R~PUB~IC OP LAOS MALAYSU
MONGOL U PHILIPPINES SINGA!'ORE THAILAND VIETNAM, NORTH
VIETNAM, SOUTH
NEAR EAST
BAHRAIN CYPRUS EGYPT IRANU IRAQ**
ISRAEL. JORDAN KUWAIT•• L.UANON OMAN
QAHR** S.AUOI .ARABIA** SYRIA UNITED .ARAB EMIR~** YEMEN (ADEN)
YEMf;N (SANA)
SOUTH .ASIA
.AI'GH.ANUTAN IUNG~AOESH INDIA NEPAL PAKISTAN
SRI LANI(A .
78
21505 15682
!q 72& 157
1696 170
602 so•
211~2 732 253
• 2!6 1117 11311
111120
8632
1611!U
• 2
i!180 3877 1 7i!' 1
40ll 5!8
fiT 126
01
2 10!8 1905
77 126
29111
309 53
U90 2
8112
18
• 1693
1011
601 •
2438 729
79
• 218
53 1115
•
71175
• • •
2702 2
3856 1100
1t1 21
3
•
• •
• •
41 •
83
2
3705
• 8
155 •
•
• •
• • • •
2990
•
&300
• •
2116!5 589
13113
• • • II •
• •
1758 •
114
. -309
30 UT'J
•
10
45
2 3 2 •
• • 7 •
• • • • •
51111
• •
87 1
3&
109 5
• 11 • •
190 •
29 •
260
• •
39 •
221
•
tl4 1&66
3 • • • 5
•
• • •
• • • 2&11 • • • •
&II •
• • 3 •
116 • 13
• 1395
• 775
• •
11 2211
II
Z!l s• 'J1
3 21
z 33&
1 :JO
1
•& • •
7e 1
11
•
• • • •
• • • • •
• • 2 • •
• 350
• • • •
J50
•
26
• • • •
• • • • 2
• 2
10 & • •
224
• •
25 113
H
• 18 • •
• 10 21 • • •
• • 4 •
25
•
5
• • • • s
• • • • •
• • • • •
• 3117
• 2
152 z
100
• • •
•
• •
87 • • •
102
• •
811 •
18
•
•
• •
• • • •
21
• • • • • •
116
·• • •
• • • • •
• • • • •
• 10
• • • 1 9
•
10
• • • • •
• • • • • • • • •
10
•
32
• • 8 • 4
• • • • • • •
20 • • •
27
• •
27 • • •
202
5 1 • 3
45
• 1 •
5CJ
•
• 25
701
• •
32 201 193
37 111
2 17 112
• zq t3 18 11
32
U5
•
• 100
•
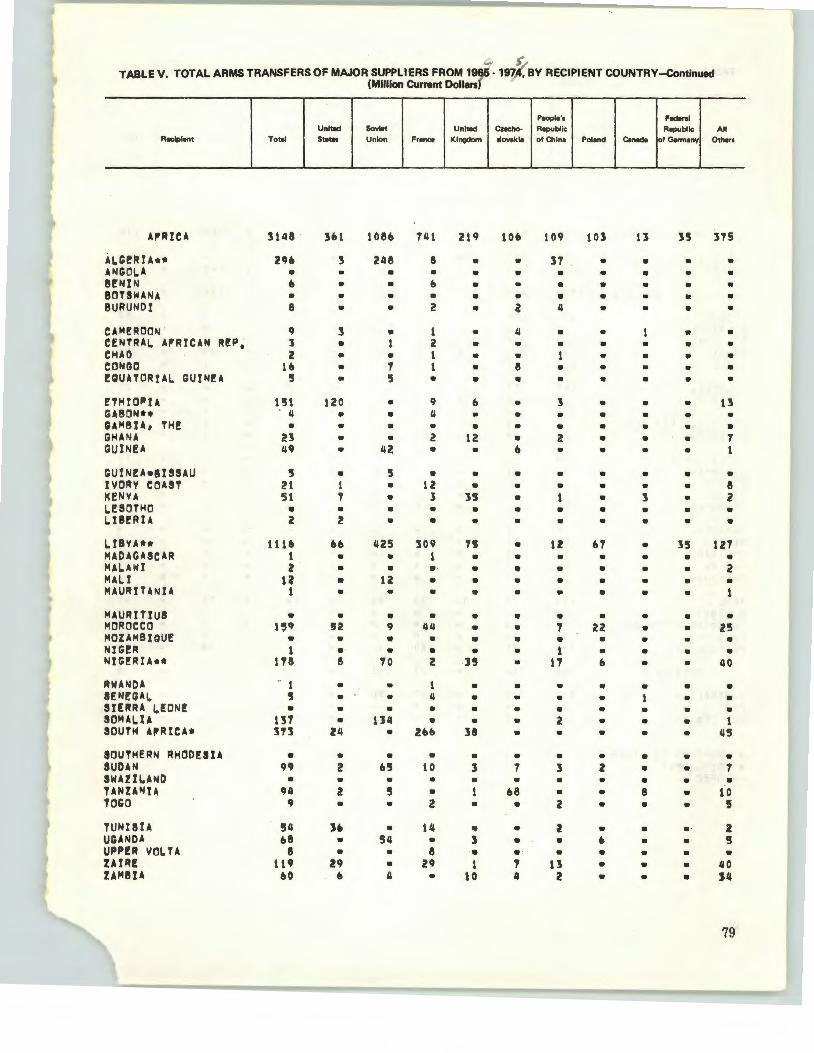
TABLE V. TOTAL ARMS TRANSFERS OF MAJOR SUPPLIERS FROM 196S -197( BY RECIPIENT COUNTRY-Continued (Million Current Dollanf
Recipient
AI'RICA
AI,.G!IUAu ANGOL.A B~NIN BOTSWANA BURUNDI
CAM!ROON . CENTRAL. AFRICAN R!P, CHAD CONGO fQUATDRIAL GUINEA
ETHIOP'U GABONU GAMBIA, TH! GHANA GUINEA
GUINEA•BISSAU %\lORY COAST I<EN'I'A I.E SOTHO L.IB!RU
LIBYA** MADAGASCAR MALAWI MALI MAU~ITANIA
MAURITIUS MOROCCO MOZAM8%QUI! NIG!R NIGERUu
RWANDA SENI!QAL. SIERRA l.fDN! SOMAL. lA SOUTH ORICU
SOUTHERN RHOD!S!A SUDAN SWAZILAND UNU"'iU TOGO
TUNISU UliANDA UltP!R 1/0L TA ZAIRE UM!!U
Total
3148
• b • 8
9 l 2
lb 5
151 . 4
• u 49
5 21 51 • 2
tlU l a
u l
• 1
118
.. 1 5 •
131 313
• 9CJ •
!54 u
8 119
bO
United States
• • • •
• • • •
120 • • • • • 1 ., •
• • • •
• 52 • • 8
• • • •
• 2 • 2 •
• •
Soviet Union
108b
248 • • • • • • 1 5
• • • •
42
5 • • • •
425 • • •
• 9
• •
10
• • •
134 • •
b5 •
•
• 54 • • 4
Fr1nce
741
8 •
• 2
1 2 1 1 •
• 2 • •
12 3 • •
309 1 • • • •
1111 • • 2
1 II • •
• 10 • • 2
• 8
29 •
United Kingdom
• • • • • • • • • •
• •
12 • • •
35 • •
n • • • •
• • • •
• • • •
38
• •
•
" 3 • 1
10
Czocho· slovakia
106
• • • •
• • 8 • • • • • b
• • • " • • " " " •
" • • • •
• • • • • • 7 •
68 • • " • ., 4
People's Republic of China
109
31 • • • 4
• • • • l • • 2 •
• • • •
• • • •
• 1 • 1
17
• • • 2 •
• 3 • • 2
l • •
13 2
Poland
103
.. • • • • • • • • • • • • • • • • • • •
67 • • • • •
22 • •
• • • • •
• 2 • • • • 6 • • •
Canedo
• • • • •
• • • •
• • • • •
• • 3 • • • • • • •
• • • • •
• • • • • • • 8 • • • • • •
F-Republic
of Germ•nv
• • • • • • • • • • • •· • • •
• • • • •
3'5 • • • • • • • • · •
• • • • • • • • • • •· •· • • •
All
Others
• • • • • • • • • •
13 • • 7 1
• 8 2 • •
127 • 2 •
• 25 • •
110
• • • 1
115
• 7 •
10 5
2 5 •
110 J4
79
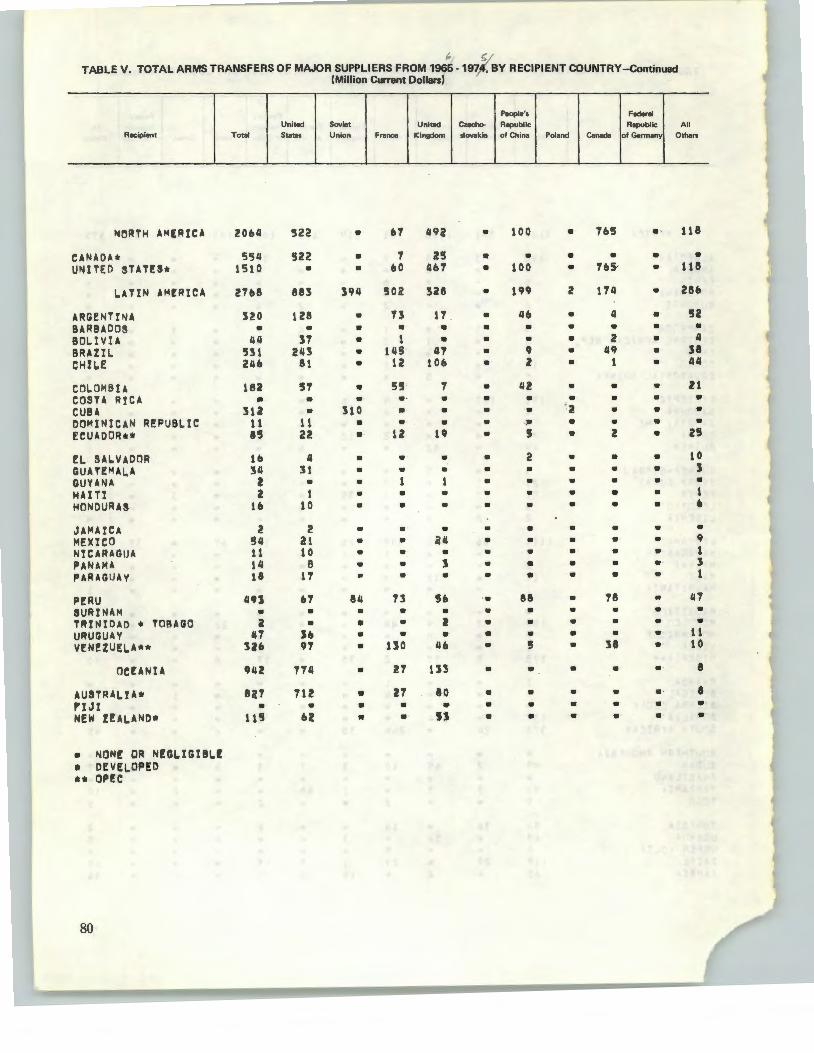
~' TABLE V. TOTAL ARMS TRANSFERS OF MAJOR SUPPLIERS FROM 1965 ·1974, BY RECIPIENT COUNTRY-Continued
Recipient
NORTH AME:RICA
CANADA* UNITED STAT!S•
I.ATIN AM!RICA
ARG~NTINA BARBADOS BOI.IVU BRHII. Cto!ll.f:
COLOMBIA COSTA RICA CUBA DOMINICAN REPUBLIC ECUADOR•*
Et. SAI.VADOR GUAT!!MAL.A GUYANA HAITI HONDURAS
JAJolAICA MEXICO NICARAGUA PANAMA I'ARAGUAV
PfRU SURINAM TRINIDAD + TOBAGO URUGUAY VEN!ZUEL.A**
OCfANU
AUSTR-'I.IA* I'IJI NEW lEALANOtlt
• NON[ OR N!G~IGIBt.! * OfVELOP!D u OP!C
80
Total
2064
554 1510
Z7b8
•
• lU
11 85
16 34
l 2
16
2 54 t 1 14 l8
4•J •
• 115
Unitod States
522
522 •
128 •
31 24:5
81
51 • •
11 22
4 lt • t
10
2 21 10
6 11
u • •
114
712 •
(Million Current Dollan)
Soviet United
Union France Kingdom
• 111 49~
• 'T 25 • 60 4&1
:1'4 502 :528
• 13 11 • • • • 1 • • 1U 47 • 12 106
• 55 1 . •· . 310 • •
• • • • · 12 1'
• • • • • • • • • • • • •
• • • • • i4 • • • • • 1 • • •
• • • • • I • • • • uo 46
• 21 133
• l7 80 • • • • • Sl
Czocho· slovakia
•
• • •
• • • • • • • • • • • • • • •
• • • • • .. • • • •
•
" • •
People 's
Republic of China
100
• 100
u•
• •
' 2
42 • • ,.. s
2 • • • • • • • • •
88 • • •
• • • •
Poland
• • • 2
• • • • • • • 'a • • • • • • •
• • • • • • • • • •
•
• • •
Canada
•
•
• • • • 2
• • • • •
• • • • •
18 •
• J8
• • • . .
Federal
Republic All
of Germany Others
• 118
• • • 118
• 286
• 52 • • • 4 • :sa • 44
• 2l • • • • .. . • 25
• 10 • J • • • l . " • • . ' • 1 • l • l
• 41 • • • • • ll • 10
• . 8
• . 8 • • • •
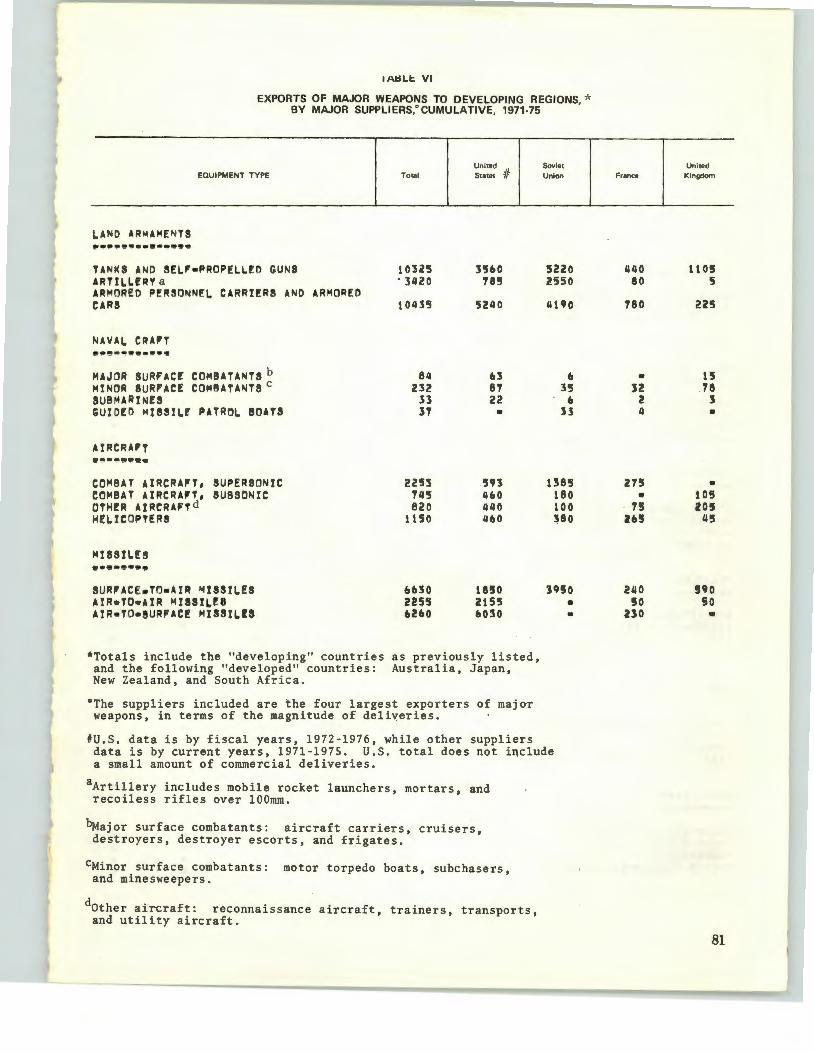
I A.tsLI: VI
EXPORTS OF MAJOR WEAPONS TO DEVELOPING REGIONS, >'< BY MAJOR SUPPLIERS,"CUMULATIVE, 1971-75
EQUIPMENT TYPE
L.AND UtdMENTS ·-··~·~-·--!!P··
TANKS AND S~~'•PROPEL.l!O GUNS ARTILI.U'I' a AR~ORED PERSONNEL CARRifRS AND ARMORED CARS
t NAVAL CIUn P~W·~••••••
MAJOR SURF'ACf COMBATANTS b MINOR SURI"ACf COMBATANTS c SUBMARINES GUIDED MISSIL~ PATROL. BOATS
·-·-!J··· COMBAT AIRCRA,T, SUPERSONIC COMBAT AIRCRA,T, SUBSONIC OTM!R AIRCRAFfd HELICOPTERS
M!5StLfS
··~-~··· SUR,ACEeTO•AIR MISSILES AIR•TO•AIR MISSILES AIR•TO•SURFAC! MISSIL.IS
Total
10U5 • 3420
10435
84 232
33 l'7
2Z53 74'5 820
1150
6UO 2255 6260
United States if
3'560 '785
5240
63 8'7 22 •
593 460 440 4110
tno 2155 6030
*Totals include the "developing" countries as previously listed, and the following "developed" countries: Australia, Japan, New Zealand, and South Africa.
0 The suppliers included are the four largest exporters of majo-r weapons, in terms of the magnitude of deliveries.
Soviet Union
5220 2550
4190
6 3'5
. b 33
1385 180 100 ~80
• •
#U.S. data is by fiscal years, 1972-1976, while other suppliers data is by current years, 1971-1975. U.S. total does not include a small amount of commercial deliveries.
aArtillery includes mobile rocket launchers, mortars, and recoiless rifles over lOOmm.
~ajor surface combatants: aircraft carriers, cruisers, destroyers, destroyer escorts, and frigates.
cMinor surface combatants: motor torpedo boats, subchasers, and minesweepers.
dother air~raft: reconnaissance aircraft, trainers, transports, and utility aircraft.
France
440 80
'780
• 32
2 4
275 •
'75 au
240 50
no
United Kingdom
1105 5
225
15 '78
J •
• 105 205
4'5
590 so •
81
.I
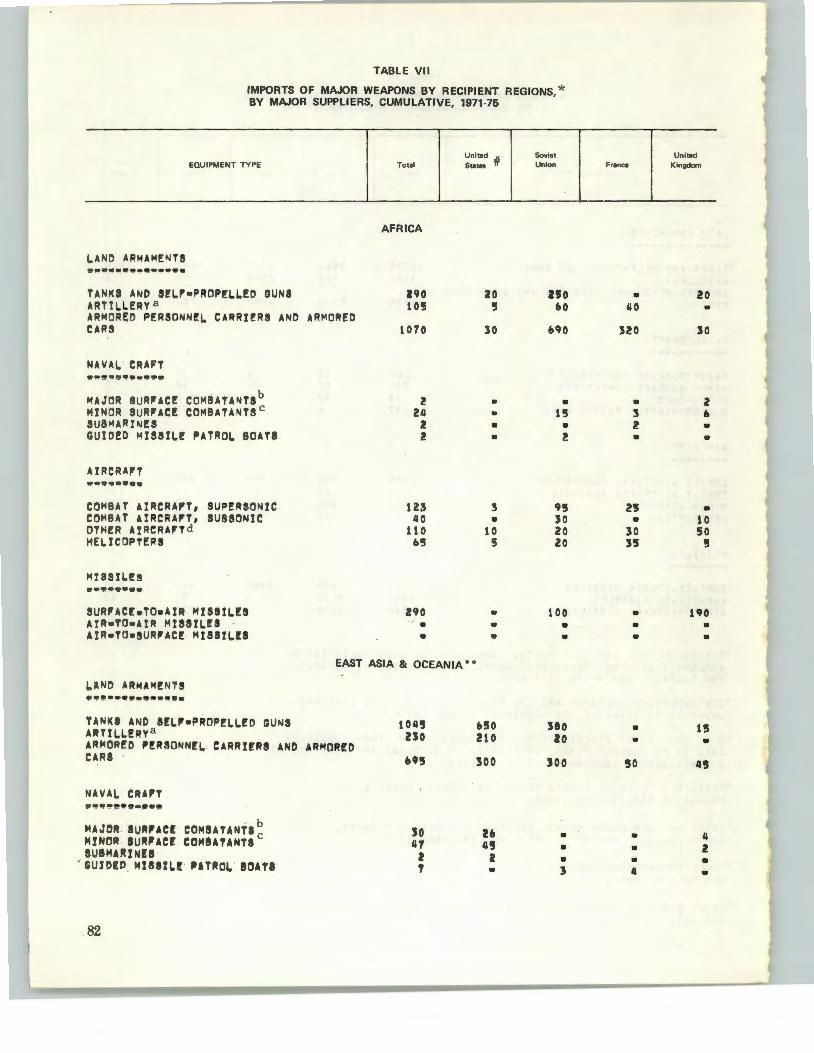
TABLE VII
IMPORTS OF MAJOR WEAPONS BY RECIPIENT REGIONS,* BY MAJOR SUPPLIERS, CUMULATIVE, 1971-75
United It
Soviet EQUIPMENT TYPE Total States Union
AFRICA
LAND ARMAMENTS @•··~·~---~~~!'··
TANKS AND S!Lr•PROP!LLED GUNS uo 20 no ARTILLfRV a 105 '5 60 ARMORtO PERSONNEL CARRIERS AND ARMORED CARS 1010 :so 690
NAVAL CRAFT IP•!f•t!t~9•·~·
MAJOR SURFACE COMBATANTS b 2 • • MINOR SURI"ACE COMBATANTS c 24 • 1'5 SUBMARINES z • • GUIDED MUSIL! Ft ATROL BOA T8 2 • z
AIRCRArT @•II!!~····
COMBAT AIRCRAI'T, SUF'ERSONIC 123 3 95 COMBAT AIRCRAI'T, SUBSONIC 40 • JD OTHER AIRCRAI'Td 110 10 20 HELICOPTfRS 65 5 20
MISSIL.I!S e·~·••••
SURI"AC[.TO•AIR MISSILES no • 1DD AIR•TO•AIR MISSILES • • • AIR•TD•SURI"ACf MISSILIS • • •
EAST ASIA & OCEANIA • •
LAND ARMA"'fNTS ·~·--··-···4!·· TANKS AND SELI'•PROPEL.LfD GUNS 1045 6'50 380 ARTILL.ER'I'a 230 210 20 ARMORfO PERSONN(L CARRI!RS AND ARMORED CARS 69!1 ::soo soo
NAVAL. CRAI'T -~~~~·--··· MAJOR IUR,ACl COMI!IAUNTS ~ so u • "!!NOll! SUR,AC[ COMIUUNTS 41 "' • 8UBMAR%N!S
' 2 • ' GUIDED MISSIL! PATROL BOATI 1 • 3
,82
United Fral'lce K;ngdom
• .20 40 •
SC!D 30
• z l , z • • •
Z5 • • 10
30 50 35 '5
• 1'0 • • • •
• u • •
50 4'5
• 4 • 2 • •· 4 •
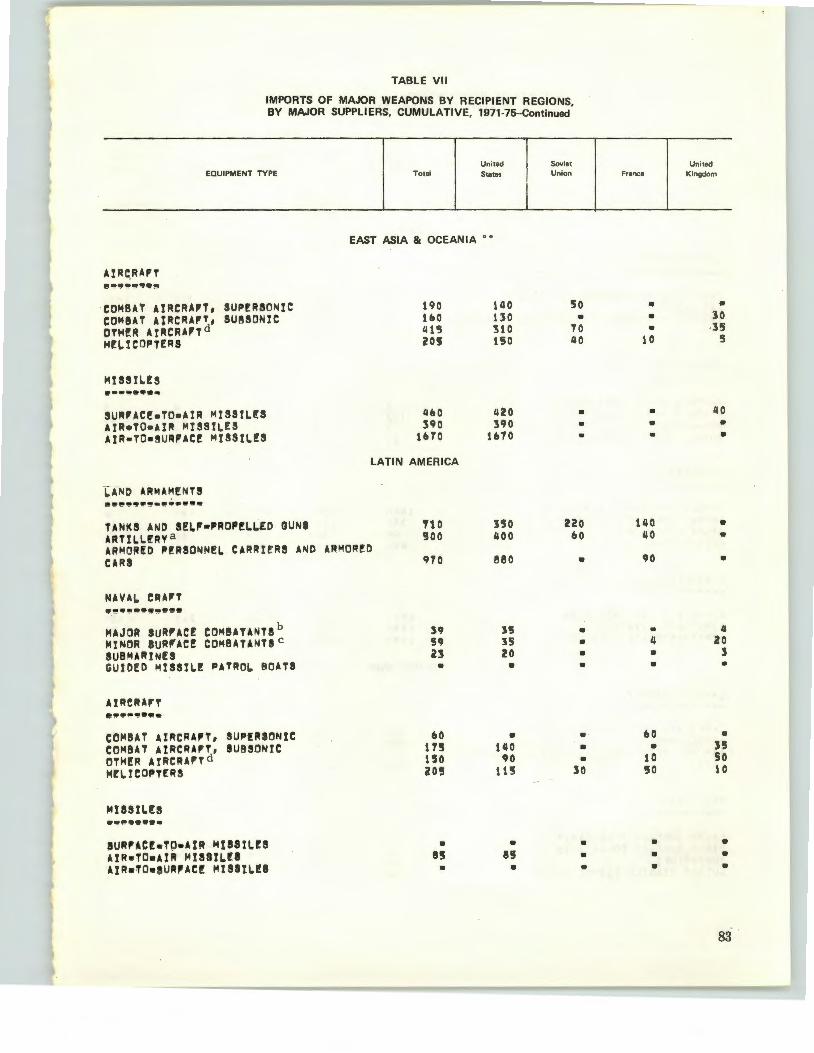
TABLE VII
IMPORTS OF MAJOR WEAPONS BY RECIPIENT REGIONS BY MAJOR SUPPLIERS, CUMULATIVE, 1971-75--Continued'
United Soviet EQUIPMENT TYPE Total States Union
EAST ASIA & OCEANIA • •
URC.RA'T e-.!P•I!! ... !I!II
·COMBAT AlRCRAI"T, SUPERSONIC 190 140 50 COMBAT AIRCRHT, SUBSONIC 1&0 130 • OTH~R AtRCRAI"Td 1115 ltO 70 HEL.tCOPTfRS ZO'J uo 40
MISSILES ·--~@'··~
SURI"AC!•TO•AIR MtSSIL[S 4&0 420 • AtR•TO•Al~ MISSILES 390 390 • AtR•TO•SURI"AC! MISSILES 1&70 tbTO •
LATIN AMERICA
'CANt> ARMAMENTS ., ... .,~~·~--l!t ..... TANKS AND S!LI"•,ROP!LL!D OUNI TtO 350 220 ARTILL!RYa !500 400 ItO ARMORED P!RSONN!L CARRIERS AND ARMORED CARS 970 880 •
NAVAL CRArT .. !!~l!!!lilp··l!"··· MAJOR SURP"AC! COMBATANT!! b S9 l! • MINOR 8UR,-ACE COMBATANTS c s~ 35 • SUBMARINfS z~ 20 • GUlOfD MISSILE PATROL BOATS • • •
A!RCRA'T
-~··II!··· COI'I!IAT URCRAI"T, SUP(IIISON t C ItO • • COMBAT AlRCRAil'T, SUBSONIC 17~ 140 • OTH!R AIRCRAfi'Td 1!50 qo • M!LICOPTERS 20!5 115 30
MtsSIL!S -~~~" .... IURI"~C!•TP•AIR MtSStL!S • • • AtR•TO•Al~ M!SStL!I n 8!5 • AtR•'D•SU~I"AC! MtSStL!S • • •
United France Kingdom
• • • 30 • -35
10 5
• 40 • • • •
140 • 40 • 90 •
• 4 4 20 • 3 • •
60 • • l!5
tO so !50 10
• • • • •· •
83
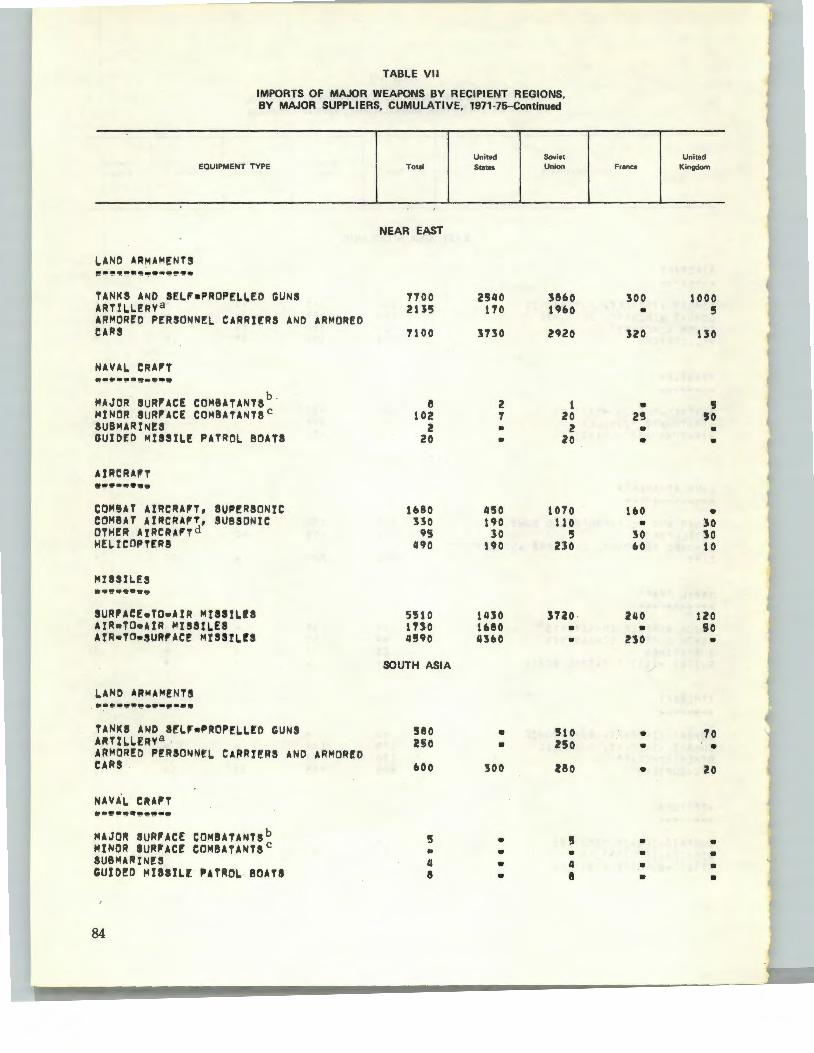
TABLE VII
IMPORTS OF MAJOR WEAPONS BY RECIPIENT REGIONS, BY MAJOR SUPPLIERS, CUMULATIVE, 1971-75--Continued
United Soviet EQUIPMENT TYPE Total States Union
NEAR EAST
LAND ARMAM!NTS e·~•·•~-·-~!!P• .. TANKS AND SELF•PROP!L~ED GUNS 1'700 2540 38&0 ARTILLERY a 2135 110 U&O ARMORED PERSONNE~ CARRIERS AND ARMORED CARS 1100 3130 2920
NAVAL. CRAI'T ·-·-~·!!····
MAJOR SURFACE COMBATANTS b . e 2 1 MINOR SURI'ACE COMBATANTS c 102 1 20 SUBMARINES l • 2 GUIDED MISSILE PATROL. BOATS 20 • 20
URCRAI'T ••!!'•'!•·· COM~AT AIRCRAFT, SUPERSONIC 1&80 4!50 1010 COM!AT URCIUI'T, SUBSONIC 330 190 110 OTHER A IRCRAI'T d 95 30 5 HEL.ICOPT[RS 490 190 2JO
MlSSII.ES !! .. !!~.,.""
SURI'ACf.TO•AtR MtSStL.rs 5'!510 14:10 l1ZO · AIR•TO•AlR MISSIL.f8 1UO uso • A!R•TO•SURI'AC! MtSStL.!S 4590 43&0 •
SOUTH ASIA
LAND ARMAM!NTS !P•P•!'•••••••••
TANKS AND SfL.I'•PROPfL.L.!D GUNS 580 • 510 ART!L.L.fRVa 2!50 • no ARMOR!D PERSONNEL. CARRIERS AND ARMORED CARS &00 300 280
NAV .. L CRAI'T ·-·-~·!!•tiP••
MAJOR SURFACE COMBATANTS b 5 • 5 MINOR SURI'ACE COMBATANTS c • • • SUBMARIN!'S " • " GU!O!D MISSIL.f PATROL BOATS e • 8
84
United France Kingdom
300 1000 • 5
320 130
• 5 2!5 !10 • • • •
1&0 • • 30
:so :so flO 10
240 120 • so
no •
• 10 • • • 20
• • • • • • • •
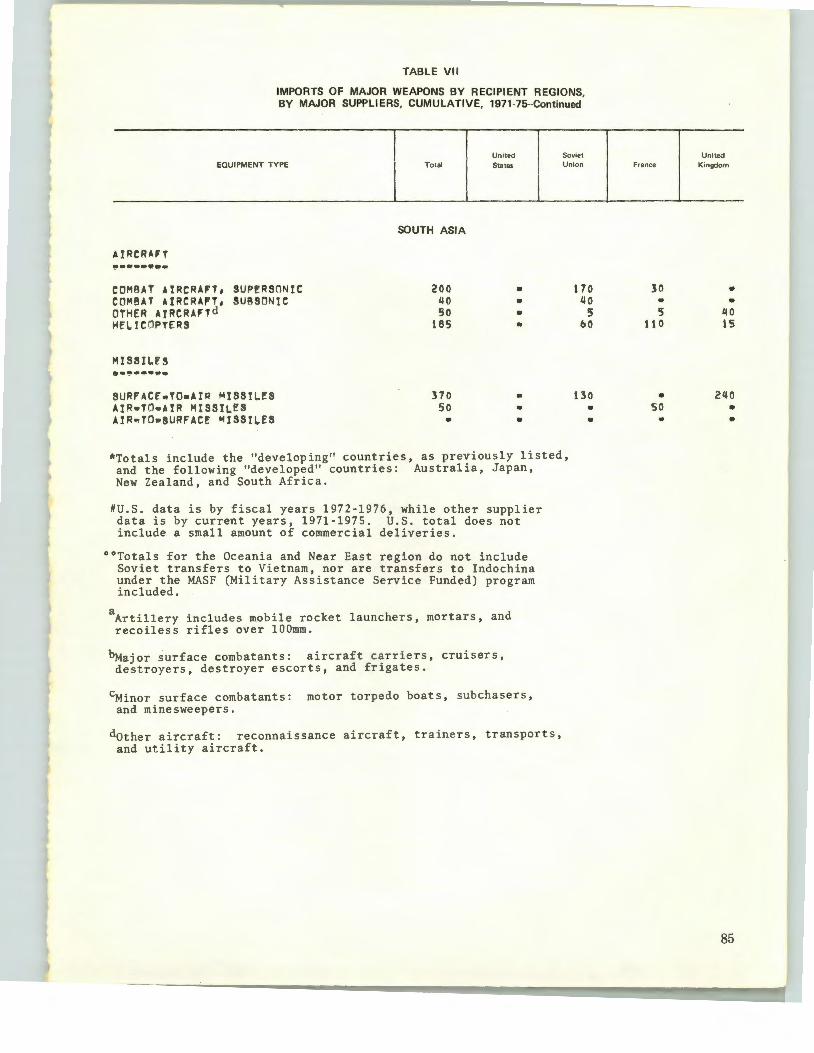
TABLE VII
IMPORTS OF MAJOR WEAPONS BY RECIPIENT REGIONS, BY MAJOR SUPPLIERS, CUMULATIVE, 1971-75--Continued
EQUIPMENT TYPE
COMBAT AIRCRA,T 1 SUPERSONIC COMBAT AIRCRA,T, SUBSONIC OTHER A!RCRAFTd HELICOPTERS
MISSILE'S
SURfACf,.TO•AlR MISSIL~S A!R•TO•AIR MISSILES A!R~To~sURfAC~ MISSILES
Total
SOUTH ASIA
200 liO 50
185
370 50 •
United States
• • • •
.. • •
Soviet Union
170 liO
5 bO
130 • •
*Totals include the "developing" countries, as previously listed, and the following "developed" countries: Australia, Japan, New Zealand, and South Africa.
#U.S. data is by fiscal years 1972-1976, while other supplier data is by current years, 1971-1975. U.S. total does not include a small amount of commercial deliveries.
00 Totals for the Oceania and Near East region do not include Soviet transfers to Vietnam, nor are transfers to Indochina under the MASF (Military Assistance Service Funded) program included.
aArtillery includes mobile rocket launchers, mortars, and recoiless rifles over lOOmm.
bMajor surface combatants: aircraft carriers, cruisers, destroyers, destroyer escorts, and frigates.
cMinor surface combatants: motor torpedo boats, subchasers, and minesweepers.
dother aircraft: reconnaissance aircraft, trainers, transports, and utility aircraft.
France
30 • 5
110
• so
United K ingdom
• •
40 15
2ll0 • •
85