Embed Size (px)
Citation preview
Mustapha. World Journal of Engineering Research and Technology
www.wjert.org
254
EFFECT OF FOLIAGE ON MOBILE RADIO PROPAGATION
CHARACTERISTIC IN MTN NIGERIA AND AIRTEL NIGERIA (A
CASE STUDY OF MAIDUGURI METROPOLIS)
Isa M. Sani1, Mala U.M. Bakura
2, Musa Mustapha*
2, Modu M. Ibarhim
2 Zainab M.
Gwoma2 and Modu A. Gana
3
1Electrical Engineering Department, National Board for Technology Incubation, Technology
Incubation Center Maiduguri, Nigeria.
2Department of Electrical and Electronics Engineering, University of Maiduguri, Maiduguri,
Nigeria.
3Department of Biomedical Engineering, University of Maiduguri Teaching Hospital,
Maiduguri, Nigeria.
Article Received on 07/01/2018 Article Revised on 28/01/2018 Article Accepted on 18/02/2018
ABSTRACT
This research investigated the effects of foliage on mobile
networks. The wet season is known to be characterized by increase
in foliage due to increased moisture content. Global System for
Mobile Communications (GSM) signal strength measurements of
two networks were taken during the dry season and repeated during
the wet season at the same point. These data were then analyzed using
the systematic approach of collecting and collating relevant data to determine the
relationship between the signal strength loss, foliage depth and frequency. To ensure greater
accuracy of results, two networks (Airtel and MTN) were considered. Furthermore, signal
strength measurements were conducted in Maidugur i c it y and Auno rural area around
Maiduguri. GSM signals were discovered to suffer greater losses during the rainy season
due to increased foliage. Losses of between - 4dBm and -10dBm were observed in rural and
suburban areas while the losses observed in the metropolis were between -0dB and - 4dBm
These losses, though not significant in urban areas, were significant in the rural and
wjert, 2018, Vol. 4, Issue 2, 254-266.
World Journal of Engineering Research and Technology
WJERT
www.wjert.org
ISSN 2454-695X Original Article
SJIF Impact Factor: 5.218
*Corresponding Author
Musa Mustapha
Department of Electrical
and Electronics
Engineering, University of
Maiduguri, Maiduguri,
Nigeria.
Mustapha. World Journal of Engineering Research and Technology
www.wjert.org
255
suburban areas. The result obtained for the developed Maiduguri model is observed to be
within the range when compared with Wiessberger and ITU models.
KEYWORDS: BTS: Base station, EIRP: effective isotropic radiated power, CCIR:
Consultative Committee on International Radio GSM: Global System of Mobile
Communications.
INTRODUCTION
Since the introduction of GSM into Nigeria in early twentieth century mobile
telecommunications industry has grown tremendously. This growth made it possible for
urban as well as rural populace to gain access to mobile phones. However, this growth came
with attendant problems, some of which include poor signal reception at various points,
dropped calls, and congestion. GSM service providers in Nigeria have thus been trying to
evolve methods of tackling these problems. Some of these problems are not peculiar to any
specific region whereas others are. For instance, the vegetation cover in an area could pose
specific problems to the operators and thus solutions peculiar to these environments need to
be sought. Nigeria as a country has a varied vegetation which ranges from thick vegetation in
the South to the savannah grassland in the middle belt to the semi- desert or Sahel savannah
regions of the extreme North. The extreme north region of Nigeria experiences between 4 to
6 months (between April and October) of rain every year. The increased in earth moisture
content during this period gives rise to ground conductivity and foliage. This condition will
affect GSM signal strength. For GSM operators to ensure continuous quality service delivery,
the relationship or effects of ground conductivity and foliage on signal strength needs to be
understood particularly in the specific region where such networks are deployed.[1]
Carried
out measurements and analysis for signal attenuation through Date Palm trees in North
Abu Dhabi, United Arab Emirates. This region is an arid/semi desert region. The results
obtained showed significant additional losses of up to 20 dB due to foliage, these
measurements were however taken at a frequency of 2.1 GHz which is much higher than
the frequency used by mobile networks in Nigeria. A research on effect of foliage in a
small forestry area in Akure, field strength meter type UNAOHM Model EP742A was used
and a yagi array receiving antenna covering both VHF and UHF frequency bands was used
for the measurement,[2,3]
carried out campaign in two forested channels in Calabar city of
Nigeria, statistical data of signal strength outside and inside the channel at different depth to
determine foliage loss was obtained, instrument used is digital community access cable
Mustapha. World Journal of Engineering Research and Technology
www.wjert.org
256
(CATV) television analyser with 24 channels, the foliage loss in the two channel were found
to be 3.24mdB and 2.23mdB respectively. A study found an average excess path loss of
between 3 and 7 dB due to tree foliage for a carrier frequency of 3.676 GHz in a suburban
setting outside Chicago Illinois was also observed.[4]
Traffic analysis of the NITEL GSM
network was carried out. To ensure network optimization, the prime concern was monitoring
and forecasting the network usage by measuring, analysing and interpreting traffic data In
the same vein.[5]
Similarly a research conducted into the prediction of seasonal trends in
cellular dropped call probability in the United States. The work which focused on the effect
of atmospheric refraction concluded that the effect of foliage path loss would be greater
during wet seasons.[6]
Also a study investigates the effect of dry and wet earth on GSM
signals, and the results indicated signal experience extra losses due to foliage within the
range 3 dB to 6 dB at 1800 MHz and about 1 dB to 3 dB extra loss at 900 MHz
Measurements were made by using Sony Ericsson phone K600i at 1800 MHz, and T610 at
900 MHz, though the research was conducted in Turkey within a forested area, main losses
and effect observed was foliage losses. The intensity of these losses during the dry and wet
seasons was compared and was found to be greater during the wet season.[7]
Also a study
examine the effect of dry and wet earth on GSM Signals, the results indicate signal
experience extra losses due to foliage within the range 3 dB to 6 dB at 1800 MHz and about 1
dB to 3 dB extra loss at 900 MHz Measurements were made by using Sony Ericsson phone
K600i at 1800 MHz, and T610 at 900 MHz. The research was conducted in Turkey within a
forested area, main losses and effect observed was foliage losses. The intensity of these
losses during the dry and wet seasons was compared and was found to be greater during the
wet season.[8]
Similarly,[9 ]
in his work, concentrated on the network features and their
effects on radio quality, his emphasis was on how to manipulate these features to improve
network quality. It is therefore valuable to verify a particular model’s applicability to a
given region based on historical use or comparison of the model prediction to measured
results.
None of these studies, however, considered in great details the effect of increased foliage
and depth of this foliage in relation to signal strength loss along the loss path occasioned by
the rainy season on radio networks in a Sahel savannah terrain. All these works were carried
out in regions whose vegetation’s are different from the sahel savannah vegetation
predominant in the far North eastern region of Nigeria. Furthermore a model for Maiduguri
Mustapha. World Journal of Engineering Research and Technology
www.wjert.org
257
metropolis and environment was established and difference in the propagation characteristics
between urban and rural areas was investigated in this research.
Foliage Loss Models Used
Wiessberger Model
Wiessberger modified exponential decay model is given by:
0.284 0.5881.33 14 400
10.2840.45 0 14
f df m df mL dB
f m df m
Where; L: Signal strength loss (dB)
Df: Depth of foliage in (m)
f: Frequency in (GHz)
The attenuation predicted by Wiessberger’s model is in addition to free-space (and any
other non-foliage loss). Wiessberger modified exponential decay model given in equation 1
applied when the propagation path is blocked by dense, dry, leafed trees found in temperate
climate. It is important that the foliage depth be expressed in meter and that the frequency
is in GHz. This model covers the frequency range from 230 MHz to 95 GHz.[10]
It is
applicable in situations where propagation is likely to occur through a grove of trees
rather than by diffraction over the top of the trees.[10]
Equation 1 reveals that foliage
loss would increase as frequency and foliage depth increase.
Early ITU Vegetation Model
The early International Telecommunication Union, (ITU), foliage model was adopted by
the Consultative Committee on International Radio (CCIR) in 1986 and is also known as
the early ITU vegetation model. While the model has been superseded by a more recent
ITU recommendation (ITU-R), it is an easily applied model that provides results that are
fairly consistent With the Wiessberger model. The model is given in equation 2 below
0.3 0.6
0.2 2L dB f df
Where L; signal strength loss along the LOS path.
f; frequency in GHz
df; depth of the foliage along the Loss path in meter.
The ITU-R was developed from measurements carried out mainly at Ultra High
Frequency (UHF), and was proposed for cases where either the transmitter or the
Mustapha. World Journal of Engineering Research and Technology
www.wjert.org
258
receiver is near to a small grove of trees (foliage depth < 400 m). Thus a large portion
of the signal propagates through the trees.[11]
Equation 2 indicates that foliage Loss would
increase with foliage depth and frequency. This is consistent with Wiessberger Model.
METHODOLOGY
In order to achieve the objectives of this investigation, a series of measurements of
mobile radio signal strengths using Airtel and MTN base stations as reference points were
carried out within Maiduguri metropolis. The method employed in this research was
systematic approach of collecting and collating relevant data.[12]
Thereafter, detailed
analysis of the data was carried out from which valuable results were obtained. Part of the
research objectives was to compare the propagation characteristics of urban, rural and
suburban environments. Thus, Maiduguri metropolis and Auno rural area was chosen.
Furthermore, two sets of measurements were taken; one during the dry season (Between
the months of December 2015 and January 2016) and the other during the w e t season
(Between the months of September 2016 and October 2016).
Data Collection
The various steps taken in the course of this research were as follows:
a) Signal strength of Airtel and MTN networks at various points in Maiduguri Metropolis
and environs during the dry season was measured.
b) Signal strength of same networks at same places in (a) was measured during the wet
Season.
c) Evaluation, analysis and comparison of obtained data using graphs.
d) Comparison of measured results with existing prediction models on effects of wet
Season on GSM signals.
e) Measurement of foliage depth at various points in Maiduguri metropolis and environs
Measuring Instrument used in taking the Readings
The equipment used for taking the measurements of the signal strength measurement is
the Sagem OT290 phone. It is specialized equipment used by many telecommunications
companies in Nigeria for monitoring their networks. It is capable of measuring received
signal power in decibel ( mill watts) (SAGEM, 2003). The equipment has the facility to
indicate the particular base station whose signal strength is being measured. Hence care
was taken to avoid measuring signal strengths from different base stations at the same point
on different occasions.
Mustapha. World Journal of Engineering Research and Technology
www.wjert.org
259
Measurement Procedure
Before conducting signal strength measurements, the particular base station of interest is
identified and a signal strength measurement is taken at the base station. Thereafter,
further measurements are taken at progressive intervals and test points (TPs) of 1 km from
the station up to a maximum of 5 km for rural areas. Within Maiduguri Metropolis however,
further measurements were taken at a progressive interval of 200 meters. To ensure greater
accuracy, measurements were taken 2 to 3 times at each test point and a mean value was
recorded. The base station (BTS) antenna is a tri sector vertical dipole directional antenna
mounted at 37m above the ground for the GSM 900. The transmitted power for the
antenna is 42 dBm while the antenna gain (GT) is 18.5 dB and a minimum received
power level for good links is from -90dBm (Huawei Technology, 2003).
RESULTS AND DISCUSSION
Global System for Mobile Communications (GSM) signal strength measurements of two
networks were taken during the rainy seasons at the base station point (200 meters apart) and
these measurements were repeated during the dry season. These data were then analyzed
using the systematic approach of collecting and collating data to determine the relationship
between the signal strength and foliage. Table 1 and table 2 below shows results obtained
from measurement conducted along Bama road Maiduguri (urban area) for wet and dry
season respectively.
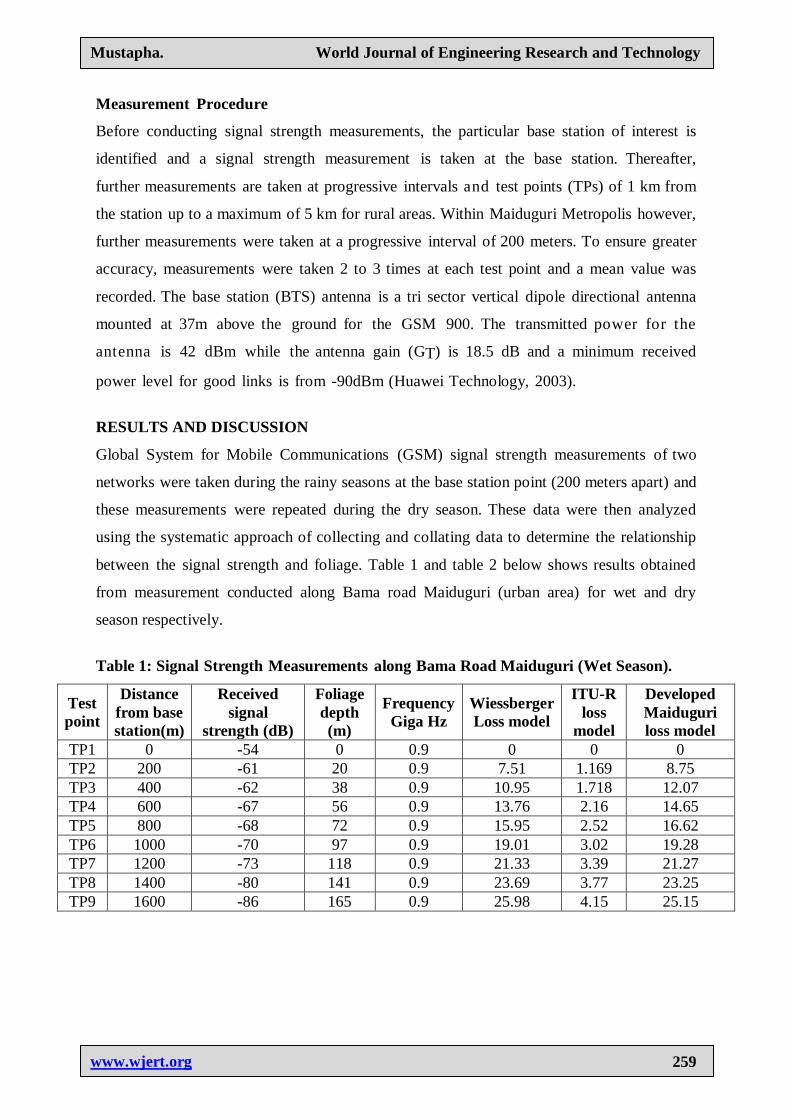
Table 1: Signal Strength Measurements along Bama Road Maiduguri (Wet Season).
Test
point
Distance
from base
station(m)
Received
signal
strength (dB)
Foliage
depth
(m)
Frequency
Giga Hz
Wiessberger
Loss model
ITU-R
loss
model
Developed
Maiduguri
loss model
TP1 0 -54 0 0.9 0 0 0
TP2 200 -61 20 0.9 7.51 1.169 8.75
TP3 400 -62 38 0.9 10.95 1.718 12.07
TP4 600 -67 56 0.9 13.76 2.16 14.65
TP5 800 -68 72 0.9 15.95 2.52 16.62
TP6 1000 -70 97 0.9 19.01 3.02 19.28
TP7 1200 -73 118 0.9 21.33 3.39 21.27
TP8 1400 -80 141 0.9 23.69 3.77 23.25
TP9 1600 -86 165 0.9 25.98 4.15 25.15
Mustapha. World Journal of Engineering Research and Technology
www.wjert.org
260
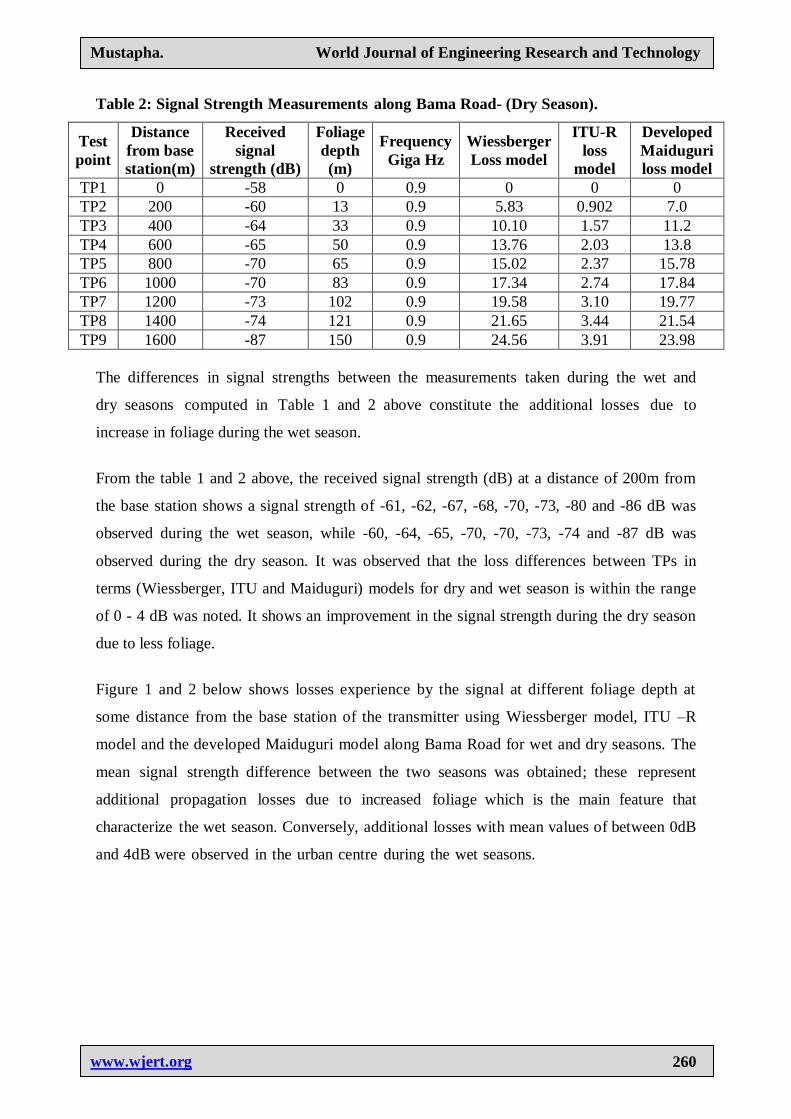
Table 2: Signal Strength Measurements along Bama Road- (Dry Season).
Test
point
Distance
from base
station(m)
Received
signal
strength (dB)
Foliage
depth
(m)
Frequency
Giga Hz
Wiessberger
Loss model
ITU-R
loss
model
Developed
Maiduguri
loss model
TP1 0 -58 0 0.9 0 0 0
TP2 200 -60 13 0.9 5.83 0.902 7.0
TP3 400 -64 33 0.9 10.10 1.57 11.2
TP4 600 -65 50 0.9 13.76 2.03 13.8
TP5 800 -70 65 0.9 15.02 2.37 15.78
TP6 1000 -70 83 0.9 17.34 2.74 17.84
TP7 1200 -73 102 0.9 19.58 3.10 19.77
TP8 1400 -74 121 0.9 21.65 3.44 21.54
TP9 1600 -87 150 0.9 24.56 3.91 23.98
The differences in signal strengths between the measurements taken during the wet and
dry seasons computed in Table 1 and 2 above constitute the additional losses due to
increase in foliage during the wet season.
From the table 1 and 2 above, the received signal strength (dB) at a distance of 200m from
the base station shows a signal strength of -61, -62, -67, -68, -70, -73, -80 and -86 dB was
observed during the wet season, while -60, -64, -65, -70, -70, -73, -74 and -87 dB was
observed during the dry season. It was observed that the loss differences between TPs in
terms (Wiessberger, ITU and Maiduguri) models for dry and wet season is within the range
of 0 - 4 dB was noted. It shows an improvement in the signal strength during the dry season
due to less foliage.
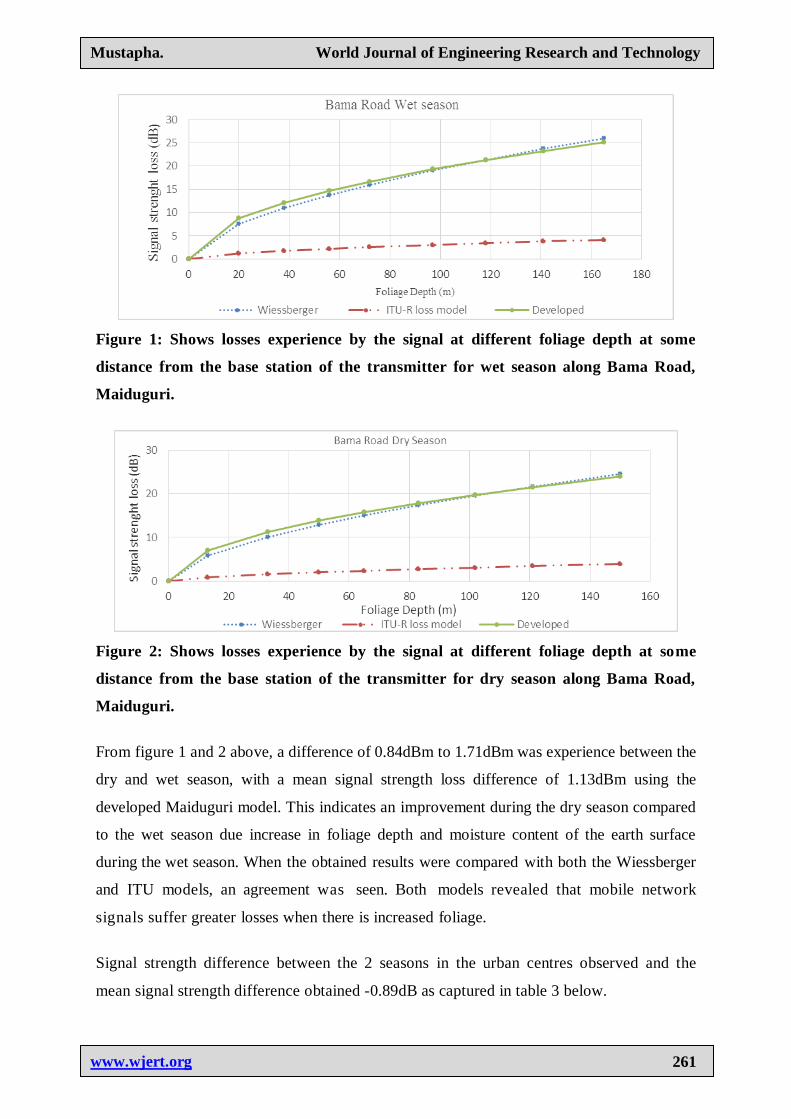
Figure 1 and 2 below shows losses experience by the signal at different foliage depth at
some distance from the base station of the transmitter using Wiessberger model, ITU –R
model and the developed Maiduguri model along Bama Road for wet and dry seasons. The
mean signal strength difference between the two seasons was obtained; these represent
additional propagation losses due to increased foliage which is the main feature that
characterize the wet season. Conversely, additional losses with mean values of between 0dB
and 4dB were observed in the urban centre during the wet seasons.
Mustapha. World Journal of Engineering Research and Technology
www.wjert.org
261
Figure 1: Shows losses experience by the signal at different foliage depth at some
distance from the base station of the transmitter for wet season along Bama Road,
Maiduguri.
Figure 2: Shows losses experience by the signal at different foliage depth at some
distance from the base station of the transmitter for dry season along Bama Road,
Maiduguri.
From figure 1 and 2 above, a difference of 0.84dBm to 1.71dBm was experience between the
dry and wet season, with a mean signal strength loss difference of 1.13dBm using the
developed Maiduguri model. This indicates an improvement during the dry season compared
to the wet season due increase in foliage depth and moisture content of the earth surface
during the wet season. When the obtained results were compared with both the Wiessberger
and ITU models, an agreement was seen. Both models revealed that mobile network
signals suffer greater losses when there is increased foliage.
Signal strength difference between the 2 seasons in the urban centres observed and the
mean signal strength difference obtained -0.89dB as captured in table 3 below.
Mustapha. World Journal of Engineering Research and Technology
www.wjert.org
262
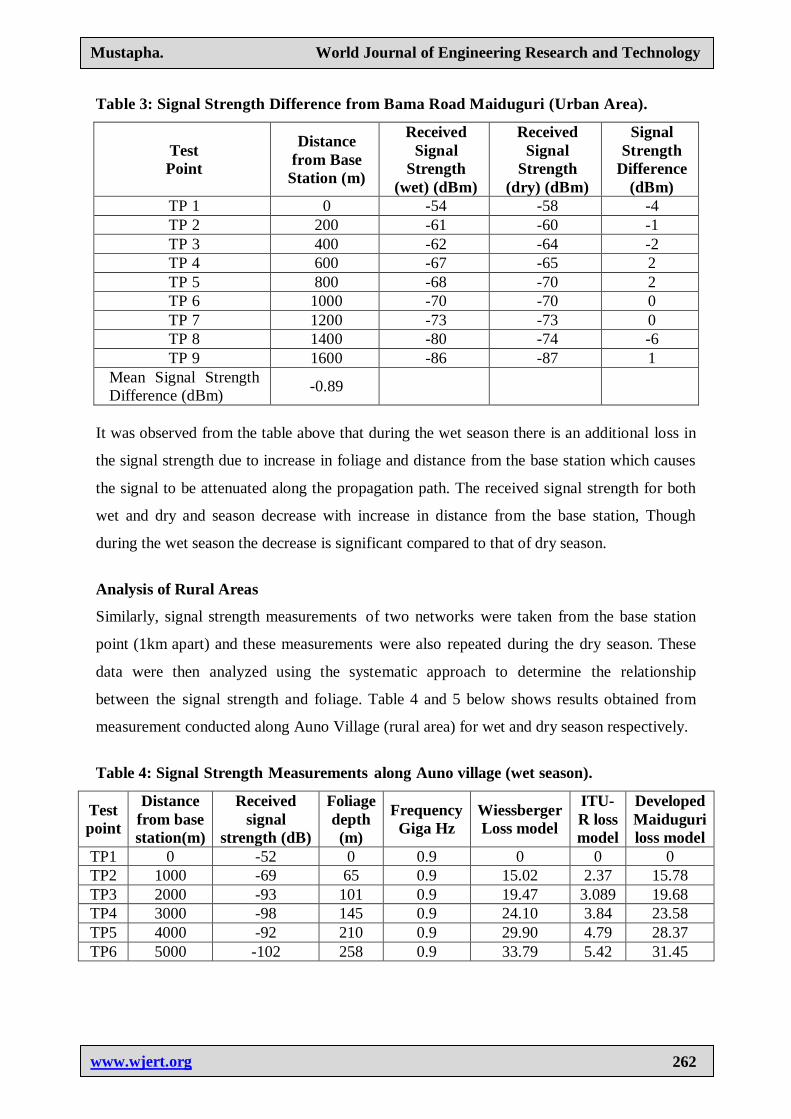
Table 3: Signal Strength Difference from Bama Road Maiduguri (Urban Area).
Test
Point
Distance
from Base
Station (m)
Received
Signal
Strength
(wet) (dBm)
Received
Signal
Strength
(dry) (dBm)
Signal
Strength
Difference
(dBm)
TP 1 0 -54 -58 -4
TP 2 200 -61 -60 -1
TP 3 400 -62 -64 -2
TP 4 600 -67 -65 2
TP 5 800 -68 -70 2
TP 6 1000 -70 -70 0
TP 7 1200 -73 -73 0
TP 8 1400 -80 -74 -6
TP 9 1600 -86 -87 1
Mean Signal Strength
Difference (dBm) -0.89
It was observed from the table above that during the wet season there is an additional loss in
the signal strength due to increase in foliage and distance from the base station which causes
the signal to be attenuated along the propagation path. The received signal strength for both
wet and dry and season decrease with increase in distance from the base station, Though
during the wet season the decrease is significant compared to that of dry season.
Analysis of Rural Areas
Similarly, signal strength measurements of two networks were taken from the base station
point (1km apart) and these measurements were also repeated during the dry season. These
data were then analyzed using the systematic approach to determine the relationship
between the signal strength and foliage. Table 4 and 5 below shows results obtained from
measurement conducted along Auno Village (rural area) for wet and dry season respectively.
Table 4: Signal Strength Measurements along Auno village (wet season).
Test
point
Distance
from base
station(m)
Received
signal
strength (dB)
Foliage
depth
(m)
Frequency
Giga Hz
Wiessberger
Loss model
ITU-
R loss
model
Developed
Maiduguri
loss model
TP1 0 -52 0 0.9 0 0 0
TP2 1000 -69 65 0.9 15.02 2.37 15.78
TP3 2000 -93 101 0.9 19.47 3.089 19.68
TP4 3000 -98 145 0.9 24.10 3.84 23.58
TP5 4000 -92 210 0.9 29.90 4.79 28.37
TP6 5000 -102 258 0.9 33.79 5.42 31.45
Mustapha. World Journal of Engineering Research and Technology
www.wjert.org
263
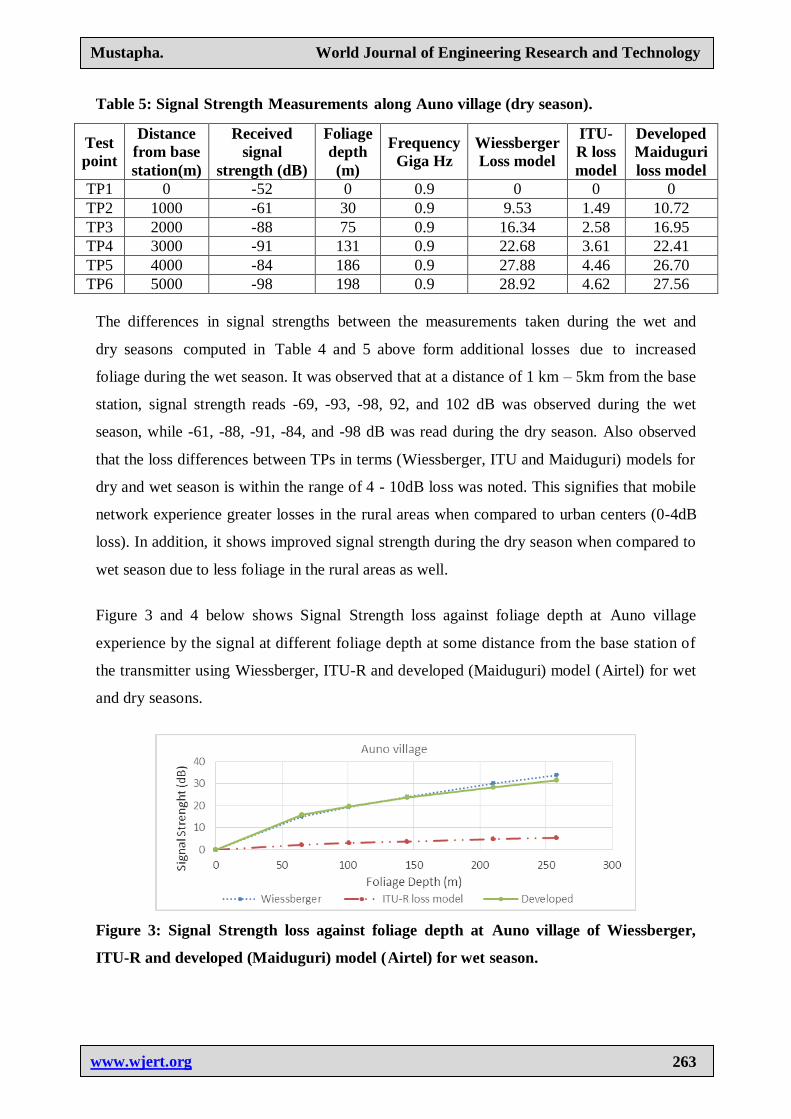
Table 5: Signal Strength Measurements along Auno village (dry season).
The differences in signal strengths between the measurements taken during the wet and
dry seasons computed in Table 4 and 5 above form additional losses due to increased
foliage during the wet season. It was observed that at a distance of 1 km – 5km from the base
station, signal strength reads -69, -93, -98, 92, and 102 dB was observed during the wet
season, while -61, -88, -91, -84, and -98 dB was read during the dry season. Also observed
that the loss differences between TPs in terms (Wiessberger, ITU and Maiduguri) models for
dry and wet season is within the range of 4 - 10dB loss was noted. This signifies that mobile
network experience greater losses in the rural areas when compared to urban centers (0-4dB
loss). In addition, it shows improved signal strength during the dry season when compared to
wet season due to less foliage in the rural areas as well.
Figure 3 and 4 below shows Signal Strength loss against foliage depth at Auno village
experience by the signal at different foliage depth at some distance from the base station of
the transmitter using Wiessberger, ITU-R and developed (Maiduguri) model (Airtel) for wet
and dry seasons.
Figure 3: Signal Strength loss against foliage depth at Auno village of Wiessberger,
ITU-R and developed (Maiduguri) model (Airtel) for wet season.
Test
point
Distance
from base
station(m)
Received
signal
strength (dB)
Foliage
depth
(m)
Frequency
Giga Hz
Wiessberger
Loss model
ITU-
R loss
model
Developed
Maiduguri
loss model
TP1 0 -52 0 0.9 0 0 0
TP2 1000 -61 30 0.9 9.53 1.49 10.72
TP3 2000 -88 75 0.9 16.34 2.58 16.95
TP4 3000 -91 131 0.9 22.68 3.61 22.41
TP5 4000 -84 186 0.9 27.88 4.46 26.70
TP6 5000 -98 198 0.9 28.92 4.62 27.56
Mustapha. World Journal of Engineering Research and Technology
www.wjert.org
264
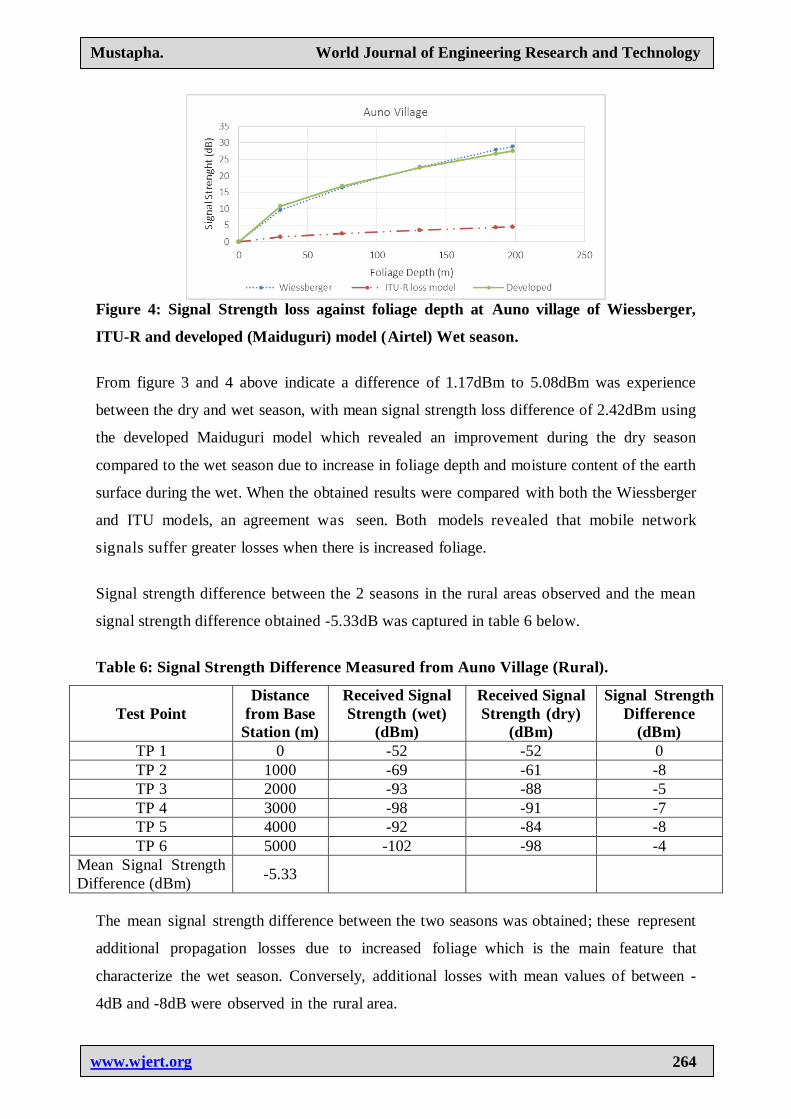
Figure 4: Signal Strength loss against foliage depth at Auno village of Wiessberger,
ITU-R and developed (Maiduguri) model (Airtel) Wet season.
From figure 3 and 4 above indicate a difference of 1.17dBm to 5.08dBm was experience
between the dry and wet season, with mean signal strength loss difference of 2.42dBm using
the developed Maiduguri model which revealed an improvement during the dry season
compared to the wet season due to increase in foliage depth and moisture content of the earth
surface during the wet. When the obtained results were compared with both the Wiessberger
and ITU models, an agreement was seen. Both models revealed that mobile network
signals suffer greater losses when there is increased foliage.
Signal strength difference between the 2 seasons in the rural areas observed and the mean
signal strength difference obtained -5.33dB was captured in table 6 below.
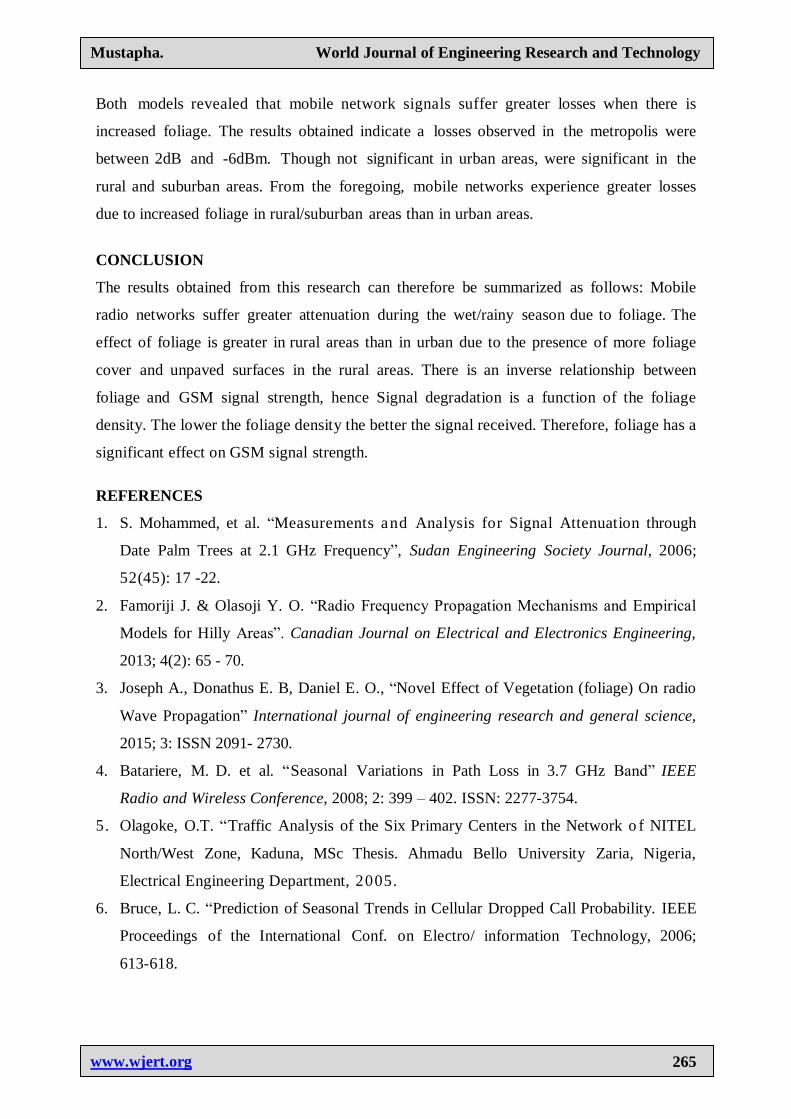
Table 6: Signal Strength Difference Measured from Auno Village (Rural).
Test Point
Distance
from Base
Station (m)
Received Signal
Strength (wet)
(dBm)
Received Signal
Strength (dry)
(dBm)
Signal Strength
Difference
(dBm)
TP 1 0 -52 -52 0
TP 2 1000 -69 -61 -8
TP 3 2000 -93 -88 -5
TP 4 3000 -98 -91 -7
TP 5 4000 -92 -84 -8
TP 6 5000 -102 -98 -4
Mean Signal Strength
Difference (dBm) -5.33
The mean signal strength difference between the two seasons was obtained; these represent
additional propagation losses due to increased foliage which is the main feature that
characterize the wet season. Conversely, additional losses with mean values of between -
4dB and -8dB were observed in the rural area.
Mustapha. World Journal of Engineering Research and Technology
www.wjert.org
265
Both models revealed that mobile network signals suffer greater losses when there is
increased foliage. The results obtained indicate a losses observed in the metropolis were
between 2dB and -6dBm. Though not significant in urban areas, were significant in the
rural and suburban areas. From the foregoing, mobile networks experience greater losses
due to increased foliage in rural/suburban areas than in urban areas.
CONCLUSION
The results obtained from this research can therefore be summarized as follows: Mobile
radio networks suffer greater attenuation during the wet/rainy season due to foliage. The
effect of foliage is greater in rural areas than in urban due to the presence of more foliage
cover and unpaved surfaces in the rural areas. There is an inverse relationship between
foliage and GSM signal strength, hence Signal degradation is a function of the foliage
density. The lower the foliage density the better the signal received. Therefore, foliage has a
significant effect on GSM signal strength.
REFERENCES
1. S. Mohammed, et al. “Measurements and Analysis for Signal Attenuation through
Date Palm Trees at 2.1 GHz Frequency”, Sudan Engineering Society Journal, 2006;
52(45): 17 -22.
2. Famoriji J. & Olasoji Y. O. “Radio Frequency Propagation Mechanisms and Empirical
Models for Hilly Areas”. Canadian Journal on Electrical and Electronics Engineering,
2013; 4(2): 65 - 70.
3. Joseph A., Donathus E. B, Daniel E. O., “Novel Effect of Vegetation (foliage) On radio
Wave Propagation” International journal of engineering research and general science,
2015; 3: ISSN 2091- 2730.
4. Batariere, M. D. et al. “Seasonal Variations in Path Loss in 3.7 GHz Band” IEEE
Radio and Wireless Conference, 2008; 2: 399 – 402. ISSN: 2277-3754.
5. Olagoke, O.T. “Traffic Analysis of the Six Primary Centers in the Network o f NITEL
North/West Zone, Kaduna, MSc Thesis. Ahmadu Bello University Zaria, Nigeria,
Electrical Engineering Department, 2005.
6. Bruce, L. C. “Prediction of Seasonal Trends in Cellular Dropped Call Probability. IEEE
Proceedings of the International Conf. on Electro/ information Technology, 2006;
613-618.
Mustapha. World Journal of Engineering Research and Technology
www.wjert.org
266
7. Karlsson, R. E. S., C. Berglund, and N. Lowendahl, “The Influence of Trees on Radio
Channel at Frequencies of 3& 5 GHz”, IEEE VTS 54th Vehicular Technology
Conference, 2012.
8. Helhel, S et al. “Investigation of GSM Signal Variation Dry and Wet Earth Effects”, A
Progress Report in Electromagnetics Research, Department of Electrical and
Electronics Engineering, Akdeniz University Antalya, Turkey. Retrieved from
www.ieee.org on June 2009.
9. Abdullahi, T. S. “Network Optimization in a GSM System: A Case Study of MTN
Nigeria Communications Limited. Ahmadu Bello University Zaria. Nigeria, Electrical
Engineering Department, MSc Thesis, 2008.
10. Seybold, J. S. “Introduction to RF Propagation”, New York: John Wiley & Sons Inc.,
2005.
11. Meng, Y. S. et al. “Study of Propagation Loss Prediction in Forest Environment” School
of Electrical and Electronic Engineering Nanyang Technological University Singapore.
Singapore, MSc thesis Progress report, 2009.
12. Nigerian communication commission data sheet, www.ncc.gov.ng.