Embed Size (px)
Citation preview

World Energy Prospects to 2050
Mr. Bo Diczfalusy
Director Sustainable Energy Policy and TechnologyDirector, Sustainable Energy Policy and Technology
International Energy Agency
Clean Coal Day in Japan
2012 I i l S i
© OECD/IEA 2012
2012 International Symposium
Tokyo, 4 September 2012

World energy prospects to 2050
Content of presentation:
Introduction to ETP2012 Introduction to ETP2012
Coal technologies g
Carbon capture and storage
© OECD/IEA 2012

ETP 2012 – Choice of 3 Futures
6DS4DS2DSwhere the world is now heading with potentially devastating results
reflecting pledges by countries to cut emissions and boost
a vision of a sustainableenergy system of reduced Greenhouse Gas (GHG) devastating results
The 6°C Scenario
emissions and boost energy efficiency
The 4°C Scenario
Greenhouse Gas (GHG) and CO2 emissions
The 2°C Scenario The 6 C ScenarioThe 4 C ScenarioThe 2 C Scenario
© OECD/IEA 2012

Sustainable future still in reach
Are we on track to Can we get on Is a clean energy reach a clean
energy future?track? transition urgent?
NO ✗ YES ✓ YES ✓
© OECD/IEA 2012

Recommendations to Governments
1. Create an investment climate of confidencein clean energy
2. Unlock the incredible potential of energy ffi i “th hidd ” f l f th f tefficiency – “the hidden” fuel of the future
3 A l t i ti d bli h3. Accelerate innovation and public research, development and demonstration (RD&D)
© OECD/IEA 2012

A smart, sustainable energy system
Renewable energy resourcesCo generation
Centralised fuel productionCentralised fuel production
Renewable energy resourcesCo-generation
Centralised fuel production,power and storage
Centralised fuel production,power and storage
Smart energysystem control
Distributedenergy resources
H vehicle2
EVSurplus heat
© OECD/IEA 2012
A sustainable energy system is a smarter, more unified and integrated energy system.

Clean energy: slow lane to fast track
Cleaner coal power Cleaner coal power
Nuclear power
Renewable power
CCS in power
Progress is too slow in
CCS in power
CCS in industry
almost all technology areas
Significant action is required
Industry
Significant action is required to get back on track Buildings
Fuel economy
Electric vehicles
© OECD/IEA 2012
Biofuels for transport

Low-carbon electricity: a clean core
2DS
35 000
40 000
45 000 Other
Wind
Solar
2DS
25 000
30 000
35 000Hydro
Nuclear
Biomass and wasteTWh
10 000
15 000
20 000Biomass and waste
Oil
Gas with CCS
Gas
T
0
5 000
10 000
2009 2020 2030 2040 2050
Gas
Coal with CCS
Coal
2009 2020 2030 2040 2050
Renewables will generate more than half the world’s electricity in the 2DS.
© OECD/IEA 2012

Natural gas: a transitional fuel
7 5002DS
7 500
tura
l Gas
5 000
n fro
m N
atW
h
2 500
Gen
erat
ion TW
02009 2020 2030 2040 2050P
ower
G
OECD China India Other non-OECD
© OECD/IEA 2012
Around 2030, natural gas becomes ‘high carbon’.

The CCS infant must grow quickly
Mt CO2
Mt CO2
Mt CO2
Mt CO2
t CO
2
Mt CO2 M
Note: Capture rates in MtCO2 /year
A projected 123 GtCO capt red bet een 2015 and 2050 the
© OECD/IEA 2012
A projected 123 GtCO2 captured between 2015 and 2050, the majority from power generation; in some regions, however, CO2 captured from industrial applications dominates.

Industry must become more efficient
10
12 6DS
Other industries
6
8 Chemicals and petrochemicalsAluminiumO
2
4
6 Aluminium
Pulp and paperGtC
O
0
2
2010 2020 2030 2040 20 0
Iron and steel
Cement2010 2020 2030 2040 2050
© OECD/IEA 2012
Significant potential for enhanced energy efficiency can be achieved through best available technologies.

Clean energy investment pays off
With price effect
Additionalinvestment
ngs
Power
Industry
Additional investment
With price effect
Additionalinvestment
ings
Power
Industry
Additional investment
With price effect
Additionalinvestment
ngs
Power
Additional investment
Undiscounted
Without price effect
price effect
Fuel
sav
i
Transport
Residential
CommercialUndiscounted
Without price effect
price effect
Fuel
sav
i
Transport
Residential
CommercialUndiscounted
Without price effect
price effect
Fuel
sav
i
Industry
Transport
3%
Undiscounted
Tota
l sav
ings
Biomass
Coal
Fuel savings3%
Undiscounted
Tota
l sav
ings
Biomass
Coal
Fuel savings3%
Undiscounted
Tota
l sav
ings
Residential
Commercial
- 160 - 120 - 80 - 40 0 40
10%
T Coal
Oil
Gas- 160 - 120 - 80 - 40 0 40
10%
T Coal
Oil
Gas- 160 - 120 - 80 - 40 0 40
10%
T Commercial
USD trillion
© OECD/IEA 2012
Every additional dollar invested in clean energy can generate 3 dollars in return.

World energy prospects to 2050
Content of presentation:p
Introduction to ETP2012
Coal technologies
C b t d t Carbon capture and storage
© OECD/IEA 2012

Fossil fuels dominate energy demand …
(EJ)
y de
man
d ar
y en
ergy
Prim
a
© OECD/IEA 2012
Efficiency improvement reduces specific fuel consumption and also reduces specific pollutant emissions.

Non-fossil power generation
TWh)
(%)
nera
tion
(
lect
ricity
Non-hydro renewables
ricity
gen
hare
of e
l
Hydro
Ele
ctr
Sh
Nuclear
Despite an increasing contrib tion across t o decades the
© OECD/IEA 2012
Despite an increasing contribution across two decades, the share of non-fossil generation has failed to keep pace with the growth in generation from fossil fuels

The size of the challenge is clear
e)co
al (M
tce
6 DS
man
d fo
r c Medium-termcoal market report
ener
gy d
em
4 DS
Prim
ary
e
2 DS
© OECD/IEA 2012
Near-term projections are not consistent with a low-carbon scenario

Reducing emissions from coal is critical
(2) R d GHG (3) R d(1) Effi i (2) Reduce non-GHG emissions
(3) ReduceCO2 emissions
(1) Efficiency improvement
© OECD/IEA 2012
Efficiency improvement reduces specific fuel consumption and also reduces specific pollutant emissions.

Advanced technology is essential re
(°C
) Advanced-USC 700oCDemonstrations are being planned from
mpe
ratu
r g p2020 - 2025
stea
m te
m
Ultra-supercritical
axim
um s
Supercritical
Subcritical
Ma Subcritical
© OECD/IEA 2012
Ultra-supercritical plants are currently operated in various countries, particularly China.
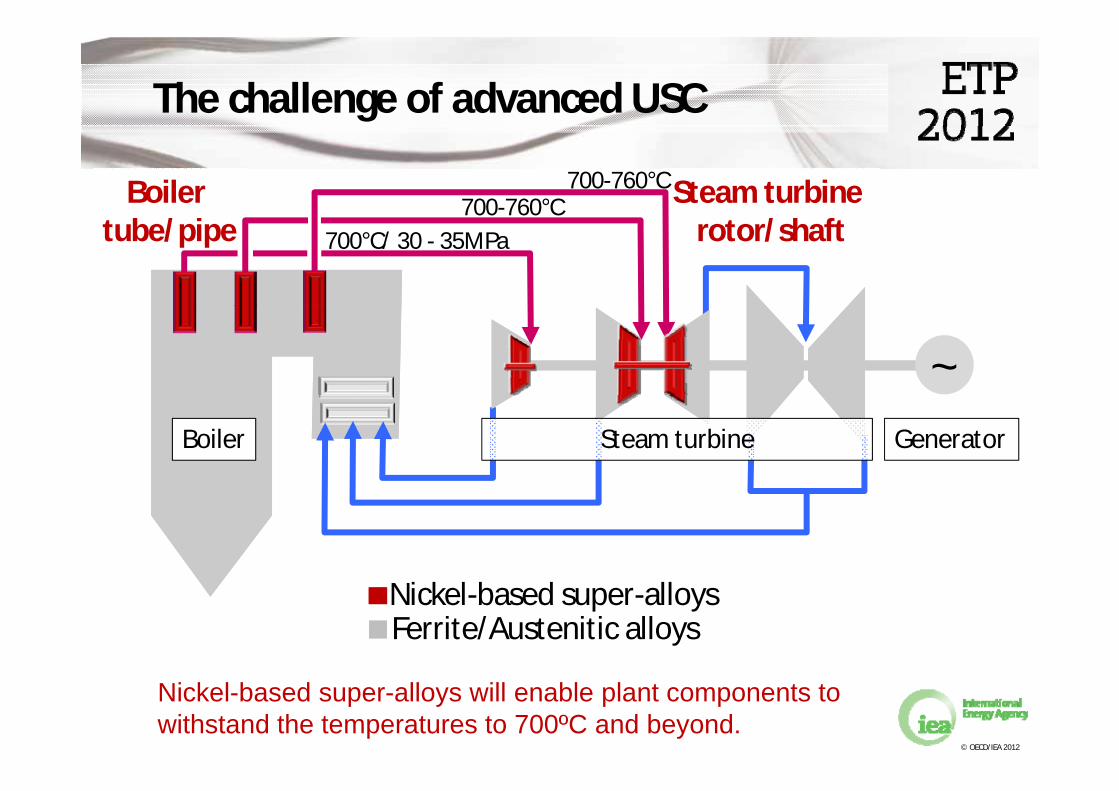
The challenge of advanced USC
Boiler Steam turbine 700-760°C 700-760°C
tube/pipe rotor/shaft700°C/ 30 - 35MPa
~GeneratorBoiler Steam turbine
Nickel-based super-alloys Ferrite/Austenitic alloys
© OECD/IEA 2012
Nickel-based super-alloys will enable plant components to withstand the temperatures to 700ºC and beyond.

World energy prospects to 2050
Content of presentation:p
Introduction to ETP2012
Coal technologies
C b t d t Carbon capture and storage
© OECD/IEA 2012

CCS is deployed globally
2DS
In the near term the largest amount of CO2 is captured in OECD
© OECD/IEA 2012
In the near term, the largest amount of CO2 is captured in OECD countries; by 2050, CO2 capture in non-OECD countries dominates.

CCS is applied in power and industry
Note: Capture rates in MtCO2/year
The majority of CO2 is captured from power generation globally but in
© OECD/IEA 2012
The majority of CO2 is captured from power generation globally, but in some regions CO2 captured from industrial applications dominates.

Where is CO2 storage needed?
Between 2015 and 2050, 123 gigatonnes of CO2 are captured that need
Note: Mass captured in GtCO2
© OECD/IEA 2012
Between 2015 and 2050, 123 gigatonnes of CO2 are captured that need to be transported to suitable sites and stored safely and effectively. Storage sites will need to be developed all around the world.

i / t
For much more, please visit
www.iea.org/etp
© OECD/IEA 2012