Embed Size (px)
Citation preview
World Economic Situation and Prospects 2015
asdfUnited NationsNew York, 2015
Statistical annex
Country classification
Data sources, country classifications and aggregation methodology
The statistical annex contains a set of data that the World Economic Situation and Prospects (WESP) employs to delineate trends in various dimensions of the world economy.
Data sourcesThe annex was prepared by the Development Policy and Analysis Division (DPAD) of the Department of Economic and Social Affairs of the United Nations Secretariat (UN/DESA). It is based on information obtained from the Statistics Division and the Population Division of UN/DESA, as well as from the five United Nations regional commissions, the United Na-tions Conference on Trade and Development (UNCTAD), the United Nations World Tour-ism Organization (UNWTO), the International Monetary Fund (IMF), the World Bank, the Organization for Economic Cooperation and Development (OECD), and national and private sources. Estimates for the most recent years were made by DPAD in consultation with the regional commissions, UNCTAD, UNWTO and participants in Project LINK, an international collaborative research group for econometric modelling coordinated jointly by DPAD and the University of Toronto. Forecasts for 2015 and 2016 are primarily based on the World Economic Forecasting Model of DPAD, with support from Project LINK.
Data presented in WESP may differ from those published by other organizations for a series of reasons, including differences in timing, sample composition and aggregation methods. Historical data may differ from those in previous editions of WESP because of updating and changes in the availability of data for individual countries.
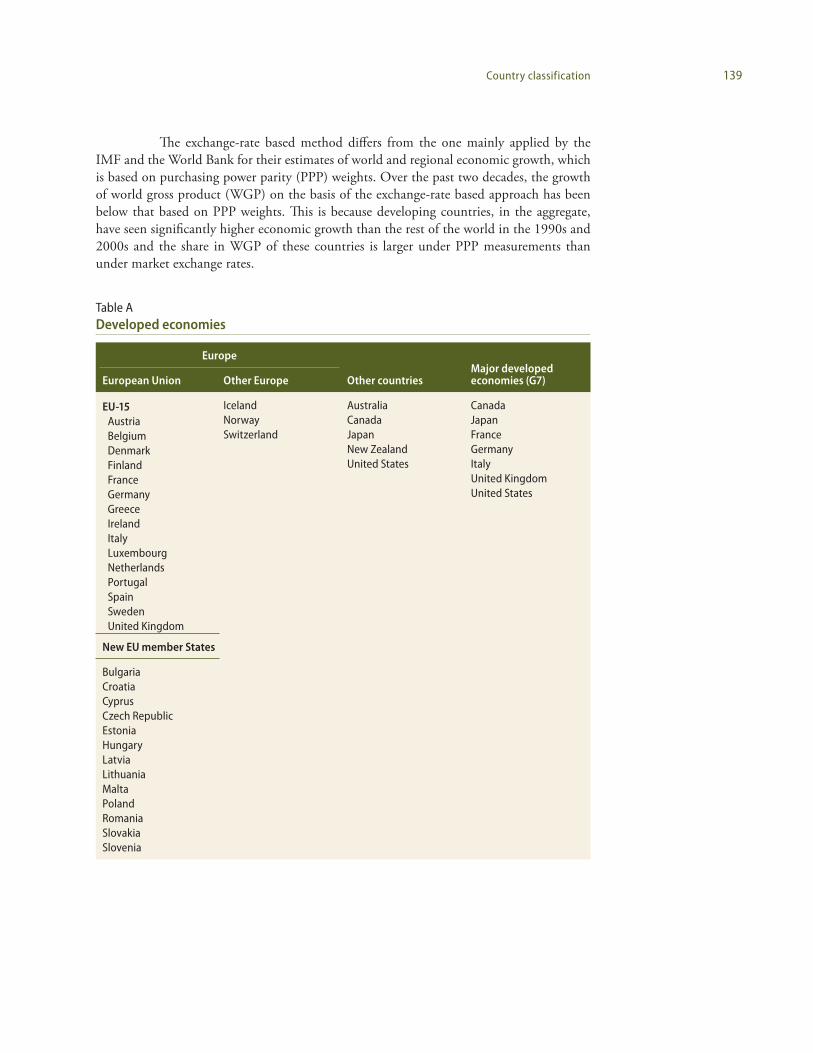
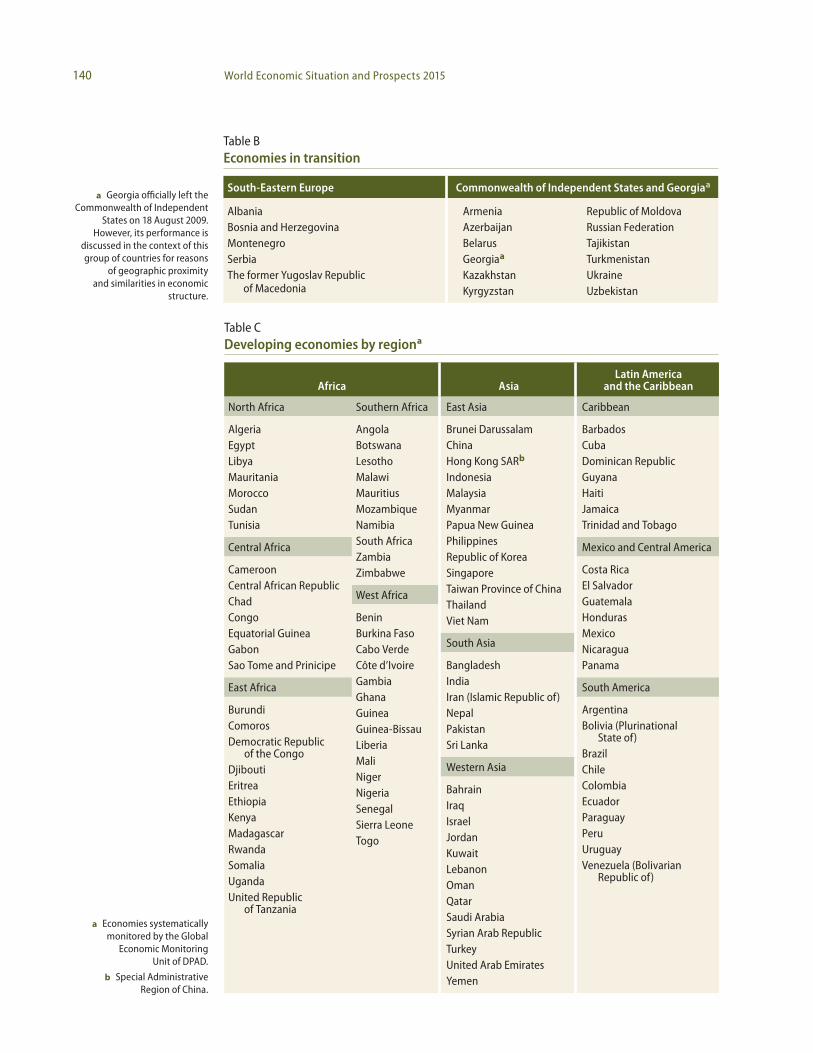
Country classificationsFor analytical purposes, WESP classifies all countries of the world into one of three broad categories: developed economies, economies in transition and developing economies. The composition of these groupings, specified in tables A, B and C, is intended to reflect basic economic country conditions. Several countries (in particular the economies in transition) have characteristics that could place them in more than one category; however, for purposes of analysis, the groupings have been made mutually exclusive. Within each broad category, some subgroups are defined based either on geographical location or on ad hoc criteria, such as the subgroup of “major developed economies”, which is based on the membership of the Group of Seven. Geographical regions for developing economies are as follows: Africa, East Asia, South Asia, Western Asia, and Latin America and the Caribbean.1
1 Names and composition of geographical areas follow those specified in the statistical paper entitled “Standard country or area codes for statistical use” (ST/ESA/STAT/SER.M/49/Rev. 4).
138 World Economic Situation and Prospects 2015
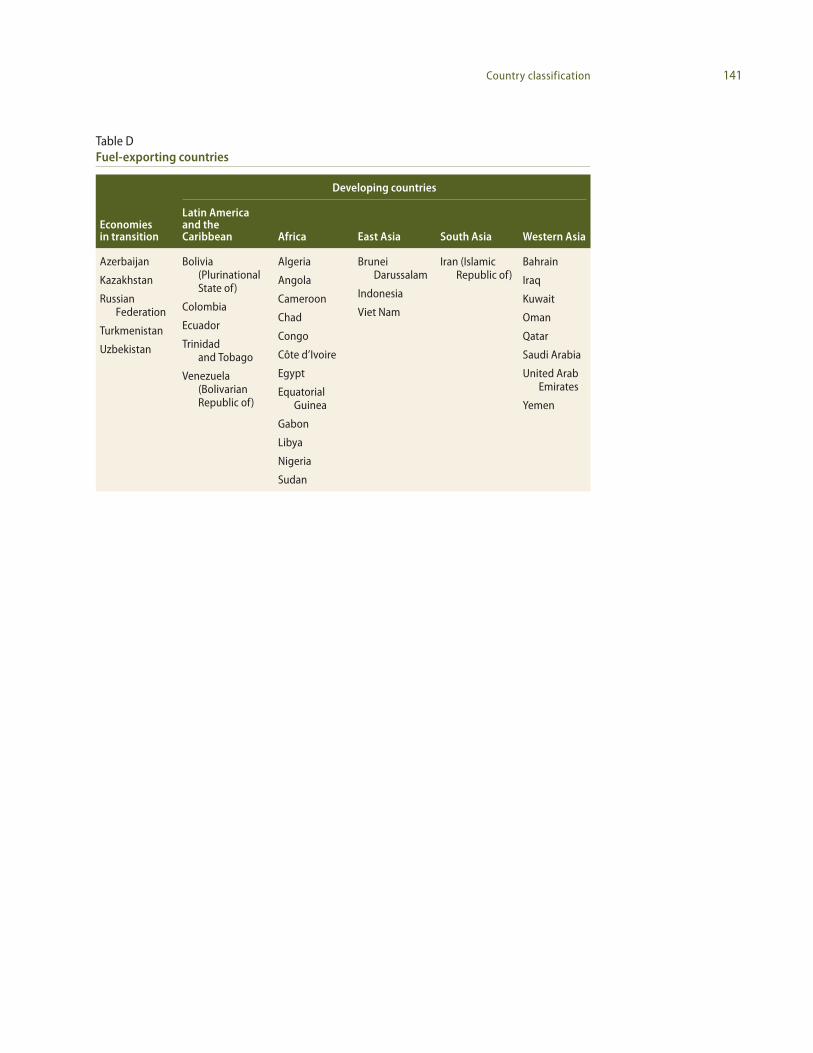
In parts of the analysis, a distinction is made between fuel exporters and fuel import-ers from among the economies in transition and the developing countries. An economy is classified as a fuel exporter if the share of fuel exports in its total merchandise exports is greater than 20 per cent and the level of fuel exports is at least 20 per cent higher than that of the country’s fuel imports. This criterion is drawn from the share of fuel exports in the total value of world merchandise trade. Fuels include coal, oil and natural gas (table D).
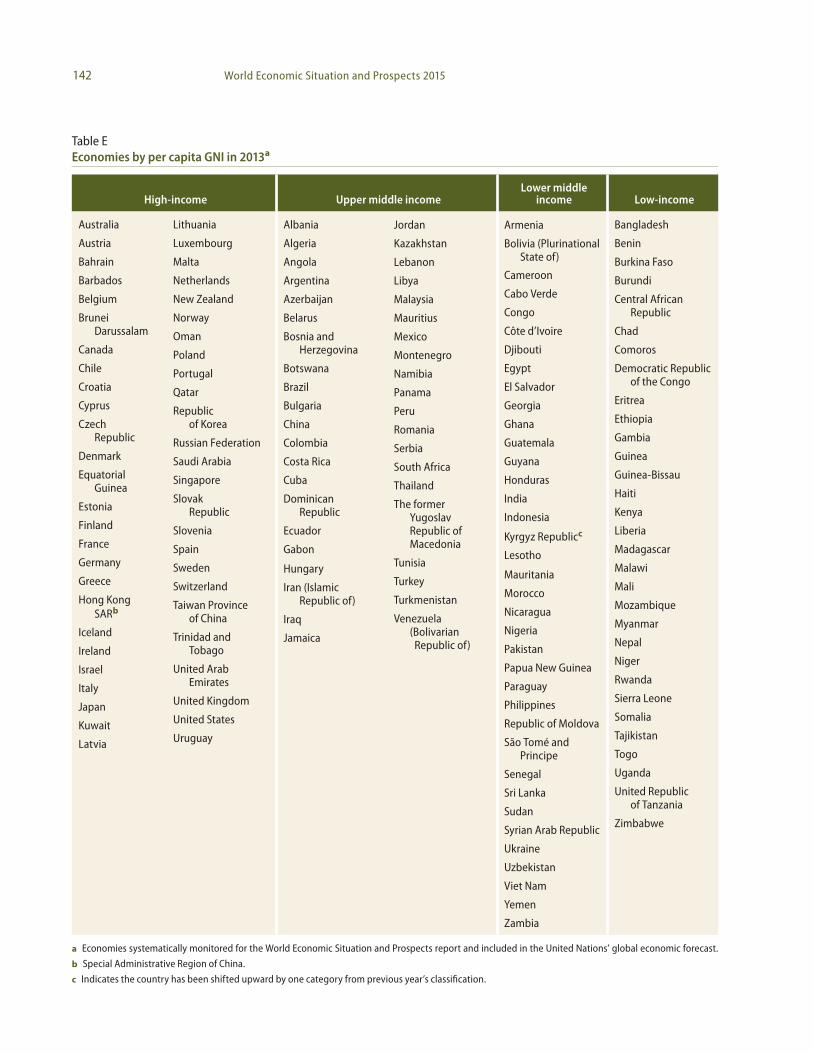
For other parts of the analysis, countries have been classified by their level of develop-ment as measured by per capita gross national income (GNI). Accordingly, countries have been grouped as high-income, upper middle income, lower middle income and low-income (table E). To maintain compatibility with similar classifications used elsewhere, the thresh-old levels of GNI per capita are those established by the World Bank. Countries with less than $1,045 GNI per capita are classified as low-income countries, those with between $1,046 and $4,125 as lower middle income countries, those with between $4,126 and $12,745 as upper middle income countries, and those with incomes of more than $12,746 as high-income countries. GNI per capita in dollar terms is estimated using the World Bank Atlas method,2 and the classification in table E is based on data for 2013.
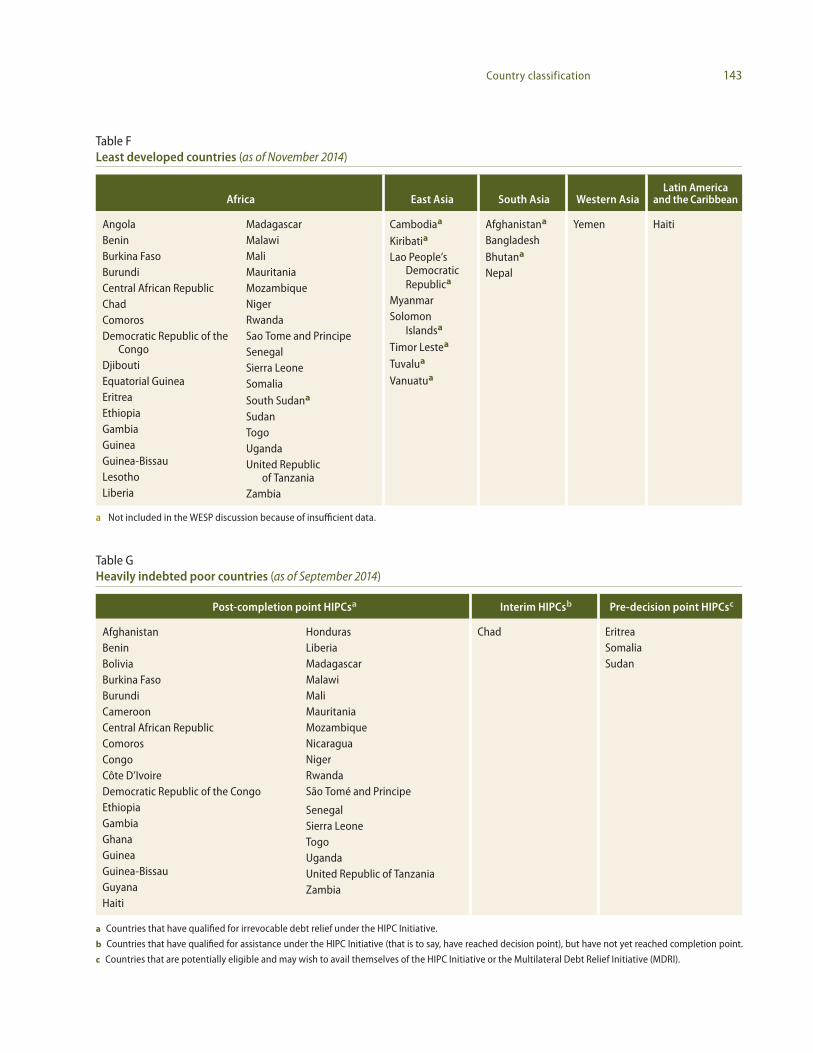
The list of the least developed countries (LDCs) is decided upon by the United Nations Economic and Social Council and, ultimately, by the General Assembly, on the basis of recom-mendations made by the Committee for Development Policy. The basic criteria for inclusion require that certain thresholds be met with regard to per capita GNI, a human assets index and an economic vulnerability index.3 As at 30 November 2014, there were 47 LDCs (table F).
WESP also makes reference to the group of heavily indebted poor countries (HIPCs), which are considered by the World Bank and IMF as part of their debt-relief initiative (the Enhanced HIPC Initiative).4 In September 2014, there were 39 HIPCs (see table G).
Aggregation methodologyAggregate data are either sums or weighted averages of individual country data. Unless otherwise indicated, multi-year averages of growth rates are expressed as compound annual percentage rates of change. The convention followed is to omit the base year in a multi-year growth rate. For example, the 10-year average growth rate for the decade of the 2000s would be identified as the average annual growth rate for the period from 2001 to 2010.
WESP utilizes exchange-rate conversions of national data in order to aggregate output of individual countries into regional and global totals. The growth of output in each group of countries is calculated from the sum of gross domestic product (GDP) of individual countries measured at 2010 prices and exchange rates. Data for GDP in 2010 in national currencies were converted into dollars (with selected adjustments) and extended forwards and backwards in time using changes in real GDP for each country. This method supplies a reasonable set of aggregate growth rates for a period of about 15 years, centred on 2010.
2 See http://data.worldbank.org/about/country-classifications.3 Handbook on the Least Developed Country Category: Inclusion, Graduation and Special Support Measures
(United Nations publication, Sales No. E.07.II.A.9). Available from http://www.un.org/esa/analysis/devplan/cdppublications/2008cdphandbook.pdf.
4 IMF, Debt Relief Under the Heavily Indebted Poor Countries (HIPC) Initiative, available from http://www.imf.org/external/np/exr/facts/pdf/hipc.pdf.
139Country classification
Table ADeveloped economies
Europe
Other countriesMajor developed economies (G7)European Union Other Europe
EU-15AustriaBelgiumDenmarkFinlandFranceGermanyGreeceIrelandItalyLuxembourgNetherlandsPortugalSpainSwedenUnited Kingdom
IcelandNorwaySwitzerland
AustraliaCanadaJapanNew ZealandUnited States
CanadaJapanFranceGermanyItalyUnited Kingdom United States
New EU member States
BulgariaCroatiaCyprusCzech RepublicEstoniaHungaryLatviaLithuaniaMaltaPolandRomaniaSlovakiaSlovenia
The exchange-rate based method differs from the one mainly applied by the IMF and the World Bank for their estimates of world and regional economic growth, which is based on purchasing power parity (PPP) weights. Over the past two decades, the growth of world gross product (WGP) on the basis of the exchange-rate based approach has been below that based on PPP weights. This is because developing countries, in the aggregate, have seen significantly higher economic growth than the rest of the world in the 1990s and 2000s and the share in WGP of these countries is larger under PPP measurements than under market exchange rates.
140 World Economic Situation and Prospects 2015
a Georgia officially left the Commonwealth of Independent
States on 18 August 2009. However, its performance is
discussed in the context of this group of countries for reasons
of geographic proximity and similarities in economic
structure.
Table BEconomies in transition
South-Eastern Europe Commonwealth of Independent States and Georgiaa
AlbaniaBosnia and HerzegovinaMontenegroSerbia The former Yugoslav Republic
of Macedonia
ArmeniaAzerbaijanBelarusGeorgiaa
KazakhstanKyrgyzstan
Republic of MoldovaRussian FederationTajikistanTurkmenistanUkraineUzbekistan
Table CDeveloping economies by regiona
Africa AsiaLatin America
and the Caribbean
North Africa Southern Africa East Asia Caribbean
AlgeriaEgyptLibyaMauritaniaMoroccoSudanTunisia
AngolaBotswanaLesothoMalawiMauritiusMozambiqueNamibiaSouth AfricaZambiaZimbabwe
Brunei DarussalamChinaHong Kong SARb
IndonesiaMalaysiaMyanmarPapua New GuineaPhilippinesRepublic of KoreaSingaporeTaiwan Province of ChinaThailandViet Nam
BarbadosCubaDominican RepublicGuyanaHaitiJamaicaTrinidad and Tobago
Central Africa Mexico and Central America
CameroonCentral African RepublicChadCongoEquatorial GuineaGabonSao Tome and Prinicipe
Costa RicaEl SalvadorGuatemalaHondurasMexicoNicaraguaPanama
West Africa
BeninBurkina FasoCabo VerdeCôte d’IvoireGambiaGhanaGuineaGuinea-BissauLiberiaMaliNigerNigeriaSenegalSierra LeoneTogo
South Asia
BangladeshIndiaIran (Islamic Republic of)NepalPakistanSri Lanka
East Africa South America
BurundiComorosDemocratic Republic
of the CongoDjiboutiEritreaEthiopiaKenyaMadagascarRwandaSomaliaUgandaUnited Republic
of Tanzania
ArgentinaBolivia (Plurinational
State of)BrazilChileColombiaEcuadorParaguayPeruUruguayVenezuela (Bolivarian
Republic of)
Western Asia
BahrainIraqIsraelJordanKuwaitLebanonOmanQatarSaudi ArabiaSyrian Arab RepublicTurkeyUnited Arab EmiratesYemen
a Economies systematically monitored by the Global
Economic Monitoring Unit of DPAD.
b Special Administrative Region of China.
141Country classification
Table DFuel-exporting countries
Economies in transition
Developing countries
Latin America and the Caribbean Africa East Asia South Asia Western Asia
Azerbaijan
Kazakhstan
Russian Federation
Turkmenistan
Uzbekistan
Bolivia (Plurinational State of)
Colombia
Ecuador
Trinidad and Tobago
Venezuela (Bolivarian Republic of)
Algeria
Angola
Cameroon
Chad
Congo
Côte d’Ivoire
Egypt
Equatorial Guinea
Gabon
Libya
Nigeria
Sudan
Brunei Darussalam
Indonesia
Viet Nam
Iran (Islamic Republic of)
Bahrain
Iraq
Kuwait
Oman
Qatar
Saudi Arabia
United Arab Emirates
Yemen
142 World Economic Situation and Prospects 2015
Table EEconomies by per capita GNI in 2013a
High-income Upper middle incomeLower middle
income Low-income
Australia
Austria
Bahrain
Barbados
Belgium
Brunei Darussalam
Canada
Chile
Croatia
Cyprus
Czech Republic
Denmark
Equatorial Guinea
Estonia
Finland
France
Germany
Greece
Hong Kong SARb
Iceland
Ireland
Israel
Italy
Japan
Kuwait
Latvia
Lithuania
Luxembourg
Malta
Netherlands
New Zealand
Norway
Oman
Poland
Portugal
Qatar
Republic of Korea
Russian Federation
Saudi Arabia
Singapore
Slovak Republic
Slovenia
Spain
Sweden
Switzerland
Taiwan Province of China
Trinidad and Tobago
United Arab Emirates
United Kingdom
United States
Uruguay
Albania
Algeria
Angola
Argentina
Azerbaijan
Belarus
Bosnia and Herzegovina
Botswana
Brazil
Bulgaria
China
Colombia
Costa Rica
Cuba
Dominican Republic
Ecuador
Gabon
Hungary
Iran (Islamic Republic of)
Iraq
Jamaica
Jordan
Kazakhstan
Lebanon
Libya
Malaysia
Mauritius
Mexico
Montenegro
Namibia
Panama
Peru
Romania
Serbia
South Africa
Thailand
The former Yugoslav Republic of Macedonia
Tunisia
Turkey
Turkmenistan
Venezuela (Bolivarian Republic of)
Armenia
Bolivia (Plurinational State of)
Cameroon
Cabo Verde
Congo
Côte d’Ivoire
Djibouti
Egypt
El Salvador
Georgia
Ghana
Guatemala
Guyana
Honduras
India
Indonesia
Kyrgyz Republicc
Lesotho
Mauritania
Morocco
Nicaragua
Nigeria
Pakistan
Papua New Guinea
Paraguay
Philippines
Republic of Moldova
São Tomé and Principe
Senegal
Sri Lanka
Sudan
Syrian Arab Republic
Ukraine
Uzbekistan
Viet Nam
Yemen
Zambia
Bangladesh
Benin
Burkina Faso
Burundi
Central African Republic
Chad
Comoros
Democratic Republic of the Congo
Eritrea
Ethiopia
Gambia
Guinea
Guinea-Bissau
Haiti
Kenya
Liberia
Madagascar
Malawi
Mali
Mozambique
Myanmar
Nepal
Niger
Rwanda
Sierra Leone
Somalia
Tajikistan
Togo
Uganda
United Republic of Tanzania
Zimbabwe
a Economies systematically monitored for the World Economic Situation and Prospects report and included in the United Nations’ global economic forecast.
b Special Administrative Region of China.
c Indicates the country has been shifted upward by one category from previous year’s classification.
143Country classification
Table FLeast developed countries (as of November 2014)
Africa East Asia South Asia Western AsiaLatin America
and the Caribbean
AngolaBeninBurkina FasoBurundiCentral African RepublicChadComorosDemocratic Republic of the
CongoDjiboutiEquatorial GuineaEritreaEthiopiaGambiaGuineaGuinea-BissauLesothoLiberia
MadagascarMalawiMaliMauritaniaMozambiqueNigerRwandaSao Tome and PrincipeSenegalSierra LeoneSomaliaSouth Sudana
SudanTogoUgandaUnited Republic
of TanzaniaZambia
Cambodiaa
Kiribatia
Lao People’s Democratic Republica
MyanmarSolomon
Islandsa
Timor Lestea
Tuvalua
Vanuatua
Afghanistana
BangladeshBhutana
Nepal
Yemen Haiti
a Not included in the WESP discussion because of insufficient data.
Table GHeavily indebted poor countries (as of September 2014)
Post-completion point HIPCsa Interim HIPCsb Pre-decision point HIPCsc
AfghanistanBeninBoliviaBurkina FasoBurundiCameroonCentral African RepublicComorosCongoCôte D’IvoireDemocratic Republic of the CongoEthiopiaGambiaGhanaGuineaGuinea-BissauGuyanaHaiti
HondurasLiberiaMadagascarMalawiMaliMauritaniaMozambiqueNicaraguaNigerRwandaSão Tomé and Principe
SenegalSierra LeoneTogoUgandaUnited Republic of TanzaniaZambia
Chad EritreaSomaliaSudan
a Countries that have qualified for irrevocable debt relief under the HIPC Initiative.
b Countries that have qualified for assistance under the HIPC Initiative (that is to say, have reached decision point), but have not yet reached completion point.
c Countries that are potentially eligible and may wish to avail themselves of the HIPC Initiative or the Multilateral Debt Relief Initiative (MDRI).
144 World Economic Situation and Prospects 2015
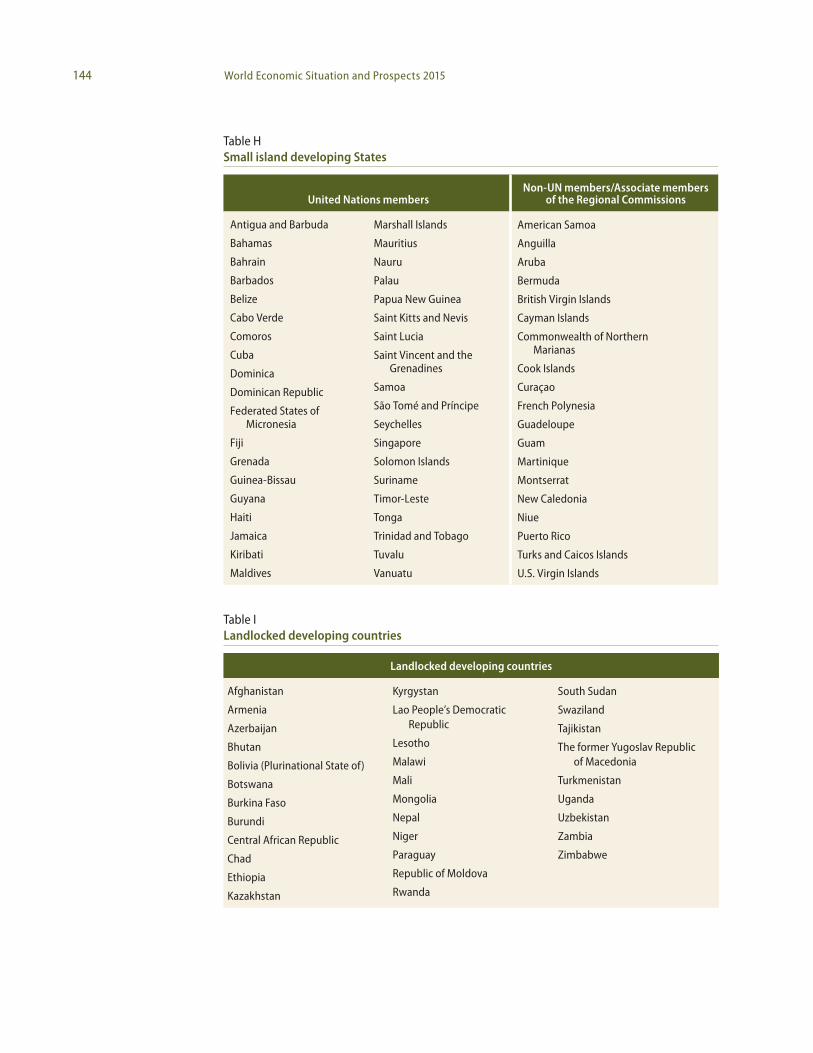
Table HSmall island developing States
United Nations membersNon-UN members/Associate members
of the Regional Commissions
Antigua and Barbuda
Bahamas
Bahrain
Barbados
Belize
Cabo Verde
Comoros
Cuba
Dominica
Dominican Republic
Federated States of Micronesia
Fiji
Grenada
Guinea-Bissau
Guyana
Haiti
Jamaica
Kiribati
Maldives
Marshall Islands
Mauritius
Nauru
Palau
Papua New Guinea
Saint Kitts and Nevis
Saint Lucia
Saint Vincent and the Grenadines
Samoa
São Tomé and Príncipe
Seychelles
Singapore
Solomon Islands
Suriname
Timor-Leste
Tonga
Trinidad and Tobago
Tuvalu
Vanuatu
American Samoa
Anguilla
Aruba
Bermuda
British Virgin Islands
Cayman Islands
Commonwealth of Northern Marianas
Cook Islands
Curaçao
French Polynesia
Guadeloupe
Guam
Martinique
Montserrat
New Caledonia
Niue
Puerto Rico
Turks and Caicos Islands
U.S. Virgin Islands
Table ILandlocked developing countries
Landlocked developing countries
Afghanistan
Armenia
Azerbaijan
Bhutan
Bolivia (Plurinational State of)
Botswana
Burkina Faso
Burundi
Central African Republic
Chad
Ethiopia
Kazakhstan
Kyrgystan
Lao People’s Democratic Republic
Lesotho
Malawi
Mali
Mongolia
Nepal
Niger
Paraguay
Republic of Moldova
Rwanda
South Sudan
Swaziland
Tajikistan
The former Yugoslav Republic of Macedonia
Turkmenistan
Uganda
Uzbekistan
Zambia
Zimbabwe

Annex tables
147Annex tables
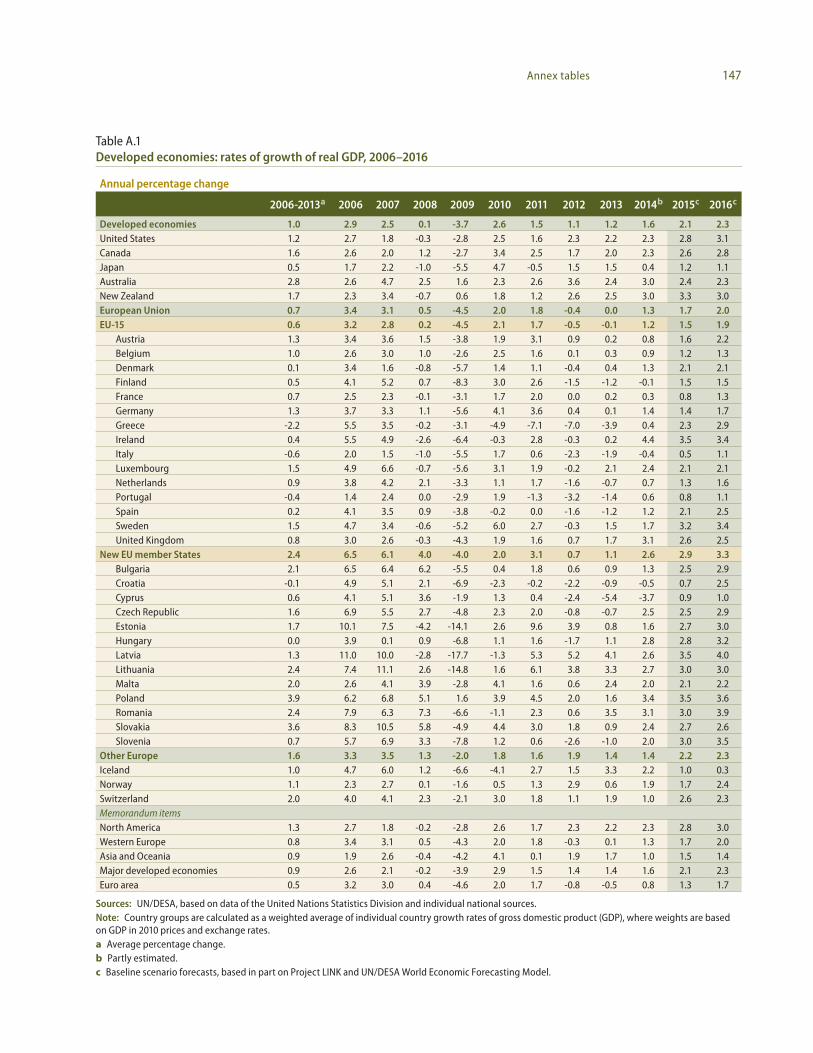
Table A.1Developed economies: rates of growth of real GDP, 2006–2016
Annual percentage change
2006-2013a 2006 2007 2008 2009 2010 2011 2012 2013 2014b 2015c 2016c
Developed economies 1.0 2.9 2.5 0.1 -3.7 2.6 1.5 1.1 1.2 1.6 2.1 2.3 United States 1.2 2.7 1.8 -0.3 -2.8 2.5 1.6 2.3 2.2 2.3 2.8 3.1 Canada 1.6 2.6 2.0 1.2 -2.7 3.4 2.5 1.7 2.0 2.3 2.6 2.8 Japan 0.5 1.7 2.2 -1.0 -5.5 4.7 -0.5 1.5 1.5 0.4 1.2 1.1 Australia 2.8 2.6 4.7 2.5 1.6 2.3 2.6 3.6 2.4 3.0 2.4 2.3 New Zealand 1.7 2.3 3.4 -0.7 0.6 1.8 1.2 2.6 2.5 3.0 3.3 3.0 European Union 0.7 3.4 3.1 0.5 -4.5 2.0 1.8 -0.4 0.0 1.3 1.7 2.0 EU-15 0.6 3.2 2.8 0.2 -4.5 2.1 1.7 -0.5 -0.1 1.2 1.5 1.9
Austria 1.3 3.4 3.6 1.5 -3.8 1.9 3.1 0.9 0.2 0.8 1.6 2.2 Belgium 1.0 2.6 3.0 1.0 -2.6 2.5 1.6 0.1 0.3 0.9 1.2 1.3 Denmark 0.1 3.4 1.6 -0.8 -5.7 1.4 1.1 -0.4 0.4 1.3 2.1 2.1 Finland 0.5 4.1 5.2 0.7 -8.3 3.0 2.6 -1.5 -1.2 -0.1 1.5 1.5 France 0.7 2.5 2.3 -0.1 -3.1 1.7 2.0 0.0 0.2 0.3 0.8 1.3 Germany 1.3 3.7 3.3 1.1 -5.6 4.1 3.6 0.4 0.1 1.4 1.4 1.7 Greece -2.2 5.5 3.5 -0.2 -3.1 -4.9 -7.1 -7.0 -3.9 0.4 2.3 2.9 Ireland 0.4 5.5 4.9 -2.6 -6.4 -0.3 2.8 -0.3 0.2 4.4 3.5 3.4 Italy -0.6 2.0 1.5 -1.0 -5.5 1.7 0.6 -2.3 -1.9 -0.4 0.5 1.1 Luxembourg 1.5 4.9 6.6 -0.7 -5.6 3.1 1.9 -0.2 2.1 2.4 2.1 2.1 Netherlands 0.9 3.8 4.2 2.1 -3.3 1.1 1.7 -1.6 -0.7 0.7 1.3 1.6 Portugal -0.4 1.4 2.4 0.0 -2.9 1.9 -1.3 -3.2 -1.4 0.6 0.8 1.1 Spain 0.2 4.1 3.5 0.9 -3.8 -0.2 0.0 -1.6 -1.2 1.2 2.1 2.5 Sweden 1.5 4.7 3.4 -0.6 -5.2 6.0 2.7 -0.3 1.5 1.7 3.2 3.4 United Kingdom 0.8 3.0 2.6 -0.3 -4.3 1.9 1.6 0.7 1.7 3.1 2.6 2.5
New EU member States 2.4 6.5 6.1 4.0 -4.0 2.0 3.1 0.7 1.1 2.6 2.9 3.3 Bulgaria 2.1 6.5 6.4 6.2 -5.5 0.4 1.8 0.6 0.9 1.3 2.5 2.9 Croatia -0.1 4.9 5.1 2.1 -6.9 -2.3 -0.2 -2.2 -0.9 -0.5 0.7 2.5 Cyprus 0.6 4.1 5.1 3.6 -1.9 1.3 0.4 -2.4 -5.4 -3.7 0.9 1.0 Czech Republic 1.6 6.9 5.5 2.7 -4.8 2.3 2.0 -0.8 -0.7 2.5 2.5 2.9 Estonia 1.7 10.1 7.5 -4.2 -14.1 2.6 9.6 3.9 0.8 1.6 2.7 3.0 Hungary 0.0 3.9 0.1 0.9 -6.8 1.1 1.6 -1.7 1.1 2.8 2.8 3.2 Latvia 1.3 11.0 10.0 -2.8 -17.7 -1.3 5.3 5.2 4.1 2.6 3.5 4.0 Lithuania 2.4 7.4 11.1 2.6 -14.8 1.6 6.1 3.8 3.3 2.7 3.0 3.0 Malta 2.0 2.6 4.1 3.9 -2.8 4.1 1.6 0.6 2.4 2.0 2.1 2.2 Poland 3.9 6.2 6.8 5.1 1.6 3.9 4.5 2.0 1.6 3.4 3.5 3.6 Romania 2.4 7.9 6.3 7.3 -6.6 -1.1 2.3 0.6 3.5 3.1 3.0 3.9 Slovakia 3.6 8.3 10.5 5.8 -4.9 4.4 3.0 1.8 0.9 2.4 2.7 2.6 Slovenia 0.7 5.7 6.9 3.3 -7.8 1.2 0.6 -2.6 -1.0 2.0 3.0 3.5
Other Europe 1.6 3.3 3.5 1.3 -2.0 1.8 1.6 1.9 1.4 1.4 2.2 2.3 Iceland 1.0 4.7 6.0 1.2 -6.6 -4.1 2.7 1.5 3.3 2.2 1.0 0.3 Norway 1.1 2.3 2.7 0.1 -1.6 0.5 1.3 2.9 0.6 1.9 1.7 2.4 Switzerland 2.0 4.0 4.1 2.3 -2.1 3.0 1.8 1.1 1.9 1.0 2.6 2.3 Memorandum itemsNorth America 1.3 2.7 1.8 -0.2 -2.8 2.6 1.7 2.3 2.2 2.3 2.8 3.0 Western Europe 0.8 3.4 3.1 0.5 -4.3 2.0 1.8 -0.3 0.1 1.3 1.7 2.0 Asia and Oceania 0.9 1.9 2.6 -0.4 -4.2 4.1 0.1 1.9 1.7 1.0 1.5 1.4 Major developed economies 0.9 2.6 2.1 -0.2 -3.9 2.9 1.5 1.4 1.4 1.6 2.1 2.3 Euro area 0.5 3.2 3.0 0.4 -4.6 2.0 1.7 -0.8 -0.5 0.8 1.3 1.7
Sources: UN/DESA, based on data of the United Nations Statistics Division and individual national sources.Note: Country groups are calculated as a weighted average of individual country growth rates of gross domestic product (GDP), where weights are based on GDP in 2010 prices and exchange rates.a Average percentage change.b Partly estimated.c Baseline scenario forecasts, based in part on Project LINK and UN/DESA World Economic Forecasting Model.
148 World Economic Situation and Prospects 2015
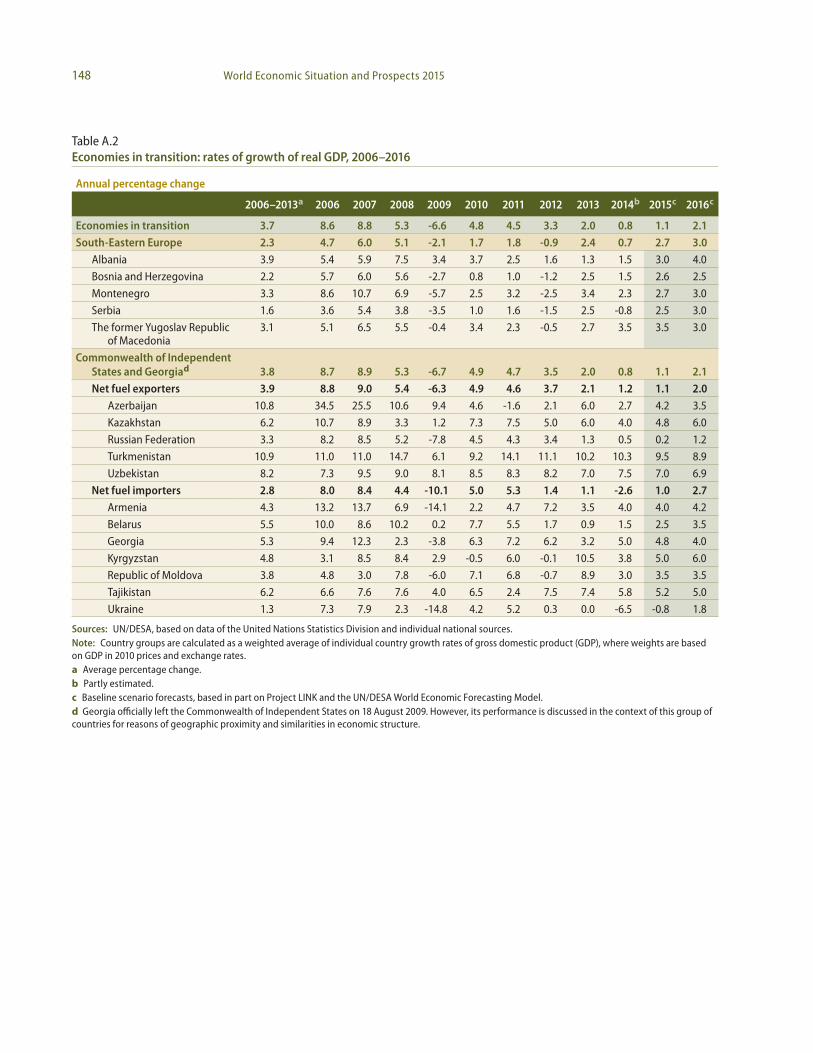
Table A.2Economies in transition: rates of growth of real GDP, 2006–2016
Annual percentage change
2006–2013a 2006 2007 2008 2009 2010 2011 2012 2013 2014b 2015c 2016c
Economies in transition 3.7 8.6 8.8 5.3 -6.6 4.8 4.5 3.3 2.0 0.8 1.1 2.1 South-Eastern Europe 2.3 4.7 6.0 5.1 -2.1 1.7 1.8 -0.9 2.4 0.7 2.7 3.0
Albania 3.9 5.4 5.9 7.5 3.4 3.7 2.5 1.6 1.3 1.5 3.0 4.0
Bosnia and Herzegovina 2.2 5.7 6.0 5.6 -2.7 0.8 1.0 -1.2 2.5 1.5 2.6 2.5
Montenegro 3.3 8.6 10.7 6.9 -5.7 2.5 3.2 -2.5 3.4 2.3 2.7 3.0
Serbia 1.6 3.6 5.4 3.8 -3.5 1.0 1.6 -1.5 2.5 -0.8 2.5 3.0
The former Yugoslav Republic of Macedonia
3.1 5.1 6.5 5.5 -0.4 3.4 2.3 -0.5 2.7 3.5 3.5 3.0
Commonwealth of Independent States and Georgiad 3.8 8.7 8.9 5.3 -6.7 4.9 4.7 3.5 2.0 0.8 1.1 2.1 Net fuel exporters 3.9 8.8 9.0 5.4 -6.3 4.9 4.6 3.7 2.1 1.2 1.1 2.0
Azerbaijan 10.8 34.5 25.5 10.6 9.4 4.6 -1.6 2.1 6.0 2.7 4.2 3.5
Kazakhstan 6.2 10.7 8.9 3.3 1.2 7.3 7.5 5.0 6.0 4.0 4.8 6.0
Russian Federation 3.3 8.2 8.5 5.2 -7.8 4.5 4.3 3.4 1.3 0.5 0.2 1.2
Turkmenistan 10.9 11.0 11.0 14.7 6.1 9.2 14.1 11.1 10.2 10.3 9.5 8.9
Uzbekistan 8.2 7.3 9.5 9.0 8.1 8.5 8.3 8.2 7.0 7.5 7.0 6.9
Net fuel importers 2.8 8.0 8.4 4.4 -10.1 5.0 5.3 1.4 1.1 -2.6 1.0 2.7 Armenia 4.3 13.2 13.7 6.9 -14.1 2.2 4.7 7.2 3.5 4.0 4.0 4.2
Belarus 5.5 10.0 8.6 10.2 0.2 7.7 5.5 1.7 0.9 1.5 2.5 3.5
Georgia 5.3 9.4 12.3 2.3 -3.8 6.3 7.2 6.2 3.2 5.0 4.8 4.0
Kyrgyzstan 4.8 3.1 8.5 8.4 2.9 -0.5 6.0 -0.1 10.5 3.8 5.0 6.0
Republic of Moldova 3.8 4.8 3.0 7.8 -6.0 7.1 6.8 -0.7 8.9 3.0 3.5 3.5
Tajikistan 6.2 6.6 7.6 7.6 4.0 6.5 2.4 7.5 7.4 5.8 5.2 5.0
Ukraine 1.3 7.3 7.9 2.3 -14.8 4.2 5.2 0.3 0.0 -6.5 -0.8 1.8
Sources: UN/DESA, based on data of the United Nations Statistics Division and individual national sources.Note: Country groups are calculated as a weighted average of individual country growth rates of gross domestic product (GDP), where weights are based on GDP in 2010 prices and exchange rates.a Average percentage change.b Partly estimated.c Baseline scenario forecasts, based in part on Project LINK and the UN/DESA World Economic Forecasting Model.d Georgia officially left the Commonwealth of Independent States on 18 August 2009. However, its performance is discussed in the context of this group of countries for reasons of geographic proximity and similarities in economic structure.
149Annex tables
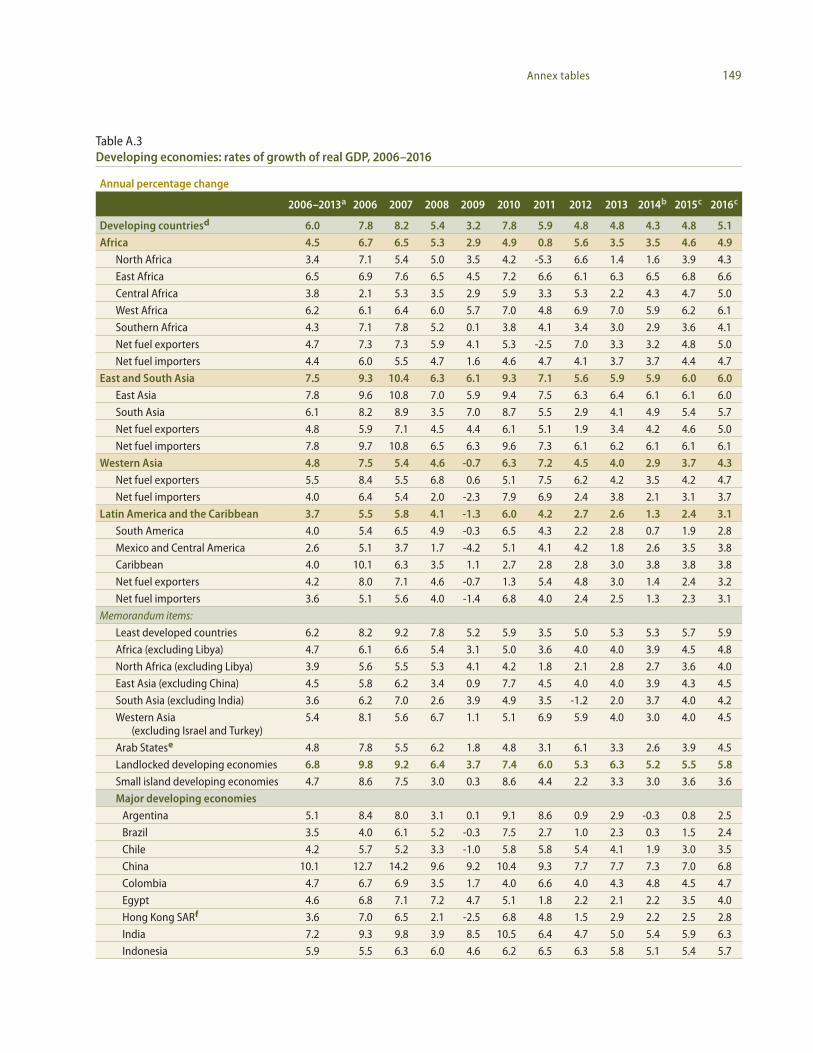
Table A.3Developing economies: rates of growth of real GDP, 2006–2016
Annual percentage change
2006–2013a 2006 2007 2008 2009 2010 2011 2012 2013 2014b 2015c 2016c
Developing countriesd 6.0 7.8 8.2 5.4 3.2 7.8 5.9 4.8 4.8 4.3 4.8 5.1 Africa 4.5 6.7 6.5 5.3 2.9 4.9 0.8 5.6 3.5 3.5 4.6 4.9
North Africa 3.4 7.1 5.4 5.0 3.5 4.2 -5.3 6.6 1.4 1.6 3.9 4.3
East Africa 6.5 6.9 7.6 6.5 4.5 7.2 6.6 6.1 6.3 6.5 6.8 6.6
Central Africa 3.8 2.1 5.3 3.5 2.9 5.9 3.3 5.3 2.2 4.3 4.7 5.0
West Africa 6.2 6.1 6.4 6.0 5.7 7.0 4.8 6.9 7.0 5.9 6.2 6.1
Southern Africa 4.3 7.1 7.8 5.2 0.1 3.8 4.1 3.4 3.0 2.9 3.6 4.1
Net fuel exporters 4.7 7.3 7.3 5.9 4.1 5.3 -2.5 7.0 3.3 3.2 4.8 5.0
Net fuel importers 4.4 6.0 5.5 4.7 1.6 4.6 4.7 4.1 3.7 3.7 4.4 4.7
East and South Asia 7.5 9.3 10.4 6.3 6.1 9.3 7.1 5.6 5.9 5.9 6.0 6.0 East Asia 7.8 9.6 10.8 7.0 5.9 9.4 7.5 6.3 6.4 6.1 6.1 6.0
South Asia 6.1 8.2 8.9 3.5 7.0 8.7 5.5 2.9 4.1 4.9 5.4 5.7
Net fuel exporters 4.8 5.9 7.1 4.5 4.4 6.1 5.1 1.9 3.4 4.2 4.6 5.0
Net fuel importers 7.8 9.7 10.8 6.5 6.3 9.6 7.3 6.1 6.2 6.1 6.1 6.1
Western Asia 4.8 7.5 5.4 4.6 -0.7 6.3 7.2 4.5 4.0 2.9 3.7 4.3 Net fuel exporters 5.5 8.4 5.5 6.8 0.6 5.1 7.5 6.2 4.2 3.5 4.2 4.7
Net fuel importers 4.0 6.4 5.4 2.0 -2.3 7.9 6.9 2.4 3.8 2.1 3.1 3.7
Latin America and the Caribbean 3.7 5.5 5.8 4.1 -1.3 6.0 4.2 2.7 2.6 1.3 2.4 3.1 South America 4.0 5.4 6.5 4.9 -0.3 6.5 4.3 2.2 2.8 0.7 1.9 2.8
Mexico and Central America 2.6 5.1 3.7 1.7 -4.2 5.1 4.1 4.2 1.8 2.6 3.5 3.8
Caribbean 4.0 10.1 6.3 3.5 1.1 2.7 2.8 2.8 3.0 3.8 3.8 3.8
Net fuel exporters 4.2 8.0 7.1 4.6 -0.7 1.3 5.4 4.8 3.0 1.4 2.4 3.2
Net fuel importers 3.6 5.1 5.6 4.0 -1.4 6.8 4.0 2.4 2.5 1.3 2.3 3.1
Memorandum items:
Least developed countries 6.2 8.2 9.2 7.8 5.2 5.9 3.5 5.0 5.3 5.3 5.7 5.9
Africa (excluding Libya) 4.7 6.1 6.6 5.4 3.1 5.0 3.6 4.0 4.0 3.9 4.5 4.8
North Africa (excluding Libya) 3.9 5.6 5.5 5.3 4.1 4.2 1.8 2.1 2.8 2.7 3.6 4.0
East Asia (excluding China) 4.5 5.8 6.2 3.4 0.9 7.7 4.5 4.0 4.0 3.9 4.3 4.5
South Asia (excluding India) 3.6 6.2 7.0 2.6 3.9 4.9 3.5 -1.2 2.0 3.7 4.0 4.2
Western Asia (excluding Israel and Turkey)
5.4 8.1 5.6 6.7 1.1 5.1 6.9 5.9 4.0 3.0 4.0 4.5
Arab Statese 4.8 7.8 5.5 6.2 1.8 4.8 3.1 6.1 3.3 2.6 3.9 4.5
Landlocked developing economies 6.8 9.8 9.2 6.4 3.7 7.4 6.0 5.3 6.3 5.2 5.5 5.8 Small island developing economies 4.7 8.6 7.5 3.0 0.3 8.6 4.4 2.2 3.3 3.0 3.6 3.6
Major developing economiesArgentina 5.1 8.4 8.0 3.1 0.1 9.1 8.6 0.9 2.9 -0.3 0.8 2.5
Brazil 3.5 4.0 6.1 5.2 -0.3 7.5 2.7 1.0 2.3 0.3 1.5 2.4
Chile 4.2 5.7 5.2 3.3 -1.0 5.8 5.8 5.4 4.1 1.9 3.0 3.5
China 10.1 12.7 14.2 9.6 9.2 10.4 9.3 7.7 7.7 7.3 7.0 6.8
Colombia 4.7 6.7 6.9 3.5 1.7 4.0 6.6 4.0 4.3 4.8 4.5 4.7
Egypt 4.6 6.8 7.1 7.2 4.7 5.1 1.8 2.2 2.1 2.2 3.5 4.0
Hong Kong SARf 3.6 7.0 6.5 2.1 -2.5 6.8 4.8 1.5 2.9 2.2 2.5 2.8
India 7.2 9.3 9.8 3.9 8.5 10.5 6.4 4.7 5.0 5.4 5.9 6.3
Indonesia 5.9 5.5 6.3 6.0 4.6 6.2 6.5 6.3 5.8 5.1 5.4 5.7
150 World Economic Situation and Prospects 2015
Annual percentage change
2006–2013a 2006 2007 2008 2009 2010 2011 2012 2013 2014b 2015c 2016c
Iran (Islamic Republic of) 2.4 6.1 8.3 1.7 4.0 5.8 2.5 -6.6 -1.9 2.0 2.5 2.8
Israel 4.4 5.8 6.9 4.5 1.2 5.7 4.6 3.4 3.3 2.7 2.9 3.3
Republic of Korea 3.7 5.2 5.5 2.8 0.7 6.5 3.7 2.3 3.0 3.4 3.6 3.7
Malaysia 4.7 5.6 6.3 4.8 -1.5 7.4 5.1 5.6 4.7 5.7 5.3 5.5
Mexico 2.4 5.0 3.2 1.4 -4.7 5.2 3.9 4.0 1.4 2.4 3.4 3.8
Nigeria 6.8 7.5 7.5 6.3 6.9 7.8 4.7 6.7 7.3 5.8 6.1 5.9
Pakistan 3.7 6.2 4.8 1.7 2.8 1.6 2.8 4.0 6.1 4.2 4.1 4.3
Peru 6.6 7.5 8.5 9.1 1.0 8.5 6.5 6.0 5.6 3.2 4.9 5.0
Philippines 5.3 5.2 6.6 4.2 1.1 7.6 3.6 6.8 7.2 6.4 6.1 6.0
Saudi Arabia 5.9 5.6 6.0 8.4 1.8 7.4 8.6 5.8 4.0 4.0 4.2 4.2
Singapore 5.7 8.9 9.0 1.9 -0.6 15.1 6.0 1.9 4.1 2.8 3.3 3.6
South Africa 3.0 5.6 5.5 3.6 -1.5 3.1 3.6 2.5 1.9 2.0 2.7 3.3
Taiwan Province of China 3.5 5.4 6.0 0.7 -1.8 10.8 4.2 1.5 2.1 3.5 3.4 3.1
Thailand 3.6 4.9 5.4 1.7 -0.9 7.4 0.6 7.1 2.9 1.1 3.9 4.2
Turkey 3.9 6.9 4.7 0.7 -4.8 9.2 8.8 2.1 4.1 2.7 3.3 4.0
Venezuela (Bolivarian Republic of) 3.7 9.9 8.8 5.3 -3.2 -1.5 4.2 5.6 1.3 -3.0 -0.5 1.0
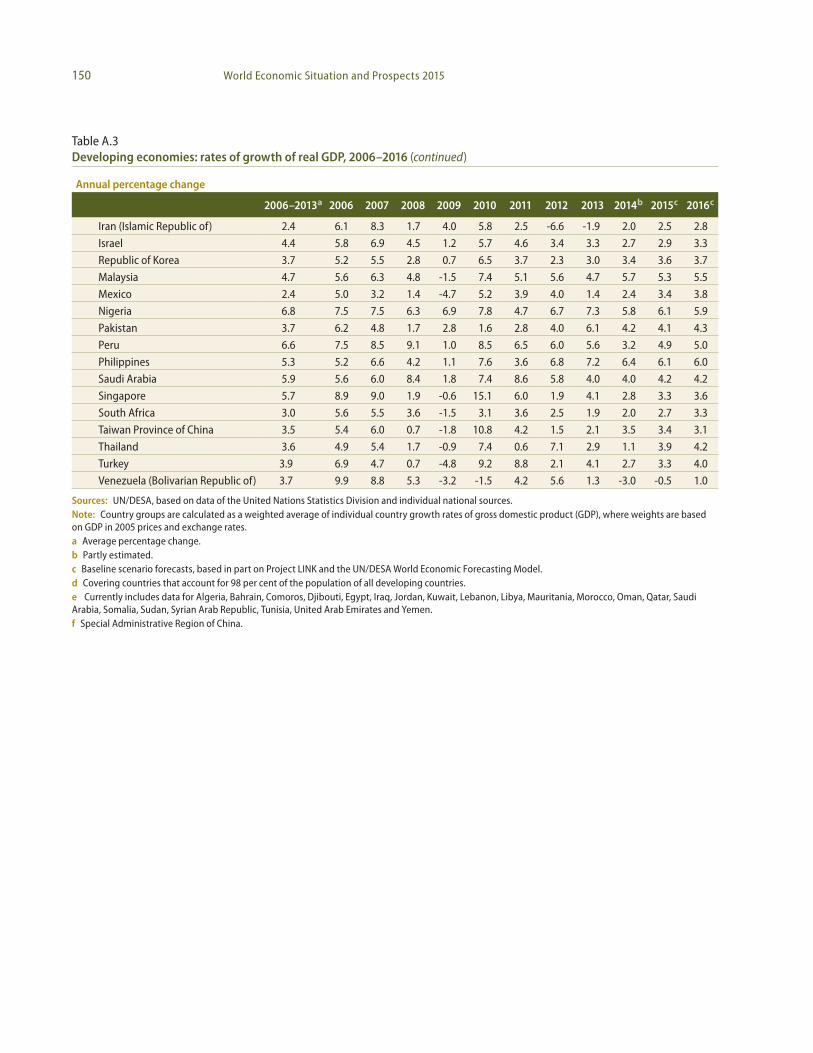
Sources: UN/DESA, based on data of the United Nations Statistics Division and individual national sources.Note: Country groups are calculated as a weighted average of individual country growth rates of gross domestic product (GDP), where weights are based on GDP in 2005 prices and exchange rates.a Average percentage change.b Partly estimated.c Baseline scenario forecasts, based in part on Project LINK and the UN/DESA World Economic Forecasting Model.d Covering countries that account for 98 per cent of the population of all developing countries.e Currently includes data for Algeria, Bahrain, Comoros, Djibouti, Egypt, Iraq, Jordan, Kuwait, Lebanon, Libya, Mauritania, Morocco, Oman, Qatar, Saudi Arabia, Somalia, Sudan, Syrian Arab Republic, Tunisia, United Arab Emirates and Yemen.f Special Administrative Region of China.
Table A.3Developing economies: rates of growth of real GDP, 2006–2016 (continued)
151Annex tables
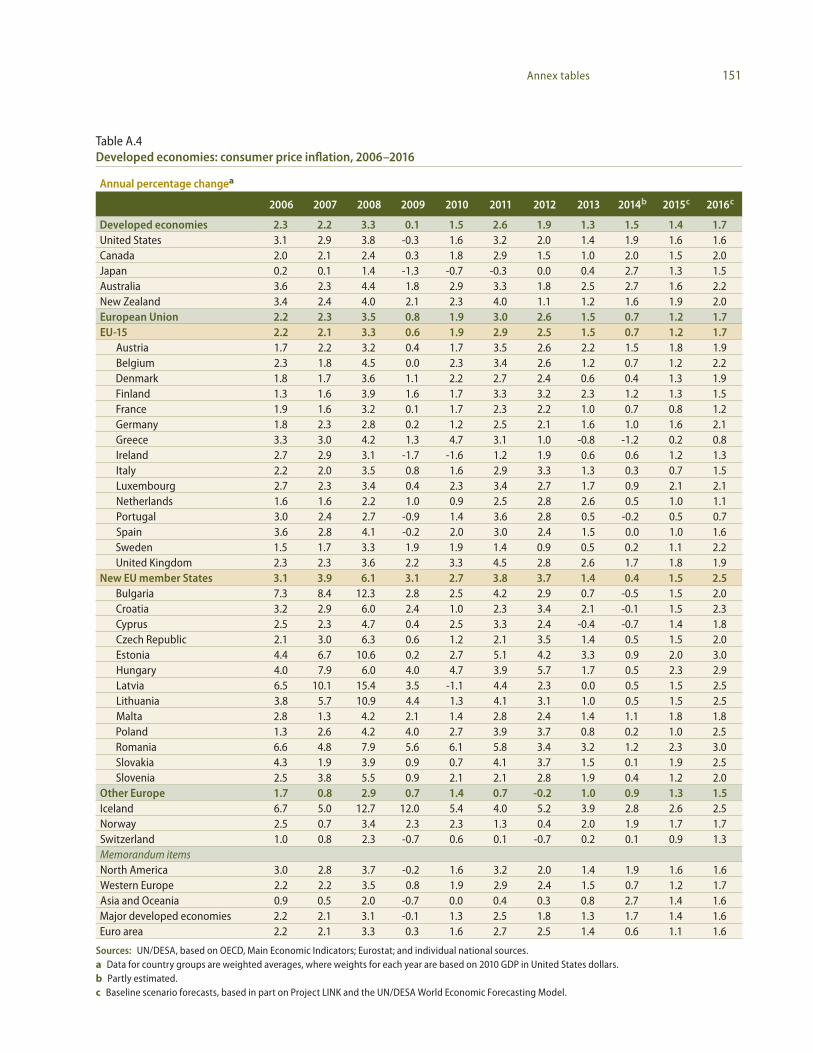
Table A.4Developed economies: consumer price inflation, 2006–2016
Annual percentage changea
2006 2007 2008 2009 2010 2011 2012 2013 2014b 2015c 2016c
Developed economies 2.3 2.2 3.3 0.1 1.5 2.6 1.9 1.3 1.5 1.4 1.7 United States 3.1 2.9 3.8 -0.3 1.6 3.2 2.0 1.4 1.9 1.6 1.6 Canada 2.0 2.1 2.4 0.3 1.8 2.9 1.5 1.0 2.0 1.5 2.0 Japan 0.2 0.1 1.4 -1.3 -0.7 -0.3 0.0 0.4 2.7 1.3 1.5 Australia 3.6 2.3 4.4 1.8 2.9 3.3 1.8 2.5 2.7 1.6 2.2 New Zealand 3.4 2.4 4.0 2.1 2.3 4.0 1.1 1.2 1.6 1.9 2.0 European Union 2.2 2.3 3.5 0.8 1.9 3.0 2.6 1.5 0.7 1.2 1.7 EU-15 2.2 2.1 3.3 0.6 1.9 2.9 2.5 1.5 0.7 1.2 1.7
Austria 1.7 2.2 3.2 0.4 1.7 3.5 2.6 2.2 1.5 1.8 1.9 Belgium 2.3 1.8 4.5 0.0 2.3 3.4 2.6 1.2 0.7 1.2 2.2 Denmark 1.8 1.7 3.6 1.1 2.2 2.7 2.4 0.6 0.4 1.3 1.9 Finland 1.3 1.6 3.9 1.6 1.7 3.3 3.2 2.3 1.2 1.3 1.5 France 1.9 1.6 3.2 0.1 1.7 2.3 2.2 1.0 0.7 0.8 1.2 Germany 1.8 2.3 2.8 0.2 1.2 2.5 2.1 1.6 1.0 1.6 2.1 Greece 3.3 3.0 4.2 1.3 4.7 3.1 1.0 -0.8 -1.2 0.2 0.8 Ireland 2.7 2.9 3.1 -1.7 -1.6 1.2 1.9 0.6 0.6 1.2 1.3 Italy 2.2 2.0 3.5 0.8 1.6 2.9 3.3 1.3 0.3 0.7 1.5 Luxembourg 2.7 2.3 3.4 0.4 2.3 3.4 2.7 1.7 0.9 2.1 2.1 Netherlands 1.6 1.6 2.2 1.0 0.9 2.5 2.8 2.6 0.5 1.0 1.1 Portugal 3.0 2.4 2.7 -0.9 1.4 3.6 2.8 0.5 -0.2 0.5 0.7 Spain 3.6 2.8 4.1 -0.2 2.0 3.0 2.4 1.5 0.0 1.0 1.6 Sweden 1.5 1.7 3.3 1.9 1.9 1.4 0.9 0.5 0.2 1.1 2.2 United Kingdom 2.3 2.3 3.6 2.2 3.3 4.5 2.8 2.6 1.7 1.8 1.9
New EU member States 3.1 3.9 6.1 3.1 2.7 3.8 3.7 1.4 0.4 1.5 2.5 Bulgaria 7.3 8.4 12.3 2.8 2.5 4.2 2.9 0.7 -0.5 1.5 2.0 Croatia 3.2 2.9 6.0 2.4 1.0 2.3 3.4 2.1 -0.1 1.5 2.3 Cyprus 2.5 2.3 4.7 0.4 2.5 3.3 2.4 -0.4 -0.7 1.4 1.8 Czech Republic 2.1 3.0 6.3 0.6 1.2 2.1 3.5 1.4 0.5 1.5 2.0 Estonia 4.4 6.7 10.6 0.2 2.7 5.1 4.2 3.3 0.9 2.0 3.0 Hungary 4.0 7.9 6.0 4.0 4.7 3.9 5.7 1.7 0.5 2.3 2.9 Latvia 6.5 10.1 15.4 3.5 -1.1 4.4 2.3 0.0 0.5 1.5 2.5 Lithuania 3.8 5.7 10.9 4.4 1.3 4.1 3.1 1.0 0.5 1.5 2.5 Malta 2.8 1.3 4.2 2.1 1.4 2.8 2.4 1.4 1.1 1.8 1.8 Poland 1.3 2.6 4.2 4.0 2.7 3.9 3.7 0.8 0.2 1.0 2.5 Romania 6.6 4.8 7.9 5.6 6.1 5.8 3.4 3.2 1.2 2.3 3.0 Slovakia 4.3 1.9 3.9 0.9 0.7 4.1 3.7 1.5 0.1 1.9 2.5 Slovenia 2.5 3.8 5.5 0.9 2.1 2.1 2.8 1.9 0.4 1.2 2.0
Other Europe 1.7 0.8 2.9 0.7 1.4 0.7 -0.2 1.0 0.9 1.3 1.5 Iceland 6.7 5.0 12.7 12.0 5.4 4.0 5.2 3.9 2.8 2.6 2.5 Norway 2.5 0.7 3.4 2.3 2.3 1.3 0.4 2.0 1.9 1.7 1.7 Switzerland 1.0 0.8 2.3 -0.7 0.6 0.1 -0.7 0.2 0.1 0.9 1.3 Memorandum itemsNorth America 3.0 2.8 3.7 -0.2 1.6 3.2 2.0 1.4 1.9 1.6 1.6 Western Europe 2.2 2.2 3.5 0.8 1.9 2.9 2.4 1.5 0.7 1.2 1.7 Asia and Oceania 0.9 0.5 2.0 -0.7 0.0 0.4 0.3 0.8 2.7 1.4 1.6 Major developed economies 2.2 2.1 3.1 -0.1 1.3 2.5 1.8 1.3 1.7 1.4 1.6 Euro area 2.2 2.1 3.3 0.3 1.6 2.7 2.5 1.4 0.6 1.1 1.6
Sources: UN/DESA, based on OECD, Main Economic Indicators; Eurostat; and individual national sources.a Data for country groups are weighted averages, where weights for each year are based on 2010 GDP in United States dollars.b Partly estimated.c Baseline scenario forecasts, based in part on Project LINK and the UN/DESA World Economic Forecasting Model.
152 World Economic Situation and Prospects 2015
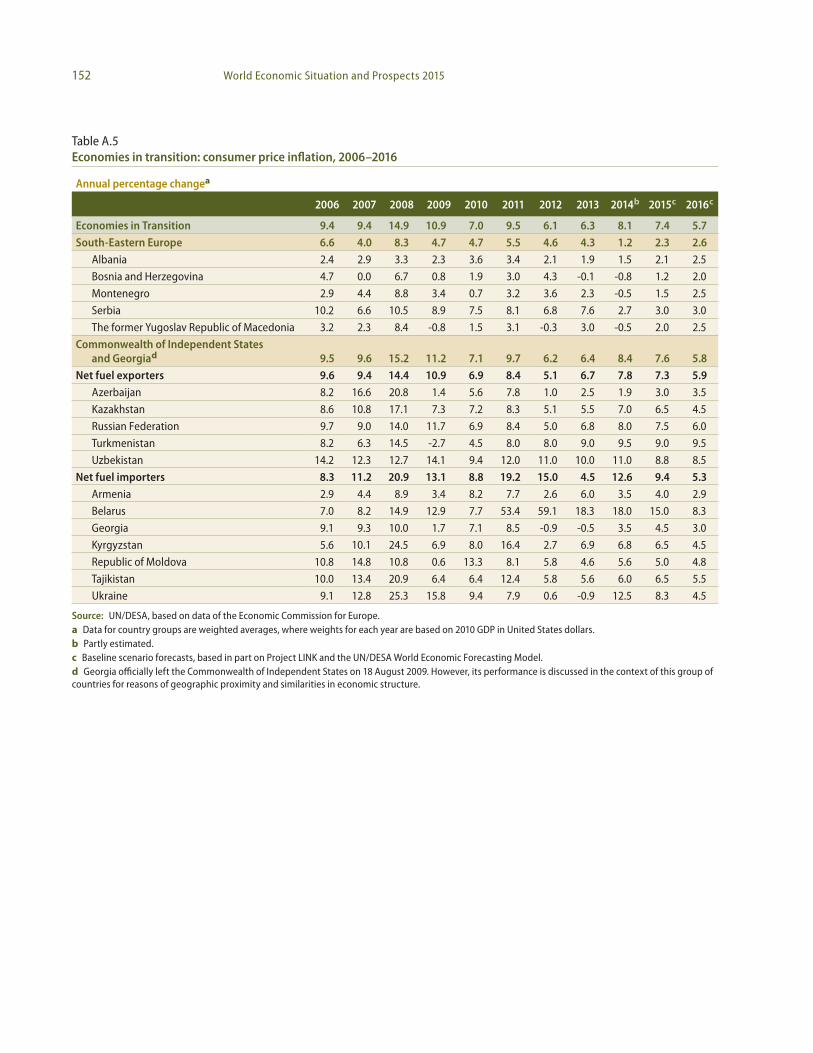
Table A.5Economies in transition: consumer price inflation, 2006–2016
Annual percentage changea
2006 2007 2008 2009 2010 2011 2012 2013 2014b 2015c 2016c
Economies in Transition 9.4 9.4 14.9 10.9 7.0 9.5 6.1 6.3 8.1 7.4 5.7 South-Eastern Europe 6.6 4.0 8.3 4.7 4.7 5.5 4.6 4.3 1.2 2.3 2.6
Albania 2.4 2.9 3.3 2.3 3.6 3.4 2.1 1.9 1.5 2.1 2.5
Bosnia and Herzegovina 4.7 0.0 6.7 0.8 1.9 3.0 4.3 -0.1 -0.8 1.2 2.0
Montenegro 2.9 4.4 8.8 3.4 0.7 3.2 3.6 2.3 -0.5 1.5 2.5
Serbia 10.2 6.6 10.5 8.9 7.5 8.1 6.8 7.6 2.7 3.0 3.0
The former Yugoslav Republic of Macedonia 3.2 2.3 8.4 -0.8 1.5 3.1 -0.3 3.0 -0.5 2.0 2.5
Commonwealth of Independent States and Georgiad 9.5 9.6 15.2 11.2 7.1 9.7 6.2 6.4 8.4 7.6 5.8
Net fuel exporters 9.6 9.4 14.4 10.9 6.9 8.4 5.1 6.7 7.8 7.3 5.9 Azerbaijan 8.2 16.6 20.8 1.4 5.6 7.8 1.0 2.5 1.9 3.0 3.5
Kazakhstan 8.6 10.8 17.1 7.3 7.2 8.3 5.1 5.5 7.0 6.5 4.5
Russian Federation 9.7 9.0 14.0 11.7 6.9 8.4 5.0 6.8 8.0 7.5 6.0
Turkmenistan 8.2 6.3 14.5 -2.7 4.5 8.0 8.0 9.0 9.5 9.0 9.5
Uzbekistan 14.2 12.3 12.7 14.1 9.4 12.0 11.0 10.0 11.0 8.8 8.5
Net fuel importers 8.3 11.2 20.9 13.1 8.8 19.2 15.0 4.5 12.6 9.4 5.3 Armenia 2.9 4.4 8.9 3.4 8.2 7.7 2.6 6.0 3.5 4.0 2.9
Belarus 7.0 8.2 14.9 12.9 7.7 53.4 59.1 18.3 18.0 15.0 8.3
Georgia 9.1 9.3 10.0 1.7 7.1 8.5 -0.9 -0.5 3.5 4.5 3.0
Kyrgyzstan 5.6 10.1 24.5 6.9 8.0 16.4 2.7 6.9 6.8 6.5 4.5
Republic of Moldova 10.8 14.8 10.8 0.6 13.3 8.1 5.8 4.6 5.6 5.0 4.8
Tajikistan 10.0 13.4 20.9 6.4 6.4 12.4 5.8 5.6 6.0 6.5 5.5
Ukraine 9.1 12.8 25.3 15.8 9.4 7.9 0.6 -0.9 12.5 8.3 4.5
Source: UN/DESA, based on data of the Economic Commission for Europe.a Data for country groups are weighted averages, where weights for each year are based on 2010 GDP in United States dollars.b Partly estimated.c Baseline scenario forecasts, based in part on Project LINK and the UN/DESA World Economic Forecasting Model.d Georgia officially left the Commonwealth of Independent States on 18 August 2009. However, its performance is discussed in the context of this group of countries for reasons of geographic proximity and similarities in economic structure.
153Annex tables
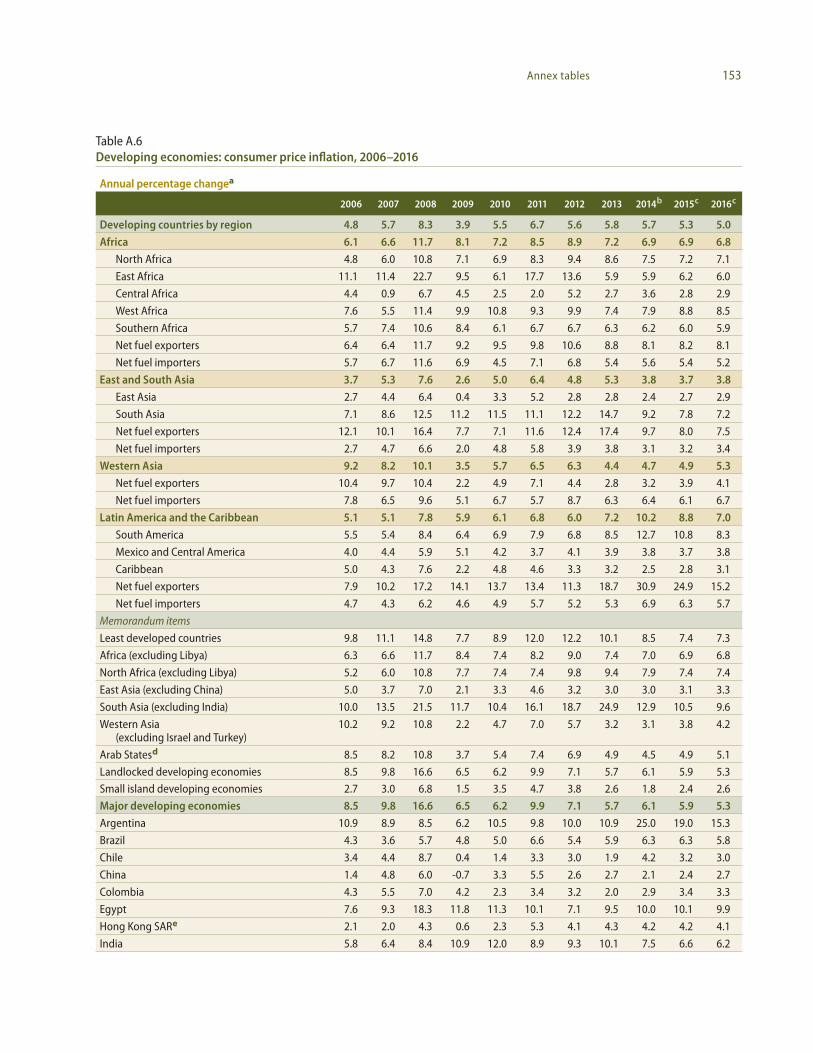
Table A.6Developing economies: consumer price inflation, 2006–2016
Annual percentage changea
2006 2007 2008 2009 2010 2011 2012 2013 2014b 2015c 2016c
Developing countries by region 4.8 5.7 8.3 3.9 5.5 6.7 5.6 5.8 5.7 5.3 5.0
Africa 6.1 6.6 11.7 8.1 7.2 8.5 8.9 7.2 6.9 6.9 6.8
North Africa 4.8 6.0 10.8 7.1 6.9 8.3 9.4 8.6 7.5 7.2 7.1
East Africa 11.1 11.4 22.7 9.5 6.1 17.7 13.6 5.9 5.9 6.2 6.0
Central Africa 4.4 0.9 6.7 4.5 2.5 2.0 5.2 2.7 3.6 2.8 2.9
West Africa 7.6 5.5 11.4 9.9 10.8 9.3 9.9 7.4 7.9 8.8 8.5
Southern Africa 5.7 7.4 10.6 8.4 6.1 6.7 6.7 6.3 6.2 6.0 5.9
Net fuel exporters 6.4 6.4 11.7 9.2 9.5 9.8 10.6 8.8 8.1 8.2 8.1
Net fuel importers 5.7 6.7 11.6 6.9 4.5 7.1 6.8 5.4 5.6 5.4 5.2
East and South Asia 3.7 5.3 7.6 2.6 5.0 6.4 4.8 5.3 3.8 3.7 3.8
East Asia 2.7 4.4 6.4 0.4 3.3 5.2 2.8 2.8 2.4 2.7 2.9
South Asia 7.1 8.6 12.5 11.2 11.5 11.1 12.2 14.7 9.2 7.8 7.2
Net fuel exporters 12.1 10.1 16.4 7.7 7.1 11.6 12.4 17.4 9.7 8.0 7.5
Net fuel importers 2.7 4.7 6.6 2.0 4.8 5.8 3.9 3.8 3.1 3.2 3.4
Western Asia 9.2 8.2 10.1 3.5 5.7 6.5 6.3 4.4 4.7 4.9 5.3
Net fuel exporters 10.4 9.7 10.4 2.2 4.9 7.1 4.4 2.8 3.2 3.9 4.1
Net fuel importers 7.8 6.5 9.6 5.1 6.7 5.7 8.7 6.3 6.4 6.1 6.7
Latin America and the Caribbean 5.1 5.1 7.8 5.9 6.1 6.8 6.0 7.2 10.2 8.8 7.0
South America 5.5 5.4 8.4 6.4 6.9 7.9 6.8 8.5 12.7 10.8 8.3
Mexico and Central America 4.0 4.4 5.9 5.1 4.2 3.7 4.1 3.9 3.8 3.7 3.8
Caribbean 5.0 4.3 7.6 2.2 4.8 4.6 3.3 3.2 2.5 2.8 3.1
Net fuel exporters 7.9 10.2 17.2 14.1 13.7 13.4 11.3 18.7 30.9 24.9 15.2
Net fuel importers 4.7 4.3 6.2 4.6 4.9 5.7 5.2 5.3 6.9 6.3 5.7
Memorandum items
Least developed countries 9.8 11.1 14.8 7.7 8.9 12.0 12.2 10.1 8.5 7.4 7.3
Africa (excluding Libya) 6.3 6.6 11.7 8.4 7.4 8.2 9.0 7.4 7.0 6.9 6.8
North Africa (excluding Libya) 5.2 6.0 10.8 7.7 7.4 7.4 9.8 9.4 7.9 7.4 7.4
East Asia (excluding China) 5.0 3.7 7.0 2.1 3.3 4.6 3.2 3.0 3.0 3.1 3.3
South Asia (excluding India) 10.0 13.5 21.5 11.7 10.4 16.1 18.7 24.9 12.9 10.5 9.6
Western Asia (excluding Israel and Turkey)
10.2 9.2 10.8 2.2 4.7 7.0 5.7 3.2 3.1 3.8 4.2
Arab Statesd 8.5 8.2 10.8 3.7 5.4 7.4 6.9 4.9 4.5 4.9 5.1
Landlocked developing economies 8.5 9.8 16.6 6.5 6.2 9.9 7.1 5.7 6.1 5.9 5.3
Small island developing economies 2.7 3.0 6.8 1.5 3.5 4.7 3.8 2.6 1.8 2.4 2.6
Major developing economies 8.5 9.8 16.6 6.5 6.2 9.9 7.1 5.7 6.1 5.9 5.3
Argentina 10.9 8.9 8.5 6.2 10.5 9.8 10.0 10.9 25.0 19.0 15.3
Brazil 4.3 3.6 5.7 4.8 5.0 6.6 5.4 5.9 6.3 6.3 5.8
Chile 3.4 4.4 8.7 0.4 1.4 3.3 3.0 1.9 4.2 3.2 3.0
China 1.4 4.8 6.0 -0.7 3.3 5.5 2.6 2.7 2.1 2.4 2.7
Colombia 4.3 5.5 7.0 4.2 2.3 3.4 3.2 2.0 2.9 3.4 3.3
Egypt 7.6 9.3 18.3 11.8 11.3 10.1 7.1 9.5 10.0 10.1 9.9
Hong Kong SARe 2.1 2.0 4.3 0.6 2.3 5.3 4.1 4.3 4.2 4.2 4.1
India 5.8 6.4 8.4 10.9 12.0 8.9 9.3 10.1 7.5 6.6 6.2
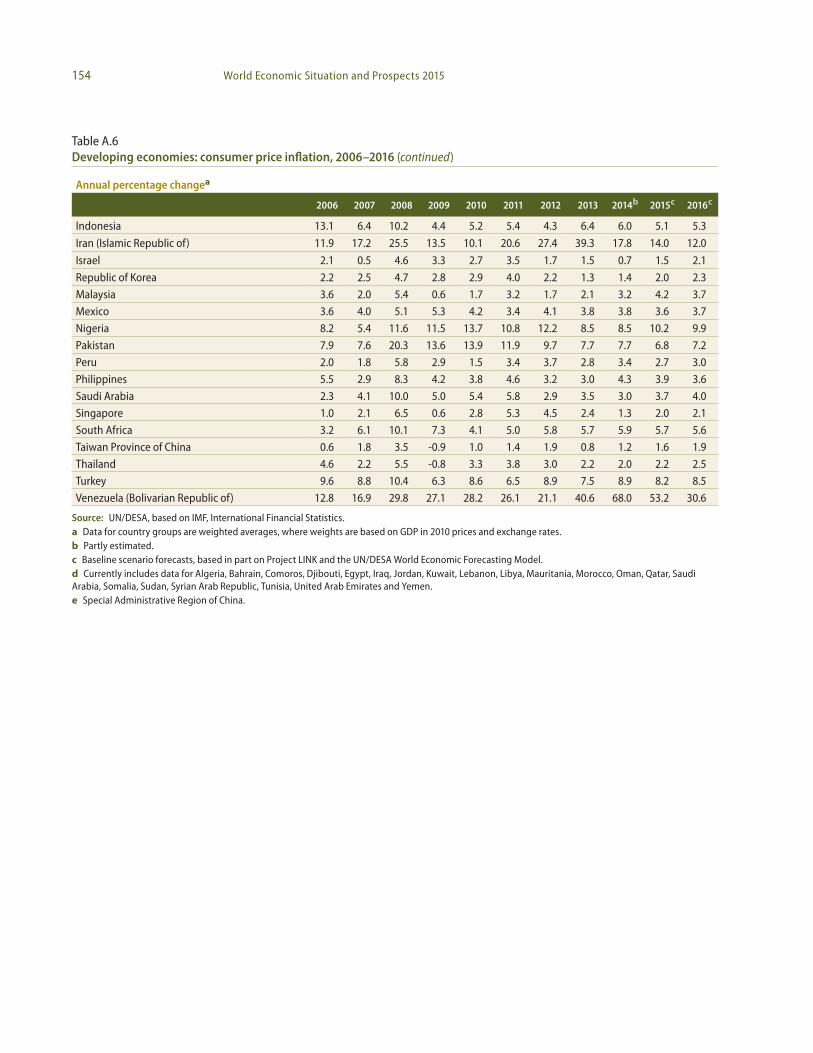
154 World Economic Situation and Prospects 2015
Annual percentage changea
2006 2007 2008 2009 2010 2011 2012 2013 2014b 2015c 2016c
Indonesia 13.1 6.4 10.2 4.4 5.2 5.4 4.3 6.4 6.0 5.1 5.3
Iran (Islamic Republic of) 11.9 17.2 25.5 13.5 10.1 20.6 27.4 39.3 17.8 14.0 12.0
Israel 2.1 0.5 4.6 3.3 2.7 3.5 1.7 1.5 0.7 1.5 2.1
Republic of Korea 2.2 2.5 4.7 2.8 2.9 4.0 2.2 1.3 1.4 2.0 2.3
Malaysia 3.6 2.0 5.4 0.6 1.7 3.2 1.7 2.1 3.2 4.2 3.7
Mexico 3.6 4.0 5.1 5.3 4.2 3.4 4.1 3.8 3.8 3.6 3.7
Nigeria 8.2 5.4 11.6 11.5 13.7 10.8 12.2 8.5 8.5 10.2 9.9
Pakistan 7.9 7.6 20.3 13.6 13.9 11.9 9.7 7.7 7.7 6.8 7.2
Peru 2.0 1.8 5.8 2.9 1.5 3.4 3.7 2.8 3.4 2.7 3.0
Philippines 5.5 2.9 8.3 4.2 3.8 4.6 3.2 3.0 4.3 3.9 3.6
Saudi Arabia 2.3 4.1 10.0 5.0 5.4 5.8 2.9 3.5 3.0 3.7 4.0
Singapore 1.0 2.1 6.5 0.6 2.8 5.3 4.5 2.4 1.3 2.0 2.1
South Africa 3.2 6.1 10.1 7.3 4.1 5.0 5.8 5.7 5.9 5.7 5.6
Taiwan Province of China 0.6 1.8 3.5 -0.9 1.0 1.4 1.9 0.8 1.2 1.6 1.9
Thailand 4.6 2.2 5.5 -0.8 3.3 3.8 3.0 2.2 2.0 2.2 2.5
Turkey 9.6 8.8 10.4 6.3 8.6 6.5 8.9 7.5 8.9 8.2 8.5
Venezuela (Bolivarian Republic of) 12.8 16.9 29.8 27.1 28.2 26.1 21.1 40.6 68.0 53.2 30.6
Source: UN/DESA, based on IMF, International Financial Statistics.a Data for country groups are weighted averages, where weights are based on GDP in 2010 prices and exchange rates.b Partly estimated.c Baseline scenario forecasts, based in part on Project LINK and the UN/DESA World Economic Forecasting Model.d Currently includes data for Algeria, Bahrain, Comoros, Djibouti, Egypt, Iraq, Jordan, Kuwait, Lebanon, Libya, Mauritania, Morocco, Oman, Qatar, Saudi Arabia, Somalia, Sudan, Syrian Arab Republic, Tunisia, United Arab Emirates and Yemen.e Special Administrative Region of China.
Table A.6Developing economies: consumer price inflation, 2006–2016 (continued)
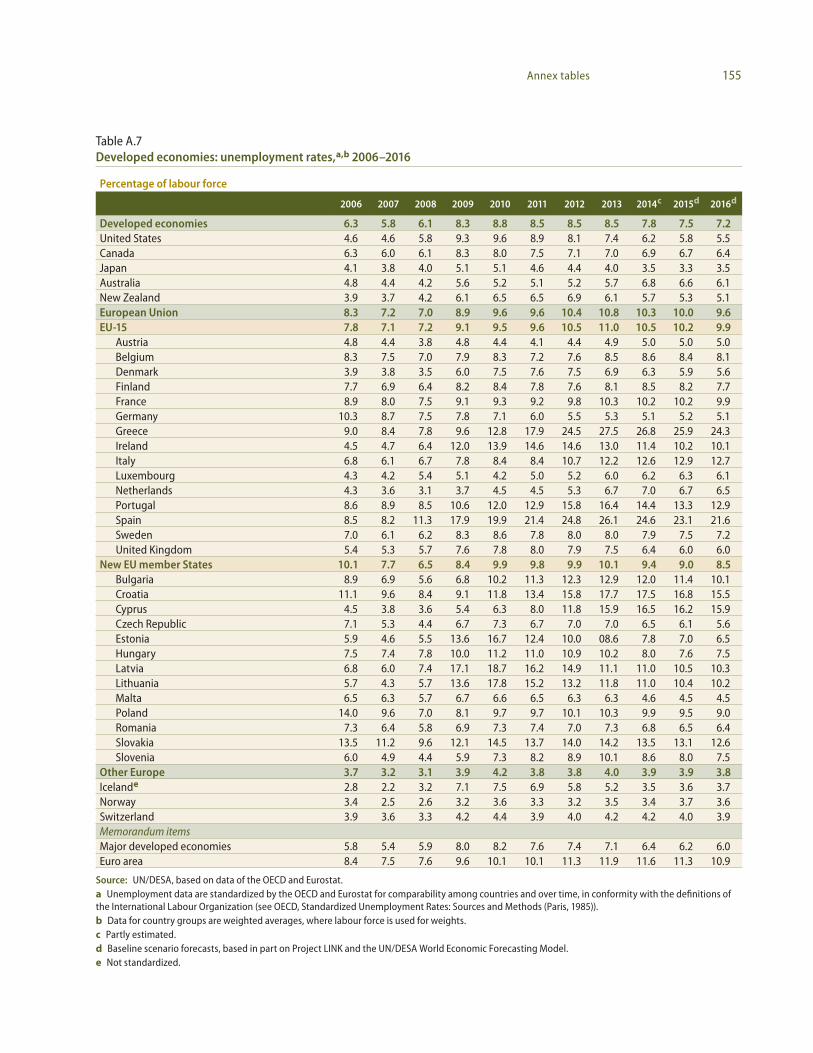
155Annex tables
Table A.7Developed economies: unemployment rates,a,b 2006–2016
Percentage of labour force
2006 2007 2008 2009 2010 2011 2012 2013 2014c 2015d 2016d
Developed economies 6.3 5.8 6.1 8.3 8.8 8.5 8.5 8.5 7.8 7.5 7.2United States 4.6 4.6 5.8 9.3 9.6 8.9 8.1 7.4 6.2 5.8 5.5Canada 6.3 6.0 6.1 8.3 8.0 7.5 7.1 7.0 6.9 6.7 6.4Japan 4.1 3.8 4.0 5.1 5.1 4.6 4.4 4.0 3.5 3.3 3.5Australia 4.8 4.4 4.2 5.6 5.2 5.1 5.2 5.7 6.8 6.6 6.1New Zealand 3.9 3.7 4.2 6.1 6.5 6.5 6.9 6.1 5.7 5.3 5.1European Union 8.3 7.2 7.0 8.9 9.6 9.6 10.4 10.8 10.3 10.0 9.6EU-15 7.8 7.1 7.2 9.1 9.5 9.6 10.5 11.0 10.5 10.2 9.9
Austria 4.8 4.4 3.8 4.8 4.4 4.1 4.4 4.9 5.0 5.0 5.0Belgium 8.3 7.5 7.0 7.9 8.3 7.2 7.6 8.5 8.6 8.4 8.1Denmark 3.9 3.8 3.5 6.0 7.5 7.6 7.5 6.9 6.3 5.9 5.6Finland 7.7 6.9 6.4 8.2 8.4 7.8 7.6 8.1 8.5 8.2 7.7France 8.9 8.0 7.5 9.1 9.3 9.2 9.8 10.3 10.2 10.2 9.9Germany 10.3 8.7 7.5 7.8 7.1 6.0 5.5 5.3 5.1 5.2 5.1Greece 9.0 8.4 7.8 9.6 12.8 17.9 24.5 27.5 26.8 25.9 24.3Ireland 4.5 4.7 6.4 12.0 13.9 14.6 14.6 13.0 11.4 10.2 10.1Italy 6.8 6.1 6.7 7.8 8.4 8.4 10.7 12.2 12.6 12.9 12.7Luxembourg 4.3 4.2 5.4 5.1 4.2 5.0 5.2 6.0 6.2 6.3 6.1Netherlands 4.3 3.6 3.1 3.7 4.5 4.5 5.3 6.7 7.0 6.7 6.5Portugal 8.6 8.9 8.5 10.6 12.0 12.9 15.8 16.4 14.4 13.3 12.9Spain 8.5 8.2 11.3 17.9 19.9 21.4 24.8 26.1 24.6 23.1 21.6Sweden 7.0 6.1 6.2 8.3 8.6 7.8 8.0 8.0 7.9 7.5 7.2United Kingdom 5.4 5.3 5.7 7.6 7.8 8.0 7.9 7.5 6.4 6.0 6.0
New EU member States 10.1 7.7 6.5 8.4 9.9 9.8 9.9 10.1 9.4 9.0 8.5Bulgaria 8.9 6.9 5.6 6.8 10.2 11.3 12.3 12.9 12.0 11.4 10.1Croatia 11.1 9.6 8.4 9.1 11.8 13.4 15.8 17.7 17.5 16.8 15.5Cyprus 4.5 3.8 3.6 5.4 6.3 8.0 11.8 15.9 16.5 16.2 15.9Czech Republic 7.1 5.3 4.4 6.7 7.3 6.7 7.0 7.0 6.5 6.1 5.6Estonia 5.9 4.6 5.5 13.6 16.7 12.4 10.0 08.6 7.8 7.0 6.5Hungary 7.5 7.4 7.8 10.0 11.2 11.0 10.9 10.2 8.0 7.6 7.5Latvia 6.8 6.0 7.4 17.1 18.7 16.2 14.9 11.1 11.0 10.5 10.3Lithuania 5.7 4.3 5.7 13.6 17.8 15.2 13.2 11.8 11.0 10.4 10.2Malta 6.5 6.3 5.7 6.7 6.6 6.5 6.3 6.3 4.6 4.5 4.5Poland 14.0 9.6 7.0 8.1 9.7 9.7 10.1 10.3 9.9 9.5 9.0Romania 7.3 6.4 5.8 6.9 7.3 7.4 7.0 7.3 6.8 6.5 6.4Slovakia 13.5 11.2 9.6 12.1 14.5 13.7 14.0 14.2 13.5 13.1 12.6Slovenia 6.0 4.9 4.4 5.9 7.3 8.2 8.9 10.1 8.6 8.0 7.5
Other Europe 3.7 3.2 3.1 3.9 4.2 3.8 3.8 4.0 3.9 3.9 3.8Icelande 2.8 2.2 3.2 7.1 7.5 6.9 5.8 5.2 3.5 3.6 3.7Norway 3.4 2.5 2.6 3.2 3.6 3.3 3.2 3.5 3.4 3.7 3.6Switzerland 3.9 3.6 3.3 4.2 4.4 3.9 4.0 4.2 4.2 4.0 3.9Memorandum itemsMajor developed economies 5.8 5.4 5.9 8.0 8.2 7.6 7.4 7.1 6.4 6.2 6.0Euro area 8.4 7.5 7.6 9.6 10.1 10.1 11.3 11.9 11.6 11.3 10.9
Source: UN/DESA, based on data of the OECD and Eurostat.a Unemployment data are standardized by the OECD and Eurostat for comparability among countries and over time, in conformity with the definitions of the International Labour Organization (see OECD, Standardized Unemployment Rates: Sources and Methods (Paris, 1985)).b Data for country groups are weighted averages, where labour force is used for weights.c Partly estimated.d Baseline scenario forecasts, based in part on Project LINK and the UN/DESA World Economic Forecasting Model.e Not standardized.
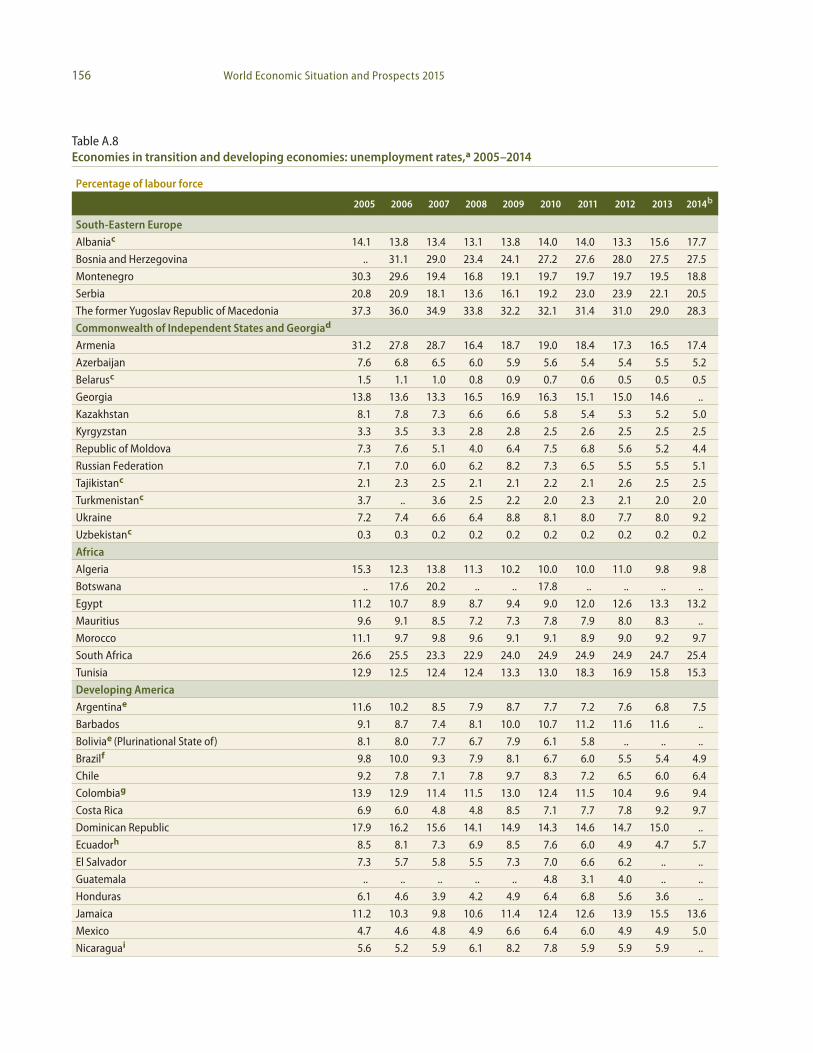
156 World Economic Situation and Prospects 2015
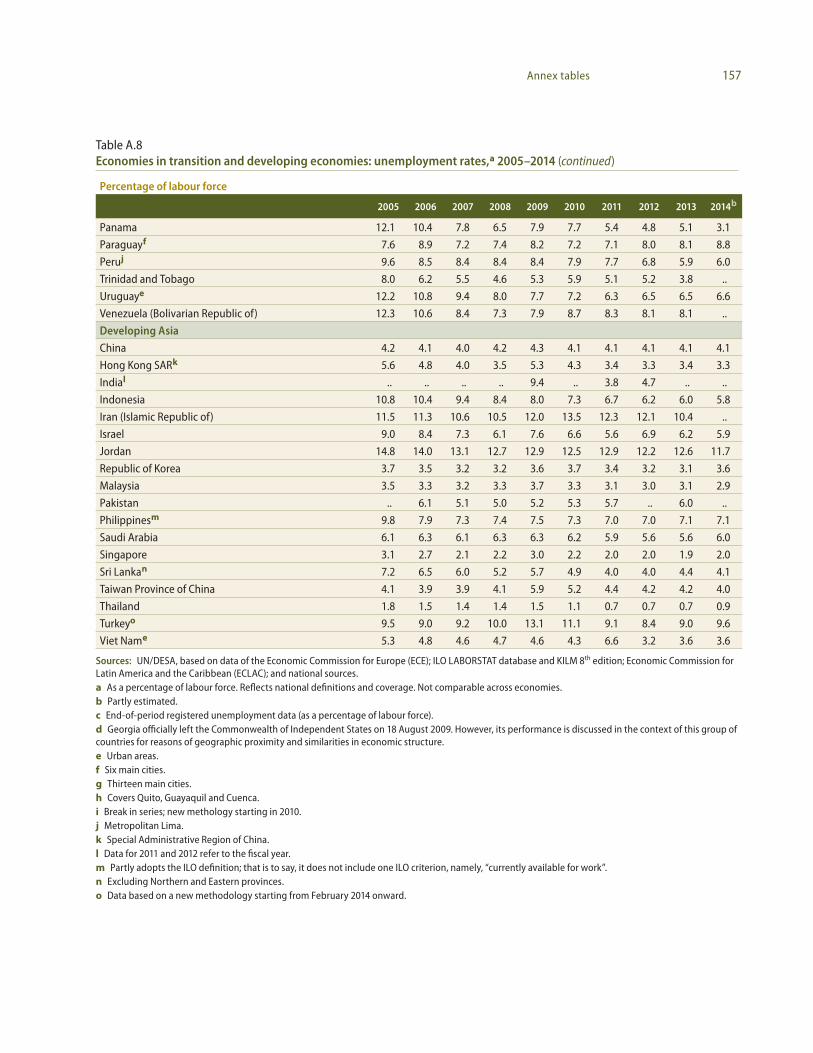
Table A.8Economies in transition and developing economies: unemployment rates,a 2005–2014
Percentage of labour force
2005 2006 2007 2008 2009 2010 2011 2012 2013 2014b
South-Eastern Europe
Albaniac 14.1 13.8 13.4 13.1 13.8 14.0 14.0 13.3 15.6 17.7
Bosnia and Herzegovina .. 31.1 29.0 23.4 24.1 27.2 27.6 28.0 27.5 27.5
Montenegro 30.3 29.6 19.4 16.8 19.1 19.7 19.7 19.7 19.5 18.8
Serbia 20.8 20.9 18.1 13.6 16.1 19.2 23.0 23.9 22.1 20.5
The former Yugoslav Republic of Macedonia 37.3 36.0 34.9 33.8 32.2 32.1 31.4 31.0 29.0 28.3
Commonwealth of Independent States and Georgiad
Armenia 31.2 27.8 28.7 16.4 18.7 19.0 18.4 17.3 16.5 17.4
Azerbaijan 7.6 6.8 6.5 6.0 5.9 5.6 5.4 5.4 5.5 5.2
Belarusc 1.5 1.1 1.0 0.8 0.9 0.7 0.6 0.5 0.5 0.5
Georgia 13.8 13.6 13.3 16.5 16.9 16.3 15.1 15.0 14.6 ..
Kazakhstan 8.1 7.8 7.3 6.6 6.6 5.8 5.4 5.3 5.2 5.0
Kyrgyzstan 3.3 3.5 3.3 2.8 2.8 2.5 2.6 2.5 2.5 2.5
Republic of Moldova 7.3 7.6 5.1 4.0 6.4 7.5 6.8 5.6 5.2 4.4
Russian Federation 7.1 7.0 6.0 6.2 8.2 7.3 6.5 5.5 5.5 5.1
Tajikistanc 2.1 2.3 2.5 2.1 2.1 2.2 2.1 2.6 2.5 2.5
Turkmenistanc 3.7 .. 3.6 2.5 2.2 2.0 2.3 2.1 2.0 2.0
Ukraine 7.2 7.4 6.6 6.4 8.8 8.1 8.0 7.7 8.0 9.2
Uzbekistanc 0.3 0.3 0.2 0.2 0.2 0.2 0.2 0.2 0.2 0.2
Africa
Algeria 15.3 12.3 13.8 11.3 10.2 10.0 10.0 11.0 9.8 9.8
Botswana .. 17.6 20.2 .. .. 17.8 .. .. .. ..
Egypt 11.2 10.7 8.9 8.7 9.4 9.0 12.0 12.6 13.3 13.2
Mauritius 9.6 9.1 8.5 7.2 7.3 7.8 7.9 8.0 8.3 ..
Morocco 11.1 9.7 9.8 9.6 9.1 9.1 8.9 9.0 9.2 9.7
South Africa 26.6 25.5 23.3 22.9 24.0 24.9 24.9 24.9 24.7 25.4
Tunisia 12.9 12.5 12.4 12.4 13.3 13.0 18.3 16.9 15.8 15.3
Developing America
Argentinae 11.6 10.2 8.5 7.9 8.7 7.7 7.2 7.6 6.8 7.5
Barbados 9.1 8.7 7.4 8.1 10.0 10.7 11.2 11.6 11.6 ..
Boliviae (Plurinational State of) 8.1 8.0 7.7 6.7 7.9 6.1 5.8 .. .. ..
Brazilf 9.8 10.0 9.3 7.9 8.1 6.7 6.0 5.5 5.4 4.9
Chile 9.2 7.8 7.1 7.8 9.7 8.3 7.2 6.5 6.0 6.4
Colombiag 13.9 12.9 11.4 11.5 13.0 12.4 11.5 10.4 9.6 9.4
Costa Rica 6.9 6.0 4.8 4.8 8.5 7.1 7.7 7.8 9.2 9.7
Dominican Republic 17.9 16.2 15.6 14.1 14.9 14.3 14.6 14.7 15.0 ..
Ecuadorh 8.5 8.1 7.3 6.9 8.5 7.6 6.0 4.9 4.7 5.7
El Salvador 7.3 5.7 5.8 5.5 7.3 7.0 6.6 6.2 .. ..
Guatemala .. .. .. .. .. 4.8 3.1 4.0 .. ..
Honduras 6.1 4.6 3.9 4.2 4.9 6.4 6.8 5.6 3.6 ..
Jamaica 11.2 10.3 9.8 10.6 11.4 12.4 12.6 13.9 15.5 13.6
Mexico 4.7 4.6 4.8 4.9 6.6 6.4 6.0 4.9 4.9 5.0
Nicaraguai 5.6 5.2 5.9 6.1 8.2 7.8 5.9 5.9 5.9 ..
157Annex tables
Table A.8Economies in transition and developing economies: unemployment rates,a 2005–2014 (continued)
Percentage of labour force
2005 2006 2007 2008 2009 2010 2011 2012 2013 2014b
Panama 12.1 10.4 7.8 6.5 7.9 7.7 5.4 4.8 5.1 3.1
Paraguayf 7.6 8.9 7.2 7.4 8.2 7.2 7.1 8.0 8.1 8.8
Peruj 9.6 8.5 8.4 8.4 8.4 7.9 7.7 6.8 5.9 6.0
Trinidad and Tobago 8.0 6.2 5.5 4.6 5.3 5.9 5.1 5.2 3.8 ..
Uruguaye 12.2 10.8 9.4 8.0 7.7 7.2 6.3 6.5 6.5 6.6
Venezuela (Bolivarian Republic of) 12.3 10.6 8.4 7.3 7.9 8.7 8.3 8.1 8.1 ..
Developing Asia
China 4.2 4.1 4.0 4.2 4.3 4.1 4.1 4.1 4.1 4.1
Hong Kong SARk 5.6 4.8 4.0 3.5 5.3 4.3 3.4 3.3 3.4 3.3
Indial .. .. .. .. 9.4 .. 3.8 4.7 .. ..
Indonesia 10.8 10.4 9.4 8.4 8.0 7.3 6.7 6.2 6.0 5.8
Iran (Islamic Republic of) 11.5 11.3 10.6 10.5 12.0 13.5 12.3 12.1 10.4 ..
Israel 9.0 8.4 7.3 6.1 7.6 6.6 5.6 6.9 6.2 5.9
Jordan 14.8 14.0 13.1 12.7 12.9 12.5 12.9 12.2 12.6 11.7
Republic of Korea 3.7 3.5 3.2 3.2 3.6 3.7 3.4 3.2 3.1 3.6
Malaysia 3.5 3.3 3.2 3.3 3.7 3.3 3.1 3.0 3.1 2.9
Pakistan .. 6.1 5.1 5.0 5.2 5.3 5.7 .. 6.0 ..
Philippinesm 9.8 7.9 7.3 7.4 7.5 7.3 7.0 7.0 7.1 7.1
Saudi Arabia 6.1 6.3 6.1 6.3 6.3 6.2 5.9 5.6 5.6 6.0
Singapore 3.1 2.7 2.1 2.2 3.0 2.2 2.0 2.0 1.9 2.0
Sri Lankan 7.2 6.5 6.0 5.2 5.7 4.9 4.0 4.0 4.4 4.1
Taiwan Province of China 4.1 3.9 3.9 4.1 5.9 5.2 4.4 4.2 4.2 4.0
Thailand 1.8 1.5 1.4 1.4 1.5 1.1 0.7 0.7 0.7 0.9
Turkeyo 9.5 9.0 9.2 10.0 13.1 11.1 9.1 8.4 9.0 9.6
Viet Name 5.3 4.8 4.6 4.7 4.6 4.3 6.6 3.2 3.6 3.6
Sources: UN/DESA, based on data of the Economic Commission for Europe (ECE); ILO LABORSTAT database and KILM 8th edition; Economic Commission for Latin America and the Caribbean (ECLAC); and national sources.a As a percentage of labour force. Reflects national definitions and coverage. Not comparable across economies.b Partly estimated.c End-of-period registered unemployment data (as a percentage of labour force).d Georgia officially left the Commonwealth of Independent States on 18 August 2009. However, its performance is discussed in the context of this group of countries for reasons of geographic proximity and similarities in economic structure.e Urban areas.f Six main cities.g Thirteen main cities.h Covers Quito, Guayaquil and Cuenca.i Break in series; new methology starting in 2010.j Metropolitan Lima.k Special Administrative Region of China.l Data for 2011 and 2012 refer to the fiscal year.m Partly adopts the ILO definition; that is to say, it does not include one ILO criterion, namely, “currently available for work”.n Excluding Northern and Eastern provinces.o Data based on a new methodology starting from February 2014 onward.
158 World Economic Situation and Prospects 2015
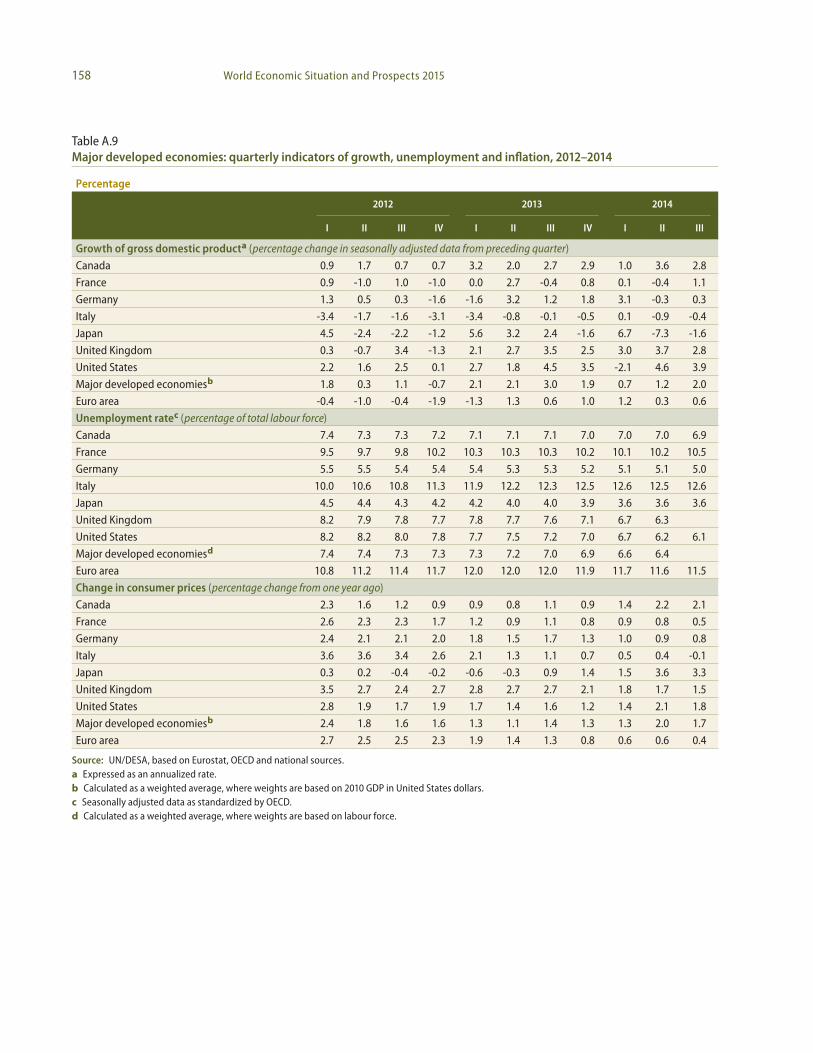
Table A.9Major developed economies: quarterly indicators of growth, unemployment and inflation, 2012–2014
Percentage
2012 2013 2014
I II III IV I II III IV I II III
Growth of gross domestic producta (percentage change in seasonally adjusted data from preceding quarter)
Canada 0.9 1.7 0.7 0.7 3.2 2.0 2.7 2.9 1.0 3.6 2.8
France 0.9 -1.0 1.0 -1.0 0.0 2.7 -0.4 0.8 0.1 -0.4 1.1
Germany 1.3 0.5 0.3 -1.6 -1.6 3.2 1.2 1.8 3.1 -0.3 0.3
Italy -3.4 -1.7 -1.6 -3.1 -3.4 -0.8 -0.1 -0.5 0.1 -0.9 -0.4
Japan 4.5 -2.4 -2.2 -1.2 5.6 3.2 2.4 -1.6 6.7 -7.3 -1.6
United Kingdom 0.3 -0.7 3.4 -1.3 2.1 2.7 3.5 2.5 3.0 3.7 2.8
United States 2.2 1.6 2.5 0.1 2.7 1.8 4.5 3.5 -2.1 4.6 3.9
Major developed economiesb 1.8 0.3 1.1 -0.7 2.1 2.1 3.0 1.9 0.7 1.2 2.0
Euro area -0.4 -1.0 -0.4 -1.9 -1.3 1.3 0.6 1.0 1.2 0.3 0.6
Unemployment ratec (percentage of total labour force)
Canada 7.4 7.3 7.3 7.2 7.1 7.1 7.1 7.0 7.0 7.0 6.9
France 9.5 9.7 9.8 10.2 10.3 10.3 10.3 10.2 10.1 10.2 10.5
Germany 5.5 5.5 5.4 5.4 5.4 5.3 5.3 5.2 5.1 5.1 5.0
Italy 10.0 10.6 10.8 11.3 11.9 12.2 12.3 12.5 12.6 12.5 12.6
Japan 4.5 4.4 4.3 4.2 4.2 4.0 4.0 3.9 3.6 3.6 3.6
United Kingdom 8.2 7.9 7.8 7.7 7.8 7.7 7.6 7.1 6.7 6.3
United States 8.2 8.2 8.0 7.8 7.7 7.5 7.2 7.0 6.7 6.2 6.1
Major developed economiesd 7.4 7.4 7.3 7.3 7.3 7.2 7.0 6.9 6.6 6.4
Euro area 10.8 11.2 11.4 11.7 12.0 12.0 12.0 11.9 11.7 11.6 11.5
Change in consumer prices (percentage change from one year ago)
Canada 2.3 1.6 1.2 0.9 0.9 0.8 1.1 0.9 1.4 2.2 2.1
France 2.6 2.3 2.3 1.7 1.2 0.9 1.1 0.8 0.9 0.8 0.5
Germany 2.4 2.1 2.1 2.0 1.8 1.5 1.7 1.3 1.0 0.9 0.8
Italy 3.6 3.6 3.4 2.6 2.1 1.3 1.1 0.7 0.5 0.4 -0.1
Japan 0.3 0.2 -0.4 -0.2 -0.6 -0.3 0.9 1.4 1.5 3.6 3.3
United Kingdom 3.5 2.7 2.4 2.7 2.8 2.7 2.7 2.1 1.8 1.7 1.5
United States 2.8 1.9 1.7 1.9 1.7 1.4 1.6 1.2 1.4 2.1 1.8
Major developed economiesb 2.4 1.8 1.6 1.6 1.3 1.1 1.4 1.3 1.3 2.0 1.7
Euro area 2.7 2.5 2.5 2.3 1.9 1.4 1.3 0.8 0.6 0.6 0.4
Source: UN/DESA, based on Eurostat, OECD and national sources.a Expressed as an annualized rate.b Calculated as a weighted average, where weights are based on 2010 GDP in United States dollars.c Seasonally adjusted data as standardized by OECD.d Calculated as a weighted average, where weights are based on labour force.
159Annex tables
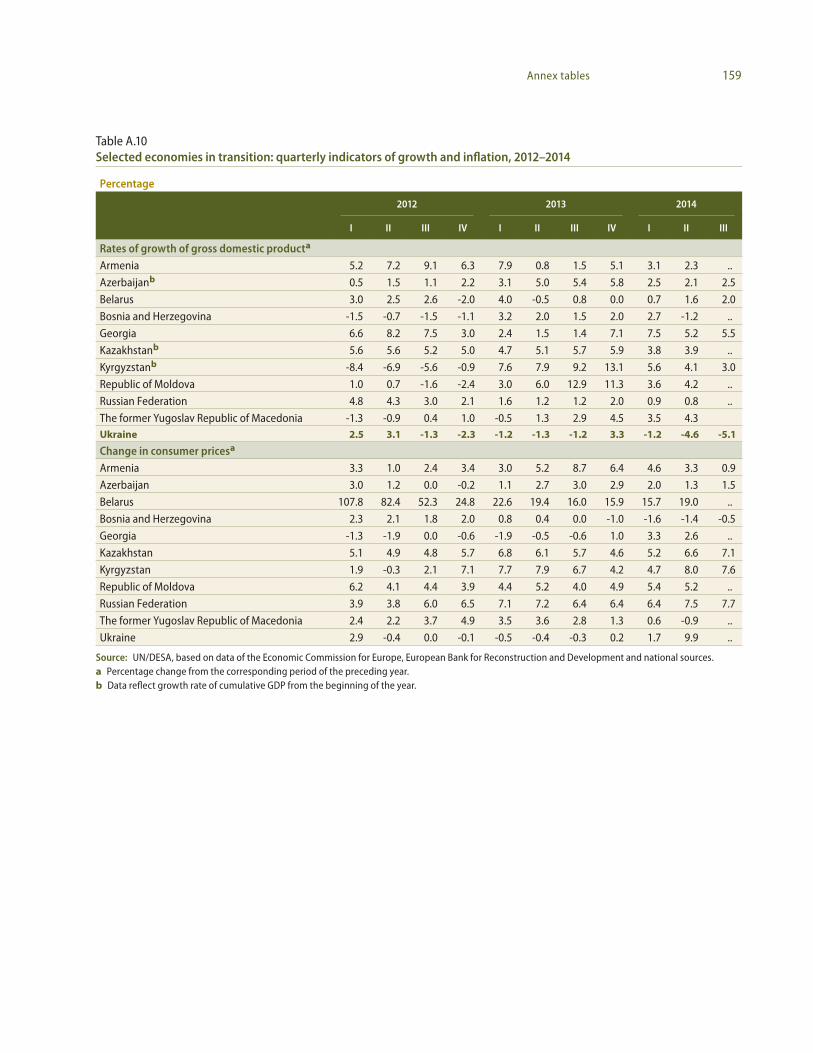
Table A.10Selected economies in transition: quarterly indicators of growth and inflation, 2012–2014
Percentage
2012 2013 2014
I II III IV I II III IV I II III
Rates of growth of gross domestic producta
Armenia 5.2 7.2 9.1 6.3 7.9 0.8 1.5 5.1 3.1 2.3 ..
Azerbaijanb 0.5 1.5 1.1 2.2 3.1 5.0 5.4 5.8 2.5 2.1 2.5
Belarus 3.0 2.5 2.6 -2.0 4.0 -0.5 0.8 0.0 0.7 1.6 2.0
Bosnia and Herzegovina -1.5 -0.7 -1.5 -1.1 3.2 2.0 1.5 2.0 2.7 -1.2 ..
Georgia 6.6 8.2 7.5 3.0 2.4 1.5 1.4 7.1 7.5 5.2 5.5
Kazakhstanb 5.6 5.6 5.2 5.0 4.7 5.1 5.7 5.9 3.8 3.9 ..
Kyrgyzstanb -8.4 -6.9 -5.6 -0.9 7.6 7.9 9.2 13.1 5.6 4.1 3.0
Republic of Moldova 1.0 0.7 -1.6 -2.4 3.0 6.0 12.9 11.3 3.6 4.2 ..
Russian Federation 4.8 4.3 3.0 2.1 1.6 1.2 1.2 2.0 0.9 0.8 ..
The former Yugoslav Republic of Macedonia -1.3 -0.9 0.4 1.0 -0.5 1.3 2.9 4.5 3.5 4.3Ukraine 2.5 3.1 -1.3 -2.3 -1.2 -1.3 -1.2 3.3 -1.2 -4.6 -5.1
Change in consumer pricesa
Armenia 3.3 1.0 2.4 3.4 3.0 5.2 8.7 6.4 4.6 3.3 0.9
Azerbaijan 3.0 1.2 0.0 -0.2 1.1 2.7 3.0 2.9 2.0 1.3 1.5
Belarus 107.8 82.4 52.3 24.8 22.6 19.4 16.0 15.9 15.7 19.0 ..
Bosnia and Herzegovina 2.3 2.1 1.8 2.0 0.8 0.4 0.0 -1.0 -1.6 -1.4 -0.5
Georgia -1.3 -1.9 0.0 -0.6 -1.9 -0.5 -0.6 1.0 3.3 2.6 ..
Kazakhstan 5.1 4.9 4.8 5.7 6.8 6.1 5.7 4.6 5.2 6.6 7.1
Kyrgyzstan 1.9 -0.3 2.1 7.1 7.7 7.9 6.7 4.2 4.7 8.0 7.6
Republic of Moldova 6.2 4.1 4.4 3.9 4.4 5.2 4.0 4.9 5.4 5.2 ..
Russian Federation 3.9 3.8 6.0 6.5 7.1 7.2 6.4 6.4 6.4 7.5 7.7
The former Yugoslav Republic of Macedonia 2.4 2.2 3.7 4.9 3.5 3.6 2.8 1.3 0.6 -0.9 ..
Ukraine 2.9 -0.4 0.0 -0.1 -0.5 -0.4 -0.3 0.2 1.7 9.9 ..
Source: UN/DESA, based on data of the Economic Commission for Europe, European Bank for Reconstruction and Development and national sources.a Percentage change from the corresponding period of the preceding year.b Data reflect growth rate of cumulative GDP from the beginning of the year.
160 World Economic Situation and Prospects 2015
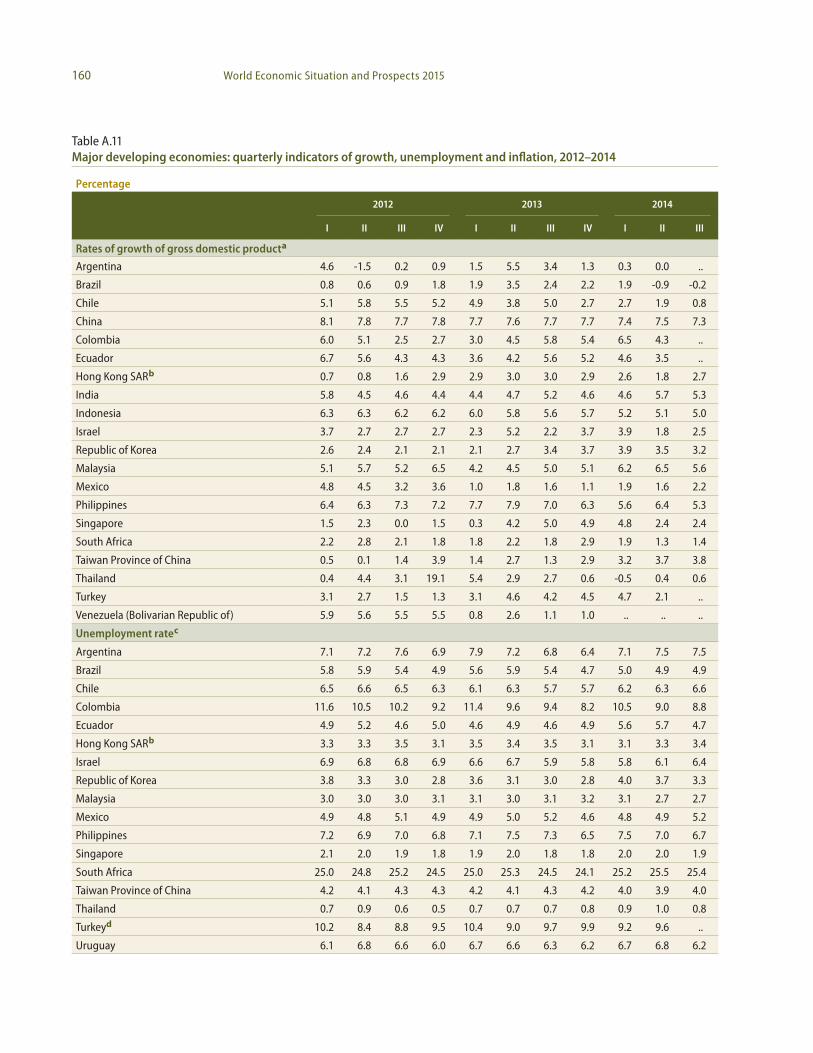
Table A.11Major developing economies: quarterly indicators of growth, unemployment and inflation, 2012–2014
Percentage
2012 2013 2014
I II III IV I II III IV I II III
Rates of growth of gross domestic producta
Argentina 4.6 -1.5 0.2 0.9 1.5 5.5 3.4 1.3 0.3 0.0 ..
Brazil 0.8 0.6 0.9 1.8 1.9 3.5 2.4 2.2 1.9 -0.9 -0.2
Chile 5.1 5.8 5.5 5.2 4.9 3.8 5.0 2.7 2.7 1.9 0.8
China 8.1 7.8 7.7 7.8 7.7 7.6 7.7 7.7 7.4 7.5 7.3
Colombia 6.0 5.1 2.5 2.7 3.0 4.5 5.8 5.4 6.5 4.3 ..
Ecuador 6.7 5.6 4.3 4.3 3.6 4.2 5.6 5.2 4.6 3.5 ..
Hong Kong SARb 0.7 0.8 1.6 2.9 2.9 3.0 3.0 2.9 2.6 1.8 2.7
India 5.8 4.5 4.6 4.4 4.4 4.7 5.2 4.6 4.6 5.7 5.3
Indonesia 6.3 6.3 6.2 6.2 6.0 5.8 5.6 5.7 5.2 5.1 5.0
Israel 3.7 2.7 2.7 2.7 2.3 5.2 2.2 3.7 3.9 1.8 2.5
Republic of Korea 2.6 2.4 2.1 2.1 2.1 2.7 3.4 3.7 3.9 3.5 3.2
Malaysia 5.1 5.7 5.2 6.5 4.2 4.5 5.0 5.1 6.2 6.5 5.6
Mexico 4.8 4.5 3.2 3.6 1.0 1.8 1.6 1.1 1.9 1.6 2.2
Philippines 6.4 6.3 7.3 7.2 7.7 7.9 7.0 6.3 5.6 6.4 5.3
Singapore 1.5 2.3 0.0 1.5 0.3 4.2 5.0 4.9 4.8 2.4 2.4
South Africa 2.2 2.8 2.1 1.8 1.8 2.2 1.8 2.9 1.9 1.3 1.4
Taiwan Province of China 0.5 0.1 1.4 3.9 1.4 2.7 1.3 2.9 3.2 3.7 3.8
Thailand 0.4 4.4 3.1 19.1 5.4 2.9 2.7 0.6 -0.5 0.4 0.6
Turkey 3.1 2.7 1.5 1.3 3.1 4.6 4.2 4.5 4.7 2.1 ..
Venezuela (Bolivarian Republic of) 5.9 5.6 5.5 5.5 0.8 2.6 1.1 1.0 .. .. ..
Unemployment ratec
Argentina 7.1 7.2 7.6 6.9 7.9 7.2 6.8 6.4 7.1 7.5 7.5
Brazil 5.8 5.9 5.4 4.9 5.6 5.9 5.4 4.7 5.0 4.9 4.9
Chile 6.5 6.6 6.5 6.3 6.1 6.3 5.7 5.7 6.2 6.3 6.6
Colombia 11.6 10.5 10.2 9.2 11.4 9.6 9.4 8.2 10.5 9.0 8.8
Ecuador 4.9 5.2 4.6 5.0 4.6 4.9 4.6 4.9 5.6 5.7 4.7
Hong Kong SARb 3.3 3.3 3.5 3.1 3.5 3.4 3.5 3.1 3.1 3.3 3.4
Israel 6.9 6.8 6.8 6.9 6.6 6.7 5.9 5.8 5.8 6.1 6.4
Republic of Korea 3.8 3.3 3.0 2.8 3.6 3.1 3.0 2.8 4.0 3.7 3.3
Malaysia 3.0 3.0 3.0 3.1 3.1 3.0 3.1 3.2 3.1 2.7 2.7
Mexico 4.9 4.8 5.1 4.9 4.9 5.0 5.2 4.6 4.8 4.9 5.2
Philippines 7.2 6.9 7.0 6.8 7.1 7.5 7.3 6.5 7.5 7.0 6.7
Singapore 2.1 2.0 1.9 1.8 1.9 2.0 1.8 1.8 2.0 2.0 1.9
South Africa 25.0 24.8 25.2 24.5 25.0 25.3 24.5 24.1 25.2 25.5 25.4
Taiwan Province of China 4.2 4.1 4.3 4.3 4.2 4.1 4.3 4.2 4.0 3.9 4.0
Thailand 0.7 0.9 0.6 0.5 0.7 0.7 0.7 0.8 0.9 1.0 0.8
Turkeyd 10.2 8.4 8.8 9.5 10.4 9.0 9.7 9.9 9.2 9.6 ..
Uruguay 6.1 6.8 6.6 6.0 6.7 6.6 6.3 6.2 6.7 6.8 6.2
161Annex tables
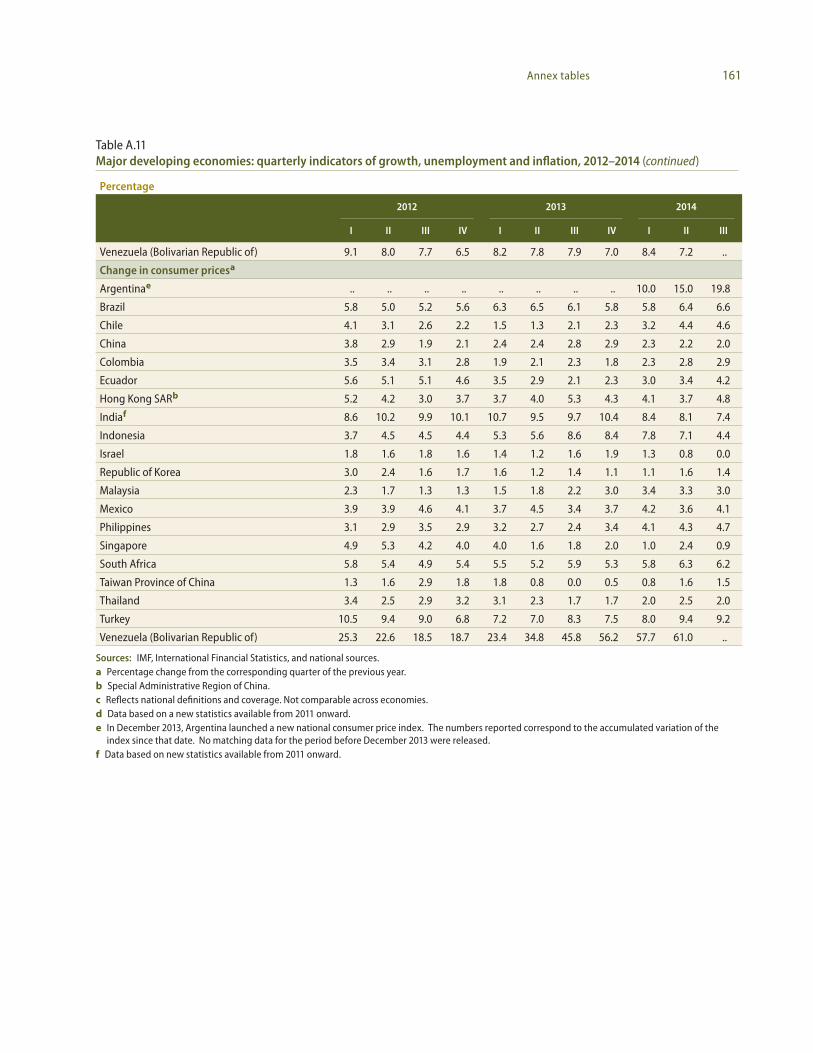
Table A.11Major developing economies: quarterly indicators of growth, unemployment and inflation, 2012–2014 (continued)
Percentage
2012 2013 2014
I II III IV I II III IV I II III
Venezuela (Bolivarian Republic of) 9.1 8.0 7.7 6.5 8.2 7.8 7.9 7.0 8.4 7.2 ..
Change in consumer pricesa
Argentinae .. .. .. .. .. .. .. .. 10.0 15.0 19.8
Brazil 5.8 5.0 5.2 5.6 6.3 6.5 6.1 5.8 5.8 6.4 6.6
Chile 4.1 3.1 2.6 2.2 1.5 1.3 2.1 2.3 3.2 4.4 4.6
China 3.8 2.9 1.9 2.1 2.4 2.4 2.8 2.9 2.3 2.2 2.0
Colombia 3.5 3.4 3.1 2.8 1.9 2.1 2.3 1.8 2.3 2.8 2.9
Ecuador 5.6 5.1 5.1 4.6 3.5 2.9 2.1 2.3 3.0 3.4 4.2
Hong Kong SARb 5.2 4.2 3.0 3.7 3.7 4.0 5.3 4.3 4.1 3.7 4.8
Indiaf 8.6 10.2 9.9 10.1 10.7 9.5 9.7 10.4 8.4 8.1 7.4
Indonesia 3.7 4.5 4.5 4.4 5.3 5.6 8.6 8.4 7.8 7.1 4.4
Israel 1.8 1.6 1.8 1.6 1.4 1.2 1.6 1.9 1.3 0.8 0.0
Republic of Korea 3.0 2.4 1.6 1.7 1.6 1.2 1.4 1.1 1.1 1.6 1.4
Malaysia 2.3 1.7 1.3 1.3 1.5 1.8 2.2 3.0 3.4 3.3 3.0
Mexico 3.9 3.9 4.6 4.1 3.7 4.5 3.4 3.7 4.2 3.6 4.1
Philippines 3.1 2.9 3.5 2.9 3.2 2.7 2.4 3.4 4.1 4.3 4.7
Singapore 4.9 5.3 4.2 4.0 4.0 1.6 1.8 2.0 1.0 2.4 0.9
South Africa 5.8 5.4 4.9 5.4 5.5 5.2 5.9 5.3 5.8 6.3 6.2
Taiwan Province of China 1.3 1.6 2.9 1.8 1.8 0.8 0.0 0.5 0.8 1.6 1.5
Thailand 3.4 2.5 2.9 3.2 3.1 2.3 1.7 1.7 2.0 2.5 2.0
Turkey 10.5 9.4 9.0 6.8 7.2 7.0 8.3 7.5 8.0 9.4 9.2
Venezuela (Bolivarian Republic of) 25.3 22.6 18.5 18.7 23.4 34.8 45.8 56.2 57.7 61.0 ..
Sources: IMF, International Financial Statistics, and national sources.a Percentage change from the corresponding quarter of the previous year.b Special Administrative Region of China.c Reflects national definitions and coverage. Not comparable across economies.d Data based on a new statistics available from 2011 onward.e In December 2013, Argentina launched a new national consumer price index. The numbers reported correspond to the accumulated variation of the index since that date. No matching data for the period before December 2013 were released.f Data based on new statistics available from 2011 onward.
162 World Economic Situation and Prospects 2015
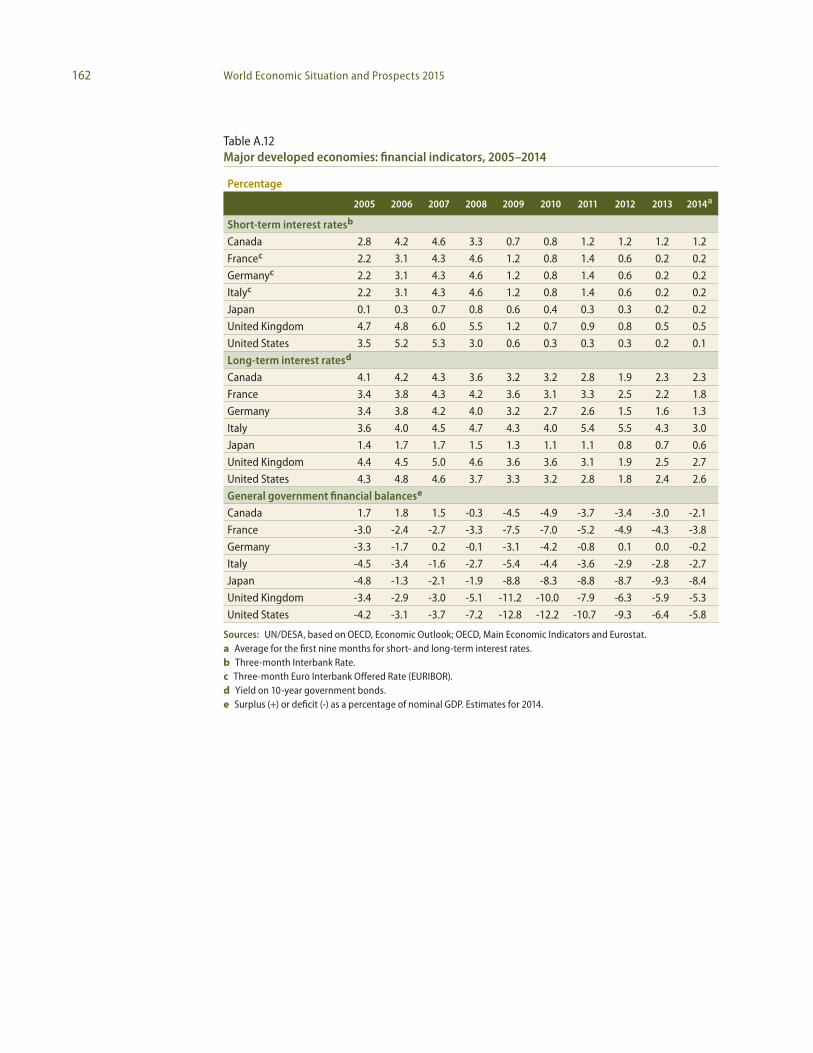
Table A.12Major developed economies: financial indicators, 2005–2014
Percentage
2005 2006 2007 2008 2009 2010 2011 2012 2013 2014a
Short-term interest ratesb
Canada 2.8 4.2 4.6 3.3 0.7 0.8 1.2 1.2 1.2 1.2
Francec 2.2 3.1 4.3 4.6 1.2 0.8 1.4 0.6 0.2 0.2
Germanyc 2.2 3.1 4.3 4.6 1.2 0.8 1.4 0.6 0.2 0.2
Italyc 2.2 3.1 4.3 4.6 1.2 0.8 1.4 0.6 0.2 0.2
Japan 0.1 0.3 0.7 0.8 0.6 0.4 0.3 0.3 0.2 0.2
United Kingdom 4.7 4.8 6.0 5.5 1.2 0.7 0.9 0.8 0.5 0.5
United States 3.5 5.2 5.3 3.0 0.6 0.3 0.3 0.3 0.2 0.1
Long-term interest ratesd
Canada 4.1 4.2 4.3 3.6 3.2 3.2 2.8 1.9 2.3 2.3
France 3.4 3.8 4.3 4.2 3.6 3.1 3.3 2.5 2.2 1.8
Germany 3.4 3.8 4.2 4.0 3.2 2.7 2.6 1.5 1.6 1.3
Italy 3.6 4.0 4.5 4.7 4.3 4.0 5.4 5.5 4.3 3.0
Japan 1.4 1.7 1.7 1.5 1.3 1.1 1.1 0.8 0.7 0.6
United Kingdom 4.4 4.5 5.0 4.6 3.6 3.6 3.1 1.9 2.5 2.7
United States 4.3 4.8 4.6 3.7 3.3 3.2 2.8 1.8 2.4 2.6
General government financial balancese
Canada 1.7 1.8 1.5 -0.3 -4.5 -4.9 -3.7 -3.4 -3.0 -2.1
France -3.0 -2.4 -2.7 -3.3 -7.5 -7.0 -5.2 -4.9 -4.3 -3.8
Germany -3.3 -1.7 0.2 -0.1 -3.1 -4.2 -0.8 0.1 0.0 -0.2
Italy -4.5 -3.4 -1.6 -2.7 -5.4 -4.4 -3.6 -2.9 -2.8 -2.7
Japan -4.8 -1.3 -2.1 -1.9 -8.8 -8.3 -8.8 -8.7 -9.3 -8.4
United Kingdom -3.4 -2.9 -3.0 -5.1 -11.2 -10.0 -7.9 -6.3 -5.9 -5.3
United States -4.2 -3.1 -3.7 -7.2 -12.8 -12.2 -10.7 -9.3 -6.4 -5.8
Sources: UN/DESA, based on OECD, Economic Outlook; OECD, Main Economic Indicators and Eurostat.a Average for the first nine months for short- and long-term interest rates.b Three-month Interbank Rate.c Three-month Euro Interbank Offered Rate (EURIBOR).d Yield on 10-year government bonds.e Surplus (+) or deficit (-) as a percentage of nominal GDP. Estimates for 2014.
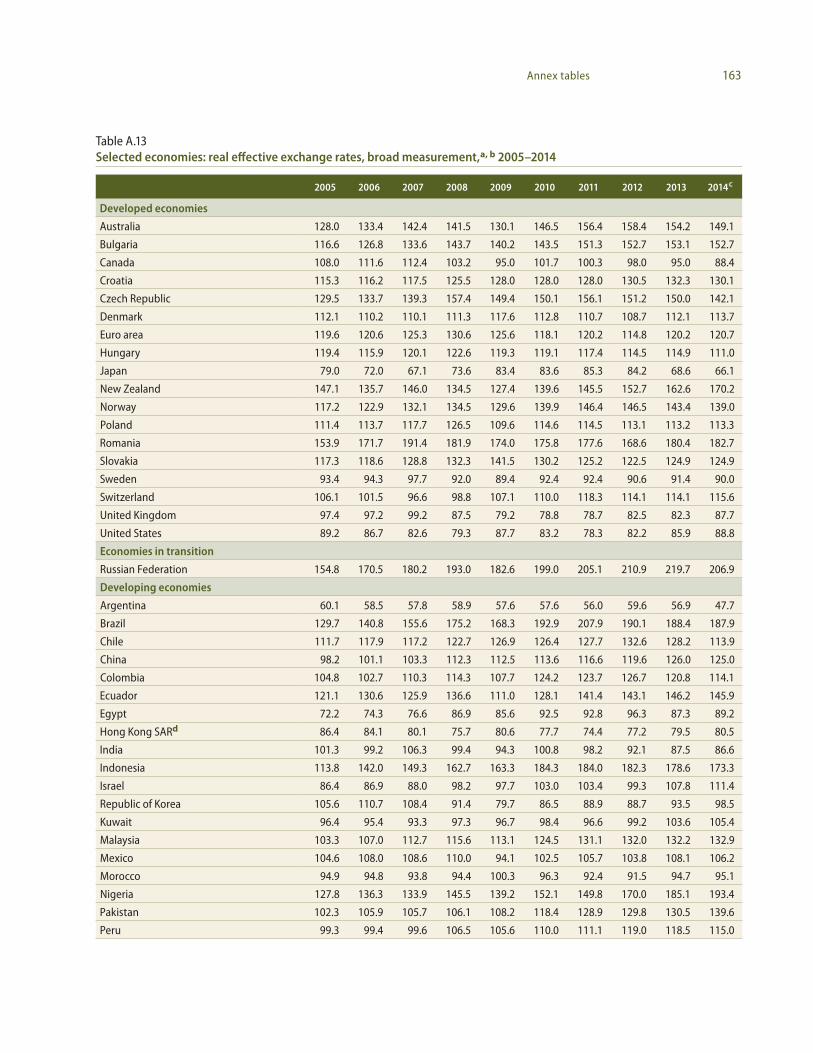
163Annex tables
Table A.13Selected economies: real effective exchange rates, broad measurement,a, b 2005–2014
2005 2006 2007 2008 2009 2010 2011 2012 2013 2014c
Developed economies
Australia 128.0 133.4 142.4 141.5 130.1 146.5 156.4 158.4 154.2 149.1
Bulgaria 116.6 126.8 133.6 143.7 140.2 143.5 151.3 152.7 153.1 152.7
Canada 108.0 111.6 112.4 103.2 95.0 101.7 100.3 98.0 95.0 88.4
Croatia 115.3 116.2 117.5 125.5 128.0 128.0 128.0 130.5 132.3 130.1
Czech Republic 129.5 133.7 139.3 157.4 149.4 150.1 156.1 151.2 150.0 142.1
Denmark 112.1 110.2 110.1 111.3 117.6 112.8 110.7 108.7 112.1 113.7
Euro area 119.6 120.6 125.3 130.6 125.6 118.1 120.2 114.8 120.2 120.7
Hungary 119.4 115.9 120.1 122.6 119.3 119.1 117.4 114.5 114.9 111.0
Japan 79.0 72.0 67.1 73.6 83.4 83.6 85.3 84.2 68.6 66.1
New Zealand 147.1 135.7 146.0 134.5 127.4 139.6 145.5 152.7 162.6 170.2
Norway 117.2 122.9 132.1 134.5 129.6 139.9 146.4 146.5 143.4 139.0
Poland 111.4 113.7 117.7 126.5 109.6 114.6 114.5 113.1 113.2 113.3
Romania 153.9 171.7 191.4 181.9 174.0 175.8 177.6 168.6 180.4 182.7
Slovakia 117.3 118.6 128.8 132.3 141.5 130.2 125.2 122.5 124.9 124.9
Sweden 93.4 94.3 97.7 92.0 89.4 92.4 92.4 90.6 91.4 90.0
Switzerland 106.1 101.5 96.6 98.8 107.1 110.0 118.3 114.1 114.1 115.6
United Kingdom 97.4 97.2 99.2 87.5 79.2 78.8 78.7 82.5 82.3 87.7
United States 89.2 86.7 82.6 79.3 87.7 83.2 78.3 82.2 85.9 88.8
Economies in transition
Russian Federation 154.8 170.5 180.2 193.0 182.6 199.0 205.1 210.9 219.7 206.9
Developing economies
Argentina 60.1 58.5 57.8 58.9 57.6 57.6 56.0 59.6 56.9 47.7
Brazil 129.7 140.8 155.6 175.2 168.3 192.9 207.9 190.1 188.4 187.9
Chile 111.7 117.9 117.2 122.7 126.9 126.4 127.7 132.6 128.2 113.9
China 98.2 101.1 103.3 112.3 112.5 113.6 116.6 119.6 126.0 125.0
Colombia 104.8 102.7 110.3 114.3 107.7 124.2 123.7 126.7 120.8 114.1
Ecuador 121.1 130.6 125.9 136.6 111.0 128.1 141.4 143.1 146.2 145.9
Egypt 72.2 74.3 76.6 86.9 85.6 92.5 92.8 96.3 87.3 89.2
Hong Kong SARd 86.4 84.1 80.1 75.7 80.6 77.7 74.4 77.2 79.5 80.5
India 101.3 99.2 106.3 99.4 94.3 100.8 98.2 92.1 87.5 86.6
Indonesia 113.8 142.0 149.3 162.7 163.3 184.3 184.0 182.3 178.6 173.3
Israel 86.4 86.9 88.0 98.2 97.7 103.0 103.4 99.3 107.8 111.4
Republic of Korea 105.6 110.7 108.4 91.4 79.7 86.5 88.9 88.7 93.5 98.5
Kuwait 96.4 95.4 93.3 97.3 96.7 98.4 96.6 99.2 103.6 105.4
Malaysia 103.3 107.0 112.7 115.6 113.1 124.5 131.1 132.0 132.2 132.9
Mexico 104.6 108.0 108.6 110.0 94.1 102.5 105.7 103.8 108.1 106.2
Morocco 94.9 94.8 93.8 94.4 100.3 96.3 92.4 91.5 94.7 95.1
Nigeria 127.8 136.3 133.9 145.5 139.2 152.1 149.8 170.0 185.1 193.4
Pakistan 102.3 105.9 105.7 106.1 108.2 118.4 128.9 129.8 130.5 139.6
Peru 99.3 99.4 99.6 106.5 105.6 110.0 111.1 119.0 118.5 115.0
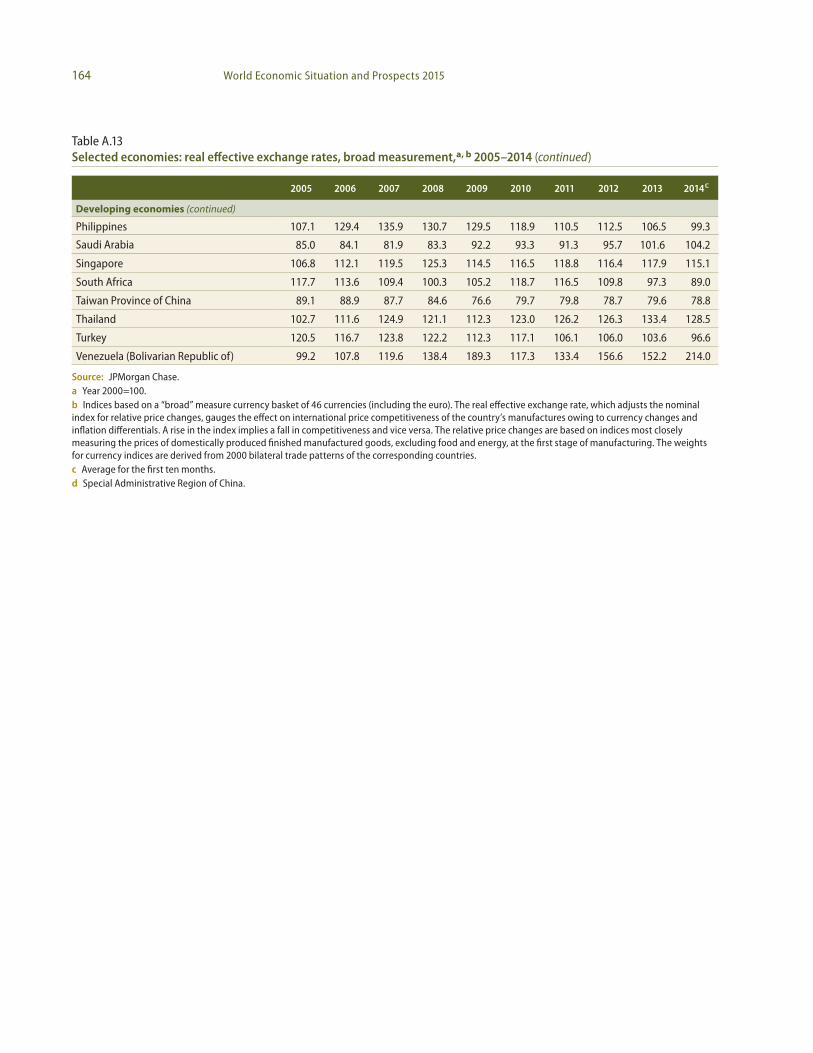
164 World Economic Situation and Prospects 2015
2005 2006 2007 2008 2009 2010 2011 2012 2013 2014c
Developing economies (continued)
Philippines 107.1 129.4 135.9 130.7 129.5 118.9 110.5 112.5 106.5 99.3
Saudi Arabia 85.0 84.1 81.9 83.3 92.2 93.3 91.3 95.7 101.6 104.2
Singapore 106.8 112.1 119.5 125.3 114.5 116.5 118.8 116.4 117.9 115.1
South Africa 117.7 113.6 109.4 100.3 105.2 118.7 116.5 109.8 97.3 89.0
Taiwan Province of China 89.1 88.9 87.7 84.6 76.6 79.7 79.8 78.7 79.6 78.8
Thailand 102.7 111.6 124.9 121.1 112.3 123.0 126.2 126.3 133.4 128.5
Turkey 120.5 116.7 123.8 122.2 112.3 117.1 106.1 106.0 103.6 96.6
Venezuela (Bolivarian Republic of) 99.2 107.8 119.6 138.4 189.3 117.3 133.4 156.6 152.2 214.0
Source: JPMorgan Chase.a Year 2000=100.b Indices based on a “broad” measure currency basket of 46 currencies (including the euro). The real effective exchange rate, which adjusts the nominal index for relative price changes, gauges the effect on international price competitiveness of the country’s manufactures owing to currency changes and inflation differentials. A rise in the index implies a fall in competitiveness and vice versa. The relative price changes are based on indices most closely measuring the prices of domestically produced finished manufactured goods, excluding food and energy, at the first stage of manufacturing. The weights for currency indices are derived from 2000 bilateral trade patterns of the corresponding countries.c Average for the first ten months.d Special Administrative Region of China.
Table A.13Selected economies: real effective exchange rates, broad measurement,a, b 2005–2014 (continued)
165Annex tables
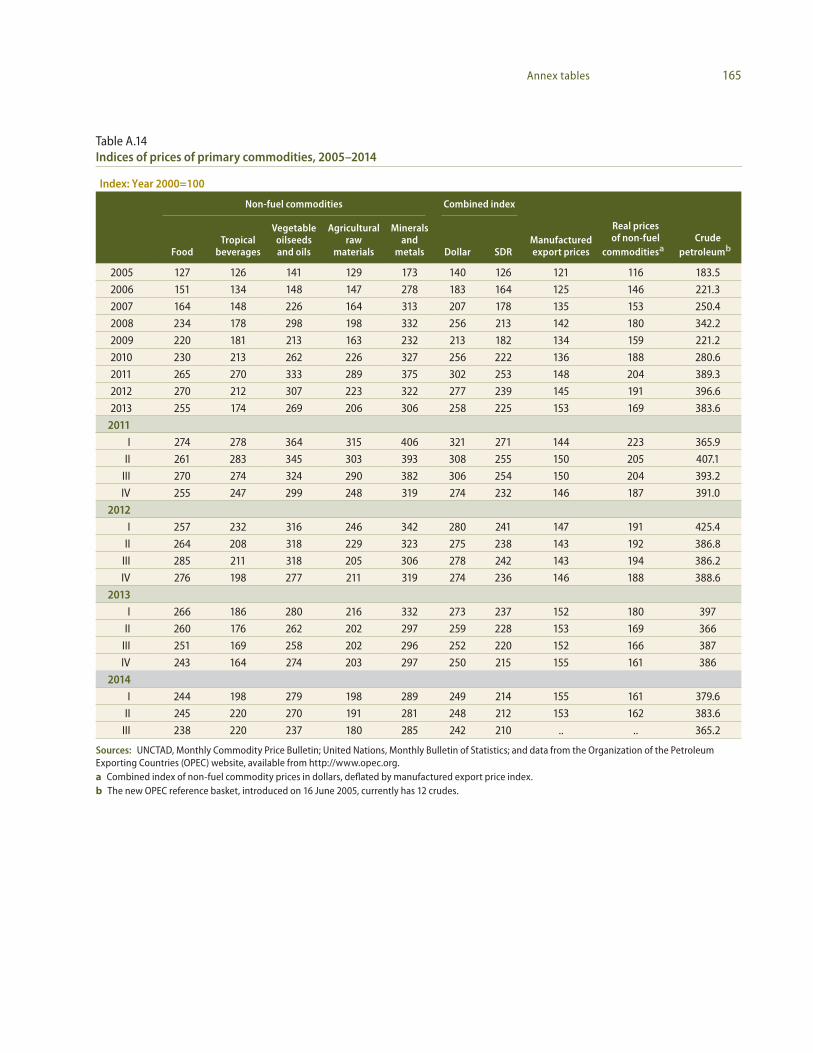
Table A.14Indices of prices of primary commodities, 2005–2014
Index: Year 2000=100
Non-fuel commodities Combined index
Manufactured export prices
Real prices of non-fuel
commoditiesaaCrude
petroleumbbFoodTropical
beverages
Vegetable oilseeds and oils
Agricultural raw
materials
Minerals and
metals Dollar SDR
2005 127 126 141 129 173 140 126 121 116 183.5
2006 151 134 148 147 278 183 164 125 146 221.3
2007 164 148 226 164 313 207 178 135 153 250.4
2008 234 178 298 198 332 256 213 142 180 342.2
2009 220 181 213 163 232 213 182 134 159 221.2
2010 230 213 262 226 327 256 222 136 188 280.6
2011 265 270 333 289 375 302 253 148 204 389.3
2012 270 212 307 223 322 277 239 145 191 396.6
2013 255 174 269 206 306 258 225 153 169 383.6
2011I 274 278 364 315 406 321 271 144 223 365.9
II 261 283 345 303 393 308 255 150 205 407.1
III 270 274 324 290 382 306 254 150 204 393.2
IV 255 247 299 248 319 274 232 146 187 391.0
2012I 257 232 316 246 342 280 241 147 191 425.4
II 264 208 318 229 323 275 238 143 192 386.8
III 285 211 318 205 306 278 242 143 194 386.2
IV 276 198 277 211 319 274 236 146 188 388.6
2013I 266 186 280 216 332 273 237 152 180 397
II 260 176 262 202 297 259 228 153 169 366
III 251 169 258 202 296 252 220 152 166 387
IV 243 164 274 203 297 250 215 155 161 386
2014I 244 198 279 198 289 249 214 155 161 379.6
II 245 220 270 191 281 248 212 153 162 383.6
III 238 220 237 180 285 242 210 .. .. 365.2
Sources: UNCTAD, Monthly Commodity Price Bulletin; United Nations, Monthly Bulletin of Statistics; and data from the Organization of the Petroleum Exporting Countries (OPEC) website, available from http://www.opec.org.a Combined index of non-fuel commodity prices in dollars, deflated by manufactured export price index.b The new OPEC reference basket, introduced on 16 June 2005, currently has 12 crudes.
166 World Economic Situation and Prospects 2015
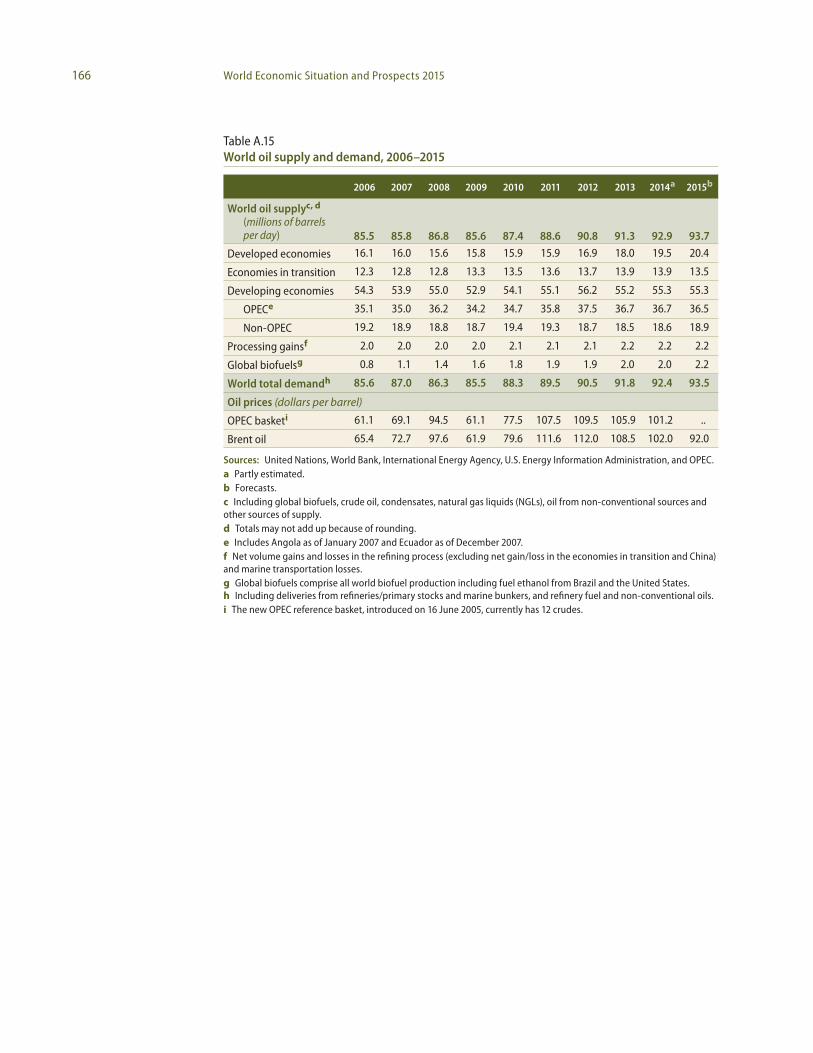
Table A.15World oil supply and demand, 2006–2015
2006 2007 2008 2009 2010 2011 2012 2013 2014a 2015b
World oil supplyc, d (millions of barrels per day) 85.5 85.8 86.8 85.6 87.4 88.6 90.8 91.3 92.9 93.7
Developed economies 16.1 16.0 15.6 15.8 15.9 15.9 16.9 18.0 19.5 20.4
Economies in transition 12.3 12.8 12.8 13.3 13.5 13.6 13.7 13.9 13.9 13.5
Developing economies 54.3 53.9 55.0 52.9 54.1 55.1 56.2 55.2 55.3 55.3
OPECe 35.1 35.0 36.2 34.2 34.7 35.8 37.5 36.7 36.7 36.5
Non-OPEC 19.2 18.9 18.8 18.7 19.4 19.3 18.7 18.5 18.6 18.9
Processing gainsf 2.0 2.0 2.0 2.0 2.1 2.1 2.1 2.2 2.2 2.2
Global biofuelsg 0.8 1.1 1.4 1.6 1.8 1.9 1.9 2.0 2.0 2.2
World total demandh 85.6 87.0 86.3 85.5 88.3 89.5 90.5 91.8 92.4 93.5
Oil prices (dollars per barrel)
OPEC basketi 61.1 69.1 94.5 61.1 77.5 107.5 109.5 105.9 101.2 ..
Brent oil 65.4 72.7 97.6 61.9 79.6 111.6 112.0 108.5 102.0 92.0
Sources: United Nations, World Bank, International Energy Agency, U.S. Energy Information Administration, and OPEC.a Partly estimated.b Forecasts.c Including global biofuels, crude oil, condensates, natural gas liquids (NGLs), oil from non-conventional sources and other sources of supply.d Totals may not add up because of rounding.e Includes Angola as of January 2007 and Ecuador as of December 2007.f Net volume gains and losses in the refining process (excluding net gain/loss in the economies in transition and China) and marine transportation losses.g Global biofuels comprise all world biofuel production including fuel ethanol from Brazil and the United States. h Including deliveries from refineries/primary stocks and marine bunkers, and refinery fuel and non-conventional oils.i The new OPEC reference basket, introduced on 16 June 2005, currently has 12 crudes.
167Annex tables
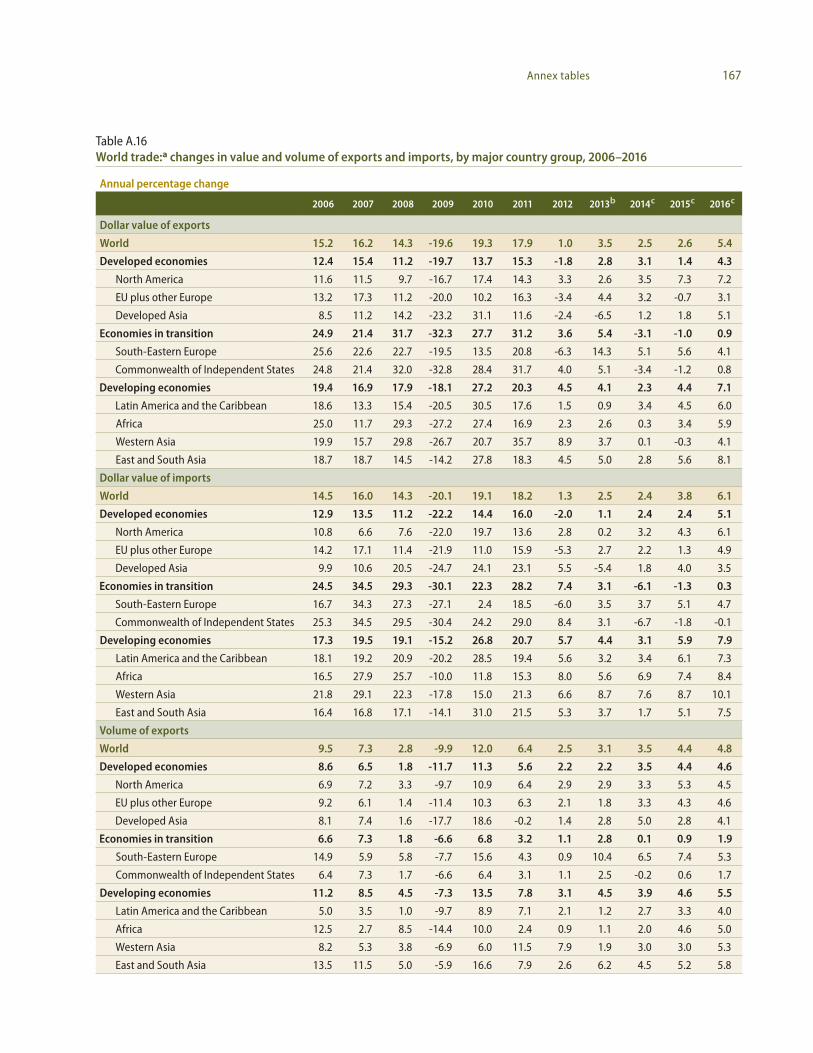
Table A.16World trade:a changes in value and volume of exports and imports, by major country group, 2006–2016
Annual percentage change
2006 2007 2008 2009 2010 2011 2012 2013b 2014c 2015c 2016c
Dollar value of exports
World 15.2 16.2 14.3 -19.6 19.3 17.9 1.0 3.5 2.5 2.6 5.4
Developed economies 12.4 15.4 11.2 -19.7 13.7 15.3 -1.8 2.8 3.1 1.4 4.3
North America 11.6 11.5 9.7 -16.7 17.4 14.3 3.3 2.6 3.5 7.3 7.2
EU plus other Europe 13.2 17.3 11.2 -20.0 10.2 16.3 -3.4 4.4 3.2 -0.7 3.1
Developed Asia 8.5 11.2 14.2 -23.2 31.1 11.6 -2.4 -6.5 1.2 1.8 5.1
Economies in transition 24.9 21.4 31.7 -32.3 27.7 31.2 3.6 5.4 -3.1 -1.0 0.9
South-Eastern Europe 25.6 22.6 22.7 -19.5 13.5 20.8 -6.3 14.3 5.1 5.6 4.1
Commonwealth of Independent States 24.8 21.4 32.0 -32.8 28.4 31.7 4.0 5.1 -3.4 -1.2 0.8
Developing economies 19.4 16.9 17.9 -18.1 27.2 20.3 4.5 4.1 2.3 4.4 7.1
Latin America and the Caribbean 18.6 13.3 15.4 -20.5 30.5 17.6 1.5 0.9 3.4 4.5 6.0
Africa 25.0 11.7 29.3 -27.2 27.4 16.9 2.3 2.6 0.3 3.4 5.9
Western Asia 19.9 15.7 29.8 -26.7 20.7 35.7 8.9 3.7 0.1 -0.3 4.1
East and South Asia 18.7 18.7 14.5 -14.2 27.8 18.3 4.5 5.0 2.8 5.6 8.1
Dollar value of imports
World 14.5 16.0 14.3 -20.1 19.1 18.2 1.3 2.5 2.4 3.8 6.1
Developed economies 12.9 13.5 11.2 -22.2 14.4 16.0 -2.0 1.1 2.4 2.4 5.1
North America 10.8 6.6 7.6 -22.0 19.7 13.6 2.8 0.2 3.2 4.3 6.1
EU plus other Europe 14.2 17.1 11.4 -21.9 11.0 15.9 -5.3 2.7 2.2 1.3 4.9
Developed Asia 9.9 10.6 20.5 -24.7 24.1 23.1 5.5 -5.4 1.8 4.0 3.5
Economies in transition 24.5 34.5 29.3 -30.1 22.3 28.2 7.4 3.1 -6.1 -1.3 0.3
South-Eastern Europe 16.7 34.3 27.3 -27.1 2.4 18.5 -6.0 3.5 3.7 5.1 4.7
Commonwealth of Independent States 25.3 34.5 29.5 -30.4 24.2 29.0 8.4 3.1 -6.7 -1.8 -0.1
Developing economies 17.3 19.5 19.1 -15.2 26.8 20.7 5.7 4.4 3.1 5.9 7.9
Latin America and the Caribbean 18.1 19.2 20.9 -20.2 28.5 19.4 5.6 3.2 3.4 6.1 7.3
Africa 16.5 27.9 25.7 -10.0 11.8 15.3 8.0 5.6 6.9 7.4 8.4
Western Asia 21.8 29.1 22.3 -17.8 15.0 21.3 6.6 8.7 7.6 8.7 10.1
East and South Asia 16.4 16.8 17.1 -14.1 31.0 21.5 5.3 3.7 1.7 5.1 7.5
Volume of exports
World 9.5 7.3 2.8 -9.9 12.0 6.4 2.5 3.1 3.5 4.4 4.8
Developed economies 8.6 6.5 1.8 -11.7 11.3 5.6 2.2 2.2 3.5 4.4 4.6
North America 6.9 7.2 3.3 -9.7 10.9 6.4 2.9 2.9 3.3 5.3 4.5
EU plus other Europe 9.2 6.1 1.4 -11.4 10.3 6.3 2.1 1.8 3.3 4.3 4.6
Developed Asia 8.1 7.4 1.6 -17.7 18.6 -0.2 1.4 2.8 5.0 2.8 4.1
Economies in transition 6.6 7.3 1.8 -6.6 6.8 3.2 1.1 2.8 0.1 0.9 1.9
South-Eastern Europe 14.9 5.9 5.8 -7.7 15.6 4.3 0.9 10.4 6.5 7.4 5.3
Commonwealth of Independent States 6.4 7.3 1.7 -6.6 6.4 3.1 1.1 2.5 -0.2 0.6 1.7
Developing economies 11.2 8.5 4.5 -7.3 13.5 7.8 3.1 4.5 3.9 4.6 5.5
Latin America and the Caribbean 5.0 3.5 1.0 -9.7 8.9 7.1 2.1 1.2 2.7 3.3 4.0
Africa 12.5 2.7 8.5 -14.4 10.0 2.4 0.9 1.1 2.0 4.6 5.0
Western Asia 8.2 5.3 3.8 -6.9 6.0 11.5 7.9 1.9 3.0 3.0 5.3
East and South Asia 13.5 11.5 5.0 -5.9 16.6 7.9 2.6 6.2 4.5 5.2 5.8
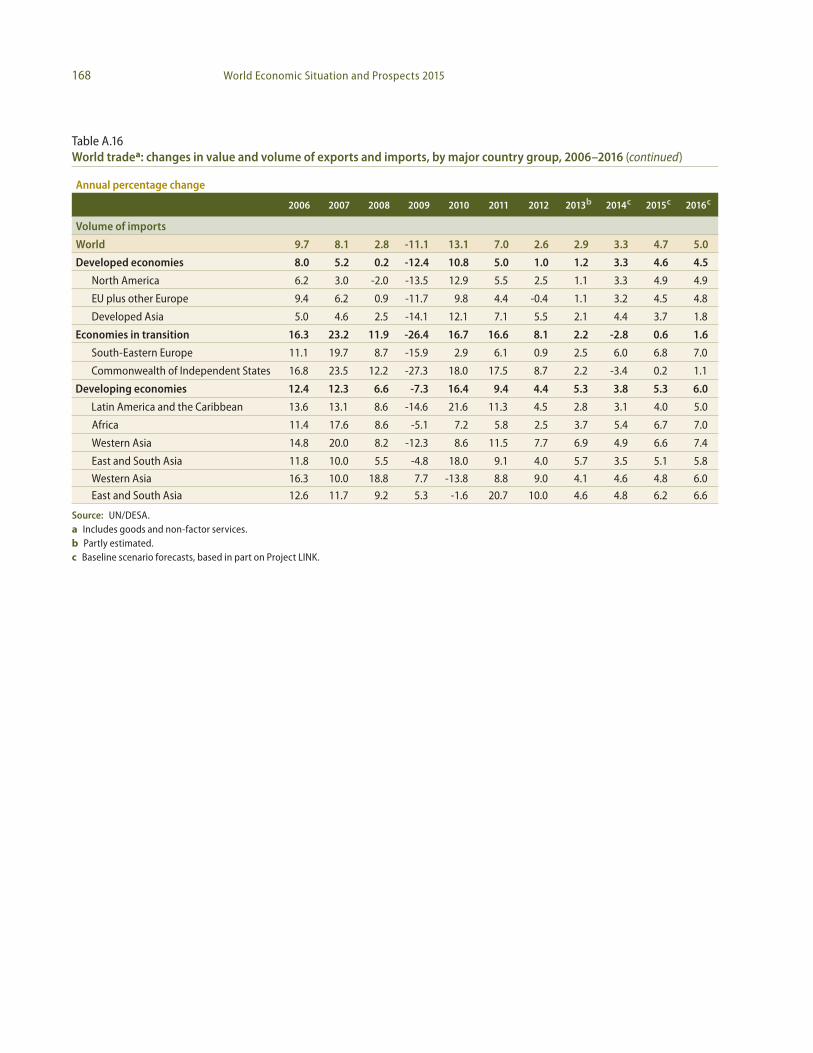
168 World Economic Situation and Prospects 2015
Annual percentage change
2006 2007 2008 2009 2010 2011 2012 2013b 2014c 2015c 2016c
Volume of imports
World 9.7 8.1 2.8 -11.1 13.1 7.0 2.6 2.9 3.3 4.7 5.0
Developed economies 8.0 5.2 0.2 -12.4 10.8 5.0 1.0 1.2 3.3 4.6 4.5
North America 6.2 3.0 -2.0 -13.5 12.9 5.5 2.5 1.1 3.3 4.9 4.9
EU plus other Europe 9.4 6.2 0.9 -11.7 9.8 4.4 -0.4 1.1 3.2 4.5 4.8
Developed Asia 5.0 4.6 2.5 -14.1 12.1 7.1 5.5 2.1 4.4 3.7 1.8
Economies in transition 16.3 23.2 11.9 -26.4 16.7 16.6 8.1 2.2 -2.8 0.6 1.6
South-Eastern Europe 11.1 19.7 8.7 -15.9 2.9 6.1 0.9 2.5 6.0 6.8 7.0
Commonwealth of Independent States 16.8 23.5 12.2 -27.3 18.0 17.5 8.7 2.2 -3.4 0.2 1.1
Developing economies 12.4 12.3 6.6 -7.3 16.4 9.4 4.4 5.3 3.8 5.3 6.0
Latin America and the Caribbean 13.6 13.1 8.6 -14.6 21.6 11.3 4.5 2.8 3.1 4.0 5.0
Africa 11.4 17.6 8.6 -5.1 7.2 5.8 2.5 3.7 5.4 6.7 7.0
Western Asia 14.8 20.0 8.2 -12.3 8.6 11.5 7.7 6.9 4.9 6.6 7.4
East and South Asia 11.8 10.0 5.5 -4.8 18.0 9.1 4.0 5.7 3.5 5.1 5.8
Western Asia 16.3 10.0 18.8 7.7 -13.8 8.8 9.0 4.1 4.6 4.8 6.0
East and South Asia 12.6 11.7 9.2 5.3 -1.6 20.7 10.0 4.6 4.8 6.2 6.6
Source: UN/DESA.a Includes goods and non-factor services.b Partly estimated.c Baseline scenario forecasts, based in part on Project LINK.
Table A.16World tradea: changes in value and volume of exports and imports, by major country group, 2006–2016 (continued)
169Annex tables
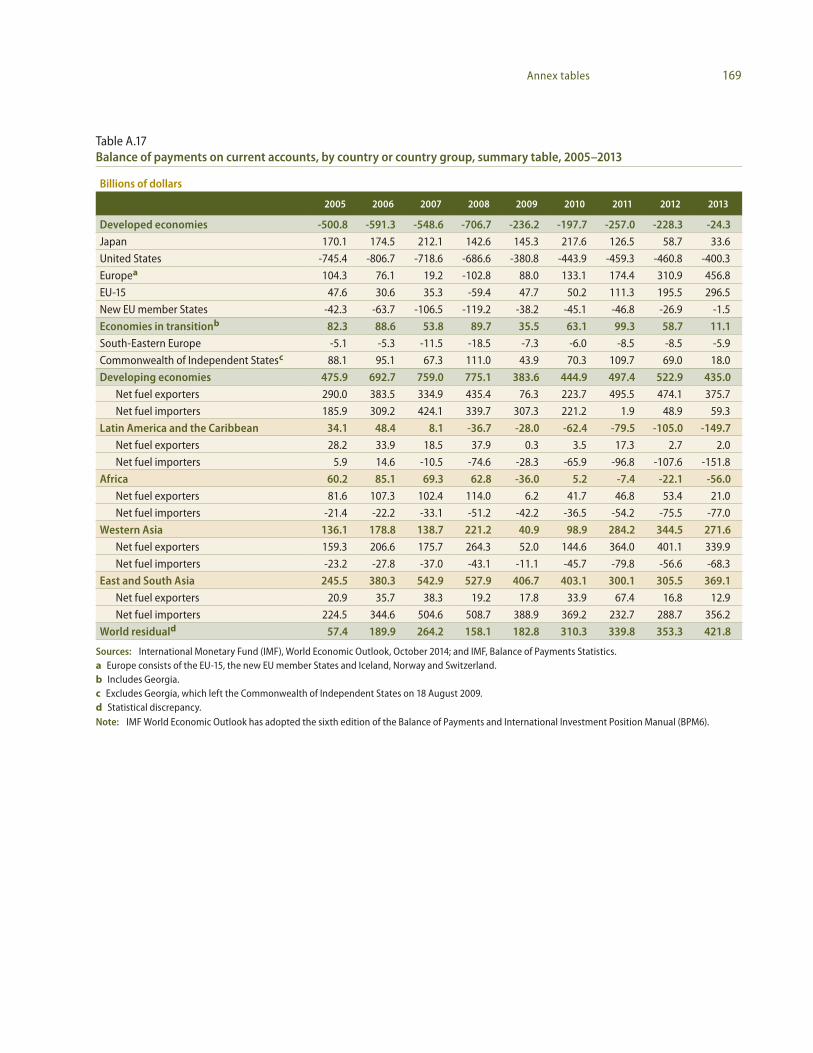
Table A.17Balance of payments on current accounts, by country or country group, summary table, 2005–2013
Billions of dollars
2005 2006 2007 2008 2009 2010 2011 2012 2013
Developed economies -500.8 -591.3 -548.6 -706.7 -236.2 -197.7 -257.0 -228.3 -24.3 Japan 170.1 174.5 212.1 142.6 145.3 217.6 126.5 58.7 33.6
United States -745.4 -806.7 -718.6 -686.6 -380.8 -443.9 -459.3 -460.8 -400.3
Europea 104.3 76.1 19.2 -102.8 88.0 133.1 174.4 310.9 456.8
EU-15 47.6 30.6 35.3 -59.4 47.7 50.2 111.3 195.5 296.5
New EU member States -42.3 -63.7 -106.5 -119.2 -38.2 -45.1 -46.8 -26.9 -1.5
Economies in transitionb 82.3 88.6 53.8 89.7 35.5 63.1 99.3 58.7 11.1 South-Eastern Europe -5.1 -5.3 -11.5 -18.5 -7.3 -6.0 -8.5 -8.5 -5.9
Commonwealth of Independent Statesc 88.1 95.1 67.3 111.0 43.9 70.3 109.7 69.0 18.0
Developing economies 475.9 692.7 759.0 775.1 383.6 444.9 497.4 522.9 435.0 Net fuel exporters 290.0 383.5 334.9 435.4 76.3 223.7 495.5 474.1 375.7
Net fuel importers 185.9 309.2 424.1 339.7 307.3 221.2 1.9 48.9 59.3
Latin America and the Caribbean 34.1 48.4 8.1 -36.7 -28.0 -62.4 -79.5 -105.0 -149.7 Net fuel exporters 28.2 33.9 18.5 37.9 0.3 3.5 17.3 2.7 2.0
Net fuel importers 5.9 14.6 -10.5 -74.6 -28.3 -65.9 -96.8 -107.6 -151.8
Africa 60.2 85.1 69.3 62.8 -36.0 5.2 -7.4 -22.1 -56.0 Net fuel exporters 81.6 107.3 102.4 114.0 6.2 41.7 46.8 53.4 21.0
Net fuel importers -21.4 -22.2 -33.1 -51.2 -42.2 -36.5 -54.2 -75.5 -77.0
Western Asia 136.1 178.8 138.7 221.2 40.9 98.9 284.2 344.5 271.6 Net fuel exporters 159.3 206.6 175.7 264.3 52.0 144.6 364.0 401.1 339.9
Net fuel importers -23.2 -27.8 -37.0 -43.1 -11.1 -45.7 -79.8 -56.6 -68.3
East and South Asia 245.5 380.3 542.9 527.9 406.7 403.1 300.1 305.5 369.1 Net fuel exporters 20.9 35.7 38.3 19.2 17.8 33.9 67.4 16.8 12.9
Net fuel importers 224.5 344.6 504.6 508.7 388.9 369.2 232.7 288.7 356.2
World residuald 57.4 189.9 264.2 158.1 182.8 310.3 339.8 353.3 421.8
Sources: International Monetary Fund (IMF), World Economic Outlook, October 2014; and IMF, Balance of Payments Statistics.a Europe consists of the EU-15, the new EU member States and Iceland, Norway and Switzerland.b Includes Georgia.c Excludes Georgia, which left the Commonwealth of Independent States on 18 August 2009.d Statistical discrepancy.Note: IMF World Economic Outlook has adopted the sixth edition of the Balance of Payments and International Investment Position Manual (BPM6).
170 World Economic Situation and Prospects 2015
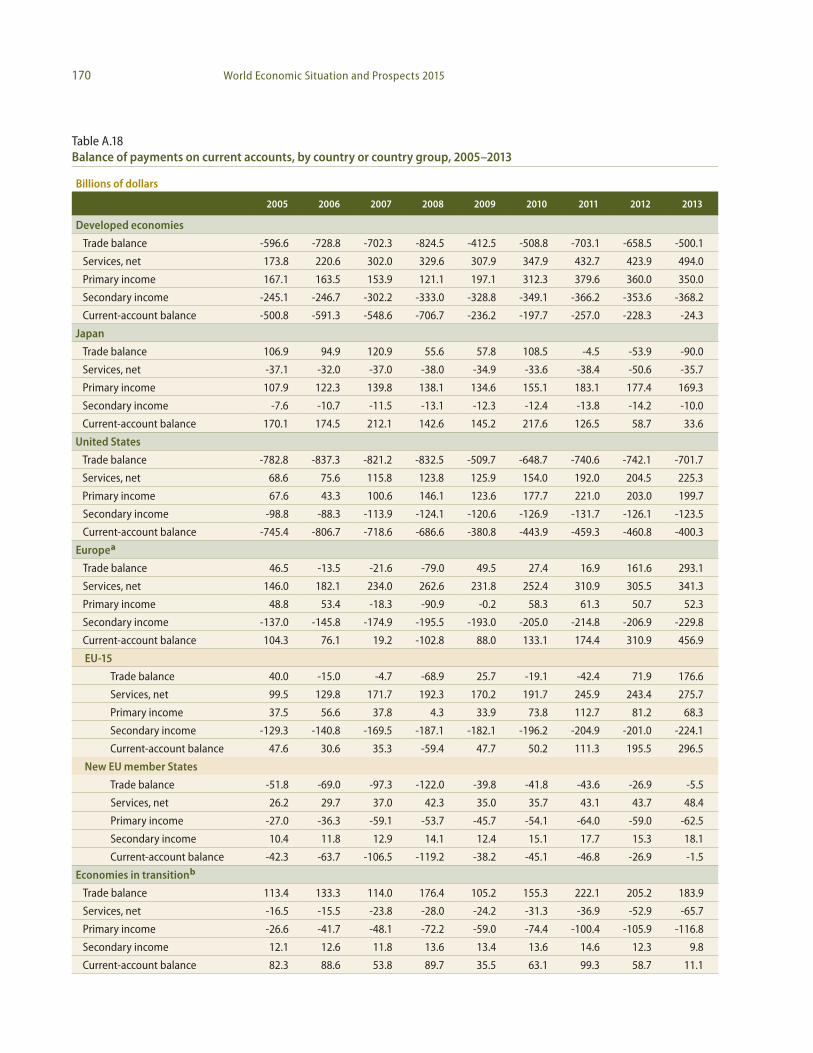
Table A.18Balance of payments on current accounts, by country or country group, 2005–2013
Billions of dollars
2005 2006 2007 2008 2009 2010 2011 2012 2013
Developed economies
Trade balance -596.6 -728.8 -702.3 -824.5 -412.5 -508.8 -703.1 -658.5 -500.1
Services, net 173.8 220.6 302.0 329.6 307.9 347.9 432.7 423.9 494.0
Primary income 167.1 163.5 153.9 121.1 197.1 312.3 379.6 360.0 350.0
Secondary income -245.1 -246.7 -302.2 -333.0 -328.8 -349.1 -366.2 -353.6 -368.2
Current-account balance -500.8 -591.3 -548.6 -706.7 -236.2 -197.7 -257.0 -228.3 -24.3
Japan
Trade balance 106.9 94.9 120.9 55.6 57.8 108.5 -4.5 -53.9 -90.0
Services, net -37.1 -32.0 -37.0 -38.0 -34.9 -33.6 -38.4 -50.6 -35.7
Primary income 107.9 122.3 139.8 138.1 134.6 155.1 183.1 177.4 169.3
Secondary income -7.6 -10.7 -11.5 -13.1 -12.3 -12.4 -13.8 -14.2 -10.0
Current-account balance 170.1 174.5 212.1 142.6 145.2 217.6 126.5 58.7 33.6
United States
Trade balance -782.8 -837.3 -821.2 -832.5 -509.7 -648.7 -740.6 -742.1 -701.7
Services, net 68.6 75.6 115.8 123.8 125.9 154.0 192.0 204.5 225.3
Primary income 67.6 43.3 100.6 146.1 123.6 177.7 221.0 203.0 199.7
Secondary income -98.8 -88.3 -113.9 -124.1 -120.6 -126.9 -131.7 -126.1 -123.5
Current-account balance -745.4 -806.7 -718.6 -686.6 -380.8 -443.9 -459.3 -460.8 -400.3
Europea
Trade balance 46.5 -13.5 -21.6 -79.0 49.5 27.4 16.9 161.6 293.1
Services, net 146.0 182.1 234.0 262.6 231.8 252.4 310.9 305.5 341.3
Primary income 48.8 53.4 -18.3 -90.9 -0.2 58.3 61.3 50.7 52.3
Secondary income -137.0 -145.8 -174.9 -195.5 -193.0 -205.0 -214.8 -206.9 -229.8
Current-account balance 104.3 76.1 19.2 -102.8 88.0 133.1 174.4 310.9 456.9
EU-15
Trade balance 40.0 -15.0 -4.7 -68.9 25.7 -19.1 -42.4 71.9 176.6
Services, net 99.5 129.8 171.7 192.3 170.2 191.7 245.9 243.4 275.7
Primary income 37.5 56.6 37.8 4.3 33.9 73.8 112.7 81.2 68.3
Secondary income -129.3 -140.8 -169.5 -187.1 -182.1 -196.2 -204.9 -201.0 -224.1
Current-account balance 47.6 30.6 35.3 -59.4 47.7 50.2 111.3 195.5 296.5
New EU member States
Trade balance -51.8 -69.0 -97.3 -122.0 -39.8 -41.8 -43.6 -26.9 -5.5
Services, net 26.2 29.7 37.0 42.3 35.0 35.7 43.1 43.7 48.4
Primary income -27.0 -36.3 -59.1 -53.7 -45.7 -54.1 -64.0 -59.0 -62.5
Secondary income 10.4 11.8 12.9 14.1 12.4 15.1 17.7 15.3 18.1
Current-account balance -42.3 -63.7 -106.5 -119.2 -38.2 -45.1 -46.8 -26.9 -1.5
Economies in transitionb
Trade balance 113.4 133.3 114.0 176.4 105.2 155.3 222.1 205.2 183.9
Services, net -16.5 -15.5 -23.8 -28.0 -24.2 -31.3 -36.9 -52.9 -65.7
Primary income -26.6 -41.7 -48.1 -72.2 -59.0 -74.4 -100.4 -105.9 -116.8
Secondary income 12.1 12.6 11.8 13.6 13.4 13.6 14.6 12.3 9.8
Current-account balance 82.3 88.6 53.8 89.7 35.5 63.1 99.3 58.7 11.1
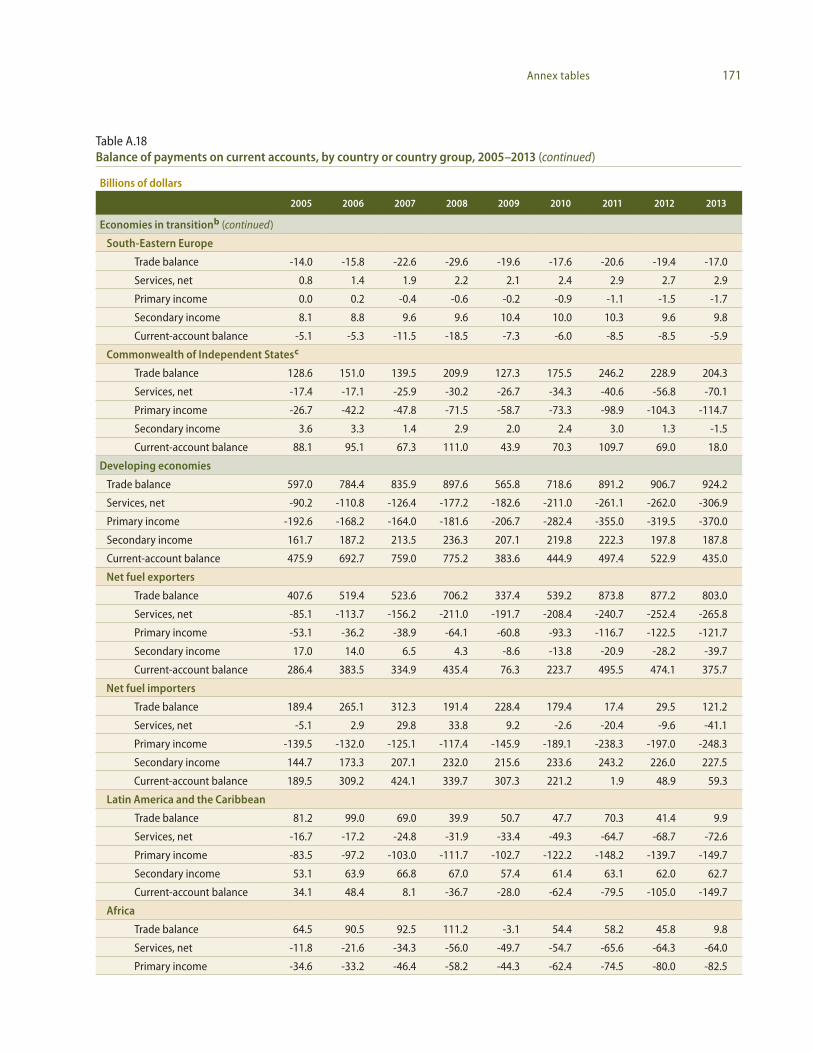
171Annex tables
Billions of dollars
2005 2006 2007 2008 2009 2010 2011 2012 2013
Economies in transitionb (continued)
South-Eastern Europe
Trade balance -14.0 -15.8 -22.6 -29.6 -19.6 -17.6 -20.6 -19.4 -17.0
Services, net 0.8 1.4 1.9 2.2 2.1 2.4 2.9 2.7 2.9
Primary income 0.0 0.2 -0.4 -0.6 -0.2 -0.9 -1.1 -1.5 -1.7
Secondary income 8.1 8.8 9.6 9.6 10.4 10.0 10.3 9.6 9.8
Current-account balance -5.1 -5.3 -11.5 -18.5 -7.3 -6.0 -8.5 -8.5 -5.9
Commonwealth of Independent Statesc
Trade balance 128.6 151.0 139.5 209.9 127.3 175.5 246.2 228.9 204.3
Services, net -17.4 -17.1 -25.9 -30.2 -26.7 -34.3 -40.6 -56.8 -70.1
Primary income -26.7 -42.2 -47.8 -71.5 -58.7 -73.3 -98.9 -104.3 -114.7
Secondary income 3.6 3.3 1.4 2.9 2.0 2.4 3.0 1.3 -1.5
Current-account balance 88.1 95.1 67.3 111.0 43.9 70.3 109.7 69.0 18.0
Developing economies
Trade balance 597.0 784.4 835.9 897.6 565.8 718.6 891.2 906.7 924.2
Services, net -90.2 -110.8 -126.4 -177.2 -182.6 -211.0 -261.1 -262.0 -306.9
Primary income -192.6 -168.2 -164.0 -181.6 -206.7 -282.4 -355.0 -319.5 -370.0
Secondary income 161.7 187.2 213.5 236.3 207.1 219.8 222.3 197.8 187.8
Current-account balance 475.9 692.7 759.0 775.2 383.6 444.9 497.4 522.9 435.0
Net fuel exporters
Trade balance 407.6 519.4 523.6 706.2 337.4 539.2 873.8 877.2 803.0
Services, net -85.1 -113.7 -156.2 -211.0 -191.7 -208.4 -240.7 -252.4 -265.8
Primary income -53.1 -36.2 -38.9 -64.1 -60.8 -93.3 -116.7 -122.5 -121.7
Secondary income 17.0 14.0 6.5 4.3 -8.6 -13.8 -20.9 -28.2 -39.7
Current-account balance 286.4 383.5 334.9 435.4 76.3 223.7 495.5 474.1 375.7
Net fuel importers
Trade balance 189.4 265.1 312.3 191.4 228.4 179.4 17.4 29.5 121.2
Services, net -5.1 2.9 29.8 33.8 9.2 -2.6 -20.4 -9.6 -41.1
Primary income -139.5 -132.0 -125.1 -117.4 -145.9 -189.1 -238.3 -197.0 -248.3
Secondary income 144.7 173.3 207.1 232.0 215.6 233.6 243.2 226.0 227.5
Current-account balance 189.5 309.2 424.1 339.7 307.3 221.2 1.9 48.9 59.3
Latin America and the Caribbean
Trade balance 81.2 99.0 69.0 39.9 50.7 47.7 70.3 41.4 9.9
Services, net -16.7 -17.2 -24.8 -31.9 -33.4 -49.3 -64.7 -68.7 -72.6
Primary income -83.5 -97.2 -103.0 -111.7 -102.7 -122.2 -148.2 -139.7 -149.7
Secondary income 53.1 63.9 66.8 67.0 57.4 61.4 63.1 62.0 62.7
Current-account balance 34.1 48.4 8.1 -36.7 -28.0 -62.4 -79.5 -105.0 -149.7
Africa
Trade balance 64.5 90.5 92.5 111.2 -3.1 54.4 58.2 45.8 9.8
Services, net -11.8 -21.6 -34.3 -56.0 -49.7 -54.7 -65.6 -64.3 -64.0
Primary income -34.6 -33.2 -46.4 -58.2 -44.3 -62.4 -74.5 -80.0 -82.5
Table A.18Balance of payments on current accounts, by country or country group, 2005–2013 (continued)
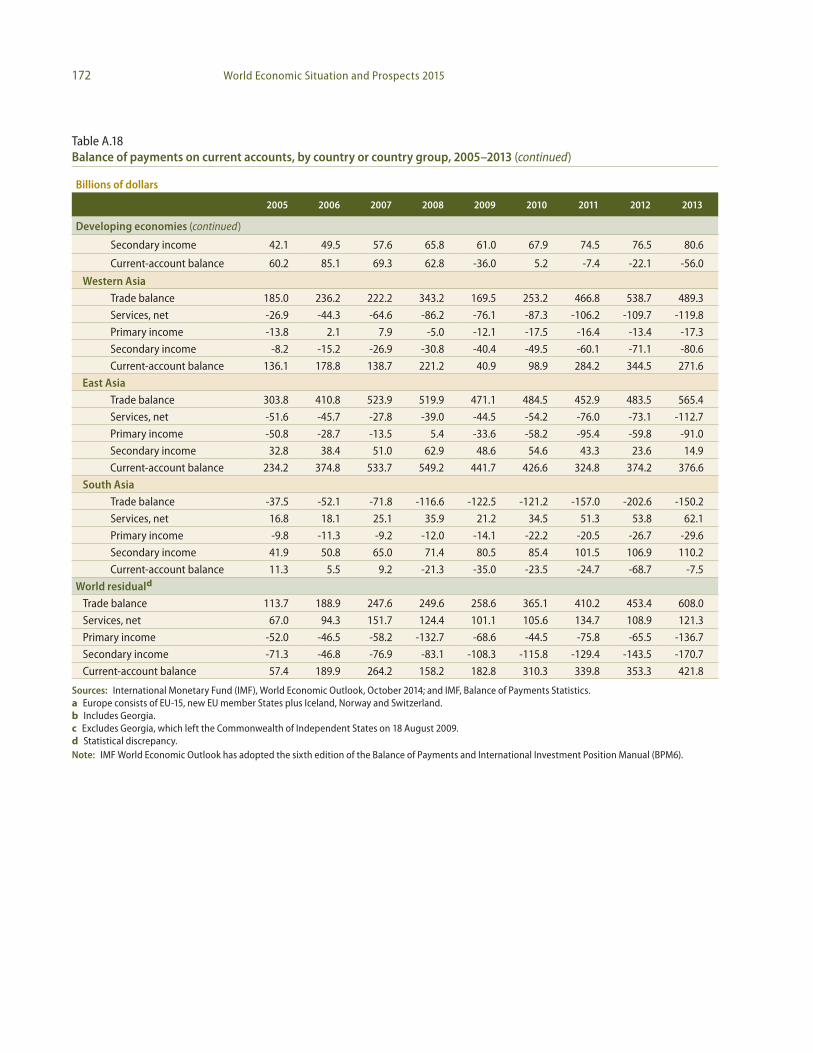
172 World Economic Situation and Prospects 2015
Billions of dollars
2005 2006 2007 2008 2009 2010 2011 2012 2013
Developing economies (continued)
Secondary income 42.1 49.5 57.6 65.8 61.0 67.9 74.5 76.5 80.6
Current-account balance 60.2 85.1 69.3 62.8 -36.0 5.2 -7.4 -22.1 -56.0
Western Asia Trade balance 185.0 236.2 222.2 343.2 169.5 253.2 466.8 538.7 489.3
Services, net -26.9 -44.3 -64.6 -86.2 -76.1 -87.3 -106.2 -109.7 -119.8
Primary income -13.8 2.1 7.9 -5.0 -12.1 -17.5 -16.4 -13.4 -17.3
Secondary income -8.2 -15.2 -26.9 -30.8 -40.4 -49.5 -60.1 -71.1 -80.6
Current-account balance 136.1 178.8 138.7 221.2 40.9 98.9 284.2 344.5 271.6
East Asia Trade balance 303.8 410.8 523.9 519.9 471.1 484.5 452.9 483.5 565.4
Services, net -51.6 -45.7 -27.8 -39.0 -44.5 -54.2 -76.0 -73.1 -112.7
Primary income -50.8 -28.7 -13.5 5.4 -33.6 -58.2 -95.4 -59.8 -91.0
Secondary income 32.8 38.4 51.0 62.9 48.6 54.6 43.3 23.6 14.9
Current-account balance 234.2 374.8 533.7 549.2 441.7 426.6 324.8 374.2 376.6
South Asia Trade balance -37.5 -52.1 -71.8 -116.6 -122.5 -121.2 -157.0 -202.6 -150.2
Services, net 16.8 18.1 25.1 35.9 21.2 34.5 51.3 53.8 62.1
Primary income -9.8 -11.3 -9.2 -12.0 -14.1 -22.2 -20.5 -26.7 -29.6
Secondary income 41.9 50.8 65.0 71.4 80.5 85.4 101.5 106.9 110.2
Current-account balance 11.3 5.5 9.2 -21.3 -35.0 -23.5 -24.7 -68.7 -7.5
World residuald
Trade balance 113.7 188.9 247.6 249.6 258.6 365.1 410.2 453.4 608.0
Services, net 67.0 94.3 151.7 124.4 101.1 105.6 134.7 108.9 121.3
Primary income -52.0 -46.5 -58.2 -132.7 -68.6 -44.5 -75.8 -65.5 -136.7
Secondary income -71.3 -46.8 -76.9 -83.1 -108.3 -115.8 -129.4 -143.5 -170.7
Current-account balance 57.4 189.9 264.2 158.2 182.8 310.3 339.8 353.3 421.8
Sources: International Monetary Fund (IMF), World Economic Outlook, October 2014; and IMF, Balance of Payments Statistics.a Europe consists of EU-15, new EU member States plus Iceland, Norway and Switzerland.b Includes Georgia.c Excludes Georgia, which left the Commonwealth of Independent States on 18 August 2009.d Statistical discrepancy.Note: IMF World Economic Outlook has adopted the sixth edition of the Balance of Payments and International Investment Position Manual (BPM6).
Table A.18Balance of payments on current accounts, by country or country group, 2005–2013 (continued)
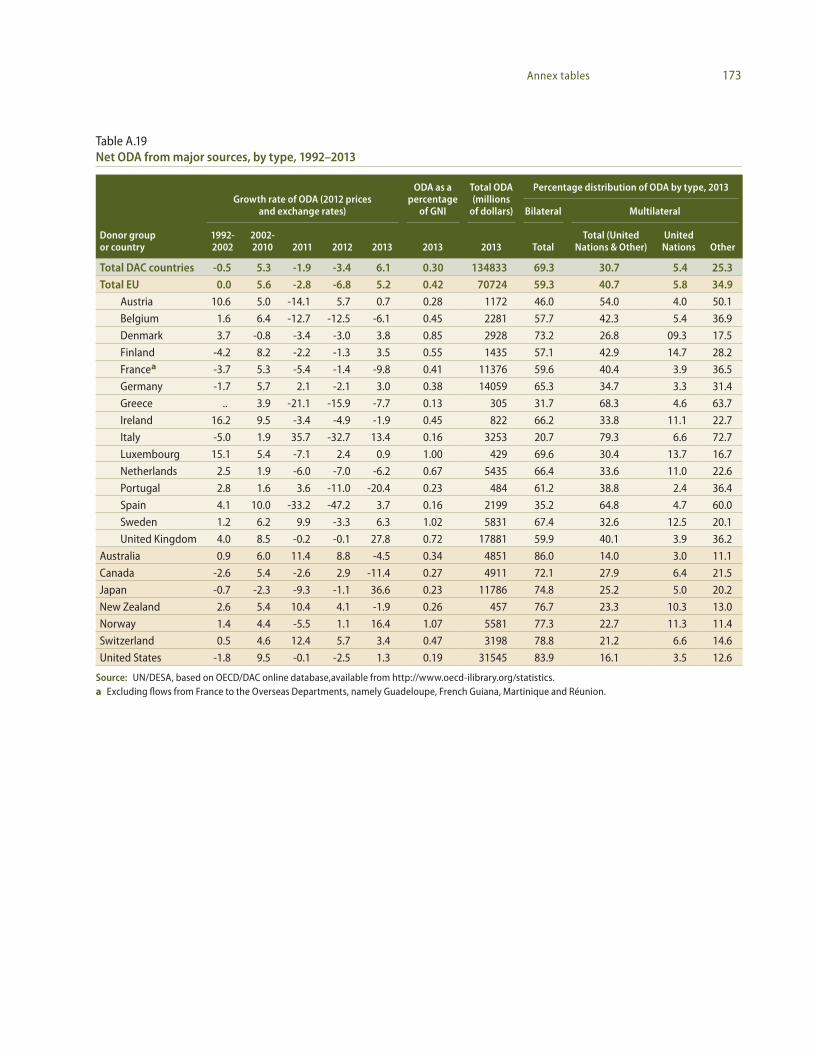
173Annex tables
Table A.19Net ODA from major sources, by type, 1992–2013
Donor group or country
Growth rate of ODA (2012 prices and exchange rates)
ODA as a percentage
of GNI
Total ODA (millions
of dollars)
Percentage distribution of ODA by type, 2013
Bilateral Multilateral
1992-2002
2002-2010 2011 2012 2013 2013 2013 Total
Total (United Nations & Other)
United Nations Other
Total DAC countries -0.5 5.3 -1.9 -3.4 6.1 0.30 134833 69.3 30.7 5.4 25.3Total EU 0.0 5.6 -2.8 -6.8 5.2 0.42 70724 59.3 40.7 5.8 34.9
Austria 10.6 5.0 -14.1 5.7 0.7 0.28 1172 46.0 54.0 4.0 50.1
Belgium 1.6 6.4 -12.7 -12.5 -6.1 0.45 2281 57.7 42.3 5.4 36.9
Denmark 3.7 -0.8 -3.4 -3.0 3.8 0.85 2928 73.2 26.8 09.3 17.5
Finland -4.2 8.2 -2.2 -1.3 3.5 0.55 1435 57.1 42.9 14.7 28.2
Francea -3.7 5.3 -5.4 -1.4 -9.8 0.41 11376 59.6 40.4 3.9 36.5
Germany -1.7 5.7 2.1 -2.1 3.0 0.38 14059 65.3 34.7 3.3 31.4
Greece .. 3.9 -21.1 -15.9 -7.7 0.13 305 31.7 68.3 4.6 63.7
Ireland 16.2 9.5 -3.4 -4.9 -1.9 0.45 822 66.2 33.8 11.1 22.7
Italy -5.0 1.9 35.7 -32.7 13.4 0.16 3253 20.7 79.3 6.6 72.7
Luxembourg 15.1 5.4 -7.1 2.4 0.9 1.00 429 69.6 30.4 13.7 16.7
Netherlands 2.5 1.9 -6.0 -7.0 -6.2 0.67 5435 66.4 33.6 11.0 22.6
Portugal 2.8 1.6 3.6 -11.0 -20.4 0.23 484 61.2 38.8 2.4 36.4
Spain 4.1 10.0 -33.2 -47.2 3.7 0.16 2199 35.2 64.8 4.7 60.0
Sweden 1.2 6.2 9.9 -3.3 6.3 1.02 5831 67.4 32.6 12.5 20.1
United Kingdom 4.0 8.5 -0.2 -0.1 27.8 0.72 17881 59.9 40.1 3.9 36.2
Australia 0.9 6.0 11.4 8.8 -4.5 0.34 4851 86.0 14.0 3.0 11.1
Canada -2.6 5.4 -2.6 2.9 -11.4 0.27 4911 72.1 27.9 6.4 21.5
Japan -0.7 -2.3 -9.3 -1.1 36.6 0.23 11786 74.8 25.2 5.0 20.2
New Zealand 2.6 5.4 10.4 4.1 -1.9 0.26 457 76.7 23.3 10.3 13.0
Norway 1.4 4.4 -5.5 1.1 16.4 1.07 5581 77.3 22.7 11.3 11.4
Switzerland 0.5 4.6 12.4 5.7 3.4 0.47 3198 78.8 21.2 6.6 14.6
United States -1.8 9.5 -0.1 -2.5 1.3 0.19 31545 83.9 16.1 3.5 12.6
Source: UN/DESA, based on OECD/DAC online database,available from http://www.oecd-ilibrary.org/statistics.a Excluding flows from France to the Overseas Departments, namely Guadeloupe, French Guiana, Martinique and Réunion.
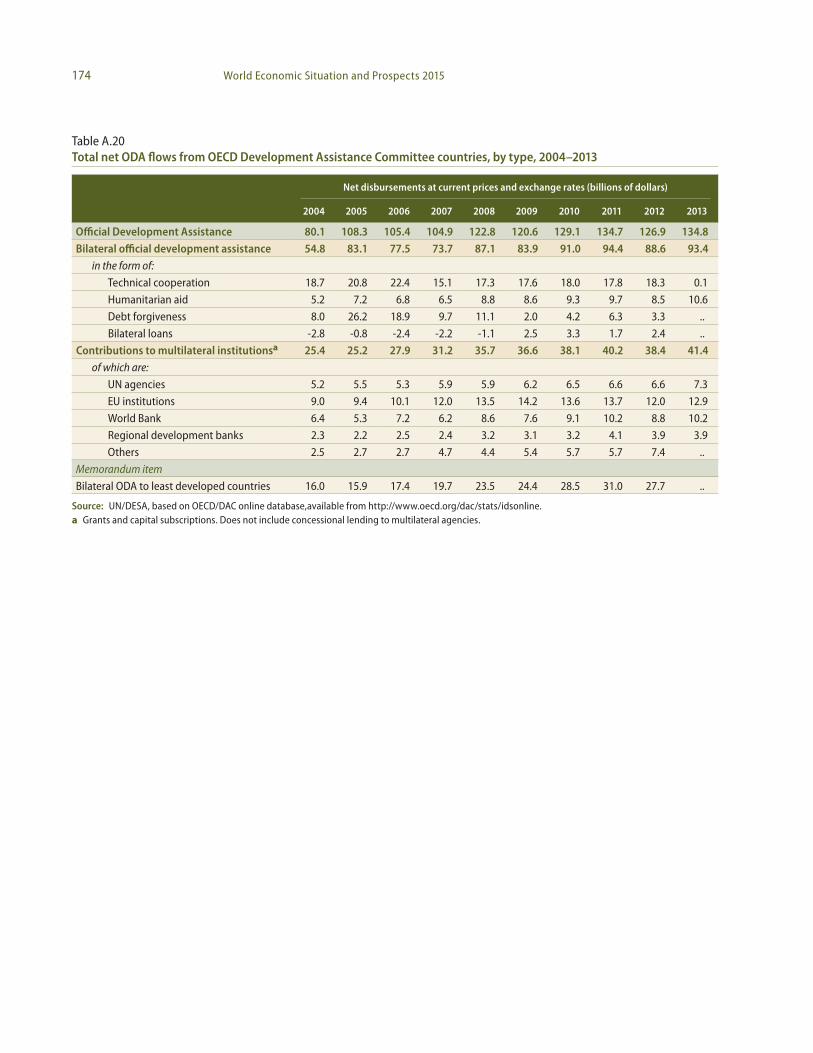
174 World Economic Situation and Prospects 2015
Table A.20Total net ODA flows from OECD Development Assistance Committee countries, by type, 2004–2013
Net disbursements at current prices and exchange rates (billions of dollars)
2004 2005 2006 2007 2008 2009 2010 2011 2012 2013
Official Development Assistance 80.1 108.3 105.4 104.9 122.8 120.6 129.1 134.7 126.9 134.8Bilateral official development assistance 54.8 83.1 77.5 73.7 87.1 83.9 91.0 94.4 88.6 93.4
in the form of:
Technical cooperation 18.7 20.8 22.4 15.1 17.3 17.6 18.0 17.8 18.3 0.1
Humanitarian aid 5.2 7.2 6.8 6.5 8.8 8.6 9.3 9.7 8.5 10.6
Debt forgiveness 8.0 26.2 18.9 9.7 11.1 2.0 4.2 6.3 3.3 ..
Bilateral loans -2.8 -0.8 -2.4 -2.2 -1.1 2.5 3.3 1.7 2.4 ..
Contributions to multilateral institutionsa 25.4 25.2 27.9 31.2 35.7 36.6 38.1 40.2 38.4 41.4of which are:
UN agencies 5.2 5.5 5.3 5.9 5.9 6.2 6.5 6.6 6.6 7.3
EU institutions 9.0 9.4 10.1 12.0 13.5 14.2 13.6 13.7 12.0 12.9
World Bank 6.4 5.3 7.2 6.2 8.6 7.6 9.1 10.2 8.8 10.2
Regional development banks 2.3 2.2 2.5 2.4 3.2 3.1 3.2 4.1 3.9 3.9
Others 2.5 2.7 2.7 4.7 4.4 5.4 5.7 5.7 7.4 ..
Memorandum item
Bilateral ODA to least developed countries 16.0 15.9 17.4 19.7 23.5 24.4 28.5 31.0 27.7 ..
Source: UN/DESA, based on OECD/DAC online database,available from http://www.oecd.org/dac/stats/idsonline. a Grants and capital subscriptions. Does not include concessional lending to multilateral agencies.
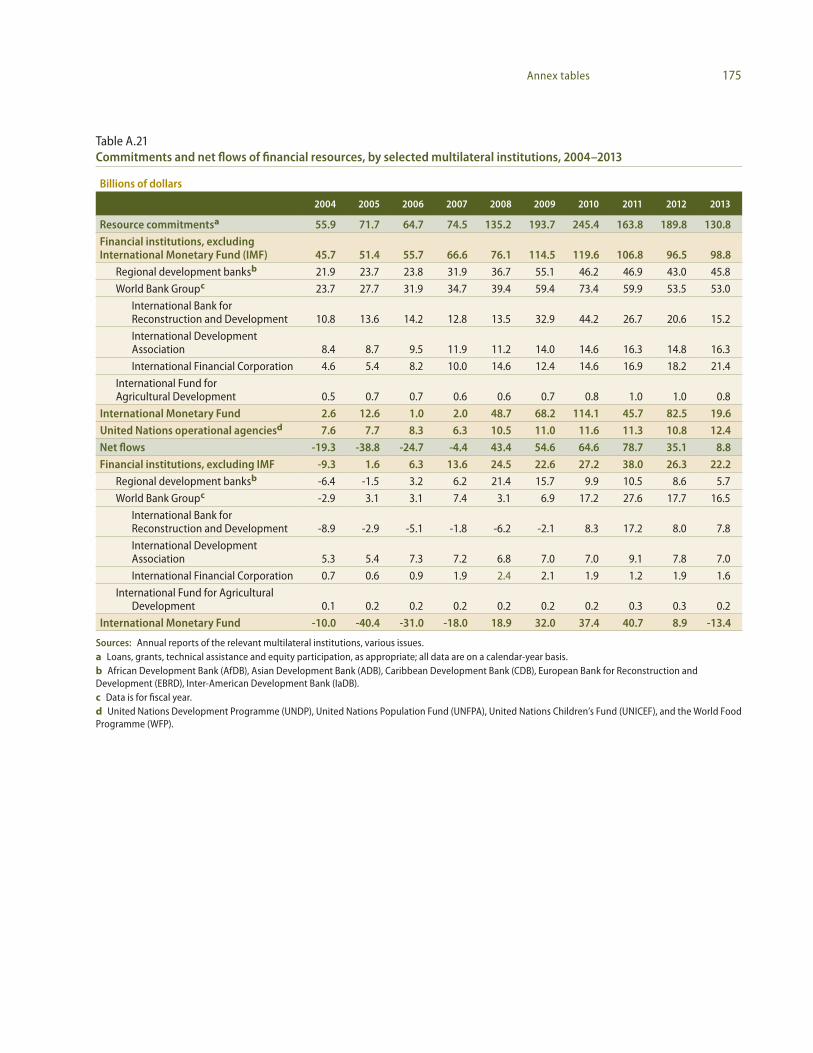
175Annex tables
Table A.21Commitments and net flows of financial resources, by selected multilateral institutions, 2004–2013
Billions of dollars
2004 2005 2006 2007 2008 2009 2010 2011 2012 2013
Resource commitmentsa 55.9 71.7 64.7 74.5 135.2 193.7 245.4 163.8 189.8 130.8Financial institutions, excluding International Monetary Fund (IMF) 45.7 51.4 55.7 66.6 76.1 114.5 119.6 106.8 96.5 98.8
Regional development banksb 21.9 23.7 23.8 31.9 36.7 55.1 46.2 46.9 43.0 45.8
World Bank Groupc 23.7 27.7 31.9 34.7 39.4 59.4 73.4 59.9 53.5 53.0
International Bank for Reconstruction and Development 10.8 13.6 14.2 12.8 13.5 32.9 44.2 26.7 20.6 15.2
International Development Association 8.4 8.7 9.5 11.9 11.2 14.0 14.6 16.3 14.8 16.3
International Financial Corporation 4.6 5.4 8.2 10.0 14.6 12.4 14.6 16.9 18.2 21.4
International Fund for Agricultural Development 0.5 0.7 0.7 0.6 0.6 0.7 0.8 1.0 1.0 0.8
International Monetary Fund 2.6 12.6 1.0 2.0 48.7 68.2 114.1 45.7 82.5 19.6United Nations operational agenciesd 7.6 7.7 8.3 6.3 10.5 11.0 11.6 11.3 10.8 12.4Net flows -19.3 -38.8 -24.7 -4.4 43.4 54.6 64.6 78.7 35.1 8.8Financial institutions, excluding IMF -9.3 1.6 6.3 13.6 24.5 22.6 27.2 38.0 26.3 22.2
Regional development banksb -6.4 -1.5 3.2 6.2 21.4 15.7 9.9 10.5 8.6 5.7
World Bank Groupc -2.9 3.1 3.1 7.4 3.1 6.9 17.2 27.6 17.7 16.5
International Bank for Reconstruction and Development -8.9 -2.9 -5.1 -1.8 -6.2 -2.1 8.3 17.2 8.0 7.8
International Development Association 5.3 5.4 7.3 7.2 6.8 7.0 7.0 9.1 7.8 7.0
International Financial Corporation 0.7 0.6 0.9 1.9 2.4 2.1 1.9 1.2 1.9 1.6
International Fund for Agricultural Development 0.1 0.2 0.2 0.2 0.2 0.2 0.2 0.3 0.3 0.2
International Monetary Fund -10.0 -40.4 -31.0 -18.0 18.9 32.0 37.4 40.7 8.9 -13.4
Sources: Annual reports of the relevant multilateral institutions, various issues.a Loans, grants, technical assistance and equity participation, as appropriate; all data are on a calendar-year basis.b African Development Bank (AfDB), Asian Development Bank (ADB), Caribbean Development Bank (CDB), European Bank for Reconstruction and Development (EBRD), Inter-American Development Bank (IaDB).c Data is for fiscal year.d United Nations Development Programme (UNDP), United Nations Population Fund (UNFPA), United Nations Children’s Fund (UNICEF), and the World Food Programme (WFP).