Embed Size (px)
Citation preview
World Economic World Economic Situation and Situation and
Prospects 2004Prospects 2004
United Nations

CONTENTS
Chapter Page
EXECUTIVE SUMMARY . . . . . . . . . . . . . . . . . . . . . . . . . . . . . . . . . . . . . . . . . . . . . . . . . . . . . . . . . . . . . . . . . . . . . . . . . . .1
I. GLOBAL OUTLOOK . . . . . . . . . . . . . . . . . . . . . . . . . . . . . . . . . . . . . . . . . . . . . . . . . . . . . . . . . . . . . . . . . . . . . . . . . . . . . . .3Improved global economic prospects . . . . . . . . . . . . . . . . . . . . . . . . . . . . . . . . . . . . . . . . . . . . . . . . . . . . . . . . . . . . . . . . . . .3
Overcoming the shocks . . . . . . . . . . . . . . . . . . . . . . . . . . . . . . . . . . . . . . . . . . . . . . . . . . . . . . . . . . . . . . . . . . . . . . . . . .3Recovery broadening across countries . . . . . . . . . . . . . . . . . . . . . . . . . . . . . . . . . . . . . . . . . . . . . . . . . . . . . . . . . . . . . .4Benign inflation and lagging employment growth . . . . . . . . . . . . . . . . . . . . . . . . . . . . . . . . . . . . . . . . . . . . . . . . . . . . .6
Addressing the global imbalances . . . . . . . . . . . . . . . . . . . . . . . . . . . . . . . . . . . . . . . . . . . . . . . . . . . . . . . . . . . . . . . . . . . . .7Reasons for the imbalances . . . . . . . . . . . . . . . . . . . . . . . . . . . . . . . . . . . . . . . . . . . . . . . . . . . . . . . . . . . . . . . . . . . . . . .7Correcting the imbalances . . . . . . . . . . . . . . . . . . . . . . . . . . . . . . . . . . . . . . . . . . . . . . . . . . . . . . . . . . . . . . . . . . . . . . . .8
Uncertainties and risks . . . . . . . . . . . . . . . . . . . . . . . . . . . . . . . . . . . . . . . . . . . . . . . . . . . . . . . . . . . . . . . . . . . . . . . . . . . . .10Current policy challenges . . . . . . . . . . . . . . . . . . . . . . . . . . . . . . . . . . . . . . . . . . . . . . . . . . . . . . . . . . . . . . . . . . . . . . . . . . .10
Managing the shift in macroeconomic policies . . . . . . . . . . . . . . . . . . . . . . . . . . . . . . . . . . . . . . . . . . . . . . . . . . . . . . .11Deciding exchange-rate policy in developing countries . . . . . . . . . . . . . . . . . . . . . . . . . . . . . . . . . . . . . . . . . . . . . . . .12Improving global development prospects . . . . . . . . . . . . . . . . . . . . . . . . . . . . . . . . . . . . . . . . . . . . . . . . . . . . . . . . . . .13
II. INTERNATIONAL TRADE AND FINANCE . . . . . . . . . . . . . . . . . . . . . . . . . . . . . . . . . . . . . . . . . . . . . . . . . . . . . . . . . . .15International trade recovers . . . . . . . . . . . . . . . . . . . . . . . . . . . . . . . . . . . . . . . . . . . . . . . . . . . . . . . . . . . . . . . . . . . . . . . . .15Commodity price recovery led by raw materials . . . . . . . . . . . . . . . . . . . . . . . . . . . . . . . . . . . . . . . . . . . . . . . . . . . . . . . . .19
Agricultural commodities . . . . . . . . . . . . . . . . . . . . . . . . . . . . . . . . . . . . . . . . . . . . . . . . . . . . . . . . . . . . . . . . . . . . . . . .21Minerals, ores and metals . . . . . . . . . . . . . . . . . . . . . . . . . . . . . . . . . . . . . . . . . . . . . . . . . . . . . . . . . . . . . . . . . . . . . . .22World oil market: increased volatility and uncertainty . . . . . . . . . . . . . . . . . . . . . . . . . . . . . . . . . . . . . . . . . . . . . . . . .23
Key trade policy developments . . . . . . . . . . . . . . . . . . . . . . . . . . . . . . . . . . . . . . . . . . . . . . . . . . . . . . . . . . . . . . . . . . . . . .24Slow progress in World Trade Organization (WTO) negotiations . . . . . . . . . . . . . . . . . . . . . . . . . . . . . . . . . . . . . . . . .24Regional and bilateral trade agreements . . . . . . . . . . . . . . . . . . . . . . . . . . . . . . . . . . . . . . . . . . . . . . . . . . . . . . . . . . .26Trade disputes . . . . . . . . . . . . . . . . . . . . . . . . . . . . . . . . . . . . . . . . . . . . . . . . . . . . . . . . . . . . . . . . . . . . . . . . . . . . . . . .29Security-related measures affecting trade . . . . . . . . . . . . . . . . . . . . . . . . . . . . . . . . . . . . . . . . . . . . . . . . . . . . . . . . . .29
Financial flows to developing and transition economies . . . . . . . . . . . . . . . . . . . . . . . . . . . . . . . . . . . . . . . . . . . . . . . . . .29Private financial flows . . . . . . . . . . . . . . . . . . . . . . . . . . . . . . . . . . . . . . . . . . . . . . . . . . . . . . . . . . . . . . . . . . . . . . . . . .29Official flows . . . . . . . . . . . . . . . . . . . . . . . . . . . . . . . . . . . . . . . . . . . . . . . . . . . . . . . . . . . . . . . . . . . . . . . . . . . . . . . . .31Net transfer of resources . . . . . . . . . . . . . . . . . . . . . . . . . . . . . . . . . . . . . . . . . . . . . . . . . . . . . . . . . . . . . . . . . . . . . . . .32
Foreign direct investment: global flows bottom out . . . . . . . . . . . . . . . . . . . . . . . . . . . . . . . . . . . . . . . . . . . . . . . . . . . . . .32Inflows by region . . . . . . . . . . . . . . . . . . . . . . . . . . . . . . . . . . . . . . . . . . . . . . . . . . . . . . . . . . . . . . . . . . . . . . . . . . . . . .32Long-term sectoral changes in foreign direct investment . . . . . . . . . . . . . . . . . . . . . . . . . . . . . . . . . . . . . . . . . . . . . . .35Policy responses . . . . . . . . . . . . . . . . . . . . . . . . . . . . . . . . . . . . . . . . . . . . . . . . . . . . . . . . . . . . . . . . . . . . . . . . . . . . . . .36
International financial cooperation . . . . . . . . . . . . . . . . . . . . . . . . . . . . . . . . . . . . . . . . . . . . . . . . . . . . . . . . . . . . . . . . . . .37Official development assistance . . . . . . . . . . . . . . . . . . . . . . . . . . . . . . . . . . . . . . . . . . . . . . . . . . . . . . . . . . . . . . . . . .37Official development cooperation . . . . . . . . . . . . . . . . . . . . . . . . . . . . . . . . . . . . . . . . . . . . . . . . . . . . . . . . . . . . . . . . .37Heavily Indebted Poor Countries (HIPC) Initiative . . . . . . . . . . . . . . . . . . . . . . . . . . . . . . . . . . . . . . . . . . . . . . . . . . . . .37
W O R L D E C O N O M I C S I T U A T I O N A N D P R O S P E C T S 2 0 0 4 iii
CONTENTS
Chapter Page
Surveillance and international standards and codes . . . . . . . . . . . . . . . . . . . . . . . . . . . . . . . . . . . . . . . . . . . . . . . . . .38Crises prevention and resolution . . . . . . . . . . . . . . . . . . . . . . . . . . . . . . . . . . . . . . . . . . . . . . . . . . . . . . . . . . . . . . . . . .39Global financial governance . . . . . . . . . . . . . . . . . . . . . . . . . . . . . . . . . . . . . . . . . . . . . . . . . . . . . . . . . . . . . . . . . . . . . .41
III. REGIONAL DEVELOPMENTS AND OUTLOOK . . . . . . . . . . . . . . . . . . . . . . . . . . . . . . . . . . . . . . . . . . . . . . . . . . . . . . . .43Developed economies . . . . . . . . . . . . . . . . . . . . . . . . . . . . . . . . . . . . . . . . . . . . . . . . . . . . . . . . . . . . . . . . . . . . . . . . . . . . .43
North America: a solidifying recovery . . . . . . . . . . . . . . . . . . . . . . . . . . . . . . . . . . . . . . . . . . . . . . . . . . . . . . . . . . . . . .44Developed Asia and Pacific: is this recovery sustainable for Japan? . . . . . . . . . . . . . . . . . . . . . . . . . . . . . . . . . . . . .45Western Europe: is a recovery finally at hand? . . . . . . . . . . . . . . . . . . . . . . . . . . . . . . . . . . . . . . . . . . . . . . . . . . . . . . .47
Economies in transition . . . . . . . . . . . . . . . . . . . . . . . . . . . . . . . . . . . . . . . . . . . . . . . . . . . . . . . . . . . . . . . . . . . . . . . . . . . .48Central and Eastern Europe: a modest recovery . . . . . . . . . . . . . . . . . . . . . . . . . . . . . . . . . . . . . . . . . . . . . . . . . . . . . .48Commonwealth of Independent States: sustaining fast growth . . . . . . . . . . . . . . . . . . . . . . . . . . . . . . . . . . . . . . . . . .50Baltic countries: fastest growing region . . . . . . . . . . . . . . . . . . . . . . . . . . . . . . . . . . . . . . . . . . . . . . . . . . . . . . . . . . . .51
Developing economies . . . . . . . . . . . . . . . . . . . . . . . . . . . . . . . . . . . . . . . . . . . . . . . . . . . . . . . . . . . . . . . . . . . . . . . . . . . . .52Africa: a favourable outlook . . . . . . . . . . . . . . . . . . . . . . . . . . . . . . . . . . . . . . . . . . . . . . . . . . . . . . . . . . . . . . . . . . . . . .52East Asia and China: strong recovery interrupted . . . . . . . . . . . . . . . . . . . . . . . . . . . . . . . . . . . . . . . . . . . . . . . . . . . . .53South Asia: sustaining growth amidst fiscal imbalances . . . . . . . . . . . . . . . . . . . . . . . . . . . . . . . . . . . . . . . . . . . . . . .55Western Asia: mixed growth prospects . . . . . . . . . . . . . . . . . . . . . . . . . . . . . . . . . . . . . . . . . . . . . . . . . . . . . . . . . . . . .55Latin America and the Caribbean: better conditions for growth in 2004 . . . . . . . . . . . . . . . . . . . . . . . . . . . . . . . . . . .57
BOXES
I.1. Exchange-rate changes and trade imbalances . . . . . . . . . . . . . . . . . . . . . . . . . . . . . . . . . . . . . . . . . . . . . . . . . . . . . . . . . . .9II.1. Development benchmarks . . . . . . . . . . . . . . . . . . . . . . . . . . . . . . . . . . . . . . . . . . . . . . . . . . . . . . . . . . . . . . . . . . . . . . . . . .27II.2. Paris Club reforms its approach to sovereign debt relief . . . . . . . . . . . . . . . . . . . . . . . . . . . . . . . . . . . . . . . . . . . . . . . . . .40
FIGURES
I.1. United States dollar exchange rates: January 2000-January 2004 . . . . . . . . . . . . . . . . . . . . . . . . . . . . . . . . . . . . . . . . . .11II.1 Euro area, Japan and USA: merchandise trade balance, 2002-2004 . . . . . . . . . . . . . . . . . . . . . . . . . . . . . . . . . . . . . . . . .15II.2. Selected economies: indices of industrial production, January 2002-September 2003 . . . . . . . . . . . . . . . . . . . . . . . . . .16II.3. China: foreign direct investment inflows, exports and imports, 1990-2002 . . . . . . . . . . . . . . . . . . . . . . . . . . . . . . . . . . . .18II.4. Prices of primary commodities and manufactures, 1999-2003 . . . . . . . . . . . . . . . . . . . . . . . . . . . . . . . . . . . . . . . . . . . . . .20II.5. World oil supply and demand and oil prices, first quarter 2002-third quarter 2003 . . . . . . . . . . . . . . . . . . . . . . . . . . . . .23II.6. Yield spreads on emerging market bonds, 1 September 2002-1 December 2003 . . . . . . . . . . . . . . . . . . . . . . . . . . . . . . .31
III.1. Selected developed countries economies: rates of real GDP growth, first quarter 2002-third quarter 2003 . . . . . . . . . .43III.2. Economies in transition: growth of real GDP, 2000-2004 . . . . . . . . . . . . . . . . . . . . . . . . . . . . . . . . . . . . . . . . . . . . . . . . . .49III.3. Africa: rates of growth of real GDP, 2002-2004 . . . . . . . . . . . . . . . . . . . . . . . . . . . . . . . . . . . . . . . . . . . . . . . . . . . . . . . . . .52III.4. Selected South Asian economies: overall deficit of central government, 2002-2004 . . . . . . . . . . . . . . . . . . . . . . . . . . . .56
W O R L D E C O N O M I C S I T U A T I O N A N D P R O S P E C T S 2 0 0 4iv
CONTENTS
Page
III.5. Selected Western Asian countries: crude oil production, January 2002-November 2003 . . . . . . . . . . . . . . . . . . . . . . . . .57III.6. Selected Latin American countries: unemployment rates, January 2002-October 2003 . . . . . . . . . . . . . . . . . . . . . . . . . .58
TABLES
I.1. Growth of world output and trade, 1994-2004 . . . . . . . . . . . . . . . . . . . . . . . . . . . . . . . . . . . . . . . . . . . . . . . . . . . . . . . . . . .4I.2. Frequency of high and low growth of per capita output, 2001-2003 . . . . . . . . . . . . . . . . . . . . . . . . . . . . . . . . . . . . . . . . . .6II.1. Exports to China by selected Asian countries, 1998-second quarter 2003 . . . . . . . . . . . . . . . . . . . . . . . . . . . . . . . . . . . . .18II.2. Net financial flows to developing economies and economies in transition, 1992-2003 . . . . . . . . . . . . . . . . . . . . . . . . . .30II.3. Inflows of foreign direct investment, by country, 2001-2003 . . . . . . . . . . . . . . . . . . . . . . . . . . . . . . . . . . . . . . . . . . . . . . .33II.4. Changes in national regulations relating to foreign direct investment, 2000-2002 . . . . . . . . . . . . . . . . . . . . . . . . . . . . . .36
ANNEX TABLES . . . . . . . . . . . . . . . . . . . . . . . . . . . . . . . . . . . . . . . . . . . . . . . . . . . . . . . . . . . . . . . . . . . . . . . . . . . . . . . . . . .61
W O R L D E C O N O M I C S I T U A T I O N A N D P R O S P E C T S 2 0 0 4 v
The following symbols and conventions have been used inthe tables throughout the report
.. Two dots indicate that data are not available or are notseparately reported.
– A dash indicates that the amount is nil or negligible.
- A hyphen indicates that the item is not applicable.
- A minus sign indicates deficit or decrease, except as indicated.
. A full stop is used to indicate decimals.
/ A slash between years indicates a crop year or financial year, for example, 1990/91.
- Use of a hyphen between years, for example, 1990-1991,signifies the full period involved, including the beginning and end years.
Reference to "dollars" ($) means United States dollars, unless otherwise stated.
Annual rates of growth or change, unless otherwise stated, refer to annual compound rates.
In most cases, the growth rate forecasts for 2004 are rounded to the nearest quarter of a percentage point.
Details and percentages in tables do not necessarily add tototals, because of rounding.
The following abbreviations have been used:
ACP African, Caribbean and Pacific (Group of) States
AGOA African Growth and Opportunity Act
AML/CFT anti-money-laundering efforts and efforts to combat financing of terrorism
ASEAN Association of Southeast Asian Nations
AU African Union
BCBS Basel Committee on Banking Supervision
BITs bilateral investment treaties
bpd barrels per day
bps basis points
BTAs bilateral trade agreements
CAC collective action clause
CACM Central American Common Market
CAP Common Agricultural Policy (EU)
CARICOM Caribbean Community
CCL Contingent Credit Line
CEE Central and Eastern Europe
CEFTA Central European Free Trade Agreement
CEMAC Communauté Economique et Monétaire de l'Afrique Centrale
CIS Commonwealth of Independent States
COMESA Common Market of Eastern and Southern Africa
CPI consumer price index
CTD Committee on Trade and Development (WTO)
DAC Development Assistance Committee (of OECD)
DTTs double taxation treaties
DWP Doha Work Programme
ECB European Central Bank
ECCAS Economic Community of Central African States
ECE Economic Commission for Europe
EMU European Monetary Union
ERM Exchange Rate Mechanism
EU European Union
FAO Food and Agriculture Organization of the United Nations
FATF Financial Action Task Force (Bretton Woods institutions)
FDI foreign direct investment
Fed United States Federal Reserve
FSF Financial Stability Forum
FTA free trade agreement
FTAA Free Trade Area of the Americas
GATT General Agreement on Tariffs and Trade
GDP gross domestic product
GI geographical indicators
GMOs genetically modified organisms
GNP gross national product
GSP Generalized System of Preferences
W O R L D E C O N O M I C S I T U A T I O N A N D P R O S P E C T S 2 0 0 4vi
EXPLANATORY NOTES
GSTP Global System of Trade Preferences among Developing Countries
GWP gross world product
HICP Harmonised Index of Consumer Prices
HIPC heavily indebted poor countries
ICCO International Cocoa Organization
ICT information and communication technologies
IFAC International Federation of Accountants
IMF International Monetary Fund
IMFC International Monetary and Financial Committee
LCP local currency pricing
LDCs least developed countries
LME London Market Exchange
M&As mergers and acquisitions
mbd million barrels per day
MCA Millennium Challenge Account
MDGs Millennium Development Goals
MERCOSUR Mercado Común del Sur (Southern Common Market)
NAFTA North American Free Trade Agreement
NAMA non-agricultural market access
NEPAD New Partnership for Africa's Development
NIEs newly industrialized economies
NPLs non-performing loans
NPV net present value
NYBOT New York Board of Trade
ODA official development assistance
OECD Organisation for Economic Cooperation and Development
OPEC Organization of the Petroleum Exporting Countries
pb per barrel
PPP purchasing power parity
PRGF Poverty Reduction Growth Facility (IMF)
Project LINK international econometric modelling group, coordinated jointly by the Development Policy Analysis Division of the United Nations Secretariat and the University of Toronto
PRSPs Poverty Reduction Strategy Papers
PTM pricing-to-market
ROSCs Reports on the Observance of Standards and Codes (Bretton Woods institutions)
RTAs regional trade arrangements
SADC Southern African Development Community
SARS severe acute respiratory syndrome
SDRs special drawing rights (IMF)
SDRM Sovereign Debt Restructuring Mechanism
SDT special and differential treatment
SGP Stability and Growth Pact
SRF Supplemental Reserve Facility
TDB Trade and Development Board (UNCTAD)
TIFAs Trade and Investment Framework Agreements
TNCs transnational corporations
TRIPS trade-related intellectual property rights
UEMOA Union Economique et Monétaire Ouest Afrique
UN/DESA Department of Economic and Social Affairs of the United Nations Secretariat
UNCTAD United Nations Conference on Trade and Development
VAT value added tax
WTO World Trade Organization
W O R L D E C O N O M I C S I T U A T I O N A N D P R O S P E C T S 2 0 0 4 vii

After growth of less than 2 per cent for over twoyears, the world economy is gaining momentum.Following the setbacks caused by the prospects of war inIraq and the outbreak of severe acute respiratory syn-drome (SARS) early in 2003, economic growth in anincreasing number of countries shifted to a measurablyhigher gear in the second half of the year, raising thegrowth of gross world product (GWP) for 2003 as awhole to 2.5 per cent. Despite some lingering uncertain-ties and downside risks, the economic recovery isexpected to strengthen and broaden further, raising glob-al economic growth to 3½ per cent in 2004. The growthof world trade is expected to reach 7½ per cent in 2004,up from 4.7 per cent in 2003. The improved performanceand outlook does not, however, compensate for the sub-dued growth of the previous two years when world percapita output failed to increase.
The global economic recovery is being driven mainlyby the United States, but increasing contributions from anumber of other economies are becoming evident.Particularly notable is the rapidly rising weight of Chinain the world economy and its role in the present recovery.East Asia has maintained its strength, accompanied by aturnaround in Japan that has been stronger than anticipat-ed. In 2003, some of the economic difficulties facing anumber of Latin American countries diminished, whilethe short-term prospects for Africa also improved. Afterthe setbacks associated with their transformation, theeconomies in transition have achieved sound growth for anumber of consecutive years despite the slowdown else-where. In contrast, Western Europe has been a source ofthe weakness that began to dissipate only in late 2003.
The recovery is being accompanied and supported by adegree of improvement in international trade and finance.World trade grew by 4.75 per cent in 2003, with much ofthe increase attributable to import demand from develop-ing countries, and is forecast to grow 7½ per cent in 2004.The international prices of non-fuel commodities havebeen rising as the demand for minerals and metals and, to
a lesser extent, agricultural raw materials strengthens, buta large part of the increase is accounted for by the depre-ciation of the dollar. Further increases in non-fuel com-modity prices are expected in 2004, but the price of oil isexpected to ease.
At almost $82 billion, net private capital flows todeveloping countries were about 50 per cent higher in2003 than in 2002, but mostly as a result of lower repay-ments and other outflows. Foreign direct investment (FDI)and official loans and grants were the only net sources ofcapital inflow for these countries. FDI, both globally andto developing countries, was almost unchanged from2002, and in both cases was well below the peak it reachedin 2000. Official development assistance (ODA) increasedin 2002 but data are not yet available for 2003. Taking intoaccount developing countries’ accumulation of reservesand their net outflows of dividends, interest and otherpayments on capital, there was a net transfer of financialresources from the developing countries of almost $190billion in 2002. This is estimated to have remained large-ly unchanged in 2003.
The strength of the current recovery is still heavilydependent on the policy stimuli of low interest rates andexpansionary fiscal measures. While the required mix ofsuch policies varies across countries, continued stimulusremains crucial for nurturing the recovery becauseautonomous effective demand remains below potential inmany economies. The challenge for policymakers in theshort run, particularly in the developed countries, is tostrike a balance between two possible outcomes: eitherchoking off the recovery through a premature withdrawalof stimuli or sowing the seeds of economic overheatingthrough a precipitate tightening of policy.
An overriding weakness in the world economy is thelarge international imbalances, manifested in the largeexternal deficit of the United States and a matchingaggregate of surpluses in a few other economies. Theseglobal imbalances reflect not only a substantial disequi-librium in international trade and capital flows, but also
E X E C U T I V E S U M M A R Y 1
EXECUTIVE SUMMARY
cross-country disparities in long-run growth and in eco-nomic structures. They will, therefore, not automaticallybe corrected by the global recovery; to the contrary, theimbalances are expected to widen further in 2004.
Alone, the ongoing realignment of exchange rates isunlikely to be either an efficient or an effective means ofremoving the imbalances; neither is international protec-tionism an appropriate response to the problem. Apreferable adjustment process would be gradual andwould involve policies in both surplus and deficiteconomies to narrow structural differentials in growthrates among major countries as well as international
cooperation that would facilitate an increase in growthand income in developing countries. The goal should beto ensure that global growth is sustained and less unsta-ble and that the benefits of growth are more equallyshared among all nations and peoples. In addition to pur-suing domestic policies to these ends, policy makersworldwide should expedite the reforms of the interna-tional trading and financial systems, proceeding expedi-tiously with the multilateral trade negotiations agreed atDoha and enhancing the capacities for crisis resolutionand counter-cyclical policies at both the internationaland national levels.
W O R L D E C O N O M I C S I T U A T I O N A N D P R O S P E C T S 2 0 0 42
IMPROVED GLOBAL ECONOMIC PROSPECTS
Overcoming the shocks
The world economy experienced two different phases in2003: a ubiquitously fragile situation in the first half ofthe year and a stronger-than-expected upturn in the sec-ond half.
In the first quarter of 2003, when the world economy wasovershadowed by the geopolitical uncertainties associatedwith the war in Iraq and by the outbreak of severe acute res-piratory syndrome (SARS), analysts broadly had two com-peting views about the prospects for the world economy.
A pessimistic view was that the anaemic world econo-my was primarily a consequence of several fundamentalweaknesses. These weaknesses included the large and per-sistent external imbalances across countries, particularlythe continuously expanding current-account deficit of theUnited States; the severe and perennial structural prob-lems in some countries, epitomized by the situation inJapan; the policy rigidities and constraints in a number ofeconomies, such as in the euro area and in some LatinAmerican countries; and the pervasive overcapacity inglobal manufacturing, especially in the information andcommunication technologies (ICT) sector. According tothis view, the exogenous shocks of the possibility of warin Iraq and SARS only exacerbated these underlying glob-al weaknesses; the world economy was therefore unlikelyto achieve a meaningful recovery in 2003-2004, even ifthese shocks faded. Two aborted recoveries in 2001-2002were cited as evidence for such a gloomy scenario.
In contrast, optimistic analysts argued that the weakeconomic situation in early 2003 had been caused pre-dominately by exogenous factors of a temporary natureand that, if these factors dissipated, there would be asound recovery. According to this point of view, despitethe plethora of uncertainties, the conditions for a recov-ery had been laid and were discernible: household spend-ing remained resilient in many economies; business
investment had shown incipient signs of rebounding ascorporate profits began to improve; inventories were lowand needed replenishing; the protracted consolidation ofearlier excess investment, and the accompanying substan-tial correction of equity prices, seemed to have reached anadir; productivity gains from ICT innovations were tan-gible, not virtual, so that the ICT revolution would con-tinue to improve efficiency and lift productivity for theforeseeable future; and macroeconomic policies in a largenumber of economies were accommodative, even thoughthey were constrained in some other countries. Overall,optimistic forecasters expected that repressed consumerand investor confidence would recover and the worldeconomy would revive once the shocks abated, most like-ly in the second half of 2003. The United Nations forecastof early 2003 shared this latter view, although a numberof downside risks had also been emphasized.1
Developments in the world economy in the second halfof 2003 seem to have largely conformed with the opti-mistic view: the recovery in a number of economies, par-ticularly the United States and some countries in Asia,has been even more vibrant than most earlier optimisticforecasts.
An international business cycle, such as the current one,is not a simple alternation of decreases and increases inaggregate output and trade; it also involves changes in thestructure of national economies and in the internationalpatterns of trade, production, financing and economicgrowth. In a business cycle in a national economy, labour,capital and other resources are reallocated across sectors,reducing excesses, inefficiency and imbalances; for exam-ple, labour shed from some sectors in the downturn maynot necessarily be rehired in the same sectors during theupturn. Across countries, international comparative advan-tage is similarly likely to change during the cycle, as arevarious international flows and balances; some countrieswill increase their shares in global markets while otherswill lose. As a result, a global business cycle can lead tofaster-than-usual changes in cross-country differences.
G L O B A L O U T L O O K 3
CHAPTER I: GLOBAL OUTLOOK
W O R L D E C O N O M I C S I T U A T I O N A N D P R O S P E C T S 2 0 0 44
Recovery broadening across countries
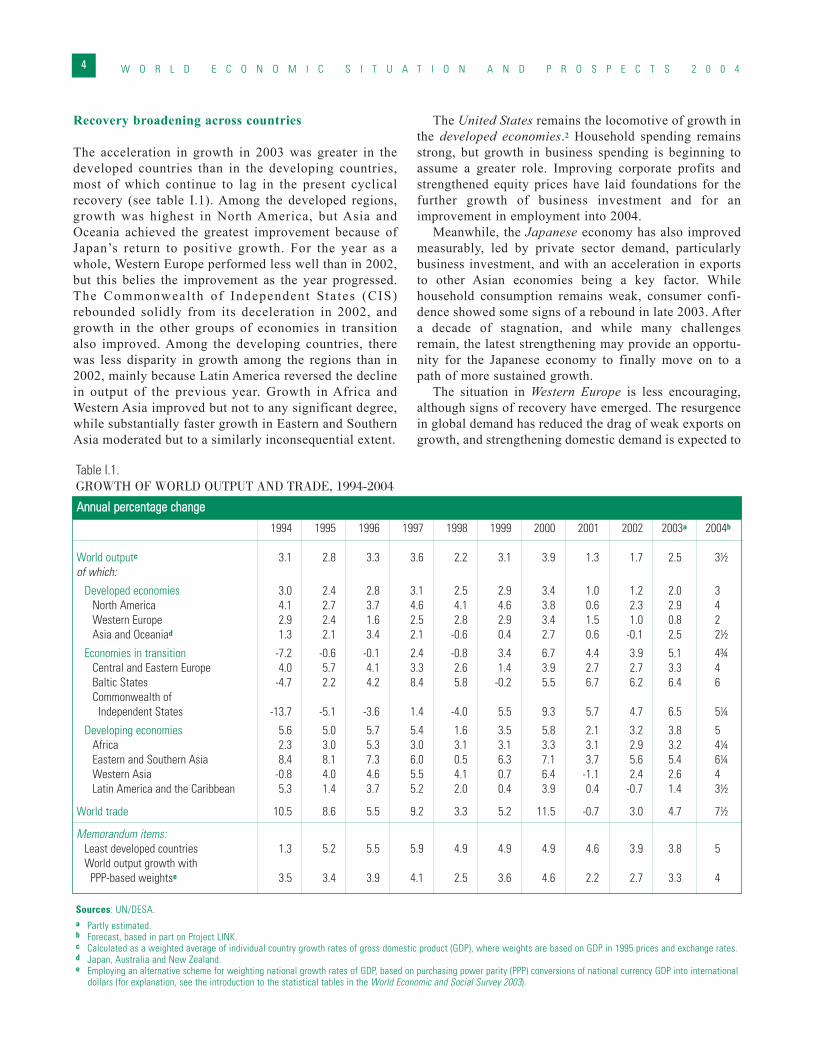
The acceleration in growth in 2003 was greater in thedeveloped countries than in the developing countries,most of which continue to lag in the present cyclicalrecovery (see table I.1). Among the developed regions,growth was highest in North America, but Asia andOceania achieved the greatest improvement because ofJapan’s return to positive growth. For the year as awhole, Western Europe performed less well than in 2002,but this belies the improvement as the year progressed.The Commonweal th of Independent States (CIS)rebounded solidly from its deceleration in 2002, andgrowth in the other groups of economies in transitionalso improved. Among the developing countries, therewas less disparity in growth among the regions than in2002, mainly because Latin America reversed the declinein output of the previous year. Growth in Africa andWestern Asia improved but not to any significant degree,while substantially faster growth in Eastern and SouthernAsia moderated but to a similarly inconsequential extent.
The United States remains the locomotive of growth inthe developed economies.2 Household spending remainsstrong, but growth in business spending is beginning toassume a greater role. Improving corporate profits andstrengthened equity prices have laid foundations for thefurther growth of business investment and for animprovement in employment into 2004.
Meanwhile, the Japanese economy has also improvedmeasurably, led by private sector demand, particularlybusiness investment, and with an acceleration in exportsto other Asian economies being a key factor. Whilehousehold consumption remains weak, consumer confi-dence showed some signs of a rebound in late 2003. Aftera decade of stagnation, and while many challengesremain, the latest strengthening may provide an opportu-nity for the Japanese economy to finally move on to apath of more sustained growth.
The situation in Western Europe is less encouraging,although signs of recovery have emerged. The resurgencein global demand has reduced the drag of weak exports ongrowth, and strengthening domestic demand is expected to
Table I.1.GROWTH OF WORLD OUTPUT AND TRADE, 1994-2004
1994 1995 1996 1997 1998 1999 2000 2001 2002 2003a 2004b
World outputc 3.1 2.8 3.3 3.6 2.2 3.1 3.9 1.3 1.7 2.5 3½of which:
Developed economies 3.0 2.4 2.8 3.1 2.5 2.9 3.4 1.0 1.2 2.0 3 North America 4.1 2.7 3.7 4.6 4.1 4.6 3.8 0.6 2.3 2.9 4 Western Europe 2.9 2.4 1.6 2.5 2.8 2.9 3.4 1.5 1.0 0.8 2 Asia and Oceaniad 1.3 2.1 3.4 2.1 -0.6 0.4 2.7 0.6 -0.1 2.5 2½
Economies in transition -7.2 -0.6 -0.1 2.4 -0.8 3.4 6.7 4.4 3.9 5.1 4¾Central and Eastern Europe 4.0 5.7 4.1 3.3 2.6 1.4 3.9 2.7 2.7 3.3 4 Baltic States -4.7 2.2 4.2 8.4 5.8 -0.2 5.5 6.7 6.2 6.4 6 Commonwealth of
Independent States -13.7 -5.1 -3.6 1.4 -4.0 5.5 9.3 5.7 4.7 6.5 5¼
Developing economies 5.6 5.0 5.7 5.4 1.6 3.5 5.8 2.1 3.2 3.8 5 Africa 2.3 3.0 5.3 3.0 3.1 3.1 3.3 3.1 2.9 3.2 4¼Eastern and Southern Asia 8.4 8.1 7.3 6.0 0.5 6.3 7.1 3.7 5.6 5.4 6¼Western Asia -0.8 4.0 4.6 5.5 4.1 0.7 6.4 -1.1 2.4 2.6 4 Latin America and the Caribbean 5.3 1.4 3.7 5.2 2.0 0.4 3.9 0.4 -0.7 1.4 3½
World trade 10.5 8.6 5.5 9.2 3.3 5.2 11.5 -0.7 3.0 4.7 7½
Memorandum items:Least developed countries 1.3 5.2 5.5 5.9 4.9 4.9 4.9 4.6 3.9 3.8 5World output growth with
PPP-based weightse 3.5 3.4 3.9 4.1 2.5 3.6 4.6 2.2 2.7 3.3 4
AAnnnnuuaall ppeerrcceennttaaggee cchhaannggee
Sources: UN/DESA.a Partly estimated.b Forecast, based in part on Project LINK.c Calculated as a weighted average of individual country growth rates of gross domestic product (GDP), where weights are based on GDP in 1995 prices and exchange rates.d Japan, Australia and New Zealand.e Employing an alternative scheme for weighting national growth rates of GDP, based on purchasing power parity (PPP) conversions of national currency GDP into international
dollars (for explanation, see the introduction to the statistical tables in the World Economic and Social Survey 2003).
provide a further stimulus in the near future. Private con-sumption will benefit from the appreciated euro, whichwill dampen inflation and boost real disposable income,and by low interest rates, which will reduce the burden ofconsumer debt. Investment has been a weakness, but busi-ness confidence is showing signs of recovery, with invest-ment expected to respond accordingly. Unemployment is,however, expected to remain high, leading to cautionregarding spending and to higher rates of saving.Government spending continues to have a positive impacton demand in the major countries, but this will be gradu-ally reduced as budgetary difficulties are addressed.
Among the economies in transition, growth in thecountries of the CIS has been accelerating, bolstered byhigher production and exports of oil, increased domesticand foreign investment and consumption boosted by high-er real wages and pension payments. The RussianFederation continues to be the economic engine for theregion, but its growth is expected to moderate in 2004 asa result of lower prices of oil. The robust growth in theBaltic States is expected to be maintained although thesecountries’ forthcoming accession to the European Union(EU) will make their prospects more dependent on theeconomic strength of the euro area. Growth in Central andEastern European countries is expected to improve in linewith the anticipated recovery in the EU, lower oil pricesand EU transfers to the countries expected to join theUnion in 2004.
The international economic environment for mostdeveloping countries improved during 2003.3 In terms ofUnited States dollars, the international prices of manycommodities increased on average by more than 10 percent from the previous year, partly because of the depreci-ation of the dollar. Capital inflows are beginning toincrease for a number of developing countries, and exter-nal financing conditions for many developing countries, aswell as for some economies in transition, have also beenimproving, as indicated by the downward trend in the dif-ferences between the yields on their sovereign bonds andthose on the government bonds of major developed coun-tries. The long-term downward trend in the real prices ofmost commodities and the pro-cyclical nature of interna-tional capital flows will, however, continue to challengemany developing countries over the longer term.
Growth in Africa is expected to accelerate somewhatin 2004. In addition to continued progress in political andeconomic governance and in achieving macroeconomicstability, a number of positive factors that characterized2003, such as increased agricultural output due toimproved weather conditions, a rise in industrial andmanufacturing output, higher consumer demand andincreased investment, including foreign direct investment(FDI), are also expected to continue to prevail in 2004.Growth in Latin America and the Caribbean is expected
to recover in 2004, boosted by the improvement in bothexternal conditions and the domestic economic policyenvironment. Increased external demand, firmer com-modity prices and more favourable external financingterms are improving the conditions for economic recov-ery in the region. In East Asia, the external sector, privateconsumption, public spending and business investmentare all contributing to a strong recovery. In South Asia,the economic spillover from the war in Iraq was relative-ly modest, and favourable agricultural production (due toimproved weather conditions), rising rural incomes,increased exports, low interest rates, growing remittancesand the improved security situation will continue to sup-port a broad-based recovery in most countries. Theprospects for Western Asia will depend critically ondevelopments in Iraq and on the Israeli and Palestinianconflict. Growth in the oil-exporting countries of theregion is forecast to accelerate in 2004, while prospectsfor the oil-importing countries are mixed.
A key feature of the global recovery has been the risingeconomic weight of the two most populous countries,China and India, both of which have been growing at arate of more than twice the world average. Continuedstrong growth in these two large low-income countrieswill benefit the world economy as whole, reduce globalpoverty and serve as an incentive for other developingcountries. However, the size of these two economiesmeans that their fast growth will have far-reaching impli-cations for international patterns of trade, production andfinancing and for the global supply and demand of energyand commodities. For example, transnational corporations(TNCs) have been relocating plants from other economiesto China, attracted partly by its vast domestic market andpartly by its enormous supply of low-cost labour as aninput for their global manufacturing operations. As aresult, international competition in some manufacturingsectors has intensified profoundly. This is a positive forcefor global efficiency and growth in the long run, but it alsocreates difficulties for some other countries, includingmany developing countries, in the short run.
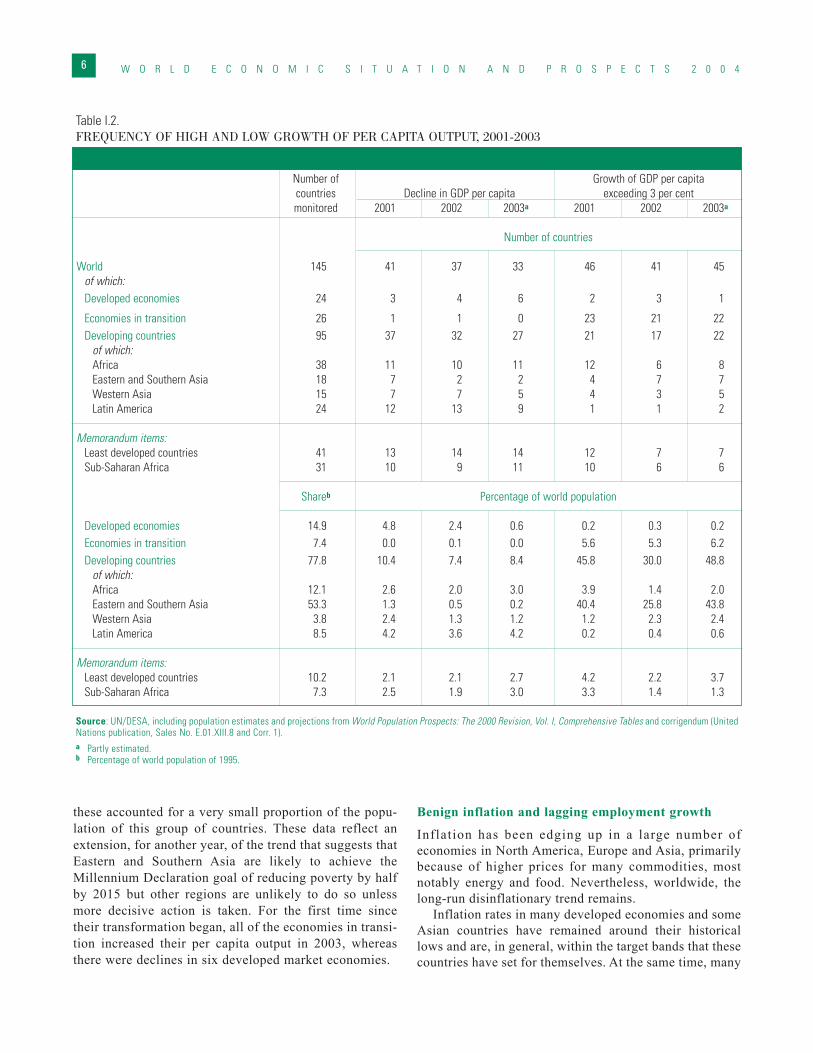
Almost two thirds of the population of the developingworld lived in countries that achieved per capita outputgrowth in 2003 of at least 3 per cent, but this group wasalmost entirely accounted for by countries in Eastern andSouthern Asia, particularly China and India; in otherdeveloping regions, very few people lived in countriesthat achieved this long-term benchmark rate of growth formeaningful poverty reduction (see table I.2). There was adecrease in 2003 in the number of developing countrieswhere per capita output fell but, because of a change inthe composition of the group, the number of people livingin such countries increased. Among 41 least developedcountries (LDCs) for which data are available, only sevenachieved a 3 per cent increase in per capita output, and
G L O B A L O U T L O O K 5
W O R L D E C O N O M I C S I T U A T I O N A N D P R O S P E C T S 2 0 0 46
these accounted for a very small proportion of the popu-lation of this group of countries. These data reflect anextension, for another year, of the trend that suggests thatEastern and Southern Asia are likely to achieve theMillennium Declaration goal of reducing poverty by halfby 2015 but other regions are unlikely to do so unlessmore decisive action is taken. For the first time sincetheir transformation began, all of the economies in transi-tion increased their per capita output in 2003, whereasthere were declines in six developed market economies.
Benign inflation and lagging employment growth
Inflation has been edging up in a large number ofeconomies in North America, Europe and Asia, primarilybecause of higher prices for many commodities, mostnotably energy and food. Nevertheless, worldwide, thelong-run disinflationary trend remains.
Inflation rates in many developed economies and someAsian countries have remained around their historicallows and are, in general, within the target bands that thesecountries have set for themselves. At the same time, many
Table I.2.FREQUENCY OF HIGH AND LOW GROWTH OF PER CAPITA OUTPUT, 2001-2003
Number of Growth of GDP per capitacountries Decline in GDP per capita exceeding 3 per centmonitored 2001 2002 2003a 2001 2002 2003a
Number of countries
World 145 41 37 33 46 41 45of which:Developed economies 24 3 4 6 2 3 1
Economies in transition 26 1 1 0 23 21 22Developing countries 95 37 32 27 21 17 22
of which:Africa 38 11 10 11 12 6 8Eastern and Southern Asia 18 7 2 2 4 7 7Western Asia 15 7 7 5 4 3 5Latin America 24 12 13 9 1 1 2
Memorandum items:Least developed countries 41 13 14 14 12 7 7Sub-Saharan Africa 31 10 9 11 10 6 6
Shareb Percentage of world population
Developed economies 14.9 4.8 2.4 0.6 0.2 0.3 0.2Economies in transition 7.4 0.0 0.1 0.0 5.6 5.3 6.2Developing countries 77.8 10.4 7.4 8.4 45.8 30.0 48.8
of which:Africa 12.1 2.6 2.0 3.0 3.9 1.4 2.0Eastern and Southern Asia 53.3 1.3 0.5 0.2 40.4 25.8 43.8Western Asia 3.8 2.4 1.3 1.2 1.2 2.3 2.4Latin America 8.5 4.2 3.6 4.2 0.2 0.4 0.6
Memorandum items:Least developed countries 10.2 2.1 2.1 2.7 4.2 2.2 3.7Sub-Saharan Africa 7.3 2.5 1.9 3.0 3.3 1.4 1.3
Source: UN/DESA, including population estimates and projections from World Population Prospects: The 2000 Revision, Vol. I, Comprehensive Tables and corrigendum (UnitedNations publication, Sales No. E.01.XIII.8 and Corr. 1).a Partly estimated.b Percentage of world population of 1995.
developing countries in Latin America and Africa, and anumber of economies in transition, have further reducedtheir relatively high inflation rates. In some cases, part ofthe decline is attributable to the abatement of short-termincreases in inflation that had resulted from adjustmentmeasures. Meanwhile, for the few Asian economies thathad suffered a decline in general prices, deflation hasdiminished, but not disappeared, in Japan and Hong KongSpecial Administrative Region (SAR) of China, while theconcerns about deflation in China have been replaced byworries about overheating in certain sectors.
As global demand continues to recover, there may bea cyclical acceleration in inflation in several economies,reinforced by rising commodity prices and, for countrieswith their exchange rate tied to the United States dollar,a continued depreciation of that currency. However,continued productivity growth, the remaining slack inglobal manufacturing capacity and high unemploymentrates in many economies should counteract inflationarypressures.
More importantly, the worldwide long-run disinfla-tionary trend of the past decade has been driven by anumber of structural factors. In addition to the anti-infla-tionary policies of many central banks and improvedmacroeconomic management, globalization has increasedinternational competition and curbed monopoly power,technological innovations have raised productivitygrowth, and economic reforms in the international tradeand financial systems as well as in domestic markets havereduced rigidities and barriers. All have contributed toreducing global inflation and creating expectations of lowinflation in future. As long as these factors stay in place,global inflation should remain benign.
In contrast, the unemployment situation remains diffi-cult worldwide. Most economies have experienced anincrease in unemployment or underemployment in thepast few years as a result of the global slowdown and thesubsequent period of low growth. An increase in employ-ment always lags other aspects of a recovery, so that onlya few economies have experienced any improvement intheir labour market so far. Unemployment rates in manyeconomies are not expected to improve meaningfullyuntil late 2004, but growth in employment, by reinforcingdemand from the household and business sectors, is nec-essary to solidifying the recovery.
Some analysts and policy makers have attributedunemployment in many economies to productivity growthand increased international competition, arguing thathigher productivity growth, driven by ICT innovations,has made firms shed more workers in the downturn anddelayed hiring in the upturn. They also argue thatincreased imports and international outsourcing have ledto the loss of jobs in the domestic market, particularly indeveloped countries.
These views confuse macroeconomic with microeco-nomic issues and sectoral with economy-wide problems.Both productivity growth and international competitionare crucial driving forces for output growth, for increas-ing wages and for raising income levels in the long run.In many developed economies, most of the recent rise inunemployment is cyclical and is caused mainly by a lackof aggregate demand, whereas the majority of unem-ployment in developing countries is structural andcaused by various capacity constraints, including ashortage of both internal and external financialresources. In order to reduce their unemployment,developed countries need to ensure that the recovery issustained and, in some cases, to address structural diffi-culties in their labour markets.
Developing countries need to pay more attention totheir high structural unemployment and underemploy-ment, particularly in Africa and some Latin Americaneconomies, where the rates reach 30 per cent or evenhigher. Inadequate employment is both a cause and aresult of low growth and underdevelopment in thesecountries and is a root cause of their poverty, as well asa waste of a resource for the global economy as a whole.Progress in addressing this challenge could be achievedthrough the implementation of the panoply of actions topromote development that governments have alreadycollectively agreed to in the global conferences of thepast decade.
ADDRESSING THE GLOBAL IMBALANCES
Despite the improved global economic prospects, largeimbalances remain in the world economy. The imbal-ances are epitomized by the United States current-account deficit of more than $500 billion in 2003, about5 per cent of its gross domestic product (GDP). This ismatched by the aggregate of the surpluses of a number ofeconomies in Asia and Europe, such as China, Japan,Germany and Russia. The forecast indicates that therecovery in global growth will not narrow the imbal-ances in the near future; on the contrary, most areexpected to widen further in 2004. However, they cannotbe sustained indefinitely, and their eventual correctionwill have profound implications for the future stability,efficiency and equity of the world economy.
Reasons for the imbalances
There are wide-ranging views on the causes, effects, sus-tainability, adjustment and policy implications of theglobal imbalances. In addition to political and ideologicalconsiderations, different approaches to the analysis of theimbalances have contributed to the disagreements.
G L O B A L O U T L O O K 7
The conventional approach focuses almost exclusivelyon trade flows because the imbalances appear to be main-ly the result of differences between the exports andimports of individual countries. According to thisapproach, the cross-country imbalances are temporary,caused mainly by changes in relative demand and relativeprices across nations, such as terms-of-trade shocks or atemporary misalignment in exchange rates. In this case,the imbalances can be reversed through an adjustment inexchange rates.
There is no inherent connection between this approachand international protectionism, but the argument canreadily be used. According to some views, for example,the large deficits of the United States are caused by for-eign governments’ manipulation of exchange rates, bytrade barriers, by low wages in developing countries, or bydeveloping countries’ failure to adopt international labourand environment standards. Such observers argue that theimbalances have cost the United States millions of jobsand have depressed the wages of workers in the manufac-turing sector in that country. They therefore call for tradeprotection measures and for other countries to revaluetheir currencies in order to correct the imbalances.
An alternative analysis of the imbalances, originating inmodern international macroeconomic theory, focuses onglobal asset allocation.4 The counterparts of the current-account imbalances are the corresponding changes innational holdings of international financial assets. Moreimportantly, the current account imbalances are directlyrelated to the saving-investment gaps and the governmentbalances of individual countries. According to thisapproach, the global imbalances are the result of a world-wide asset allocation that is determined by long-run, cross-country differences in growth, rates of return on capital,saving-investment gaps and other structural factors.
An extension of this approach is that cross-countryimbalances do not matter because they merely reflect thedynamic efficiency of the global mobility of capital andgoods: some global savings will flow to countries thatgrow faster than others in order to finance both a rate ofinvestment that is higher than the rate of domestic savingsand levels of imports that are higher than exports, result-ing in current-account deficits for these faster-growingcountries. Ideally, such a situation would characterizedeveloping countries; it is a reflection of the inherentasymmetry of the present international financial systemthat it pertains to the world’s best-endowed economy.
Despite complacency in some quarters, the globalimbalances are important for a number of reasons. First,contrary to some views, the global system of trade andfinance is far from perfectly competitive, particularly sinceit includes underdeveloped markets and no market at all inmany developing countries, with the result that the imbal-ances do not represent an efficient allocation of global cap-
ital and goods. Secondly, the global imbalances implyunequal opportunities for many developing countries. As amajor issuer of international currency, the United States isin a unique position to finance its external deficit by creat-ing debt with the rest of the world and capturing the result-ing “seigniorage”. Meanwhile, with one of the lowest sav-ing rates in the world, the United States absorbs a largeshare of global savings, leaving many developing countrieswithout the capital to finance their economic development,and thereby widening the income gaps between the richand poor countries. According to this view, the large glob-al imbalances benefit the United States at the expense ofothers in both the long run and the short run.
Correcting the imbalances
Historically, most current-account imbalances arereversed when they reach a certain level in relation toGDP. For many economies, as indicated in some recentcases, the reversal of a large external deficit is likely tobe an abrupt process, usually involving a sudden halt incapital inflows and a severe adjustment in various sec-tors of the economy.5 For an economy that occupies akey position in the world economy, such as the UnitedStates, the international repercussions of an adjustmentof its imbalance would be at least as important as theimpact on the domestic economy.
The current global imbalances can be broken downinto a cyclical component and a perennial component. Achange in the exchange rate may be appropriate to correctthe cyclical component of the imbalances (see box I.1),but the adjustment of the perennial component has to bebrought about primarily by a narrowing of internationalstructural differentials. This is a longer-term process thatcannot be achieved solely through a realignment ofexchange rates; an attempt to do so is likely to result inextreme movements in exchange rates and correspond-ingly excessive adjustment costs.
Nevertheless, when confronting the need to adjustimbalances, many analysts, policy makers and financialmarket actors focus on the exchange rate, implying that achange in exchange rates is both necessary and sufficientto adjust the global imbalances. The depreciation of theUnited States dollar vis-à-vis other major currencies in2003, the pressures on a number of developing countriesto revalue their currencies and some of the rising tradetensions are all based on this belief. However, for the rea-sons given above, this notion is misconceived and is mis-leading to both foreign exchange markets and exchange-rate policy in many countries.
There is a myriad of paths for the adjustment of theglobal imbalances because so many variables areinvolved. However, a complete reversal of the presentimbalances should not be a short-run objective. Accord-
W O R L D E C O N O M I C S I T U A T I O N A N D P R O S P E C T S 2 0 0 48
G L O B A L O U T L O O K 9
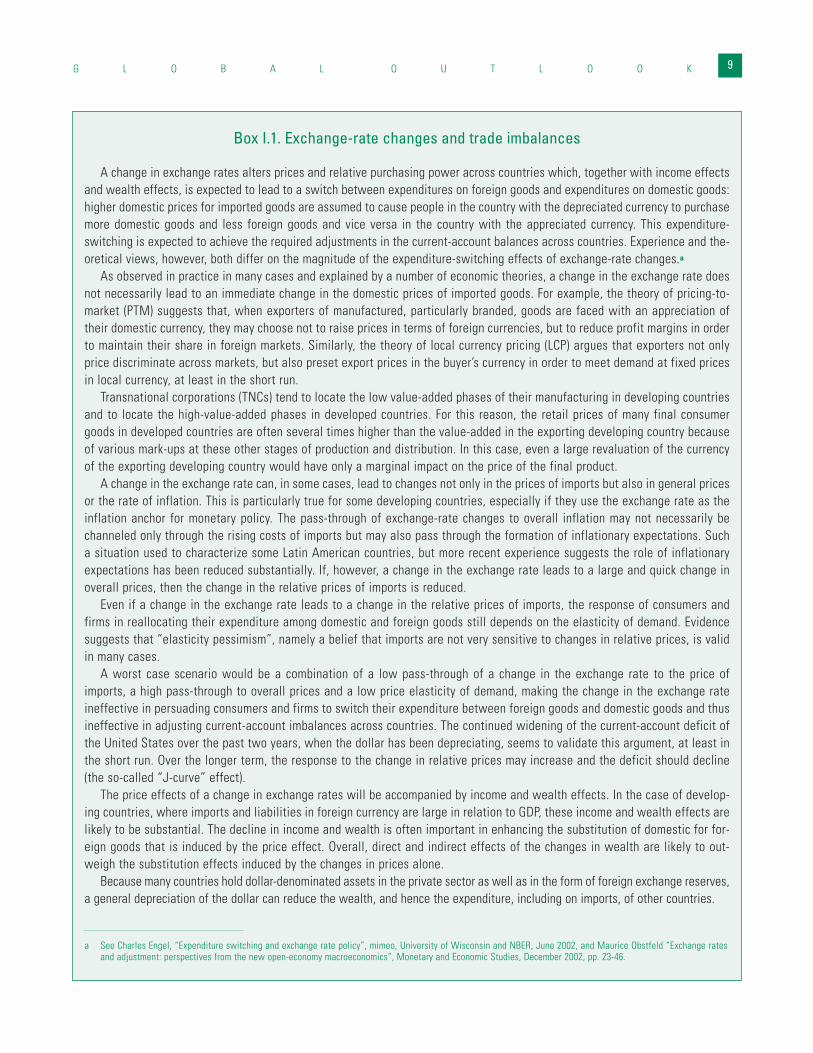
Box I.1. Exchange-rate changes and trade imbalances
A change in exchange rates alters prices and relative purchasing power across countries which, together with income effectsand wealth effects, is expected to lead to a switch between expenditures on foreign goods and expenditures on domestic goods:higher domestic prices for imported goods are assumed to cause people in the country with the depreciated currency to purchasemore domestic goods and less foreign goods and vice versa in the country with the appreciated currency. This expenditure-switching is expected to achieve the required adjustments in the current-account balances across countries. Experience and the-oretical views, however, both differ on the magnitude of the expenditure-switching effects of exchange-rate changes.a
As observed in practice in many cases and explained by a number of economic theories, a change in the exchange rate doesnot necessarily lead to an immediate change in the domestic prices of imported goods. For example, the theory of pricing-to-market (PTM) suggests that, when exporters of manufactured, particularly branded, goods are faced with an appreciation oftheir domestic currency, they may choose not to raise prices in terms of foreign currencies, but to reduce profit margins in orderto maintain their share in foreign markets. Similarly, the theory of local currency pricing (LCP) argues that exporters not onlyprice discriminate across markets, but also preset export prices in the buyer’s currency in order to meet demand at fixed pricesin local currency, at least in the short run.
Transnational corporations (TNCs) tend to locate the low value-added phases of their manufacturing in developing countriesand to locate the high-value-added phases in developed countries. For this reason, the retail prices of many final consumergoods in developed countries are often several times higher than the value-added in the exporting developing country becauseof various mark-ups at these other stages of production and distribution. In this case, even a large revaluation of the currencyof the exporting developing country would have only a marginal impact on the price of the final product.
A change in the exchange rate can, in some cases, lead to changes not only in the prices of imports but also in general pricesor the rate of inflation. This is particularly true for some developing countries, especially if they use the exchange rate as theinflation anchor for monetary policy. The pass-through of exchange-rate changes to overall inflation may not necessarily bechanneled only through the rising costs of imports but may also pass through the formation of inflationary expectations. Sucha situation used to characterize some Latin American countries, but more recent experience suggests the role of inflationaryexpectations has been reduced substantially. If, however, a change in the exchange rate leads to a large and quick change inoverall prices, then the change in the relative prices of imports is reduced.
Even if a change in the exchange rate leads to a change in the relative prices of imports, the response of consumers andfirms in reallocating their expenditure among domestic and foreign goods still depends on the elasticity of demand. Evidencesuggests that “elasticity pessimism”, namely a belief that imports are not very sensitive to changes in relative prices, is validin many cases.
A worst case scenario would be a combination of a low pass-through of a change in the exchange rate to the price ofimports, a high pass-through to overall prices and a low price elasticity of demand, making the change in the exchange rateineffective in persuading consumers and firms to switch their expenditure between foreign goods and domestic goods and thusineffective in adjusting current-account imbalances across countries. The continued widening of the current-account deficit ofthe United States over the past two years, when the dollar has been depreciating, seems to validate this argument, at least inthe short run. Over the longer term, the response to the change in relative prices may increase and the deficit should decline(the so-called “J-curve” effect).
The price effects of a change in exchange rates will be accompanied by income and wealth effects. In the case of develop-ing countries, where imports and liabilities in foreign currency are large in relation to GDP, these income and wealth effects arelikely to be substantial. The decline in income and wealth is often important in enhancing the substitution of domestic for for-eign goods that is induced by the price effect. Overall, direct and indirect effects of the changes in wealth are likely to out-weigh the substitution effects induced by the changes in prices alone.
Because many countries hold dollar-denominated assets in the private sector as well as in the form of foreign exchange reserves,a general depreciation of the dollar can reduce the wealth, and hence the expenditure, including on imports, of other countries.
a See Charles Engel, “Expenditure switching and exchange rate policy”, mimeo, University of Wisconsin and NBER, June 2002, and Maurice Obstfeld “Exchange ratesand adjustment: perspectives from the new open-economy macroeconomics”, Monetary and Economic Studies, December 2002, pp. 23-46.
ing to some studies,6 an adjustment process that wouldminimize the adverse shocks to the global economywould involve a gradual and simultaneous adjustment inboth deficit and surplus countries through policies thatwould reduce the cross-country differences in growthrates and in saving-investment gaps. In the present case,this would require the United States to consolidate itsgovernment deficit and raise private savings, whileEurope and Japan should take measures that would boosttheir private consumption and long-term growth.Meanwhile, countries with large and growing foreignexchange reserves should consider policies to use thosefinancial resources more productively. Even if such meas-ures were taken, the asymmetry of the excessive absorp-tion of global savings by the United States and the pauci-ty of financing for development in a large number ofdeveloping countries will likely continue for the foresee-able future as a reflection of the inadequacies of the pres-ent international financial system.
UNCERTAINTIES AND RISKSWhile more analysts have revised upward their economicforecasts for 2004, there remains a debate whether theworld economy can sustain a path of high growth beyondthe current policy-led cyclical upturn. The forecast inthis report foresees continued economic recovery in theshort run, but is cautious about the strength of globalgrowth in the medium run. Some of the forces that wereresponsible for global growth of 3.5 per cent or higher inthe 1990s are now absent or not strong enough to pro-duce such robust growth. For example, despite somerecovery, the dynamism of trade is not broad enough, andworld exports are not expected to grow at their earlierrapid pace. With the setbacks to the multilateral tradenegotiations under the Doha Round and persisting tradetensions, international trade lacks any additional impetusother than the recovery in demand. Furthermore, interna-tional capital flows, another key stimulant of the 1990s,are far less buoyant. Moreover, although a recovery inthe ICT sector seems to be under way, investment spend-ing on ICT in many economies seems unlikely to reachthe torrid pace of the 1990s. Finally, other developmentsin recent years, such as heightened geopolitical tensions,intensified international terrorism and, to some extentrelatedly, rising global military spending are likely toadversely affect the potential growth of the world econo-my in the medium and long run.
Even in the short run, the world economy is still sub-ject to a number of downside risks: international tradeimbalances continue to widen and exchange-rate adjust-ments among major currencies are accompanied by con-siderable volatility, complicating domestic economic pol-icy in many countries. The widespread worsening fiscal
deficits also create risks of instability, as do the high lev-els of household debt and the possibility of a “bubble” inreal estate prices in a number of countries. These vulner-abilities will become more acute when interest ratesincrease, as is forecast to be the trend in 2004. On thegeopolitical front, some tensions have been reduced, butfar from eliminated, while others remain.
A particularly adverse possibility would be a rapiddepreciation of the United States dollar and an abruptreversal of its trade deficit. If the consequent adjustmentmainly involved a substantial cut in consumption, invest-ment and import demand in the United States, the globaleconomic recovery would probably be aborted, revertingto another slowdown.
This possibility has existed for some time,7 butchanges in the factors behind the external deficit of theUnited States have heightened the risk. Three years ago,the United States current-account deficit reflected main-ly the gap between investment and savings in the privatesector, but now the main element is the governmentbudget deficit. From the perspective of net foreign hold-ings of United States assets, three years ago foreigninvestors were mainly financing the high growth of busi-ness investment in the United States through FDI andequity flows; now capital inflows are largely taking theform of increased holdings of United States governmentbonds, as reflected in the increase in the foreignexchange reserves of many developing countries, a largeproportion of which is in the form of United StatesTreasury bonds.
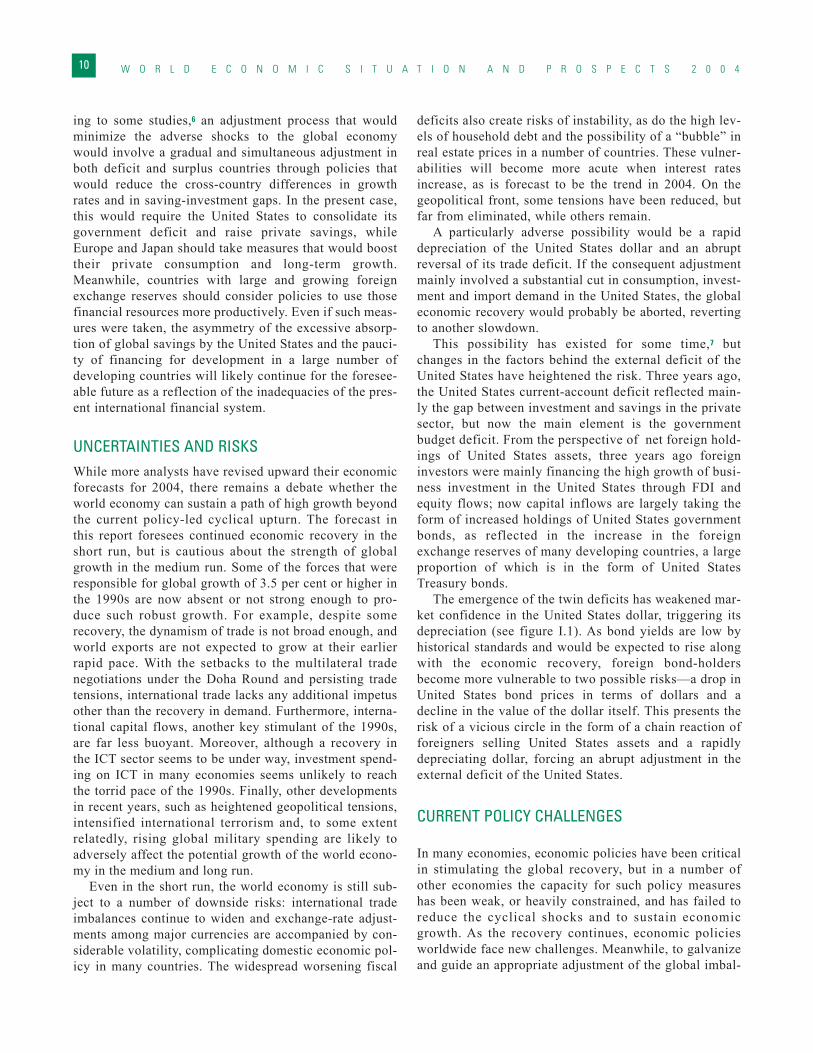
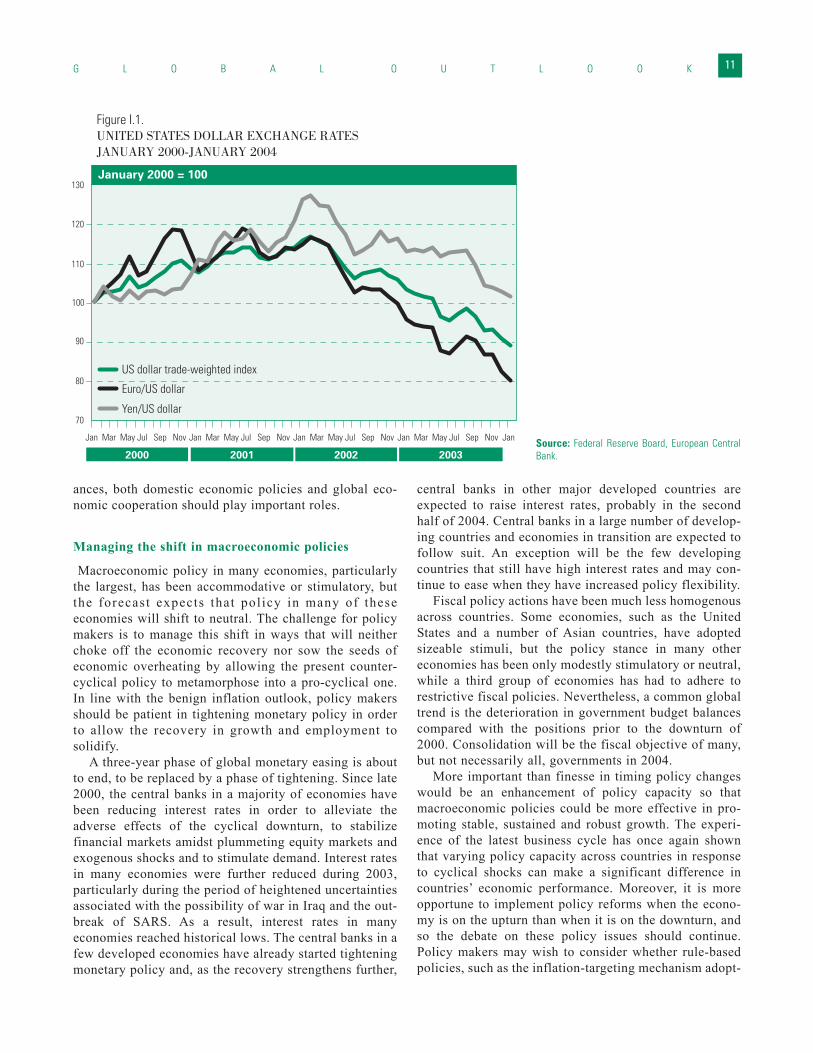
The emergence of the twin deficits has weakened mar-ket confidence in the United States dollar, triggering itsdepreciation (see figure I.1). As bond yields are low byhistorical standards and would be expected to rise alongwith the economic recovery, foreign bond-holdersbecome more vulnerable to two possible risks—a drop inUnited States bond prices in terms of dollars and adecline in the value of the dollar itself. This presents therisk of a vicious circle in the form of a chain reaction offoreigners selling United States assets and a rapidlydepreciating dollar, forcing an abrupt adjustment in theexternal deficit of the United States.
CURRENT POLICY CHALLENGES
In many economies, economic policies have been criticalin stimulating the global recovery, but in a number ofother economies the capacity for such policy measureshas been weak, or heavily constrained, and has failed toreduce the cyclical shocks and to sustain economicgrowth. As the recovery continues, economic policiesworldwide face new challenges. Meanwhile, to galvanizeand guide an appropriate adjustment of the global imbal-
W O R L D E C O N O M I C S I T U A T I O N A N D P R O S P E C T S 2 0 0 410
ances, both domestic economic policies and global eco-nomic cooperation should play important roles.
Managing the shift in macroeconomic policies
Macroeconomic policy in many economies, particularlythe largest, has been accommodative or stimulatory, butthe forecast expects that pol icy in many of theseeconomies will shift to neutral. The challenge for policymakers is to manage this shift in ways that will neitherchoke off the economic recovery nor sow the seeds ofeconomic overheating by allowing the present counter-cyclical policy to metamorphose into a pro-cyclical one.In line with the benign inflation outlook, policy makersshould be patient in tightening monetary policy in orderto allow the recovery in growth and employment tosolidify.
A three-year phase of global monetary easing is aboutto end, to be replaced by a phase of tightening. Since late2000, the central banks in a majority of economies havebeen reducing interest rates in order to alleviate theadverse effects of the cyclical downturn, to stabilizefinancial markets amidst plummeting equity markets andexogenous shocks and to stimulate demand. Interest ratesin many economies were further reduced during 2003,particularly during the period of heightened uncertaintiesassociated with the possibility of war in Iraq and the out-break of SARS. As a result, interest rates in manyeconomies reached historical lows. The central banks in afew developed economies have already started tighteningmonetary policy and, as the recovery strengthens further,
central banks in other major developed countries areexpected to raise interest rates, probably in the secondhalf of 2004. Central banks in a large number of develop-ing countries and economies in transition are expected tofollow suit. An exception will be the few developingcountries that still have high interest rates and may con-tinue to ease when they have increased policy flexibility.
Fiscal policy actions have been much less homogenousacross countries. Some economies, such as the UnitedStates and a number of Asian countries, have adoptedsizeable stimuli, but the policy stance in many othereconomies has been only modestly stimulatory or neutral,while a third group of economies has had to adhere torestrictive fiscal policies. Nevertheless, a common globaltrend is the deterioration in government budget balancescompared with the positions prior to the downturn of2000. Consolidation will be the fiscal objective of many,but not necessarily all, governments in 2004.
More important than finesse in timing policy changeswould be an enhancement of policy capacity so thatmacroeconomic policies could be more effective in pro-moting stable, sustained and robust growth. The experi-ence of the latest business cycle has once again shownthat varying policy capacity across countries in responseto cyclical shocks can make a significant difference incountries’ economic performance. Moreover, it is moreopportune to implement policy reforms when the econo-my is on the upturn than when it is on the downturn, andso the debate on these policy issues should continue.Policy makers may wish to consider whether rule-basedpolicies, such as the inflation-targeting mechanism adopt-
G L O B A L O U T L O O K 11
Figure I.1.UNITED STATES DOLLAR EXCHANGE RATES JANUARY 2000-JANUARY 2004
January 2000 = 100
2000 2001 2002 2003
US dollar trade-weighted index
Euro/US dollar
Yen/US dollar 70
80
90
100
110
120
130
Jan Mar May Jul Sep Nov Jan Mar May Jul Sep Nov Jan Mar May Jul Sep Nov Jan Mar May Jul Sep Nov Jan Source: Federal Reserve Board, European CentralBank.
W O R L D E C O N O M I C S I T U A T I O N A N D P R O S P E C T S 2 0 0 412
ed by a growing number of economies in recent years, aretoo rigid to respond effectively to shocks, particularly inan economic downturn. Among the developing countries,there are questions of whether the conditionalities associ-ated with the programmes of the international financialinstitutions are pro-cyclical and lead to unnecessary loss-es in output and employment, particularly in a crisis, ornear-crisis, situation. Finally, there is the question of howmacroeconomic management in developing countries fac-ing increasing global economic integration can beenhanced.
Deciding exchange-rate policy in developing countries
Particularly in the light of the large realignments in theexchange rates among the major currencies, exchangerate and other macroeconomic policies in many develop-ing countries are facing new challenges. There has beenmounting pressure for revaluation on China and a fewother Asian economies whose currencies are pegged, dejure or de facto, to the United States dollar and who havebeen experiencing a rapid increase in their large foreignreserves. Developing countries that have floatingexchange rates, such as those that were forced to aban-don their fixed exchange-rate regimes in the past fewyears because of financial crises, seem likely to fare wellas the depreciation of the United States dollar gives themmore flexibility to implement monetary easing to stimu-late economic recovery. However, even for theseeconomies, continued real appreciation is likely tobecome a concern at some point.
These challenges for exchange-rate policy in manydeveloping countries are a direct result of the inconsis-tency between the use of a few major national currencies—the dollar, euro and yen—as world money and increas-ing global economic integration, particularly the rapidgrowth of trade and capital flows. Monetary policy andexchange-rate policy in these currency-issuing countriesfocuses primarily on their domestic needs, rather than onthe needs of the rest of the world. The system thereforefails to fulfill the function of stabilizing internationaltrade and capital flows and promoting global growth. Asa result, it remains the responsibility of individual coun-tries to maintain an appropriate exchange-rate policy.However, it has become increasingly costly and difficultfor many developing countries to do so, partly because ofincreased global capital mobility.
The competing demands for flexibility and stabilityare at the center of the quandary for many developingcountries in choosing and maintaining an appropriateexchange-rate policy and regime.8 The role of theexchange rate in determining relative purchasing powerand relative prices across countries and in acting as abuffer to absorb and dampen international shocks calls
for flexibility. Over time, as international differentials ingrowth, productivity, income, resources endowment,technology and other economic structural aspects change,the parities among currencies should also change toensure an efficient allocation of resources across nations.Meanwhile, when an economy faces an external shock,such as a drop in import demand, a flexible exchange ratecould dampen the adverse effects on output and employ-ment. However, as so often observed in reality, the fluc-tuations in exchange rates under a floating exchange-rateregime are often too volatile to be explained by changesin economic fundamentals.
In contrast with this need for flexibility, the intercon-nection between the exchange rate and domestic mone-tary policy and the use of the exchange rate as a key vari-able in decision-making by firms engaged in internation-al trade and by global investors makes stability in theexchange rate desirable. In a number of developing coun-tries, particularly those having a history of hyperinflationor lacking credibility and capacity in controlling infla-tion, the exchange rate has been used as the anchor to sta-bilize the value of the local currency and thus to stabilizethe economy. At the same time, firms and individualsengaged in international trade and investment usuallyprefer a stable exchange rate because of the costs theymay incur if there are large changes in the exchange rate.
To maintain a stable, or fixed, exchange rate can, how-ever, be costly for many developing countries. In the firstinstance, holding large amounts of foreign reservesinvolves opportunity costs because the rate of return onsuch reserves is much lower than the rate of interest thatthese countries pay on their foreign debts. There are alsothe potentially large financial losses in the value of for-eign reserves due to realignments in the exchange rates ofmajor currencies—the recent depreciation of the UnitedStates dollar, for example will have led to significantlosses for those developing countries with a large portionof their reserves denominated in dollars. Finally, there arethe losses in reserves incurred during currency crises orspeculative attacks. Moreover, a stable peg to one majorcurrency can mean an unstable exchange rate vis-à-visother major currencies because of the volatility amongmajor currencies. Overall, there is the question ofwhether these risks associated with a fixed exchange rateregime should be solely borne by the government or beshared by businesses and international investors.
The panoply of exchange-rate regimes that hasevolved in the past few decades reflects the efforts ofmany economies to make an appropriate trade-offbetween flexibility and stability. After the internationalfinancial crises of the 1990s, however, the trade-offseems to have become even harder to resolve. Somecountries have maintained, or adopted, a fixed exchangerate but a larger number of economies have moved to a
G L O B A L O U T L O O K 13
floating exchange-rate regime. In practice, however, fewcurrencies float completely freely; in most cases, govern-ments intervene on occasion, leading to a “dirty float”which endeavours to capture the benefits of both regimeswhile reducing their respective costs.
It is difficult to define an optimal exchange-rateregime and even more so to determine an optimalexchange-rate level. The key is the consistency betweenexchange-rate policy and other economic policies andbetween the exchange-rate regime and other aspects ofthe institutional framework. The countries that are cur-rently under pressure to revalue should consider theirexchange-rate policy in the broader context of overalleconomic management and reform, including macroeco-nomic management, current-account and capital accountregulations and reform of the financial system.
Improving global development prospects
As elaborated above, the global imbalances are not onlya problem in themselves, presenting risks to the worldeconomy in the short term, but are also a manifestationof longer-term structural problems that require corre-spondingly longer-term solutions. Part of the longer-termsolution lies in accelerating growth in the parts of theworld where it is currently lagging, including both devel-oped and developing countries.
Among the slow-growing developing countries, whichincludes most of those in Africa, Latin America andWestern Asia, improved economic performance will requiresustainable macroeconomic frameworks, productive devel-opment strategies aimed at guaranteeing international com-petition and improved governance. It is essential thatdeveloping countries and economies in transition makeevery effort to mobilize additional resources for develop-ment purposes and to ensure that all domestic and interna-tional resources for this purpose are used effectively.
Equally, however, restoring economic growth in thesecountries requires, first and foremost, a prompt, solid andsupportive recovery in the developed economies.Achieving the internationally-agreed development goals,including the Millennium Development Goals, requiresprogress to be sustained over the longer term. This, in turn,will require prompt and complete delivery on the interna-tional commitments to development that have already beenmade, most notably in the Millennium Declaration, at theFourth Ministerial Meeting of the World Trade Organi-zation (WTO), the Monterrey Consensus adopted by theInternational Conference on Financing for Developmentand the Plan of Implementation of the Johannesburg WorldSummit on Sustainable Development.
Progress to date in the implementation of the interna-tional commitments made at Doha, Monterrey andJohannesburg has been mixed. Although data for 2003 are
not available, an early outcome was a turnaround in 2002in the previous downward trend in flows of official devel-opment assistance (ODA). It is increasingly recognizedthat ODA can be very effective in accelerating develop-ment if conditions in both the recipient country and theinternational economy are supportive.9 This not only tes-tifies to the need for both sound domestic policies and aconducive international development environment butalso underscores the need for previous commitments offurther increases in ODA to be realized.
In contrast, total private capital flows to developingcountries, including FDI, have declined each year since2000, belying the high hopes that were ascribed to thefuture role of international private sector entities indevelopment. While some increase in private sector flowsis likely to form part of the global economic recovery, asubstantial increase, particularly in comparison with theneeds of developing countries, seems unlikely. Moreover,experience suggests that such flows tend to be concen-trated in a relatively small number of countries and theseare not necessarily the poorest countries or those wherethe needs are greatest. Nor do such flows normallyaddress needs in such areas as education and health.Particular attention should therefore be given to identify-ing ways and means of increasing official non-conces-sional flows to developing countries, particularly forinfrastructure and similar investments that might serve ascatalysts for private sector financing.
Despite progress over the years, external debt contin-ues to constrain development in many countries and topresent new challenges to the international community.Progress in implementing the enhanced Heavily IndebtedPoor Countries (HIPC) initiative has proven to be slow,and even those countries that have completed the processhave not necessarily received sufficient relief to fullyremove the obstacle that external debt presents for theirdevelopment. Further efforts need to be made to ensurethat this initiative achieves its intended result of ensuringthat the external debt burden of each of the poorest coun-tries is made sustainable as soon as possible. Thisrequires providing further support to ensure that countriesare able to fulfill the procedural requirements; furtherconsideration of the amount of relief required to ensurethat the process results in each country’s achieving a sus-tainable external debt position; the full and prompt provi-sion of the necessary financial resources by developedcountries and international institutions; and, last but notleast, ensuring that new financial flows to these countriesare provided on a grant basis so that they do not face newexternal debt problems in future.
The continued periodic eruption of financial crisesalso testifies to the continuing lack of adequate arrange-ments for dealing with the external debt problems of non-HIPC countries. Incremental progress continues to be
made, most recently with the more widespread use of col-lective action clauses (CACs) in bond issuances by devel-oping countries and the refinement of arrangements forthe rescheduling of official bilateral debt by the ParisClub. Nevertheless, further work is required to ensurethat resources are available to respond to prospectivefinancial crises where appropriate,
The very limited progress in the global trade negotia-tions at the Fifth Ministerial Conference of the WorldTrade Organization in Cancún in September 2003 was asetback, tempered only by the apparently universalrecognition that reviving the negotiations is indispensa-ble. Given the slow and discouraging start, the successfulcompletion of the Doha programme will require a highdegree of political determination on the part of all coun-tries to deliver on the commitment to make these negoti-ations a “development round”. From a shorter-term per-
spective, they should also be seen in the context of thecurrent need to provide a boost to confidence that willsustain the present global economic recovery.
Independently of the adjustments that are required orwill occur in response to the global imbalances, the worldeconomy is in a process of rapid change, driven by thenew political economy that has evolved over the pastdecade or so, new technologies and the emergence of newactors. Such change will bring benefits to the world atlarge over the longer term, but it is also likely to create asuccession of short-term economic difficulties for differ-ent parties. Because of the intensified interdependencethat now characterizes the world economy, internationalcooperation, most particularly in the areas of internation-al trade and finance, will continue to be central to ensur-ing that the inevitable short-term difficulties of adjust-ment and change do not derail longer-term progress.
W O R L D E C O N O M I C S I T U A T I O N A N D P R O S P E C T S 2 0 0 414
1 See World Economic and Social Survey 2003 (United Nations publication, SalesNo. E.03.II.C.1).
2 See Chapter III for a more detailed economic analysis of each of the main countrygroupings.
3 See Chapter II for a review of developments in international trade and finance. 4 For the development of this approach, see Maurice Obstfeld and Kenneth Rogoff,
Foundations of International Macroeconomics (MIT Press, Cambridge, Massachu-setts, and London, England, 1996).
5 For a historical review and analysis of current-account adjustment in manycountries, see Sebastian Edwards, “Current Account Imbalances: History,Trends, and Adjustment Mechanisms”, Fourth Annual IMF ResearchConference, November 6-7 2003 (www.imf.org/external/pubs/ft/staffp/2003/00-00/arc.htm).
6 See, for example, IMF, World Economic Outlook, May 2000, pp. 40-42, and PingfanHong, “Global implications of the United States trade deficit adjustment”, DESADiscussion Paper No. 17, United Nations, 2001.
7 See, for example, World Economic and Social Survey 2001 (United Nations publi-cation, Sales No.E.O1.II.C.1), pp. 23-24.
8 See José Antonio Ocampo, “Developing countries’ anti-cyclical policy in a global-ized world” in Amitava Dutt and Jaime Ros (eds.), Development Economics andStructuralist Macroeconomics: Essays in honour of Lance Taylor (Edward Elgar,Aldershot, U.K., 2003).
9 See, for example, World Bank, “Supporting Sound Policies with Adequate andAppropriate Financing”, Development Committee document DC2002-0016(http://siteresources.worldbank.org/DEVCOMMINT/Documentation/20127712/DC2003-0016(E)-Financing.pdf).
Notes
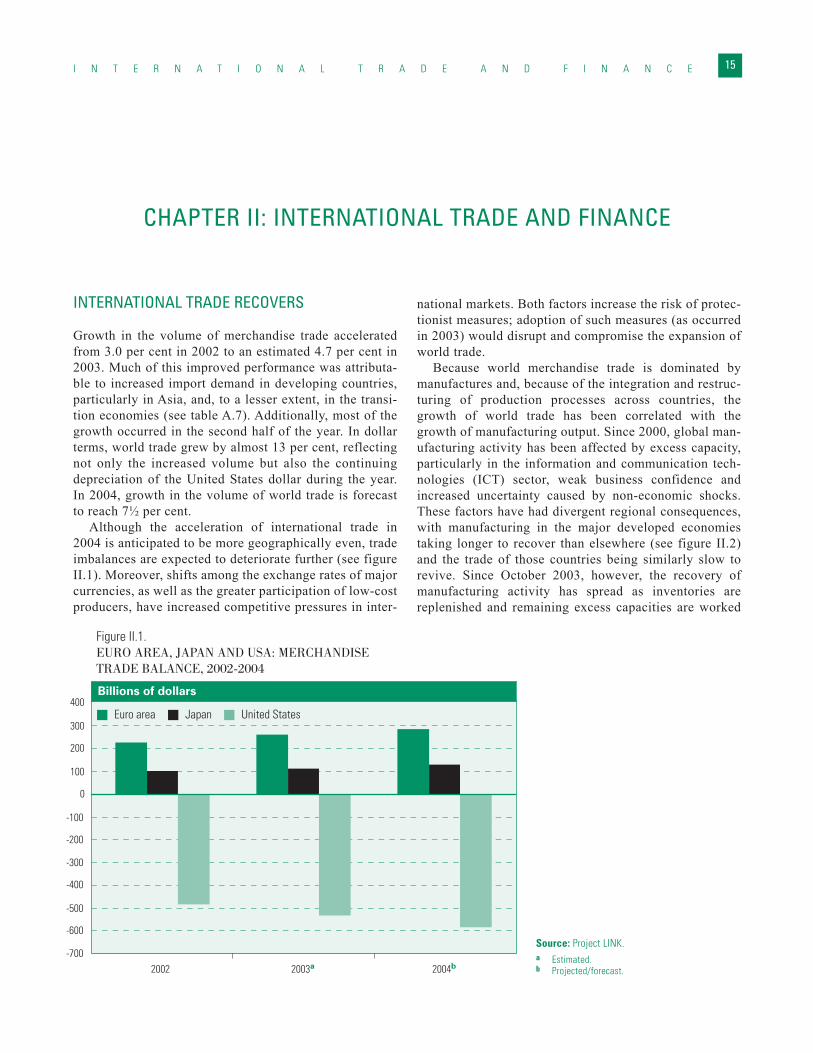
INTERNATIONAL TRADE RECOVERS
Growth in the volume of merchandise trade acceleratedfrom 3.0 per cent in 2002 to an estimated 4.7 per cent in2003. Much of this improved performance was attributa-ble to increased import demand in developing countries,particularly in Asia, and, to a lesser extent, in the transi-tion economies (see table A.7). Additionally, most of thegrowth occurred in the second half of the year. In dollarterms, world trade grew by almost 13 per cent, reflectingnot only the increased volume but also the continuingdepreciation of the United States dollar during the year.In 2004, growth in the volume of world trade is forecastto reach 7½ per cent.
Although the acceleration of international trade in2004 is anticipated to be more geographically even, tradeimbalances are expected to deteriorate further (see figureII.1). Moreover, shifts among the exchange rates of majorcurrencies, as well as the greater participation of low-costproducers, have increased competitive pressures in inter-
national markets. Both factors increase the risk of protec-tionist measures; adoption of such measures (as occurredin 2003) would disrupt and compromise the expansion ofworld trade.
Because world merchandise trade is dominated bymanufactures and, because of the integration and restruc-turing of production processes across countries, thegrowth of world trade has been correlated with thegrowth of manufacturing output. Since 2000, global man-ufacturing activity has been affected by excess capacity,particularly in the information and communication tech-nologies (ICT) sector, weak business confidence andincreased uncertainty caused by non-economic shocks.These factors have had divergent regional consequences,with manufacturing in the major developed economiestaking longer to recover than elsewhere (see figure II.2)and the trade of those countries being similarly slow torevive. Since October 2003, however, the recovery ofmanufacturing activity has spread as inventories arereplenished and remaining excess capacities are worked
I N T E R N A T I O N A L T R A D E A N D F I N A N C E 15
CHAPTER II: INTERNATIONAL TRADE AND FINANCE
Figure II.1.EURO AREA, JAPAN AND USA: MERCHANDISE TRADE BALANCE, 2002-2004
Billions of dollars
Euro area Japan United States
-700
-600
-500
-400
-300
-200
-100
0
100
200
300
400
2002 2003a 2004b
Source: Project LINK.a Estimated.b Projected/forecast.
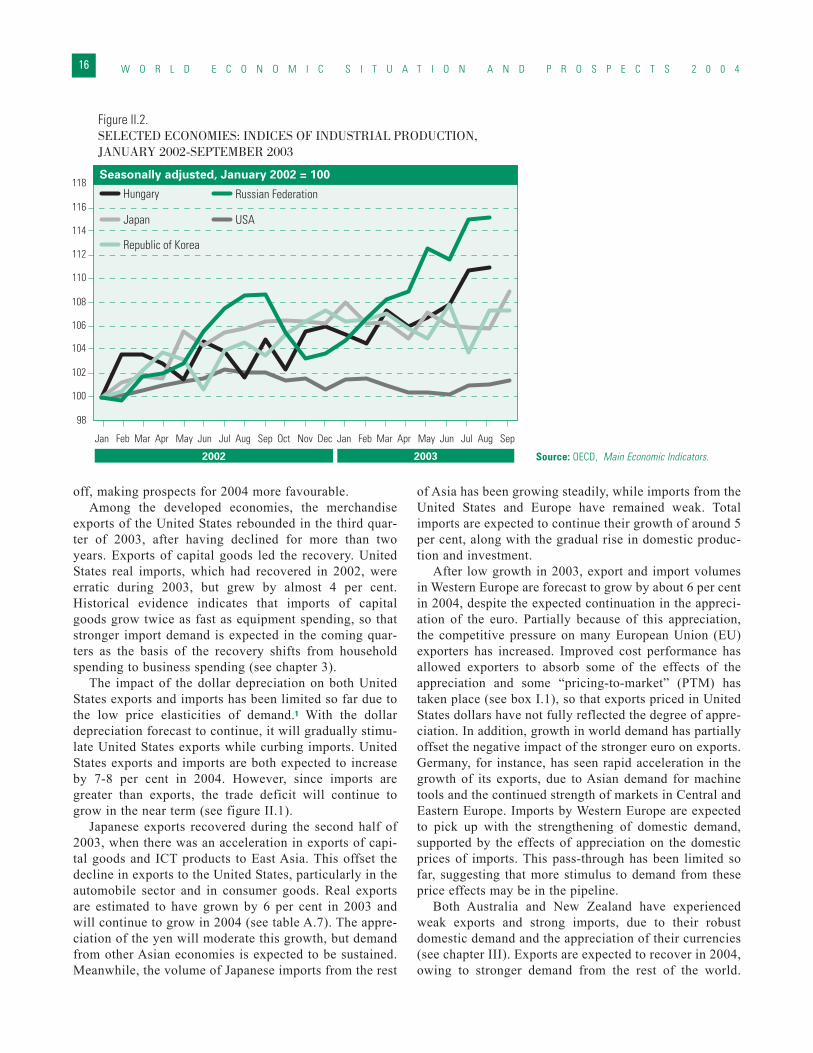
off, making prospects for 2004 more favourable.Among the developed economies, the merchandise
exports of the United States rebounded in the third quar-ter of 2003, after having declined for more than twoyears. Exports of capital goods led the recovery. UnitedStates real imports, which had recovered in 2002, wereerratic during 2003, but grew by almost 4 per cent.Historical evidence indicates that imports of capitalgoods grow twice as fast as equipment spending, so thatstronger import demand is expected in the coming quar-ters as the basis of the recovery shifts from householdspending to business spending (see chapter 3).
The impact of the dollar depreciation on both UnitedStates exports and imports has been limited so far due tothe low price elasticities of demand.1 With the dollardepreciation forecast to continue, it will gradually stimu-late United States exports while curbing imports. UnitedStates exports and imports are both expected to increaseby 7-8 per cent in 2004. However, since imports aregreater than exports, the trade deficit will continue togrow in the near term (see figure II.1).
Japanese exports recovered during the second half of2003, when there was an acceleration in exports of capi-tal goods and ICT products to East Asia. This offset thedecline in exports to the United States, particularly in theautomobile sector and in consumer goods. Real exportsare estimated to have grown by 6 per cent in 2003 andwill continue to grow in 2004 (see table A.7). The appre-ciation of the yen will moderate this growth, but demandfrom other Asian economies is expected to be sustained.Meanwhile, the volume of Japanese imports from the rest
of Asia has been growing steadily, while imports from theUnited States and Europe have remained weak. Totalimports are expected to continue their growth of around 5per cent, along with the gradual rise in domestic produc-tion and investment.
After low growth in 2003, export and import volumesin Western Europe are forecast to grow by about 6 per centin 2004, despite the expected continuation in the appreci-ation of the euro. Partially because of this appreciation,the competitive pressure on many European Union (EU)exporters has increased. Improved cost performance hasallowed exporters to absorb some of the effects of theappreciation and some “pricing-to-market” (PTM) hastaken place (see box I.1), so that exports priced in UnitedStates dollars have not fully reflected the degree of appre-ciation. In addition, growth in world demand has partiallyoffset the negative impact of the stronger euro on exports.Germany, for instance, has seen rapid acceleration in thegrowth of its exports, due to Asian demand for machinetools and the continued strength of markets in Central andEastern Europe. Imports by Western Europe are expectedto pick up with the strengthening of domestic demand,supported by the effects of appreciation on the domesticprices of imports. This pass-through has been limited sofar, suggesting that more stimulus to demand from theseprice effects may be in the pipeline.
Both Australia and New Zealand have experiencedweak exports and strong imports, due to their robustdomestic demand and the appreciation of their currencies(see chapter III). Exports are expected to recover in 2004,owing to stronger demand from the rest of the world.
W O R L D E C O N O M I C S I T U A T I O N A N D P R O S P E C T S 2 0 0 416
Figure II.2.SELECTED ECONOMIES: INDICES OF INDUSTRIAL PRODUCTION, JANUARY 2002-SEPTEMBER 2003
Seasonally adjusted, January 2002 = 100
2002 2003
Jan Feb Mar Apr May Jun Jul Aug Sep Oct Nov Dec Jan Feb Mar Apr May Jun Jul Aug Sep
Russian Federation
USA
Republic of Korea
Hungary
Japan
98
100
102
104
106
108
110
112
114
116
118
Source: OECD, Main Economic Indicators.
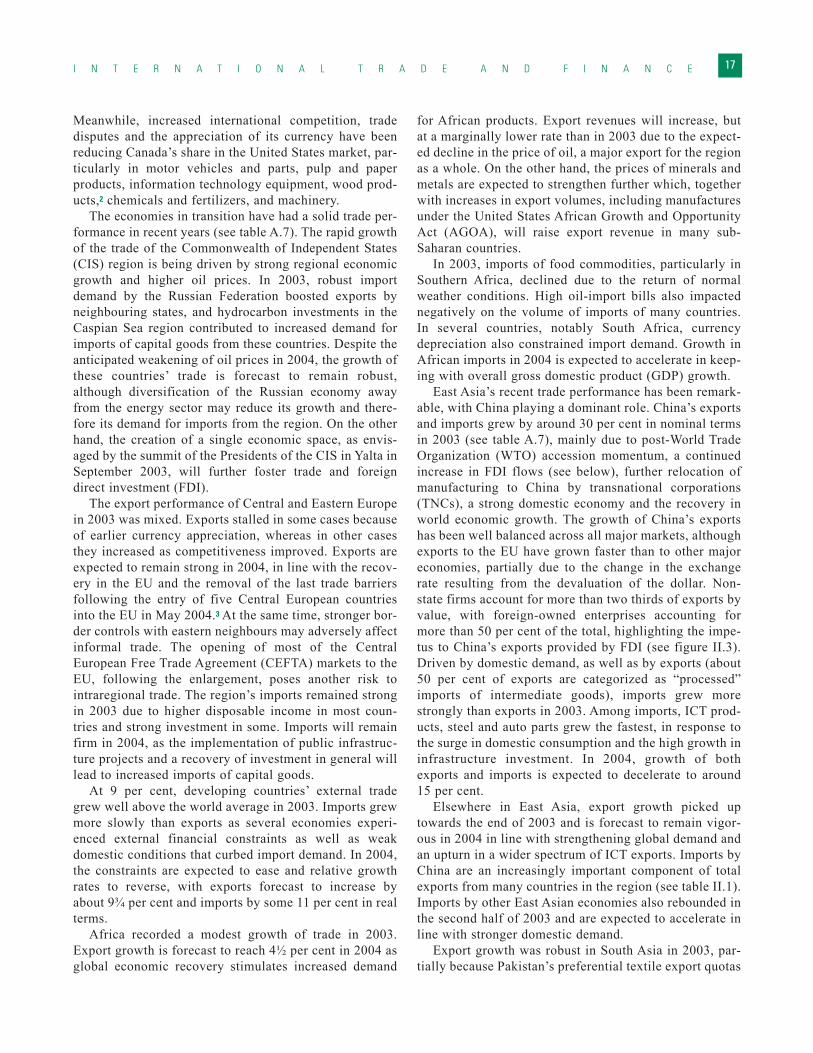
Meanwhile, increased international competition, tradedisputes and the appreciation of its currency have beenreducing Canada’s share in the United States market, par-ticularly in motor vehicles and parts, pulp and paperproducts, information technology equipment, wood prod-ucts,2 chemicals and fertilizers, and machinery.
The economies in transition have had a solid trade per-formance in recent years (see table A.7). The rapid growthof the trade of the Commonwealth of Independent States(CIS) region is being driven by strong regional economicgrowth and higher oil prices. In 2003, robust importdemand by the Russian Federation boosted exports byneighbouring states, and hydrocarbon investments in theCaspian Sea region contributed to increased demand forimports of capital goods from these countries. Despite theanticipated weakening of oil prices in 2004, the growth ofthese countries’ trade is forecast to remain robust,although diversification of the Russian economy awayfrom the energy sector may reduce its growth and there-fore its demand for imports from the region. On the otherhand, the creation of a single economic space, as envis-aged by the summit of the Presidents of the CIS in Yalta inSeptember 2003, will further foster trade and foreigndirect investment (FDI).
The export performance of Central and Eastern Europein 2003 was mixed. Exports stalled in some cases becauseof earlier currency appreciation, whereas in other casesthey increased as competitiveness improved. Exports areexpected to remain strong in 2004, in line with the recov-ery in the EU and the removal of the last trade barriersfollowing the entry of five Central European countriesinto the EU in May 2004.3 At the same time, stronger bor-der controls with eastern neighbours may adversely affectinformal trade. The opening of most of the CentralEuropean Free Trade Agreement (CEFTA) markets to theEU, following the enlargement, poses another risk tointraregional trade. The region’s imports remained strongin 2003 due to higher disposable income in most coun-tries and strong investment in some. Imports will remainfirm in 2004, as the implementation of public infrastruc-ture projects and a recovery of investment in general willlead to increased imports of capital goods.
At 9 per cent, developing countries’ external tradegrew well above the world average in 2003. Imports grewmore slowly than exports as several economies experi-enced external financial constraints as well as weakdomestic conditions that curbed import demand. In 2004,the constraints are expected to ease and relative growthrates to reverse, with exports forecast to increase byabout 9¾ per cent and imports by some 11 per cent in realterms.
Africa recorded a modest growth of trade in 2003.Export growth is forecast to reach 4½ per cent in 2004 asglobal economic recovery stimulates increased demand
for African products. Export revenues will increase, butat a marginally lower rate than in 2003 due to the expect-ed decline in the price of oil, a major export for the regionas a whole. On the other hand, the prices of minerals andmetals are expected to strengthen further which, togetherwith increases in export volumes, including manufacturesunder the United States African Growth and OpportunityAct (AGOA), will raise export revenue in many sub-Saharan countries.
In 2003, imports of food commodities, particularly inSouthern Africa, declined due to the return of normalweather conditions. High oil-import bills also impactednegatively on the volume of imports of many countries.In several countries, notably South Africa, currencydepreciation also constrained import demand. Growth inAfrican imports in 2004 is expected to accelerate in keep-ing with overall gross domestic product (GDP) growth.
East Asia’s recent trade performance has been remark-able, with China playing a dominant role. China’s exportsand imports grew by around 30 per cent in nominal termsin 2003 (see table A.7), mainly due to post-World TradeOrganization (WTO) accession momentum, a continuedincrease in FDI flows (see below), further relocation ofmanufacturing to China by transnational corporations(TNCs), a strong domestic economy and the recovery inworld economic growth. The growth of China’s exportshas been well balanced across all major markets, althoughexports to the EU have grown faster than to other majoreconomies, partially due to the change in the exchangerate resulting from the devaluation of the dollar. Non-state firms account for more than two thirds of exports byvalue, with foreign-owned enterprises accounting formore than 50 per cent of the total, highlighting the impe-tus to China’s exports provided by FDI (see figure II.3).Driven by domestic demand, as well as by exports (about50 per cent of exports are categorized as “processed”imports of intermediate goods), imports grew morestrongly than exports in 2003. Among imports, ICT prod-ucts, steel and auto parts grew the fastest, in response tothe surge in domestic consumption and the high growth ininfrastructure investment. In 2004, growth of bothexports and imports is expected to decelerate to around15 per cent.
Elsewhere in East Asia, export growth picked uptowards the end of 2003 and is forecast to remain vigor-ous in 2004 in line with strengthening global demand andan upturn in a wider spectrum of ICT exports. Imports byChina are an increasingly important component of totalexports from many countries in the region (see table II.1).Imports by other East Asian economies also rebounded inthe second half of 2003 and are expected to accelerate inline with stronger domestic demand.
Export growth was robust in South Asia in 2003, par-tially because Pakistan’s preferential textile export quotas
I N T E R N A T I O N A L T R A D E A N D F I N A N C E 17
to the EU and the United States were expanded. They areunlikely to increase further and, more generally, competi-tion from low-cost producers, inadequate infrastructureand other structural weaknesses will continue to weigh onthe region’s export growth. The region’s imports alsogrew strongly in 2003 in line with rising domesticdemand and increasing demand for inputs to exportindustries. Import growth is likely to strengthen in 2004and lead to worsening trade balances in most countries.However, the effect of this deterioration on the current-account balance will be mitigated by lower prices for oil
imports and higher prices for exports of non-oil com-modities.
Western Asia’s trade performance is closely tied todevelopments in the world oil market and political stabil-ity in the region. The rise in oil prices boosted theregion’s export revenues by about 12 per cent in 2003. Involume terms, however, the region’s oil-importing coun-tries performed better than the oil-exporting countries asIsraeli exports recovered and Turkey sustained strongexport performance. Meanwhile, the region’s importgrowth slowed to 3.5 per cent in real terms in 2003 from
W O R L D E C O N O M I C S I T U A T I O N A N D P R O S P E C T S 2 0 0 418
Figure II.3.CHINA: FOREIGN DIRECT INVESTMENT INFLOWS, EXPORTS AND IMPORTS, 1990-2002
Billions of dollars
Exports
Imports
FDI flows (right axis)
0
50
100
150
200
250
300
350
1997 1998 1999 2000 2001 2002
20
30
40
50
60
70
80
90
Sources: IMF, International Financial Statistics,and UNCTAD, FDI database.
Table II.1.EXPORTS TO CHINA BY SELECTED ASIAN COUNTRIES,1998-SECOND QUARTER 2003
First SecondAverage quarter quarter
1998-2000 2001 2002 2003 2003
India 1.6 3.5 4.2 4.9 4.2 Indonesia 4.1 3.9 5.1 5.9 4.9 Japan 5.7 7.7 9.6 11.2 11.0 Korea, Republic of 9.8 12.1 14.7 17.7 14.7 Philippines 1.5 2.5 3.9 4.2 3.6 Singapore 3.7 4.4 5.5 6.1 6.7 Thailand 3.5 4.4 5.2 7.0 6.8
Memorandum item:World 5.6 6.5 7.3 6.7 7.3
PPeerrcceennttaaggee ooff ttoottaall mmeerrcchhaannddiissee eexxppoorrttss
Source: IMF, Direction of Trade Statistics.
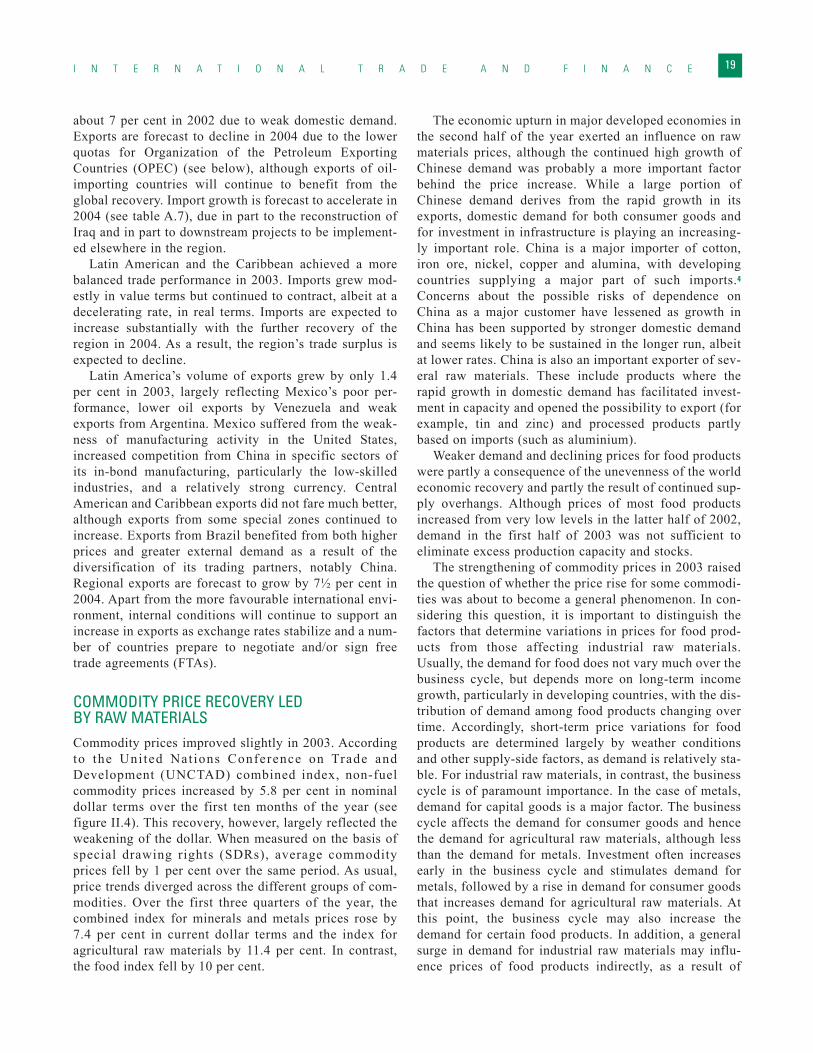
about 7 per cent in 2002 due to weak domestic demand.Exports are forecast to decline in 2004 due to the lowerquotas for Organization of the Petroleum ExportingCountries (OPEC) (see below), although exports of oil-importing countries will continue to benefit from theglobal recovery. Import growth is forecast to accelerate in2004 (see table A.7), due in part to the reconstruction ofIraq and in part to downstream projects to be implement-ed elsewhere in the region.
Latin American and the Caribbean achieved a morebalanced trade performance in 2003. Imports grew mod-estly in value terms but continued to contract, albeit at adecelerating rate, in real terms. Imports are expected toincrease substantially with the further recovery of theregion in 2004. As a result, the region’s trade surplus isexpected to decline.
Latin America’s volume of exports grew by only 1.4per cent in 2003, largely reflecting Mexico’s poor per-formance, lower oil exports by Venezuela and weakexports from Argentina. Mexico suffered from the weak-ness of manufacturing activity in the United States,increased competition from China in specific sectors ofits in-bond manufacturing, particularly the low-skilledindustries, and a relatively strong currency. CentralAmerican and Caribbean exports did not fare much better,although exports from some special zones continued toincrease. Exports from Brazil benefited from both higherprices and greater external demand as a result of thediversification of its trading partners, notably China.Regional exports are forecast to grow by 7½ per cent in2004. Apart from the more favourable international envi-ronment, internal conditions will continue to support anincrease in exports as exchange rates stabilize and a num-ber of countries prepare to negotiate and/or sign freetrade agreements (FTAs).
COMMODITY PRICE RECOVERY LED BY RAW MATERIALSCommodity prices improved slightly in 2003. Accordingto the United Nat ions Conference on Trade andDevelopment (UNCTAD) combined index, non-fuelcommodity prices increased by 5.8 per cent in nominaldollar terms over the first ten months of the year (seefigure II.4). This recovery, however, largely reflected theweakening of the dollar. When measured on the basis ofspecial drawing rights (SDRs), average commodityprices fell by 1 per cent over the same period. As usual,price trends diverged across the different groups of com-modities. Over the first three quarters of the year, thecombined index for minerals and metals prices rose by7.4 per cent in current dollar terms and the index foragricultural raw materials by 11.4 per cent. In contrast,the food index fell by 10 per cent.
The economic upturn in major developed economies inthe second half of the year exerted an influence on rawmaterials prices, although the continued high growth ofChinese demand was probably a more important factorbehind the price increase. While a large portion ofChinese demand derives from the rapid growth in itsexports, domestic demand for both consumer goods andfor investment in infrastructure is playing an increasing-ly important role. China is a major importer of cotton,iron ore, nickel, copper and alumina, with developingcountries supplying a major part of such imports.4
Concerns about the possible risks of dependence onChina as a major customer have lessened as growth inChina has been supported by stronger domestic demandand seems likely to be sustained in the longer run, albeitat lower rates. China is also an important exporter of sev-eral raw materials. These include products where therapid growth in domestic demand has facilitated invest-ment in capacity and opened the possibility to export (forexample, tin and zinc) and processed products partlybased on imports (such as aluminium).
Weaker demand and declining prices for food productswere partly a consequence of the unevenness of the worldeconomic recovery and partly the result of continued sup-ply overhangs. Although prices of most food productsincreased from very low levels in the latter half of 2002,demand in the first half of 2003 was not sufficient toeliminate excess production capacity and stocks.
The strengthening of commodity prices in 2003 raisedthe question of whether the price rise for some commodi-ties was about to become a general phenomenon. In con-sidering this question, it is important to distinguish thefactors that determine variations in prices for food prod-ucts from those affecting industrial raw materials.Usually, the demand for food does not vary much over thebusiness cycle, but depends more on long-term incomegrowth, particularly in developing countries, with the dis-tribution of demand among food products changing overtime. Accordingly, short-term price variations for foodproducts are determined largely by weather conditionsand other supply-side factors, as demand is relatively sta-ble. For industrial raw materials, in contrast, the businesscycle is of paramount importance. In the case of metals,demand for capital goods is a major factor. The businesscycle affects the demand for consumer goods and hencethe demand for agricultural raw materials, although lessthan the demand for metals. Investment often increasesearly in the business cycle and stimulates demand formetals, followed by a rise in demand for consumer goodsthat increases demand for agricultural raw materials. Atthis point, the business cycle may also increase thedemand for certain food products. In addition, a generalsurge in demand for industrial raw materials may influ-ence prices of food products indirectly, as a result of
I N T E R N A T I O N A L T R A D E A N D F I N A N C E 19
W O R L D E C O N O M I C S I T U A T I O N A N D P R O S P E C T S 2 0 0 420
Figure II.4.PRICES OF PRIMARY COMMODITIES AND MANUFACTURES, 1999-2003 (Indices of prices in United States dollars, 1995 = 100)
Manufactures
Non-fuel primary commodities
Food
Vegetable oilseeds and oilsTropical beverages
Minerals and metalsAgricultural raw materials
40
60
80
100
120
20001999 2001 2002 2003
40
60
80
100
120
1999 2000 2001 2002 2003
40
60
80
100
120
1999 2000 2001 2002 2003
40
60
80
100
120
1999 2000 2001 2002 2003
40
60
80
100
120
1999 2000 2001 2002 2003
40
60
80
100
120
1999 2000 2001 2002 2003
Sources: UN/DESA and UNCTAD, Monthly Commodity Price Bulletin.
speculation or general market sentiment, particularly ifinflation is expected to accelerate.
As noted in chapter I, the global economic upturn wasdelayed by a number of factors including excess capaci-ty—and hence weak investment—in several sectors in thedeveloped economies. Meanwhile, investment in Asia,particularly China, was growing rapidly. The resultingAsian demand for investment goods led to reductions inmetal stocks, and this coincided with the external upturnin the major industrial economies. At this point, aroundOctober 2003, prices of almost all metals started risingrapidly. In view of the low stock levels for most metalsand the expectation that industrial production willincrease further in 2004, the price boom for these com-modities seems likely to continue. For agricultural com-modities, the situation is less clear: although the econom-ic upturn is likely to have a positive influence on theprices of these products, the extent of this influence willdepend mainly on supply-side factors, including theweather, as well as on stock levels, which vary from oneproduct to another.
Finally, some of the factors underlying the rise inprices were not directly related to market fundamentals.For instance, alternative investment funds, includinghedge funds, as well as private equity and property funds,were active in several commodity sectors, temporarilyswitching from traditional assets, such as shares andbonds, to positions in such commodities as coffee orcocoa5. With the economic recovery in the United Statesand, to a lesser extent, in Japan and Europe, the impor-tance of this phenomenon may decline as stock marketsbecome more attractive to investors.
Agricultural commodities
The trend of falling coffee prices was reversed in 2002,but prices have not yet recovered from the fall of theprevious five years. According to UNCTAD estimates, ifthe prices of coffee had remained at their 1998 levelsbetween 1999 and 2002, coffee-producing countrieswould have earned US$19 billion more than they did.The drop in income led some producers to temporarilywithdraw from the market. Between the crop years 2001-2002 and 2002-2003, Central American productiondecreased on average by 9.1 per cent. Similarly, therewere large cutbacks in such other countr ies asCameroon, Kenya and Uganda. Since coffee productionin these countries mainly takes place on small farms, thefall in production and prices has had severe impacts onrural income levels. The decline in supply from thesecountries might partly explain the modest strengtheningof prices in 2003. However, excess supply still weighson the market due to production increases in Brazil. Inall, world coffee production increased by 8.2 per cent
and world stocks by 4.9 per cent, while consumptiongrew by only 2.3 per cent during the crop season of2002-2003 so that significant price increases should notbe expected.
The price of tea rose by 7 per cent over the first threequarters of 2003, mainly driven by increasing imports bythe EU and CIS. However, rising Indian production, com-bined with sluggish imports from Western Asia, mighthave a dampening effect on the market in 2004.
Cocoa prices experienced a short-lived peak at the endof 2002 and the beginning of 2003 (see table A.8) as aresult of concern about political developments in Côted’Ivoire, demonstrating the importance of supply-sidefactors. However, since then, cocoa prices have fallensteadily because of the rise of 8.4 per cent in world cocoaproduction in 2002-2003. The surge in supply was drivenmainly by increasing production in Western Africa, sincethe world’s third largest producer, Indonesia, was affect-ed by drought in 2003.
Cereal prices increased in the second half of 2003because of reduced production in the northern hemi-sphere summer, due to adverse weather conditions inmajor producer countries. It is estimated that globalwheat production in 2003 was around 2 per cent less thanin the previous year. EU wheat production, for instance,is estimated to have decreased by 11 per cent. To coun-teract this, the EU reduced the set-aside rate6 by 10 percent to boost production in 2004. The fall in productionmay have adverse consequences on net food-importingdeveloping countries in the short term.
The price of rice rose slightly in 2003. Althoughfavourable weather conditions and an expansion of plant-ed areas contributed to an increase in rice production,especially in India, world production is forecast to beinsufficient to match demand. In addition, Chinese pro-duction is expected to fall due to a reduction in plantedareas. World stocks are anticipated to decrease further in2003-2004 to reach their lowest level since 1987.
The price of sugar continued to fall in 2003, and mar-ket fundamentals, particularly booming Brazilian produc-tion, cast a gloom on the near future. Despite the negativeimpact of poor climatic conditions in China and the EU,different sources, including the International SugarOrganization, anticipate that world sugar stocks willreach 70 million tons by the end of 2004, equivalent tosix months of consumption, and will maintain the down-ward pressure on prices.
Banana prices fell by 44 per cent during the first threequarters of 2003. The re-emergence of such producers asBrazil and China, combined with competition from low-cost producers such as the Philippines, contributed to anincrease in supply. Since the price elasticity of demandfor bananas is low, the lower price did not lead to any sig-nificant increase in demand.
I N T E R N A T I O N A L T R A D E A N D F I N A N C E 21
The prices of vegetable oilseeds and oils continued torecover in 2003 (see figure II.4). The prices of someproducts, including soybean oil and groundnut oil,increased due to growing demand, including massiveimports of soybean oil by such countries as China. Overthe past fifteen years, the growth of Chinese demand hasturned the country from a net exporter into a net importerof oilseeds and oil meals, as well as of vegetable oils. Forsoybeans, while output in Argentina and Brazil rose, pro-duction in the United States declined for a second con-secutive year. World production of soybeans is expectedto grow by 2 per cent in the 2003-2004 crop year.
Among agricultural raw materials, cotton prices rosesignificantly in 2003, particularly for coarser varieties,mainly due to a fall in Chinese production, which led to anincrease in imports. Adverse weather conditions in Chinawere the foremost factor in the fall in production, leadingto an increase in the Chinese import quota from 856,250tonnes in 2002 to 1.36 million tonnes in 2003.7 The surgein price was intensified by the influence of hedge fundsand speculators that were reported to hold close to half theopen positions on the New York Board of Trade (NYBOT)at the beginning of October 2003. Supply and demandconditions, including no expected changes in subsidypolicies or in the competitive position of cotton vis-à-vissynthetic fibres, suggest that prices will remain largelyunchanged until the beginning of 2004.
Meanwhile, rubber prices increased, primarily due tocoordinated supply management by Indonesia, Malaysiaand Thailand. These three countries account for roughly80 per cent of world production and their joint launch ofthe newly-created International Rubber CompanyLimited, designed to influence rubber price movements,appears to have had a positive impact on prices.
Minerals, ores and metals
Excess capacity continues to be a problem for some met-als, while shortfalls developed for others during 2003. Asa result, prices recovered on average for this group ofcommodities (see figure II.4). A return to higher economicgrowth could lead to the emergence of additional short-falls over the next few years. China’s demand for mineralsand metals continues to grow and has become the mostdynamic element of otherwise relatively calm markets.Developments regarding China are now given consider-able weight by market observers and exercise a stronginfluence on prices. Nonetheless, China’s share of globalconsumption of some metals is still relatively small.
Iron ore production increased in all major producingcountries, supported by strong demand from the steelindustry in almost all countries. Chinese demand, in par-ticular, was a major factor: iron ore imports in the first halfof the year increased by 30 per cent. Steel demand is fore-cast to increase by almost 6 per cent in 2004, which
implies continued high growth rates in iron ore demand.Concerns have been raised about the ability of iron oremining companies to respond to the rapid growth indemand. Most of the additional ore supply in 2003 camefrom existing mines now operating at full capacity, withport and shipping facilities being expanded and stocksbeing drawn down. More projects therefore need to comeon-stream to meet the expected rise in iron ore demand in2004. However, large capacity expansions cannot beexpected before 2005. Additionally, a shortage of shippingcapacity appeared in 2003. Ocean freight rates for iron oreskyrocketed and became more expensive than the oreitself. In view of the depreciation of the United States dol-lar and the increasingly tight supply situation, further priceincreases in 2004 appear likely and will, together withhigher freight rates, raise the costs of steel producers.
The rise in nickel prices continued in 2003, fuelled byrobust demand growth and limited additions to supply,resulting in a growing gap between supply and demand.Growth of Chinese demand continues to account for amajor portion of the global growth in demand. Supplydisruptions in Canada supported higher prices, whichwere particularly significant towards the end of the year.The market is expected to face significant shortfalls atleast in 2004 and 2005. Expected additions to capacity inCanada and Indonesia, for instance, will increase supplyby 2006/2007, but other sources of capacity expansion inthe short term are limited. Additionally, small additions tocapacity elsewhere will be offset by expected reductionsdue to the depletion of reserves.
Primary aluminium production increased by more than3 per cent during the first three quarters of 2003. As con-sumption kept pace and stocks remained stable (althoughstill at historically high levels), prices increased. On theother hand, the balance between supply and demand is con-siderably tighter in the case of alumina, the raw materialfor aluminium. The re-emergence of Chinese aluminiumproduction, and resulting growth in alumina imports, hasled to a deficit of alumina and rising prices worldwide.Previously closed alumina refineries restarted productionin 2003 and new projects are being speeded up. The evolv-ing deficit is likely to affect prices in medium-term con-tracts. Alumina prices are usually set as a percentage of theLondon Market Exchange (LME) quotation for aluminium.Prices have traditionally been 12-13 per cent of the alu-minium price, but may now move to 15-16 per cent or evenhigher. Since the lead time for additions to capacity toenter into production is around three to four years—depending on whether it is an extension to existing capac-ity or a new refinery—and there are few new projectsunderway, the deficit is likely to persist for the next fewyears. Meanwhile, demand for aluminium is likely to risefaster in 2004, leading to further tightness of the aluminamarket as well as to rising aluminium prices.
The price of copper increased rapidly towards the end
W O R L D E C O N O M I C S I T U A T I O N A N D P R O S P E C T S 2 0 0 422
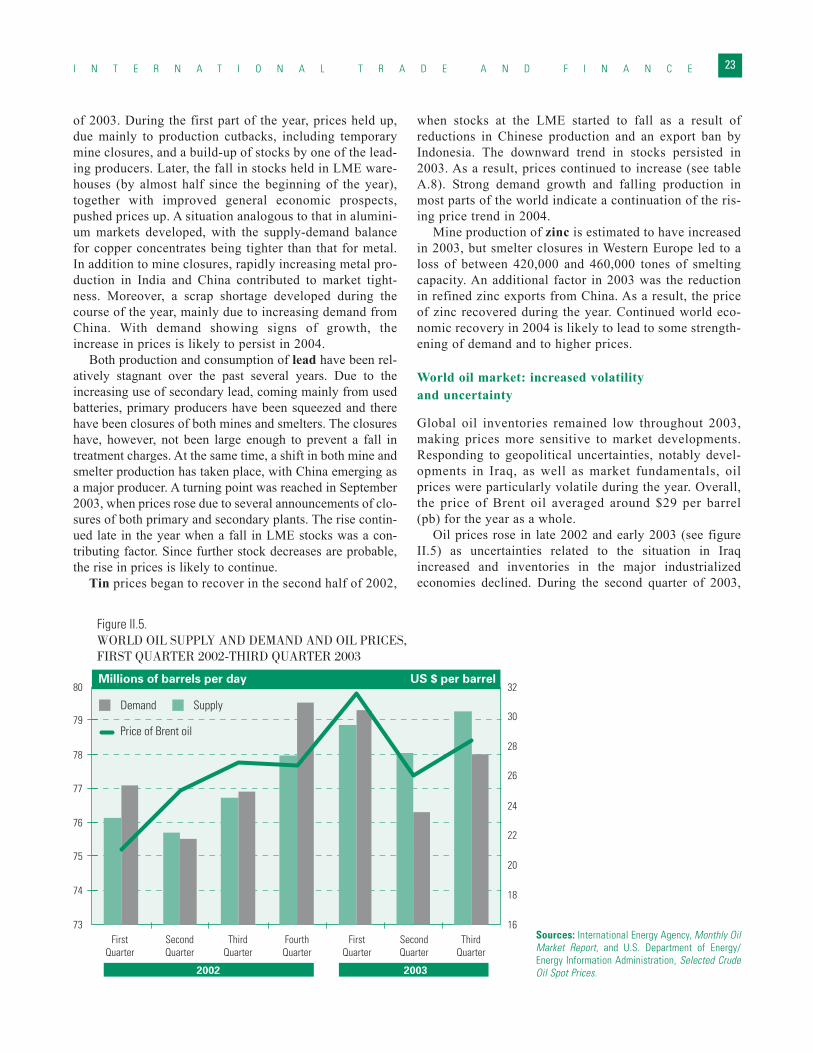
of 2003. During the first part of the year, prices held up,due mainly to production cutbacks, including temporarymine closures, and a build-up of stocks by one of the lead-ing producers. Later, the fall in stocks held in LME ware-houses (by almost half since the beginning of the year),together with improved general economic prospects,pushed prices up. A situation analogous to that in alumini-um markets developed, with the supply-demand balancefor copper concentrates being tighter than that for metal.In addition to mine closures, rapidly increasing metal pro-duction in India and China contributed to market tight-ness. Moreover, a scrap shortage developed during thecourse of the year, mainly due to increasing demand fromChina. With demand showing signs of growth, theincrease in prices is likely to persist in 2004.
Both production and consumption of lead have been rel-atively stagnant over the past several years. Due to theincreasing use of secondary lead, coming mainly from usedbatteries, primary producers have been squeezed and therehave been closures of both mines and smelters. The closureshave, however, not been large enough to prevent a fall intreatment charges. At the same time, a shift in both mine andsmelter production has taken place, with China emerging asa major producer. A turning point was reached in September2003, when prices rose due to several announcements of clo-sures of both primary and secondary plants. The rise contin-ued late in the year when a fall in LME stocks was a con-tributing factor. Since further stock decreases are probable,the rise in prices is likely to continue.
Tin prices began to recover in the second half of 2002,
when stocks at the LME started to fall as a result ofreductions in Chinese production and an export ban byIndonesia. The downward trend in stocks persisted in2003. As a result, prices continued to increase (see tableA.8). Strong demand growth and falling production inmost parts of the world indicate a continuation of the ris-ing price trend in 2004.
Mine production of zinc is estimated to have increasedin 2003, but smelter closures in Western Europe led to aloss of between 420,000 and 460,000 tones of smeltingcapacity. An additional factor in 2003 was the reductionin refined zinc exports from China. As a result, the priceof zinc recovered during the year. Continued world eco-nomic recovery in 2004 is likely to lead to some strength-ening of demand and to higher prices.
World oil market: increased volatility and uncertainty
Global oil inventories remained low throughout 2003,making prices more sensitive to market developments.Responding to geopolitical uncertainties, notably devel-opments in Iraq, as well as market fundamentals, oilprices were particularly volatile during the year. Overall,the price of Brent oil averaged around $29 per barrel(pb) for the year as a whole.
Oil prices rose in late 2002 and early 2003 (see figureII.5) as uncertainties related to the situation in Iraqincreased and inventories in the major industrializedeconomies declined. During the second quarter of 2003,
I N T E R N A T I O N A L T R A D E A N D F I N A N C E 23
Figure II.5.WORLD OIL SUPPLY AND DEMAND AND OIL PRICES, FIRST QUARTER 2002-THIRD QUARTER 2003
Millions of barrels per day US $ per barrel
First Quarter
Second Quarter
Third Quarter
Fourth Quarter
First Quarter
Second Quarter
Third Quarter
2002 2003
SupplyDemand
Price of Brent oil
73
74
75
76
77
78
79
80
16
18
20
22
24
26
28
30
32
Sources: International Energy Agency, Monthly OilMarket Report, and U.S. Department of Energy/Energy Information Administration, Selected CrudeOil Spot Prices.
however, world oil demand weakened, global oil invento-ries increased and oil prices dropped, though remainingwithin the OPEC target band of $22-$28 pb. By the begin-ning of May, oil prices had reached their lowest level forthe year, as major military hostilities ceased in Iraq.Despite the drastic drop in Iraqi oil production, there wasexcess oil supply during the second quarter of 2003, asOPEC and non-OPEC countries increased output to com-pensate for Iraq’s shortfall and calm the markets. After theseasonal weakness in the second quarter of 2003, global oildemand strengthened, supported by economic growth inChina and the United States and the economic recovery inJapan. The situation in Iraq is also contributing toincreased world oil demand, mainly owing to risingdemand from military operations and diesel generators.
For 2003 as whole, world oil supply rose by 3 per centto 78.7 million barrels per day (mbd). Oil demandincreased by 1.7 per cent to 78.6 mbd and is expected toreach 79.6 mbd in 2004. The anticipated increase in sup-ply by non-OPEC countries in 2004 will be sufficient tomatch this increase in demand, while cuts in OPEC out-put, if fully implemented, should accommodate growingIraqi production. Oil prices are forecast to average $25 pbin 2004, as petroleum stocks in industrialized countriesgradually return to more normal levels and uncertaintiesregarding Iraqi output diminish.
The resumption of oil production in Iraq has beenslower than anticipated. In the third quarter of 2003, oilproduction in Iraq averaged 1.1 mbd, significantly lowerthan the pre-war level of about 2.6 mbd. In addition toother difficulties, limited storage capacity and the inabil-ity of Iraq to use its oil transportation facilities due tosecurity problems have forced the country to re-inject apart of its oil production after removing natural gas fordomestic use. Iraqi exports have not recovered as expect-ed either. The country’s main pipeline to the Turkish portof Ceyhan was shut down due to sabotage, and thepipeline to the Gulf is not fully operational because ofrepeated power outages. Oil production in the northernpart of the country has continued to be constrained by thelack of export outlets due to pipeline bottlenecks.Reduced crude oil production has negatively affected thecountry’s oil refining capacity. As a result, Iraq has beenimporting refined products.
Among other OPEC countries, Venezuela had notrestored production to its pre-strike level by the end of2003, producing 2.6 mbd compared to its quota ceiling ofaround 2.9 mbd. Meanwhile, civil strife and political dis-turbances reduced oil production in Nigeria during thesecond and third quarters of 2003.
In September 2003, OPEC countries agreed to cut oilproduction by 900,000 barrels per day (bpd) to 24.5 mbd,starting on 1 November 2003. The cut was aimed at pre-venting a possible oil glut and a slide in prices; pricesremained firm for the remainder of 2003. OPEC countries
met again on 4 December 2003, concerned about possiblelower prices in the second quarter of 2004—usually theweakest period of the year for global oil demand. Theynoted that the strength of the oil price was clouded by theweakness of the dollar (in which oil is priced), which hasbeen eroding oil’s purchasing power. Nonetheless, quotasremained unchanged at about 24.5 mbd for the group as awhole, excluding Iraq.
KEY TRADE POLICY DEVELOPMENTS
Slow progress in World Trade Organization (WTO) negotiations
Multilateral trade negotiations failed to advance in 2003.The Doha Work Programme (DWP), launched at theFourth Ministerial Conference of the World TradeOrganization in Doha, Qatar, in 2001, provided for a mid-term review of progress in the negotiations at the FifthMinisterial Conference of the World Trade Organization, inCancún, Mexico, in September 2003. The Cancún meetingwas also meant to be an occasion for political guidance anddecisions in a number of areas. However, the meeting waslargely unsuccessful in moving the DWP programmeahead.
Process-related issuesThe seeds of the Cancún setback were sown by generalproblems of missing deadlines that had been set at Doha,inadequate treatment of development issues and unfin-ished business and imbalances from the Uruguay Round.On particular areas of negotiation, the key problemswere the slow pace of agricultural reform in developedcountries and inadequate progress on core market accessand development issues.
Leading up to and at Cancún, procedural difficultieswere among the impediments to progress. In addition tothe process overload, particularly for developing coun-tries, these difficulties included the timing of issues andtheir maturity for resolution; procedures relating torecord-keeping and dissemination and to the preparationand transmission of texts; when and how to reflect alter-native views of WTO Members; how to select officers;and how to ensure the inclusiveness of the process at alltimes. There were also expectations in some quarters thatthe Cancún meeting would result in a positive-sum agree-ment on all accounts for all WTO Members, but the link-ages, balances, sequencing and perceived costs and bene-fits were too complex to achieve such an outcome.
The decision-making processes in the WTO have alsobecome more complex and difficult, partially because of thelarger membership (now 148) and the broadened agenda,but also because most participating countries are democra-cies. The prominence of civil society and private sectororganizations, as well as the increasingly important role of
W O R L D E C O N O M I C S I T U A T I O N A N D P R O S P E C T S 2 0 0 424
Parliamentarians, should be seen in this context. The resultis that WTO negotiating dynamics have changed, with theGovernments of both developed and developing countrieshaving to consider political, social and economic interestsand other considerations involving their people and con-stituencies. The negotiations have to take into account theinterests and concerns of all participants, regardless of theirlevel of development, size or share of world trade. In par-ticular, the developing countries are demanding that theircore market access and development concerns be addressedand that they have a real say in decisions that affect theireconomies and peoples.
A number of issue-based alliances have evolved amonggroups of developing countries, for example the Group oftwenty-plus, focusing particularly on agriculture but alsoon non-agricultural market access (NAMA), the groupingof African, Caribbean and Pacific Group of States/ AfricanUnion/least developed countries (ACP/AU/ LDCs) on so-called Singapore issues and the coalition of Benin,Burkina Faso, Chad and Mali regarding cotton. Thesealliances point to a greater assertiveness of developingcountries within the WTO and have thereby strengthenedthe WTO by the redressing the imbalances in countries’negotiating leverage.
Divergent views emerged on the decision-makingprocess. Some contended that there was an imbalancebetween a consensus-based decision-making process,which was inefficient in reaching agreements quickly, onthe one hand, and an effective and time-bound enforce-ment and dispute settlement system, on the other. Othersencouraged further democratization of the decision-mak-ing process of the WTO. Yet others cautioned that anexamination of reforms in the WTO ran the risk of divert-ing attention from the main issues facing the multilateraltrading system, particularly market access and develop-ment issues.
Substantive issues In part because of the procedural reasons outlined above,but also because of substantive differences, progress fol-lowing the launching of the negotiations was slow, withmost intermediate deadlines being missed. Nevertheless,results were achieved in some areas. Agreement wasreached on overall guidelines on accession for leastdeveloped countries (LDCs) and on the special treatmentto be accorded to LDCs in negotiations on services. Atthe end of August 2003, after a number of missed dead-lines, a decision was adopted on trade-related intellectualproperty rights (TRIPS) and public health, aimed atensuring that countries with insufficient or no pharma-ceutical manufacturing capacity have access to medi-cines at affordable prices or low cost. Finally, a numberof new members joined the WTO, including China. Themembership of Cambodia and Nepal, the first LDCs to
join the WTO since its creation, was agreed during theCancún Meeting after long prior negotiations that result-ed in these two countries assuming a higher overall levelof obligations than the original LDC members.
At the Cancún meeting, the key difficulties were in theareas of agriculture, cotton, NAMA and the fourSingapore issues (the relationship between trade andinvestment, trade and competition policy, governmentprocurement and trade facilitation). In addition, therewere a number of development issues emphasized bydeveloping countries, including special and differentialtreatment (SDT) and implementation issues, on whichcommercially meaningful agreement could not bereached.8
In regard to agriculture, effective realization of theDoha provision of substantial improvements in marketaccess, reductions of, with a view to phasing out, allforms of export subsidies, and substantial reductions intrade-distorting domestic support, is pivotal to ensuringthat the DWP is successful in achieving its purpose as a“development round”. While some concessions were pro-posed, developed countries have resisted undertaking thecomprehensive removal of subsidies and other domesticsupport measures that distort global agricultural trade, tothe detriment of most developing countries. Agriculturehas long been excluded from global trade negotiations,and the lack of progress in this area must therefore beviewed as one of the major failures of the CancúnConference.
A particular flashpoint within the negotiations relatedto cotton, in particular the subsidies provided to cottonfarmers in the United States. A number of African cotton-producing countries called for a phasing-out of these sub-sidies, arguing that their cotton farmers were beingthreatened by the resulting depressed world cotton prices.For its part, the United States argued that cotton shouldbe part of the overall negotiations on agriculture.
On NAMA, the revised draft Cuncún Ministerial textproposed a non-linear formula requiring countries, amongother things, to make greater reductions in tariffs abovetheir average rates and smaller reductions in tariffs belowtheir average rates. Developing countries argued that,besides the complexity of this approach, it would result intheir making the largest cuts (since they have the highesttariffs) which, in their view, was inconsistent with theprinciple of less than full reciprocity contained in theDoha Declaration, while entailing substantial adjustmentsin their nascent industrial sectors.
Another area of contention was the so-called Singaporeissues. The Doha Declaration provided that negotiation onthese issues would take place on the basis of a decision tobe taken by explicit consensus at the Fifth MinisterialConference of the WTO on modalities of negotiations, butdeveloping countries have resisted such a broadening of
I N T E R N A T I O N A L T R A D E A N D F I N A N C E 25
the multilateral trade agenda in areas that they view to bewithin the realm of domestic policy. Also to a certaindegree, the attitude of developing countries to theSingapore issues has been conditioned by the lack ofprogress on implementation-related issues, SDT and agri-culture. In addition, in the light of the difficulties they arealready having in implementing commitments from previ-ous rounds of trade negotiations, they anticipate that suchagreements will be burdensome for them. In the negotia-tions, the Chair proposed a differentiated approach, withnegotiations to commence on transparency in governmentprocurement and trade facilitation. However, the meetingwas aborted before any agreement could be finalized.
With a view to breaking the impasse that had evolved,the Cancún Conference instructed the WTO GeneralCouncil to convene “no later than 15 December 2003 totake the action necessary … to move towards a successfuland timely conclusion of the negotiations.”9 The meetingof the WTO General Council on 15 December 2003focused on agriculture, NAMA, cotton and Singaporeissues, but agreements proved elusive and there was noconcrete outcome. The Chairman said, in his closingremarks, that he did not see “the closing of the gapbetween expressions of flexibility, commitment andengagement and a translation of these into new negotiat-ing positions that would allow us to look for commonground or to accommodate the position of others… wehave to narrow the gap between expressions of goodwill,commitment and their translation into negotiating posi-tions.” There was, however, a reconfirmation of a sense ofengagement and a commitment to the DWP, to the multi-lateral trading system and to finishing the round on time.There was a willingness to restart the work of all the nego-tiating groups and other bodies, including the TradeNegotiations Committee, which have to deal with theDoha agenda, in early 2004, on the understanding thatrestarting this work does not in any way mean losing anoverview of the process or a sense of the horizontal inte-gration of issues. There were informal discussions regard-ing extending the current deadline of January 2005 forconcluding the DWP negotiations.
The way forwardAs emphasized by the Trade and Development Board(TDB) of UNCTAD following the Cancún meeting, thereis a need for urgent and purposeful work on the key out-standing issues in order to put the DWP back on track.Efforts should concentrate on the Doha mandate and oncore issues: a balanced outcome both within and acrossthe spectrum of negotiating areas; full realization andimportance of the development agenda; complete inclu-siveness, transparency and democracy in the negotiatingprocesses, procedures and decision-making; concentrationon trade liberalization and border measures; completion of
the unfinished business of the previous rounds, especiallyin agriculture, textiles and Mode 4 in services; implemen-tation issues; SDT; and enhanced technical assistance andcapacity building to meet the needs of developing coun-tries. More generally, there is also a need to ensure coher-ence and consistency between trade, financial, monetaryand technological policies in support of development andto take into account the implications for the multipleissues that operate in the interface of trade, developmentand globalization.
The negotiations need to recognize, take into accountand provide for ab initio the adjustment and social coststhat their implementation will involve, particularly fordeveloping countries. In addition to support in participat-ing in the negotiations, developing countries require addi-tional financial and technical resources and capacity andinstitution-building to prepare for the implementation ofthe outcomes of trade negotiations. Targeted and compre-hensive technical assistance is already an element of theDWP and, in addition to ongoing programmes, theInternational Monetary Fund (IMF) and World Bank havelaunched an initiative to support adjustment by develop-ing countries to address the impact of multilateral tradeliberalization. A commitment of further support of thisnature, including by bilateral donors as part of theirpledges to increase official development assistance(ODA), should pay a “double dividend” by providingdeveloping countries with greater flexibility in the nego-tiations and thereby giving a boost to the negotiationsthemselves.
The DWP was launched as a “development round” oftrade negotiations. Progress should therefore be moni-tored against a set of benchmarks relating to developmentobjectives. The TDB of UNCTAD, and subsequently theGeneral Assembly at its fifty-eighth session,10 took noteof a series of possible development benchmarks (see boxII.1). Such benchmarks are a useful way of systematical-ly assessing progress in assuring development gains fromthe international trading system in general and from tradenegotiations.
Regional and bilateral trade agreements
At present, some 215 regional trade agreements (RTAs)and bilateral trade agreements (BTAs) are operational.By 2007, some 300 such agreements are expected to bein force. Some 40 per cent of global trade is currentlyconducted within existing or emerging RTAs and BTAs,and it is estimated that more than a half will be coveredby RTAs by 2005. These agreements, which developedparallel to the evolution of the MTS, have become a per-manent feature of international trading. As in the run-upto the completion of the Uruguay Round, the currentimpasse in multilateral trade negotiations may give
W O R L D E C O N O M I C S I T U A T I O N A N D P R O S P E C T S 2 0 0 426
I N T E R N A T I O N A L T R A D E A N D F I N A N C E 27
Box II.1: Development benchmarksa
The following development benchmarks have been identified by UNCTAD for assessing progress in mainstreaming develop-ment in trade negotiations.
Openness and Liberalization. An important development benchmark is how open, liberal and fair the premium marketsare to which developing countries export their agricultural and manufactured goods and services. In this regard, barriers to mar-ket entry (in the form of discretionary standards, technical and environment requirements and rules of origin) are as crucial asformal market access conditions. In addition, the pace and sequencing of trade liberalization and the relative ability of coun-tries to absorb the costs and dislocation involved have to be taken into account in determining the development gains.Particularly for developing countries to capture the benefits of liberalization, mechanisms to increase supply capacity and tocope with adjustment difficulties and costs (such as social safety nets, adjustment support, infrastructure investment, institu-tion-building etc.) need to be in place. These may require external support beyond the traditional technical cooperation direct-ed at implementing WTO Agreements.
Equal opportunity for unequal partners. Equitable rules and their fair application are the ultimate protection of weakertrading nations. From this standpoint, the principle of special and differential treatment (SDT) is meant to take into accountstructural and emerging asymmetries between the developed and developing countries, including those relating to per capitaincome; supply capacities; size, market power and scope of their industries and enterprises; capital and technological advan-tages; ability to subsidize agriculture, industry, services and research and development (R&D); and availability and costs of eco-nomic, trade-related and financial infrastructures. These asymmetries need to be addressed in all existing agreements whileany new agreements need to be such that the rules fully accommodate the “developmental, financial and trade needs” of devel-oping countries, and provide them sufficient policy space.
Striving for a better balance. The present multilateral trade negotiations are also about the balance between the legacyof rights and obligations and costs and benefits from previous rounds and those from this round; balance of loss and gain with-in each area and in overall terms; balance in the processes, selection of issues, sequencing and timelines and the levels ofambition and of outcome. Rebalancing would involve dealing purposefully with implementation issues. Care also needs to betaken not to give rise to new imbalances even as the previous ones are remedied. Balance requires that trade-offs lead to pos-itive sum outcomes for all parties, particularly for developing countries. Transparency and the increased participation of devel-oping countries in the decision-making processes is another imperative. Accession of developing countries to the WTO on termscommensurate with their level of development continues to be a key priority.
Serving public interest. The Millennium Declaration commits the international community to making the right to develop-ment a reality for everyone and resolves to create an environment at national and global levels conducive to development and tothe elimination of poverty. The common good, public interest and ways to help the poor should be the guiding light of a develop-ment-oriented multilateral trading system. Efforts must be made to ensure that the trading system is responsive to the key devel-opment issues, including the eradication of poverty, fighting infectious diseases and epidemics and ensuring provision of basicsocial services to the poor and the underprivileged. The TRIPS and Public Health Declaration at Doha and the recently adopteddecision was a breakthrough in that it recognized that trade is not value neutral and that public interest must be a priority.
Revitalizing the commodities sector. Raising the profile of commodities in the multilateral and wider international tradeand development cooperation agenda whilst evolving a supportive international environment for commodity-dependent devel-oping countries is long overdue. Some fifty developing countries depend on just two or three commodity exports and thirty-nineof them on exports of single commodities. In order to reach the millennium development goals on poverty reduction, these coun-tries need to achieve a strong revival of their commodity sectors and higher value realization from their exports.
Coherence. Key to the development orientation of the multilateral trading system is the degree of coherence that can bebrought to bear among the different areas of negotiations and disciplines, between the different multilateral institutions andpolicies and between these and regional and national processes and strategies. Three aspects of coherence need to be moni-tored: (i) synergy and proper sequencing between the capacities of the developing countries, their level of obligations, the costof implementation and the adequacy of financial and technical resources made available to them; (ii) positive linkages betweenthe trade, financial, monetary and technology policies of developed countries and the ability of developing countries’ trade lib-eralization and their reaping of development gains; and (iii) implications of the multilateral trade negotiations and the multi-lateral trading system for such key development issues as poverty elimination, employment, food security and rural develop-ment, environment, health, culture, gender, migration, competition, technology and enterprise development.
a For an elaboration, see UNCTAD document TD/B/50/8.
added impetus to the formation and deepening of RTAsand BTAs.
A major aspect of in the evolution of the RTAs andBTAs has been the development of agreements involvingboth developed and developing countries. An early exam-ple was the North American Free Trade Agreement(NAFTA) among Canada, Mexico and the United States,which celebrated its tenth anniversary of going into effectat the beginning of 2004. More recent examples includethe Euro-Med Association Agreements concludedbetween EU and Mediterranean Basin countries(Morocco, Tunisia, Egypt, Jordan, Israel); EU-Chile; EU-Mexico; EU-South Africa; EU-Jordan; United States-Israel; United States-Singapore; Canada-Chile; andCanada-Costa Rica. Under the Cotonou PartnershipAgreement, ACP and EU are negotiating economic part-nership agreements based on reciprocal opening of mar-kets, the second phase of which, dealing mainly with theliberalization of market access, was launched inSeptember 2003.
In November 2003, Western Hemisphere trade minis-ters adopted a compromise declaration on the way for-ward for the Free Trade Area of the Americas (FTAA).Ministers reaffirmed their commitment to “ the successfulconclusion of the FTAA negotiations by January 2005,with the ultimate goal of achieving an area of free tradeand regional integration“ and agreed that the negotiatorsshould aim “at a balanced agreement that addresses theissue of differences in the levels of development and sizeof economies of the hemisphere.” The declaration recog-nized that countries might assume different levels ofcommitments by selecting the obligations they willassume, instead of committing to a ‘single-undertaking’arrangement. The implications of this, especially forsmaller partners, remain to be seen. It was also agreedthat the negotiations on market access must lead to con-clusion by 30 September 2004.
Bilateral and regional FTAs have become an importantelement in United States trade policy. In addition to con-cluding the FTAs with Canada and Mexico, as well withJordan and Singapore, referred to above, during 2003, inDecember 2003 it concluded a collective agreement withEl Salvador, Guatemala, Honduras, and Nicaragua.11 TheUnited States is currently negotiating FTAs withAustralia and Thailand and has also proposed FTAs with,among others, sub-Saharan African countries (under itsAfrican Growth and Opportunities Act (AGOA)) and theArab States.
A recent feature of RTAs has been the widening cover-age of the agreements beyond trade in goods to includetrade in services and other trade-related policy areas,such as intellectual property rights, investment, competi-tion policy and government procurement. In addition,physical integration through joint infrastructure develop-
ment, social and cultural cooperation, political and secu-rity cooperation, and other sectors of cooperation havebeen pursued to enhance regional economic linkages, sta-bility and solidarity.
A continued concern regarding RTAs and BTAs is theircompatibility with the relevant WTO rules and disci-plines, including General Agreement on Tariffs and Trade(GATT) Article XXIV, which concerns primarily RTAsamong developed countries and between developed anddeveloping countries. For the latter, there are importantdevelopment implications arising mainly from the issuesof reciprocity and SDT. Little progress has been madeunder the DWP in clarifying and improving the disci-plines and procedures under the WTO provisions apply-ing to RTAs in order to take into account developmentalaspects of these agreements.
A key challenge for RTAs among developing countrieshas been the effective implementation of their liberaliza-tion programmes. Experience shows that the degree ofimplementation of such RTAs has been greater for tradi-tional and less sophisticated agreements focusing ontrade in goods than for agreements that seek “deeper”integration and cover such issues as investment, competi-tion policy and government procurement. The latter typeof agreements tend to lag behind the planned time frame.The South Summit, held in Marrakech in December 2003,dealt with some of these and other issues of economic andtrade cooperation among developing countries.
The widening, deepening and consolidation of regionalintegration among developing countries has had differingimpacts on intra-group trade. Between 1990 and 2001, theshare of such trade within the Southern Common Market(MERCOSUR) rose from 8.9 per cent to 21.8 per cent.During the same period, the intra-trade of Association ofSoutheast Asian Nations (ASEAN) countries was consis-tently between 20 and 25 per cent, except during the Asianfinancial crisis. ASEAN countries (22.4 per cent in 2001)and MERCOSUR have attained a relatively high-level ofintra-regional trade, but the ratio is less in the CentralAmerican Common Market (CACM) (15.0 per cent), theUnion Economique et Monétaire Ouest Africaine(UEMOA) (13.5 per cent), the Caribbean Community(CARICOM) (13.4 per cent) and the Southern AfricanDevelopment Community (SADC) (10.9 per cent). AmongAfrican groupings, the shares of intraregional trade of theCommon Market of Eastern and Southern Africa (COME-SA), the Communauté Economique et Monétaire del’Afrique Centrale (CEMAC) and the EconomicCommunity of Central African States (ECCAS) were only5.2 per cent, 1.3 per cent and 1.1 per cent, respectively, in2001. In all cases, these shares remain low compared tosome RTAs among developed countries, with intra-groupexports accounting for 61 per cent of EU exports and 55per cent of NAFTA exports.
W O R L D E C O N O M I C S I T U A T I O N A N D P R O S P E C T S 2 0 0 428
The overall increase in trade under RTAs among devel-oping countries is consistent with the burgeoning tradeamong these countries in general. Compared to 27 per centin 1980, about 40 per cent of developing countries’ mer-chandise exports are now to other developing countries,reflecting their growth of inter- as well as intraregionaltrade. For example, between 1999 and 2002, tradebetween India and Brazil increased fivefold, from an ini-tial level of $200 million. The Global System of TradePreferences among Developing Countries (GSTP) is animportant instrument for developing countries to furtherpromote trade among themselves. At a meeting of the G-20 developing countries in Brazil in December 2003,Brazilian President, Lula da Silva, proposed that membersof the Group should implement free trade amongst them-selves and that this initiative should be taken up at theeleventh session of UNCTAD in June 2004.
Trade disputes
In 2001, the United States imposed new duties on steelimports, prompting the EU and other trade partners tothreaten retal ia tory act ion against United Statesexports.12 In November 2003, WTO ruled that the UnitedStates duties were in violation of WTO rules and, inDecember 2003, the United States announced that itwould lift the duties.
This development notwithstanding, a number of otherissues continue to affect United States-EU trade relations,particularly an ongoing dispute over United States taxconcessions for its companies that export under theForeign Sales Corporation law and the continued EU defacto moratorium on the approval of genetically modifiedorganisms (GMOs).
Among other WTO cases, India has disputed the rightof the EU to grant special tariff benefits under itsGeneralized System of Preferences (GSP) scheme toPakistan’s textiles and clothing exports as part of the EU“drug incentive” programme. This arrangement providesadditional preferences to Pakistan (but not to India) andto Andean countries (but not to Paraguay). India arguedthat the EU “drug incentive” violates GATT Article I andthat the EU should demonstrate that it has met the condi-tion provided under the Enabling Clause, which requiresany preferences to be generalized and non-discriminato-ry. India claimed that, since the EU scheme could not beseen as a measure designed or necessary to protect humanlife and health, the effect was to shift the burden of pro-viding resources for countries fighting drug productionand trafficking to countries that had not caused suchproblems. A WTO panel subsequently found the EU pref-erential ‘Drug Arrangements’ scheme to be GATT-illegal.
A first implication of this finding is that, as informallyevident prior to the case, non-generalized unilateral pref-erences, such as the United States AGOA or the EU
Cotonou Agreement (although granted a waiver), aremost likely not justifiable under the Enabling Clause.Secondly, non-trade conditionality, such as the EU posi-tive incentive scheme on the basis of labour or environ-mental criteria, is also not justifiable.13
Security-related measures affecting trade
A number of initiatives and measures have been taken,mostly by certain developed countries, regarding thesecurity of exports. These measures may have implica-tions for developing countries, including the possibilityof increased transactions’ time and costs; the additionalcost of adjustment to and compliance with each new pro-cedure and regulation; the uncertainty regarding the suc-cessful completion of formalities and the consequent riskof export loss; the possibility of discriminatory treat-ment; and the likelihood that these regulations might actas barr iers to t rade. The programme of TransportSecurity Action agreed by the Group of 8 (G8) at itssummit in Canada in 2002, the United States securitylegis lat ion and the work within the Internat ionalMaritime Organization and the EU demonstrate theimportance of maritime and container security issues andtheir implications for international trade. It is essentialthat a coordinated global approach be adopted to avoidthe negative consequences of a proliferation of diverseunilateral and regional standards and approaches.
FINANCIAL FLOWS TO DEVELOPING ANDTRANSITION ECONOMIES
Developing countries received an estimated $95 billionin net capital flows in 2003, a modest increase from2002 and only slightly more than one half of the averageannual amount in the mid-1990s (see table II.2). FDI andofficial loans and grants were the only net sources ofcapital inflow. While FDI was still the most resilientcapital flow, it was unchanged from the relatively lowlevel of 2002 (see following section). For the transitioneconomies, FDI and commercial bank lending were themain sources of net capital inflow in 2003.
Private financial flows
Foreign investor sentiment towards emerging marketsimproved as 2003 progressed, bolstered by improve-ment in the domestic situation of a number of countries,including Brazil, Turkey and Uruguay. This was reflect-ed both in new flows to selected emerging economiesand in the reduction of the spread between the yield onemerging market bonds and that of the risk-free bench-mark United States Treasury bonds during the year (seefigure II.6). The decline in the yield spread was particu-larly sharp on bonds of a number of Latin American
I N T E R N A T I O N A L T R A D E A N D F I N A N C E 29
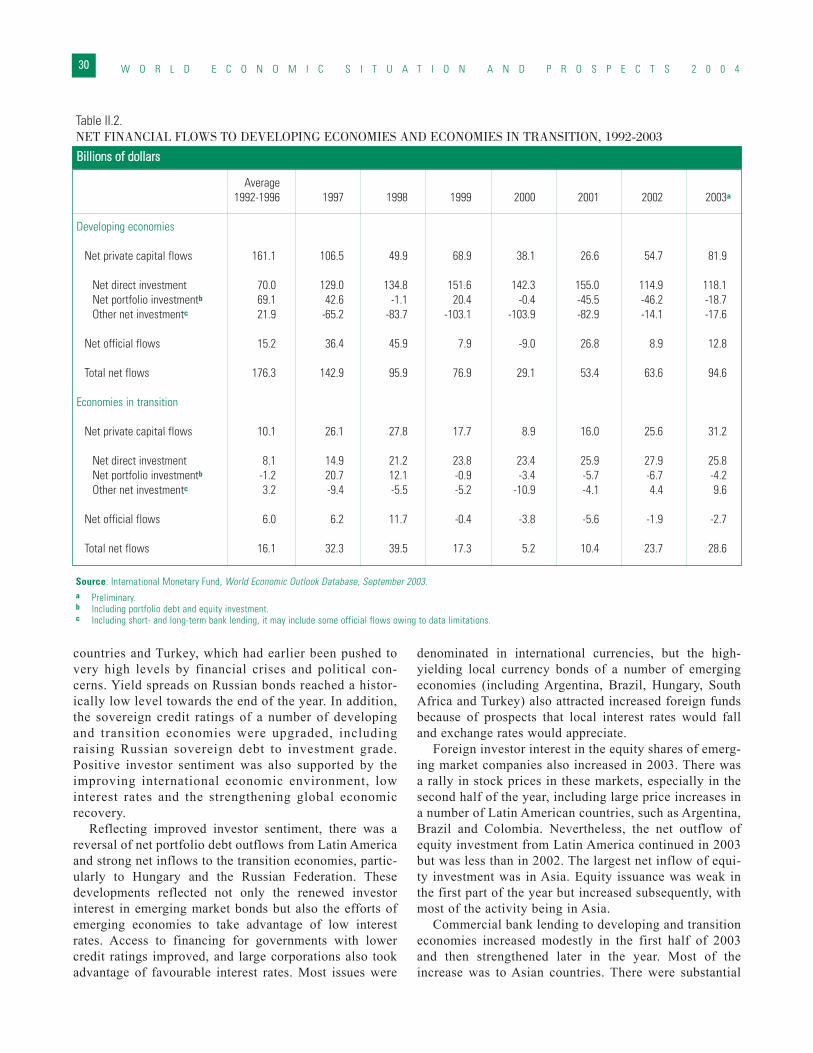
countries and Turkey, which had earlier been pushed tovery high levels by financial crises and political con-cerns. Yield spreads on Russian bonds reached a histor-ically low level towards the end of the year. In addition,the sovereign credit ratings of a number of developingand transition economies were upgraded, includingraising Russian sovereign debt to investment grade.Positive investor sentiment was also supported by theimproving international economic environment, lowinterest rates and the strengthening global economicrecovery.
Reflecting improved investor sentiment, there was areversal of net portfolio debt outflows from Latin Americaand strong net inflows to the transition economies, partic-ularly to Hungary and the Russian Federation. Thesedevelopments reflected not only the renewed investorinterest in emerging market bonds but also the efforts ofemerging economies to take advantage of low interestrates. Access to financing for governments with lowercredit ratings improved, and large corporations also tookadvantage of favourable interest rates. Most issues were
denominated in international currencies, but the high-yielding local currency bonds of a number of emergingeconomies (including Argentina, Brazil, Hungary, SouthAfrica and Turkey) also attracted increased foreign fundsbecause of prospects that local interest rates would falland exchange rates would appreciate.
Foreign investor interest in the equity shares of emerg-ing market companies also increased in 2003. There wasa rally in stock prices in these markets, especially in thesecond half of the year, including large price increases ina number of Latin American countries, such as Argentina,Brazil and Colombia. Nevertheless, the net outflow ofequity investment from Latin America continued in 2003but was less than in 2002. The largest net inflow of equi-ty investment was in Asia. Equity issuance was weak inthe first part of the year but increased subsequently, withmost of the activity being in Asia.
Commercial bank lending to developing and transitioneconomies increased modestly in the first half of 2003and then strengthened later in the year. Most of theincrease was to Asian countries. There were substantial
W O R L D E C O N O M I C S I T U A T I O N A N D P R O S P E C T S 2 0 0 430
Table II.2.NET FINANCIAL FLOWS TO DEVELOPING ECONOMIES AND ECONOMIES IN TRANSITION, 1992-2003
Average1992-1996 1997 1998 1999 2000 2001 2002 2003a
Developing economies
Net private capital flows 161.1 106.5 49.9 68.9 38.1 26.6 54.7 81.9
Net direct investment 70.0 129.0 134.8 151.6 142.3 155.0 114.9 118.1Net portfolio investmentb 69.1 42.6 -1.1 20.4 -0.4 -45.5 -46.2 -18.7Other net investmentc 21.9 -65.2 -83.7 -103.1 -103.9 -82.9 -14.1 -17.6
Net official flows 15.2 36.4 45.9 7.9 -9.0 26.8 8.9 12.8
Total net flows 176.3 142.9 95.9 76.9 29.1 53.4 63.6 94.6
Economies in transition
Net private capital flows 10.1 26.1 27.8 17.7 8.9 16.0 25.6 31.2
Net direct investment 8.1 14.9 21.2 23.8 23.4 25.9 27.9 25.8Net portfolio investmentb -1.2 20.7 12.1 -0.9 -3.4 -5.7 -6.7 -4.2Other net investmentc 3.2 -9.4 -5.5 -5.2 -10.9 -4.1 4.4 9.6
Net official flows 6.0 6.2 11.7 -0.4 -3.8 -5.6 -1.9 -2.7
Total net flows 16.1 32.3 39.5 17.3 5.2 10.4 23.7 28.6
Source: International Monetary Fund, World Economic Outlook Database, September 2003.a Preliminary.b Including portfolio debt and equity investment.c Including short- and long-term bank lending, it may include some official flows owing to data limitations.
BBiilllliioonnss ooff ddoollllaarrss
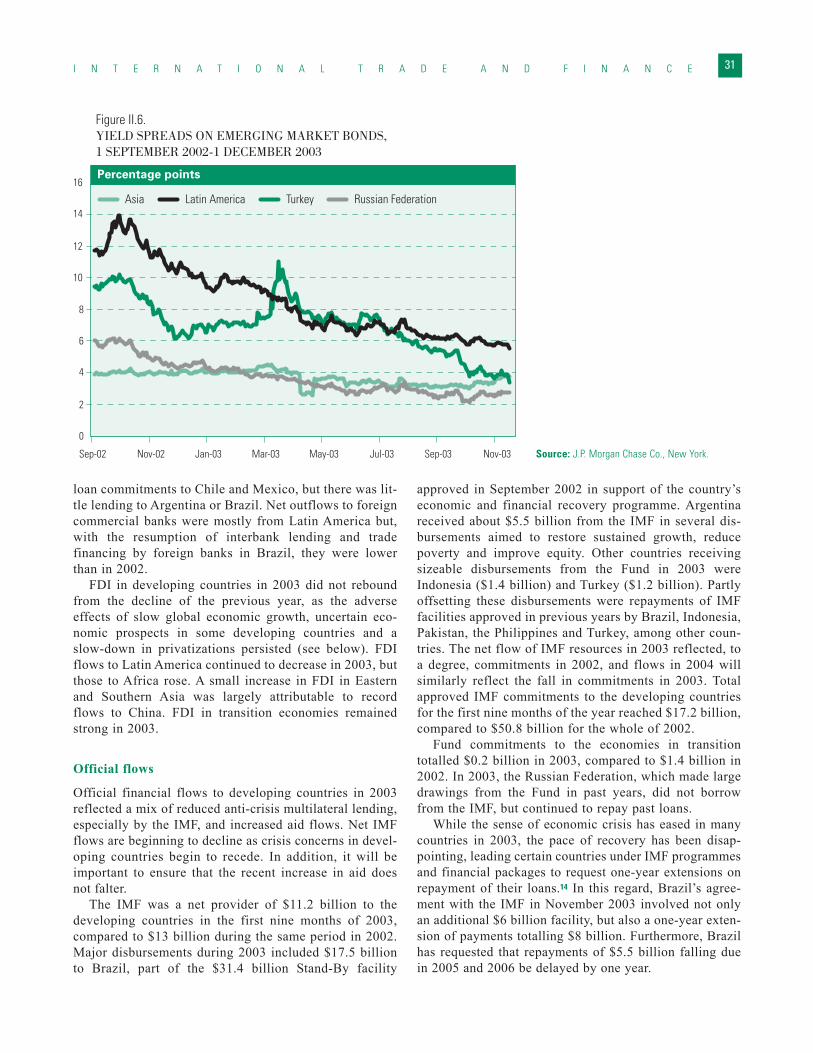
loan commitments to Chile and Mexico, but there was lit-tle lending to Argentina or Brazil. Net outflows to foreigncommercial banks were mostly from Latin America but,with the resumption of interbank lending and tradefinancing by foreign banks in Brazil, they were lowerthan in 2002.
FDI in developing countries in 2003 did not reboundfrom the decline of the previous year, as the adverseeffects of slow global economic growth, uncertain eco-nomic prospects in some developing countries and aslow-down in privatizations persisted (see below). FDIflows to Latin America continued to decrease in 2003, butthose to Africa rose. A small increase in FDI in Easternand Southern Asia was largely attributable to recordflows to China. FDI in transition economies remainedstrong in 2003.
Official flows
Official financial flows to developing countries in 2003reflected a mix of reduced anti-crisis multilateral lending,especially by the IMF, and increased aid flows. Net IMFflows are beginning to decline as crisis concerns in devel-oping countries begin to recede. In addition, it will beimportant to ensure that the recent increase in aid doesnot falter.
The IMF was a net provider of $11.2 billion to thedeveloping countries in the first nine months of 2003,compared to $13 billion during the same period in 2002.Major disbursements during 2003 included $17.5 billionto Brazil, part of the $31.4 billion Stand-By facility
approved in September 2002 in support of the country’seconomic and financial recovery programme. Argentinareceived about $5.5 billion from the IMF in several dis-bursements aimed to restore sustained growth, reducepoverty and improve equity. Other countries receivingsizeable disbursements from the Fund in 2003 wereIndonesia ($1.4 billion) and Turkey ($1.2 billion). Partlyoffsetting these disbursements were repayments of IMFfacilities approved in previous years by Brazil, Indonesia,Pakistan, the Philippines and Turkey, among other coun-tries. The net flow of IMF resources in 2003 reflected, toa degree, commitments in 2002, and flows in 2004 willsimilarly reflect the fall in commitments in 2003. Totalapproved IMF commitments to the developing countriesfor the first nine months of the year reached $17.2 billion,compared to $50.8 billion for the whole of 2002.
Fund commitments to the economies in transitiontotalled $0.2 billion in 2003, compared to $1.4 billion in2002. In 2003, the Russian Federation, which made largedrawings from the Fund in past years, did not borrowfrom the IMF, but continued to repay past loans.
While the sense of economic crisis has eased in manycountries in 2003, the pace of recovery has been disap-pointing, leading certain countries under IMF programmesand financial packages to request one-year extensions onrepayment of their loans.14 In this regard, Brazil’s agree-ment with the IMF in November 2003 involved not onlyan additional $6 billion facility, but also a one-year exten-sion of payments totalling $8 billion. Furthermore, Brazilhas requested that repayments of $5.5 billion falling duein 2005 and 2006 be delayed by one year.
I N T E R N A T I O N A L T R A D E A N D F I N A N C E 31
Figure II.6.YIELD SPREADS ON EMERGING MARKET BONDS, 1 SEPTEMBER 2002-1 DECEMBER 2003
Percentage points
Asia Latin America Turkey Russian Federation
0
2
4
6
8
10
12
14
16
Sep-02 Nov-02 Jan-03 Mar-03 May-03 Jul-03 Sep-03 Nov-03 Source: J.P. Morgan Chase Co., New York.
Another instance is Argentina, which has been strug-gling under the weight of heavy debt-servicing obliga-tions, including large private international credits that arein default. In addition to being granted permission to delayfor one year payment to the IMF of $3.8 billion that felldue in August 2003, Argentina was granted waivers fornon-observance of certain performance criteria and appli-cability of fiscal targets for end-May and end-June 2003.Argentina requested the IMF not to consider its inabilityto adhere to previously-agreed economic and fiscal targetsas prejudicial to the approval and release of IMF loans. Anew set of targets was agreed in September 2003.
Net transfer of resources
Normally, for countries at early and middle stages ofdevelopment, there should be a net inward transfer offinancial resources15 that supplements gross domesticsaving to help finance investment. A net outward transferof resources may be expected in individual years, forexample, in a boom year for commodity exports, or whena country enters a balance-of-payments crisis and mustsuddenly curtail its imports. However, over the mediumterm, there should be net financial transfers to develop-ing and transition economies, raising levels of invest-ment above what can be financed from domestic savingand permitting more imports than exports of goods andservices. However, in every year since 1997, the devel-oping countries as a whole have made, rather thanreceived, net financial transfers. Preliminary and incom-plete information suggests that the total net financialtransfer in 2003 was of similar magnitude to that in2002, when it reached a peak level of about $192billion.16 There was also a net outward financial transferfrom economies in transition in 2003.
Among the financial components of the net transfer,there was an increase in capital flows to some countriesand an increase in foreign exchange reserves by some,particularly those countries with large trade surpluses butalso by some countries receiving increased capitalinflows. The accumulation of reserves is held mainly inlow-risk, and thus low-yield, investments in developedcountries and helps to finance, in particular, the externalcurrent-account and fiscal deficits of the United States.The high levels of reserves now held by some Asiandeveloping countries have raised questions about theneed for any further accumulation of reserves by thesecountries, given the opportunity cost in terms of foregoneimports and overall expenditure and the low utility ofadditional reserves in further reducing countries’ vulner-ability to financial crises.17
At the regional level, there were large net outwardtransfers of financial resources from Latin America in2002 as countries in financial crisis compressed con-
sumption and investment in response to the withdrawal ofcapital flows by international investors and the region’strade balance went into surplus. In 2003, there was anincrease in exports and a deceleration in the decline inimports, but not enough to reverse the outward net trans-fer. The large net outward transfers of resources fromEast Asia as a result of its strong export growth in recentyears continued in 2003. While this supported strong eco-nomic growth and high rates of domestic saving andinvestment, concerns have been raised that theseeconomies should seek more balance in growth betweentradable and non-tradable sectors, including physical andhuman infrastructure development. Financial resourceoutflows were used for net repayment of debt and pur-chase of foreign assets, a large part of which was in theform of official reserve accumulation.
FOREIGN DIRECT INVESTMENT: GLOBAL FLOWS BOTTOM OUT
In 2003, global FDI flows were about $650 billion, simi-lar to 2002, suggesting a bottoming-out after the down-turn from the peak of $1.4 trillion in 2000. The main fac-tors behind this downturn in FDI were slow global eco-nomic growth, including the delayed recovery in themajor developed economies, lower corporate profitabili-ty, falling stock market valuations and the decline in pri-vatization in some countries. The continuing low numberand value of cross-border mergers and acquisitions(M&As)18—the key driving force behind global FDIflows since the late 1980s—contributed heavily to thestagnation in FDI.
FDI flows are expected to rebound in 2004. Thestrengthening global economy, improved corporate prof-itability, a recovery in M&A transactions and growinginvestor confidence will all provide a stimulus for FDIflows.19 Flows to individual countries, regions and sectorswill depend on economic growth, corporate profitabilityand corporate strategies, the scope for, and speed of, pri-vatization and security and safety considerations.
Inflows by region
Global FDI inflows declined by one fifth in 2002, com-pared with 2001, but the downturn bottomed out in 2003at $653 billion—about the same level as in 2002 (seetable II.3). FDI inflows declined in 108 out of 195economies in 2002. The regional unevenness of flows in2002 continued into 2003.
Flows to developed countries increased from $460 bil-lion in 2002 to $467 billion in 2003—about 40 per cent oftheir peak level of $1.1 trillion in 2000. Five countries (inparticular the United States, Ireland and Norway) receivedsignificantly increased inflows but most other countries
W O R L D E C O N O M I C S I T U A T I O N A N D P R O S P E C T S 2 0 0 432
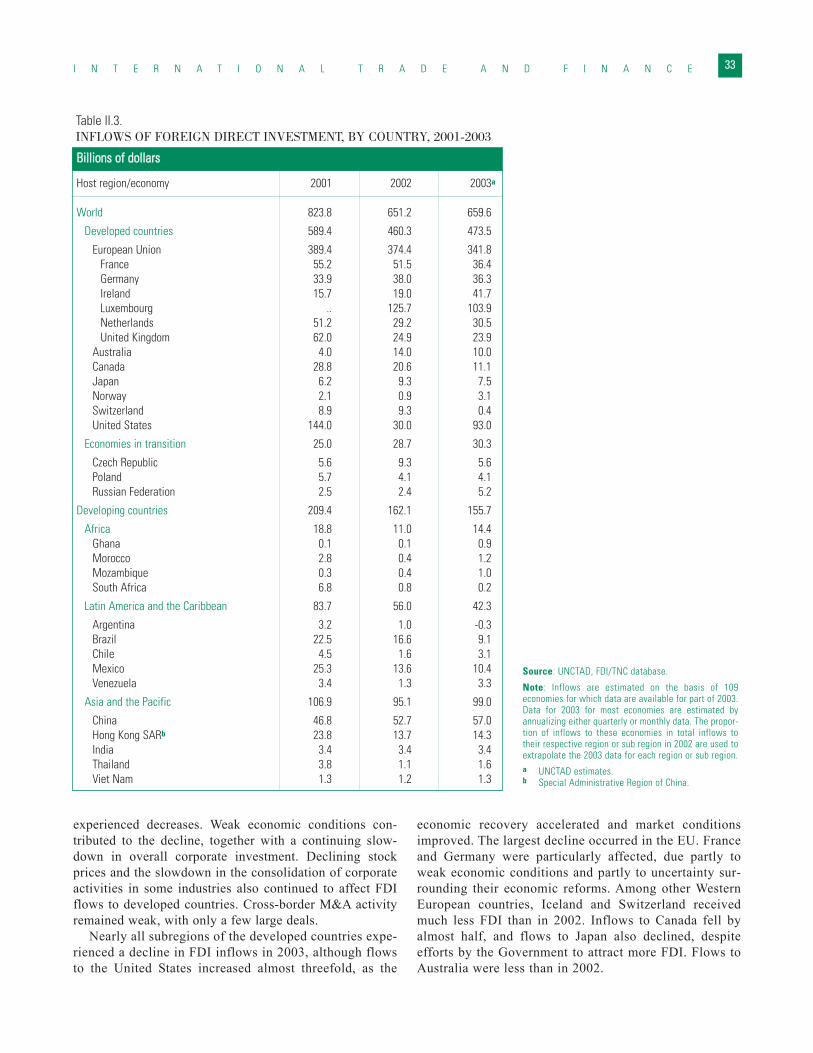
experienced decreases. Weak economic conditions con-tributed to the decline, together with a continuing slow-down in overall corporate investment. Declining stockprices and the slowdown in the consolidation of corporateactivities in some industries also continued to affect FDIflows to developed countries. Cross-border M&A activityremained weak, with only a few large deals.
Nearly all subregions of the developed countries expe-rienced a decline in FDI inflows in 2003, although flowsto the United States increased almost threefold, as the
economic recovery accelerated and market conditionsimproved. The largest decline occurred in the EU. Franceand Germany were particularly affected, due partly toweak economic conditions and partly to uncertainty sur-rounding their economic reforms. Among other WesternEuropean countries, Iceland and Switzerland receivedmuch less FDI than in 2002. Inflows to Canada fell byalmost half, and flows to Japan also declined, despiteefforts by the Government to attract more FDI. Flows toAustralia were less than in 2002.
I N T E R N A T I O N A L T R A D E A N D F I N A N C E 33
Table II.3.INFLOWS OF FOREIGN DIRECT INVESTMENT, BY COUNTRY, 2001-2003
Host region/economy 2001 2002 2003a
World 823.8 651.2 659.6
Developed countries 589.4 460.3 473.5
European Union 389.4 374.4 341.8France 55.2 51.5 36.4Germany 33.9 38.0 36.3Ireland 15.7 19.0 41.7Luxembourg .. 125.7 103.9Netherlands 51.2 29.2 30.5United Kingdom 62.0 24.9 23.9
Australia 4.0 14.0 10.0Canada 28.8 20.6 11.1Japan 6.2 9.3 7.5Norway 2.1 0.9 3.1Switzerland 8.9 9.3 0.4United States 144.0 30.0 93.0
Economies in transition 25.0 28.7 30.3
Czech Republic 5.6 9.3 5.6Poland 5.7 4.1 4.1Russian Federation 2.5 2.4 5.2
Developing countries 209.4 162.1 155.7
Africa 18.8 11.0 14.4Ghana 0.1 0.1 0.9Morocco 2.8 0.4 1.2Mozambique 0.3 0.4 1.0South Africa 6.8 0.8 0.2
Latin America and the Caribbean 83.7 56.0 42.3
Argentina 3.2 1.0 -0.3Brazil 22.5 16.6 9.1Chile 4.5 1.6 3.1Mexico 25.3 13.6 10.4Venezuela 3.4 1.3 3.3
Asia and the Pacific 106.9 95.1 99.0
China 46.8 52.7 57.0Hong Kong SARb 23.8 13.7 14.3India 3.4 3.4 3.4Thailand 3.8 1.1 1.6Viet Nam 1.3 1.2 1.3
BBiilllliioonnss ooff ddoollllaarrss
Source: UNCTAD, FDI/TNC database.
Note: Inflows are estimated on the basis of 109economies for which data are available for part of 2003.Data for 2003 for most economies are estimated byannualizing either quarterly or monthly data. The propor-tion of inflows to these economies in total inflows totheir respective region or sub region in 2002 are used toextrapolate the 2003 data for each region or sub region.a UNCTAD estimates.b Special Administrative Region of China.
With the global economic recovery gaining strength,the outlook for FDI flows to developed countries in 2004is promising. With all subregions expected to see strongereconomic growth, corporate investment is expected to bepositively affected. Strategic repositioning by severalTNCs may also result in industry consolidation andincreasing M&As. The appreciation of the euro mightfavour further investment in the United States by EUcompanies.
After a record level of slightly below $29 billion in2002, FDI flows to the economies in transition increasedto over $30 billion in 2003. FDI in Central and EasternEurope increased in 2003 for the third consecutive year.Inflows to the eight Central and Eastern European coun-tries joining the EU in 2004 declined, but they were morethan offset by increases in other countries.
FDI receipts of the forthcoming new members of theEU declined from $22 billion in 2002 to $15 billion in2003, and their share of total inflows into Central andEastern Europe also declined. This may confirm expecta-tions concerning a post-EU-enlargement shift in theregional pattern of FDI inflows from relatively moreadvanced countries towards less developed ones. In theformer group, the fall in FDI inflows was particularlypronounced in such countries as the Czech Republic,Slovakia and Slovenia, which had completed major pri-vatization programmes involving foreign capital in 2002.With no new large privatizations in sight, inflows intothese three countries declined from $15 billion in 2002 to$8 billion in 2003, despite the strong performance ofgreenfield projects. FDI inflows to Hungary also declinedto their lowest level since 1991, mainly due to negativeintra-company loans. However, other accession countriesfared better: inflows to Poland remained unchanged at $4billion in 2003, while flows to Estonia and Lithuaniaincreased significantly. The longer-term outlook for thesecountries is more promising because of the incentive pro-vided by EU membership.
In contrast to the EU accession group, FDI flows toSouth-eastern Europe (including Bulgaria and Romania,which are expected to join the EU in 2007) and to the CISincreased in 2003. In South-eastern Europe, Croatia andSerbia and Montenegro experienced the largest increases;in the CIS, Ukraine and, especially, the RussianFederation experienced major gains.
FDI flows to the CIS continued to surge in 2003, driv-en by oil investment, especially in Azerbaijan, and largeflows into the Russian Federation. FDI in the RussianFederation jumped from $3 billion in 2002 to $5 billionin 2003, despite the potential negative impact of the legalproblems that Yukos, a major Russian oil firm, experi-enced in the second half of the year. The Yukos case is notlikely to deter FDI inflows in either natural resources orother activities, partially because Yukos has almost no
foreign shareholders. In addition, foreign investors, espe-cially in the oil and gas industry, interpreted the legal dif-ficulties of Yukos as an isolated and purely domestic case,not applicable to other companies and especially not toforeign firms. Nevertheless, it may raise the cost ofefforts to attract new large projects to the country in themedium and long terms.20 Investors may require wide-ranging and stronger guarantees, access to internationalarbitration and incentives as means to reduce theincreased risks that they may perceive in the aftermath ofthe Yukos case.
FDI outflows from the economies in transitionincreased from $4 billion in 2002 to $5 billion in 2003.With an outflow of $3 billion in both 2002 and 2003, theRussian Federation maintained its dominant position asan outward investor. Outflows from Hungary, traditional-ly the second largest source of FDI in the Central EasternEuropean region, increased, from around $300 million in2002 to $700 million in 2003, making the country a netexporter of FDI for the first time.
Among developing countries, Africa registered a 30per cent increase in FDI inflows in 2003. FDI flows toAsia and the Pacific increased only marginally, but thelong-term prospects for flows to that region are promis-ing. Flows to Latin America and the Caribbean continuedto decline in 2003, but they are likely to rise in 2004.
Africa’s inflows of FDI increased to $14 billion in2003 from $11 billion in 2002. This rebound was due to anumber of large investment projects in natural resources(particularly in the oil sector) as well as to the improvedpolicy environment, including the implementation ofsuch multinational initiatives as the New Partnership forAfrica’s Development (NEPAD) which served as cata-lysts in this respect, particularly in small economies. Theoil sector accounted for the bulk of the increase in FDIflows to African countries with oil reserves (for example,Algeria, Angola, Chad and Nigeria). There were alsoincreases in flows to the mining sector, notably in Ghana(the $1.4 billion acquisition of Ashanti gold fields byAnglogold of South Africa) and in Mozambique (the $1billion expansion of the aluminium plant of BHPBilliton). The increase in FDI flows to Morocco wasmainly accounted for by the purchase of Regie des TabacsMarocains for 1.3 billion euros by Altadis, the Franco-Spanish tobacco group. Africa’s prospects for FDIinflows in 2004 are promising, taking into account theanticipated investment in the oil sector. Privatizationinflows are expected to continue to be weak, with theprobable exception of some large sales, particularly in theelectricity and telecommunications industries, which willstimulate increased FDI inflows to some individual coun-tries. African TNCs, notably those in South Africa, areexpected to continue their expansion worldwide.SABMiller, the South African brewing company, is
W O R L D E C O N O M I C S I T U A T I O N A N D P R O S P E C T S 2 0 0 434
expected to become the second largest brewery in theworld as a result of its investments in the Italian andChinese markets in 2003.
FDI inflows to the Asia and Pacific region rose from$95 billion in 2002 to $99 billion in 2003, with increasesin more countries than in 2002. The major recipientsincluded China, the Republic of Korea and the morevibrant economies (for example, Thailand and Viet Nam).Strong domestic growth, the relocation of efficiency-seek-ing FDI to competitive locations in the region, improve-ments in global corporate spending and increasing oilinvestment were the key factors contributing to the growthof inflows. In addition, the region proved to be resilient tothe predicted negative impact of severe acute respiratorysyndrome (SARS) on FDI inflows.
China again received record FDI inflows (an estimated$57 billion), accounting for most of the increase ininflows to the region. FDI flows to the members ofASEAN were unchanged. The improved economic situa-tion and the integration process in ASEAN countriesaverted a further decline in FDI in 2003 and should helpthe subregion attract higher flows in 2004. FDI flows toSouthern Asia were unchanged in 2003, with most goingto India. Flows to the Pacific Islands remained modest,mainly because of their small size and remoteness, whileflows to Western Asia declined again due to the war inIraq and the increasing attention of TNCs in the oil sectorto investment opportunities in Africa and Central Asia.
The prospects for FDI inflows to Asia and the Pacific in2004 are promising, with recovering global growth, sus-tained regional economic growth and an improvement ininvestor confidence and corporate profitability likely totrigger a resumption of cross-border M&As. The privatiza-tion of State assets in such countries as Indonesia will helpraise FDI. Flows into the automotive, electronics and serv-ices industries are likely to benefit from the economicupswing while some Asian countries will continue toreceive FDI in corporate services and back-office opera-tions because of their comparative advantage as low-costlocations. The surge in the number of concluded regionaland bilateral agreements and free trade pacts, which typi-cally include investment issues, will further strengthen FDIflows to and within the region. The concern with terrorismremains in some countries, but its impact on FDI flows isdifficult to assess, as the assessment of security risks byTNCs varies from company to company.
In 2003, Latin America and the Caribbean was againthe most negatively affected developing region in termsof FDI: flows to the region fell from $56 billion in 2002to $42 billion in 2003, a fourth consecutive year ofdecline. The primary reason was a further decrease inflows to the largest economies. Many smaller countriesalso received less FDI, but exceptions included Chile,Ecuador and Venezuela. Concern over the economic situ-
ation in some Latin American countries, their uncertainprospects, a slowdown in privatizations in the region andthe weak global economy, including lower total FDI,were the key reasons for the decline in flows to theregion. The relocation of efficiency-seeking FDI tolower-cost countries, such as China, contributed to reduc-ing flows to some Latin American countries (for example,Mexico) in some industries (for example, automobilesand textiles). The consolidation and downsizing of TNCsin some countries aggravated the situation.
With the improving regional and global economic sit-uation, the outlook for FDI flows to the region in 2004 ismore promising, although much depends on the policydiscipline and reforms undertaken by countries in theregion (for example, Argentina and Brazil). Success inthese areas should increase investor confidence andthereby lead to higher FDI inflows in the future.
Long-term sectoral changes in foreign direct investment21
FDI in services has increased over time in all countriesand the sector now accounts for about 60 per cent of theglobal stock of FDI, compared to less than 50 per cent adecade ago (see table II.3). The share of manufacturingin FDI stock declined from more than 40 per cent in1990 to 35 per cent today, and that of the primary sectorfrom 10 per cent to 6 per cent.
The growth of FDI in services reflects the rise of theservices economy in developed countries (with the serv-ices sector now accounting for two thirds of the GDP ofthese countries) and the opening-up to FDI in services inall groups of economies. As many services are neithertradable at arm’s length over distance nor storable, butmust be produced where and when they are consumed,FDI is a key channel for supplying services to foreignmarkets. Moreover, host-country regulations oftenrequire local establishment for the delivery of services. Inaddition, manufacturing TNCs have frequently estab-lished service affiliates abroad, in particular in tradingand financial services, in support of their trade and otherforeign operations.22 The expansion of FDI in services isalso fuelled by ICT, which makes services, especiallyinformation-intensive ones, more tradable across bordersand allows the emergence of international production net-works in services. Although trading and financial servic-es still dominate FDI in the sector as a whole, a new pat-tern is emerging because of increasing FDI in moredynamic sectors, including, in particular, utilities (elec-tricity, gas and water), telecommunications and businessservices (for example, real estate, machinery and equip-ment rental, computer-related activities, research anddevelopment and advertising).
Developed countries are the dominant source of the
I N T E R N A T I O N A L T R A D E A N D F I N A N C E 35
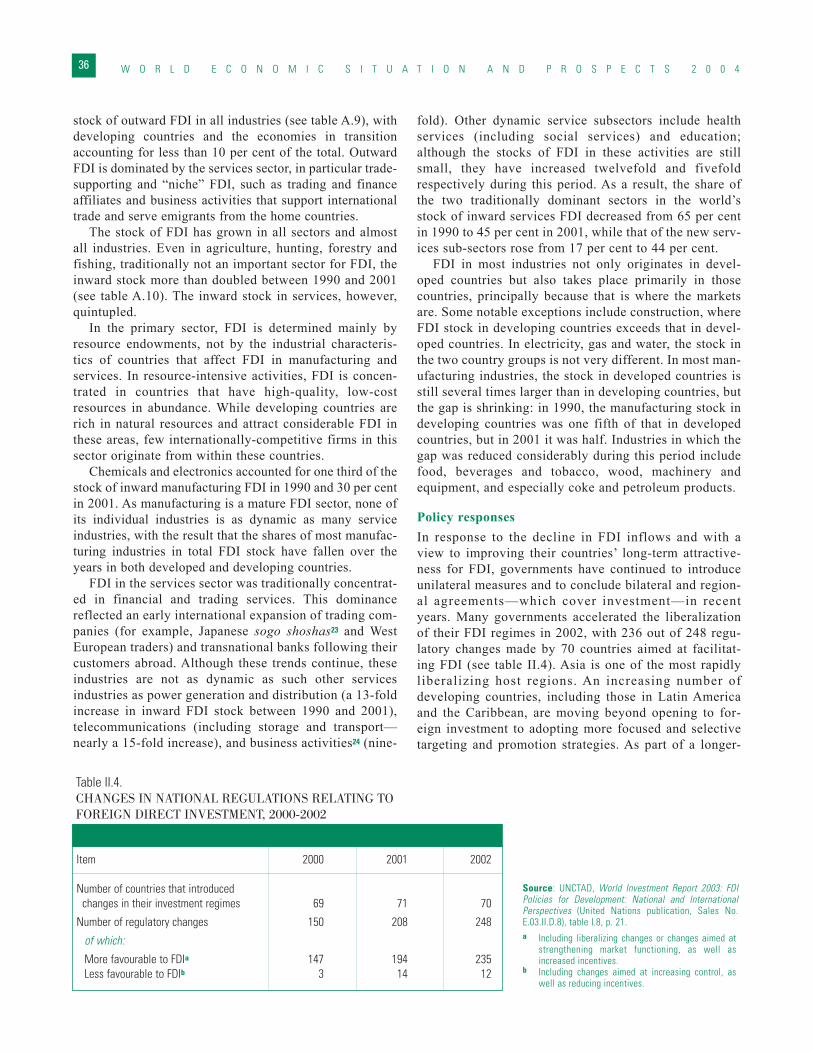
stock of outward FDI in all industries (see table A.9), withdeveloping countries and the economies in transitionaccounting for less than 10 per cent of the total. OutwardFDI is dominated by the services sector, in particular trade-supporting and “niche” FDI, such as trading and financeaffiliates and business activities that support internationaltrade and serve emigrants from the home countries.
The stock of FDI has grown in all sectors and almostall industries. Even in agriculture, hunting, forestry andfishing, traditionally not an important sector for FDI, theinward stock more than doubled between 1990 and 2001(see table A.10). The inward stock in services, however,quintupled.
In the primary sector, FDI is determined mainly byresource endowments, not by the industrial characteris-tics of countries that affect FDI in manufacturing andservices. In resource-intensive activities, FDI is concen-trated in countries that have high-quality, low-costresources in abundance. While developing countries arerich in natural resources and attract considerable FDI inthese areas, few internationally-competitive firms in thissector originate from within these countries.
Chemicals and electronics accounted for one third of thestock of inward manufacturing FDI in 1990 and 30 per centin 2001. As manufacturing is a mature FDI sector, none ofits individual industries is as dynamic as many serviceindustries, with the result that the shares of most manufac-turing industries in total FDI stock have fallen over theyears in both developed and developing countries.
FDI in the services sector was traditionally concentrat-ed in financial and trading services. This dominancereflected an early international expansion of trading com-panies (for example, Japanese sogo shoshas23 and WestEuropean traders) and transnational banks following theircustomers abroad. Although these trends continue, theseindustries are not as dynamic as such other servicesindustries as power generation and distribution (a 13-foldincrease in inward FDI stock between 1990 and 2001),telecommunications (including storage and transport—nearly a 15-fold increase), and business activities24 (nine-
fold). Other dynamic service subsectors include healthservices (including social services) and education;although the stocks of FDI in these activities are stillsmall, they have increased twelvefold and fivefoldrespectively during this period. As a result, the share ofthe two traditionally dominant sectors in the world’sstock of inward services FDI decreased from 65 per centin 1990 to 45 per cent in 2001, while that of the new serv-ices sub-sectors rose from 17 per cent to 44 per cent.
FDI in most industries not only originates in devel-oped countries but also takes place primarily in thosecountries, principally because that is where the marketsare. Some notable exceptions include construction, whereFDI stock in developing countries exceeds that in devel-oped countries. In electricity, gas and water, the stock inthe two country groups is not very different. In most man-ufacturing industries, the stock in developed countries isstill several times larger than in developing countries, butthe gap is shrinking: in 1990, the manufacturing stock indeveloping countries was one fifth of that in developedcountries, but in 2001 it was half. Industries in which thegap was reduced considerably during this period includefood, beverages and tobacco, wood, machinery andequipment, and especially coke and petroleum products.
Policy responsesIn response to the decline in FDI inflows and with aview to improving their countries’ long-term attractive-ness for FDI, governments have continued to introduceunilateral measures and to conclude bilateral and region-al agreements—which cover investment—in recentyears. Many governments accelerated the liberalizationof their FDI regimes in 2002, with 236 out of 248 regu-latory changes made by 70 countries aimed at facilitat-ing FDI (see table II.4). Asia is one of the most rapidlyliberalizing host regions. An increasing number ofdeveloping countries, including those in Latin Americaand the Caribbean, are moving beyond opening to for-eign investment to adopting more focused and selectivetargeting and promotion strategies. As part of a longer-
W O R L D E C O N O M I C S I T U A T I O N A N D P R O S P E C T S 2 0 0 436
Table II.4.CHANGES IN NATIONAL REGULATIONS RELATING TO FOREIGN DIRECT INVESTMENT, 2000-2002
Item 2000 2001 2002
Number of countries that introduced changes in their investment regimes 69 71 70
Number of regulatory changes 150 208 248
of which:
More favourable to FDIa 147 194 235Less favourable to FDIb 3 14 12
Source: UNCTAD, World Investment Report 2003: FDIPolicies for Development: National and InternationalPerspectives (United Nations publication, Sales No.E.03.II.D.8), table I.8, p. 21.a Including liberalizing changes or changes aimed at
strengthening market functioning, as well asincreased incentives.
b Including changes aimed at increasing control, aswell as reducing incentives.
term trend, and not solely in response to the downturn inFDI, more countries are concluding bilateral investmenttreaties (BITs) and double taxation treaties (DTTs). In2002, 82 BITs were concluded by 76 countries and 68DTTs by 64 countries. Many countries are concludingBITs with countries in their own region to promote intraregional FDI.
The number of bilateral and regional trade and invest-ment agreements has also increased. In contrast with ear-lier such agreements, it has become standard for tradeagreements to address investment issues, directly or indi-rectly. Such agreements are being concluded in allregions, with ASEAN countries taking the lead in Asiaand the Pacific and NAFTA and the ongoing negotiationson the FTAA being prime examples in the Americas.
INTERNATIONAL FINANCIAL COOPERATION
At the International Conference on Financing forDevelopment, held in Monterrey, Mexico, in March2002, the international community committed itself toenhancing international financial cooperation as part of acomprehensive set of domestic and international policymeasures. In 2003, there were noteworthy developmentsin several areas of international financial cooperationthat pertain to commitments made in Monterrey.
Official development assistance
Data on total ODA for 2003 are not yet available butpledges made by a number of donors in the context ofthe Internat ional Conference on Financing forDevelopment imply a sustained increase at least until2006. Total pledges, if realized, will lead to an increaseof about 31 per cent, or about $16 billion in annual ODAby 2006, bringing it to about 0.26 per cent of the grossnat ional income of the member countr ies of theDevelopment Assistance Committee (DAC) of theOrganisat ion for Economic Cooperat ion andDevelopment (OECD).
The pledges made at Monterrey provided an impetus toODA in 2002, when it increased to $57 billion from $52.3billion in 2001, or by 5 per cent in real terms. The rise inODA included increases by Canada, the EU, Norway,Switzerland and the United States. In the case of theUnited States, the commitment to raise its annual coredevelopment assistance by $5 billion by 2006 (anincrease of about 50 per cent) entails creating a newMillennium Challenge Account (MCA) for use by devel-oping countries showing strong commitment towardsgood governance, health and education, as well as soundeconomic policies to promote enterprise development andentrepreneurship. During 2003, the United StatesCongress took steps towards authorizing an independent
MCA and appropriating funds for it in fiscal year 2004(beginning 1 October 2003).
Official development cooperation
Despite the projected increase in ODA in the near term,many governments have stressed, most recently inOctober during the High-level Dialogue on Financing forDevelopment held at the fifty-eight session of theGeneral Assembly, that a large gap remains betweenODA flows and the estimated $100 billion a year neededto achieve the Mil lennium Development Goals(MDGs).25 One of the steps identified by the develop-ment community to narrow the difference between cur-rent ODA flows and the amount needed is to reduce theadministrat ive component of ODA disbursementsthrough better harmonized aid procedures and improveddonor coordinat ion. The Rome Declarat ion onHarmonization, adopted in February 2003, involved apledge to this effect.26
Recipient and donor countries have noted, however,that progress has been slow in improving the effective-ness of aid delivery and coordination. In addition, thelimited absorptive capacity of some developing countriesis seen as an impediment to the disbursement of somecurrently available ODA.27 This notwithstanding, andwhile making ODA more effective is important, there isno substitute for substantially raising total ODA levelsthrough increased contributions from traditional donors,as well as increasing the number of donors.
Heavily Indebted Poor Countries (HIPC) Initiative
As at November 2003, 27 countries had reached their“decision points” and had thereby begun to benefit fromdebt relief under the Heavily Indebted Poor Countries(HIPC) Initiative. These 27 countries account for some85 per cent of the total expected debt relief as measuredin terms of net present value (NPV) for the 34 HIPCs forwhich data are available (41 countries were included inthe list of potentially eligible countries for HIPC debtrelief). With the provision of relief, the debt stocks of the27 countries are expected to be reduced by about twothirds in NPV terms. Of the 27 countries, eight (Benin,Bolivia, Burkina Faso, Mali, Mauritania, Mozambique,United Republic of Tanzania and Uganda) had reachedtheir “completion points” and exited the programme.
In the light of the fact that the HIPC programme beganin 1996, the progress of eligible countries in reachingfirst the “decision point” and then the “completion point”has been slow. The delays in reaching the decision pointhave been attributed to problems that countries have inpreparing Poverty Reduction Strategy Papers (PRSPs) ormeeting fiscal targets. Reaching this phase of the initia-tive, where interim debt relief is provided, has been espe-
I N T E R N A T I O N A L T R A D E A N D F I N A N C E 37
cially challenging for countries emerging from conflictsituations or having protracted arrears, including Liberia,Somalia and the Sudan. Moreover, it has been questionedwhether countries that have reached the “completionpoint” have achieved debt sustainability, especially wheretheir ability to service their debts has been undermined bylower world market prices for their commodity exportsand generally weak world economic conditions.
Many participants in the High-Level Dialogue onFinancing for Development called for, inter alia, revi-sions in debt sustainability criteria, increased efforts todevelop innovative debt relief mechanisms and moreexpeditious delivery of HIPC financial commitments bydonors.28 During the Dialogue, a number of creditor gov-ernments expressed their willingness to revisit the issueof “topping up”, a mechanism to provide additional debtrelief to a HIPC country that, at completion point, contin-ues to suffer from an unsustainable debt situation.Participants at the Dialogue noted, however, that theseproposals were only part of the solution and that, formany low income countries, maintaining debt sustain-ability required significantly increased financial assis-tance in the form of grants.
Surveillance and international standards and codes
Multilateral surveillance by IMF is a critical instrumentof the international community for the prevention offinancial crises, another one of the major concerns high-lighted at the International Conference on Financing forDevelopment. Reflecting changing views on the sourcesof instability, IMF surveillance is now focusing on struc-tural and institutional policies, observance of variousstandards and codes, assessment of financial sectorsoundness and the improvement of debt sustainability andvulnerability assessments, in addition to the traditionalmacroeconomic policy areas. Increased attention is alsobeing paid to surveillance of the policies of the majoreconomies and to systemic issues, including exchange-rate policies, global imbalances and capital markets.
Along with expanded surveillance coverage, therehave been efforts to increase the transparency and can-dour of the IMF’s assessments of members. In June 2003,the Executive Board agreed to move, after 1 July 2004,from voluntary to presumed publication of IMF ArticleIV surveillance reports and programme documents, aswell as reports on use of Fund resources by membercountries. Also after July 2004, the publication of staffreports related to exceptionally large drawings on Fundresources would become a condition for approval of thearrangement.29 The ongoing reforms to strengthen theframework for IMF surveillance, as well as possible addi-tional measures to further improve its quality, effective-ness and consistency, will be considered in the context ofthe 2004 biennial review of surveillance.
The Basel Committee on Banking Supervision(BCBS), the source of the standards on banking supervi-sion, met in Madrid, Spain, on 10 and 11 October 2003 todiscuss the public comments on the proposed new BaselCapital Accord. After more than five years of work, theprocess of developing the new Accord (Basel II) hasreached a critical stage of finalization. Critics argue,however, that the proposals are still too complex, pro-cyclical, overly prescriptive and costly to implement.Another concern is that the transition to a more risk-sen-sitive framework may increase the cost and reduce thesupply of bank lending to certain categories of borrowers,including small and medium enterprises in industrialeconomies and most developing countries. Also, thesupervisory framework needs to be better aligned withconverging accounting practices worldwide. The BCBS iscommitted to work to resolve the outstanding issues bymid-2004.30 The implementation of the new Accord isscheduled to begin at the end of 2006.
Another new development in the area of internationalstandards and codes was the issuance by the FinancialAction Task Force (FATF) in June 2003 of its revised 40recommendations to combat money laundering. TheFATF has also revised the Anti-Money Laundering andCountering the Financing of Terrorism (AML/CFT)assessment methodology, which is expected to be final-ized by February 2004.31
There has also been an increased focus on corporategovernance, accounting and auditing standards. In thepost-Enron environment, there is broad acceptance thatsuch standards should strengthen the functioning of mar-kets, not just in emerging market economies but also inindustrialized economies. Corporate governance concernspersist in the latter countries, with the latest indicationbeing the trading abuses and unethical, or even illegal,management practices in some mutual funds in the UnitedStates. At its tenth meeting in September 2003, theFinancial Stability Forum (FSF) reviewed progress inaddressing weaknesses in market foundations and corpo-rate governance.32 The FSF emphasized that improve-ments in national governance standards should be reflect-ed in the ongoing revision of the OECD Principles onCorporate Governance. Also, proposals to address con-flicts of interest faced by financial analysts have beenincluded in the Statement of Principles that theInternational Organization of Securities Commissionsissued on 25 September 2003.33
The FSF welcomed the discussions between theInternational Federation of Accountants (IFAC) and theinternational regulatory community on audit-related stan-dard-setting. These discussions are expected to lead to theestablishment of a Public Interest Oversight Board afterdeliberations by the IFAC Council in November 2003.The FSF also hailed the progress made in the short-termconvergence project between the International
W O R L D E C O N O M I C S I T U A T I O N A N D P R O S P E C T S 2 0 0 438
Accounting Standards Board and the United StatesFinancial Accounting Standards Board, while urging con-tinued consultation on remaining issues.
In addition to these reformulations of particular stan-dards, 2003 saw an increasing degree of implementationof internationally-recognized standards and codes,reflecting increased ownership by countries. India andMexico are examples of emerging market countries thathave made intensified efforts in this area. The continuinginternational focus on assessment and monitoring hasalso played an important role. To date, some one hundreddeveloped, developing and transition economy countrieshave completed, in cooperation with IMF, reports onobservance of at least one set of standards and codes.
Many developing and transition countries, however,have found some of the standards complex and theirimplementation challenging. These countries have con-tinued to stress the need for flexibility without undermin-ing the universal applicability of standards and codes andto urge gradual and differentiated implementation consis-tent with countries’ needs and capacity. As the interna-tional standards require strong supervisory capacity andgood information, which most developing and transitioncountries do not yet have, these countries need moreinternational support and technical assistance to facilitatetheir implementation of the international standards.
Crises prevention and resolution
As well as better surveillance, precautionary commit-ments of financial support to use in the event of externalshocks can help prevent crises. The Contingent CreditLine (CCL), introduced by IMF in 1999, was intended toachieve this objective. CCL gave pre-qualified borrowersa credit line on which they could draw with a highdegree of automaticity during an emergency. However,the facility was never used, and it expired in November2003. The key problem was that potential users wereconcerned that applying for the facility, let alone draw-ing from it, would be viewed as a sign of financial weak-ness by the market , thereby reducing, rather thanstrengthening, confidence in the economy. It is, however,vital that IMF has the capacity to respond quickly to thefinancial needs of member countries that have soundpolicies but are nevertheless challenged by the actions ofthe globally integrated capital markets. The IMF is there-fore exploring other ways to achieve the objectives ofthe CCL.
Meanwhile, the financial crises of the 1990s reignitedefforts to promote regional monetary cooperation to helpachieve greater financial stability, a policy thrust that wasalso endorsed at Monterrey. Actions at the regional levelare seen as important complements to the global cooper-ative framework. Regional groups offer opportunities formacroeconomic consultation and coordination, monitor-
ing financial vulnerabilities and administering schemesfor mutual assistance. The most noteworthy of suchdevelopments has been the growth of monetary and finan-cial cooperation in East Asia. In May 2000, the ten mem-ber states of ASEAN, together with China, Japan and theRepublic of Korea, decided to strengthen regional coop-eration through an expanded network of swap facilitiesamong their central banks. The “ASEAN+3” countriesalso considered strengthening the regional policy dia-logue and cooperation in surveillance and monitoring,including of capital flows. Currently efforts are beingmade to develop early warning systems and to monitorshort-term capital flows. Meanwhile, because of similarconcerns, efforts are being made to define common goalsfor macroeconomic coordination within Latin Americanand Caribbean sub-regional integration processes. Thedevelopment of such regional arrangements signals theinterest of policy makers in developing countries inexploring a less centralized and more flexible interna-tional financial architecture.
Recent policy initiatives regarding the resolution offinancial crises have been in the direction of insertingmore clarity and certainty in the process for resolvingunsustainable debt situations. Over the past several years,there has been a vigorous and constructive debate onways to address this problem. The debate has been instru-mental in developing a better understanding of the issuesrelated to sovereign debt restructuring and advancingwork in a number of areas to improve restructuringarrangements. In particular, a growing awareness of theneed for a better process has overcome financial markets’resistance to the design and use of collective action claus-es (CACs). CACs aim to prevent a small minority ofbondholders from impeding restructuring of individualbond issues and specify the modalities of the restructur-ing process itself. Both Governments in the workinggroup of the Group of 10 and private creditor associationshave been drafting sets of model clauses. In 2003, theseefforts resulted in an increase in the use of CACs in inter-national sovereign bonds governed by New York law,which, unlike sovereign bonds governed by the laws ofthe United Kingdom and Japan, typically did not containthese clauses. Belize, Brazil, Guatemala, the Republic ofKorea, Mexico, and South Africa were among the devel-oping countries that issued bonds in 2003 governed byNew York law and containing CACs. Many of theseissues were oversubscribed and showed no evidence of aninterest rate premium attributable to the CACs. CACshave also been included in the new bonds resulting fromUruguay’s debt exchange, an initiative that rescheduled$5.4 billion, or half of Uruguay’s total debt. Amongdeveloped countries, Italy recently launched bonds withCACs under New York law. Overall, CACs can be said tobe winning broad market acceptance.
Some efforts are also under way to improve the process
I N T E R N A T I O N A L T R A D E A N D F I N A N C E 39
of sovereign debt restructuring in the event of a debt crisis,with particular emphasis on how to strengthen theexchange of information between a government debtor andits creditors and to ensure comparability in the treatment ofdifferent creditors and in the overall adequacy of reliefwhen the restructuring involves a large and diverse groupof creditors. Some discussions have taken place betweencertain emerging market countries and private sector rep-resentatives on a voluntary Code of Conduct, which wouldbroadly stipulate the roles that key parties would beexpected to play in resolving a debt crisis. At its meeting inOctober 2003, the finance ministers and central bank gov-ernors of the Group of 20 (G-20) encouraged issuers andmarket participants to engage in further discussions of theissue, with G-20 members participating on a voluntarybasis. They also asked G-20 deputies to review, at theirnext meeting in March 2004, the progress made.34
While the proposed Code of Conduct was an initiativeof private creditors, the Paris Club of government credi-tors has also sought to reform its practices. In October
2003, the representatives of the creditor countries agreedon a new approach to deal with non-HIPC countries indebt difficulties, as had been requested by the financeministers of the Group of 8 at their meeting in May 2003.35
According to this approach, the Paris Club will break fromits traditional practice of defining standard terms for par-ticular classes of debtor governments and instead tailor itsresponse to the specific financial situation of each country(see box II.2). Debt reduction for qualifying countries willbe considered as an option, but accorded only in excep-tional cases when the need is clearly demonstrated. Thenew approach also calls for better coordination betweenthe Paris Club and private creditors to ensure comparabil-ity of treatment of their respective claims.
In contrast to the private sector and Paris Club initia-tives, the effort by the IMF to develop a statutoryapproach to the comprehensive treatment of the debt of acountry in crisis did not win enough support to advancefurther. The proposal, the Sovereign Debt RestructuringMechanism (SDRM), aimed to enable a debtor in crisis
W O R L D E C O N O M I C S I T U A T I O N A N D P R O S P E C T S 2 0 0 440
Box II.2. Paris Club reforms its approach to sovereign debt relief
The Paris Club, which brings together the major government creditors of developing and transition economies, agreed in October2003 to change its approach to its treatment of the external debt of debt-crisis countries that are not covered by the internationalinitiative for the heavily indebted poor countries (HIPCs).a While the Club has interpreted its policies flexibly in individual cases, thenew policy outlines procedures that will facilitate flexibility in general. It also establishes a set of exceptional circumstances whenit may agree to reduce the debt of countries that have previously been considered as essentially eligible only for postponement ofdebt servicing payments. It notably reflects the intention of the Paris Club to treat the debt of an insolvent country in a way that ismore transparent and is easier to compare with the treatment by private banks and bondholders. The new approach is, however,complicated and could give the Paris Club a more central coordinating role in the overall restructuring of sovereign foreign debt,even when the Club itself is a minority creditor. Much attention will thus be paid to how the new approach is put into practice.
The new policy, called the “Evian Approach”, puts into effect an agreement of the finance ministers of the Group of 8,b whoseheads of state and government met in Evian-les-Bains, France, in June 2003. That agreement stemmed from recognition that thedebt treatment granted by Paris Club creditors sometimes turned out to be inadequate. Members saw some of their agreements ashaving been excessively generous compared to the financing needs of the debtor country, while in other cases their inability toaddress sustainability considerations led to debtors requiring repeated resort to the Paris Club.
The new policy reflects willingness in the Paris Club to promote a more orderly, timely and predictable framework for crisis res-olution, recognizing the widespread dissatisfaction with the way in which complex debt crises have been handled in recent years.Governments and civil society critics claimed that the overall relief left debtor countries with unsustainable debt burdens. Privatecreditors complained about the unfair apportionment of relief between themselves and official lenders and about the unstructuredway in which multilateral institutions, the debtor government and the Paris Club interacted with them in seeking to resolve a debtcrisis.
The International Monetary Fund (IMF) responded to those criticisms by leading an international effort to design a comprehen-sive debt restructuring process. While the Fund’s central proposal, the “Sovereign Debt Restructuring Mechanism”, did not winbroad backing, the discussions about it highlighted shortcomings in both private and official debt restructuring. The Evian Approachaims to help address those shortcomings in the Paris Club operations, as the introduction of “collective action clauses” (CACs) hassought to do for bond restructuring.c
The main innovation in the Evian Approach is that the Paris Club has introduced a comprehensive mechanism for participating inan overall treatment of an unsustainable debt situation, which, by definition, is one that requires at least some of the creditors toaccept a reduction in their claims on the debtor government; countries deemed to have a liquidity as opposed to a solvency crisiswould receive the standard Paris Club treatment. The new mechanism differs from the HIPC initiative (which has no standard termsand no automaticity of debt relief and takes a case-by-case approach), although the two approaches have some common features.d
The Paris Club proposes to apply a three-stage approach to according relief: first, an assessment of need is made and partial relief
and a qualified majority of its creditors to make a restruc-turing agreement binding on all creditors in all the cov-ered classes of debt through a formal internationalprocess established through an amendment of the IMFArticles of Agreement. The consideration of the SDRMbrought up several issues of general relevance to anorderly resolution of financial crises, including—but notlimited to—comparable treatment of all creditors, fullparticipation of all creditors in each creditor class and,most importantly, ensuring the overall adequacy of nego-tiated debt relief for the debtor country and its people. Itis recognized that work should continue on all of theseissues and on mechanisms that incorporate or build on theCAC approach, as they would be complementary.
Global financial governance
It has been increasingly acknowledged that developingand transition economies should have a greater role indecision-making in IMF and other multilateral financial
institutions. In the Monterrey Consensus,36 the BrettonWoods institutions undertook to enhance the voice ofthose countries in decision-making on international finan-cial issues. Measures have been taken to enhance capacityin the Executive Directors’ offices and in the capitals ofthese countries. Also, an Analytical Trust Fund to assistExecutive Directors representing sub-Saharan Africancountries to undertake independent research and analysison development issues has been proposed.37
However, the question of devising a new formula forassigning votes, quotas on borrowing and contributionsto the Fund has not been resolved. Existing quotas formany countries may seem misaligned with global eco-nomic realities and fairness and, for a significant numberof countries, present quota shares are lower or higherthan they would be regardless of the alternative formulaemployed.38 Progress requires being able to reach a polit-ical understanding that has thus far been elusive.Likewise, the required majority still does not exist for anincrease in basic votes that would correct the erosion of
I N T E R N A T I O N A L T R A D E A N D F I N A N C E 41
Box II.2 (continued)
of debt servicing is granted under a “flow treatment” for a period of one to three years if the country is found to be insolvent andon condition that it follows an IMF-supported adjustment programme; second, part of the “exit treatment” (debt reduction or otherspecial arrangement) is granted during the period of a successor IMF programme; and third, the remainder of the “exit treatment”is given on successful completion of the IMF programme. The Paris Club thus would maintain the link between its relief and debtor-government policy performance, which include a satisfactory payment record with the Paris Club on obligations not waived orrescheduled during the monitored period. In addition, Paris Club creditors, expressing their willingness to tailor debt treatment tothe specific situation of the debtor country, strongly insist on being able to adapt it over time, according to the evolution of the coun-try’s situation.
The Paris Club was also conscious of the need to better coordinate its relief with that of the private creditors, although thelengthy process under the new mechanism may be hard to reconcile with the one-off approach preferred by private creditors, espe-cially bondholders. Moreover, the Paris Club would seek to include provisions to reduce the amount of its debt forgiveness in theevent of an unexpected improvement in the debtor’s situation over time. Such “claw backs” (as they were called in the 1980s) havenot been a standard feature of private sector restructuring in recent years.
Typically in a bond restructuring, a new bond with a different payment schedule and a present value below the original face valueis exchanged for the defaulted bonds (and defaulted bank loans may also be converted into such bonds). Holders of the new bondsare free to sell them on receipt, and a market in such bonds usually develops, with the result that the original creditor does not nec-essarily hold the new bond. In contrast, there is no market in Paris Club loans. In addition, Paris Club creditors typically have anincentive to delay budgetary consequences of having to reduce non-performing claims, whereas the immediate “mark-to-market”practices of private creditors give them an incentive to dispose of their non-performing assets.
Despite such differences, the Paris Club envisages that better communication with private creditors in any specific debt crisis,including early discussion of what might constitute “comparable treatment” of their respective claims, will facilitate reaching a set-tlement. Presumably, private and government creditors would also discuss the degree of overall relief required to move the debtorto a sustainable debt situation. The notion of debt sustainability is, however, a complex one. It may be expected that, while the ParisClub has reserved to itself the responsibility for deciding how much overall relief is required, in close coordination with the IMF, theview of both the private creditors and the government and people of the debtor country would also have to be taken into account.The Paris Club has not yet addressed that coordination question.
a See “Evian Approach”, on the web page of the Paris Club (www.clubdeparis.org, under “Presentation”).b See Group of 8, “Finance Ministers’ Statement,” Deauville, France, 17 May 2003, Annex (www.g7.utoronto.ca/finance/fm030517_communique.htm).c See World Economic and Social Survey, 2003 (United Nations publication, Sales No. E.03.II.C.1), pp. 60-61.d Unlike the HIPC Initiative, debt of non-HIPC countries owed to multilateral institutions will be excluded from comprehensive debt reductions.
the voting power of the smallest members. The Develop-ment Committee of the IMF and World Bank neverthe-less remains committed to working on the issue andplans to consider a “road map” for reform at its meetingin April 2004. This is one avenue to focus political, aswell as technical, attention on the matter of fairness, aswell as on more effective management of the globalfinancial system.
Lastly, in a potentially important step to strengthenglobal economic governance, the General Assemblyagreed in December 200339 to re-establish a set of infor-mal discussion processes that had worked effectively inthe preparation of the International Conference onFinancing for Development in bringing together experts
from national governments, international trade and finan-cial institutions, business and civil society organizationsto develop ideas and proposals for what became theMonterrey Consensus. That is, the Assembly has request-ed the United Nations Secretariat to organize workshopsand “multistakeholder consultations” to examine issuesrelated to the mobilization of resources for financingdevelopment and poverty eradication. It also requestedthe Secretariat to convene activities involving variousstakeholders to promote best practices and exchangeinformation on implementation of the Consensus. Theseprocesses can be not only forums for vetting new ideas,but also mechanisms to build momentum on ideas that arefound attractive to increasing numbers of stakeholders.
W O R L D E C O N O M I C S I T U A T I O N A N D P R O S P E C T S 2 0 0 442
1 For a more detailed discussion of this issue, see Box I.1 and World Economic andSocial Survey 2003 (United Nations publication, Sales No. E.03.II.C.1), pp. 15-16.
2 Since 2001, the United States has imposed 29 per cent countervailing andantidumping duties on Canadian softwood lumber.
3 Czech Republic, Hungary, Poland, Slovakia and Slovenia. 4 Australia is also an important supplier of minerals and metals for China.5 Commodities provided a higher return than equities during the equity bear market
that began in March 2000 (see “Commodities are a big, new theme” in FinancialTimes, 18 September 2003).
6 Introduced into the Common Agricultural Policy (CAP) of the European Union in1988, the set-aside scheme is a system of financial compensation to farmers forleaving a proportion of their land uncultivated for a specified period of time.
7 In October 2003, Chinese importers negotiated the most important buying contractsince 1995 with American exporters, involving a volume of 488,300 bales (1 bale =230 kilograms). Additionally, West African cotton producers are benefiting fromincreased Chinese demand: Burkina Faso, for instance, increased its exports toChina threefold in October 2003 compared to the same month a year earlier. (RadioFrance Internationale and Les Echos, “La Chine fait flamber tous les produits debase”, 27 October 2003).
8 For a detailed analysis of the outcome of the Cancún Ministerial Conference, seeUNCTAD document TD/B/50/8.
9 See Cancún Ministerial Statement (WT/MIN (03)/W/24).10 See General Assembly resolution 58/197 of 23 December 2003.11 The other Central American country, Costa Rica, did not join this agreement
because of its concerns relating to the telecommunications, insurance, agricultureand textiles sectors.
12 See World Economic and Social Survey 2002 (United Nations publication, Sales No.E.02.II.C.1), Box II.2, “The controversy on the imposition of steel safeguards: athreat to international trade?” pp.46-47.
13 India dropped a claim in these areas in view of the insignificant trade involved.14 Extensions of payments are allowed under the Fund’s general policies governing
such payment expectations, including policies under the Supplemental ReserveFacility (SRF), if repayment would cause undue hardship, provided the borrower istaking actions to improve its balance-of-payments situation.
15 The net transfer statistic adds together receipts of foreign investment income andfinancial inflows from abroad minus payments of foreign investment income andfinancial outflows, including increases in foreign reserve holdings. The net trans-fer of a country is thus the financial counterpart to the balance of trade in goodsand services. A trade surplus corresponds to a net outward (negative) transfer anda trade deficit to a net inward (positive) transfer. A trade surplus means the totalvalue of domestic production exceeds domestic consumption and investment, theexcess being transferred abroad instead of being used within the economy, andvice versa for a trade deficit.
16 See World Economic and Social Survey 2003 (United Nations publication, Sales No.E.03.II.C.1), pp. 41-42.
17 See International Monetary Fund, World Economic Outlook, September 2003(Washington, D.C., 2003), pp. 87-92.
18 In 2003, the number and value of cross-border M&As (deals involving the acquisi-tion of more than 10 per cent of the equity of a company) fell 7 per cent and 25 percent, respectively, to 4,200 and $270 billion, their lowest levels since 1998.
19 This is in line with the forecast by the Institute of International Finance which haspredicted a 16 per cent increase in FDI flows to the 29 emerging market economiesin 2004, to $119 billion from $103 billion in 2003. All regions, except forAfrica/Middle East, are expected to receive increased FDI inflows. The reasonsbehind the increase, according to the Institute, include accelerating growth ofemerging markets, the growing comfort of investors with the political climate andpolicy framework in some key emerging economies and a more favourable globaleconomic situation (Institute of International Finance, “Capital flows to emergingmarket economies”, 21 September 2003).
20 See Boris Kagarlitsky, “Comparing Khodorkovsky”, The Moscow Times, 13November 2003, p. 9 (http://www.themoscowtimes.com/stories/2003/11/13/009.html).
21 This section is based on material presented in the UNCTAD press release, “NewFDI pattern emerging, says UNCTAD, reshaped by services economy, new indus-tries” (UNCTAD/PRESS/PR/2003/105, 28 October 2003).
22 For example, 30 per cent of the foreign affiliates established by Japanese manu-facturing TNCs by 2001 were in the services sector.
23 Trade-related activities account for one tenth of all Japanese outward FDI.24 Business activities include real estate. In the case of Hong Kong SAR, it also
includes holding companies.25 See “Summary by the President of the General Assembly of the High level Dialogue
on Financing for Development,” 6 November 2003 (A/58/555), para. 28.26 See letter dated 18 March 2003 from the Permanent Representative of Italy to the
United Nations addressed to the Secretary-General transmitting the RomeDeclaration on Harmonization (A/57/763).
27 See “Summary by the President of the General Assembly…”, op. cit., para. 29.28 See “Summary by the President of the General Assembly…”, op. cit., paras. 32 and
33.29 See “Report of the Managing Director to the International Monetary and Financial
Committee on the IMF’s Policy Agenda”, IMF, 16 September 2003, p. 10(www.imf.org).
30 See “Basel II: Significant Progress on Major Issues”, BIS Press Release, 11 October2003 (www.bis.org).
31 See Financial Action Task Force (FATF) News Release, New Anti-Money LaunderingStandards Released, 20 June 2003 (www.oecd.org/fatf/ #Releases).
32 See statement by Roger Ferguson, Chairman of the Financial Stability Forum, at theInternational Monetary and Financial Committee (IMFC) meeting, 21 September2003, Dubai. (www.fsforum.org).
33 Available at: http://www.iosco.org/news/pdf/10SCONEWS58.pdf34 See “Morelia Communiqué”, Fifth G-20 Finance Ministers’ and Central Bank
Governors’ Meeting, Morelia, Mexico, 26-27 October 2003 (www.g20.org).35 See “Paris Club creditors agree on the Evian Approach”, Press Release, Paris Club,
29 October 2003 (www.clubdeparis.org).36 See Monterrey Consensus, para. 63; in Financing for Development, Building on
Monterrey 2002 (United Nations publication, Sales No. E.02.II.A.S.), p. 11.37 See Development Committee Communiqué, Dubai, United Arab Emirates, 22
September 2003 (http://www.imf.org).38 See “IMF Executive Board Discusses Quota Distribution Issues”, Public Information
Notice (PIN) No. 03/106, 29 August 2003 (http://www.imf.org).39 See General Assembly resolution 53/230 of 23 December 2003.
Notes
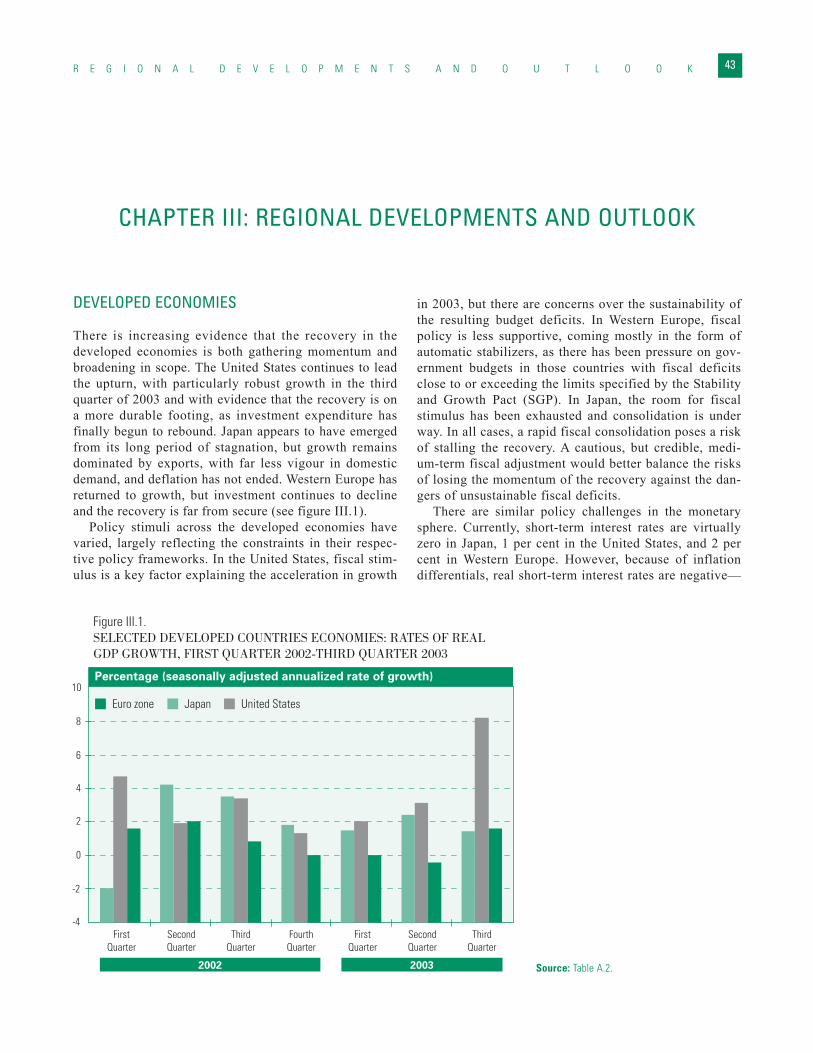
R E G I O N A L D E V E L O P M E N T S A N D O U T L O O K
CHAPTER III: REGIONAL DEVELOPMENTS AND OUTLOOK
43
DEVELOPED ECONOMIES
There is increasing evidence that the recovery in thedeveloped economies is both gathering momentum andbroadening in scope. The United States continues to leadthe upturn, with particularly robust growth in the thirdquarter of 2003 and with evidence that the recovery is ona more durable footing, as investment expenditure hasfinally begun to rebound. Japan appears to have emergedfrom its long period of stagnation, but growth remainsdominated by exports, with far less vigour in domesticdemand, and deflation has not ended. Western Europe hasreturned to growth, but investment continues to declineand the recovery is far from secure (see figure III.1).
Policy stimuli across the developed economies havevaried, largely reflecting the constraints in their respec-tive policy frameworks. In the United States, fiscal stim-ulus is a key factor explaining the acceleration in growth
in 2003, but there are concerns over the sustainability ofthe resulting budget deficits. In Western Europe, fiscalpolicy is less supportive, coming mostly in the form ofautomatic stabilizers, as there has been pressure on gov-ernment budgets in those countries with fiscal deficitsclose to or exceeding the limits specified by the Stabilityand Growth Pact (SGP). In Japan, the room for fiscalstimulus has been exhausted and consolidation is underway. In all cases, a rapid fiscal consolidation poses a riskof stalling the recovery. A cautious, but credible, medi-um-term fiscal adjustment would better balance the risksof losing the momentum of the recovery against the dan-gers of unsustainable fiscal deficits.
There are similar policy challenges in the monetarysphere. Currently, short-term interest rates are virtuallyzero in Japan, 1 per cent in the United States, and 2 percent in Western Europe. However, because of inflationdifferentials, real short-term interest rates are negative—
Figure III.1.SELECTED DEVELOPED COUNTRIES ECONOMIES: RATES OF REAL GDP GROWTH, FIRST QUARTER 2002-THIRD QUARTER 2003
Percentage (seasonally adjusted annualized rate of growth)
First Quarter
Second Quarter
Third Quarter
Fourth Quarter
First Quarter
Second Quarter
Third Quarter
2002 2003
Japan United StatesEuro zone
-4
-2
0
2
4
6
8
10
Source: Table A.2.
and therefore the most expansionary—in the UnitedStates, zero in Western Europe and slightly positive inJapan. This reflects, on the one hand, the active strategyof the United States Federal Reserve (Fed) and, on theother, constraints faced by policy makers in WesternEurope and Japan. In Japan, short-term rates hit the floorof zero early in the slowdown, so that non-traditionalmeasures, in the form of direct injections of liquidity, hadto be utilized but had limited effect. In Western Europe,inflation has not reflected the slowdown but has beenaggravated by various supply shocks, notably theincrease in oil prices, and has remained above theEuropean Central Bank’s (ECB) inflation target. This hasmade further monetary stimulus difficult to justify interms of the policy mandate of the ECB. As economicactivity continues to strengthen, policy will need to betightened to a neutral stance. The timing and speed of thisnormalization will be critical. In this case also, careshould be taken to ensure the durability of the recovery,which argues for caution in policy tightening.
A key challenge for the three major developedeconomies is the realignment of exchange rates that hasbeen taking place. The United States dollar has declinedsignificantly in trade-weighted terms, but mostly againstthe euro, starting 2003 at 1.05 to the euro but falling to1.25 by the end of the year. Against the yen, the move-ment had been more muted, partially due to currencymarket interventions by the Bank of Japan (BoJ), but thefourth quarter of 2003 saw noticeable downward move-ment in the value of the dollar against the yen. The pri-mary force behind the depreciation of the dollar is theUnited States current-account deficit, but the more activemonetary policy of the United States has also led tointerest rate differentials that are in favour of Europe.The countervailing pressures are that the outlook forgrowth in the United States is stronger than that forEurope and relative growth rates between the two areashave been a key reason for euro/dollar movements overthe past few years.
The decline of the dollar can be expected to have a dif-ferent impact on economic activity both within andamong the developed economies. In the United States, themix of activity should move in favour of exports andagainst domestic demand, whilst the reverse should betrue in Western Europe and Japan. Among countries,depreciation of the dollar should boost growth in theUnited States and dampen it in Western Europe andJapan. Given that recovery is not assured in WesternEurope and that growth in Japan still depends heavily onexports, this poses dangers. However, the within-countryadjustments will result in more balanced activity, and thedangers, so long as the adjustment remains orderly, canbe mitigated through appropriate policy adjustment.
North America: a solidifying recovery
Economic recovery in North America is gaining momen-tum, and the United States is taking the lead. With grossdomestic product (GDP) growth above 8 per cent in thethird quarter, the highest in almost two decades, therevival in the United States seems well balancedamongst all sectors, indicating that the long-awaitedrecovery is on a solid track (see table A.2). Although alarge part of the current growth continues to be bolsteredby policy stimuli, which remain crucial for sustaining therecovery in the near future, a shift is under way, suggest-ing a more sustained pattern of growth. Canada was hin-dered by a number of factors in much of 2003, such asthe substantial appreciation of the Canadian dollar, theshocks from SARS, an electricity blackout and traderestrictions on some of its exports, but it has also shownsigns of accelerating growth.
Household spending, which was resilient during thedownturn and has led the recovery, remains strong in theUnited States. The reduction of the income tax, low inter-est rates, and, particularly, the substantial increase inhouse prices1 have been the key factors supporting thegrowth in household spending. With house prices possi-bly peaking and mortgage rates rising, household con-sumption is expected to moderate in the outlook; howev-er, an anticipated improvement in the labour market andcontinued recovery in equity markets will provide newsupport. In Canada, private consumption, supported bylow interest rates, is also outpacing overall growth, butsome moderation is expected in 2004, partly because ofhigh consumer debt levels.
Meanwhile, the crucial transit from strength in house-hold spending to growth in business spending has alreadybegun in both economies. In the United States, there wasa recovery in corporate equipment investment in the sec-ond quarter of 2003, which strengthened in the third quar-ter to a double-digit pace. Recovering corporate profits,higher equity prices and increasing demand for informa-tion and communication technologies (ICT) productshave laid the foundation for further growth of businessinvestment. Many businesses have not yet introducedstate-of-the-art ICT technologies and are now expected todo so, causing continued innovation and diffusion of ICTto remain a driving force for economic growth.
An improvement in the labour market will be criticalfor stronger growth in 2004. Up to the third quarter of2003, the recovery in the United States was characterizedas “jobless”, or even “job loss”, growth. This lag betweenthe recovery in output and the hiring of additional work-ers during an upturn may be particularly pronounced onthis occasion because of low capacity utilization andstrong productivity growth. Nevertheless, data in thefourth quarter of 2003 indicated that the labour market
W O R L D E C O N O M I C S I T U A T I O N A N D P R O S P E C T S 2 0 0 444
was stabilizing, with payroll employment starting to rise.In addition, a strong rebound in the index of manufactur-ing activity suggests a recovery in manufacturingemployment, which has been weak over the past fewyears. The unemployment rate in the United States is,however, not expected to decline significantly in 2004.The unemployment rate in Canada has always been abouttwo percentage points higher than the United States, butCanada achieved a 2 per cent growth in employment for2003, although slower employment growth is projectedfor 2004.
The net contribution of the external sector to GDPgrowth in the United States has been negative for manyyears and is expected to remain so in the near term. Aftera decline for more than two years, real exports rebound-ed by 9 per cent in the third quarter of 2003, led by capi-tal goods, such as aircraft and computers. Meanwhile,real imports, which recovered earlier than exports, con-tinued a modest upward trend. In the United States, thegrowth of both exports and imports is expected to accel-erate in 2004. On the other hand, a major factor behindthe weak overall performance of Canada in 2003 was theloss of Canadian exports to the United States (see ChapterII). As industrial production and import demand in theUnited States recover, Canadian exports are expected togrow in 2004.
Despite the depreciation of the dollar vis-à-vis othermajor currencies, the United States current-accountdeficit swelled further in 2003, reaching an estimated$550 billion, or 5 per cent of GDP. The weak dollar and arecovery in the rest of the world will eventually curb theexternal deficit, but not in the next few years when thedeficit is forecast to grow.2
Inflation in both economies edged up slightly during2003, mainly because of a rise in the prices of commodi-ties, particularly food and energy, but the annual increas-es in consumer prices in both countries were still below 3per cent. Inflation rates are forecast to retreat to below 2per cent.
Monetary policy in the United States has been marked-ly expansionary. The Fed is expected to keep its policyinterest rate at the current level, the lowest in fourdecades, until mid 2004, tightening gradually thereafter.On the other hand, monetary conditions in Canada havebeen tightening as a result of policy moves by the CentralBank of Canada (CBC) and the appreciation of theCanadian dollar. In 2004, the CBC is expected to keeppolicy interest rates at the current level of 2.75 per cent,175 basis points higher than the corresponding rates inthe United States.
Fiscal policy in the United States has been stimulatory,with income tax cuts and growth of federal spending ofabout 8 per cent in real terms in 2003 offsetting therestrictive effects of the budgets of many states and local
governments. Fiscal policy is expected to be less expan-sionary in 2004. The budget deficit of the United States isestimated to have been more than $350 billion in 2003and is forecast to increase to above $450 billion in 2004.In contrast, the fiscal stance in Canada has been slightlyrestrictive and is expected to remain so in 2004, with thebudget remaining in small surplus.
The major caveats and downside risks for the outlookrelate mostly to the large and growing twin deficits of theUnited States and their implications for the exchange rateof the dollar and for the financial markets. The possibili-ty of a bubble in housing prices and the high debt level ofconsumers are also worrisome. On the geopolitical front,the situation in Iraq remains far from stabilized. In themedium run, the crowding-out effects of the large fiscaldeficit and increased military spending may dampenpotential growth of the United States.
Developed Asia and Pacific: is this recovery sustainable for Japan?
The economy of Japan improved measurably over thecourse of 2003, due largely to the more auspicious inter-national economic environment in the second half of theyear, some tangible progress in domestic structural reformand certain policy effects. GDP growth in 2003 is estimat-ed at 2.5 per cent, one of the best performances for sever-al years, and is projected to be above 2 per cent in 2004(see table A.1). After a decade of stagnation, includingthree failed recoveries, this may mark a turning point forthe economy to finally move on to a sustained growthpath. However, many formidable challenges remain: his-torically high unemployment, the large amount of non-performing loans (NPLs), the large government deficitand the high level of public debt, the continued need forcorporate restructuring and, to some extent as a result ofthe above, lingering deflationary pressures.
The recovery is being led by private sector demand,particularly business investment, which recovered fromthe decline of the previous two years. Since its stabiliza-tion at the beginning of 2003, business sentiment has con-tinued to improve, accompanied by a rise in projectionsof capital spending. According to surveys, the businesssentiment of large manufacturing firms has turned posi-tive for the first time since 2000 and that of other firmshas also improved. A key supporting factor for investmenthas been a recovery in corporate profits, coinciding witha recovery in equity prices, but increased exports, thereplenishment of inventories and the reduction of taxes in2003 have all provided stimulus. Business investment isestimated to have grown by about 5 per cent in 2003 andis forecast to strengthen further in 2004, although persist-ent excess capacities may continue to be a dragging fac-tor. In contrast, housing investment remains sluggish, and
R E G I O N A L D E V E L O P M E N T S A N D O U T L O O K 45
public investment is expected to decline further. While household consumption remains weak, con-
sumer confidence has begun to improve. The deteriorat-ing employment and income situation of the past fewyears has been a major factor behind depressed consumersentiment and weak private consumption. The labourmarket has shown some signs of improvement: the unem-ployment rate improved in the third quarter of 2003 (seetable A.2), although it remains historically high; the ratioof job offers to applicants and the number of new joboffers have gradually moved upward; and finally, the pro-tracted decline in wages and compensation seems to bestabilizing. However, the pace of improvement is stillmodest and household spending will therefore likelyremain muted, continuing to be the major hurdle for thesustainability of the overall recovery.
Real net exports contributed positively to the recoveryin 2003. After stagnating in the first half of the year, realexports moved higher in the second half, boosted by salesof capital goods and ICT-related products to East Asia.Real exports are expected to remain strong in 2004 asglobal demand improves. However, the appreciation ofthe yen, particularly if continued, may be a dampeningfactor. Imports are expected to increase with the rise indomestic production and investment. In 2003, the diver-gence in the performance of imports and exportsincreased Japan’s nominal trade surplus, one of the glob-al counterparts of the United States trade deficit. This sur-plus is expected to increase further in 2004.
Deflation in Japan continues, although it deceleratedin 2003. Equity prices dropped to their lowest levels intwo decades early in the year, but subsequently rebound-ed steadily, while real estate prices, both commercial andresidential, continue on a decade-long slide. Mild defla-tion is expected in 2004.
Monetary policy was accommodative during 2003 asthe BoJ used various measures to inject more liquidityinto the economy: it expanded bank reserves both to sta-bilize financial markets during the war in Iraq and tosmooth the end-of-fiscal-year adjustment; it increasedpurchases of stocks from banks; and it bought securitiesissued by small and medium-sized firms. More quantita-tive monetary easing in the same vein is expected in2004. BoJ also purchased United States dollars in the for-eign exchange market in an effort to prevent the yen fromappreciating, but the currency nevertheless appreciatedby more than 10 per cent in 2003. The overnight call ratecontinues to be virtually zero, but there remains a largegap between the growth of the monetary base and of thebroad measure of the money supply, reflecting weakness-es in the commercial banking system and compromisingthe efficacy of monetary easing for boosting real eco-nomic activity. Trammelled by large NPLs and otherproblems, lending from commercial banks continues to
decrease, despite the low interest rates and the highgrowth in the monetary base. There has been someprogress in the disposal of NPLs, but revitalization of thebanking system remains a challenge.
The fiscal position in Japan continues to deteriorate.Fiscal policy has been restrictive, although there was anincrease in the government budget for fiscal year 2003,mainly reflecting higher debt service and higher socialspending. Official budget projections suggest that a rev-enue gap will have to be met by new bond issuances infiscal year 2004 or by an increase in taxes.
Australia and New Zealand, which fared well despitethe global slowdown, experienced a moderation ingrowth during 2003, but an acceleration is expected in2004. The domestic sector in both economies hasremained robust, in particular the housing sector, whichhas been the key source of strength for the past few years.The possibility of a speculative element in housing pricesis a policy concern, because of the risks for economic sta-bility, although the New Zealand housing boom seems tobe supported by strong inward migration.
Australia’s worst drought in 100 years is estimated tohave caused a loss of 1 percentage point of GDP in 2002-2003. With the end of the drought, a rebound in farm out-put will contribute substantially to growth in GDP in2004. Farm income in New Zealand has also been falling,but mainly because of a weakness in exports. Botheconomies suffered weak exports in 2003, due to theappreciation of their currencies by more than 20 per centvis-à-vis the United States dollar, the SARS shock and ageneral weakness in external demand. As a result, currentaccount balances in both economies deteriorated furtherin 2003, to about 6 per cent of GDP.
Inflation remains under the targeted range in botheconomies, and unemployment rates have declined fur-ther, reaching historical lows. Nevertheless, CentralBanks in both economies faced challenges. On the onehand, soaring house prices accompanied by rapidlygrowing housing credit, above-trend growth of domesticdemand and strong imports call for monetary tightening,but weak external demand and large currency apprecia-tion suggest the need for relatively low interest rates onthe other. In Australia, for example, the appreciation ofthe currency implies a significant tightening in monetaryconditions, but this form of tightening has no directimpact on housing demand, whereas it adversely affectsthe weakest part of the economy—exports. Furthermore,appreciation is putting downward pressure on inflation:import prices fell by over 10 per cent in 2003. Withexternal demand for Australia’s commodity exportsimproving and the drought having eased, the CentralBank raised its policy interest rate in November 2003.Any tightening in the two countries in 2004 is expectedto be limited.
W O R L D E C O N O M I C S I T U A T I O N A N D P R O S P E C T S 2 0 0 446
Western Europe: is a recovery finally at hand?
There are increasing signs of economic recovery inWestern Europe. Initially, these were almost entirely inthe form of improving confidence and expectationsrather than in measures of prevailing economic condi-tions.3 A similar situation occurred in the first fourmonths of 2002 and, in that case, the heightened expec-tations did not materialize into stronger growth. To thecontrary, growth was weak, and negative in most of themajor economies, in the first half of 2003. However, firstestimates for the third quarter of 2003 displayed broadevidence that an upturn was under way. Germany, Italyand the Netherlands, which had been in technical reces-sion, and France, which had slumped in the second quar-ter, all returned to growth, while the United Kingdommaintained its more robust pace (see table A.2). Despitethis, the outlook remains fragile. Short-term high-fre-quency data, such as industrial production and retailsales, have been extremely volatile and have yet todemonstrate a sustained upturn. The continuing apprecia-tion of the euro will also put pressure on exports, whilehigh rates of unemployment may lead to caution by con-sumers. On the other hand, strengthening world demandwill provide a boost. GDP for the EU is forecast to growby over 2 per cent in 2004 after less than 1 per cent in2003 (see table A.1).
Despite the appreciation of the euro, the resurgence inglobal demand has overcome the weak growth in exportsthat was a key to the poor performance in early 2003.However, the deterioration in competitiveness as a resultof the depreciation will dampen exports, making overallgrowth more dependent on the strengthening of domesticdemand that is expected in 2004. Private consumptionwill be driven by increases in real disposable income,supported by a fall in inflation (induced in part by thestrengthening euro), low interest rates (which reduce debtburdens) and continued improvements in wealth as equi-ty markets strengthen. However, unemployment isexpected to remain high, leading to consumer caution andhigher rates of saving. Government spending continues tobe a positive factor, but will be become more restraineddue to budgetary pressures. Investment has been anotherdrag on growth, but is expected to gradually turn around.Strengthening foreign demand should boost investment,and financing conditions are also expected to continue toimprove—interest rates are expected to remain low, bal-ance sheet constraints are diminishing as equity pricesrise and the banking sector is improving.
Inflation, as measured by the Harmonised Index ofConsumer Prices (HICP), fell below 2 per cent in mid2003 but rose marginally towards the end of the year, andremains above the ECB definition of price stability.4
There had been a general expectation that price increases
would decelerate throughout the year, given slow growthand an appreciating currency, but this proved incorrectbecause of higher-than-anticipated energy and food pricesand the slow feed-through of the currency appreciation.Inflation rates varied substantially across the region. InOctober, for example, HICP inflation for the euro areawas 2 per cent, but it was close to 1 per cent for threecountries and close to 3 per cent for four countries. Moreimportantly, the inflation differential between two of themajor economies in the region, France and Germany, wasa full percentage point, indicating significant differencesin economic conditions. Inflation is still expected todiminish gradually: the sustained appreciation of the euroshould eventually provide downward pressure; the fore-cast decline in oil prices should also contribute; and theslowness of the recovery, with output reaching potentialonly in 2005, should reduce the possibility of inflationarypressure.
Unemployment has not deteriorated to the extent thatit did in previous downturns. During the slowdown of theearly 1990s, unemployment rates in many Europeancountries increased by about three percentage points, andreached almost 11 per cent for the euro zone as a whole.In the present case, unemployment is expected to exceedits low in the first half of 2001 by only about 1 percent-age point. This reduced deterioration can be attributed, inpart, to the labour market reforms being undertaken in anumber of countries. However, the rate is still high whencompared to other developed countries, or even to somecountries within the region. In addition to the laggingnature of movements in employment over the course of abusiness cycle, the output gap is not expected to closesufficiently in 2004 to generate strong labour demand:unemployment is expected to increase marginally beforedecreasing towards the end of the year.
Fiscal policy through the free play of automatic stabi-lizers, some discretionary measures, as well as spendingoverruns, has been supportive during the period of slowgrowth, but at the expense of deteriorated fiscal positions.In a number of countries, deficits have been well inexcess of the limit of 3 per cent of GDP enshrined in theSGP. Germany and France both exceeded the limit in2002 and are estimated to have had record deficits ofnearly 4 per cent of GDP in 2003, with only minorimprovements likely in 2004. Portugal, having exceededthe limit in 2001, is estimated to have done so again in2003, while Italy, the Netherlands and the UnitedKingdom have seen slippages putting them close to theboundary. These pressures eliminated the possibility ofthe active use of discretionary fiscal policy for manycountries in 2003. Consequently, the overall fiscal policystance in the euro zone, as measured by the cyclicallyadjusted primary balance, was broadly neutral. In addi-tion, the need to deal with countries that were in breach
R E G I O N A L D E V E L O P M E N T S A N D O U T L O O K 47
of the SGP led to a decision that was interpreted by manyas a suspension of the SGP. Regardless of how this issueis ultimately resolved, the immediate priority should be tosupport the recovery; further fiscal consolidation shouldbe postponed until economic activity has returned to amore solid footing.
Monetary policy in the region continues to be moder-ately stimulative. Short-term interest rates in the eurozone have been at 2per cent since the last rate cut in June2003 and, with inflation hovering at 2 per cent, real short-term rates are zero. However, this stimulus is offset tosome extent by the appreciation of the currency, togetherwith some upward movement in long-term interest rates.In addition, the large differences in rates of inflationacross the region result in equivalently large differencesin real rates of interest, and thus different degrees of mon-etary stimulus. This has had the paradoxical result thatGermany, with one of the weakest growth performances,has one of highest real rates of interest.
With mounting evidence that recovery is under way,the likelihood of further monetary easing has receded,and the challenge has become the timing of the return toa more neutral policy stance. The United Kingdom raisedits short-term policy rate by 25 basis points (bps) to 3.75per cent in early November 2003. However, for mostother countries, there are reasons for this change in poli-cy direction to be delayed. The recovery remains tenta-tive, the appreciation of the euro has already resulted in amore restrictive monetary environment and the expecteddecline in inflation will yield higher real interest rates.ECB policy is forecast to remain unchanged until thefourth quarter of 2004, at which point short term rateswill be increased by 25 bps.
While the outlook for Western Europe is one of gradu-ally improving performance, there are risks. Of primaryconcern is further rapid euro appreciation. This wouldhave a strong negative impact on export performance,perhaps pushing some countries back into recession.However, within bounds, further euro appreciation couldbe managed through policy action, and could yield a bet-ter balance between domestic and foreign demand.Lowering interest rates in the face of the on-going appre-ciation would be maintaining constant monetary condi-tions and would boost domestic demand, particularlyinvestment, as well as reduce the interest differential thatis contributing to the euro’s strength. A stronger currencywould also provide impetus to consumption expenditurethrough improved terms of trade.
A second risk lies in the fiscal arena and concerns theSGP and sustainable public finances. The current situa-tion demonstrates the need for an active countercyclicalpolicy in the euro zone. At the same time, any perceivedweakening of the commitment to fiscal sustainability is
dangerous and may already have contributed to theincrease in long-term interest rates. Further weakeningcould provoke a stronger market response. In addition,the looming demographic impact on pensions and othersocial benefits will require substantial fiscal leeway inthe future.
Finally, there continues to be uncertainty over the paceand durability of structural reforms. Progress has beenmade, but reforms of the labour market, pensions andhealthcare expenditures are far from complete, particular-ly in light of the looming ageing problem. The uncertain-ty surrounding the adoption of the reforms has con-tributed to the cautious behaviour of economic agents andhence to the slow growth in the region.
ECONOMIES IN TRANSITION
Growth in the economies in transition accelerated to about5 per cent in 2003, outpacing the world economy (see fig-ure III.2). The dynamism within the group was more pro-nounced in the Baltic countries, where it was driven bydomestic demand, and in the economies of theCommonwealth of Independent States (CIS), where asurge in world oil prices and investment boosted growthin many countries (see table A.3). Growth in Central andEastern Europe improved in 2003 and is forecast tostrengthen further in 2004 with the recovery of WesternEuropean import demand and as five Central and EasternEuropean countries join the EU. Economic activity in theCIS is expected to slow as oil prices weaken and domesticdemand decelerates but will remain robust. Maintainingsustainable growth in the CIS depends on continuedreforms to reduce these economies’ high dependency onnatural resources and on adjusting macroeconomic poli-cies, including adopting more flexible exchange rates.
Central and Eastern Europe: a modest recovery
Economic growth in the Central and Eastern Europeanregion accelerated to 3.3 per cent in 2003 and is expect-ed to strengthen to 4 per cent in 2004. The improvementin 2003, however, was mostly due to a rebound in Polandwhere it was export-led; in almost all other economies,GDP growth moderated, in spite of strong private con-sumption in many countries and strong export perform-ance in a few cases. Given their high degree of integra-tion of trade and production with the EU, these countrieshad limited room for counter-cyclical policy action inresponse to the continuing weakness of EU markets.Investment in Central Europe stagnated and this mayadversely affect medium-term prospects and the speed ofconvergence of the new members in the EU.
W O R L D E C O N O M I C S I T U A T I O N A N D P R O S P E C T S 2 0 0 448
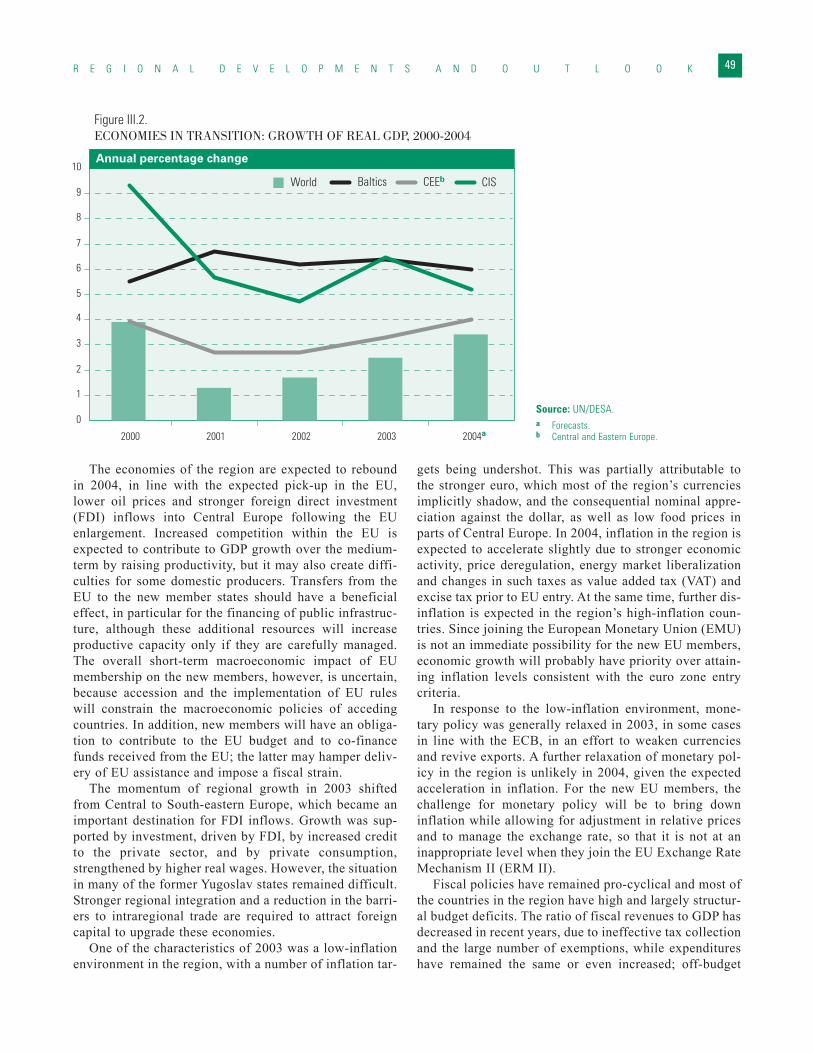
The economies of the region are expected to reboundin 2004, in line with the expected pick-up in the EU,lower oil prices and stronger foreign direct investment(FDI) inflows into Central Europe following the EUenlargement. Increased competition within the EU isexpected to contribute to GDP growth over the medium-term by raising productivity, but it may also create diffi-culties for some domestic producers. Transfers from theEU to the new member states should have a beneficialeffect, in particular for the financing of public infrastruc-ture, although these additional resources will increaseproductive capacity only if they are carefully managed.The overall short-term macroeconomic impact of EUmembership on the new members, however, is uncertain,because accession and the implementation of EU ruleswill constrain the macroeconomic policies of accedingcountries. In addition, new members will have an obliga-tion to contribute to the EU budget and to co-financefunds received from the EU; the latter may hamper deliv-ery of EU assistance and impose a fiscal strain.
The momentum of regional growth in 2003 shiftedfrom Central to South-eastern Europe, which became animportant destination for FDI inflows. Growth was sup-ported by investment, driven by FDI, by increased creditto the private sector, and by private consumption,strengthened by higher real wages. However, the situationin many of the former Yugoslav states remained difficult.Stronger regional integration and a reduction in the barri-ers to intraregional trade are required to attract foreigncapital to upgrade these economies.
One of the characteristics of 2003 was a low-inflationenvironment in the region, with a number of inflation tar-
gets being undershot. This was partially attributable tothe stronger euro, which most of the region’s currenciesimplicitly shadow, and the consequential nominal appre-ciation against the dollar, as well as low food prices inparts of Central Europe. In 2004, inflation in the region isexpected to accelerate slightly due to stronger economicactivity, price deregulation, energy market liberalizationand changes in such taxes as value added tax (VAT) andexcise tax prior to EU entry. At the same time, further dis-inflation is expected in the region’s high-inflation coun-tries. Since joining the European Monetary Union (EMU)is not an immediate possibility for the new EU members,economic growth will probably have priority over attain-ing inflation levels consistent with the euro zone entrycriteria.
In response to the low-inflation environment, mone-tary policy was generally relaxed in 2003, in some casesin line with the ECB, in an effort to weaken currenciesand revive exports. A further relaxation of monetary pol-icy in the region is unlikely in 2004, given the expectedacceleration in inflation. For the new EU members, thechallenge for monetary policy will be to bring downinflation while allowing for adjustment in relative pricesand to manage the exchange rate, so that it is not at aninappropriate level when they join the EU Exchange RateMechanism II (ERM II).
Fiscal policies have remained pro-cyclical and most ofthe countries in the region have high and largely structur-al budget deficits. The ratio of fiscal revenues to GDP hasdecreased in recent years, due to ineffective tax collectionand the large number of exemptions, while expenditureshave remained the same or even increased; off-budget
R E G I O N A L D E V E L O P M E N T S A N D O U T L O O K 49
Figure III.2.ECONOMIES IN TRANSITION: GROWTH OF REAL GDP, 2000-2004
Annual percentage change
Baltics CEEb CISWorld
0
1
2
3
4
5
6
7
8
9
10
2000 2001 2002 2003 2004a
Source: UN/DESA.a Forecasts.b Central and Eastern Europe.
spending was reduced only recently. In order to balancebudgets, a reform of public finances is needed, includingchanges in the pension system. Many governments haveadopted plans to reduce their deficits in order to preparefor the adoption of the euro in several years. The imple-mentation of these plans may be difficult, and even tar-geted budget deficits for 2004 are high in Central Europe.The fiscal situation is better in some countries of South-eastern Europe, where there are stand-by agreements withthe International Monetary Fund (IMF).
There was some improvement in the employment situa-tion in Bulgaria and Slovakia in 2003, but not in othercountries of the region, due to growing labour productivi-ty in the industrial sector, increased real wages and the lowmobility of the population. The highest rates of unemploy-ment are in Poland and most of the former Yugoslav states.Since a number of loss-making state-owned enterprises arestill to be privatized in the most advanced countries of theregion, little progress in reducing unemployment is expect-ed in the short term. The largest problem is that unemploy-ment in the region is structural and does not fall signifi-cantly with the growth of output.
Current accounts in the region remain in deficit.Strong import demand, driven by private consumption inthe Czech Republic and Hungary and by growth ofinvestment in Bulgaria and Romania, overshadowedexports in 2003. Tourism receipts failed to grow and therepatriation of profits from the region put a further strainon current accounts. Adverse weather conditions inSouth-eastern Europe may increase imports of grain andfuel during the winter period. Exports are expected tostrengthen in 2004, but the strong growth in imports isalso expected to continue because of EU membership, theimplementation of public infrastructure projects, therecovery of domestic demand and continued stronggrowth in investment. In the past, current-account deficitswere fully covered by FDI inflows, but the future may seeexternal borrowing if entry into the EU is not followed bycontinued strong FDI.
The main policy challenge for the countries joining theEU in 2004 is to finalize preparations for the accessionand to work out a comprehensive post-enlargement strat-egy, ensuring that the application of EU rules and regula-tions does not have an adverse impact on their economies.The largest risk to the region is prolonged stagnation andweaker business confidence in the EU, the impact ofwhich may, however, be mitigated if some EU productionis relocated to the region as a cost-cutting measure.
Commonwealth of Independent States: sustaining fast growth
Economic growth in the CIS accelerated in 2003, sup-ported by favourable external conditions and increased
investment in many countries. Regional GDP growth ofover 6 per cent is projected to moderate slightly in 2004as a result of a deceleration in domestic consumption andweakening oil prices (see table A.3). Real incomes aregrowing due to real wage and pension increases in manycountries, albeit from a very low base. Policy reforms inmany countries have boosted consumer and investor con-fidence and will continue to bolster economic growth in2004. The divergence in economic performance amongcountries is still heavily determined by the initial condi-tions of the transition, the pattern of reforms and, mostnotably, their implementation and progress, all of whichcreate different prospects for sustained growth in themedium term.
Economic growth in the region is driven mainly by theRussian Federation. Fostered by the surge in oil pricesand robust domestic demand, Russian GDP grew by over6 per cent in 2003, but growth is expected to moderate toabout 5 per cent in 2004. The key elements behind thisgrowth are strong increases in consumption, fixed capitalformation and exports, mostly of oil, natural gas and non-ferrous metals. FDI more than doubled in the first half of2003 and is expected to grow further with the liberaliza-tion of currency controls while the upgrading of Russiansovereign debt to investment grade has improved theprospects for other capital flows. However, these inflowsare causing a real appreciation of the ruble, which isadversely affecting the competitiveness of manufacturingand, combined with increased imports of final goods, ishindering industrial diversification. Real wage increasesare outpacing productivity growth, putting additionalpressure on costs. These tendencies, if they continue, willmake a shift to competitive non-oil sector activities diffi-cult, widening the gap between the oil sector and the restof the economy.
Growth in Ukraine and Belarus has benefited fromspillover effects from the Russian Federation. Supported bystrong increases in exports, private consumption (due toreal wage increases) and gross fixed capital formation, theirgrowth will remain robust in 2004. Rising oil prices andincreasing hydrocarbon investments boosted economicactivity in the Caspian region in 2003, and further invest-ment will continue to support growth in the future.
For the energy-exporting countries, such as theRussian Federation, Azerbaijan and Kazakhstan, futuregrowth depends heavily on their ability to transfer accu-mulated export revenues into a broader investment frame-work, in particular to strengthen investment in non-ener-gy sectors. Large-scale projects, like the construction ofthe Baku-Tbilisi-Ceyhan oil pipeline, are boosting invest-ment in some non-oil-producing countries while politicaltensions and uncertainties about future economic devel-opment are key factors in Georgia.
Labour market conditions in the region are difficult to
W O R L D E C O N O M I C S I T U A T I O N A N D P R O S P E C T S 2 0 0 450
evaluate due to the highly unreliable data. In the RussianFederation, for which data are available, the unemploymentrate rose marginally in 2003, while the sectoral reallocationof labour improved labour productivity, most notably in oiland coal production. The number of unemployed fell inKazakhstan, but increased in Azerbaijan, Belarus, Moldovaand Ukraine. In many CIS countries, unemployment is par-ticularly acute in rural regions. In Armenia, for example,unemployment is around 9 per cent, with the majority of theunemployed being in rural regions.
External imbalances pose a risk for many of the ener-gy-importing countries, although the external situation ofthe region as a whole improved in 2003 as a result ofhigher fuel prices. The region’s current-account balancesare likely to deteriorate because of weak exports andstrong imports driven by domestic demand, demand byforeign investors and currency appreciation in manycountries. However, some improvements in the invisiblecomponents of the balance of payments, such as transitpayments from Russian oil and gas exporters and remit-tances, will have a positive effect on external balances.
Despite higher oil prices, the average inflation rate forthe region continues to decline (see table A.3), butremains higher than in other regions of the world. Thelarge differences in inflation rates across the region aredue to different policies and price controls on utilities.Monetary policy is geared to price stability and its tight-ening has helped to curb inflation in many countries ofthe region. The instrument used to control liquidity is theinterest rate, but priority has often been given to smooth-ing exchange-rate fluctuations rather than price volatility.Taking into account the limited instruments for absorbingliquidity, large capital inflows could compromise the effi-ciency of monetary instruments and have an inflationaryoutcome. On the other hand, monetary policy in manycountries of the region is hindered by underdevelopedfinancial intermediaries and distortions in the economy,preventing changes in policy interest rates from beingtransferred to financial markets.
For the Russian Federation, inflation is determined bythe tight control over administered prices on the one handand, on the other, by the monetary efforts of the CentralBank (TsBR) to prevent faster nominal appreciation of theruble. Because of the high and persistent current accountsurplus and reduced capital flight, the TsBR’s official pol-icy to limit real appreciation and smooth the exchange ratehas increased the monetary base, expanding the supply ofmoney and credit. Such a policy may not be sustainable orconsistent with the targeted inflation rate of 10 per cent for2004. Weakening global energy prices and prudent fiscaland monetary policies in the region are expected to reducethe average inflation rate in 2004.
On the fiscal side, most countries in the region haddeficits in 2003, with the Russian Federation and Ukraine
being exceptions. In the Russian Federation, the govern-ment budget is in surplus for a fourth consecutive yearand is expected to remain so in 2004. In Ukraine, a smalldeficit is anticipated, due to a reduction in taxes andbecause difficulties in securing multilateral finance arelikely to increase domestic borrowing. Elsewhere in theregion, further changes in tax systems, progress in pen-sion reform and prudent budgetary and debt managementpolicies are necessary to address the fiscal deficits. Moreimportant, however, is ensuring that fiscal expenditureshave a positive effect on GDP and real income growth. Inhigh-deficit low-income countries, such as the CIS-7(Armenia, Azerbaijan, Georgia, Kyrgyz Republic,Republic of Moldova, Tajikistan and Uzbekistan), publicsector spending is characterized by poor governance,which is adversely affecting investment. Achieving anappropriate balance between macroeconomic stabilityand restructuring in pursuit of sustainable growth will becrucial to the region’s development.
Baltic countries: fastest growing region
The economies of the Baltic States continue to grow vig-orously, outpacing the Central and Eastern Europeancountries and remaining largely unaffected by the weak-ness in Western Europe (see table A.3). Their relativelystable growth is based on domestic demand, supported bystructural reforms. EU accession will provide an addition-al stimulus to these countries because of the inflows ofgrants, the opportunities for further integration and theconsolidation of reforms. At the same time, EU member-ship will make the prospects of these economies moredependent on the euro area. Growth is expected to remainbuoyant but will moderate to about 6 per cent in 2004.
Average inflation in the group is increasing, mainlybecause of increases in administered prices and higherimport prices in Latvia. Because its currency is pegged tothe special drawing rights (SDR), which gives significantweight to the US dollar, Latvia experienced changes inprices that were correlated with the dollar depreciation.The dollar depreciation will continue to create uncertain-ty, not so much for inflation but for the country’s tradebalance.
The region’s fiscal deficits are growing because of risingexpenditures to co-finance EU projects and to manage EUfunds and, in the case of Lithuania, because of subsidies toagriculture. Large current-account deficits pose anotherrisk for these economies. Inflows of FDI cover a large partof these deficits, but external loans are increasing. Theselarge external deficits and the high and persistent unem-ployment are the key macroeconomic challenges for thesecountries. Unemployment in the region was above 8 percent in 2003 and is likely to remain high due to ongoingenterprise restructuring and labour market rigidities.
R E G I O N A L D E V E L O P M E N T S A N D O U T L O O K 51
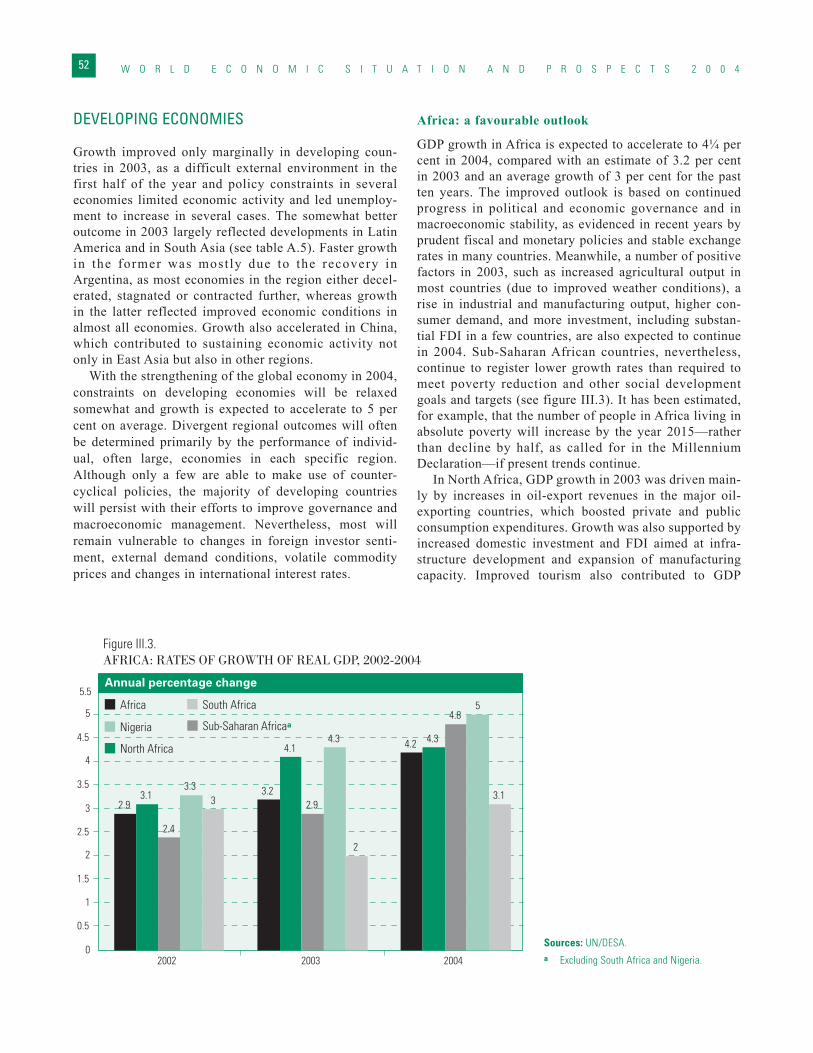
DEVELOPING ECONOMIES
Growth improved only marginally in developing coun-tries in 2003, as a difficult external environment in thefirst half of the year and policy constraints in severaleconomies limited economic activity and led unemploy-ment to increase in several cases. The somewhat betteroutcome in 2003 largely reflected developments in LatinAmerica and in South Asia (see table A.5). Faster growthin the former was most ly due to the recovery inArgentina, as most economies in the region either decel-erated, stagnated or contracted further, whereas growthin the latter reflected improved economic conditions inalmost all economies. Growth also accelerated in China,which contributed to sustaining economic activity notonly in East Asia but also in other regions.
With the strengthening of the global economy in 2004,constraints on developing economies will be relaxedsomewhat and growth is expected to accelerate to 5 percent on average. Divergent regional outcomes will oftenbe determined primarily by the performance of individ-ual, often large, economies in each specific region.Although only a few are able to make use of counter-cyclical policies, the majority of developing countrieswill persist with their efforts to improve governance andmacroeconomic management. Nevertheless, most willremain vulnerable to changes in foreign investor senti-ment, external demand conditions, volatile commodityprices and changes in international interest rates.
Africa: a favourable outlook
GDP growth in Africa is expected to accelerate to 4¼ percent in 2004, compared with an estimate of 3.2 per centin 2003 and an average growth of 3 per cent for the pastten years. The improved outlook is based on continuedprogress in political and economic governance and inmacroeconomic stability, as evidenced in recent years byprudent fiscal and monetary policies and stable exchangerates in many countries. Meanwhile, a number of positivefactors in 2003, such as increased agricultural output inmost countries (due to improved weather conditions), arise in industrial and manufacturing output, higher con-sumer demand, and more investment, including substan-tial FDI in a few countries, are also expected to continuein 2004. Sub-Saharan African countries, nevertheless,continue to register lower growth rates than required tomeet poverty reduction and other social developmentgoals and targets (see figure III.3). It has been estimated,for example, that the number of people in Africa living inabsolute poverty will increase by the year 2015—ratherthan decline by half, as called for in the MillenniumDeclaration—if present trends continue.
In North Africa, GDP growth in 2003 was driven main-ly by increases in oil-export revenues in the major oil-exporting countries, which boosted private and publicconsumption expenditures. Growth was also supported byincreased domestic investment and FDI aimed at infra-structure development and expansion of manufacturingcapacity. Improved tourism also contributed to GDP
W O R L D E C O N O M I C S I T U A T I O N A N D P R O S P E C T S 2 0 0 452
Figure III.3.AFRICA: RATES OF GROWTH OF REAL GDP, 2002-2004
Annual percentage change
Africa
2.93.2
4.2
3.1
4.14.3
2.4
2.9
4.8
3.3
4.3
5
3
2
3.1
0
0.5
1
1.5
2
2.5
3
3.5
4
4.5
5
5.5
2002 2003 2004
North Africa
Nigeria
South Africa
Sub-Saharan Africaa
Sources: UN/DESA.a Excluding South Africa and Nigeria.
growth in Egypt and Tunisia, recovering from the disrup-tions caused by the prospects of conflict in Iraq, whereasthe Moroccan tourism sector suffered a serious setbackafter a terrorist bombing in Casablanca in May 2003.
Economic growth in sub-Saharan Africa is expected toaccelerate from 2.9 per cent in 2003 to 4¾ per cent in2004-2005. A few countries will achieve high growth as aresult of either successful political and economic reforms(Ghana, Mauritius, Mozambique, United Republic ofTanzania and Uganda) or increased oil output, either asnew producers (Chad, Equatorial Guinea and Sudan) or asa result of substantial investment to increase productioncapacity (Angola). Substantial South African private sec-tor investment in infrastructure development andincreased industrial capacity in minerals and metals pro-cessing for the export market will continue to underpingrowth in Namibia, Mozambique and several other coun-tries in southern Africa. Countries that have emergedfrom recent conflicts (for example, the DemocraticRepublic of the Congo and Madagascar) are also expect-ed to register high rates of growth.
In most sub-Saharan African countries, however,growth is expected to be based primarily on increasedagricultural output and on manufacturing and distributivetrades linked to the agricultural sector. These countrieswill also continue to benefit from increased export oppor-tunities brought about by incentives provided by theUnited States African Growth and Opportunity Act(AGOA).
Burundi, the Central African Republic, Côte d’Ivoire,Ethiopia, Guinea Bissau, Seychelles and Zimbabwe suf-fered economic contraction in 2003. Growth is anticipat-ed to resume in all these economies in 2004, except inSeychelles and Zimbabwe, where severe economicdecline is expected to continue, although the contractionwill likely be less severe than in the past four years.5
Among the larger economies in sub-Saharan Africa,growth in 2003 was disappointing in South Africa despitestrong domestic demand driven by lower inflation,increased investment spending and a moderately expan-sionary fiscal stance. In Nigeria, GDP growth was sus-tained by higher oil-export revenues and increased privateconsumption. The country’s election in 2003 was taken asa strong mandate for the Government to introduce eco-nomic reforms, including deregulation of the petroleum-product industry to relieve shortages. These shortages hadled to severe capacity underutilization in the manufactur-ing sector because of unreliable and inadequate electricitygeneration and frequent bouts of civil unrest.
At the regional level, the trend towards lower inflationin recent years was interrupted by sharp increases ininflation to double-digit rates in some economies in 2002and 2003; these were caused primarily by higher foodprices due to drought, higher oil-import prices and cur-
rency depreciation in several countries. The continuingand rapid acceleration of inflation in Zimbabwe had anegative impact on average inflation for the region in2003 and on its projected further acceleration in 2004(see table A.5). 6
The outlook for African economies rests on continuedimprovements in political and economic governance andthe maintenance of macroeconomic stability. Increasedagricultural output is expected to continue in 2004 due toimproved weather conditions. Normal rainfall and grow-ing patterns have returned to many countries in easternand southern Africa most severely affected by drought inrecent years. Industrial and manufacturing output willalso continue to increase in several countries as a result oflower inflation, increased consumer demand and higherinvestment, including FDI.
Africa’s improved economic performance in 2004 alsodepends heavily on the anticipated recovery of externaldemand for African exports in industrial countries, par-ticularly in Europe, increased market access for agricul-tural exports and firmer international prices for the majorexport commodities of the region. The fulfilment of com-mitments made by the international community to supportAfrica’s social and economic development throughincreased official development assistance (ODA), debtrelief and FDI will also be important.
Earlier fears of instability and unrest in North Africancountries as a result of conflicts in the Middle East werelessened by the quick invasion phase of the Iraqi conflict.Isolated and largely unpredictable geopolitical incidents,such as the May 2003 terrorist bombing in Morocco, areamong the few downside risks that should be weighedagainst the generally optimistic outlook for North Africa.The continuing conflict in Côte d’Ivoire and its adversecontagion effects present similar downside risks to sever-al neighbouring countries in West Africa.
East Asia and China: strong recovery interrupted
The recovery of East Asian economies, affected by aslowdown in the first half of 2003, continues and isexpected to strengthen further in the near term. For 2003as a whole, however, economic growth—estimated at 5.3per cent—was lower than in 2002 (see table A.5). Exceptfor China, Malaysia, Thailand and Viet Nam, growthdecelerated in most economies of the region. In 2004,growth is expected to consolidate and broaden in linewith improved external and domestic demand. Countries’performances are anticipated to be less uneven, and theregion is expected to grow by 6¼ per cent. This out-come, however, is partly influenced by the growingweight of the Chinese economy in the region. ExcludingChina, East Asia is forecast to grow by 5 per cent in2004.
R E G I O N A L D E V E L O P M E N T S A N D O U T L O O K 53
Most of the newly industrialized economies (NIEs)7
slowed in 2003. In Singapore and Taiwan Province ofChina, this was largely attributable to the adverse impactof the SARS epidemic; in the Republic of Korea, it wasmainly due to tightened household credit early in theyear, labour unrest, adverse weather conditions andheightened political uncertainty.
A rebound in both exports and domestic demandunderpinned the recovery in the region. Export growthhas picked up in recent months and is likely to acceleratein 2004 in line with the strengthening of global demand.The continuing recovery of ICT exports, the upturn indemand in the United States and vibrant intraregionaltrade bode well for the region’s exports.
The Chinese economy rebounded strongly after theSARS crisis, supported by policy stimuli. While therecovery has been well balanced across all sectors, it wasled by domestic spending on housing, cars and ICT prod-ucts and by China’s booming international trade.Nevertheless, maintaining its rapid growth will requireChina to address the fragilities in its financial system, andespecially in its banking sector, particularly because ofthe low efficiency and high rates of NPLs in four majorstate-owned banks.8 The Government has announced amajor plan of reforms for the banking sector to be imple-mented in 2004, involving an injection of public funds torecapitalize these four banks, the transfer of additionalNPLs to asset management companies and ownershiprestructuring, including an eventual public listing of thesebanks in either domestic or overseas stock markets.9 Thesuccess of this plan will be crucial for China to sustainrobust growth in the longer run, but it also involves somerisks for the stability of the economy and for the sound-ness of the government fiscal position.
Domestic demand in the region is expected to contin-ue to improve into 2004, supported by expansionary poli-cies, rising exports, higher stock prices, softening oilprices and improving confidence. In Hong Kong SpecialAdministrative Region (SAR) of China, the Philippinesand Thailand, respectively, the surge in tourist inflowsfrom China (if continued), large inflows of remittancesand high rural income due to firmer agricultural pricesand rural support programmes should also boost domesticdemand. Conversely, in Indonesia and the Philippines,ongoing fiscal consolidation and, in Taiwan Province ofChina and Singapore, high unemployment and weak(albeit mildly improving) property markets weigh ondemand expansion. In the Republic of Korea, the positiveeffects from fiscal stimuli appear to be partially offset byheightened political uncertainty, restrictions on the realestate market and large household debts.
The labour market situation, after worsening in thefirst half of 2003 improved in line with the recovery ofthe region’s economies. In the coming months, employ-
ment will continue to increase in most economies asgrowth picks up, but the improvement will be gradual andthe unemployment rate will remain relatively high. In theNIEs, employment in the manufacturing sector continuesto be restrained by corporate retrenchment. In theseeconomies, the youth unemployment rate is extremelyhigh and is a cause of concern. Similarly, in China, con-tinuing layoffs by state-owned enterprises undertakingrestructuring, the large amount of surplus labour in ruralareas and the annual addition of about 10 million peopleto the labour force means that unemployment remains amajor policy challenge.
Inflation has been subdued in the region (see table A.5), allowing for relaxed monetary policy stances. After aperiod of deflation, China has been experiencing a mod-est increase in consumer prices (see table A.6), partiallyattributable to increases in food prices. The latter werebrought about by an upward trend in the internationalprices of commodities as well as by a reduction in thesowing area for some agricultural products. The rise infood prices will raise overall inflation, but a furtheracceleration of inflation is not foreseen.
Counter-cyclical policies continue to play an impor-tant role in the region. Due to weaker domestic demandand heightened uncertainty, monetary policy was relaxedfurther in several East Asian economies in the first half of2003 and is expected to remain accommodative for thenext several months to ensure the recovery. As the recov-ery becomes secure, inflationary pressures edge up andinternational interest rates rise, countries are expected toshift their policy to a less expansionary stance, possiblyby mid-2004. The policy change, however, is likely to begradual.
Fiscal policy in most economies (except for Indonesiaand the Philippines) turned more expansionary in the firsthalf of 2003 to support domestic demand. Manyeconomies introduced relief packages to offset theadverse impact of SARS; these, together with the eco-nomic slowdown, led to a deterioration in fiscal balances.Fiscal policy will remain expansionary in most countriesfor the next several months, but is then expected to betightened. This, combined with stronger growth, willresult in improved fiscal positions, although countriesmay not achieve their original fiscal targets. Later in theyear, rising exports, reduced uncertainty and improvedmarket sentiment, combined with lower oil prices, willcontinue to sustain domestic demand as policy support isgradually withdrawn. In China, macroeconomic policieswill likely become similarly less stimulatory, but in thiscase the aim will be to pre-empt overheating in certainsectors of the economy. Concerns about deflation over thepast few years have recently been replaced by worriesabout possible bubbles, particularly in real estate, and theassociated risks for future macroeconomic stability. In
W O R L D E C O N O M I C S I T U A T I O N A N D P R O S P E C T S 2 0 0 454
all, domestic demand will continue to be buoyed by poli-cy stimuli through early 2004.
Prospects for the region remain generally positive.First, export growth will be supported by the recovery inworld demand although, in a number of economies, theappreciation of local currencies against the dollar maydampen exports. Second, global ICT markets, which arecrucial to the region’s export recovery, are expected torebound in 2004. On the other hand, domestic demandand production may be constrained by high unemploy-ment and low capacity utilization and, in a number ofeconomies, by large household debts, tightened restric-tions on the real property sector and geopolitical uncer-tainty. Policy support will also begin to wane in the sec-ond half of 2004. In the NIEs, corporate retrenchmentowing to the relocation of production facilities to Chinaand other low cost neighbours will also continue to weighon investment, employment and growth.
South Asia: sustaining growth amidst fiscal imbalances
Growth in South Asia began to rebound in the first halfof 2003 and continued to strengthen and broaden duringthe year. The spillover from the invasion of Iraq andSARS was relatively modest in the region. Growth isexpected to continue at a comparable pace in 2004 (seetable A.5). In addition to normal weather conditions andrising exports, the region’s broad-based recovery will beunderpinned by low interest rates, softer oil prices,improved non-oil primary commodity prices, continuingforeign financial assistance and investment and overallimprovements in the security situation.
Growth in the region in 2003 was supported byfavourable agricultural production and rising domesticand external demand. Low interest rates, rising incomesand improved consumer and investor confidence boosteddomestic demand. On the supply side, a strong rebound inagricultural production—excluding Sri Lanka, which suf-fered heavy rain damage—was a major contribution tothe broad-based recovery.
Industrial production reacted positively to these devel-opments, while the service sector has benefited from theoverall strengthening of economic activity in the region.In India, a bumper harvest in this crop cycle, due to ade-quate rainfall during summer, will boost rural incomesand consumption for the next several months. Moreover,the country’s service sector will continue to grow, sup-ported by booming ICT-related services. In Sri Lanka, theopening up of northern and eastern districts as a result ofthe ceasefire has facilitated the recovery of the servicesector, especially distribution and transportation. InNepal, the tourism sector has benefited from rising touristinflows from India. Nepalese growth, albeit experiencing
some recovery in 2003, continued to be well below theregion’s average, and may be adversely affected by therecent breakdown of the ceasefire between theGovernment and the insurgents.
Export growth has been robust and, except forPakistan, is expected to accelerate further in 2004 in linewith the stronger global demand. Import growth is likelyto increase in 2004 as well (see chapter 2). Continuinglarge remittances from expatriate workers in severalcountries, a rebound in tourist inflows and, in India,booming ICT-related service exports should contribute toa current-account balance.
Inflation remains relatively low and stable in the region(see table A.5), which enables most countries to maintaintheir soft monetary policy well into 2004 to ensure therecovery as well as to maintain exchange-rate stability.Nevertheless, as inflationary pressures build up in linewith stronger demand, countries are expected to graduallyraise interest rates, possibly in the second half of 2004.The extent of their monetary tightening will also dependon the increase in international interest rates, governmentborrowing requirements and exchange-rate movements.
On the fiscal front, most countries continue to pursuefiscal consolidation but also continue to face large budg-et deficits (see figure III.4). Deficit reduction is likely tofall short of their respective targets due to either over-spending or revenue shortfalls. In India, the budget forfiscal 2003/04 already included tax cuts in the run-up tothe general election due by October 2004; overspendingis also likely to occur. In Pakistan, the good fiscal per-formance in the previous year is unlikely to be repeated,largely due to tax incentives to support growth and anincrease in civil servants’ salaries and pensions. In SriLanka, widespread tax evasion and inefficient revenuecollection will hamper efforts at deficit reduction. Inthese countries, successful fiscal consolidation is crucialfor their longer-run financial viability and growth sus-tainability, although it may restrain demand expansion inthe short term.
Western Asia: mixed growth prospects
GDP growth in Western Asia is projected to increase to 4per cent in 2004 from 2.6 per cent in 2003. This forecast,however, depends critically on positive developments inIraq.10 Business and consumer confidence remaineddepressed in the region in 2003 due to the build-up towar in Iraq, the invasion and its aftermath, as well as tothe persistence of the Israeli-Palestinian conflict .Reconstruction efforts in Iraq and the overall stabiliza-tion of the country should have positive spillover effectsthroughout the region, notably through expanded tradeopportunities and the reduction of political tensions. Forexample, Jordan will benefit from the return of normalcy
R E G I O N A L D E V E L O P M E N T S A N D O U T L O O K 55
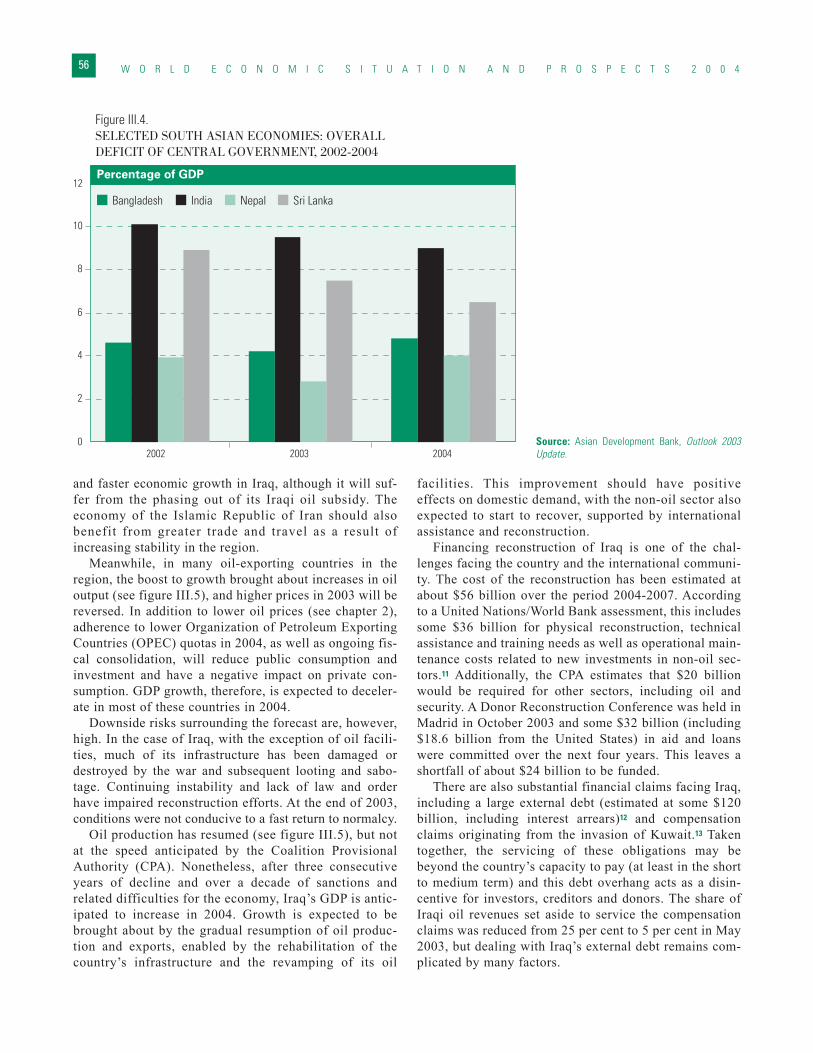
and faster economic growth in Iraq, although it will suf-fer from the phasing out of its Iraqi oil subsidy. Theeconomy of the Islamic Republic of Iran should alsobenefit from greater trade and travel as a result ofincreasing stability in the region.
Meanwhile, in many oil-exporting countries in theregion, the boost to growth brought about increases in oiloutput (see figure III.5), and higher prices in 2003 will bereversed. In addition to lower oil prices (see chapter 2),adherence to lower Organization of Petroleum ExportingCountries (OPEC) quotas in 2004, as well as ongoing fis-cal consolidation, will reduce public consumption andinvestment and have a negative impact on private con-sumption. GDP growth, therefore, is expected to deceler-ate in most of these countries in 2004.
Downside risks surrounding the forecast are, however,high. In the case of Iraq, with the exception of oil facili-ties, much of its infrastructure has been damaged ordestroyed by the war and subsequent looting and sabo-tage. Continuing instability and lack of law and orderhave impaired reconstruction efforts. At the end of 2003,conditions were not conducive to a fast return to normalcy.
Oil production has resumed (see figure III.5), but notat the speed anticipated by the Coalition ProvisionalAuthority (CPA). Nonetheless, after three consecutiveyears of decline and over a decade of sanctions andrelated difficulties for the economy, Iraq’s GDP is antic-ipated to increase in 2004. Growth is expected to bebrought about by the gradual resumption of oil produc-tion and exports, enabled by the rehabilitation of thecountry’s infrastructure and the revamping of its oil
facilities. This improvement should have positiveeffects on domestic demand, with the non-oil sector alsoexpected to start to recover, supported by internationalassistance and reconstruction.
Financing reconstruction of Iraq is one of the chal-lenges facing the country and the international communi-ty. The cost of the reconstruction has been estimated atabout $56 billion over the period 2004-2007. Accordingto a United Nations/World Bank assessment, this includessome $36 billion for physical reconstruction, technicalassistance and training needs as well as operational main-tenance costs related to new investments in non-oil sec-tors.11 Additionally, the CPA estimates that $20 billionwould be required for other sectors, including oil andsecurity. A Donor Reconstruction Conference was held inMadrid in October 2003 and some $32 billion (including$18.6 billion from the United States) in aid and loanswere committed over the next four years. This leaves ashortfall of about $24 billion to be funded.
There are also substantial financial claims facing Iraq,including a large external debt (estimated at some $120billion, including interest arrears)12 and compensationclaims originating from the invasion of Kuwait.13 Takentogether, the servicing of these obligations may bebeyond the country’s capacity to pay (at least in the shortto medium term) and this debt overhang acts as a disin-centive for investors, creditors and donors. The share ofIraqi oil revenues set aside to service the compensationclaims was reduced from 25 per cent to 5 per cent in May2003, but dealing with Iraq’s external debt remains com-plicated by many factors.
W O R L D E C O N O M I C S I T U A T I O N A N D P R O S P E C T S 2 0 0 456
Figure III.4.SELECTED SOUTH ASIAN ECONOMIES: OVERALL DEFICIT OF CENTRAL GOVERNMENT, 2002-2004
Percentage of GDP
Bangladesh India Nepal Sri Lanka
0
2
4
6
8
10
12
2002 2003 2004Source: Asian Development Bank, Outlook 2003Update.
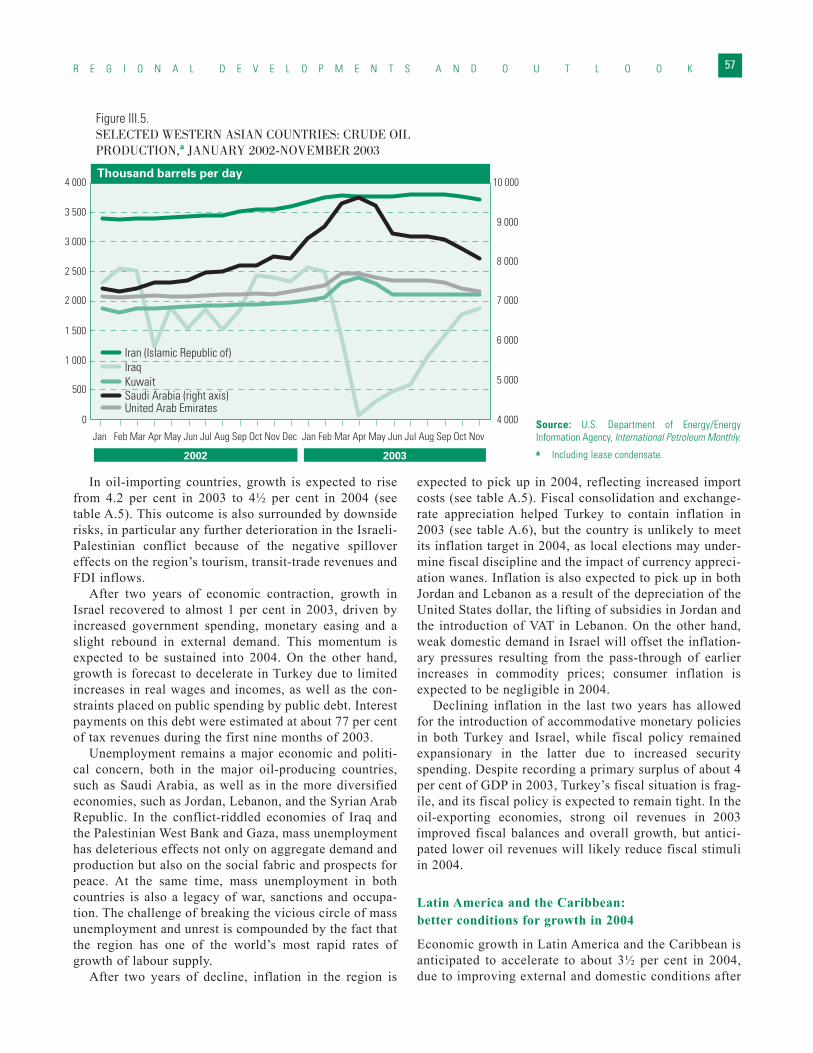
In oil-importing countries, growth is expected to risefrom 4.2 per cent in 2003 to 4½ per cent in 2004 (seetable A.5). This outcome is also surrounded by downsiderisks, in particular any further deterioration in the Israeli-Palestinian conflict because of the negative spillovereffects on the region’s tourism, transit-trade revenues andFDI inflows.
After two years of economic contraction, growth inIsrael recovered to almost 1 per cent in 2003, driven byincreased government spending, monetary easing and aslight rebound in external demand. This momentum isexpected to be sustained into 2004. On the other hand,growth is forecast to decelerate in Turkey due to limitedincreases in real wages and incomes, as well as the con-straints placed on public spending by public debt. Interestpayments on this debt were estimated at about 77 per centof tax revenues during the first nine months of 2003.
Unemployment remains a major economic and politi-cal concern, both in the major oil-producing countries,such as Saudi Arabia, as well as in the more diversifiedeconomies, such as Jordan, Lebanon, and the Syrian ArabRepublic. In the conflict-riddled economies of Iraq andthe Palestinian West Bank and Gaza, mass unemploymenthas deleterious effects not only on aggregate demand andproduction but also on the social fabric and prospects forpeace. At the same time, mass unemployment in bothcountries is also a legacy of war, sanctions and occupa-tion. The challenge of breaking the vicious circle of massunemployment and unrest is compounded by the fact thatthe region has one of the world’s most rapid rates ofgrowth of labour supply.
After two years of decline, inflation in the region is
expected to pick up in 2004, reflecting increased importcosts (see table A.5). Fiscal consolidation and exchange-rate appreciation helped Turkey to contain inflation in2003 (see table A.6), but the country is unlikely to meetits inflation target in 2004, as local elections may under-mine fiscal discipline and the impact of currency appreci-ation wanes. Inflation is also expected to pick up in bothJordan and Lebanon as a result of the depreciation of theUnited States dollar, the lifting of subsidies in Jordan andthe introduction of VAT in Lebanon. On the other hand,weak domestic demand in Israel will offset the inflation-ary pressures resulting from the pass-through of earlierincreases in commodity prices; consumer inflation isexpected to be negligible in 2004.
Declining inflation in the last two years has allowedfor the introduction of accommodative monetary policiesin both Turkey and Israel, while fiscal policy remainedexpansionary in the latter due to increased securityspending. Despite recording a primary surplus of about 4per cent of GDP in 2003, Turkey’s fiscal situation is frag-ile, and its fiscal policy is expected to remain tight. In theoil-exporting economies, strong oil revenues in 2003improved fiscal balances and overall growth, but antici-pated lower oil revenues will likely reduce fiscal stimuliin 2004.
Latin America and the Caribbean: better conditions for growth in 2004
Economic growth in Latin America and the Caribbean isanticipated to accelerate to about 3½ per cent in 2004,due to improving external and domestic conditions after
R E G I O N A L D E V E L O P M E N T S A N D O U T L O O K 57
Figure III.5.SELECTED WESTERN ASIAN COUNTRIES: CRUDE OIL PRODUCTION,a JANUARY 2002-NOVEMBER 2003
Thousand barrels per day
2002 2003
Iran (Islamic Republic of)
0
500
1 000
1 500
2 000
2 500
3 000
3 500
4 000
4 000
5 000
6 000
7 000
8 000
9 000
10 000
Jan Feb Mar Apr May Jun Jul Aug Sep Oct Nov Dec Jan Feb Mar Apr May Jun Jul Aug Sep Oct Nov
IraqKuwait
United Arab EmiratesSaudi Arabia (right axis)
Source: U.S. Department of Energy/EnergyInformation Agency, International Petroleum Monthly.a Including lease condensate.
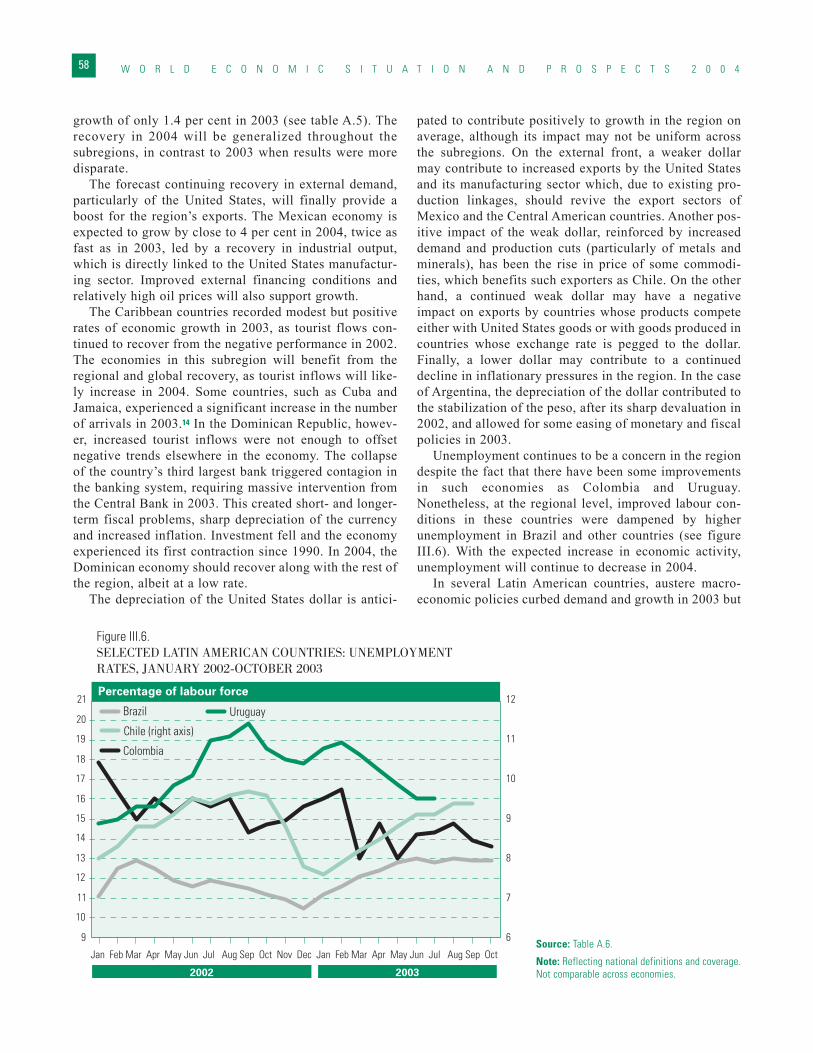
growth of only 1.4 per cent in 2003 (see table A.5). Therecovery in 2004 will be generalized throughout thesubregions, in contrast to 2003 when results were moredisparate.
The forecast continuing recovery in external demand,particularly of the United States, will finally provide aboost for the region’s exports. The Mexican economy isexpected to grow by close to 4 per cent in 2004, twice asfast as in 2003, led by a recovery in industrial output,which is directly linked to the United States manufactur-ing sector. Improved external financing conditions andrelatively high oil prices will also support growth.
The Caribbean countries recorded modest but positiverates of economic growth in 2003, as tourist flows con-tinued to recover from the negative performance in 2002.The economies in this subregion will benefit from theregional and global recovery, as tourist inflows will like-ly increase in 2004. Some countries, such as Cuba andJamaica, experienced a significant increase in the numberof arrivals in 2003.14 In the Dominican Republic, howev-er, increased tourist inflows were not enough to offsetnegative trends elsewhere in the economy. The collapseof the country’s third largest bank triggered contagion inthe banking system, requiring massive intervention fromthe Central Bank in 2003. This created short- and longer-term fiscal problems, sharp depreciation of the currencyand increased inflation. Investment fell and the economyexperienced its first contraction since 1990. In 2004, theDominican economy should recover along with the rest ofthe region, albeit at a low rate.
The depreciation of the United States dollar is antici-
pated to contribute positively to growth in the region onaverage, although its impact may not be uniform acrossthe subregions. On the external front, a weaker dollarmay contribute to increased exports by the United Statesand its manufacturing sector which, due to existing pro-duction linkages, should revive the export sectors ofMexico and the Central American countries. Another pos-itive impact of the weak dollar, reinforced by increaseddemand and production cuts (particularly of metals andminerals), has been the rise in price of some commodi-ties, which benefits such exporters as Chile. On the otherhand, a continued weak dollar may have a negativeimpact on exports by countries whose products competeeither with United States goods or with goods produced incountries whose exchange rate is pegged to the dollar.Finally, a lower dollar may contribute to a continueddecline in inflationary pressures in the region. In the caseof Argentina, the depreciation of the dollar contributed tothe stabilization of the peso, after its sharp devaluation in2002, and allowed for some easing of monetary and fiscalpolicies in 2003.
Unemployment continues to be a concern in the regiondespite the fact that there have been some improvementsin such economies as Colombia and Uruguay.Nonetheless, at the regional level, improved labour con-ditions in these countries were dampened by higherunemployment in Brazil and other countries (see figureIII.6). With the expected increase in economic activity,unemployment will continue to decrease in 2004.
In several Latin American countries, austere macro-economic policies curbed demand and growth in 2003 but
W O R L D E C O N O M I C S I T U A T I O N A N D P R O S P E C T S 2 0 0 458
Figure III.6.SELECTED LATIN AMERICAN COUNTRIES: UNEMPLOYMENT RATES, JANUARY 2002-OCTOBER 2003
Percentage of labour force
2002 2003
Brazil
Jan Feb Mar Apr May Jun Jul Aug Sep Oct Nov Dec Jan Feb Mar Apr May Jun Jul Aug Sep Oct
Chile (right axis)
Colombia
Uruguay
9
10
11
12
13
14
15
16
17
18
19
20
21
6
7
8
9
10
11
12
Source: Table A.6.
Note: Reflecting national definitions and coverage.Not comparable across economies.
led to increased control over public finances, stabilizationof the exchange rate and lower inflation. Additionally,these policies contributed to increased trade surpluses,which were necessary due to the limited capital inflowsinto the region during the year. Preliminary estimatesindicate that the region generated, for the first time indecades, a small current-account surplus in 2003. Thiswas mostly due to surpluses in Argentina, Brazil andVenezuela, which had large trade surpluses.15
Lower inflation and more stable currencies will allowfor a further easing of monetary policy in 2004. The mon-etary authorities in Brazil and Mexico will continue theirexpansionary policies to rekindle their subdued industrialsectors. In Brazil, the inflation targets for 2004 and 2005have been adjusted upwards which, while maintaininginflation at relatively low levels, will allow for furtherreductions in interest rates. Brazilian monetary authori-ties expect private consumption and investment to reactpositively to the lower rates. Growth is thus anticipated tobe generated by the recovery of the domestic demand, asthe contribution of net exports will decline due toincreased imports. Similarly, a more stable Mexican pesoand lower inflationary expectations will allow additionalcuts in interest rates, rekindling domestic demand, in par-ticular private consumption and investment.
Fiscal discipline is helping lift investor confidence butwill continue to limit the public sector’s contribution toaggregate demand. The majority of the countries in con-tinental Latin America are strengthening efforts toachieve fiscal consolidation in both the short- and medi-um-term by adopting such structural measures as themodification of tax laws, fiscal responsibility laws, pub-lic expenditure ceilings, etc. Mexico, for instance, hasone of the lowest levels of tax revenues in the region,since it has traditionally relied on revenues from Pemex(Petróleos de México, S.A), the state-owned enterprise.Accordingly, Mexican authorities are planning toincrease tax revenues by increasing the efficiency of taxcollection and broadening the tax base.
Similarly, fiscal consolidation will continue in Brazil.Due to its relatively large public debt (some 57 per centof GDP in October 2003), the country is obliged to run asubstantial primary surplus to maintain debt sustainabili-ty and investor confidence in the economy. An enormouseffort has been required from the economy as a consider-able share of the public debt is linked to either the dollaror the official interest rate. As the currency depreciatedand interest rates shot up, the debt burden increased andrequired additional fiscal measures so that the nominal
deficit (and therefore public debt) would remain manage-able. With the stabilization of the exchange rate and cutsin the interest rate, the fiscal position improved, but itremains a source of concern.
Argentina’s goods-producing sectors, especially agri-culture, manufacturing and construction, recorded robustgrowth during 2003, favoured by a more stable exchangerate. The economy will sustain its recovery in 2004 asthese sectors continue to benefit from the devaluation ofthe peso in 2002, but at a more moderate pace than in2003, as the exchange rate has stabilized. Higher tax rev-enues are anticipated for 2004. This will permit an expan-sion of social expenditures, which has absorbed a substan-tial part of the burden of the financial crisis. In addition,Argentina rescheduled its obligations with the IMF inSeptember 2003. This extension will allow the govern-ment more space to pursue its medium-term economicplan, which emphasizes growth, employment and socialobjectives, strengthening of the shattered banking systemand institutional reforms to support its debt restructuring.However, there are some risks presented by the reaction ofcreditors to Argentina’s proposal to restructure its default-ed debt, which represents about half of its total debt (seechapter 2). The anticipated recovery of the two largesteconomies in the Southern Cone should also benefit theother members of the Southern Common Market (MER-COSUR), Paraguay and Uruguay.
After three consecutive years of stagnation, due to slowgrowth in Colombia and Mexico as well as the politicaland economic crisis in Venezuela, the net oil-exportingcountries are expected to recuperate in 2004, growing at anaverage rate of almost 4 per cent. Despite political uncer-tainties, growth should return to Venezuela as oil produc-tion has recovered and positive spillover effects shouldspread throughout the economy. The crisis in Venezuelaaffected Colombia’s external sector, but the country wasable to partially offset the negative impact of weakerdemand by its neighbour—and second largest trading part-ner—due to improved domestic demand. The Venezuelanrecovery will likely support growth in Colombia in 2004.In contrast, internal demand in Ecuador lost momentum in2003, after an original surge created by improved confi-dence in the economy due to the introduction of dollariza-tion and increased investment boosted by the constructionof a new oil pipeline.16 Aggregate demand is expected torecuperate in 2004, mostly led by greater net exports.Meanwhile, the return to relative normalcy after a politi-cally and socially tumultuous year in Bolivia should sup-port a mild economic recovery in 2004.
R E G I O N A L D E V E L O P M E N T S A N D O U T L O O K 59
1 It is estimated that households have realized $500 billion from refinancing andequity loans each year in the past two years.
2 For a detailed discussion on the effects of the dollar depreciation on the adjust-ment of the trade deficit, see World Economic and Social Survey 2003 (UnitedNations publication, Sales No. E.03.II.C.1), pp. 15-16.
3 For example, the rise in the German IFO survey of business conditions since Aprilhas been driven by its expectations component, while the current conditions com-ponent has yet to turn up convincingly.
4 The ECB refined its definition of price stability in May 2003. Price stability isdefined, as before, as a year-on-year increase in the HICP of below 2 per cent.The refinement is that, in the pursuit of price stability, the Governing Council willaim to maintain inflation close to 2 per cent. The previous goal, while not explic-itly stated, was generally thought to be a target of 1.5 per cent, with upper andlower bounds of 2 per cent and 0 per cent, respectively (see http://www.ecb.int/about/monetarypolicy.htm).
5 GDP contracted by over 50 per cent in Zimbabwe during the period 1999-2003.6 Average annual inflation in Zimbabwe was estimated at some 140 per cent and
380 per cent in 2002 and 2003, respectively, and forecast to be above 700 percent in 2004.
7 Hong Kong Special Administrative Region (SAR) of China, Republic of Korea,Singapore and Taiwan Province of China.
8 The official estimate of NPLs is about 20 per cent of the total loans. Estimates byother sources, however, are much higher.
9 Due to China’s commitments to joining the World Trade Organization (WTO), some
liberalization of the Chinese financial sector is anticipated, and competition fromforeign banks is expected to increase markedly in the next few years.
10 Excluding Iraq, forecast GDP growth in Western Asia would decline from an esti-mated 4.3 per cent in 2003 to 3½ per cent in 2004.
11 The sectors included in the United Nations/World Bank assessment include: edu-cation, health, employment creation, water and sanitation, transport andtelecommunications, electricity, housing and land management, urban manage-ment, agriculture, water resources, food security, finance, state-owned enterpris-es, investment climate, mine action and government institutions. For details, seeUnited Nations/World Bank, Joint Iraq Needs Assessment, October 2003.
12 See M. Abdel-Fadil, “Issues of Economic Reconstruction of Iraq” in ESCWA,Reconstruction of Iraq: an Arab Economic and Social View, Report of the work-shop on Iraq and the region after the war, Beirut, 9-11 July 2003,E/ESCWA/SDPD/2003/9, 27 October 2003.
13 As of 10 November 2003, there were $28 billion in claims awarded compensationby the United Nations Compensation Commission but still to be paid, while addi-tional claims totalling $96 billion were still awaiting a decision.
14 See World Tourism Organization, World Tourism Barometer, 29 October 2003 (http://www.world-tourism.org/newsroom/Releases/2003/october/ barometer.htm).
15 Based on preliminary estimates by the Economic Commission for Latin Americaand the Caribbean.
16 See World Economic and Social Survey 2003 (United Nations publication, SalesNo. E.03.II.C.1), box III.3, “Ecuador and El Salvador: a tale of two dollarizations”,pp. 103-105.
W O R L D E C O N O M I C S I T U A T I O N A N D P R O S P E C T S 2 0 0 460
Notes
LIST OF TABLES
Page
A. 1 Developed market economies: rates of growth of real GDP and rates of inflation and unemployment, 2002-2004 . . . . . . . . . . . . . .63A. 2 Major developed economies: quarterly indicators of growth, unemployment and inflation, 2001-2003 . . . . . . . . . . . . . . . . . . . . . . .64A. 3 Economies in transition: rates of growth of real GDP and rates of inflation and unemployment, 2002-2004 . . . . . . . . . . . . . . . . . . .65A. 4 Major economies in transition: quarterly indicators of growth and inflation, 2001-2003 . . . . . . . . . . . . . . . . . . . . . . . . . . . . . . . . . . .66A. 5 Developing countries: rates of growth of real GDP and rates of inflation, 2002-2004 . . . . . . . . . . . . . . . . . . . . . . . . . . . . . . . . . . . . .67A. 6 Major developing countries: quarterly indicators of growth, unemployment and inflation, 2001-2003 . . . . . . . . . . . . . . . . . . . . . . . .68A. 7 World trade: rates of growth of volumes and values, 2002-2004 . . . . . . . . . . . . . . . . . . . . . . . . . . . . . . . . . . . . . . . . . . . . . . . . . . . . .70A. 8 Commodity prices, 2001-2003 . . . . . . . . . . . . . . . . . . . . . . . . . . . . . . . . . . . . . . . . . . . . . . . . . . . . . . . . . . . . . . . . . . . . . . . . . . . . . . . . .71A. 9 Outward stock of foreign direct investment, by sector and main country groups, 1990 and 2001 . . . . . . . . . . . . . . . . . . . . . . . . . . . .72A.10 Inward stock of foreign direct investment, by sector and main country groups, 1990 and 2001 . . . . . . . . . . . . . . . . . . . . . . . . . . . . .73
S T A T I S T I C A L T A B L E S 61

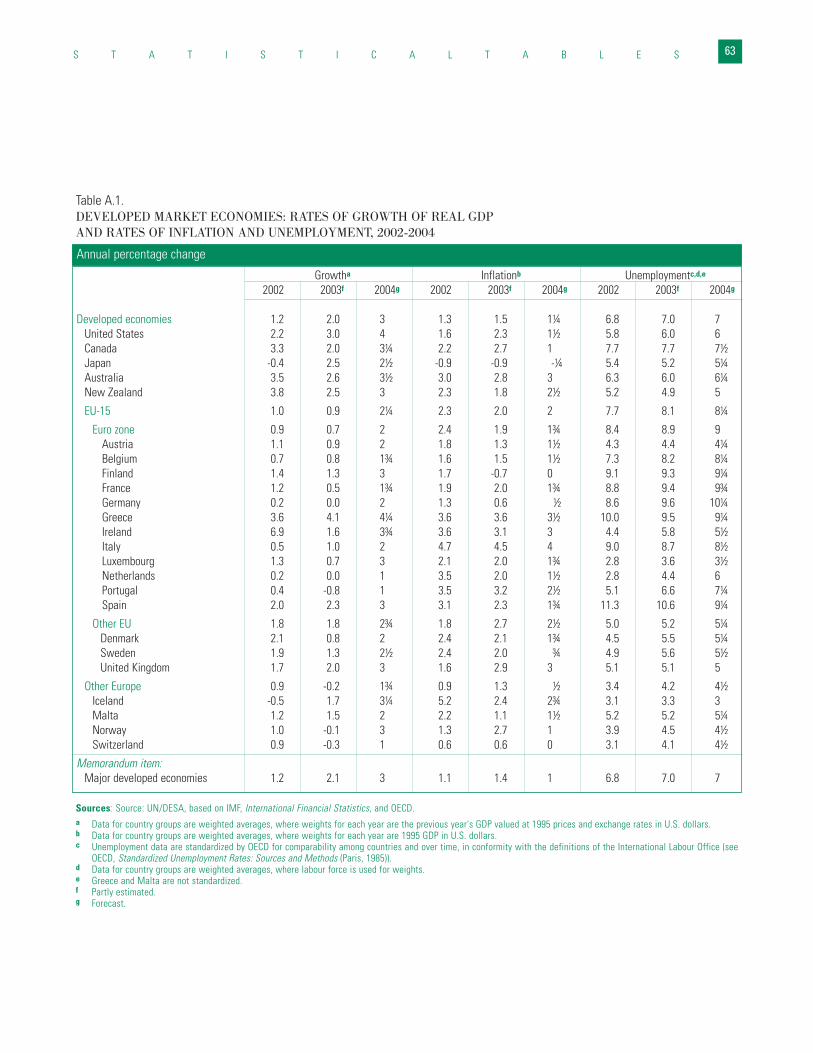
S T A T I S T I C A L T A B L E S 63
Table A.1.DEVELOPED MARKET ECONOMIES: RATES OF GROWTH OF REAL GDP AND RATES OF INFLATION AND UNEMPLOYMENT, 2002-2004
Growtha Inflationb Unemploymentc,d,e
2002 2003f 2004g 2002 2003f 2004g 2002 2003f 2004g
Developed economies 1.2 2.0 3 1.3 1.5 1¼ 6.8 7.0 7United States 2.2 3.0 4 1.6 2.3 1½ 5.8 6.0 6 Canada 3.3 2.0 3¼ 2.2 2.7 1 7.7 7.7 7½Japan -0.4 2.5 2½ -0.9 -0.9 -¼ 5.4 5.2 5¼Australia 3.5 2.6 3½ 3.0 2.8 3 6.3 6.0 6¼New Zealand 3.8 2.5 3 2.3 1.8 2½ 5.2 4.9 5
EU-15 1.0 0.9 2¼ 2.3 2.0 2 7.7 8.1 8¼
Euro zone 0.9 0.7 2 2.4 1.9 1¾ 8.4 8.9 9Austria 1.1 0.9 2 1.8 1.3 1½ 4.3 4.4 4¼Belgium 0.7 0.8 1¾ 1.6 1.5 1½ 7.3 8.2 8¼Finland 1.4 1.3 3 1.7 -0.7 0 9.1 9.3 9¼France 1.2 0.5 1¾ 1.9 2.0 1¾ 8.8 9.4 9¾Germany 0.2 0.0 2 1.3 0.6 ½ 8.6 9.6 10¼Greece 3.6 4.1 4¼ 3.6 3.6 3½ 10.0 9.5 9¼Ireland 6.9 1.6 3¾ 3.6 3.1 3 4.4 5.8 5½Italy 0.5 1.0 2 4.7 4.5 4 9.0 8.7 8½Luxembourg 1.3 0.7 3 2.1 2.0 1¾ 2.8 3.6 3½Netherlands 0.2 0.0 1 3.5 2.0 1½ 2.8 4.4 6 Portugal 0.4 -0.8 1 3.5 3.2 2½ 5.1 6.6 7¼Spain 2.0 2.3 3 3.1 2.3 1¾ 11.3 10.6 9¼
Other EU 1.8 1.8 2¾ 1.8 2.7 2½ 5.0 5.2 5¼Denmark 2.1 0.8 2 2.4 2.1 1¾ 4.5 5.5 5¼Sweden 1.9 1.3 2½ 2.4 2.0 ¾ 4.9 5.6 5½United Kingdom 1.7 2.0 3 1.6 2.9 3 5.1 5.1 5
Other Europe 0.9 -0.2 1¾ 0.9 1.3 ½ 3.4 4.2 4½Iceland -0.5 1.7 3¼ 5.2 2.4 2¾ 3.1 3.3 3 Malta 1.2 1.5 2 2.2 1.1 1½ 5.2 5.2 5¼Norway 1.0 -0.1 3 1.3 2.7 1 3.9 4.5 4½Switzerland 0.9 -0.3 1 0.6 0.6 0 3.1 4.1 4½
Memorandum item:Major developed economies 1.2 2.1 3 1.1 1.4 1 6.8 7.0 7
Sources: Source: UN/DESA, based on IMF, International Financial Statistics, and OECD.a Data for country groups are weighted averages, where weights for each year are the previous year's GDP valued at 1995 prices and exchange rates in U.S. dollars.b Data for country groups are weighted averages, where weights for each year are 1995 GDP in U.S. dollars.c Unemployment data are standardized by OECD for comparability among countries and over time, in conformity with the definitions of the International Labour Office (see
OECD, Standardized Unemployment Rates: Sources and Methods (Paris, 1985)).d Data for country groups are weighted averages, where labour force is used for weights.e Greece and Malta are not standardized.f Partly estimated.g Forecast.
Annual percentage change
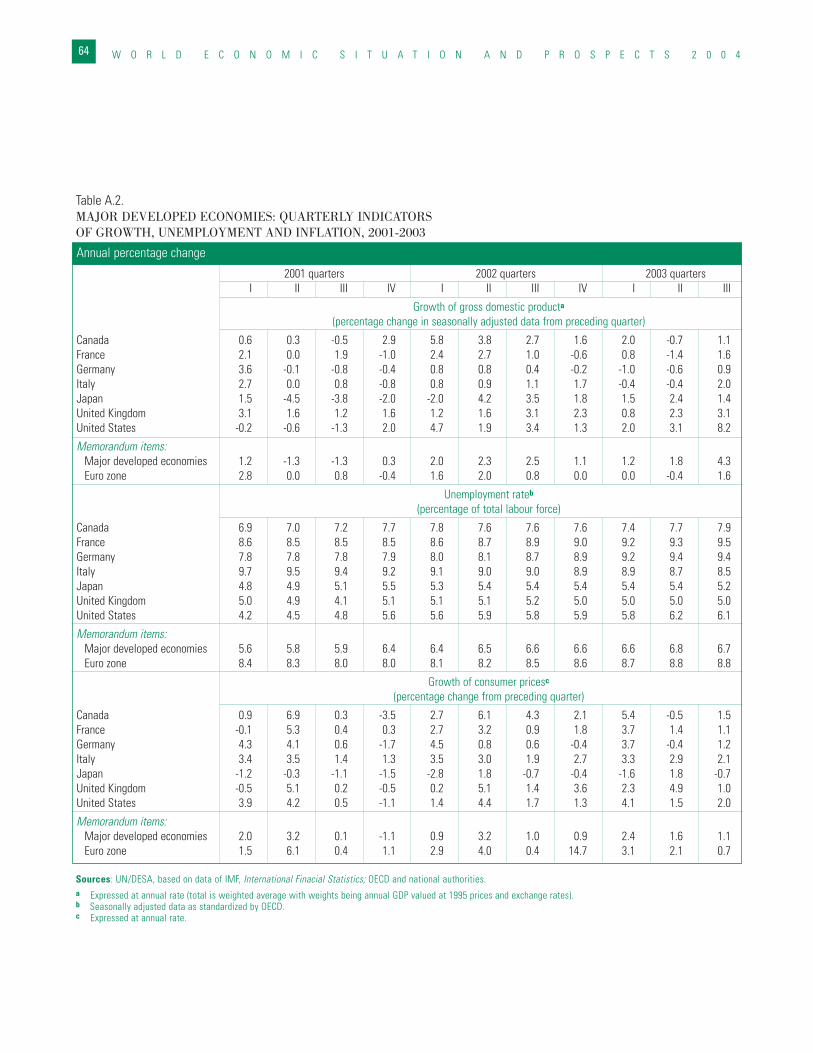
W O R L D E C O N O M I C S I T U A T I O N A N D P R O S P E C T S 2 0 0 464
Table A.2.MAJOR DEVELOPED ECONOMIES: QUARTERLY INDICATORS OF GROWTH, UNEMPLOYMENT AND INFLATION, 2001-2003
2001 quarters 2002 quarters 2003 quartersI II III IV I II III IV I II III
Growth of gross domestic producta
(percentage change in seasonally adjusted data from preceding quarter)
Canada 0.6 0.3 -0.5 2.9 5.8 3.8 2.7 1.6 2.0 -0.7 1.1France 2.1 0.0 1.9 -1.0 2.4 2.7 1.0 -0.6 0.8 -1.4 1.6Germany 3.6 -0.1 -0.8 -0.4 0.8 0.8 0.4 -0.2 -1.0 -0.6 0.9Italy 2.7 0.0 0.8 -0.8 0.8 0.9 1.1 1.7 -0.4 -0.4 2.0Japan 1.5 -4.5 -3.8 -2.0 -2.0 4.2 3.5 1.8 1.5 2.4 1.4United Kingdom 3.1 1.6 1.2 1.6 1.2 1.6 3.1 2.3 0.8 2.3 3.1United States -0.2 -0.6 -1.3 2.0 4.7 1.9 3.4 1.3 2.0 3.1 8.2
Memorandum items:Major developed economies 1.2 -1.3 -1.3 0.3 2.0 2.3 2.5 1.1 1.2 1.8 4.3Euro zone 2.8 0.0 0.8 -0.4 1.6 2.0 0.8 0.0 0.0 -0.4 1.6
Unemployment rateb
(percentage of total labour force)
Canada 6.9 7.0 7.2 7.7 7.8 7.6 7.6 7.6 7.4 7.7 7.9France 8.6 8.5 8.5 8.5 8.6 8.7 8.9 9.0 9.2 9.3 9.5Germany 7.8 7.8 7.8 7.9 8.0 8.1 8.7 8.9 9.2 9.4 9.4Italy 9.7 9.5 9.4 9.2 9.1 9.0 9.0 8.9 8.9 8.7 8.5Japan 4.8 4.9 5.1 5.5 5.3 5.4 5.4 5.4 5.4 5.4 5.2United Kingdom 5.0 4.9 4.1 5.1 5.1 5.1 5.2 5.0 5.0 5.0 5.0United States 4.2 4.5 4.8 5.6 5.6 5.9 5.8 5.9 5.8 6.2 6.1
Memorandum items:Major developed economies 5.6 5.8 5.9 6.4 6.4 6.5 6.6 6.6 6.6 6.8 6.7Euro zone 8.4 8.3 8.0 8.0 8.1 8.2 8.5 8.6 8.7 8.8 8.8
Growth of consumer pricesc
(percentage change from preceding quarter)
Canada 0.9 6.9 0.3 -3.5 2.7 6.1 4.3 2.1 5.4 -0.5 1.5France -0.1 5.3 0.4 0.3 2.7 3.2 0.9 1.8 3.7 1.4 1.1Germany 4.3 4.1 0.6 -1.7 4.5 0.8 0.6 -0.4 3.7 -0.4 1.2Italy 3.4 3.5 1.4 1.3 3.5 3.0 1.9 2.7 3.3 2.9 2.1Japan -1.2 -0.3 -1.1 -1.5 -2.8 1.8 -0.7 -0.4 -1.6 1.8 -0.7United Kingdom -0.5 5.1 0.2 -0.5 0.2 5.1 1.4 3.6 2.3 4.9 1.0United States 3.9 4.2 0.5 -1.1 1.4 4.4 1.7 1.3 4.1 1.5 2.0
Memorandum items:Major developed economies 2.0 3.2 0.1 -1.1 0.9 3.2 1.0 0.9 2.4 1.6 1.1Euro zone 1.5 6.1 0.4 1.1 2.9 4.0 0.4 14.7 3.1 2.1 0.7
Annual percentage change
Sources: UN/DESA, based on data of IMF, International Finacial Statistics; OECD and national authorities.a Expressed at annual rate (total is weighted average with weights being annual GDP valued at 1995 prices and exchange rates).b Seasonally adjusted data as standardized by OECD.c Expressed at annual rate.
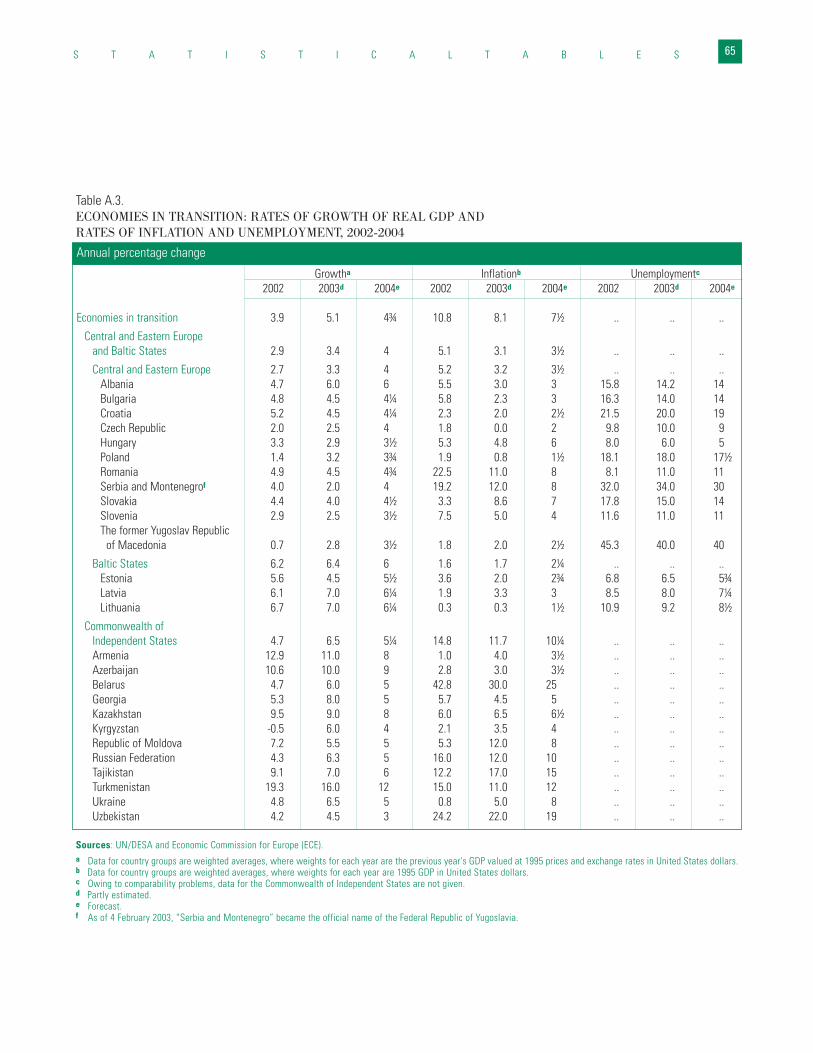
S T A T I S T I C A L T A B L E S 65
Table A.3.ECONOMIES IN TRANSITION: RATES OF GROWTH OF REAL GDP AND RATES OF INFLATION AND UNEMPLOYMENT, 2002-2004
Growtha Inflationb Unemploymentc
2002 2003d 2004e 2002 2003d 2004e 2002 2003d 2004e
Economies in transition 3.9 5.1 4¾ 10.8 8.1 7½ .. .. ..
Central and Eastern Europeand Baltic States 2.9 3.4 4 5.1 3.1 3½ .. .. ..
Central and Eastern Europe 2.7 3.3 4 5.2 3.2 3½ .. .. ..Albania 4.7 6.0 6 5.5 3.0 3 15.8 14.2 14 Bulgaria 4.8 4.5 4¼ 5.8 2.3 3 16.3 14.0 14 Croatia 5.2 4.5 4¼ 2.3 2.0 2½ 21.5 20.0 19 Czech Republic 2.0 2.5 4 1.8 0.0 2 9.8 10.0 9 Hungary 3.3 2.9 3½ 5.3 4.8 6 8.0 6.0 5 Poland 1.4 3.2 3¾ 1.9 0.8 1½ 18.1 18.0 17½Romania 4.9 4.5 4¾ 22.5 11.0 8 8.1 11.0 11 Serbia and Montenegrof 4.0 2.0 4 19.2 12.0 8 32.0 34.0 30 Slovakia 4.4 4.0 4½ 3.3 8.6 7 17.8 15.0 14 Slovenia 2.9 2.5 3½ 7.5 5.0 4 11.6 11.0 11 The former Yugoslav Republic
of Macedonia 0.7 2.8 3½ 1.8 2.0 2½ 45.3 40.0 40
Baltic States 6.2 6.4 6 1.6 1.7 2¼ .. .. ..Estonia 5.6 4.5 5½ 3.6 2.0 2¾ 6.8 6.5 5¾Latvia 6.1 7.0 6¼ 1.9 3.3 3 8.5 8.0 7¼Lithuania 6.7 7.0 6¼ 0.3 0.3 1½ 10.9 9.2 8½
Commonwealth ofIndependent States 4.7 6.5 5¼ 14.8 11.7 10¼ .. .. ..Armenia 12.9 11.0 8 1.0 4.0 3½ .. .. ..Azerbaijan 10.6 10.0 9 2.8 3.0 3½ .. .. ..Belarus 4.7 6.0 5 42.8 30.0 25 .. .. ..Georgia 5.3 8.0 5 5.7 4.5 5 .. .. ..Kazakhstan 9.5 9.0 8 6.0 6.5 6½ .. .. ..Kyrgyzstan -0.5 6.0 4 2.1 3.5 4 .. .. ..Republic of Moldova 7.2 5.5 5 5.3 12.0 8 .. .. ..Russian Federation 4.3 6.3 5 16.0 12.0 10 .. .. ..Tajikistan 9.1 7.0 6 12.2 17.0 15 .. .. ..Turkmenistan 19.3 16.0 12 15.0 11.0 12 .. .. ..Ukraine 4.8 6.5 5 0.8 5.0 8 .. .. ..Uzbekistan 4.2 4.5 3 24.2 22.0 19 .. .. ..
Annual percentage change
Sources: UN/DESA and Economic Commission for Europe (ECE).a Data for country groups are weighted averages, where weights for each year are the previous year's GDP valued at 1995 prices and exchange rates in United States dollars.b Data for country groups are weighted averages, where weights for each year are 1995 GDP in United States dollars.c Owing to comparability problems, data for the Commonwealth of Independent States are not given.d Partly estimated.e Forecast.f As of 4 February 2003, “Serbia and Montenegro” became the official name of the Federal Republic of Yugoslavia.
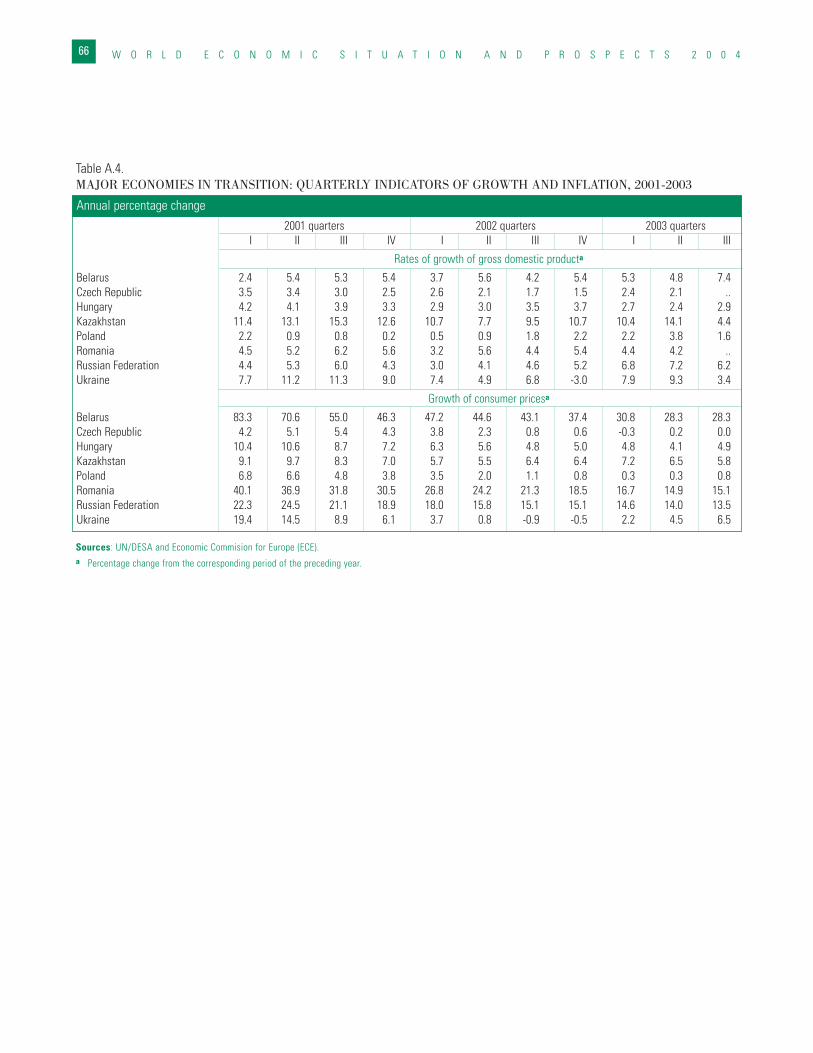
W O R L D E C O N O M I C S I T U A T I O N A N D P R O S P E C T S 2 0 0 466
Table A.4.MAJOR ECONOMIES IN TRANSITION: QUARTERLY INDICATORS OF GROWTH AND INFLATION, 2001-2003
2001 quarters 2002 quarters 2003 quartersI II III IV I II III IV I II III
Rates of growth of gross domestic producta
Belarus 2.4 5.4 5.3 5.4 3.7 5.6 4.2 5.4 5.3 4.8 7.4Czech Republic 3.5 3.4 3.0 2.5 2.6 2.1 1.7 1.5 2.4 2.1 ..Hungary 4.2 4.1 3.9 3.3 2.9 3.0 3.5 3.7 2.7 2.4 2.9Kazakhstan 11.4 13.1 15.3 12.6 10.7 7.7 9.5 10.7 10.4 14.1 4.4Poland 2.2 0.9 0.8 0.2 0.5 0.9 1.8 2.2 2.2 3.8 1.6Romania 4.5 5.2 6.2 5.6 3.2 5.6 4.4 5.4 4.4 4.2 ..Russian Federation 4.4 5.3 6.0 4.3 3.0 4.1 4.6 5.2 6.8 7.2 6.2Ukraine 7.7 11.2 11.3 9.0 7.4 4.9 6.8 -3.0 7.9 9.3 3.4
Growth of consumer pricesa
Belarus 83.3 70.6 55.0 46.3 47.2 44.6 43.1 37.4 30.8 28.3 28.3Czech Republic 4.2 5.1 5.4 4.3 3.8 2.3 0.8 0.6 -0.3 0.2 0.0Hungary 10.4 10.6 8.7 7.2 6.3 5.6 4.8 5.0 4.8 4.1 4.9Kazakhstan 9.1 9.7 8.3 7.0 5.7 5.5 6.4 6.4 7.2 6.5 5.8Poland 6.8 6.6 4.8 3.8 3.5 2.0 1.1 0.8 0.3 0.3 0.8Romania 40.1 36.9 31.8 30.5 26.8 24.2 21.3 18.5 16.7 14.9 15.1Russian Federation 22.3 24.5 21.1 18.9 18.0 15.8 15.1 15.1 14.6 14.0 13.5Ukraine 19.4 14.5 8.9 6.1 3.7 0.8 -0.9 -0.5 2.2 4.5 6.5
Annual percentage change
Sources: UN/DESA and Economic Commision for Europe (ECE).a Percentage change from the corresponding period of the preceding year.
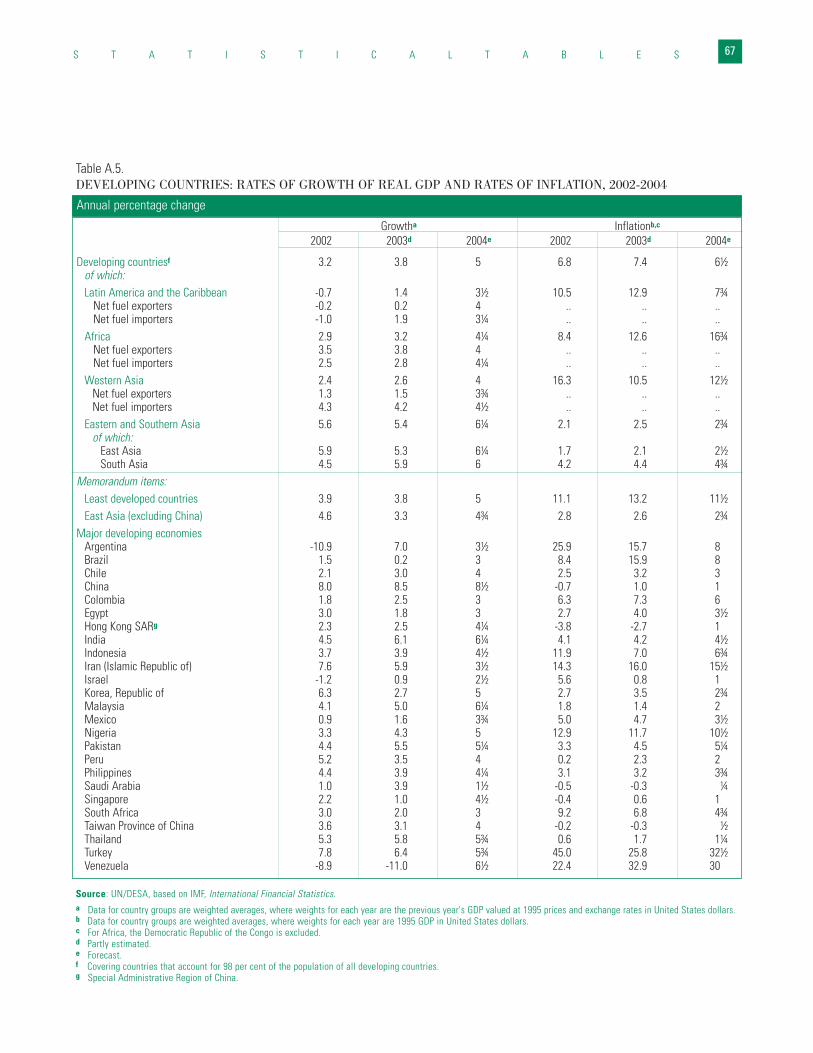
S T A T I S T I C A L T A B L E S 67
Table A.5.DEVELOPING COUNTRIES: RATES OF GROWTH OF REAL GDP AND RATES OF INFLATION, 2002-2004
Growtha Inflationb,c
2002 2003d 2004e 2002 2003d 2004e
Developing countriesf 3.2 3.8 5 6.8 7.4 6½of which:Latin America and the Caribbean -0.7 1.4 3½ 10.5 12.9 7¾
Net fuel exporters -0.2 0.2 4 .. .. ..Net fuel importers -1.0 1.9 3¼ .. .. ..
Africa 2.9 3.2 4¼ 8.4 12.6 16¾Net fuel exporters 3.5 3.8 4 .. .. ..Net fuel importers 2.5 2.8 4¼ .. .. ..
Western Asia 2.4 2.6 4 16.3 10.5 12½Net fuel exporters 1.3 1.5 3¾ .. .. ..Net fuel importers 4.3 4.2 4½ .. .. ..
Eastern and Southern Asia 5.6 5.4 6¼ 2.1 2.5 2¾of which:
East Asia 5.9 5.3 6¼ 1.7 2.1 2½South Asia 4.5 5.9 6 4.2 4.4 4¾
Memorandum items:Least developed countries 3.9 3.8 5 11.1 13.2 11½East Asia (excluding China) 4.6 3.3 4¾ 2.8 2.6 2¾
Major developing economiesArgentina -10.9 7.0 3½ 25.9 15.7 8 Brazil 1.5 0.2 3 8.4 15.9 8 Chile 2.1 3.0 4 2.5 3.2 3 China 8.0 8.5 8½ -0.7 1.0 1 Colombia 1.8 2.5 3 6.3 7.3 6 Egypt 3.0 1.8 3 2.7 4.0 3½Hong Kong SARg 2.3 2.5 4¼ -3.8 -2.7 1 India 4.5 6.1 6¼ 4.1 4.2 4½Indonesia 3.7 3.9 4½ 11.9 7.0 6¾Iran (Islamic Republic of) 7.6 5.9 3½ 14.3 16.0 15½Israel -1.2 0.9 2½ 5.6 0.8 1 Korea, Republic of 6.3 2.7 5 2.7 3.5 2¾Malaysia 4.1 5.0 6¼ 1.8 1.4 2 Mexico 0.9 1.6 3¾ 5.0 4.7 3½Nigeria 3.3 4.3 5 12.9 11.7 10½Pakistan 4.4 5.5 5¼ 3.3 4.5 5¼Peru 5.2 3.5 4 0.2 2.3 2 Philippines 4.4 3.9 4¼ 3.1 3.2 3¾Saudi Arabia 1.0 3.9 1½ -0.5 -0.3 ¼Singapore 2.2 1.0 4½ -0.4 0.6 1 South Africa 3.0 2.0 3 9.2 6.8 4¾Taiwan Province of China 3.6 3.1 4 -0.2 -0.3 ½Thailand 5.3 5.8 5¾ 0.6 1.7 1¼Turkey 7.8 6.4 5¾ 45.0 25.8 32½Venezuela -8.9 -11.0 6½ 22.4 32.9 30
Annual percentage change
Source: UN/DESA, based on IMF, International Financial Statistics.a Data for country groups are weighted averages, where weights for each year are the previous year's GDP valued at 1995 prices and exchange rates in United States dollars.b Data for country groups are weighted averages, where weights for each year are 1995 GDP in United States dollars.c For Africa, the Democratic Republic of the Congo is excluded.d Partly estimated.e Forecast.f Covering countries that account for 98 per cent of the population of all developing countries.g Special Administrative Region of China.
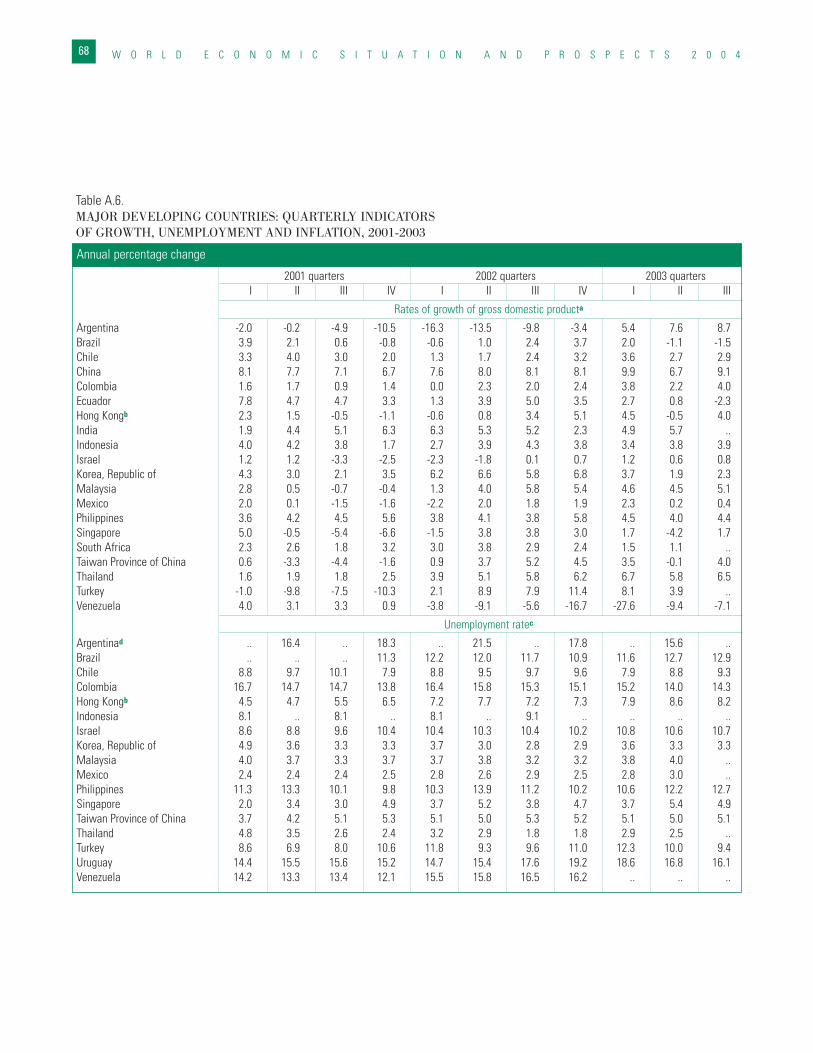
W O R L D E C O N O M I C S I T U A T I O N A N D P R O S P E C T S 2 0 0 468
Table A.6.MAJOR DEVELOPING COUNTRIES: QUARTERLY INDICATORS OF GROWTH, UNEMPLOYMENT AND INFLATION, 2001-2003
2001 quarters 2002 quarters 2003 quartersI II III IV I II III IV I II III
Rates of growth of gross domestic producta
Argentina -2.0 -0.2 -4.9 -10.5 -16.3 -13.5 -9.8 -3.4 5.4 7.6 8.7Brazil 3.9 2.1 0.6 -0.8 -0.6 1.0 2.4 3.7 2.0 -1.1 -1.5Chile 3.3 4.0 3.0 2.0 1.3 1.7 2.4 3.2 3.6 2.7 2.9China 8.1 7.7 7.1 6.7 7.6 8.0 8.1 8.1 9.9 6.7 9.1Colombia 1.6 1.7 0.9 1.4 0.0 2.3 2.0 2.4 3.8 2.2 4.0Ecuador 7.8 4.7 4.7 3.3 1.3 3.9 5.0 3.5 2.7 0.8 -2.3Hong Kongb 2.3 1.5 -0.5 -1.1 -0.6 0.8 3.4 5.1 4.5 -0.5 4.0India 1.9 4.4 5.1 6.3 6.3 5.3 5.2 2.3 4.9 5.7 ..Indonesia 4.0 4.2 3.8 1.7 2.7 3.9 4.3 3.8 3.4 3.8 3.9Israel 1.2 1.2 -3.3 -2.5 -2.3 -1.8 0.1 0.7 1.2 0.6 0.8Korea, Republic of 4.3 3.0 2.1 3.5 6.2 6.6 5.8 6.8 3.7 1.9 2.3Malaysia 2.8 0.5 -0.7 -0.4 1.3 4.0 5.8 5.4 4.6 4.5 5.1Mexico 2.0 0.1 -1.5 -1.6 -2.2 2.0 1.8 1.9 2.3 0.2 0.4Philippines 3.6 4.2 4.5 5.6 3.8 4.1 3.8 5.8 4.5 4.0 4.4Singapore 5.0 -0.5 -5.4 -6.6 -1.5 3.8 3.8 3.0 1.7 -4.2 1.7South Africa 2.3 2.6 1.8 3.2 3.0 3.8 2.9 2.4 1.5 1.1 ..Taiwan Province of China 0.6 -3.3 -4.4 -1.6 0.9 3.7 5.2 4.5 3.5 -0.1 4.0Thailand 1.6 1.9 1.8 2.5 3.9 5.1 5.8 6.2 6.7 5.8 6.5Turkey -1.0 -9.8 -7.5 -10.3 2.1 8.9 7.9 11.4 8.1 3.9 ..Venezuela 4.0 3.1 3.3 0.9 -3.8 -9.1 -5.6 -16.7 -27.6 -9.4 -7.1
Unemployment ratec
Argentinad .. 16.4 .. 18.3 .. 21.5 .. 17.8 .. 15.6 ..Brazil .. .. .. 11.3 12.2 12.0 11.7 10.9 11.6 12.7 12.9Chile 8.8 9.7 10.1 7.9 8.8 9.5 9.7 9.6 7.9 8.8 9.3Colombia 16.7 14.7 14.7 13.8 16.4 15.8 15.3 15.1 15.2 14.0 14.3Hong Kongb 4.5 4.7 5.5 6.5 7.2 7.7 7.2 7.3 7.9 8.6 8.2Indonesia 8.1 .. 8.1 .. 8.1 .. 9.1 .. .. .. ..Israel 8.6 8.8 9.6 10.4 10.4 10.3 10.4 10.2 10.8 10.6 10.7Korea, Republic of 4.9 3.6 3.3 3.3 3.7 3.0 2.8 2.9 3.6 3.3 3.3Malaysia 4.0 3.7 3.3 3.7 3.7 3.8 3.2 3.2 3.8 4.0 ..Mexico 2.4 2.4 2.4 2.5 2.8 2.6 2.9 2.5 2.8 3.0 ..Philippines 11.3 13.3 10.1 9.8 10.3 13.9 11.2 10.2 10.6 12.2 12.7Singapore 2.0 3.4 3.0 4.9 3.7 5.2 3.8 4.7 3.7 5.4 4.9Taiwan Province of China 3.7 4.2 5.1 5.3 5.1 5.0 5.3 5.2 5.1 5.0 5.1Thailand 4.8 3.5 2.6 2.4 3.2 2.9 1.8 1.8 2.9 2.5 ..Turkey 8.6 6.9 8.0 10.6 11.8 9.3 9.6 11.0 12.3 10.0 9.4Uruguay 14.4 15.5 15.6 15.2 14.7 15.4 17.6 19.2 18.6 16.8 16.1Venezuela 14.2 13.3 13.4 12.1 15.5 15.8 16.5 16.2 .. .. ..
Annual percentage change
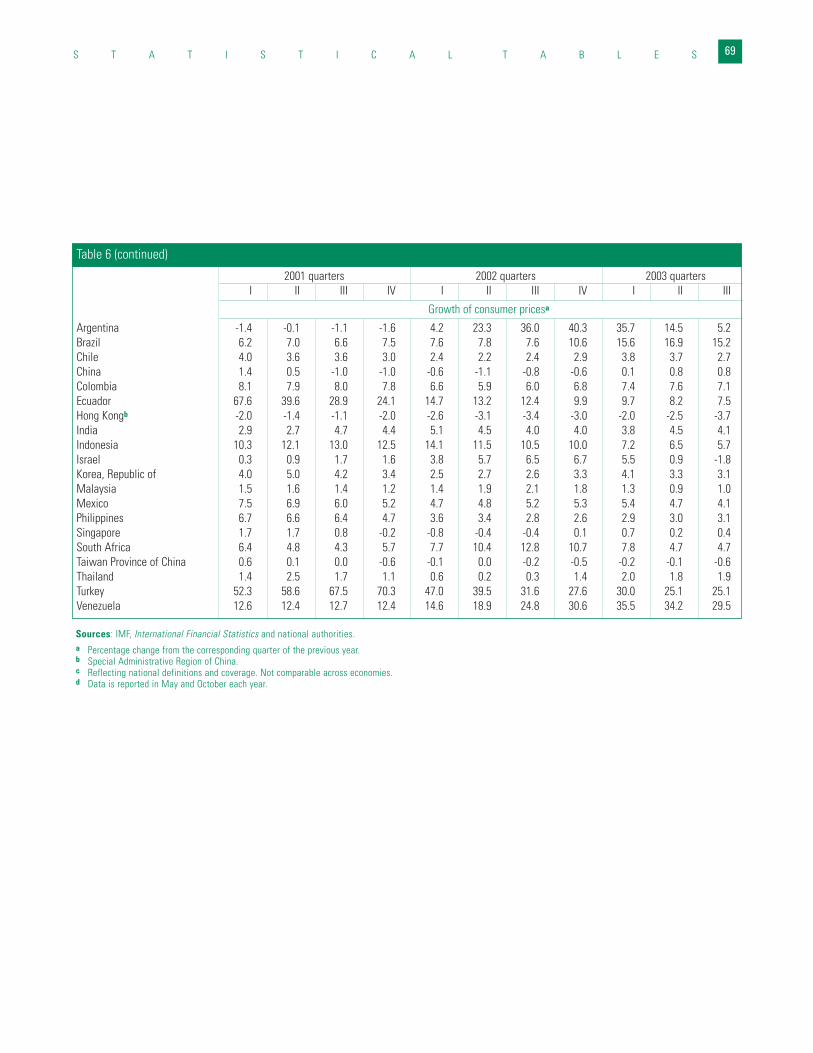
S T A T I S T I C A L T A B L E S 69
2001 quarters 2002 quarters 2003 quartersI II III IV I II III IV I II III
Growth of consumer pricesa
Argentina -1.4 -0.1 -1.1 -1.6 4.2 23.3 36.0 40.3 35.7 14.5 5.2Brazil 6.2 7.0 6.6 7.5 7.6 7.8 7.6 10.6 15.6 16.9 15.2Chile 4.0 3.6 3.6 3.0 2.4 2.2 2.4 2.9 3.8 3.7 2.7China 1.4 0.5 -1.0 -1.0 -0.6 -1.1 -0.8 -0.6 0.1 0.8 0.8Colombia 8.1 7.9 8.0 7.8 6.6 5.9 6.0 6.8 7.4 7.6 7.1Ecuador 67.6 39.6 28.9 24.1 14.7 13.2 12.4 9.9 9.7 8.2 7.5Hong Kongb -2.0 -1.4 -1.1 -2.0 -2.6 -3.1 -3.4 -3.0 -2.0 -2.5 -3.7India 2.9 2.7 4.7 4.4 5.1 4.5 4.0 4.0 3.8 4.5 4.1Indonesia 10.3 12.1 13.0 12.5 14.1 11.5 10.5 10.0 7.2 6.5 5.7Israel 0.3 0.9 1.7 1.6 3.8 5.7 6.5 6.7 5.5 0.9 -1.8Korea, Republic of 4.0 5.0 4.2 3.4 2.5 2.7 2.6 3.3 4.1 3.3 3.1Malaysia 1.5 1.6 1.4 1.2 1.4 1.9 2.1 1.8 1.3 0.9 1.0Mexico 7.5 6.9 6.0 5.2 4.7 4.8 5.2 5.3 5.4 4.7 4.1Philippines 6.7 6.6 6.4 4.7 3.6 3.4 2.8 2.6 2.9 3.0 3.1Singapore 1.7 1.7 0.8 -0.2 -0.8 -0.4 -0.4 0.1 0.7 0.2 0.4South Africa 6.4 4.8 4.3 5.7 7.7 10.4 12.8 10.7 7.8 4.7 4.7Taiwan Province of China 0.6 0.1 0.0 -0.6 -0.1 0.0 -0.2 -0.5 -0.2 -0.1 -0.6Thailand 1.4 2.5 1.7 1.1 0.6 0.2 0.3 1.4 2.0 1.8 1.9Turkey 52.3 58.6 67.5 70.3 47.0 39.5 31.6 27.6 30.0 25.1 25.1Venezuela 12.6 12.4 12.7 12.4 14.6 18.9 24.8 30.6 35.5 34.2 29.5
Table 6 (continued)
Sources: IMF, International Financial Statistics and national authorities.a Percentage change from the corresponding quarter of the previous year.b Special Administrative Region of China.c Reflecting national definitions and coverage. Not comparable across economies.d Data is reported in May and October each year.
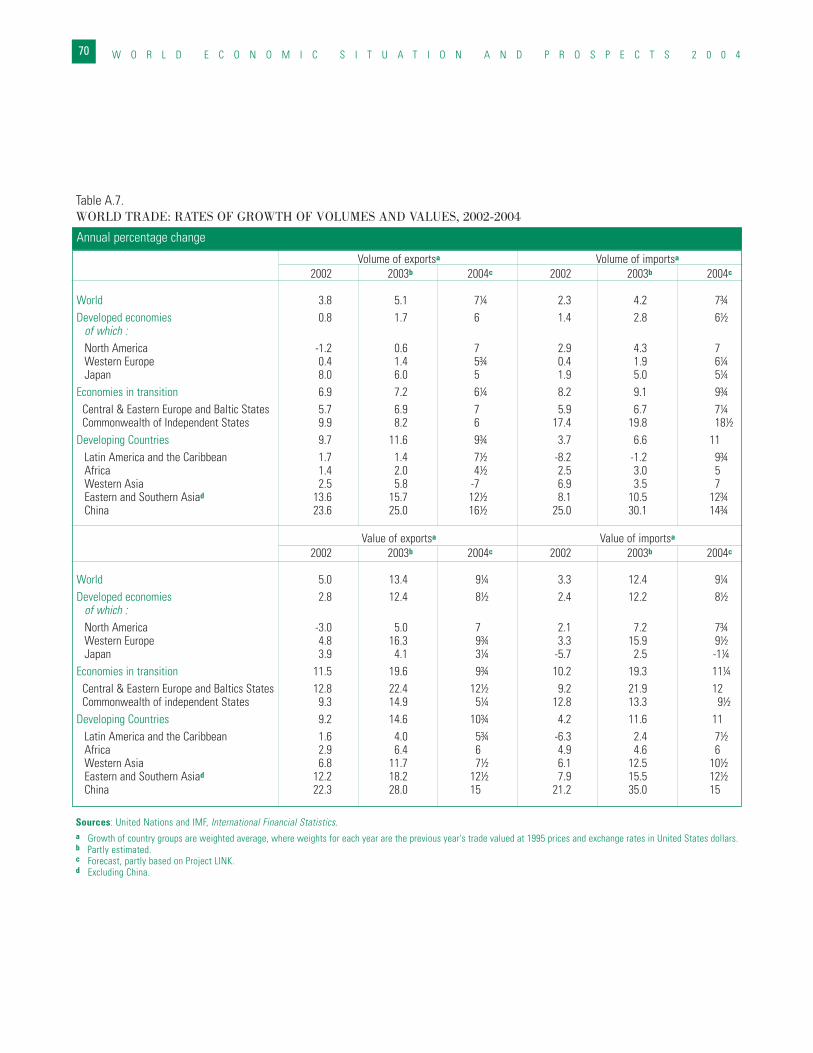
W O R L D E C O N O M I C S I T U A T I O N A N D P R O S P E C T S 2 0 0 470
Table A.7.WORLD TRADE: RATES OF GROWTH OF VOLUMES AND VALUES, 2002-2004
Volume of exportsa Volume of importsa
2002 2003b 2004c 2002 2003b 2004c
World 3.8 5.1 7¼ 2.3 4.2 7¾Developed economies 0.8 1.7 6 1.4 2.8 6½
of which :North America -1.2 0.6 7 2.9 4.3 7 Western Europe 0.4 1.4 5¾ 0.4 1.9 6¼Japan 8.0 6.0 5 1.9 5.0 5¼
Economies in transition 6.9 7.2 6¼ 8.2 9.1 9¾Central & Eastern Europe and Baltic States 5.7 6.9 7 5.9 6.7 7¼Commonwealth of Independent States 9.9 8.2 6 17.4 19.8 18½
Developing Countries 9.7 11.6 9¾ 3.7 6.6 11 Latin America and the Caribbean 1.7 1.4 7½ -8.2 -1.2 9¾Africa 1.4 2.0 4½ 2.5 3.0 5 Western Asia 2.5 5.8 -7 6.9 3.5 7 Eastern and Southern Asiad 13.6 15.7 12½ 8.1 10.5 12¾China 23.6 25.0 16½ 25.0 30.1 14¾
Value of exportsa Value of importsa
2002 2003b 2004c 2002 2003b 2004c
World 5.0 13.4 9¼ 3.3 12.4 9¼Developed economies 2.8 12.4 8½ 2.4 12.2 8½
of which :North America -3.0 5.0 7 2.1 7.2 7¾Western Europe 4.8 16.3 9¾ 3.3 15.9 9½Japan 3.9 4.1 3¼ -5.7 2.5 -1¼
Economies in transition 11.5 19.6 9¾ 10.2 19.3 11¼Central & Eastern Europe and Baltics States 12.8 22.4 12½ 9.2 21.9 12 Commonwealth of independent States 9.3 14.9 5¼ 12.8 13.3 9½
Developing Countries 9.2 14.6 10¾ 4.2 11.6 11 Latin America and the Caribbean 1.6 4.0 5¾ -6.3 2.4 7½Africa 2.9 6.4 6 4.9 4.6 6 Western Asia 6.8 11.7 7½ 6.1 12.5 10½Eastern and Southern Asiad 12.2 18.2 12½ 7.9 15.5 12½China 22.3 28.0 15 21.2 35.0 15
Annual percentage change
Sources: United Nations and IMF, International Financial Statistics.a Growth of country groups are weighted average, where weights for each year are the previous year's trade valued at 1995 prices and exchange rates in United States dollars.b Partly estimated.c Forecast, partly based on Project LINK.d Excluding China.
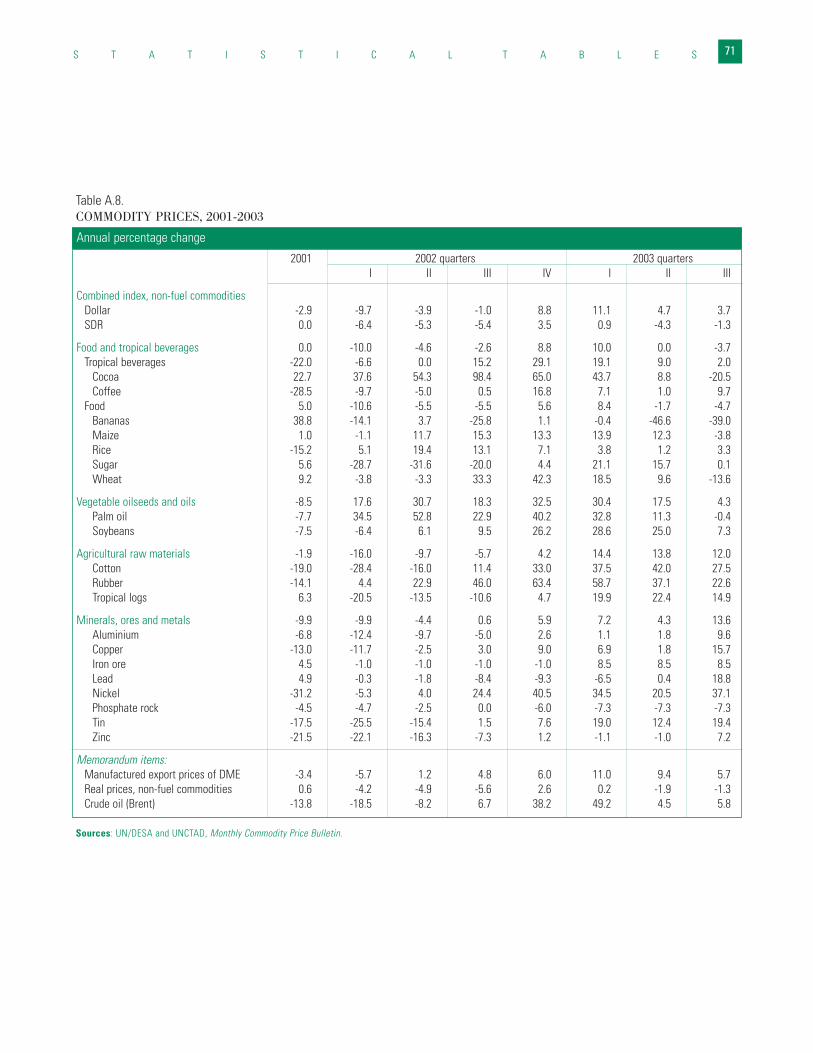
S T A T I S T I C A L T A B L E S 71
Table A.8.COMMODITY PRICES, 2001-2003
2001 2002 quarters 2003 quartersI II III IV I II III
Combined index, non-fuel commoditiesDollar -2.9 -9.7 -3.9 -1.0 8.8 11.1 4.7 3.7SDR 0.0 -6.4 -5.3 -5.4 3.5 0.9 -4.3 -1.3
Food and tropical beverages 0.0 -10.0 -4.6 -2.6 8.8 10.0 0.0 -3.7Tropical beverages -22.0 -6.6 0.0 15.2 29.1 19.1 9.0 2.0
Cocoa 22.7 37.6 54.3 98.4 65.0 43.7 8.8 -20.5Coffee -28.5 -9.7 -5.0 0.5 16.8 7.1 1.0 9.7
Food 5.0 -10.6 -5.5 -5.5 5.6 8.4 -1.7 -4.7Bananas 38.8 -14.1 3.7 -25.8 1.1 -0.4 -46.6 -39.0Maize 1.0 -1.1 11.7 15.3 13.3 13.9 12.3 -3.8Rice -15.2 5.1 19.4 13.1 7.1 3.8 1.2 3.3Sugar 5.6 -28.7 -31.6 -20.0 4.4 21.1 15.7 0.1Wheat 9.2 -3.8 -3.3 33.3 42.3 18.5 9.6 -13.6
Vegetable oilseeds and oils -8.5 17.6 30.7 18.3 32.5 30.4 17.5 4.3Palm oil -7.7 34.5 52.8 22.9 40.2 32.8 11.3 -0.4Soybeans -7.5 -6.4 6.1 9.5 26.2 28.6 25.0 7.3
Agricultural raw materials -1.9 -16.0 -9.7 -5.7 4.2 14.4 13.8 12.0Cotton -19.0 -28.4 -16.0 11.4 33.0 37.5 42.0 27.5Rubber -14.1 4.4 22.9 46.0 63.4 58.7 37.1 22.6Tropical logs 6.3 -20.5 -13.5 -10.6 4.7 19.9 22.4 14.9
Minerals, ores and metals -9.9 -9.9 -4.4 0.6 5.9 7.2 4.3 13.6Aluminium -6.8 -12.4 -9.7 -5.0 2.6 1.1 1.8 9.6Copper -13.0 -11.7 -2.5 3.0 9.0 6.9 1.8 15.7Iron ore 4.5 -1.0 -1.0 -1.0 -1.0 8.5 8.5 8.5Lead 4.9 -0.3 -1.8 -8.4 -9.3 -6.5 0.4 18.8Nickel -31.2 -5.3 4.0 24.4 40.5 34.5 20.5 37.1Phosphate rock -4.5 -4.7 -2.5 0.0 -6.0 -7.3 -7.3 -7.3Tin -17.5 -25.5 -15.4 1.5 7.6 19.0 12.4 19.4Zinc -21.5 -22.1 -16.3 -7.3 1.2 -1.1 -1.0 7.2
Memorandum items:Manufactured export prices of DME -3.4 -5.7 1.2 4.8 6.0 11.0 9.4 5.7Real prices, non-fuel commodities 0.6 -4.2 -4.9 -5.6 2.6 0.2 -1.9 -1.3Crude oil (Brent) -13.8 -18.5 -8.2 6.7 38.2 49.2 4.5 5.8
Annual percentage change
Sources: UN/DESA and UNCTAD, Monthly Commodity Price Bulletin.
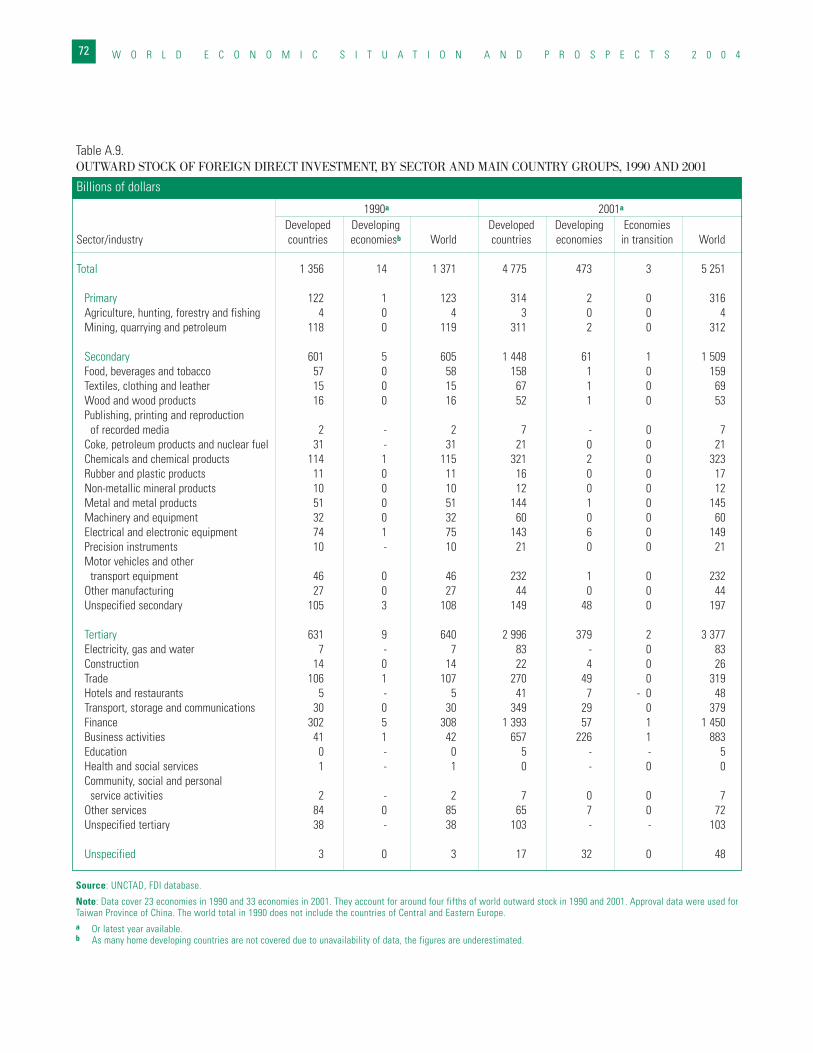
W O R L D E C O N O M I C S I T U A T I O N A N D P R O S P E C T S 2 0 0 472
Table A.9.OUTWARD STOCK OF FOREIGN DIRECT INVESTMENT, BY SECTOR AND MAIN COUNTRY GROUPS, 1990 AND 2001
1990a 2001a
Developed Developing Developed Developing EconomiesSector/industry countries economiesb World countries economies in transition World
Total 1 356 14 1 371 4 775 473 3 5 251
Primary 122 1 123 314 2 0 316Agriculture, hunting, forestry and fishing 4 0 4 3 0 0 4Mining, quarrying and petroleum 118 0 119 311 2 0 312
Secondary 601 5 605 1 448 61 1 1 509Food, beverages and tobacco 57 0 58 158 1 0 159Textiles, clothing and leather 15 0 15 67 1 0 69Wood and wood products 16 0 16 52 1 0 53Publishing, printing and reproduction
of recorded media 2 - 2 7 - 0 7Coke, petroleum products and nuclear fuel 31 - 31 21 0 0 21Chemicals and chemical products 114 1 115 321 2 0 323Rubber and plastic products 11 0 11 16 0 0 17Non-metallic mineral products 10 0 10 12 0 0 12Metal and metal products 51 0 51 144 1 0 145Machinery and equipment 32 0 32 60 0 0 60Electrical and electronic equipment 74 1 75 143 6 0 149Precision instruments 10 - 10 21 0 0 21Motor vehicles and other
transport equipment 46 0 46 232 1 0 232Other manufacturing 27 0 27 44 0 0 44Unspecified secondary 105 3 108 149 48 0 197
Tertiary 631 9 640 2 996 379 2 3 377Electricity, gas and water 7 - 7 83 - 0 83Construction 14 0 14 22 4 0 26Trade 106 1 107 270 49 0 319Hotels and restaurants 5 - 5 41 7 - 0 48Transport, storage and communications 30 0 30 349 29 0 379Finance 302 5 308 1 393 57 1 1 450Business activities 41 1 42 657 226 1 883Education 0 - 0 5 - - 5Health and social services 1 - 1 0 - 0 0Community, social and personal
service activities 2 - 2 7 0 0 7Other services 84 0 85 65 7 0 72Unspecified tertiary 38 - 38 103 - - 103
Unspecified 3 0 3 17 32 0 48
Billions of dollars
Source: UNCTAD, FDI database.
Note: Data cover 23 economies in 1990 and 33 economies in 2001. They account for around four fifths of world outward stock in 1990 and 2001. Approval data were used forTaiwan Province of China. The world total in 1990 does not include the countries of Central and Eastern Europe.a Or latest year available.b As many home developing countries are not covered due to unavailability of data, the figures are underestimated.
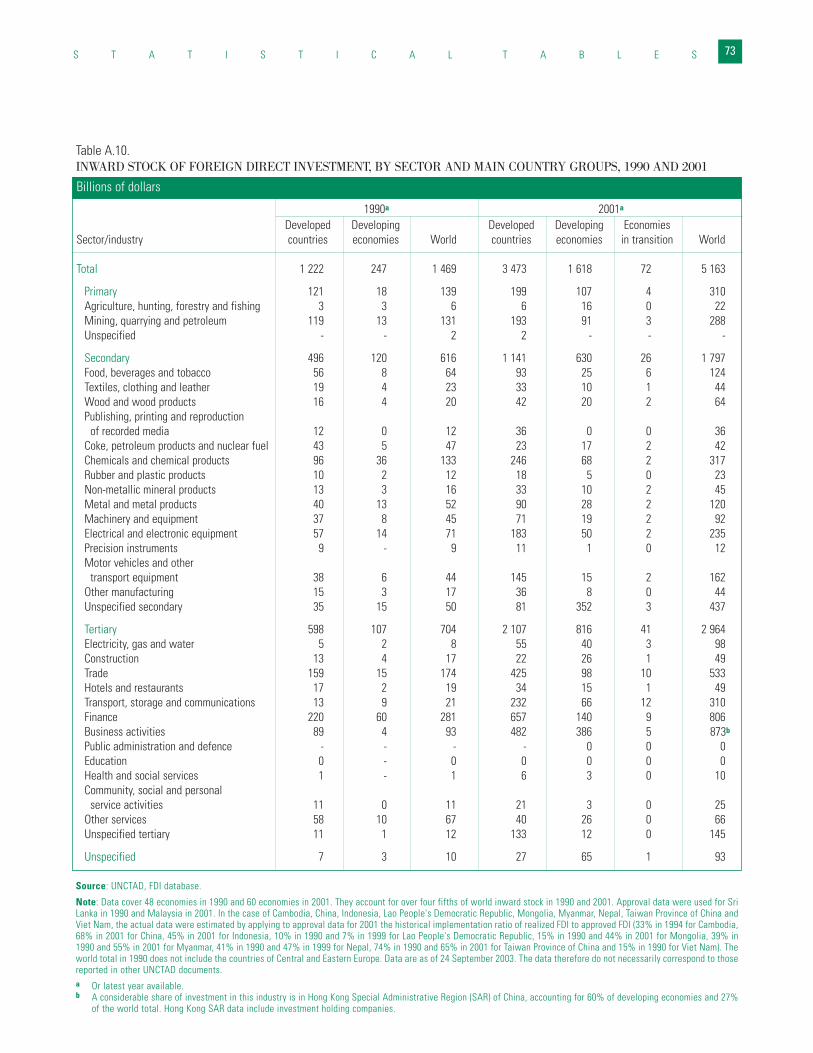
S T A T I S T I C A L T A B L E S
Table A.10.INWARD STOCK OF FOREIGN DIRECT INVESTMENT, BY SECTOR AND MAIN COUNTRY GROUPS, 1990 AND 2001
1990a 2001a
Developed Developing Developed Developing EconomiesSector/industry countries economies World countries economies in transition World
Total 1 222 247 1 469 3 473 1 618 72 5 163
Primary 121 18 139 199 107 4 310Agriculture, hunting, forestry and fishing 3 3 6 6 16 0 22Mining, quarrying and petroleum 119 13 131 193 91 3 288Unspecified - - 2 2 - - -
Secondary 496 120 616 1 141 630 26 1 797Food, beverages and tobacco 56 8 64 93 25 6 124Textiles, clothing and leather 19 4 23 33 10 1 44Wood and wood products 16 4 20 42 20 2 64Publishing, printing and reproduction
of recorded media 12 0 12 36 0 0 36Coke, petroleum products and nuclear fuel 43 5 47 23 17 2 42Chemicals and chemical products 96 36 133 246 68 2 317Rubber and plastic products 10 2 12 18 5 0 23Non-metallic mineral products 13 3 16 33 10 2 45Metal and metal products 40 13 52 90 28 2 120Machinery and equipment 37 8 45 71 19 2 92Electrical and electronic equipment 57 14 71 183 50 2 235Precision instruments 9 - 9 11 1 0 12Motor vehicles and other
transport equipment 38 6 44 145 15 2 162Other manufacturing 15 3 17 36 8 0 44Unspecified secondary 35 15 50 81 352 3 437
Tertiary 598 107 704 2 107 816 41 2 964Electricity, gas and water 5 2 8 55 40 3 98Construction 13 4 17 22 26 1 49Trade 159 15 174 425 98 10 533Hotels and restaurants 17 2 19 34 15 1 49Transport, storage and communications 13 9 21 232 66 12 310Finance 220 60 281 657 140 9 806Business activities 89 4 93 482 386 5 873b
Public administration and defence - - - - 0 0 0Education 0 - 0 0 0 0 0Health and social services 1 - 1 6 3 0 10Community, social and personal
service activities 11 0 11 21 3 0 25Other services 58 10 67 40 26 0 66Unspecified tertiary 11 1 12 133 12 0 145
Unspecified 7 3 10 27 65 1 93
Billions of dollars
Source: UNCTAD, FDI database.
Note: Data cover 48 economies in 1990 and 60 economies in 2001. They account for over four fifths of world inward stock in 1990 and 2001. Approval data were used for SriLanka in 1990 and Malaysia in 2001. In the case of Cambodia, China, Indonesia, Lao People's Democratic Republic, Mongolia, Myanmar, Nepal, Taiwan Province of China andViet Nam, the actual data were estimated by applying to approval data for 2001 the historical implementation ratio of realized FDI to approved FDI (33% in 1994 for Cambodia,68% in 2001 for China, 45% in 2001 for Indonesia, 10% in 1990 and 7% in 1999 for Lao People's Democratic Republic, 15% in 1990 and 44% in 2001 for Mongolia, 39% in1990 and 55% in 2001 for Myanmar, 41% in 1990 and 47% in 1999 for Nepal, 74% in 1990 and 65% in 2001 for Taiwan Province of China and 15% in 1990 for Viet Nam). Theworld total in 1990 does not include the countries of Central and Eastern Europe. Data are as of 24 September 2003. The data therefore do not necessarily correspond to thosereported in other UNCTAD documents.a Or latest year available.b A considerable share of investment in this industry is in Hong Kong Special Administrative Region (SAR) of China, accounting for 60% of developing economies and 27%
of the world total. Hong Kong SAR data include investment holding companies.
73


World Economic World Economic Situation and Situation and
Prospects 2004Prospects 2004
United Nations