Embed Size (px)
Citation preview
1
Informal firms in Mozambique: status and potential
Gemechu Aga, Francisco Campos, Adriana Conconi, Elwyn Davies, Carolin Geginat
Version: June 25, 2019
Abstract
In most countries in Africa, the informal sector is large and exhibits low levels of productivity
compared to the formal economy: informal firms are typically small, inefficient, and run by
entrepreneurs with low levels of education. This paper presents novel representative firm-level
data collected on informal firms in the three largest cities of Mozambique, as well as data of formal
enterprises. Compared to formal microenterprises, informal firms sell about 14 times less, make
17 times lower profits and are 2-3 times less productive. Almost two-thirds (61%) of these
performance gaps can be explained by differences in firm characteristics: informal firms are
smaller, use fewer business practices and use less capital and production inputs, while the rest of
the gap is explained by differential returns. Despite this “duality” between formality and
informality, there is nevertheless a small but significant group of informal enterprises (7.6% of
informal firms, representing 10.6% of employment in the informal sector) that in their
characteristics and productivity levels are similar to formal microenterprises. Policies should take
this heterogeneity into account.
Keywords: Informality; business registration; tax; government; financial access, small enterprises.
JEL codes: O17, O12, C93, D22, H41, L26
Pub
lic D
iscl
osur
e A
utho
rized
Pub
lic D
iscl
osur
e A
utho
rized
Pub
lic D
iscl
osur
e A
utho
rized
Pub
lic D
iscl
osur
e A
utho
rized
2
1 Introduction
In line with many other low-income countries, informality remains very much prevalent in
Mozambique: about 80% of the Mozambican labor force works in the informal sector, mostly in
agriculture and informal self-employment (World Bank 2018). Very few workers are employed
formally: social security only covers a mere 6% of the labor force. Despite the establishment of
“one-stop shops” by the Mozambique government to encourage registration, Mozambique still
only ranks 174 out of 190 on the formal Ease of Starting a Business and firms report that
registration remains an even lengthier and tedious process than what the law requires of them.1
Berkel (2018) followed a shoemaker from Maputo on his journey of formalizing his firm. Even
though the law stipulates a business license with indefinite validity could be obtained with only
minimal documentation, the entrepreneur was sent back several times to collect additional
documents that were not required by law, had to pay more (5,700 MZN / US$100 instead of 1,639
MZN / US$27) and in the end only got a license that had to be renewed annually for a fee of 3,000
MZN. The entire procedure took 32 days, instead of the 17 days formally required that are
documented by the World Bank’s Doing Business report.
The informal sector in Mozambique is estimated to account for 31% of GDP (Medina and
Schneider 2018). Despite its importance, our understanding of the informal private sector in
Mozambique is limited. Existing administrative data (e.g., the Censo de Empresas, CEMPRE, as
used by Lachler & Walker 2018) only covers the formal manufacturing sector (which corresponds
to only 7% of all firms in the country).
This paper covers this gap by analyzing novel non-farm firm data collected by the 2018 World
Bank Enterprise Survey, which – for the first time in Mozambique – also covers informal
enterprises. As the data shows, and in line with the earlier literature, informal firms are less
productive than formal enterprises, confirming findings from other countries. Compared to formal
microenterprises, informal firms sell about 14 times less, make 17 times lower profits and are 2-3
times less productive. Informal firms significantly differ in underlying characteristics from formal
microenterprises. Informal firms employ fewer employees, use less capital and raw material, are
1 In the Enterprise Survey of informal firms, 40.8% of informal enterprises report that the time, fees, and paperwork
required to register is the primary or secondary reason why they have not registered.
3
less likely to have access to finance and banking, adopt fewer good business practices and have
fewer skills at their disposal.
But not all informal firms are the same. Earlier studies in other countries have shown that there is
a group of informal firms that is very similar in their characteristics to formal enterprises (De Mel
et al. 2010, Bruhn 2011, Benhassine et al. 2018) and who produce at similar levels as formal
enterprises (e.g. in Tanzania, Diao, Kweka & McMillan 2017). Benhassine et al. (2018) showed
for Benin that this group of firms was more likely to benefit more from formalization incentives
than other firms. Using a discriminant analysis (also known as species classification) we identify
for Mozambique a group of “high-resemblance-high-performance” informal firms that in their
characteristics resemble formal businesses and produce on par with them. This group corresponds
to 7.6% of informal firms, representing 10.6% of employment in the informal sector in the three
cities we study.
This paper is organized as follows. Section 2 presents a review of the literature on informal firms.
Section 3 presents the data, sampling and empirical strategy. Section 4 describes the informal
sector in Mozambique. Section 5 compares the performance of informal and formal firms,
identifying possible explanatory factors for the differences. Section 6 identifies informal firms in
Mozambique with high productivity and a high resemblance to formal firms. Section 7 discusses
the implications of the findings for policy.
2 Background
Cross-country comparisons show a strong relationship between informality and economic output:
informality is especially prevalent in low income countries, and informality declines as countries
become wealthier (La Porta & Schleifer 2014). Despite the strong correlation, the direction of
causality is not necessarily obvious.
One view expressed by De Soto (1989) suggests that burdensome regulation is keeping firms both
informal and unproductive. A removal of these barriers will allow firms to increase access to
4
finance and markets, provide more legal certainty and subsequently encourage firm growth. Some
of the benefits might accrue to other firms that are already formal or to potential new entrant firms.2
An opposing view expressed by La Porta & Schleifer (2014) emphasizes that informal firms are
in their characteristics (e.g. education, skills, experience, and attitudes of the manager) very
different from formal firms and that these differences in fundamental characteristics are key to
understanding observed differences in firm performance. Under this view, policy should focus on
other areas of enterprise development, and that informality would reduce over time as the country
develops.
Countries around the world have tried different approaches to entice firms to formalize:
a. Many countries have approached the challenge of formalization by simplifying legal
procedures. Experiences from countries like Mexico and Colombia show that simplified
start-up processes do lead to increases in the number of business registrations (e.g., in
Mexico and Colombia the number of registrations increased by approximately 5%; see
Bruhn 2011, Kaplan, Piedra & Seria 2011, Bruhn & McKenzie 2013). In Peru,
simplification led to a 43% increase in firm registrations, but many firms only applied for
temporary one-year licenses and did not renew these in the following year (Mullainathan
& Schnabl 2010; Bruhn & McKenzie 2013).3
b. Other countries focused on creating more transparency around the process have had decent
results. In Malawi, providing firms with information and support to register was successful.
Campos, Goldstein & McKenzie (2018) conducted a field experiment where firms were
given hands-on assistance in registering their business. More than 70% of the targeted firms
registered their business, even though fewer than 10% registered for taxes. However,
business registration on its own did not impact firm profits. Only when information on
business registration was combined with information on opening a business bank account
profits increased. In another field experiment in Belo Horizonte, Brazil, De Andrade,
2 Informal firms can harm and in certain cases crowd out existing formal firms or potential entrants, by competing
unfairly through the avoidance of tax and labor regulations (Levy 2008). In the 2018 Mozambique Enterprise Survey,
unfair competition from the informal sector was indeed identified as among the top three constraints on operations
and productivity for formal firms in Mozambique. 3 In the case of Peru (Mullainathan & Schnabl 2010) were offered the choice between a more expensive permanent
license and a cheaper provisional license, only valid for one year. A proportion of 63% of businesses opted for the
provisional one-year license.
5
Bruhn & McKenzie (2014) find that just providing information on business registration
does not lead to more business registrations. However, increasing enforcement does help
to achieve formalization: firms that were visited by an inspector were 27% more likely to
be registered.
c. And some countries have tried financial incentives to entice firms to formalize. In Sri
Lanka, De Mel et al. (2013) conducted a field experiment giving informal firms with 1 to
14 workers incentives to formalize. Treatments in which firms were given information on
the registration process or were reimbursed their direct costs did not lead to more business
registrations. Payments between half and twice the median firm’s profits did lead to more
business registrations, but the impact on firm performance remained limited to a few firms.
In Benin, the government simplified registration and exempted newly registered firms from
paying taxes. Nevertheless, formalization rates were low: an intervention that provided
information on the new regime increased formalization by 9.6% and combining this with
tax assistance and connecting to a bank led to an increase 16 percentage points in business
registration rates (Benhassine et al. 2018).
Despite the success of some of these interventions in achieving formalization, full elimination of
informality rarely happens, even in countries with simple, cheap and transparent processes to
register a business. For countries in the upper quart of the income distribution measures of
informality suggest that on average informality represents around 8% to 17% of GDP (La Porta &
Shleifer 2008; ILO 2018).
Given the cost of registration and the costs of formalization encouragement programs,
encouragement programs targeting all firms may not be cost-effective (Benhassine et al. 2018).4
Instead, the question is whether there is a subset of firms that would benefit most from
formalization and should be targeted.
World Bank Enterprise Survey data across the world suggests that informal entrepreneurs tend to
have received less education than formal entrepreneurs and score lower across a wide range of
skill metrics (La Porta & Shleifer 2008). Informal entrepreneurs are also more likely to be
“necessity entrepreneurs”, whose main rationale to become an entrepreneur is a lack of an outside
4 This does not mean necessarily that there are no further benefits to formalization, as some of the benefits may accrue
to other firms that are already formal or to potential new entrant firms.
6
option, while formal entrepreneurs are more likely to be “opportunity entrepreneurs”, who made
an active choice to become an entrepreneur to take advantage of a perceived unexploited or
underexploited business opportunity (Acs 2006).
It is likely that many of the informal entrepreneurs would take up wage employment if the
opportunity came along. In Sri Lanka, De Mel et al. (2010) compare the characteristics of informal
entrepreneurs with those of larger firm owners and wage workers. They find that about two thirds
to three quarters of informal entrepreneurs have characteristics that are very similar to wage
workers. The attraction of wage work can have consequences for business growth: Koelle (2019)
argues that entrepreneurs who anticipate that at some point a wage opportunity will come along,
invest rationally less in their business.
However, some studies suggest that there is a subgroup of informal firms with capacity to grow.
For example, in the De Mel et al. (2013) study in Sri Lanka, there was a small group of high-
growth firms (about 5% of the sample) who following registration significantly increased their
performance. To identify these informal firms that can grow, earlier studies have taken two
approaches: identifying firms that perform on par with the formal sector (high-performance firms)
or firms that in characteristics are similar to formal firms (high-resemblance firms). Diao, Kweka
& McMillan (2017) take the first approach and show that in Tanzania a significant degree in
overlap in productivity exists between formal and informal micro, small and medium-sized
enterprises (MSMEs), and informal “in-between” firms contributed significantly to overall labor
productivity growth. De Mel et al. (2010) study in Sri Lanka is an example of the second approach
– it uses a species classification analysis to show that about a quarter to a third of
microentrepreneurs share similar characteristics as those of larger enterprises.
There is some evidence that these firms with an overlap in characteristics with the formal sector
are more likely to formalize. Bruhn (2011) replicates this species classification in Mexico and
shows that the group of informal business owners sharing characteristics with formal entrepreneurs
– about half of the informal business owners – was more likely to register their business as part of
a formalization campaign than informal entrepreneurs resembling wage workers. Likewise, in
Benin, Benhassine et al. (2018) classify 18% of (initial) informal businesses as being similar to
formal enterprises, and these firms were 4 to 12 percentage points more likely to register than other
firms.
7
3 Data and empirical strategy
Data
For this analysis, we rely on newly collected data for the Mozambique 2018 World Bank Enterprise
Survey. Formal firms are sampled from firm listings maintained by the national statistical agency
(Instituto Nacional de Estatistica), and for firms with five or more employees, also from the
previous edition of the Enterprise Survey, which was conducted in 2007. The survey for micro
firms (0-4 employees) was stratified by province (Cabo Delgado, Nampula, Zambézia, Tete,
Manica, Sofala and Greater Maputo) and by industry (mining and quarrying, food and beverages,
metals/machinery/computers/electronics, other manufacturing, tourism, retail and other services).
The survey for small, medium and large enterprises (more than 5 employees) was stratified by
region, industry and size. Most of our analysis of formal firms as a comparator group relies on the
micro firm survey data.
For the first time in Mozambique, the Enterprise Survey also interviewed informal firms.5 The
informal firms survey covered firms in the three biggest cities (Beira, Maputo and Nampula, where
2.4 million people live or 9% of the country’s total population). A firm is considered informal in
Mozambique when it lacks either an operating license, a business registration certificate, or a
taxpayer’s identification number (NUIT) in name of the owner.
Informal firms – by definition – are not included in the business register and are therefore sampled
using an alternative method, Adaptive Cluster Sampling (Thompson 1990). This method relies on
dividing the surveyed cities into a grid of 150 by 150 squares, with each square stratified into four
different categories based on the likely concentration of informal business – low, medium, high
concentration areas, and market centers.
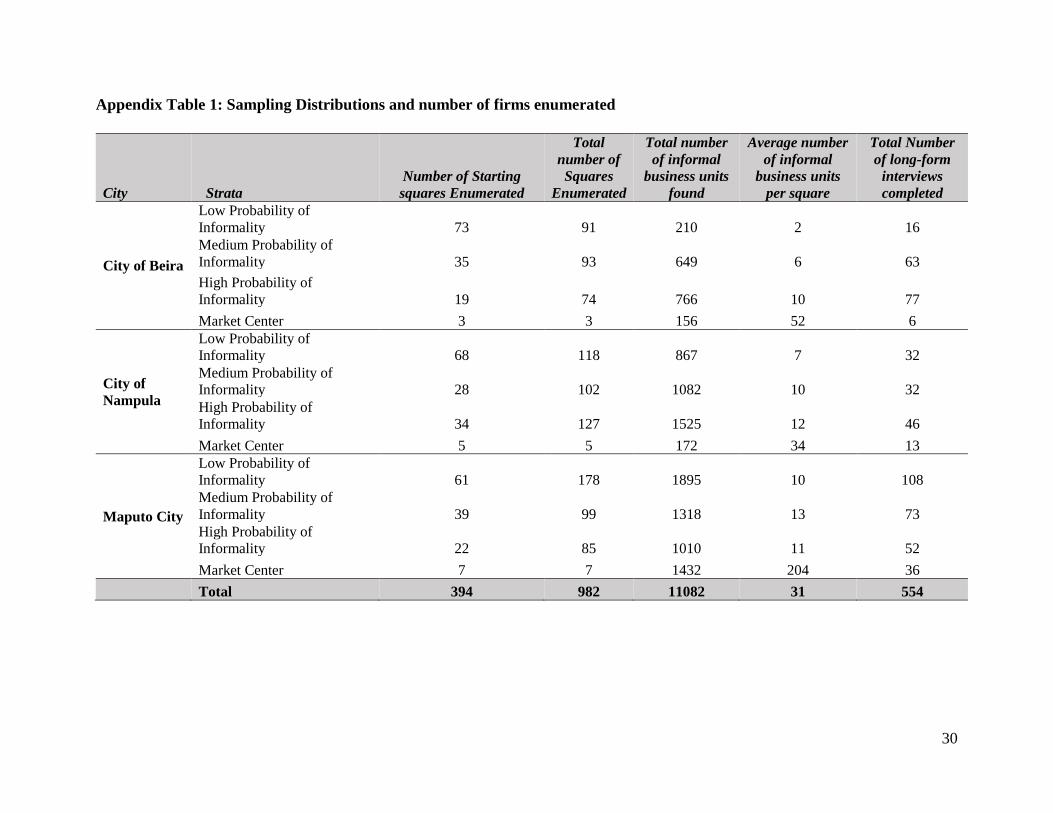
A total of about 400 squares were randomly selected - within strata of the likelihood of identifying
informal firms - for a full enumeration (see Annex-1 for distribution of the sample by city). All
informal firms in these squares were enumerated by administrating few questions to capture
information on the type of activity, physical location, and the number of workers, etc. Since
5 The datasets for both formal and informal firms are available at https://www.enterprisesurveys.org/data.
8
businesses can be operated from within the household premises, enumeration required knocking
on every house in the square to check if there are informal businesses activities in the house. A
sub-sample of the enumerated informal businesses were selected randomly, using the tablet device,
and administered the main questionnaire for the survey. The selection of businesses to the main
interview is conducted in real time while enumeration is being conducted, and it is pre-
programmed in to the CAPI system such that enumerators have in principle no control on which
informal business will get selected for the main questionnaire.
The process is adaptive, namely that the enumeration and main data collection is expanded to all
adjacent squares if the number of informal firms found in a given square is above a pre-defined
threshold. This process is repeated until the number of firms found in a square is lower than the
set threshold or a maximum number of iterations was reached.
A total of 982 squares were surveyed in Mozambique, leading to a listing of 11,000 informal firms.
Of these, 554 firms were randomly selected for the full-length Enterprise Survey informal firms’
questionnaire.6
Empirical strategy
We start by examining whether informal firms have lower sales and profits. We run local linear
regressions of log sales/profits on informality. Next, we examine cross-sectional associations with
productivity by estimating for firm i in industry j and location p:
𝑦𝑖,𝑗,𝑝 = 𝛼𝑙𝑙𝑖,𝑗,𝑝 + 𝛼𝑘𝑘𝑖,𝑗,𝑝 + 𝛼𝑛𝑛𝑖,𝑗,𝑝 + 𝛽𝐼𝑖,𝑗,𝑝 + 𝛿𝑍𝑖,𝑗,𝑝 + 𝜇𝑖,𝑗.𝑝 (Eq. 1)
where y is log sales or log profits, l is log labor, k is log capital, n is log inputs, and I is a dummy
variable taking the value of 1 if the firm is informal. Z is a vector of additional controls that are
predicted to affect firm performance, such as firm characteristics (e.g. firm age) and business
owner characteristics (e.g. gender).7
To better understand the drivers behind performance gaps between informal and formal firms, we
use the Oaxaca-Blinder (OB) decomposition. Consider that informal and formal firms differ in
their characteristics. These different characteristics contribute to the productivity gap between
6 Questionnaire modules included in Appendix Table 3. 7 See Table 3 for full description of the controls used.
9
formal and informal firms (e.g. formal firms tend to be larger than informal firms and large firms
are more productive). But also, the relationship between these characteristics and performance
could differ between formal and informal firms (e.g. a formal firm can benefit more from adding
an employee compared to an informal firm). The OB decomposition decomposes the gap into the
part explained by formal and informal firms differing in observable characteristics (the
“endowment effect”) and the part explained by how these characteristics influence performance
differently between formal and informal firms (the “structure effect” or “coefficients effect”).
For the OB decomposition, we follow O'Sullivan et al. (2014) and Fortin et al. (2011). We estimate
the following equation with outcome measure 𝑌 (e.g., log sales):
𝑌𝑔 = 𝑋′𝛽 + 휀 (Eq. 2)
where g indicates the firm type, 𝑋′ is a matrix (𝑛 × 𝐾) with K observable owner’s and firm’s
characteristics; 𝛽 is the associated vector of intercept and slope coefficients; and 휀 is the error term
under the assumption that 𝐸(휀𝐹𝐴) = 𝐸(휀𝐹𝐵) = 0 where 𝐹𝐴 is a firm-type A8 and 𝐹𝐵 is a firm-type
B.9 The gap between firm types 𝐺 is expressed as the mean outcome difference:
𝐺 = 𝐸(𝑌𝐹𝐴) − 𝐸(𝑌𝐹𝐵) (Eq. 3)
Replacing Eq. (3) into Eq. (2) and taking the expectations, the gap is:
𝐺 = 𝐸(𝑋′)𝛽𝐹𝐵 + 𝐸(휀𝐹𝐵) − 𝐸(𝑋′)𝛽𝐹𝐴 − 𝐸(휀𝐹𝐴) = 𝐸(𝑋
′)𝛽𝐹𝐵 − 𝐸(𝑋′)𝛽𝐹𝐴 (Eq. 4)
and Eq. (4) can be rewritten as:
𝐺 = 𝛽0,𝐹𝐵 +∑𝐸(𝑋𝑘,𝐹𝐵)𝛽𝑘,𝐹𝐵
𝐾
𝑘=1
− 𝛽0,𝐹𝐴 −∑𝐸(𝑋𝑘,𝐹𝐴)𝛽𝑘,𝐹𝐴
𝐾
𝑘=1
(Eq. 5)
Rearranging Eq. (5) and adding and subtracting the intercept coefficient of the pooled regression
𝛽0∗ and the terms 𝐸(𝑋𝑡,𝑘) 𝛽𝑘
∗, we obtain:
𝐺 =∑[𝐸(𝑋𝑘,𝐹𝐵) − 𝐸(𝑋𝑘,𝐹𝐴)]
𝐾
𝑘=1
𝛽𝑘∗
⏟ 𝐶𝑜𝑚𝑝𝑜𝑛𝑒𝑛𝑡 1: 𝐸𝑛𝑑𝑜𝑤𝑚𝑒𝑛𝑡 𝐸𝑓𝑓𝑒𝑐𝑡
+
8 Firm-type A: Informal. 9 Firm-type B: Formal
10
(𝛽0,𝐹𝐵 − 𝛽0∗)+∑ 𝐸(𝑋𝑘,𝐹𝐵) (𝛽𝑘,𝐹𝐵 − 𝛽𝑘
∗)
𝐾
𝑘=1⏟ 𝐹𝑖𝑟𝑚 𝑇𝑦𝑝𝑒 𝐵 𝑆𝑡𝑟𝑢𝑐𝑡𝑢𝑟𝑎𝑙 𝐴𝑑𝑣𝑎𝑛𝑡𝑎𝑔𝑒
+ ( 𝛽0∗ − 𝛽0,𝐹𝐴)+∑ 𝐸(𝑋𝑘,𝐹𝐴) (𝛽𝑘
∗ − 𝛽𝑘,𝐹𝐴
)
𝐾
𝑘=1⏟ 𝐹𝑖𝑟𝑚 𝑇𝑦𝑝𝑒 𝐴 𝑆𝑡𝑟𝑢𝑐𝑡𝑢𝑟𝑎𝑙 𝐴𝑑𝑣𝑎𝑛𝑡𝑎𝑔𝑒
⏟ 𝐶𝑜𝑚𝑝𝑜𝑛𝑒𝑛𝑡 2: 𝑆𝑡𝑟𝑢𝑐𝑡𝑢𝑟𝑒 𝐸𝑓𝑓𝑒𝑐𝑡
(Eq. 6)
where 𝛽0,𝐹𝐴, 𝛽0,𝐹𝐵, 𝛽0∗ , 𝛽𝑘,𝐹𝐴, 𝛽𝑘,𝐹𝐵, 𝛽𝑘
∗ (𝑘 = 1,… ,𝐾) are the intercept and slope coefficients of each
covariate included in the regressions of firm type A, firm type B and pooled samples.
Eq. (6) shows the aggregate decomposition. The first component is the endowment effect, the
second component is the structure effect – the firm type B structure advantage and the type A
structure advantage.
4 The informal sector in Mozambique
Informal firms are smaller, younger, mostly in retail and are more likely to be owned by women
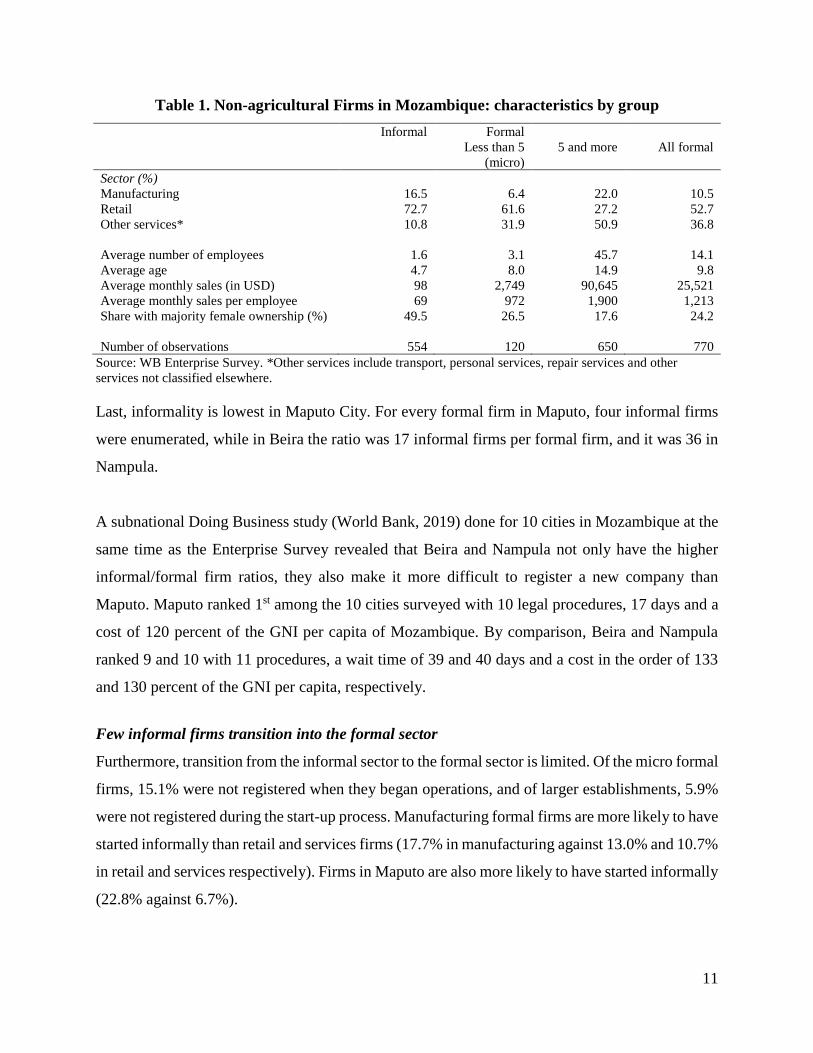
Table 1 describes the informal and formal firms present in Mozambique in 2018. The vast amount
of informal enterprises in Mozambique are small retail firms. An estimated 72% of informal firms
are in retail, against 52% of formal enterprises. Other common industries are other manufacturing
(7.4%), personal service activities (6.1%) and food manufacturing (4.8%).
Informal firms are on average smaller than formal firms. The average size of an informal enterprise
is 1.6 employee, while the average size of a formal enterprise is 14.1. For the retail sector, the most
common informal enterprise, the average size is 1.5, against an average size of 5.6 of formal firms
in the retail sector. About 62% of informal firms only have one person engaged, and practically no
informal firm (0.1%) has more than five employees.
Informal firms are on average younger than formal firms. Their average age is 4.7 years, against
8.0 years for micro formal enterprises (fewer than five employees) and 14.9 years for larger formal
enterprises (five or more employees).
Informal firms are also more likely to be owned by women. Almost half (49.5%) of informal firms
are majority-owned by women, while less than a quarter (24.2%) of formal firms have a majority
ownership by women. Retail informal firms are more likely to be majority-owned by women (52%,
against 45% for manufacturing and 38% for services).
11
Table 1. Non-agricultural Firms in Mozambique: characteristics by group
Informal Formal
Less than 5
(micro)
5 and more All formal
Sector (%)
Manufacturing 16.5 6.4 22.0 10.5
Retail 72.7 61.6 27.2 52.7
Other services* 10.8 31.9 50.9 36.8
Average number of employees 1.6 3.1 45.7 14.1
Average age 4.7 8.0 14.9 9.8
Average monthly sales (in USD) 98 2,749 90,645 25,521
Average monthly sales per employee 69 972 1,900 1,213
Share with majority female ownership (%) 49.5 26.5 17.6 24.2
Number of observations 554 120 650 770
Source: WB Enterprise Survey. *Other services include transport, personal services, repair services and other
services not classified elsewhere.
Last, informality is lowest in Maputo City. For every formal firm in Maputo, four informal firms
were enumerated, while in Beira the ratio was 17 informal firms per formal firm, and it was 36 in
Nampula.
A subnational Doing Business study (World Bank, 2019) done for 10 cities in Mozambique at the
same time as the Enterprise Survey revealed that Beira and Nampula not only have the higher
informal/formal firm ratios, they also make it more difficult to register a new company than
Maputo. Maputo ranked 1st among the 10 cities surveyed with 10 legal procedures, 17 days and a
cost of 120 percent of the GNI per capita of Mozambique. By comparison, Beira and Nampula
ranked 9 and 10 with 11 procedures, a wait time of 39 and 40 days and a cost in the order of 133
and 130 percent of the GNI per capita, respectively.
Few informal firms transition into the formal sector
Furthermore, transition from the informal sector to the formal sector is limited. Of the micro formal
firms, 15.1% were not registered when they began operations, and of larger establishments, 5.9%
were not registered during the start-up process. Manufacturing formal firms are more likely to have
started informally than retail and services firms (17.7% in manufacturing against 13.0% and 10.7%
in retail and services respectively). Firms in Maputo are also more likely to have started informally
(22.8% against 6.7%).
12
Very few informal firms are currently considering or have considered transitioning to the formal
sector. About 9.0% of informal firms considered registering the business in the last three years,
and only 5.5% of informal firms took steps to register their business in that period. About a tenth
(10.6%) of informal firms would currently be interested.
Table 2. Reasons for not registering
All informal firms Informal firms with a high resemblance to
formal enterprises
Reasons for not
registering
Percentage
answering “yes”
Percentage
selecting as main
reason
Percentage
answering “yes”
Percentage
selecting as main
reason
Time, fees and
paperwork
33.4 26.1 50.4 68.7
Taxation 27.5 10.9 42.2 2.9
Inspections 13.6 1.4 24.4 4.3
Bribes 12.9 1.8 22.2 0.0
No benefit for business 45.3 33.5 22.3 14.6
Lack of information 43.0 18.6 37.2 8.7 Source: WB Enterprise Survey.
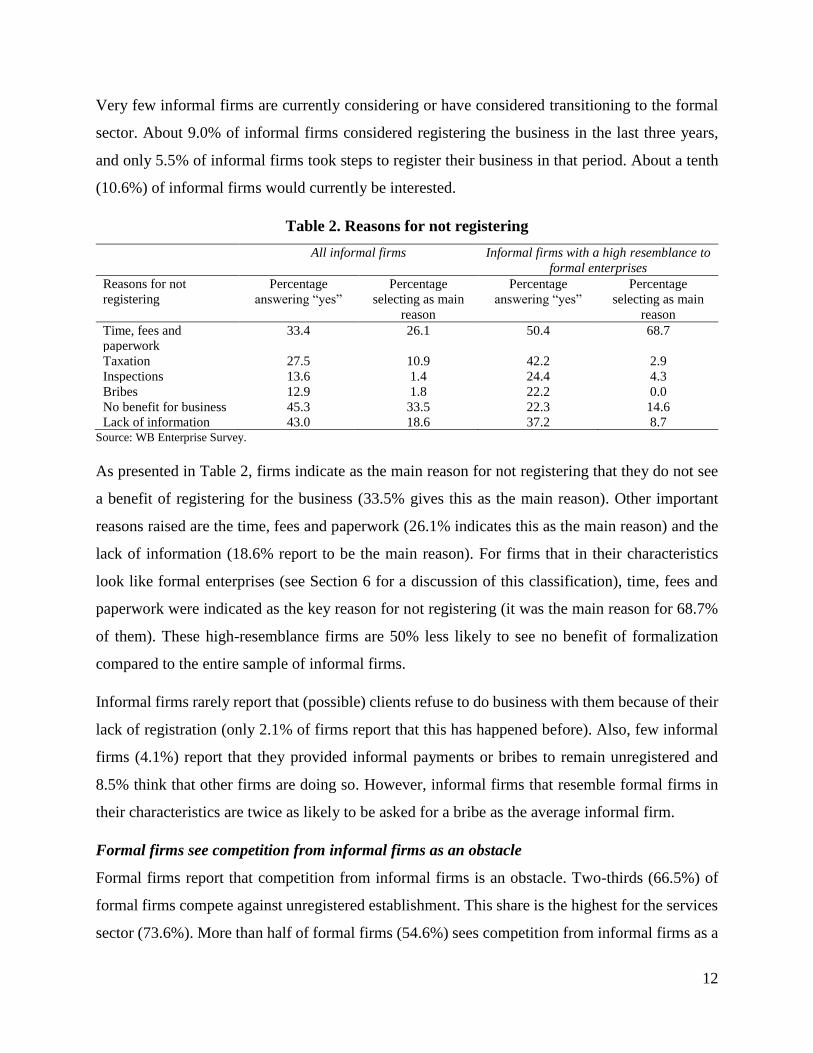
As presented in Table 2, firms indicate as the main reason for not registering that they do not see
a benefit of registering for the business (33.5% gives this as the main reason). Other important
reasons raised are the time, fees and paperwork (26.1% indicates this as the main reason) and the
lack of information (18.6% report to be the main reason). For firms that in their characteristics
look like formal enterprises (see Section 6 for a discussion of this classification), time, fees and
paperwork were indicated as the key reason for not registering (it was the main reason for 68.7%
of them). These high-resemblance firms are 50% less likely to see no benefit of formalization
compared to the entire sample of informal firms.
Informal firms rarely report that (possible) clients refuse to do business with them because of their
lack of registration (only 2.1% of firms report that this has happened before). Also, few informal
firms (4.1%) report that they provided informal payments or bribes to remain unregistered and
8.5% think that other firms are doing so. However, informal firms that resemble formal firms in
their characteristics are twice as likely to be asked for a bribe as the average informal firm.
Formal firms see competition from informal firms as an obstacle
Formal firms report that competition from informal firms is an obstacle. Two-thirds (66.5%) of
formal firms compete against unregistered establishment. This share is the highest for the services
sector (73.6%). More than half of formal firms (54.6%) sees competition from informal firms as a
13
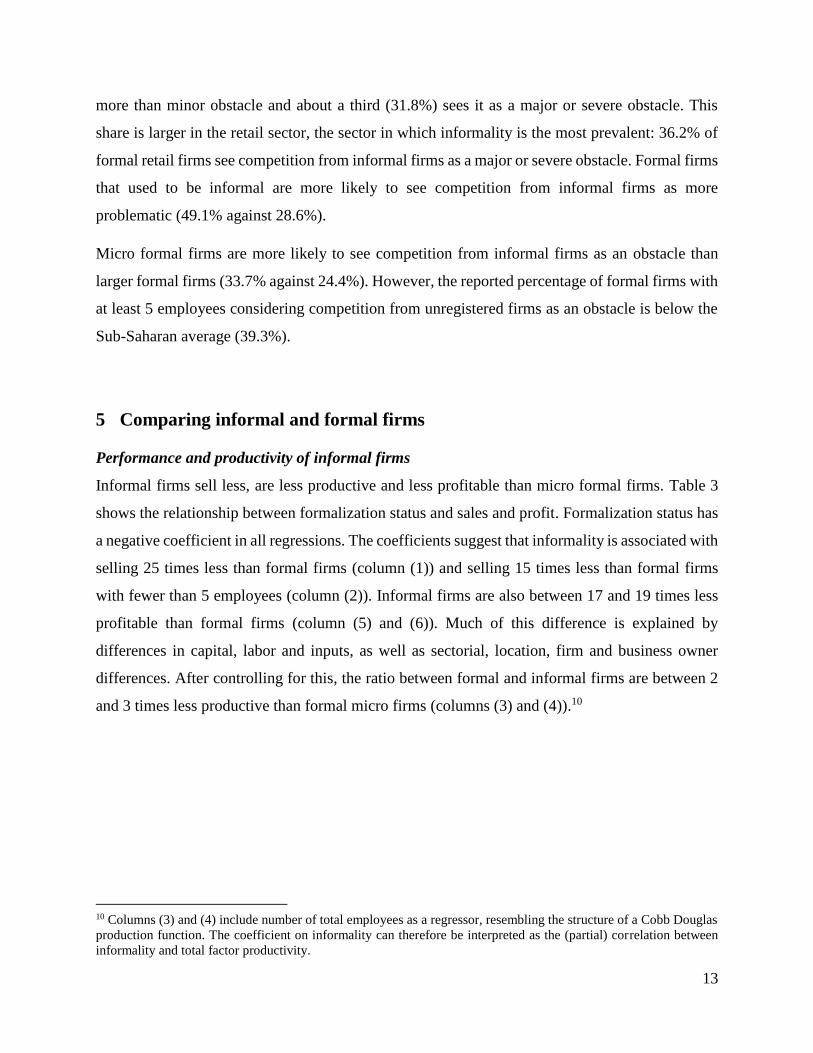
more than minor obstacle and about a third (31.8%) sees it as a major or severe obstacle. This
share is larger in the retail sector, the sector in which informality is the most prevalent: 36.2% of
formal retail firms see competition from informal firms as a major or severe obstacle. Formal firms
that used to be informal are more likely to see competition from informal firms as more
problematic (49.1% against 28.6%).
Micro formal firms are more likely to see competition from informal firms as an obstacle than
larger formal firms (33.7% against 24.4%). However, the reported percentage of formal firms with
at least 5 employees considering competition from unregistered firms as an obstacle is below the
Sub-Saharan average (39.3%).
5 Comparing informal and formal firms
Performance and productivity of informal firms
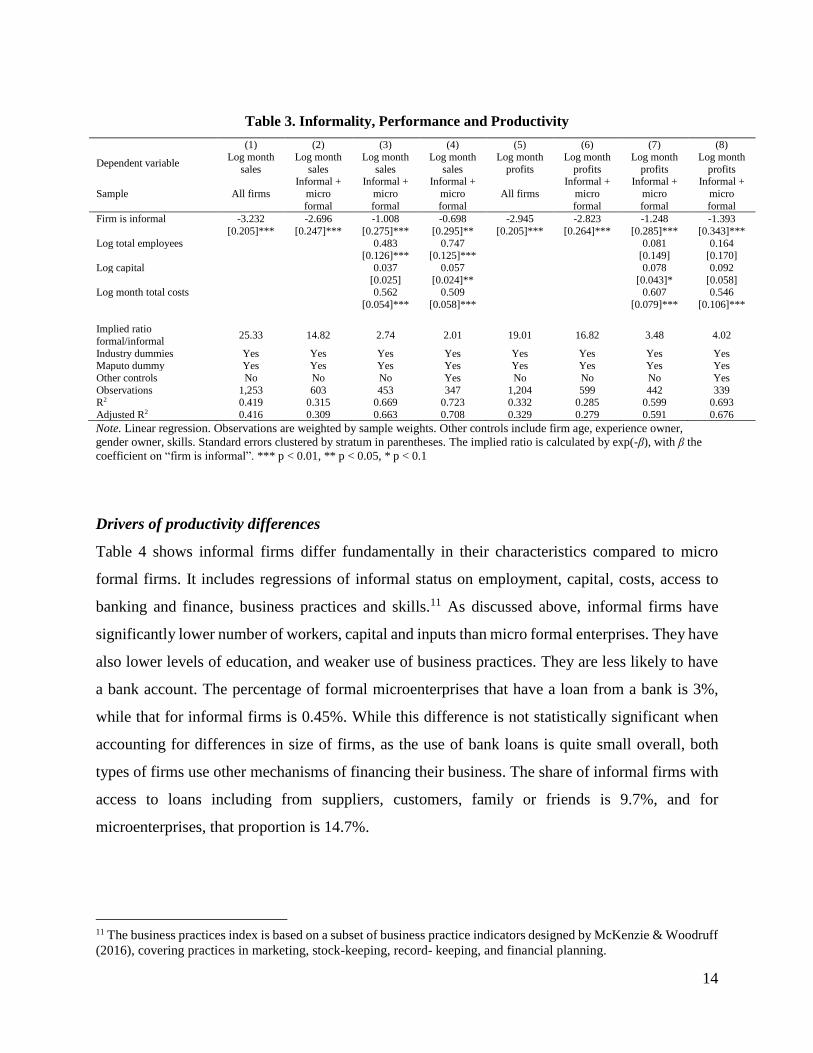
Informal firms sell less, are less productive and less profitable than micro formal firms. Table 3
shows the relationship between formalization status and sales and profit. Formalization status has
a negative coefficient in all regressions. The coefficients suggest that informality is associated with
selling 25 times less than formal firms (column (1)) and selling 15 times less than formal firms
with fewer than 5 employees (column (2)). Informal firms are also between 17 and 19 times less
profitable than formal firms (column (5) and (6)). Much of this difference is explained by
differences in capital, labor and inputs, as well as sectorial, location, firm and business owner
differences. After controlling for this, the ratio between formal and informal firms are between 2
and 3 times less productive than formal micro firms (columns (3) and (4)).10
10 Columns (3) and (4) include number of total employees as a regressor, resembling the structure of a Cobb Douglas
production function. The coefficient on informality can therefore be interpreted as the (partial) correlation between
informality and total factor productivity.
14
Table 3. Informality, Performance and Productivity
(1) (2) (3) (4) (5) (6) (7) (8)
Dependent variable Log month
sales
Log month
sales
Log month
sales
Log month
sales
Log month
profits
Log month
profits
Log month
profits
Log month
profits
Sample All firms
Informal +
micro
formal
Informal +
micro
formal
Informal +
micro
formal
All firms
Informal +
micro
formal
Informal +
micro
formal
Informal +
micro
formal
Firm is informal -3.232 -2.696 -1.008 -0.698 -2.945 -2.823 -1.248 -1.393
[0.205]*** [0.247]*** [0.275]*** [0.295]** [0.205]*** [0.264]*** [0.285]*** [0.343]***
Log total employees 0.483 0.747 0.081 0.164 [0.126]*** [0.125]*** [0.149] [0.170]
Log capital 0.037 0.057 0.078 0.092
[0.025] [0.024]** [0.043]* [0.058] Log month total costs 0.562 0.509 0.607 0.546
[0.054]*** [0.058]*** [0.079]*** [0.106]***
Implied ratio
formal/informal 25.33 14.82 2.74 2.01 19.01 16.82 3.48 4.02
Industry dummies Yes Yes Yes Yes Yes Yes Yes Yes Maputo dummy Yes Yes Yes Yes Yes Yes Yes Yes
Other controls No No No Yes No No No Yes
Observations 1,253 603 453 347 1,204 599 442 339 R2 0.419 0.315 0.669 0.723 0.332 0.285 0.599 0.693
Adjusted R2 0.416 0.309 0.663 0.708 0.329 0.279 0.591 0.676
Note. Linear regression. Observations are weighted by sample weights. Other controls include firm age, experience owner,
gender owner, skills. Standard errors clustered by stratum in parentheses. The implied ratio is calculated by exp(-β), with β the
coefficient on “firm is informal”. *** p < 0.01, ** p < 0.05, * p < 0.1
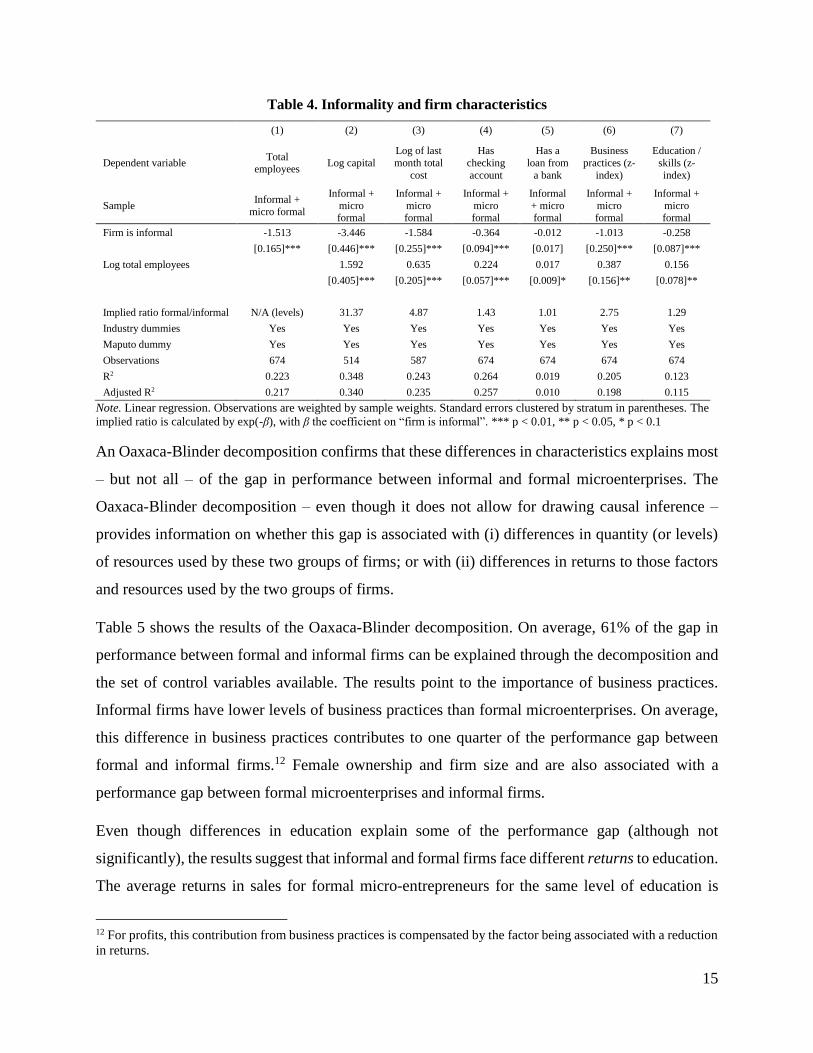
Drivers of productivity differences
Table 4 shows informal firms differ fundamentally in their characteristics compared to micro
formal firms. It includes regressions of informal status on employment, capital, costs, access to
banking and finance, business practices and skills.11 As discussed above, informal firms have
significantly lower number of workers, capital and inputs than micro formal enterprises. They have
also lower levels of education, and weaker use of business practices. They are less likely to have
a bank account. The percentage of formal microenterprises that have a loan from a bank is 3%,
while that for informal firms is 0.45%. While this difference is not statistically significant when
accounting for differences in size of firms, as the use of bank loans is quite small overall, both
types of firms use other mechanisms of financing their business. The share of informal firms with
access to loans including from suppliers, customers, family or friends is 9.7%, and for
microenterprises, that proportion is 14.7%.
11 The business practices index is based on a subset of business practice indicators designed by McKenzie & Woodruff
(2016), covering practices in marketing, stock-keeping, record- keeping, and financial planning.
15
Table 4. Informality and firm characteristics
(1) (2) (3) (4) (5) (6) (7)
Dependent variable Total
employees Log capital
Log of last
month total
cost
Has
checking
account
Has a
loan from
a bank
Business
practices (z-
index)
Education /
skills (z-
index)
Sample Informal +
micro formal
Informal +
micro formal
Informal +
micro formal
Informal +
micro formal
Informal
+ micro formal
Informal +
micro formal
Informal +
micro formal
Firm is informal -1.513 -3.446 -1.584 -0.364 -0.012 -1.013 -0.258
[0.165]*** [0.446]*** [0.255]*** [0.094]*** [0.017] [0.250]*** [0.087]***
Log total employees 1.592 0.635 0.224 0.017 0.387 0.156
[0.405]*** [0.205]*** [0.057]*** [0.009]* [0.156]** [0.078]**
Implied ratio formal/informal N/A (levels) 31.37 4.87 1.43 1.01 2.75 1.29
Industry dummies Yes Yes Yes Yes Yes Yes Yes
Maputo dummy Yes Yes Yes Yes Yes Yes Yes
Observations 674 514 587 674 674 674 674
R2 0.223 0.348 0.243 0.264 0.019 0.205 0.123
Adjusted R2 0.217 0.340 0.235 0.257 0.010 0.198 0.115
Note. Linear regression. Observations are weighted by sample weights. Standard errors clustered by stratum in parentheses. The
implied ratio is calculated by exp(-β), with β the coefficient on “firm is informal”. *** p < 0.01, ** p < 0.05, * p < 0.1
An Oaxaca-Blinder decomposition confirms that these differences in characteristics explains most
– but not all – of the gap in performance between informal and formal microenterprises. The
Oaxaca-Blinder decomposition – even though it does not allow for drawing causal inference –
provides information on whether this gap is associated with (i) differences in quantity (or levels)
of resources used by these two groups of firms; or with (ii) differences in returns to those factors
and resources used by the two groups of firms.
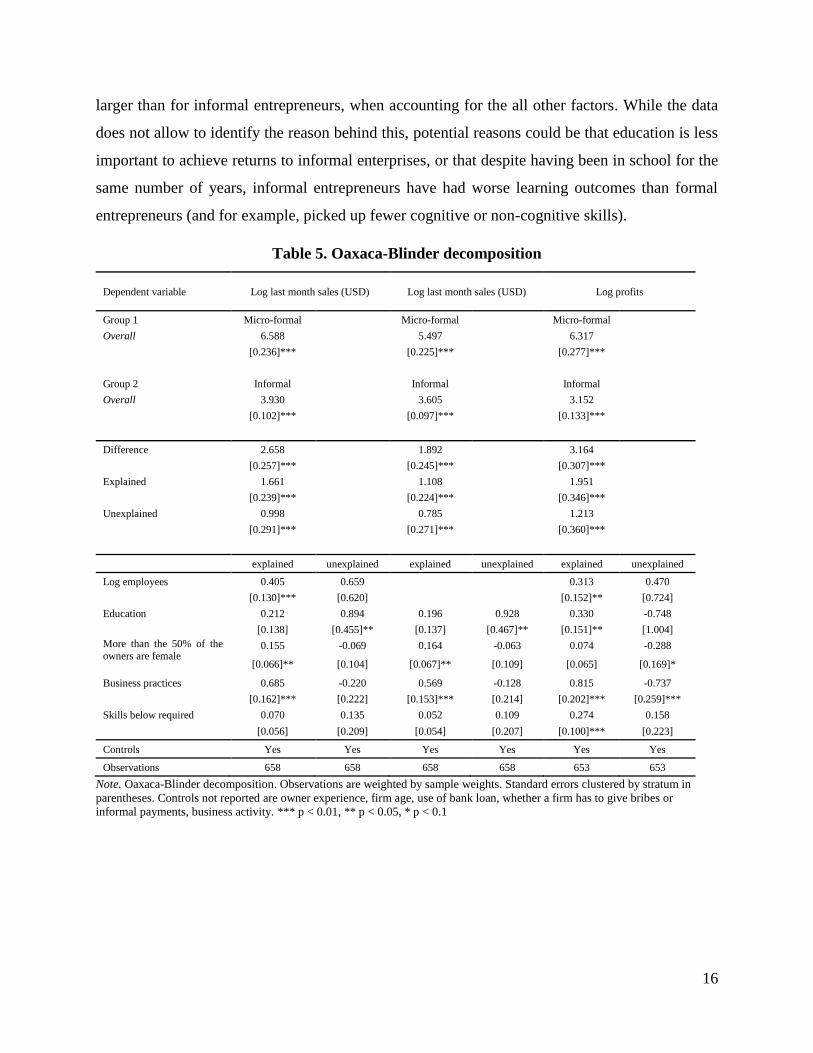
Table 5 shows the results of the Oaxaca-Blinder decomposition. On average, 61% of the gap in
performance between formal and informal firms can be explained through the decomposition and
the set of control variables available. The results point to the importance of business practices.
Informal firms have lower levels of business practices than formal microenterprises. On average,
this difference in business practices contributes to one quarter of the performance gap between
formal and informal firms.12 Female ownership and firm size and are also associated with a
performance gap between formal microenterprises and informal firms.
Even though differences in education explain some of the performance gap (although not
significantly), the results suggest that informal and formal firms face different returns to education.
The average returns in sales for formal micro-entrepreneurs for the same level of education is
12 For profits, this contribution from business practices is compensated by the factor being associated with a reduction
in returns.
16
larger than for informal entrepreneurs, when accounting for the all other factors. While the data
does not allow to identify the reason behind this, potential reasons could be that education is less
important to achieve returns to informal enterprises, or that despite having been in school for the
same number of years, informal entrepreneurs have had worse learning outcomes than formal
entrepreneurs (and for example, picked up fewer cognitive or non-cognitive skills).
Table 5. Oaxaca-Blinder decomposition
Dependent variable Log last month sales (USD) Log last month sales (USD) Log profits
Group 1 Micro-formal Micro-formal Micro-formal
Overall 6.588 5.497 6.317
[0.236]*** [0.225]*** [0.277]***
Group 2 Informal Informal Informal
Overall 3.930 3.605 3.152
[0.102]*** [0.097]*** [0.133]***
Difference 2.658 1.892 3.164
[0.257]*** [0.245]*** [0.307]***
Explained 1.661 1.108 1.951
[0.239]*** [0.224]*** [0.346]***
Unexplained 0.998 0.785 1.213
[0.291]*** [0.271]*** [0.360]***
explained unexplained explained unexplained explained unexplained
Log employees 0.405 0.659 0.313 0.470
[0.130]*** [0.620] [0.152]** [0.724]
Education 0.212 0.894 0.196 0.928 0.330 -0.748
[0.138] [0.455]** [0.137] [0.467]** [0.151]** [1.004]
More than the 50% of the
owners are female
0.155 -0.069 0.164 -0.063 0.074 -0.288
[0.066]** [0.104] [0.067]** [0.109] [0.065] [0.169]*
Business practices 0.685 -0.220 0.569 -0.128 0.815 -0.737
[0.162]*** [0.222] [0.153]*** [0.214] [0.202]*** [0.259]***
Skills below required 0.070 0.135 0.052 0.109 0.274 0.158
[0.056] [0.209] [0.054] [0.207] [0.100]*** [0.223]
Controls Yes Yes Yes Yes Yes Yes
Observations 658 658 658 658 653 653
Note. Oaxaca-Blinder decomposition. Observations are weighted by sample weights. Standard errors clustered by stratum in
parentheses. Controls not reported are owner experience, firm age, use of bank loan, whether a firm has to give bribes or
informal payments, business activity. *** p < 0.01, ** p < 0.05, * p < 0.1
17
6 Promising informal firms? High-resemblance and high-performing
informal firms
Even though as a group informal firms are smaller and less productive and differ significantly in
their characteristics from formal enterprises, we can identify groups of informal enterprises that
are have the potential to formalize one day. We identify two main groups: (1) “high-performance”
firms, which are producing on par with formal microenterprises, and (2) “high-resemblance” firms,
firms that in their characteristics are similar to formal firms.
High-performance informal firms
Even though the average informal firm is 14 times less productive than the average micro formal
firm and the median informal firm is six times less productive than the median formal firm, there
is a small group of informal firms that produces on par with formal firms.
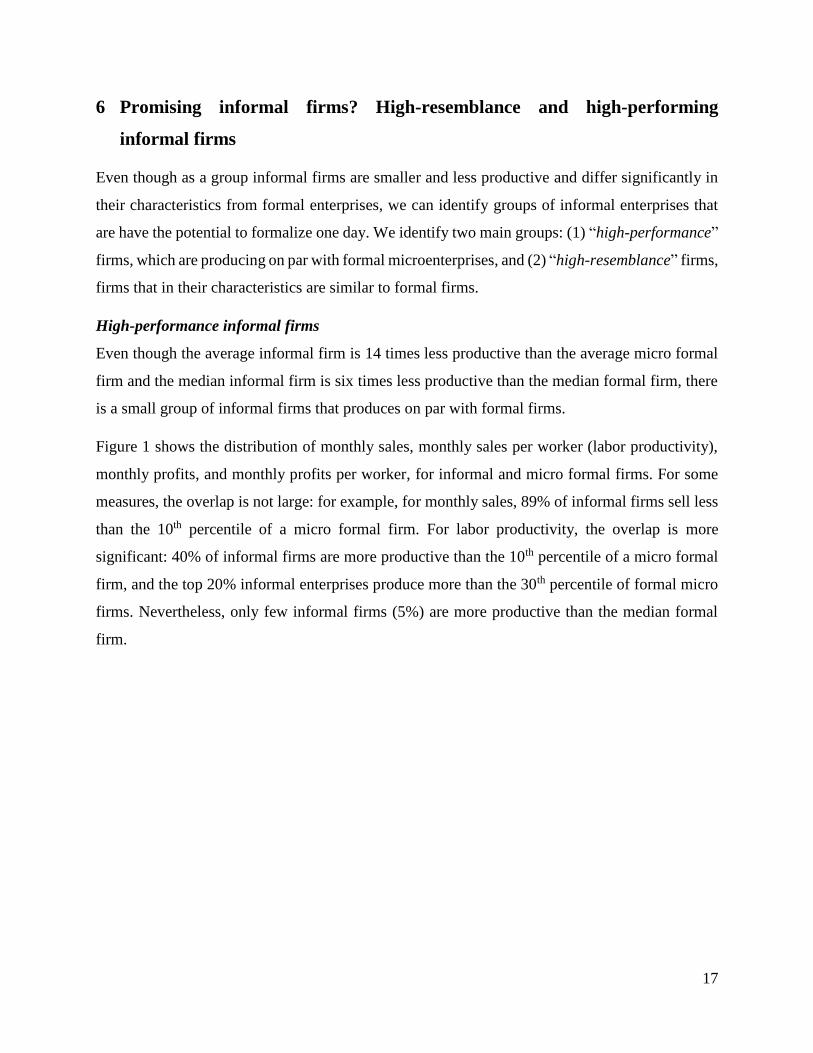
Figure 1 shows the distribution of monthly sales, monthly sales per worker (labor productivity),
monthly profits, and monthly profits per worker, for informal and micro formal firms. For some
measures, the overlap is not large: for example, for monthly sales, 89% of informal firms sell less
than the 10th percentile of a micro formal firm. For labor productivity, the overlap is more
significant: 40% of informal firms are more productive than the 10th percentile of a micro formal
firm, and the top 20% informal enterprises produce more than the 30th percentile of formal micro
firms. Nevertheless, only few informal firms (5%) are more productive than the median formal
firm.
18
Figure 1. Informal versus micro formal firms
(a) Monthly sales (b) Monthly sales per employee
(c) Profits (d) Profits per employee
Source: WB Enterprise Survey. Micro formal firms are registered firms with fewer than 5 employees.
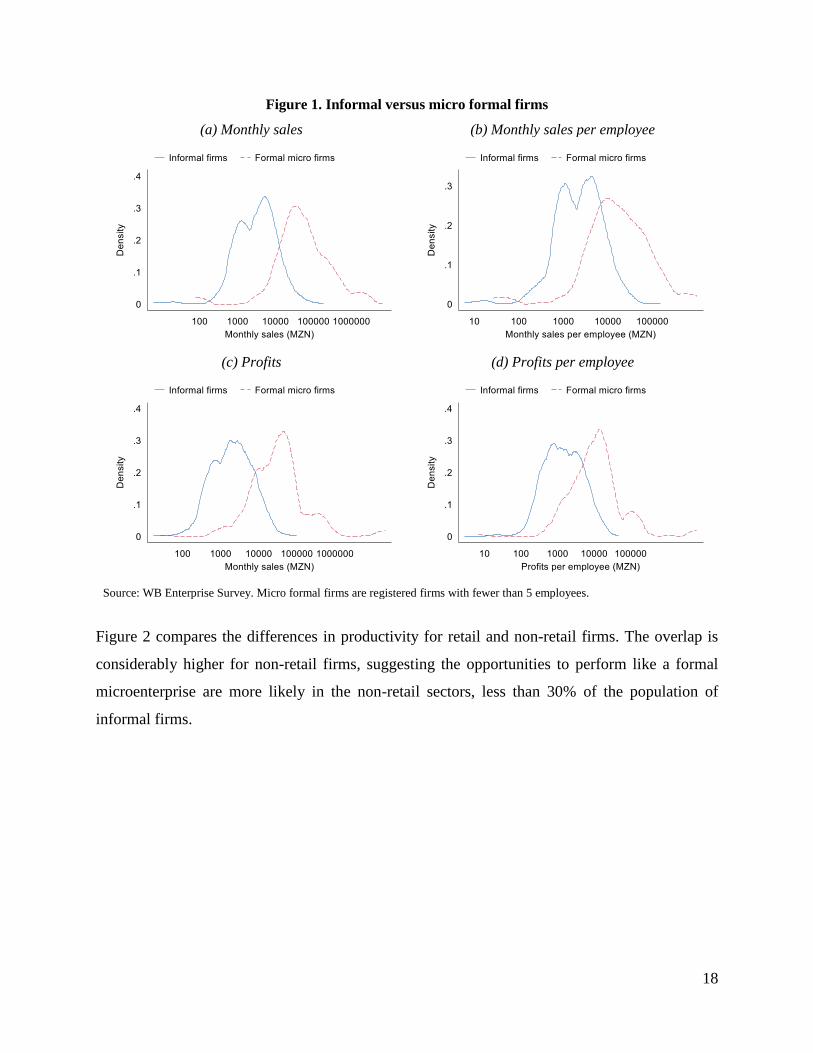
Figure 2 compares the differences in productivity for retail and non-retail firms. The overlap is
considerably higher for non-retail firms, suggesting the opportunities to perform like a formal
microenterprise are more likely in the non-retail sectors, less than 30% of the population of
informal firms.
19
Figure 2. Differences are larger in retail firms
(a) Monthly sales per employee – Retail (b) Monthly sales per employee – Non-retail
Source: WB Enterprise Survey. Micro formal firms are registered firms with fewer than 5 employees.
High-resemblance firms
A second approach to identify “promising” firms is to classify which informal firms based on
observable characteristics are looking more like a formal firm than an informal firm. These firms
we label as “high-resemblance” firms similar to what Diao et al. (2016) labelled “in-between”
firms. We use discriminant analysis (also known as species classification) to predict whether a
firm is formal or informal based on its characteristics.
The firms that are incorrectly classified by the algorithm give an idea of what share of informal
firms in their characteristics “look similar” to a formal firm. This was used first on firms by De
Mel, McKenzie & Woodruff (2010) to classify microentrepreneurs as being more likely to wage
workers or formal business owners and has since been used in several studies to classify firms or
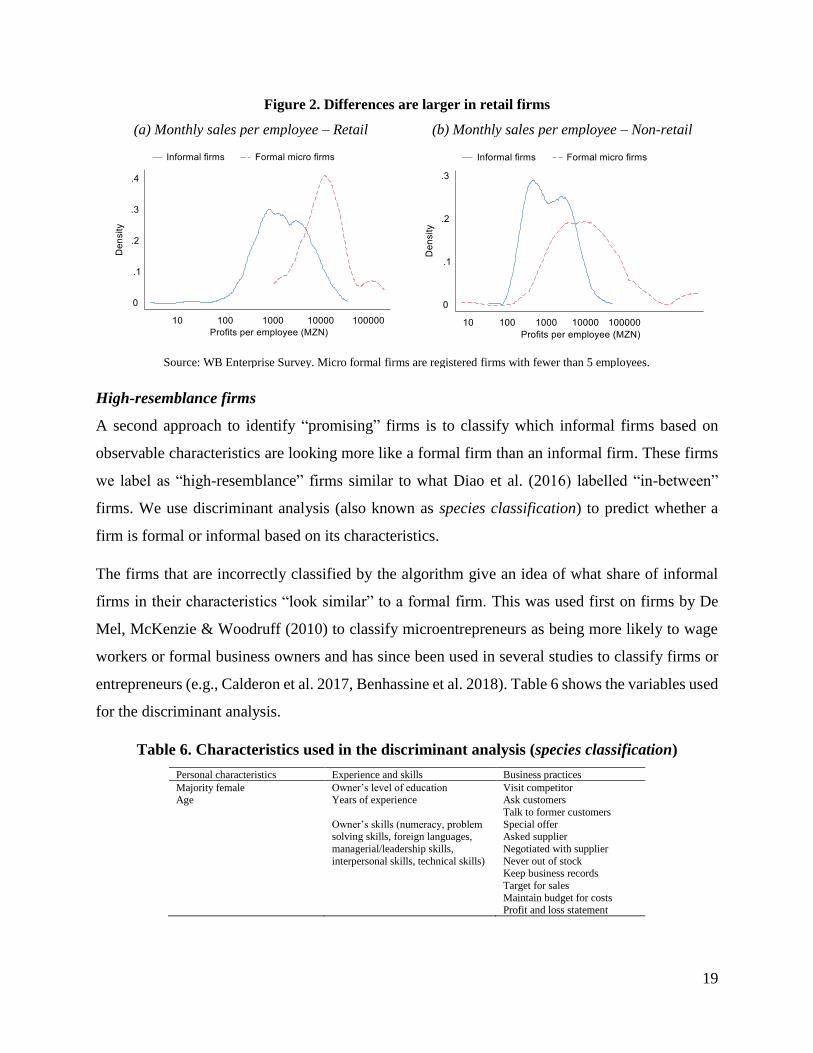
entrepreneurs (e.g., Calderon et al. 2017, Benhassine et al. 2018). Table 6 shows the variables used
for the discriminant analysis.
Table 6. Characteristics used in the discriminant analysis (species classification)
Personal characteristics Experience and skills Business practices
Majority female Age
Owner’s level of education Years of experience
Owner’s skills (numeracy, problem solving skills, foreign languages,
managerial/leadership skills,
interpersonal skills, technical skills)
Visit competitor Ask customers
Talk to former customers
Special offer Asked supplier
Negotiated with supplier
Never out of stock Keep business records
Target for sales
Maintain budget for costs Profit and loss statement
20
We use canonical linear discriminant analysis to identify firms that are “incorrectly” classified as
informal. We report through this process the share of “leave-one-out” misclassifications. The
“leave-one-out” misclassifications are determined by running the classification analysis on the
entire sample but one prediction, and then predict the formalization status for the left-out
observation. This is subsequently repeated for all observations, so that each observation is “left
out” once, to give a prediction of formalization status for each firm.13
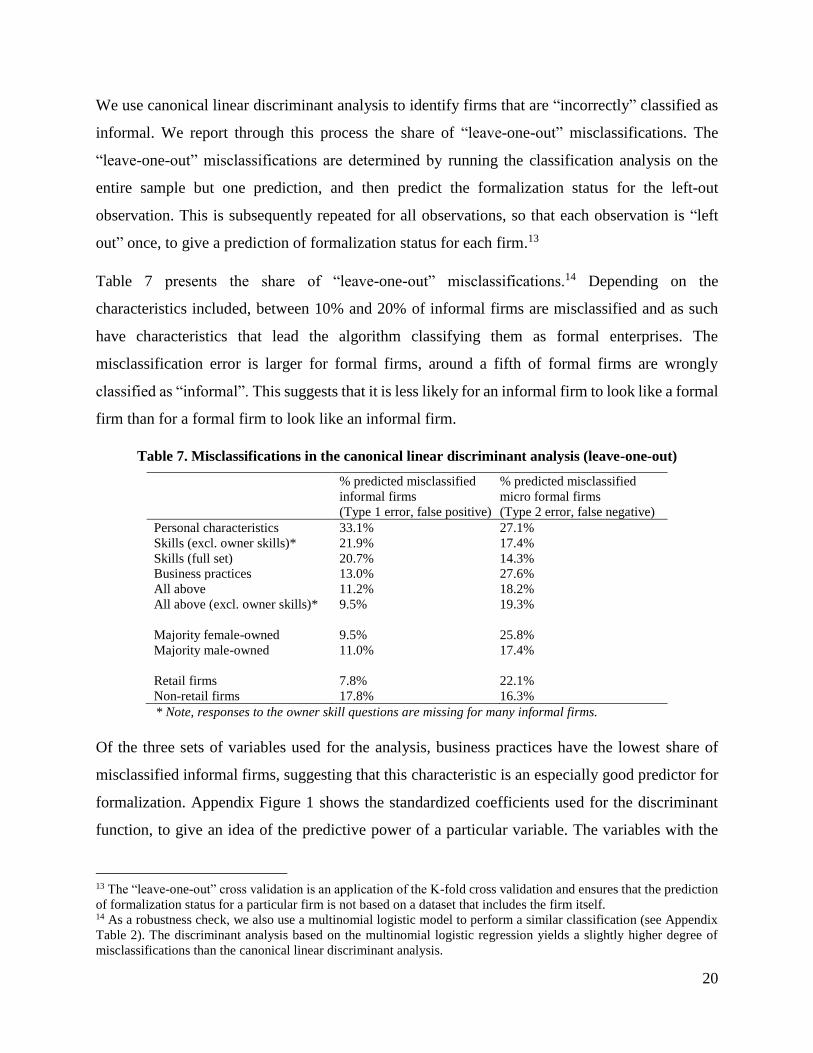
Table 7 presents the share of “leave-one-out” misclassifications.14 Depending on the
characteristics included, between 10% and 20% of informal firms are misclassified and as such
have characteristics that lead the algorithm classifying them as formal enterprises. The
misclassification error is larger for formal firms, around a fifth of formal firms are wrongly
classified as “informal”. This suggests that it is less likely for an informal firm to look like a formal
firm than for a formal firm to look like an informal firm.
Table 7. Misclassifications in the canonical linear discriminant analysis (leave-one-out)
% predicted misclassified
informal firms
(Type 1 error, false positive)
% predicted misclassified
micro formal firms
(Type 2 error, false negative)
Personal characteristics 33.1% 27.1%
Skills (excl. owner skills)* 21.9% 17.4%
Skills (full set) 20.7% 14.3%
Business practices 13.0% 27.6%
All above 11.2% 18.2%
All above (excl. owner skills)* 9.5% 19.3%
Majority female-owned 9.5% 25.8%
Majority male-owned 11.0% 17.4%
Retail firms 7.8% 22.1%
Non-retail firms 17.8% 16.3%
* Note, responses to the owner skill questions are missing for many informal firms.
Of the three sets of variables used for the analysis, business practices have the lowest share of
misclassified informal firms, suggesting that this characteristic is an especially good predictor for
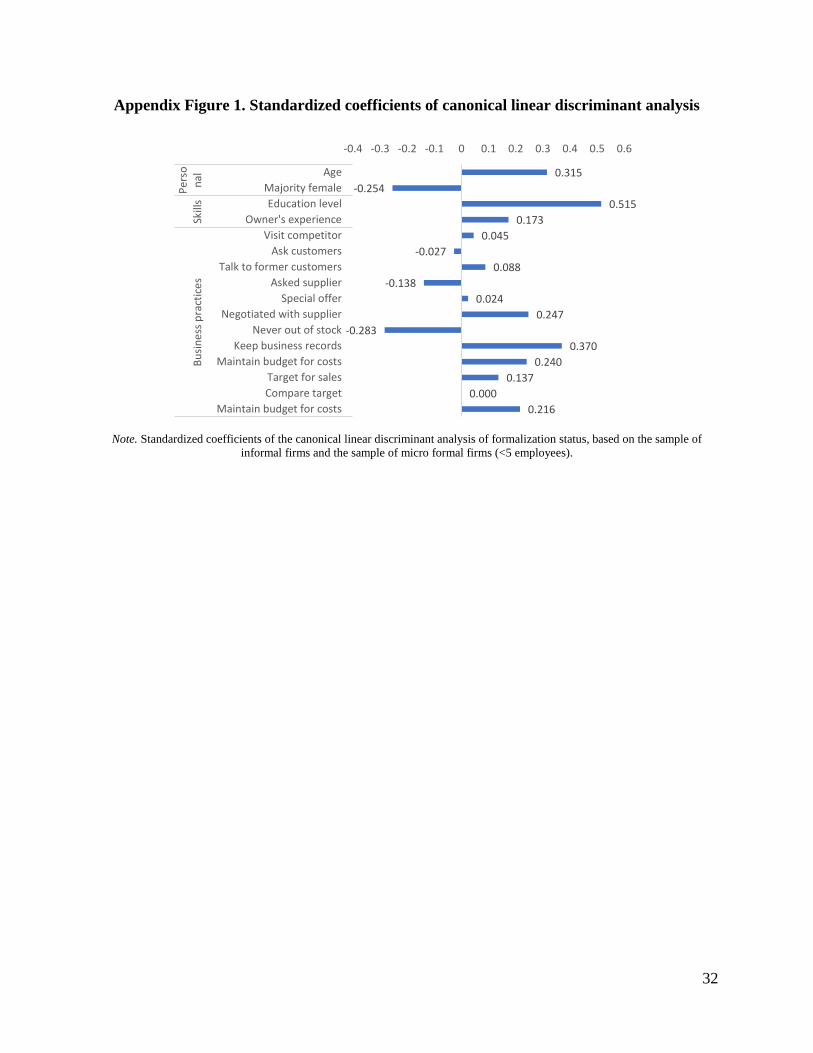
formalization. Appendix Figure 1 shows the standardized coefficients used for the discriminant
function, to give an idea of the predictive power of a particular variable. The variables with the
13 The “leave-one-out” cross validation is an application of the K-fold cross validation and ensures that the prediction
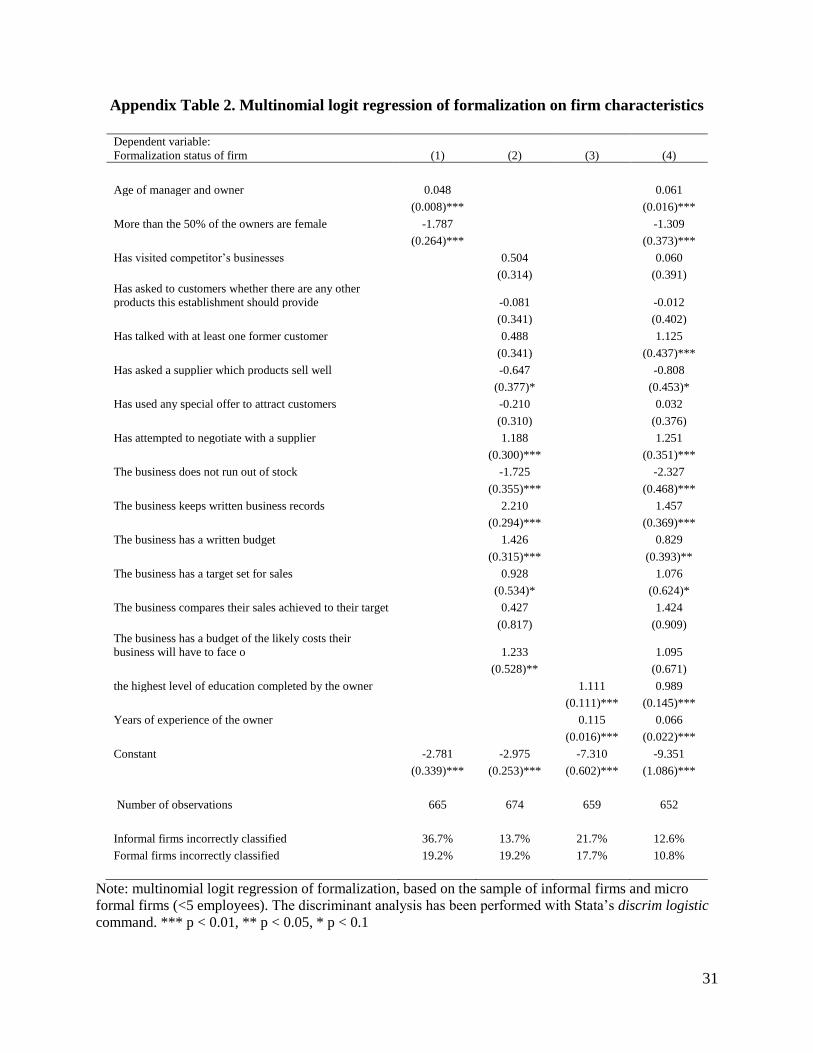
of formalization status for a particular firm is not based on a dataset that includes the firm itself. 14 As a robustness check, we also use a multinomial logistic model to perform a similar classification (see Appendix
Table 2). The discriminant analysis based on the multinomial logistic regression yields a slightly higher degree of
misclassifications than the canonical linear discriminant analysis.
21
largest positive coefficients are education level, whether a firm keeps business records, the age of
the manager or owner, whether a firm negotiated with a supplier and whether a budget for costs is
maintained. The largest negative coefficients are whether a firm has never run out of stock, whether
a firm is female majority-owned and whether a firm asked a supplier what would sell well.
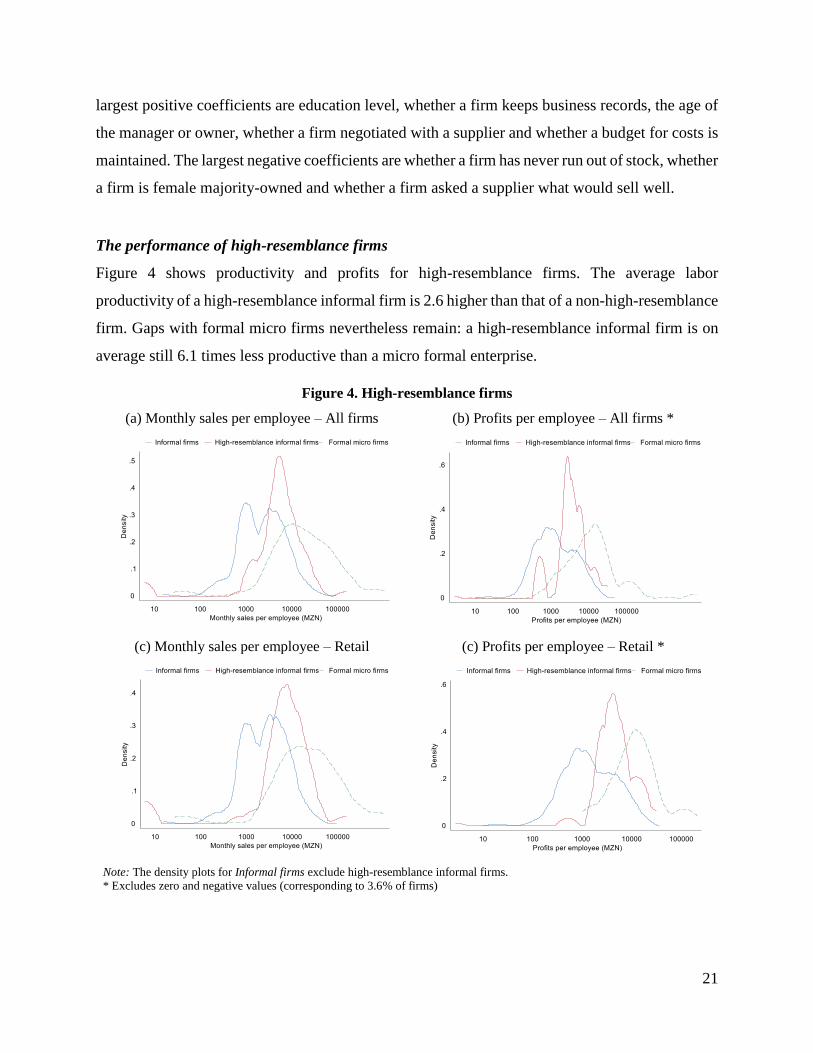
The performance of high-resemblance firms
Figure 4 shows productivity and profits for high-resemblance firms. The average labor
productivity of a high-resemblance informal firm is 2.6 higher than that of a non-high-resemblance
firm. Gaps with formal micro firms nevertheless remain: a high-resemblance informal firm is on
average still 6.1 times less productive than a micro formal enterprise.
Figure 4. High-resemblance firms
(a) Monthly sales per employee – All firms (b) Profits per employee – All firms *
(c) Monthly sales per employee – Retail (c) Profits per employee – Retail *
Note: The density plots for Informal firms exclude high-resemblance informal firms.
* Excludes zero and negative values (corresponding to 3.6% of firms)
22
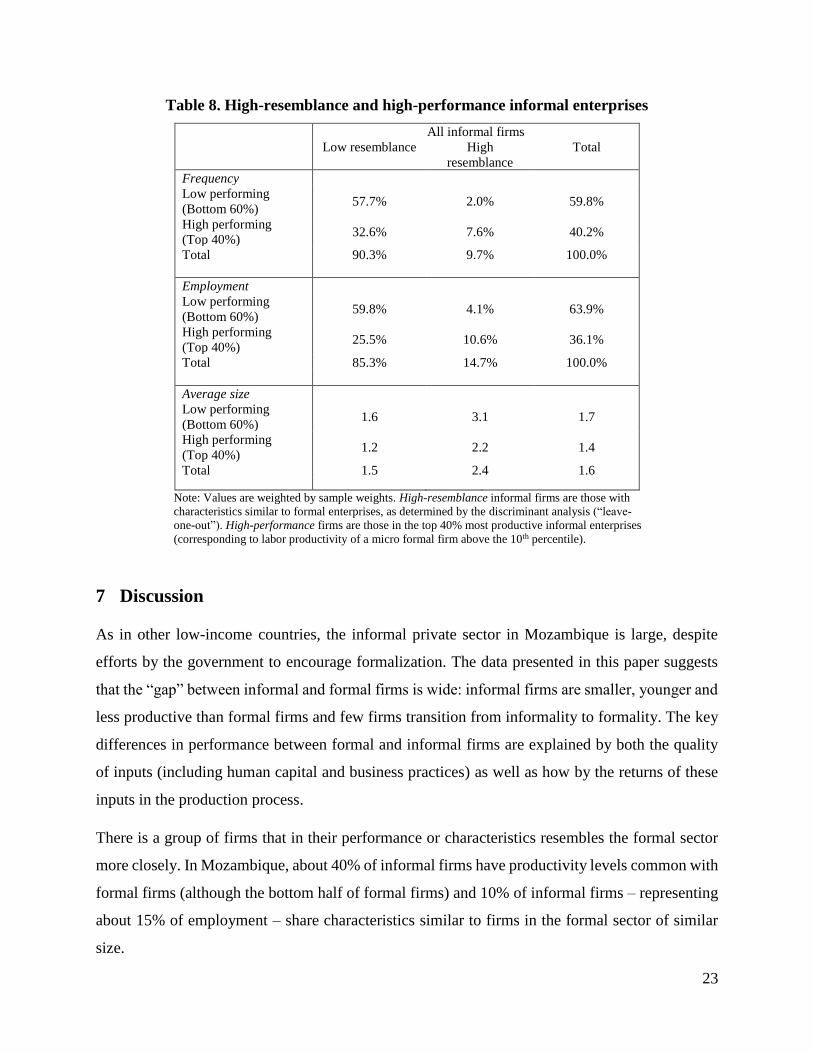
Table 8 classifies firms based on their high-resemblance and high-performance classification. The
high-resemblance classification is based on the discriminant analysis above. The high-
performance classification is based on whether a firm is in the top 40% of the labor productivity
distribution of informal enterprises, which corresponds to being above the 10th percentile of micro
formal enterprises. This results in four groups of firms:
• Low resemblance, low performing – low performance enterprises that do not “look like”
formal enterprises. This corresponds to the largest amount of the sample (57.7% of firms,
59.8% of employment in the informal sector).
• Low resemblance, high performing – High performance enterprises that do not “look like”
formal enterprises. This corresponds to about a third of firms (32.6%) and a quarter of
employment (25.5%).
• High resemblance, low performing – Low performance enterprises that in their
characteristics are similar to formal enterprises. This is the smallest group: 2.0% of firms
and 4.1% of employment.
• High resemblance, high performing - High performance enterprises that in their
characteristics are similar to formal enterprises. This corresponds to 7.6% of firms and a
10.6% of employment.
The share of the last group is the largest for non-retail enterprises: 14.3% of non-retail firms and
16.2% of employment in the non-retail informal sector is in a firm that is both high-resemblance
and high-performing.
23
Table 8. High-resemblance and high-performance informal enterprises
All informal firms
Low resemblance High
resemblance
Total
Frequency
Low performing
(Bottom 60%) 57.7% 2.0% 59.8%
High performing
(Top 40%) 32.6% 7.6% 40.2%
Total 90.3% 9.7% 100.0%
Employment
Low performing
(Bottom 60%) 59.8% 4.1% 63.9%
High performing
(Top 40%) 25.5% 10.6% 36.1%
Total 85.3% 14.7% 100.0%
Average size
Low performing
(Bottom 60%) 1.6 3.1 1.7
High performing
(Top 40%) 1.2 2.2 1.4
Total 1.5 2.4 1.6
Note: Values are weighted by sample weights. High-resemblance informal firms are those with
characteristics similar to formal enterprises, as determined by the discriminant analysis (“leave-
one-out”). High-performance firms are those in the top 40% most productive informal enterprises
(corresponding to labor productivity of a micro formal firm above the 10th percentile).
7 Discussion
As in other low-income countries, the informal private sector in Mozambique is large, despite
efforts by the government to encourage formalization. The data presented in this paper suggests
that the “gap” between informal and formal firms is wide: informal firms are smaller, younger and
less productive than formal firms and few firms transition from informality to formality. The key
differences in performance between formal and informal firms are explained by both the quality
of inputs (including human capital and business practices) as well as how by the returns of these
inputs in the production process.
There is a group of firms that in their performance or characteristics resembles the formal sector
more closely. In Mozambique, about 40% of informal firms have productivity levels common with
formal firms (although the bottom half of formal firms) and 10% of informal firms – representing
about 15% of employment – share characteristics similar to firms in the formal sector of similar
size.
24
This paper has several consequences for policy. The large differences in both inputs and outputs
between formal and informal enterprises suggest that informal firms might require different
targeting than formal enterprises. Policies that are designed to target formal enterprises, even small
ones, might be less effective for informal enterprises, who have lower levels of skills, human
capital and access to finance. Earlier studies of formalization have suggested that benefits from
formalization are very much concentrated on a small group of firms (e.g., De Mel et al. 2013) and
that high-resemblance firms are more likely to benefit from formalization (e.g., Benhassine et al.
2018).
25
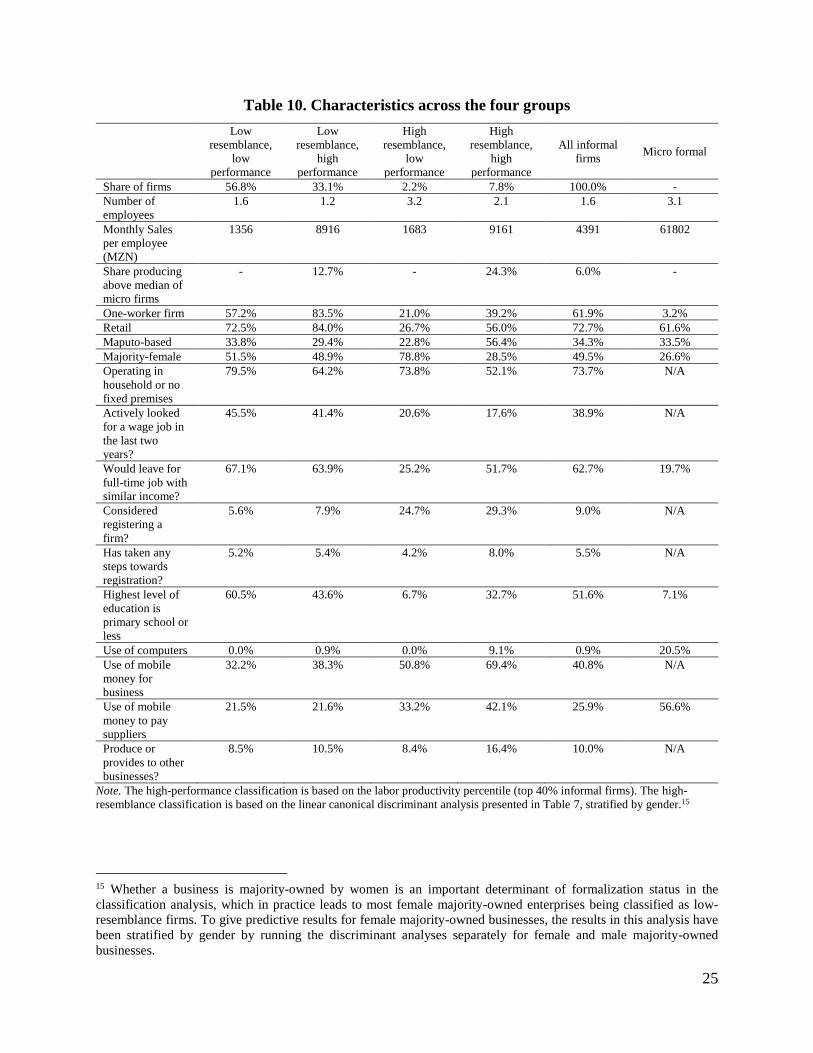
Table 10. Characteristics across the four groups
Low
resemblance,
low
performance
Low
resemblance,
high
performance
High
resemblance,
low
performance
High
resemblance,
high
performance
All informal
firms Micro formal
Share of firms 56.8% 33.1% 2.2% 7.8% 100.0% -
Number of
employees
1.6 1.2 3.2 2.1 1.6 3.1
Monthly Sales
per employee
(MZN)
1356 8916 1683 9161 4391 61802
Share producing
above median of
micro firms
- 12.7% - 24.3% 6.0% -
One-worker firm 57.2% 83.5% 21.0% 39.2% 61.9% 3.2%
Retail 72.5% 84.0% 26.7% 56.0% 72.7% 61.6%
Maputo-based 33.8% 29.4% 22.8% 56.4% 34.3% 33.5%
Majority-female 51.5% 48.9% 78.8% 28.5% 49.5% 26.6%
Operating in
household or no
fixed premises
79.5% 64.2% 73.8% 52.1% 73.7% N/A
Actively looked
for a wage job in
the last two
years?
45.5% 41.4% 20.6% 17.6% 38.9% N/A
Would leave for
full-time job with
similar income?
67.1% 63.9% 25.2% 51.7% 62.7% 19.7%
Considered
registering a
firm?
5.6% 7.9% 24.7% 29.3% 9.0% N/A
Has taken any
steps towards
registration?
5.2% 5.4% 4.2% 8.0% 5.5% N/A
Highest level of
education is
primary school or
less
60.5% 43.6% 6.7% 32.7% 51.6% 7.1%
Use of computers 0.0% 0.9% 0.0% 9.1% 0.9% 20.5%
Use of mobile
money for
business
32.2% 38.3% 50.8% 69.4% 40.8% N/A
Use of mobile
money to pay
suppliers
21.5% 21.6% 33.2% 42.1% 25.9% 56.6%
Produce or
provides to other
businesses?
8.5% 10.5% 8.4% 16.4% 10.0% N/A
Note. The high-performance classification is based on the labor productivity percentile (top 40% informal firms). The high-
resemblance classification is based on the linear canonical discriminant analysis presented in Table 7, stratified by gender.15
15 Whether a business is majority-owned by women is an important determinant of formalization status in the
classification analysis, which in practice leads to most female majority-owned enterprises being classified as low-
resemblance firms. To give predictive results for female majority-owned businesses, the results in this analysis have
been stratified by gender by running the discriminant analyses separately for female and male majority-owned
businesses.
26
The informal firms with low performance and a low resemblance to formal firms are far away from
the competitive frontier. This type of firms is likely to be a firm without employees, operating
without fixed premises or within the household and run by an entrepreneur with only limited levels
of education. For many of these entrepreneurs, the money earned from these business activities
provides an important and often primary source of income, but the low performance of these firms
also mean that the money earned is often low and potentially volatile. More than two-thirds
(67.1%) of the firm owners in this category indicate that they would prefer a wage job with a
similar wage but more stable income instead of running their own business. Given the lower
potential of these firms and low impact of entrepreneurship interventions on non-high-resemblance
firms (McKenzie & Woodruff 2014), these entrepreneurs might benefit more from policies that
facilitate transitions to wage employment (e.g. improving skills to increase employability) or
policies that offer social protection or support alternative options (e.g. programs to support
migration from rural to urban opportunities).
Informal firms with a low resemblance to formal firms but high performance represent about a
third of informal enterprises and 84 % of firms in this group are one-worker firms. Like firms in
the first group, the percentage of firm owners looking for a wage job is high (41%). However,
unlike as for the first group, this outlook does not seem to affect their performance negatively.
These firms are less likely to share characteristics or practices with formal microenterprises, but
nevertheless produce at similar levels as microenterprises, even though few (12.7%) produce more
than the median formal microenterprise. These firms could benefit from policies that target
upgrading of business practices (e.g. record-keeping, target-setting) or in specific setting to basic
skills that can support continuously expanding performance and make them embrace
entrepreneurship rather than looking of a wage job which might undermine their investment in
business (Koelle 2019).
Informal firms with a high resemblance to formal firms but low performance share characteristics
and practices with formally registered microenterprises. Among informal firms, they are the most
likely to have secondary and tertiary education, but nevertheless produce below par. This group is
likely to be female majority-owned (almost 80%), more so than any other group. The informal
firms with high resemblance and low performance are more likely to have employees besides the
owner, and less likely to be located in Maputo. The policy objective for these firms would be to
27
increase productivity. Based on the evidence in developing economies for this type of firms,
policies that likely benefit these firms are those that further improve the capabilities of these firms,
especially that go beyond very standard business practices. These policies may include developing
non-cognitive skills training (Campos et al. 2017) or rule of thumb approaches to improving
financial management (Drexler, Fischer and Schoar 2014). As the vast majority of these firms are
owned by women, policies that remove constraint to women-owned and -operated firms will likely
benefit this group.
Informal firms with a high resemblance to formal firms and high performance represent about 8
percent of informal firms. About a quarter of these firms produces above the median of
microenterprises. They are also significantly more likely to already use a computer, suggesting
space for digital opportunities.
These firms are most likely to benefit from policies that also benefit regular SMEs. Policies that
facilitate the access of these firms to markets, adopting better technologies, improve firm
capabilities through training or consulting are expected to benefit these firms. This group of firms
might also be the group of firms that is most likely to benefit from formalization, as was the case
in Benin (Benhassine et al. 2018). Compared to other informal enterprises, they are more likely
to see a benefit to formalization. In fact, almost a third (29.5%) considered registering their firms
in the last three years.16 High-resemblance firms are more likely to be concerned about time, fees
and paperwork than other informal firms (in fact, when prompted, two-thirds of high-resemblance
firms indicate this as the key reason why they do not formalize) and about taxation and inspections.
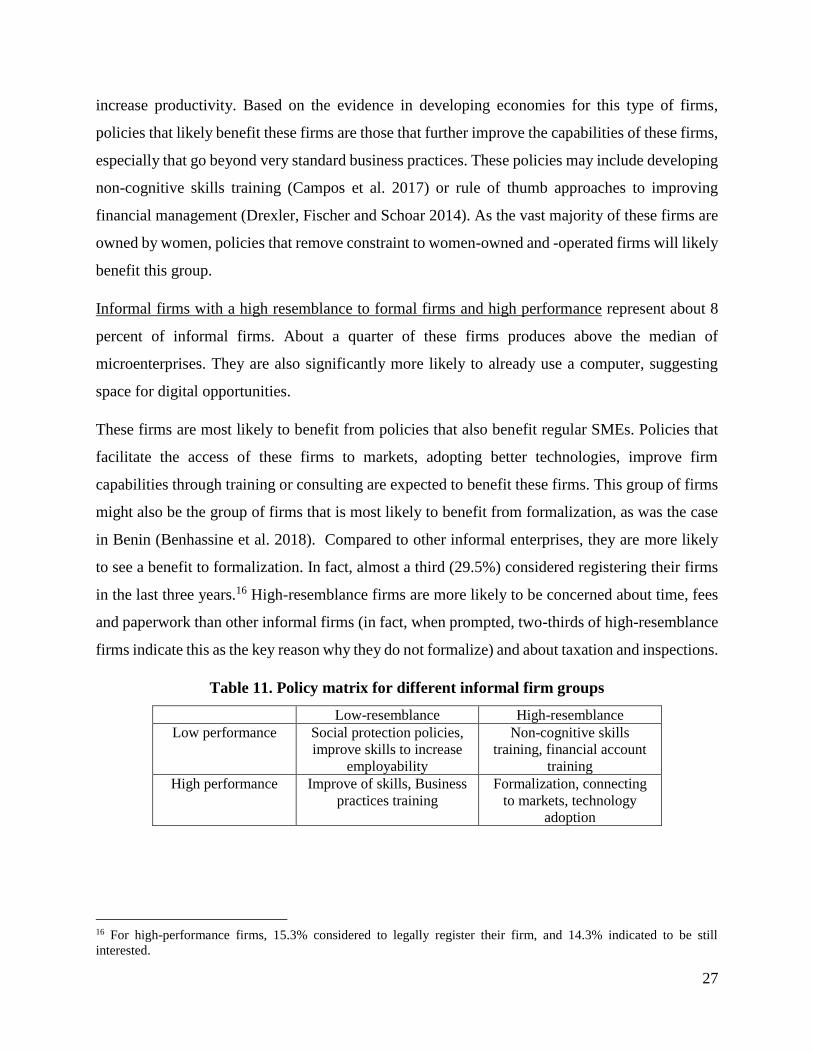
Table 11. Policy matrix for different informal firm groups
Low-resemblance High-resemblance
Low performance Social protection policies,
improve skills to increase
employability
Non-cognitive skills
training, financial account
training
High performance Improve of skills, Business
practices training
Formalization, connecting
to markets, technology
adoption
16 For high-performance firms, 15.3% considered to legally register their firm, and 14.3% indicated to be still
interested.
28
References
Acs, Z. (2006). How Is Entrepreneurship Good for Economic Growth?, Innovations, 97–107.
Andrade, G. H. De, Bruhn, M., & Mckenzie, D. (2014). A Helping Hand or the Long Arm of the
Law ? Experimental Evidence on What Governments Can Do to Formalize Firms, 24–54.
https://doi.org/10.1093/wber/lhu008
Benhassine, N., McKenzie, D., Pouliquen, V., & Santini, M. (2018). Does inducing informal firms
to formalize make sense? Experimental evidence from Benin. Journal of Public Economics,
157(February 2017), 1–14. https://doi.org/10.1016/j.jpubeco.2017.11.004
Berkel, H. (2018). The costs and benefits of formalization for firms. A mixed-methods study on
Mozambique. WIDER Working Paper, (159).
Bruhn, M. (2011). License to sell: the effect of business registration reform on entrepreneurial
activity in Mexico. The Review of Economics and Statistics, 93(1), 382–386.
Bruhn, M. (2013). A tale of two species: Revisiting the effect of registration reform on informal
business owners in Mexico. Journal of Development Economics, 103(1), 275–283.
https://doi.org/10.1016/j.jdeveco.2013.03.013
Bruhn, M., & McKenzie, D. (2014). Entry Regulation and the Formalization of Microenterprises
in Developing Countries. World Bank Research Observer, 29, 186–201.
https://doi.org/10.1093/wbro/lku002
Calderon, G., Iacovone, L., & Juarez, L. (2017). Opportunity versus necessity: Understanding the
heterogeneity of female micro-entrepreneurs. World Bank Economic Review, 30, S86–S96.
https://doi.org/10.1093/wber/lhw010
Campos, F., Goldstein, M., & McKenzie, D. (2018). How Should the Government Bring Small
Firms into the Formal System? World Bank Policy Research Working Paper, (8601).
Retrieved from http://www.worldbank.org/research.
de Mel, S., McKenzie, D., & Woodruff, C. (2010). Who Are the Microenterprise Owners?
Evidence from Sri Lanka on Tokman versus De Soto. In J. Lerner & A. Schoar (Eds.),
International Differences in Entrepreneurship (pp. 63–88). University Of Chicago Press.
https://doi.org/10.7208/chicago/9780226473109.003.0003
de Mel, S., McKenzie, D., & Woodruff, C. (2013). The demand for, and consequences of,
formalization among informal firms in Sri Lanka. American Economic Journal: Applied
Economics, 5(2), 122–150. https://doi.org/10.1257/app.5.2.122
De Soto, H. (1989). The Mystery of Capital.
29
Fischer, G., Schoar, A., & Drexler, A. (2014). Keeping it simple : Financial literacy and rules of
thumb. American Economic Journal: Applied Economics, 6(2), 1–31.
https://doi.org/10.1257/app.6.2.1
Fortin, N., Lemieux, T., & Firpo, S. (2011). Decomposition methods in economics. In Handbook
of Labor Economics. Elsevier, pages 1-102.
Kaplan, D. S., Piedra, E., & Seira, E. (2011). Entry regulation and business start-ups: Evidence
from Mexico. Journal of Public Economics, 95(11–12), 1501–1515.
https://doi.org/10.1016/j.jpubeco.2011.03.007
Koelle, M. (2019). Microenterprises and the Lure of Wage Work: Theory and Evidence from
Mexican Export Manufacturing. Working Paper.
Levy (2008). Good Intentions, Bad Outcomes: Social Policy, Informality and Economic Growth
in Mexico. Washington, DC: Brookings Institution Press.
Medina, L., & Schneider, F. (2018). Shadow Economies Around the World: What Did We Learn
Over the Last 20 Years? IMF WP/18/17.
McKenzie, D., & Woodruff, C. (2014). What are we learning from business training and
entrepreneurship evaluations around the developing world? World Bank Research Observer,
29(1), 48–82. https://doi.org/10.1093/wbro/lkt007
McKenzie, D., & Woodruff, C. (2016). Business Practices in Small Firms in Developing
Countries. Management Science, 63(9), 2967–2981.
https://doi.org/10.1287/mnsc.2016.2492
Mullainathan, S., & Schnabl, P. (2010). Does Less Market Entry Regulation Generate More
Entrepreneurs ? Evidence from a Regulatory Reform in Peru. In J. Lerner & A. Schoar (Eds.),
International Differences in Entrepreneurship (pp. 159–177). University Of Chicago Press.
https://doi.org/10.7208/chicago/9780226473109.003.0006
O’Sullivan, M., Rao, A., Banerjee, R., Gulati, K., & Vinez, M. (2014). Levelling the field:
improving opportunities for women farmers in Africa. World Bank Group / One Campaign.
Porta, R. La, & Shleifer, A. (2008). The Unofficial Economy and Economic Development.
Brookings Papers in Economic Activity (2008), 275–352
Porta, R. La, & Shleifer, A. (2014). Informality and Development. Journal of Economic
Perspectives, 28(3), 109–126.
Thompson, S. K. (1990). Adaptive cluster sampling. Journal of the American Statistical
Association, 85(412), 1050-1059.
World Bank (2019). Doing Business in Mozambique 2019. Washington, D.C.
30
Appendix Table 1: Sampling Distributions and number of firms enumerated
City Strata
Number of Starting
squares Enumerated
Total
number of
Squares
Enumerated
Total number
of informal
business units
found
Average number
of informal
business units
per square
Total Number
of long-form
interviews
completed
City of Beira
Low Probability of
Informality 73 91 210 2 16
Medium Probability of
Informality 35 93 649 6 63
High Probability of
Informality 19 74 766 10 77
Market Center 3 3 156 52 6
City of
Nampula
Low Probability of
Informality 68 118 867 7 32
Medium Probability of
Informality 28 102 1082 10 32
High Probability of
Informality 34 127 1525 12 46
Market Center 5 5 172 34 13
Maputo City
Low Probability of
Informality 61 178 1895 10 108
Medium Probability of
Informality 39 99 1318 13 73
High Probability of
Informality 22 85 1010 11 52
Market Center 7 7 1432 204 36
Total 394 982 11082 31 554
31
Appendix Table 2. Multinomial logit regression of formalization on firm characteristics
Dependent variable:
Formalization status of firm (1) (2) (3) (4)
Age of manager and owner 0.048 0.061
(0.008)*** (0.016)***
More than the 50% of the owners are female -1.787 -1.309
(0.264)*** (0.373)***
Has visited competitor’s businesses 0.504 0.060
(0.314) (0.391)
Has asked to customers whether there are any other
products this establishment should provide -0.081 -0.012
(0.341) (0.402)
Has talked with at least one former customer 0.488 1.125
(0.341) (0.437)***
Has asked a supplier which products sell well -0.647 -0.808
(0.377)* (0.453)*
Has used any special offer to attract customers -0.210 0.032
(0.310) (0.376)
Has attempted to negotiate with a supplier 1.188 1.251
(0.300)*** (0.351)***
The business does not run out of stock -1.725 -2.327
(0.355)*** (0.468)***
The business keeps written business records 2.210 1.457
(0.294)*** (0.369)***
The business has a written budget 1.426 0.829
(0.315)*** (0.393)**
The business has a target set for sales 0.928 1.076
(0.534)* (0.624)*
The business compares their sales achieved to their target 0.427 1.424
(0.817) (0.909)
The business has a budget of the likely costs their
business will have to face o 1.233 1.095
(0.528)** (0.671)
the highest level of education completed by the owner 1.111 0.989
(0.111)*** (0.145)***
Years of experience of the owner 0.115 0.066
(0.016)*** (0.022)***
Constant -2.781 -2.975 -7.310 -9.351
(0.339)*** (0.253)*** (0.602)*** (1.086)***
Number of observations 665 674 659 652
Informal firms incorrectly classified 36.7% 13.7% 21.7% 12.6%
Formal firms incorrectly classified 19.2% 19.2% 17.7% 10.8%
Note: multinomial logit regression of formalization, based on the sample of informal firms and micro
formal firms (<5 employees). The discriminant analysis has been performed with Stata’s discrim logistic
command. *** p < 0.01, ** p < 0.05, * p < 0.1
32
Appendix Figure 1. Standardized coefficients of canonical linear discriminant analysis
Note. Standardized coefficients of the canonical linear discriminant analysis of formalization status, based on the sample of
informal firms and the sample of micro formal firms (<5 employees).
0.315
-0.254
0.515
0.173
0.045
-0.027
0.088
-0.138
0.024
0.247
-0.283
0.370
0.240
0.137
0.000
0.216
-0.4 -0.3 -0.2 -0.1 0 0.1 0.2 0.3 0.4 0.5 0.6
Age
Majority female
Education level
Owner's experience
Visit competitor
Ask customers
Talk to former customers
Asked supplier
Special offer
Negotiated with supplier
Never out of stock
Keep business records
Maintain budget for costs
Target for sales
Compare target
Maintain budget for costs
Per
son
alSk
ills
Bu
sin
ess
pra
ctic
es
33
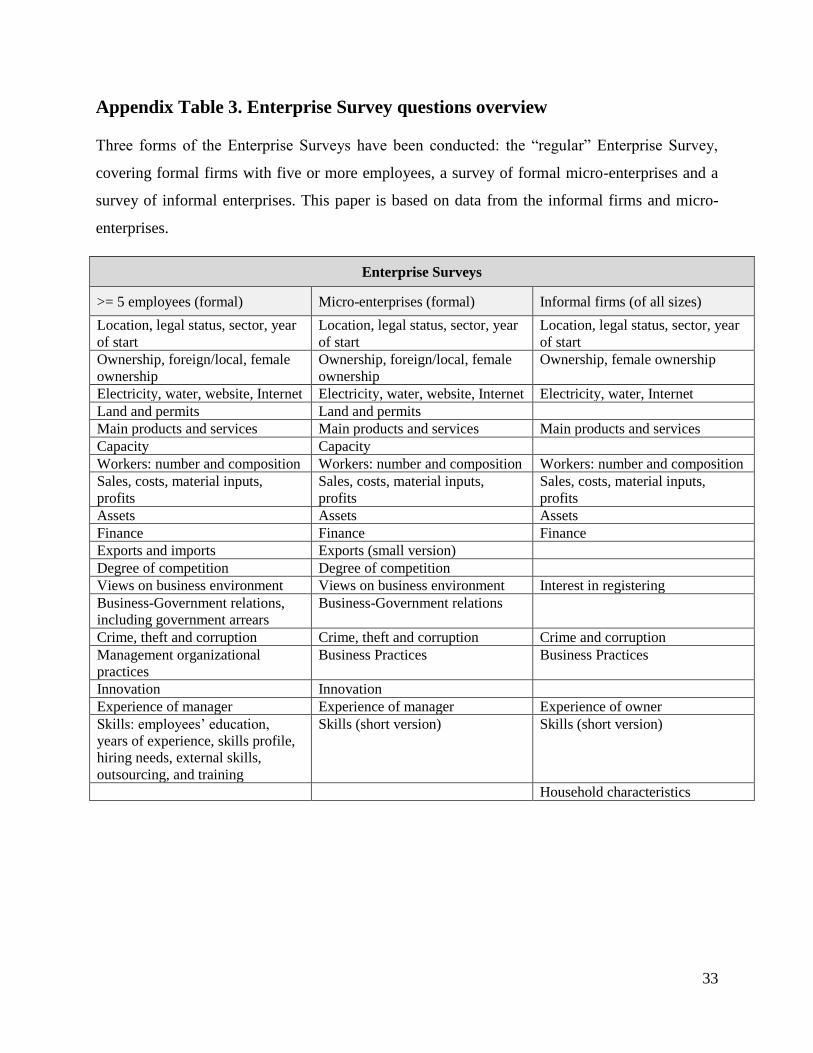
Appendix Table 3. Enterprise Survey questions overview
Three forms of the Enterprise Surveys have been conducted: the “regular” Enterprise Survey,
covering formal firms with five or more employees, a survey of formal micro-enterprises and a
survey of informal enterprises. This paper is based on data from the informal firms and micro-
enterprises.
Enterprise Surveys
>= 5 employees (formal) Micro-enterprises (formal) Informal firms (of all sizes)
Location, legal status, sector, year
of start
Location, legal status, sector, year
of start
Location, legal status, sector, year
of start
Ownership, foreign/local, female
ownership
Ownership, foreign/local, female
ownership
Ownership, female ownership
Electricity, water, website, Internet Electricity, water, website, Internet Electricity, water, Internet
Land and permits Land and permits
Main products and services Main products and services Main products and services
Capacity Capacity
Workers: number and composition Workers: number and composition Workers: number and composition
Sales, costs, material inputs,
profits
Sales, costs, material inputs,
profits
Sales, costs, material inputs,
profits
Assets Assets Assets
Finance Finance Finance
Exports and imports Exports (small version)
Degree of competition Degree of competition
Views on business environment Views on business environment Interest in registering
Business-Government relations,
including government arrears
Business-Government relations
Crime, theft and corruption Crime, theft and corruption Crime and corruption
Management organizational
practices
Business Practices Business Practices
Innovation Innovation
Experience of manager Experience of manager Experience of owner
Skills: employees’ education,
years of experience, skills profile,
hiring needs, external skills,
outsourcing, and training
Skills (short version) Skills (short version)
Household characteristics