Embed Size (px)
Citation preview

Innovation and productivity in formal and informal firms in Ghana
Xiaolan Fu Pierre Mohnen Giacomo Zanello
Oxford University Maastricht University
Reading University
OECD Blue Sky III conference, Ghent, 2016

Research questions
• How do formal and informal firms differ in terms of innovation?
• What is the effect of innovation on productivity, and does it differ between formal and informal firms?
Work supported by the ESRC/DIFID grant “The diffusion of innovation in low-income countries”.
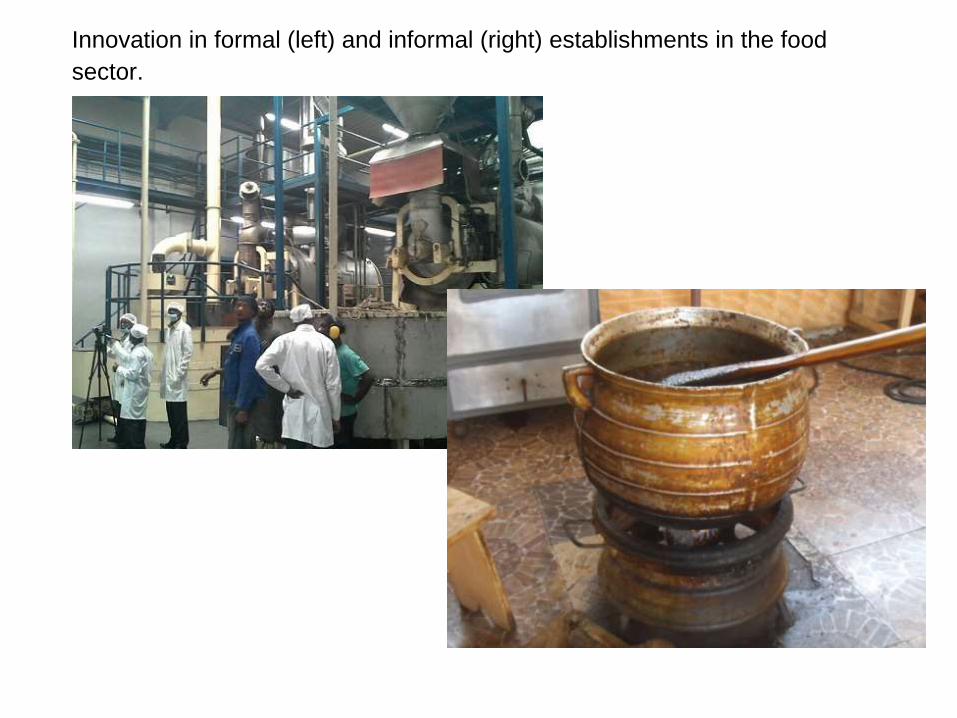
Innovation in formal (left) and informal (right) establishments in the food
sector.
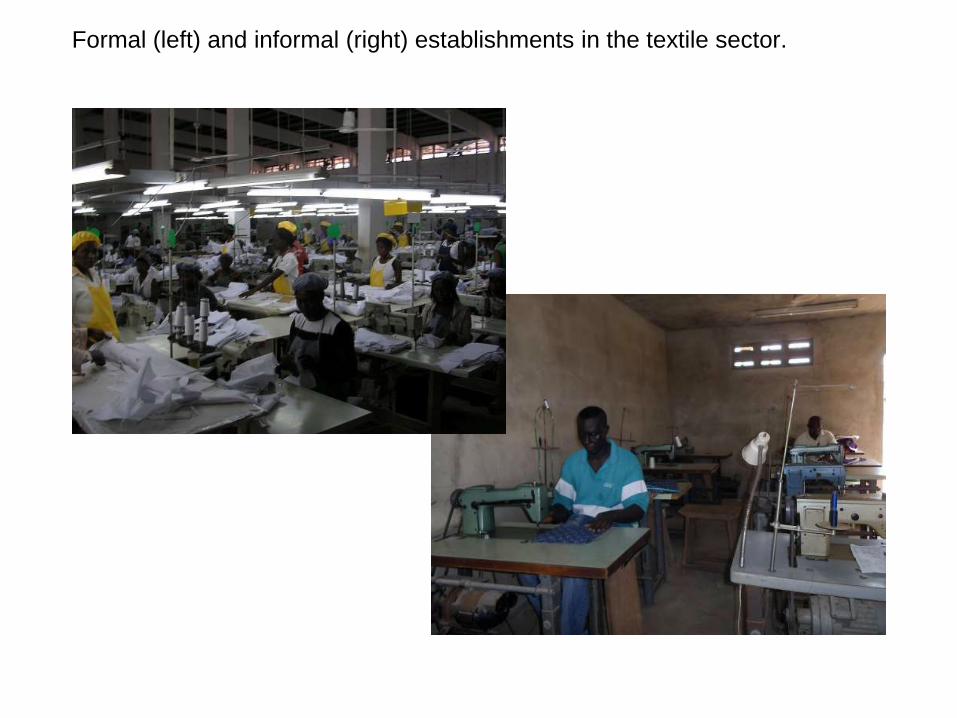
Formal (left) and informal (right) establishments in the textile sector.
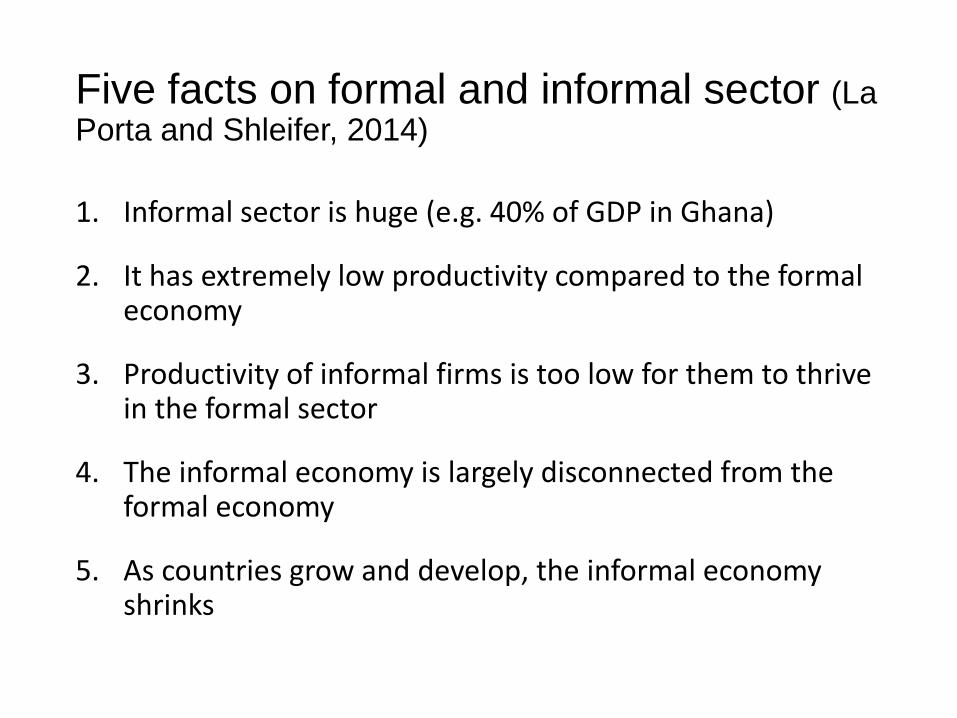
Five facts on formal and informal sector (La Porta and Shleifer, 2014)
1. Informal sector is huge (e.g. 40% of GDP in Ghana)
2. It has extremely low productivity compared to the formal economy
3. Productivity of informal firms is too low for them to thrive in the formal sector
4. The informal economy is largely disconnected from the formal economy
5. As countries grow and develop, the informal economy shrinks
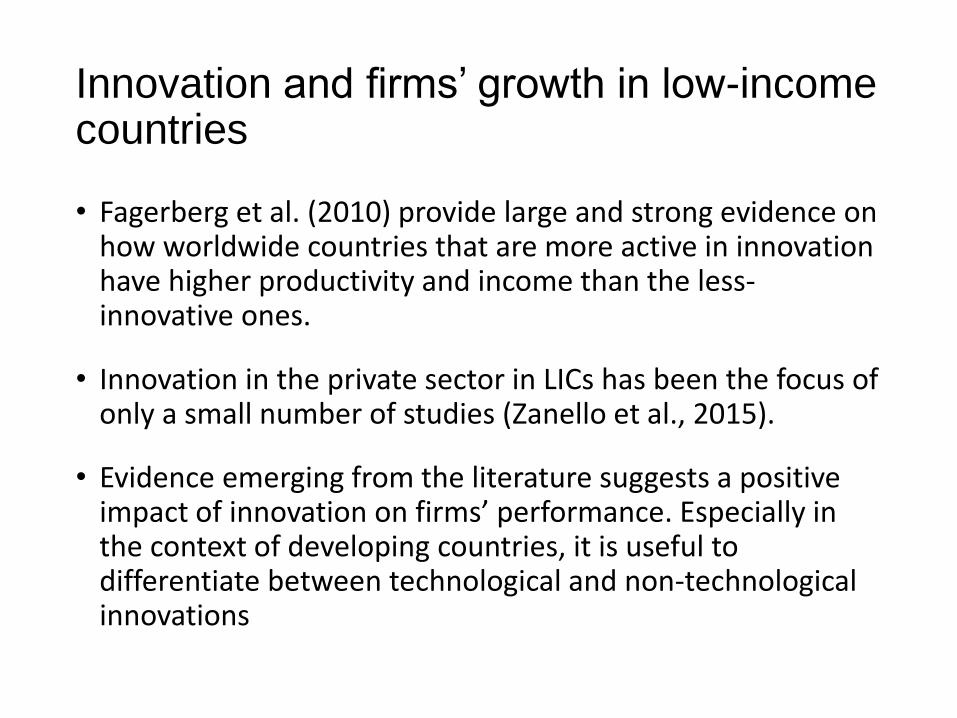
Innovation and firms’ growth in low-income countries
• Fagerberg et al. (2010) provide large and strong evidence on how worldwide countries that are more active in innovation have higher productivity and income than the less-innovative ones.
• Innovation in the private sector in LICs has been the focus of only a small number of studies (Zanello et al., 2015).
• Evidence emerging from the literature suggests a positive impact of innovation on firms’ performance. Especially in the context of developing countries, it is useful to differentiate between technological and non-technological innovations

Informality, innovation, and firms’ growth • There is increasing evidence that the cure for informality is
economic growth (La Porta and Shleifer, 2014), and therefore, innovation could play a key role in such transformation.
• Limited empirical evidence is available specifically on the role of innovation and firms’ growth in the informal sector of developing countries (De Mel, McKenzie and Woodruff 2009; Gebreeyesus, 2009; Gault, Charmes, Wunsch-Vincent, 2016).
• Importance of entrepreneurship (Donckels and Fröhlich, 1991, Prahalad, 2012, De Mel et al, 2009).

The dataset
• Cross-sectional survey on innovation activities undertaken in the period 2010 – 2013 (Fu et al., 2014)
• Nature and the sources of innovation • Mechanisms of diffusion of innovation• Foreign sources of knowledge and innovation• Objective and impact of innovation • Barriers to innovation
• 501 firms representative of Ghana
• Informal firms: random sample of 25 firms in 10 clusters spread in five regions. The choice of clusters and regions was determined to have a sector and geographical representation of the Ghanaian informal economy
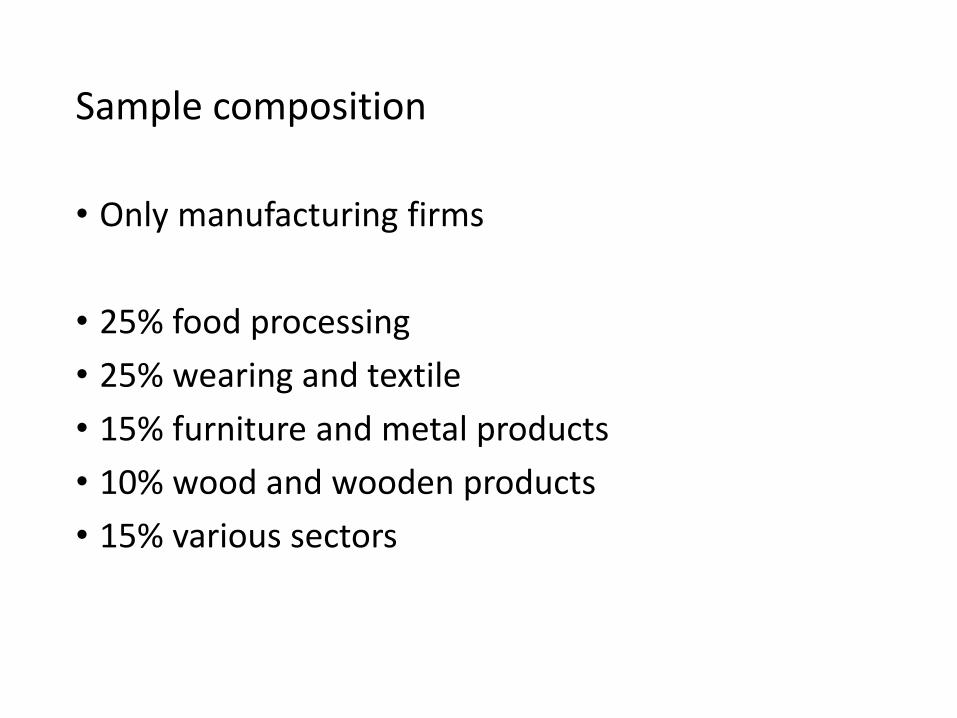
Sample composition
• Only manufacturing firms
• 25% food processing
• 25% wearing and textile
• 15% furniture and metal products
• 10% wood and wooden products
• 15% various sectors
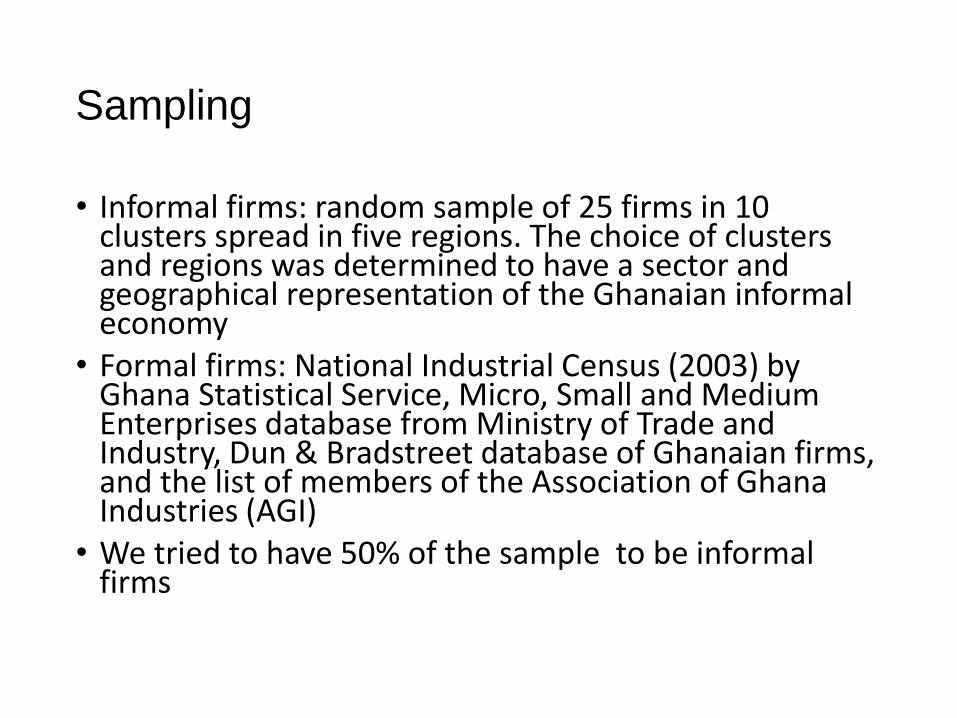
Sampling
• Informal firms: random sample of 25 firms in 10 clusters spread in five regions. The choice of clusters and regions was determined to have a sector and geographical representation of the Ghanaian informal economy
• Formal firms: National Industrial Census (2003) by Ghana Statistical Service, Micro, Small and Medium Enterprises database from Ministry of Trade and Industry, Dun & Bradstreet database of Ghanaian firms, and the list of members of the Association of Ghana Industries (AGI)
• We tried to have 50% of the sample to be informal firms

Measurement
• Firm’s productivity: Labour productivity {Log (Turnover [in 1,000 GHc] / Number of employees)}
• Nature of the firm• Self-reported nature of the firm asking the respondents “How do
you define the nature of the firm?” and providing a spectrum of options that included different degrees of formality (informal, semi-informal, semi-formal, formal). Cross-checked by enumerators’ visit of the firm’s premises and observing its activity.
• Entrepreneurship: a principal component analysis (PCA) on a series of questions that aim to capture the skills and attitude of the entrepreneurs (De Mel et al., 2009) and include the degree of optimism, pro-active attitude, curiosity, and tenacity.
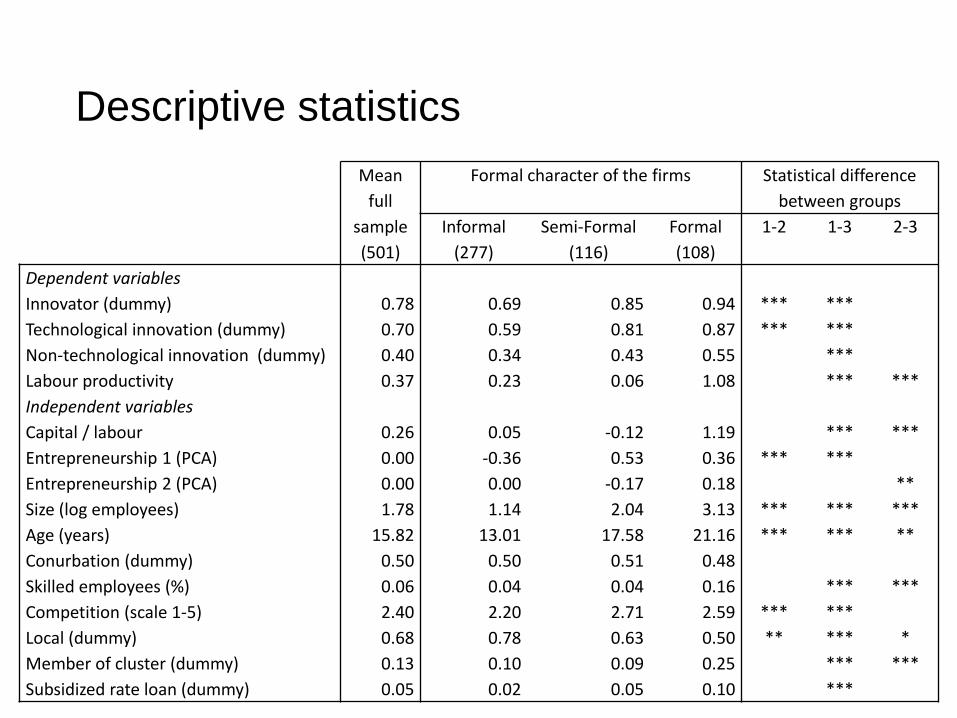
Descriptive statistics
Mean
full
sample
(501)
Formal character of the firms Statistical difference
between groups
Informal
(277)
Semi-Formal
(116)
Formal
(108)
1-2 1-3 2-3
Dependent variables
Innovator (dummy) 0.78 0.69 0.85 0.94 *** ***
Technological innovation (dummy) 0.70 0.59 0.81 0.87 *** ***
Non-technological innovation (dummy) 0.40 0.34 0.43 0.55 ***
Labour productivity 0.37 0.23 0.06 1.08 *** ***
Independent variables
Capital / labour 0.26 0.05 -0.12 1.19 *** ***
Entrepreneurship 1 (PCA) 0.00 -0.36 0.53 0.36 *** ***
Entrepreneurship 2 (PCA) 0.00 0.00 -0.17 0.18 **
Size (log employees) 1.78 1.14 2.04 3.13 *** *** ***
Age (years) 15.82 13.01 17.58 21.16 *** *** **
Conurbation (dummy) 0.50 0.50 0.51 0.48
Skilled employees (%) 0.06 0.04 0.04 0.16 *** ***
Competition (scale 1-5) 2.40 2.20 2.71 2.59 *** ***
Local (dummy) 0.68 0.78 0.63 0.50 ** *** *
Member of cluster (dummy) 0.13 0.10 0.09 0.25 *** ***
Subsidized rate loan (dummy) 0.05 0.02 0.05 0.10 ***
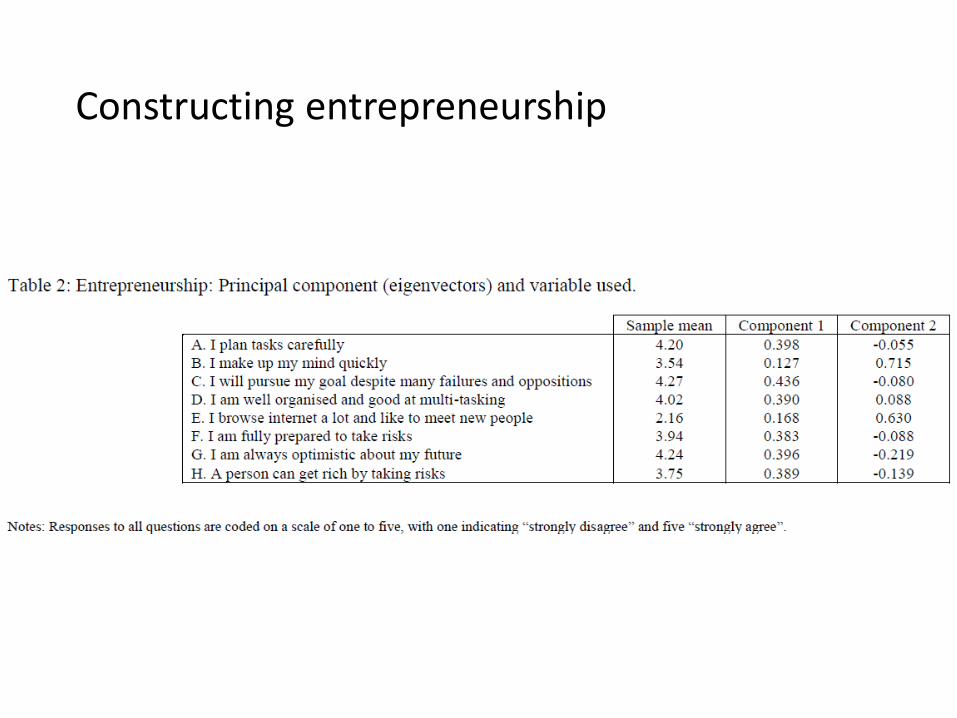
Constructing entrepreneurship
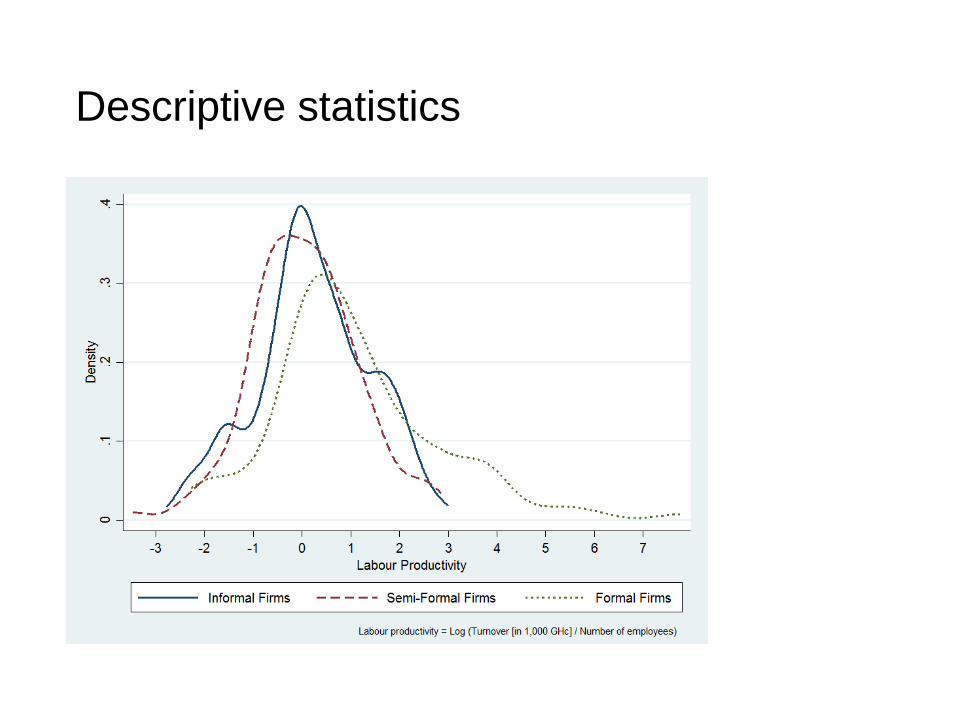
Descriptive statistics
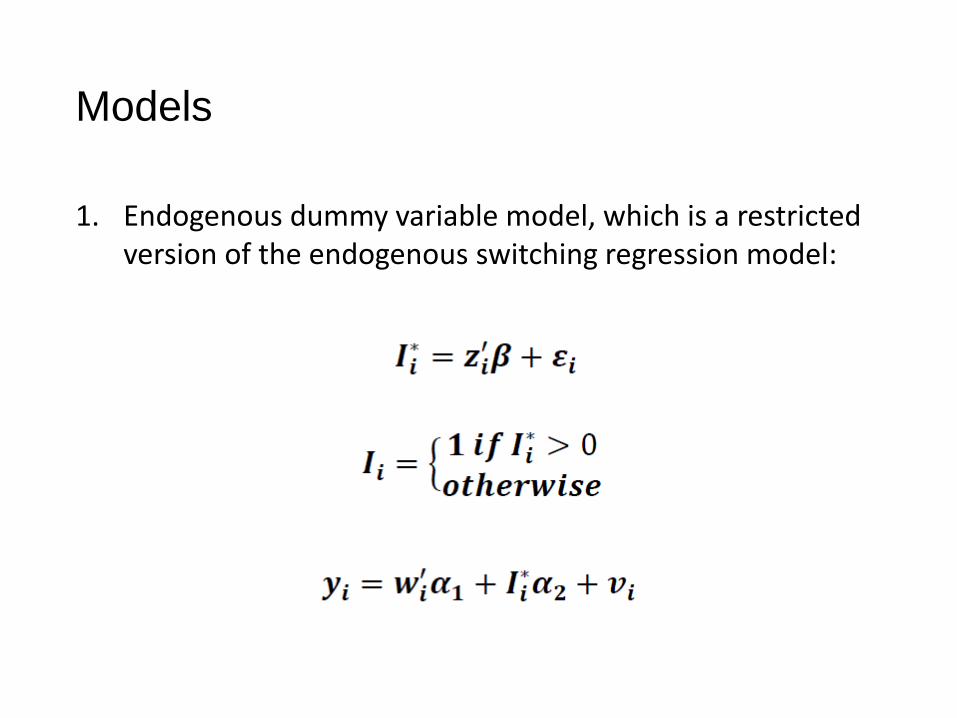
Models
1. Endogenous dummy variable model, which is a restricted version of the endogenous switching regression model:
Models
• Bivariate probit with endogenous dummy variables in the productivity equation
• Stochastic frontier model different types of innovation moving out the frontier and shifting the firm towards the frontier
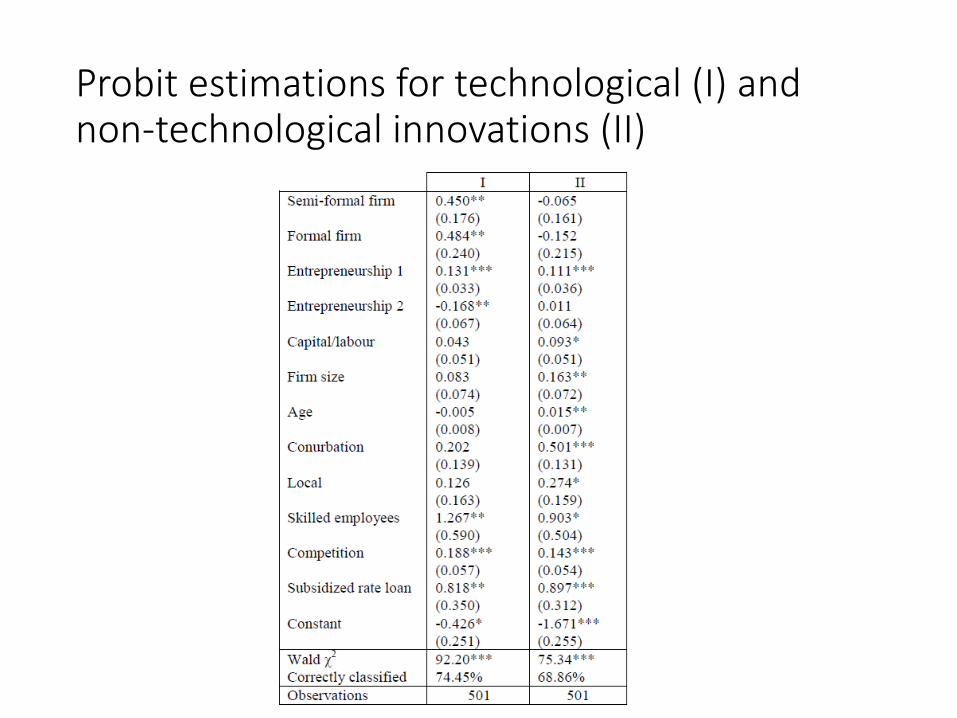
Probit estimations for technological (I) and non-technological innovations (II)
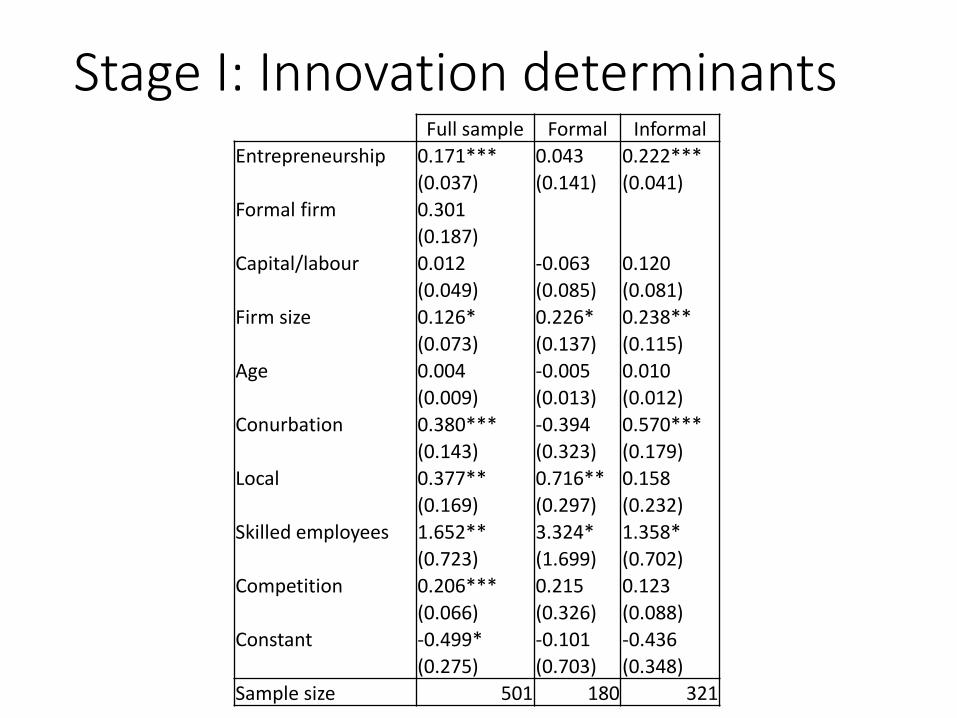
Stage I: Innovation determinantsFull sample Formal Informal
Entrepreneurship 0.171*** 0.043 0.222***
(0.037) (0.141) (0.041)
Formal firm 0.301
(0.187)
Capital/labour 0.012 -0.063 0.120
(0.049) (0.085) (0.081)
Firm size 0.126* 0.226* 0.238**
(0.073) (0.137) (0.115)
Age 0.004 -0.005 0.010
(0.009) (0.013) (0.012)
Conurbation 0.380*** -0.394 0.570***
(0.143) (0.323) (0.179)
Local 0.377** 0.716** 0.158
(0.169) (0.297) (0.232)
Skilled employees 1.652** 3.324* 1.358*
(0.723) (1.699) (0.702)
Competition 0.206*** 0.215 0.123
(0.066) (0.326) (0.088)
Constant -0.499* -0.101 -0.436
(0.275) (0.703) (0.348)
Sample size 501 180 321
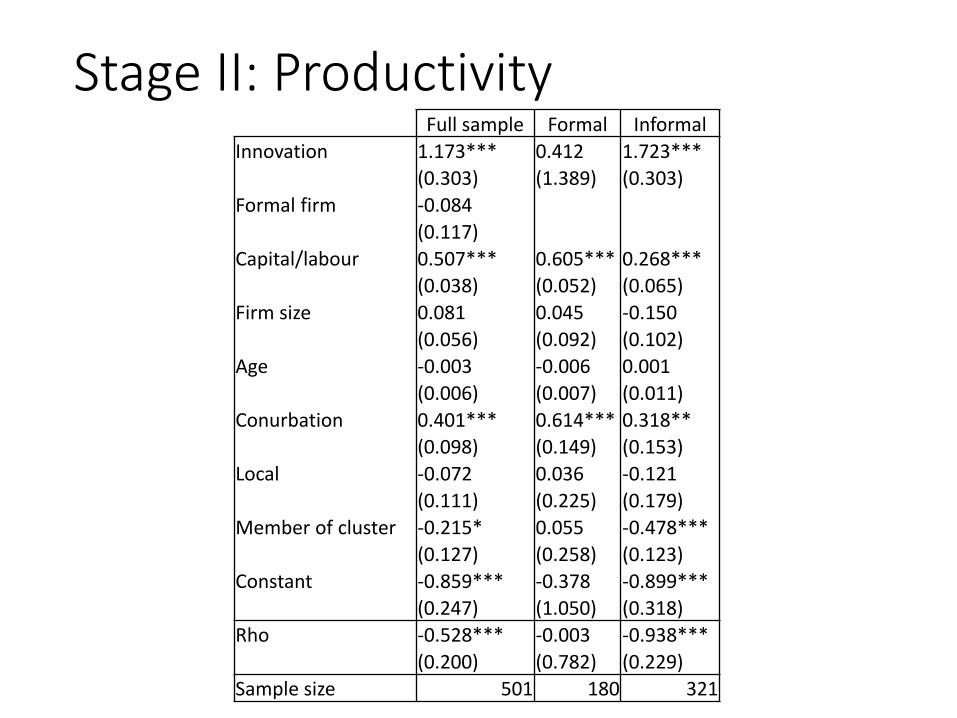
Stage II: ProductivityFull sample Formal Informal
Innovation 1.173*** 0.412 1.723***
(0.303) (1.389) (0.303)
Formal firm -0.084
(0.117)
Capital/labour 0.507*** 0.605*** 0.268***
(0.038) (0.052) (0.065)
Firm size 0.081 0.045 -0.150
(0.056) (0.092) (0.102)
Age -0.003 -0.006 0.001
(0.006) (0.007) (0.011)
Conurbation 0.401*** 0.614*** 0.318**
(0.098) (0.149) (0.153)
Local -0.072 0.036 -0.121
(0.111) (0.225) (0.179)
Member of cluster -0.215* 0.055 -0.478***
(0.127) (0.258) (0.123)
Constant -0.859*** -0.378 -0.899***
(0.247) (1.050) (0.318)
Rho -0.528*** -0.003 -0.938***
(0.200) (0.782) (0.229)
Sample size 501 180 321

Conclusion
• Importance of innovation, especially in informal firms
• Importance of entrepreneurship in informal firms