Embed Size (px)
Citation preview
wvpS2410POLICY RESEARCH WORKING PAPER 2410
Is Functional Literacy The policy implications of thisstudy of the determinants of
a Prerequisite for Entering literacy and earnings in
the Labor arket? Ghana: Basic education and
literacy programs should
target girls and poorer
An Analysis of Determinants of Adult households, especially in rural
Literacy and Earnings in Ghana areas.
Niels-Hugo Blunch
Dorte Verner
The World Bank
Africa Technical Families
Human Development 3
andLatin America and the Caribbean Region
Economic Policy Sector Unit
August 2000
Pub
lic D
iscl
osur
e A
utho
rized
Pub
lic D
iscl
osur
e A
utho
rized
Pub
lic D
iscl
osur
e A
utho
rized
Pub
lic D
iscl
osur
e A
utho
rized
| POLICY RESEARCH WORKING PAPER 2410
Summary findingsBlunch and Verner analyze the determinants of literacy rural area, and poverty are negatively associated withand earnings in Ghana. They link literacy and earnings literacy.with various other factors, including age, gender, family Functional literacy appears to be a prerequisite foreducational background, distance to school, and income. entering the labor market, which may partly explain the
Literacy and age are negatively correlated, suggesting lack of returns to education other than middle schoolthat efforts to strengthen the supply and quality of basic and technical and professional training.education programs in recent years have succeeded in The policy implications of this study: Basic educationraising literacy rates. and literacy programs should target girls and poorer
Parents' education is positively associated with literacy. households, especially in rural areas.Distance to the nearest primary school, residence in a
This paper is a joint product of Human Development 3, Africa Technical Families, and Economic Policy Sector Unit, LatinAmerica and the Caribbean Region. Copies of the paper are available free from the World Bank, 1818 H Street NW,Washington, DC 20433. Please contact Hazel Vargas, room 18-138, telephone 202-473-7871, fax 202-522-2119, email
address [email protected]. Policy Research Working Papers are also posted on the Web at www.worldbank.org/research/workingpapers. The authors may be contacted at [email protected] or [email protected]. August2000. (33 pages)
The Polcy Research Working Paper Series disseminates the findings of work in progress to encourage the exchange of ideas aboutdevelopment issues. An objective of the series is to get the findings out quickly, even if the presentations are less than fully polisbed. The
papers carry the names of the autbors and sbould be cited accordingly. The findings, interpretations, and conclusions expressed in thispaper are entirely those of the autbors. They do not necessarily represent the view of the World Bank, its Executive Directors, or the
countries they represent.
Produced bv the Policv Research Dissemination Center
Is Functional Literacy a Prerequisite for Entering the Labor Market?An Analysis of the Determinants of Adult Literacy and Earnings in
Ghana
Niels-Hugo Blunch and Dorte Verner
World Bank
We would like to thank Rosemary Bellew and Helena Ribe for invaluable support. We are also indebted toRocio Castro; Ronald Ehrenberg; Nicolai Kristensen; our discussant, Nabanita Datta Gupta; and the otherparticipants at the conference on the Economics of Education and Human Capital, held by the Centre forLabour Market and Social Research and the Aarhus School of Business, Denmark, in June, 1999, forhelpful comments and suggestions. Contacts: [email protected], [email protected].

1. INTRODUCTION
Significant and rapid increases in earnings and education have taken place over the past
hundred years in industrial economies. In developing economies the picture is different:
High illiteracy rates and very low incomes, and thus widespread poverty, are realities for
large parts of the world. Literacy and income are closely linked. Establishing and
assessing the nature of these links may help increase both literacy rates and earnings,
thereby eradicating poverty.
In this article, we analyze the determinants of literacy and earnings in Ghana based on
two household surveys. Our results link literacy and earnings with a variety of factors,
including age, gender, family educational background, distance to school, and income.
Literacy and age are found to be inversely correlated, implying that younger generations
are more literate than older generations. This relationship indicates that recent efforts to
strengthen the supply and quality of basic education programs have been successful.
Females are found to be less literate than males, controlling for other factors. Parents'
education is positively correlated with their children's literacy. Distance to the nearest
primary school and residency in a rural area, are negatively correlated with literacy rates.
Poverty and literacy are also negatively correlated.
Our analysis of the determinants of earnings reveals no significant returns to education
other than middle school and technical/professional training. This result may indicate that
the quality of education in Ghana generally is poor. Alternatively, it could suggest that
education is not serving as a signaling device in Ghana.
Functional literacy affects selection into the labor market. In developing countries, jobs
are rationed (that is, demand-side determined). We therefore interpret this result to
indicate that functional literacy is a prerequisite for entering the labor market. This
interpretation may partly explain the lack of returns to education.
2
The policy implications of these results are that greater efforts should be devoted to
developing functional literacy skills and basic education. Policymakers should aim to
increase both the supply and the quality of basic education and literacy programs. Basic
education and literacy programs should target females and poorer households, especially
in rural areas.
The article is organized as follows. Section 2 describes changes in and determinants of
literacy. Section 3 describes the Ghanaian economy. Section 4 presents the economic
model and the econometric methodology underlying the analysis. Section 5 presents the
data and descriptive statistics, and section 6 presents the regression analysis. Section 7
summarizes the article's findings and draws policy conclusions.
2. CHANGES IN AND DETERMINANTS OF LITERACY
Opinions differ widely over how best to define literacy. Unesco defines a functionally
literate person as any person 15 or older who can "read and write a simple statement on
his or her everyday life" (Unesco 1993, p. 24). The World Development Report (1997)
also adopts this definition of functional literacy. Others propose a broader and more
explicitly political definition. Paulo Friere, the Brazilian educator, sees literacy as a
process of "conscientization" that involves "reading the world" rather than merely
"reading the word" (Friere and Macedo 1987).
Widespread literacy is a twentieth century phenomenon. Before the nineteenth century,
when public school systems were developed, education was reserved for the few. School
systems developed in industrial countries largely in response to increased and more
specialized industrialization, which in turn lead to increased economic growth and
demand for an even more educated laborforce.
Over the past decade, education worldwide has exploded, as a result of the ever-
increasing demand for still more specialized labor. Attitudes toward education have also
shifted. Less than 50 years ago, education, especially higher education, was reserved
3
largely for men. Today people in industrial countries believe the entire population has the
right to education.
2.1 Developments in Literacy in the United States
Literacy progressed in stages in the United States. Initially, according to Haas (1996),
literacy spread because radical Protestants wanted to read the Bible. Their need for
literacy lead to agitation for general public education in the nineteenth century. Literacy
rates later rose as a result of several societal changes, beginning with Reconstruction
(Coy 1988). Immigration during the Industrial Revolution and the Progressive reform
movement increased literacy later in the nineteenth and early twentieth centuries. World
War I and the Depression forced the federal government into a more active and direct
role, and literacy rose even farther. The civil rights movement of the 1960s shifted the
focus to minority groups, broadening efforts to fight illiteracy. Coy believes that the
concept of functional literacy developed during this period and that the formalization of
that concept helped increase the number of adult literacy programs.
2.2 Developments in Literacy in Great Britain
In Great Britain literacy also progressed in stages. Street (1995) identifies three distinct
stages in the modem development of adult literacy programs. First, the recognition of
adult illiteracy being a widespread phenomenon - in the 1960s - lead to increased focus
on the issue. Government grants were provided, a national "Right to Read Campaign"
was launched, and local practice and experience was developed. During the 1970s and
early 1980s the government-funded agency Adult Literacy and Basic Skills Unit
emerged. The unit provided materials and guidelines for good practice and funded small
research projects. Since the late 1980s there has been a shift in policy and focus, aiming
at adjusting education toward changing national and economic needs.
4
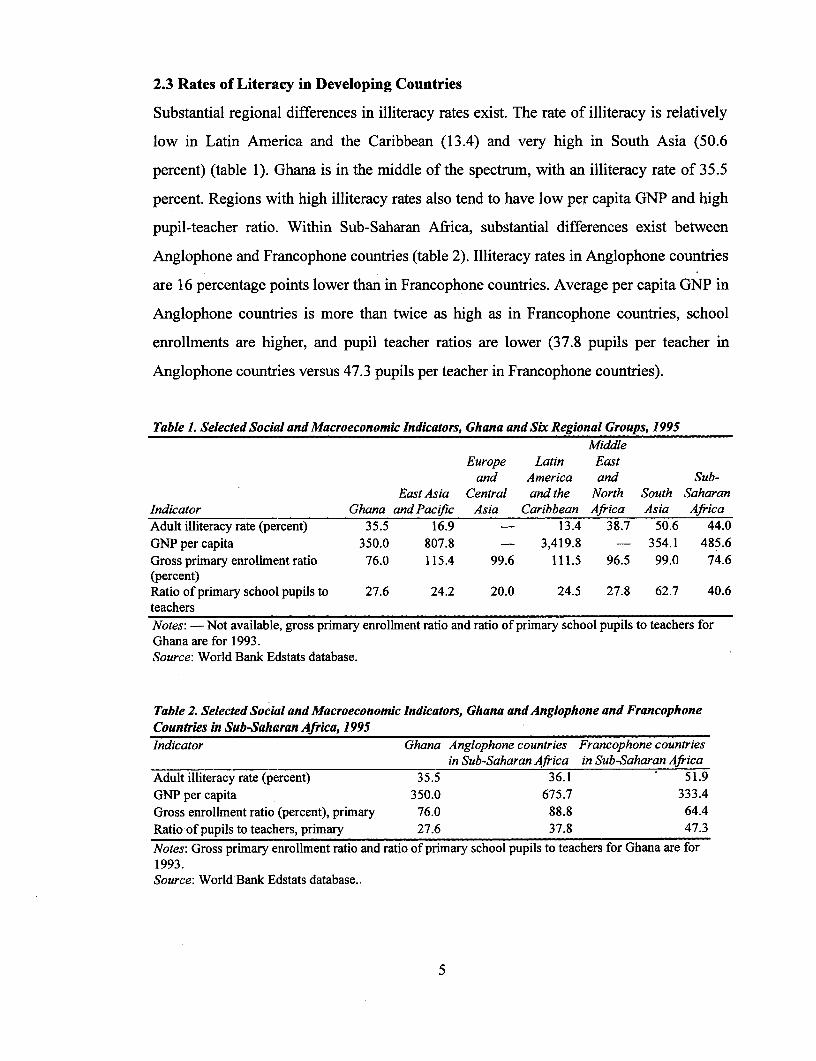
2.3 Rates of Literacy in Developing Countries
Substantial regional differences in illiteracy rates exist. The rate of illiteracy is relatively
low in Latin America and the Caribbean (13.4) and very high in South Asia (50.6
percent) (table 1). Ghana is in the middle of the spectrum, with an illiteracy rate of 35.5
percent. Regions with high illiteracy rates also tend to have low per capita GNP and high
pupil-teacher ratio. Within Sub-Saharan Africa, substantial differences exist between
Anglophone and Francophone countries (table 2). Illiteracy rates in Anglophone countries
are 16 percentage points lower than in Francophone countries. Average per capita GNP in
Anglophone countries is more than twice as high as in Francophone countries, school
enrollments are higher, and pupil teacher ratios are lower (37.8 pupils per teacher in
Anglophone countries versus 47.3 pupils per teacher in Francophone countries).
Table 1. Selected Social and Macroeconomic Indicators, Ghana and Six Regional Groups, 1995Middle
Europe Latin Eastand America and Sub-
East Asia Central and the North South SaharanIndicator Ghana and Pacif c Asia Caribbean Africa Asia AfricaAdult illiteracy rate (percent) 35.5 16.9 - 13.4 38.7 50.6 44.0GNP per capita 350.0 807.8 - 3,419.8 - 354.1 485.6Gross primary enrollment ratio 76.0 115.4 99.6 111.5 96.5 99.0 74.6(percent)Ratio of primary school pupils to 27.6 24.2 20.0 24.5 27.8 62.7 40.6teachersNotes: - Not available, gross primary enrollnent ratio and ratio of primary school pupils to teachers forGhana are for 1993.Source: World Bank Edstats database.
Table 2. Selected Social and Macroeconomic Indicators, Ghana and Anglophone and FrancophoneCountries in Sub-Saharan Africa, 1995Indicator Ghana Anglophone countries Francophone countries
in Sub-Saharan Africa in Sub-Saharan AfricaAdult illiteracy rate (percent) 35.5 36.1 51.9GNP per capita 350.0 675.7 333.4Gross enrollment ratio (percent), primary 76.0 88.8 64.4Ratio-of pupils to teachers, primary 27.6 37.8 47.3
Notes: Gross primary enrollment ratio and ratio of primary school pupils to teachers for Ghana are for1993.Source: World Bank Edstats database..
5
2.4 Worldwide Increases in Literacy
For the world as a whole, illiteracy rates have declined significantly, falling from almost
40 percent in 1970 to just 25 percent in 1990. Rates of illiteracy fell even more
dramatically in developing countries, declining from 50 percent in 1970 to 35 percent in
1990 (Lim; 1996). Wide differences across gender, geographical region, and age exist
within countries, however. For the most part, males have higher literacy rates than
females, urban areas have higher literacy rates than rural areas, and younger generations
have higher literacy rates than older generations. Lim (1996) also draws attention to the
fact that while total illiteracy rates have been falling, the proportion of women in the
world's total illiterate population has been rising. Three reasons for this tendency are
suggested: the technologies of goods production, the nature of human reproduction, and
institutionalization of violence in the state.
2.5 Literature on the Determinants of Literacy
Little has been written on the determinants of literacy. Lavy, Spratt, and Leboucher
(1995) analyze the determinants of literacy in Morocco. They find that illiteracy is more
widespread among females than among males, higher in rural areas than in urban areas,
and inversely correlated with age. The negative relationship between age and literacy may
reflect both deteriorating literacy skills over time and improvements in the quality of
education. Lavy, Spratt, and Leboucher also find that parents' literacy and household
expenditure level positively affect the level of children's literacy, suggesting that poverty
and family background are important determinants of literacy.
Verner (1999) analyzes the determinants of worldwide literacy rates by applying a human
capital framework. She finds that enrollment rates, average years of schooling of adults,
and life expectancy at birth are the main determinants of literacy. Income affects literacy
in a nonlinear fashion, with a negative impact until a threshold of about $2,000 income
per year per capita, after which the effect is positive. Institutional and regional variables
are not very important in explaining literacy across countries. Literacy rates differ widely
across regions, a finding that can be explained by social and economic conditions.
6
3. AN OVERVIEW OF THE GHANAIAN ECONOMY
Ghana is a low-income country, with per capita income of $406 in 1998 (World Bank
l999a). It relies heavily on the agricultural sector, in particular cocoa, which accounts for
almost half of GDP (World Bank 1999b).
From the mid-1970s to the mid-1980s, declining cocoa production and trade restrictions
stalled economic growth in Ghana. The return of more than a million Ghanaians from
Nigeria in 1982-83 and a prolonged drought in 1982 caused growth rates to fall to all-
time low levels by about 1984.
In conjunction with the IMF and the World Bank, the Ghanaian government initiated the
Economic Recovery Program (ERP) in 1983. The program implemented a number of
policy reforms aimed at restoring macrdeconomic stability, encouraging savings and
investment, providing an enabling environment for the private sector, and improving
public sector management, including privatization of some of the many publicly owned
enterprises.
The ERP places significant emphasis on education. The Education Sector Reform
Program, established in 1987, improved the efficiency, quality, and relevance of
education. The program also increased access to education and shortened the length of
pre-university schooling from 17 to 12 years. As a result of the reform program, spending
on education rose from 1.4 percent of GDP in 1983 to 3.8 percent of GDP in 1994.
The government's plans for additional reforms are outlined in its development strategy,
"Ghana-Vision 2020" (Republic of Ghana 1995). A substantial part of the program's
social agenda is aimed at basic education. Specific goals include achieving universal
basic education and adult literacy, increasing access to secondary and tertiary education,
and strengthening laborforce skills by increasing technical and vocational training. To
achieve these goals, the government, with the assistance of the World Bank and other
donors, launched the Basic Education Sector Improvement Program in 1996. The
7
program plans to increase investment in school facilities and teacher housing in rural
areas and to strengthen science and math in the curriculum by raising education
expenditures from 3.8 percent of GDP in 1998 to 4.1 percent in 2001.
4. THE ECONOMIC MODEL AND THE ECONOMETRIC FRAMEWORK
The framework for the analysis is standard human capital theory, in which individuals
build up knowledge and skills through education and experience -- specific on-the-job
experience as well as general experience (Becker 1975; Mincer 1974). According to the
theory, individuals who invest in human capital are subsequently rewarded with higher
earnings. Formally, the economic model may be derived from the theory of either
household or individual demand for schooling, both of which view education as an
investment in human capital. In industrial economies, in which subsidies for education
are common, the investment decision may be viewed as an individual decision; in
developing economies the relevant decision unit may be the household (Khandker, Lavy,
and Filmer 1994; Mason and Khandker 1997). Households will invest in education up to
the point at which the marginal benefit from an additional year of schooling equals the
marginal cost of an additional year of schooling.!
In the traditional human capital literature, earnings are determined by education and other
individual, household, and, possibly, community characteristics. Earnings are observed,
however, only for individuals who have positive earnings (that is, who actually supply
labor). To take this into account, we specify a labor supply function. Our model then
becomes:
(1) Ei = Eoi, Hi, Ci)
(2) Si= S(Ii, Hi, Cd)
This implicitly assumes that the household decisionmaker possesses perfect information and that capital
markets are perfect. Both assumptions are very restrictive and appear unrealistic in developing economies.
8
where Ei (earnings of individual i) and Si (the labor supply of individual i) are the
dependent variables; I is a vector of individual characteristics, such as age and age
squared (to capture possible nonlinearities), gender, the individual's level of education,
and the level of education of the individual's parents; H is a vector of household
characteristics, such as the wealth of the household; and C is a vector of community
variables, such as urban versus rural location. Literacy, L, is then determined by the
following simple model:
(3) Li = L(I, Hi, Ci)
The explanatory variables are similar to those in the earnings equation, with some
differences. In order to investigate the possible link between poverty and literacy, we
include earnings and the poverty quintile of the household in H. We also include a
measure of the distance to the nearest primary school in C.
To analyze the determinants of earnings, we use a Heckman selection model
(1976, 1979), which can be briefly described as follows. Consider the earnings
regression:
(4) ln Wi = Xip + si
where ln Wi is log-earnings for individual i, Xi is a vector of explanatory variables for
individual i, 1B is a vector of parameters, and Si is an error term capturing unobserved
variables. The problem in estimating equation 4 is that we implicitly apply a sample
selection rule because we observe only earnings of individuals who work; potential
earnings of people who do not supply labor are not incorporated. If the sample has
characteristics that differ from those of the underlying population in a nonrandom
fashion, it will suffer from a selection bias, which, if not taken into account, will lead to
biased parameter estimates. Heckman's solution to this problem is to incorporate the
labor supply choice in the earnings equation. The earnings and labor supply choice
equations thus become:
9
(5) ln Wi = Xip + ri
(6) I*i=Ziy+ vi
where equation 5 is the earnings equation (equivalent to equation 4), I* in equation 6 is a
latent variable that reflects the excess utility from participating in the labor market, and Zi
is a vector of variables explaining the labor supply decision of individual i. The latent
variable I* corresponds to the indicator variable:
Ii = 1 if I*i > OJ,O otherwise
The model is estimated by first estimating the inverse Mill's ratio and then including it as
an additional regressor in equation 5:
(7) In Wi = Xi + Aip+ ei
where Ai is an estimate of the inverse Mill's ratio for individual iO
The Heckman model views labor supply as an individual choice. This view may be
inappropriate in a development context, where the absence of (public) safety nets means
that there is not likely to be much of a choice involved in the labor supply "decision."
The labor actually supplied to the market is likely to be determined more from the
demand side than from the supply side. This contrasts with industrial economies, in
which the labor supply decision is likely to be made in a different way. Skilled workers
are more likely to supply their labor than unskilled workers since they forgo more income
than do skilled workers by staying idle (given that there is a social safety net whose
benefits are high enough not to "force" them into working).
2 We applied the maximum likelihood version of the Heckman selection model -- rather than the Two-Stepversion -- in order to be able to weight the data.
10
We view the Heckman model as the general model, the validity of which must be tested
against the reduced model. The reduced model here is the standard earnings equation,
which is nested within the selection model. That is, the standard earnings equation is a
special case of the selection model in which the selection correction terms, Xi, are
statistically insignificantly different from zero.
5. THE DATA AND DESCRIPTIVE STATISTICS
We test the model using data from two household surveys, the 1991/92 Ghana Living
Standards Survey (GLSS3) and the 1997 Core Welfare Indicators Questionnaire (CWIQ).
GLSS3 aims at obtaining measures of the living standard in Ghana on several
dimensions, including health and education/literacy. The survey is very extensive and
includes 4,565 households. The CWIQ aims mainly at providing data applicable for
analyzing factors affecting poverty, education, and labor markets issues. It contains a
much smaller number of questions (questions about earnings, for example, are not
included) but a larger sample of households (14,514) and individuals (60,686).
5.1 Results on Literacy
Investigating literacy and its covariates for the GLSS data enables differentiating between
several types of literacy and reveals that being able to read and write in English is
associated with higher earnings than is being able to read and write in one or more
Ghanaian languages (table 3).3 The various measures of literacy are highly correlated,
however, a problem that is likely to cause collinearity in the regression analysis of the
next section. To circumvent these problems, we combine the various literacy variables
into a single composite measure of functional literacy. Specifically, we define individuals
as functionally literate if they can read or write in English or any Ghanaian language and
perform arithmetic calculations.
Both surveys rely on self-assessment of literacy, which puts the validity of their findings in somequestion. The fact that self-reports of literacy are reasonably consistent with educational levels suggeststhat under- or overreporting are not serious problems, however.
11
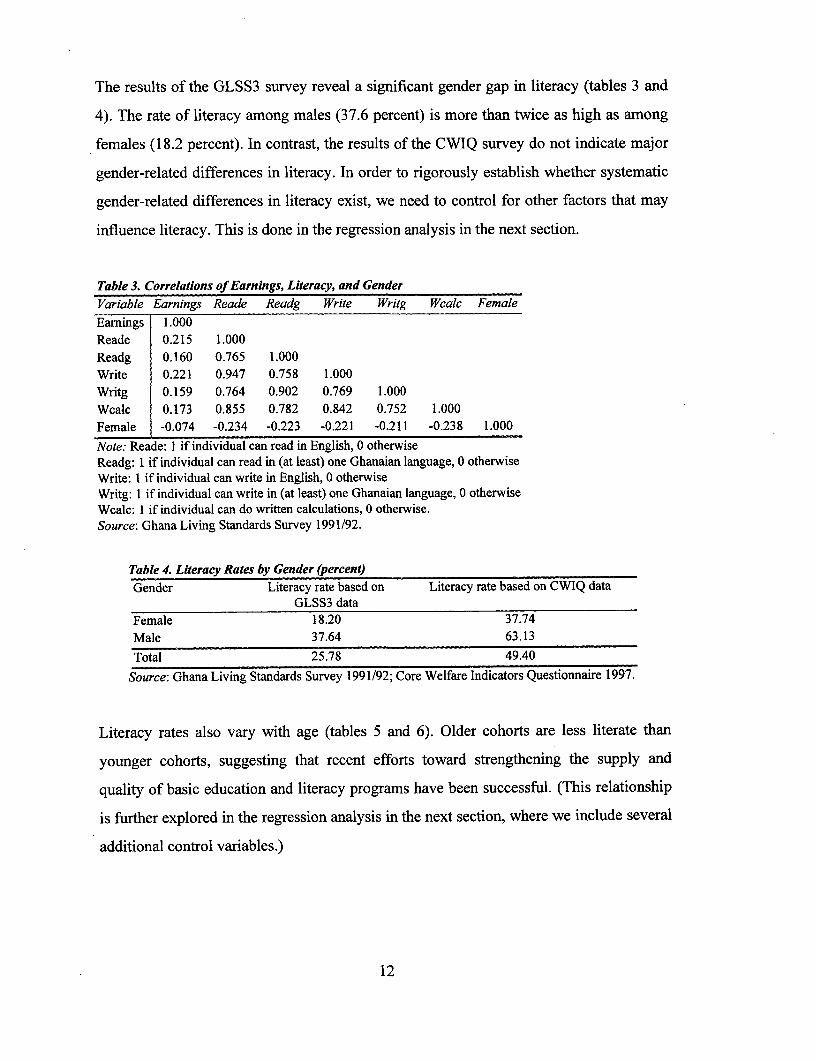
The results of the GLSS3 survey reveal a significant gender gap in literacy (tables 3 and
4). The rate of literacy among males (37.6 percent) is more than twice as high as among
females (18.2 percent). In contrast, the results of the CWIQ survey do not indicate major
gender-related differences in literacy. In order to rigorously establish whether systematic
gender-related differences in literacy exist, we need to control for other factors that may
influence literacy. This is done in the regression analysis in the next section.
Table 3. Correlations of Earnings, Literacy, and Gender
Variable Earnings Reade Readg Write Writg Wcalc Female
Earnings 1.000Reade 0.215 1.000Readg 0.160 0.765 1.000Write 0.221 0.947 0.758 1.000Writg 0.159 0.764 0.902 0.769 1.000
Wcalc 0.173 0.855 0.782 0.842 0.752 1.000
Female -0.074 -0.234 -0.223 -0.221 -0.211 -0.238 1.000
Note: Reade: I if individual can read in English, 0 otherwiseReadg: I if individual can read in (at least) one Ghanaian language, 0 otherwiseWrite: I if individual can write in English, 0 otherwiseWritg: I if individual can write in (at least) one Ghanaian language, 0 otherwiseWcalc: I if individual can do written calculations, 0 otherwise.Source: Ghana Living Standards Survey 1991/92.
Table 4. Literacy Rates by Gender (percent)
Gender Literacy rate based on Literacy rate based on CWIQ dataGLSS3 data
Female 18.20 37.74
Male 37.64 63.13
Total 25.78 49.40
Source: Ghana Living Standards Survey 1991/92; Core Welfare Indicators Questionnaire 1997.
Literacy rates also vary with age (tables 5 and 6). Older cohorts are less literate than
younger cohorts, suggesting that recent efforts toward strengthening the supply and
quality of basic education and literacy programs have been successful. (This relationship
is further explored in the regression analysis in the next section, where we include several
additional control variables.)
12
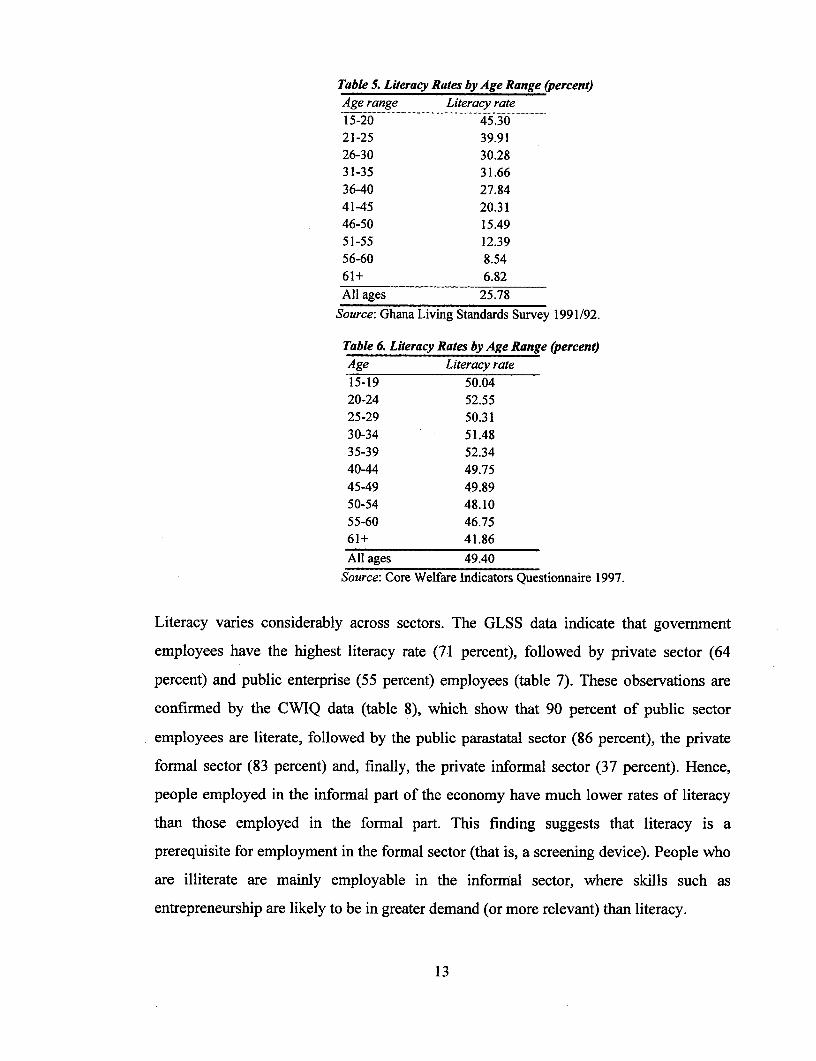
Table 5. Literacy Rates by Age Range (percent)Age range Literacy rate15-20 45.3021-25 39.9126-30 30.2831-35 31.6636-40 27.8441-45 20.3146-50 15.4951-55 12.3956-60 8.5461+ 6.82All ages 25.78
Source: Ghana Living Standards Survey 1991/92.
Table 6. Literacy Rates by Age Range (percent)Age Literacy rate15-19 50.0420-24 52.5525-29 50.3130-34 51.4835-39 52.3440-44 49.7545-49 49.8950-54 48.1055-60 46.7561+ 41.86
All ages 49.40
Source: Core Welfare Indicators Questionnaire 1997.
Literacy varies considerably across sectors. The GLSS data indicate that government
employees have the highest literacy rate (71 percent), followed by private sector (64
percent) and public enterprise (55 percent) employees (table 7). These observations are
confirmed by the CWIQ data (table 8), which show that 90 percent of public sector
employees are literate, followed by the public parastatal sector (86 percent), the private
formal sector (83 percent) and, finally, the private informal sector (37 percent). Hence,
people employed in the informal part of the economy have much lower rates of literacy
than those employed in the formal part. This finding suggests that literacy is a
prerequisite for employment in the formal sector (that is, a screening device). People who
are illiterate are mainly employable in the informal sector, where skills such as
entrepreneurship are likely to be in greater demand (or more relevant) than literacy.
13
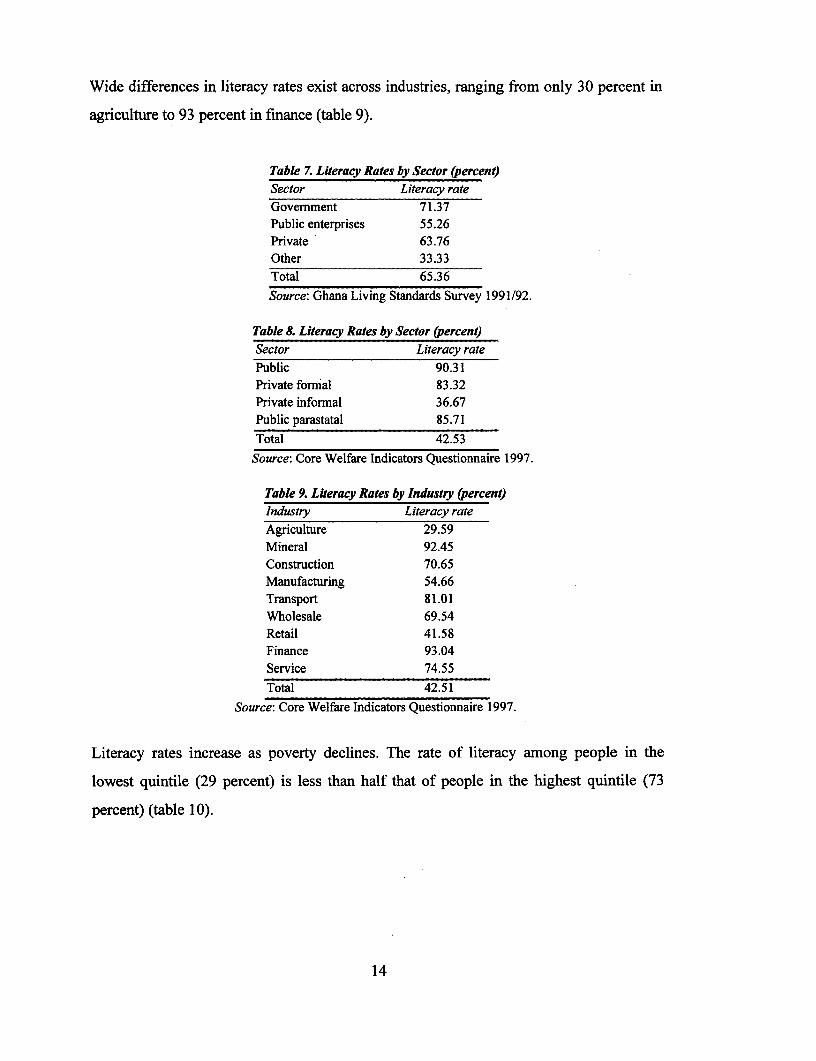
Wide differences in literacy rates exist across industries, ranging from only 30 percent in
agriculture to 93 percent in finance (table 9).
Table 7. Literacy Rates by Sector (percent)Sector Literacy rateGovernment 71.37Public enterprises 55.26Private 63.76Other 33.33Total 65.36Source: Ghana Living Standards Survey 1991/92.
Table 8. Literacy Rates by Sector (percent)Sector Literacy ratePublic 90.31Private formal 83.32Private informal 36.67Public parastatal 85.71Total 42.53
Source: Core Welfare Indicators Questionnaire 1997.
Table 9. Literacy Rates by Industry (percent)Industry Literacy rateAgriculture 29.59Mineral 92.45Construction 70.65Manufacturing 54.66Transport 81.01Wholesale 69.54Retail 41.58Finance 93.04Service 74.55Total 42.51
Source: Core Welfare Indicators Questionnaire 1997.
Literacy rates increase as poverty declines. The rate of literacy among people in the
lowest quintile (29 percent) is less than half that of people in the highest quintile (73
percent) (table 10).
14
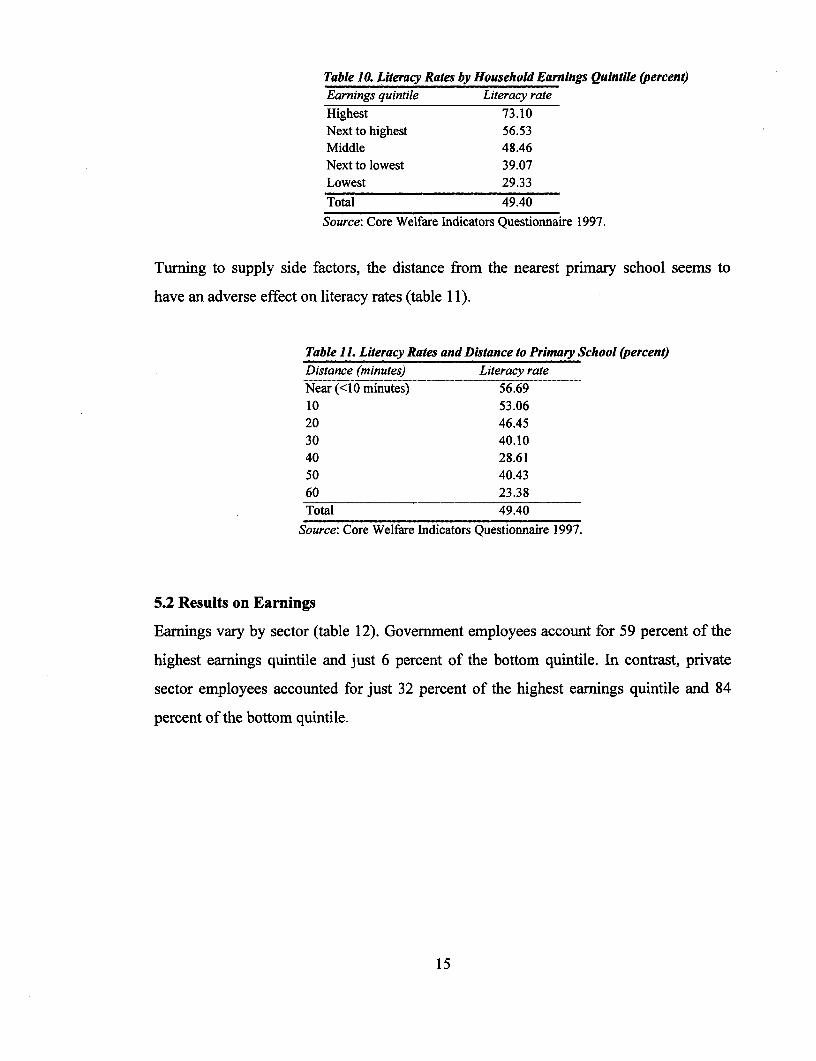
Table 10. Literacy Rates by Household Earnings Quintile (percent)Earnings quintile Literacy rate
Highest 73.10Next to highest 56.53Middle 48.46Next to lowest 39.07Lowest 29.33
Total 49.40
Source: Core Welfare Indicators Questionnaire 1997.
Turning to supply side factors, the distance from the nearest primary school seems to
have an adverse effect on literacy rates (table 11).
Table 11. Literacy Rates and Distance to Primary School (percent)Distance (minutes) Literacy rateNear (<10 minutes) 56.6910 53.0620 46.4530 40.1040 28.6150 40.43
60 23.38Total 49.40
Source: Core Welfare Indicators Questionnaire 1997.
5.2 Results on Earnings
Earnings vary by sector (table 12). Government employees account for 59 percent of the
highest earnings quintile and just 6 percent of the bottom quintile. In contrast, private
sector employees accounted for just 32 percent of the highest earnings quintile and 84
percent of the bottom quintile.
15
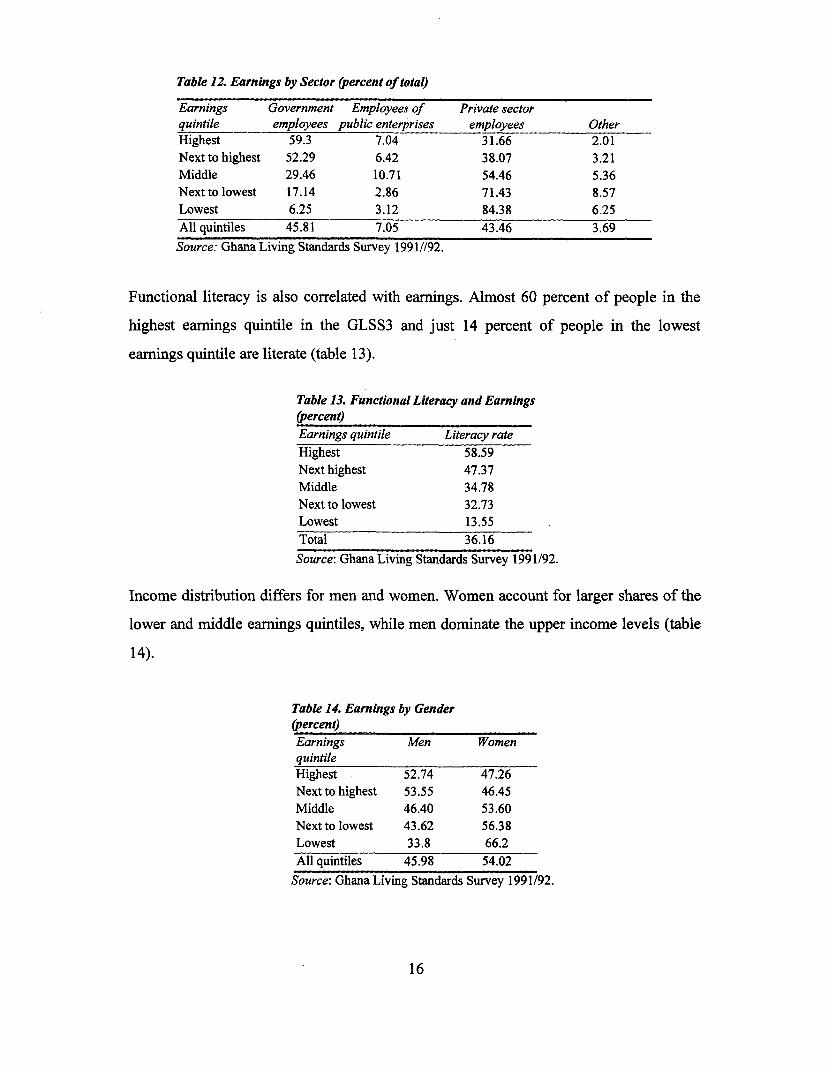
Table 12. Earnings by Sector (percent of total)
Earnings Government Employees of Private sectorquintile employees public enterprises employees Other
Highest 59.3 7.04 31.66 2.01
Next to highest 52.29 6.42 38.07 3.21
Middle 29.46 10.71 54.46 5.36
Next to lowest 17.14 2.86 71.43 8.57
Lowest 6.25 3.12 84.38 6.25
All quintiles 45.81 7.05 43.46 3.69
Source: Ghana Living Standards Survey 1991//92.
Functional literacy is also correlated with earnings. Almost 60 percent of people in the
highest earnings quintile in the GLSS3 and just 14 percent of people in the lowest
earnings quintile are literate (table 13).
Table 13. Functional Literacy and Earnings(percent)Earnings quintile Literacy rate
Highest 58.59Next highest 47.37Middle 34.78Next to lowest 32.73Lowest 13.55
Total 36.16
Source: Ghana Living Standards Survey 1991/92.
Income distribution differs for men and women. Women account for larger shares of the
lower and middle earnings quintiles, while men dominate the upper income levels (table
14).
Table 14. Earnings by Gender(percent)Earnings Men WomenquintileHighest 52.74 47.26Next to highest 53.55 46.45Middle 46.40 53.60Next to lowest 43.62 56.38Lowest 33.8 66.2
All quintiles 45.98 54.02
Source: Ghana Living Standards Survey 1991/92.
16
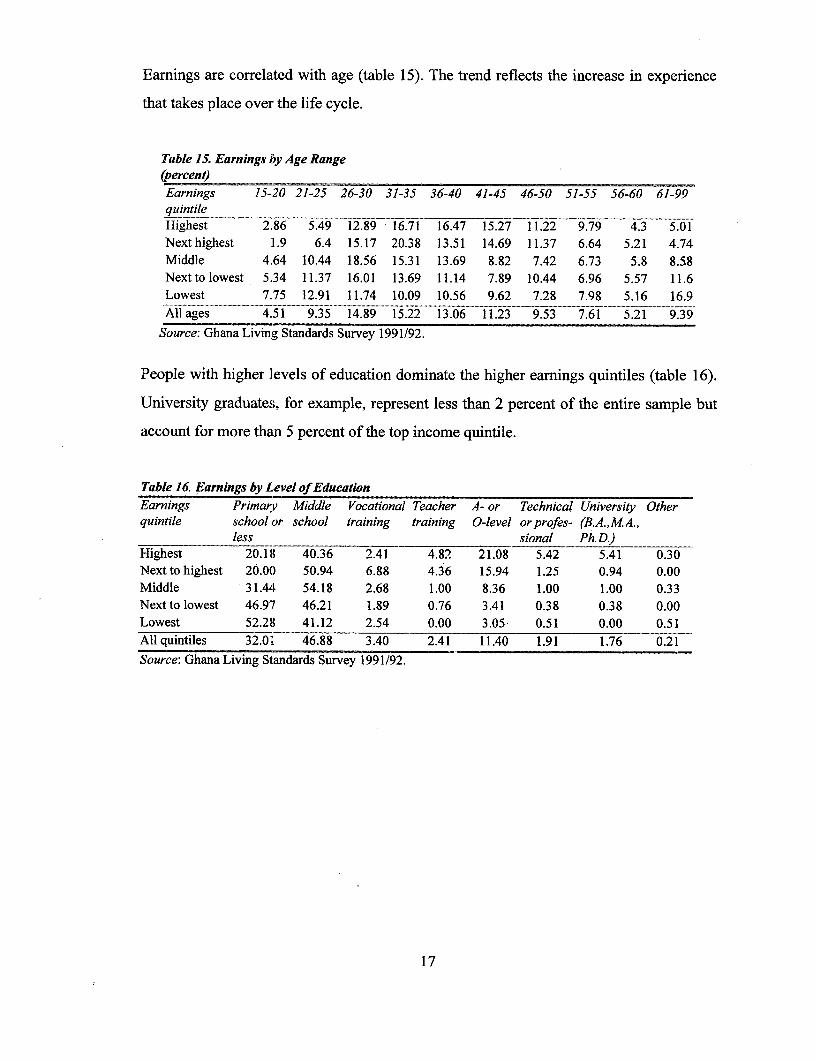
Earnings are correlated with age (table 15). The trend reflects the increase in experience
that takes place over the life cycle.
Table 15. Earnings by Age Range(percent)Earnings 15-20 21-25 26-30 31-35 36-40 41-45 46-50 51-55 56-60 61-99quintileHighest 2.86 5.49 12.89 16.71 16.47 15.27 11.22 9.79 4.3 5.01Nexthighest 1.9 6.4 15.17 20.38 13.51 14.69 11.37 6.64 5.21 4.74Middle 4.64 10.44 18.56 15.31 13.69 8.82 7.42 6.73 5.8 8.58Nexttolowest 5.34 11.37 16.01 13.69 11.14 7.89 10.44 6.96 5.57 11.6Lowest 7.75 12.91 11.74 10.09 10.56 9.62 7.28 7.98 5.16 16.9
f -.......... ....... . ... . ...................... .. ..... ._ ... _ ..94 .. ........._. All ages 4.51..35 14.89 15.22 13.06 11.23 9.53 7.61 5.21 9.39
Source: Ghana Living Standards Survey 1991/92.
People with higher levels of education dominate the higher earnings quintiles (table 16).
University graduates, for example, represent less than 2 percent of the entire sample but
account for more than 5 percent of the top income quintile.
Table 16. Earnings by Level of EducationEarnings Primary Middle Vocational Teacher A- or Technical University Otherquintile school or school training training 0-level orprofes- (B.A.,MA.,
less sional Ph.D.)Highest 20.18 40.36 2.41 4.82 21.08 5.42 5.41 0.30Next to highest 20.00 50.94 6.88 4.36 15.94 1.25 0.94 0.00Middle 31.44 54.18 2.68 1.00 8.36 1.00 1.00 0.33Next to lowest 46.97 46.21 1.89 0.76 3.41 0.38 0.38 0.00Lowest 52.28 41.12 2.54 0.00 3.05 0.51 0.00 0.51All quintiles 32.01 46.88 3.40 2.41 11.40 1.91 1.76 0.21Source: Ghana Living Standards Survey 1991/92.
17
6. DETERMINANTS OF FUNCTIONAL LE7N'ERACY AND EARNINGS IN
GHANA4
To analyze the determinants of literacy, we performed multivariate regression analysis
using a probit regression model. Although the determinants of earnings have been
rigorously analyzed in the empirical human capital literature, the link to functional
literacy has not been addressed. Hence although our main interest is identifying the
determinants of literacy, we incorporate an analysis of the determinants of earnings,
focusing on the role of functional literacy.
6.1 Determinants of Functional Literacy
We regress functional literacy on the explanatory variables discussed above for
individuals 15 years old and older by applying probit regression techniques. A priori we
hypothesize that, following standard human capital theory, earnings positively influence
the probability of being literate (note that the hypothesized causality runs from literacy to
earnings here, even though, in a sense, all variables are endogenous in the literacy probits
presented below) and that literacy and age are inversely related. Older cohorts are
expected to be less literate than younger cohorts both because their literacy skills
deteriorate over time and because the quality of education thcy received was likely to
have been lower than that enjoyed by younger cohorts.
We would also expect to see gender and sectoral differences in literacy rates. We
therefore control for gender and sectoral differences by including gender and sectoral
variables. We also include regional differences, as individuals from urban areas are likely
to be more literate than individuals from rural areas because of the greater supply of
schooling in urban areas. These differences are captured by including a dummy in the
regression, which takes the value of I for individuals from urban areas and 0 for
4We use sample weights in the regression analysis in this section in order to account for the possible non-representativeness of the sample, due to the sample design. Hence, these weights remedy possibleover/under representation of observations on certain variables. However, the difference betweenparameter estimates and their statistical significance is quite robust across the weighted andunweighted specifications.
18
individuals from rural areas, where urban areas are defined as localities with a 1984
population of more than 5,000. This specification is consistent with the specification
applied in the analysis for Morocco by Lavy, Spratt, and Leboucher (1995), discussed
above.
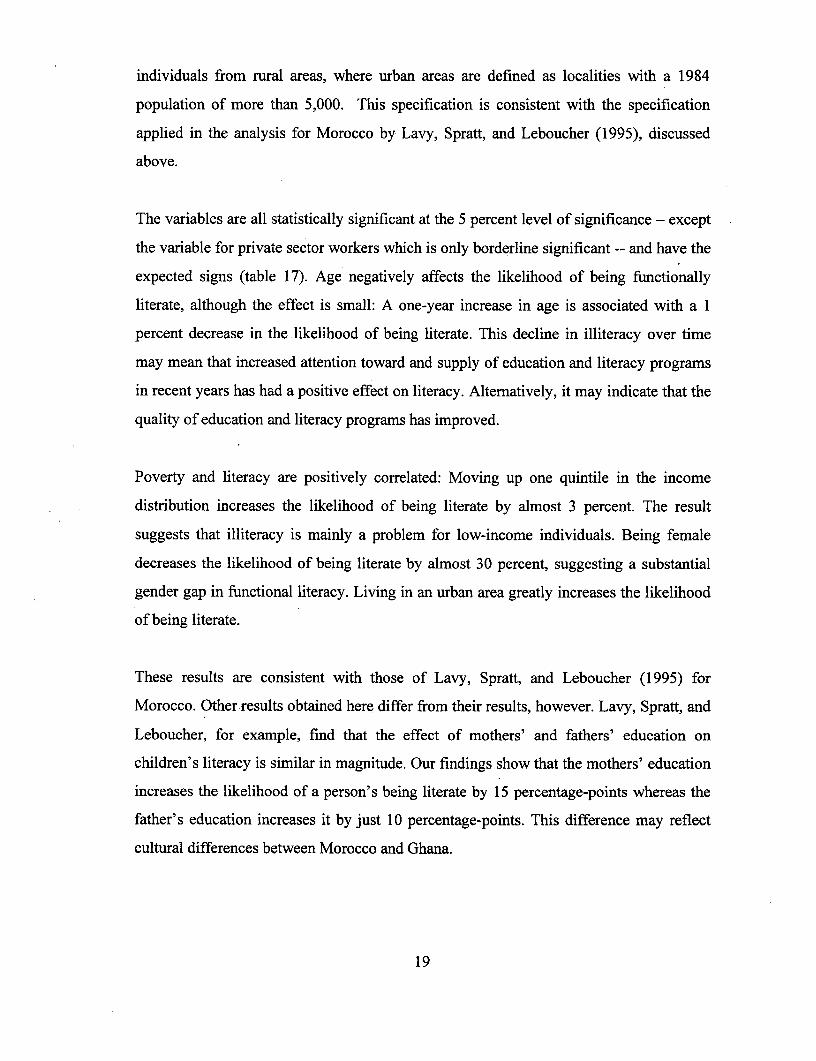
The variables are all statistically significant at the 5 percent level of significance - except
the variable for private sector workers which is only borderline significant -- and have the
expected signs (table 17). Age negatively affects the likelihood of being functionally
literate, although the effect is small: A one-year increase in age is associated with a 1
percent decrease in the likelihood of being literate. This decline in illiteracy over time
may mean that increased attention toward and supply of education and literacy programs
in recent years has had a positive effect on literacy. Alternatively, it may indicate that the
quality of education and literacy programs has improved.
Poverty and literacy are positively correlated: Moving up one quintile in the income
distribution increases the likelihood of being literate by almost 3 percent. The result
suggests that illiteracy is mainly a problem for low-income individuals. Being female
decreases the likelihood of being literate by almost 30 percent, suggesting a substantial
gender gap in functional literacy. Living in an urban area greatly increases the likelihood
of being literate.
These results are consistent with those of Lavy, Spratt, and Leboucher (1995) for
Morocco. Otherresults obtained here differ from their results, however. Lavy, Spratt, and
Leboucher, for example, find that the effect of mothers' and fathers' education on
children's literacy is similar in magnitude. Our findings show that the mothers' education
increases the likelihood of a person's being literate by 15 percentage-points whereas the
father's education increases it by just 10 percentage-points. This difference may reflect
cultural differences between Morocco and Ghana.
19
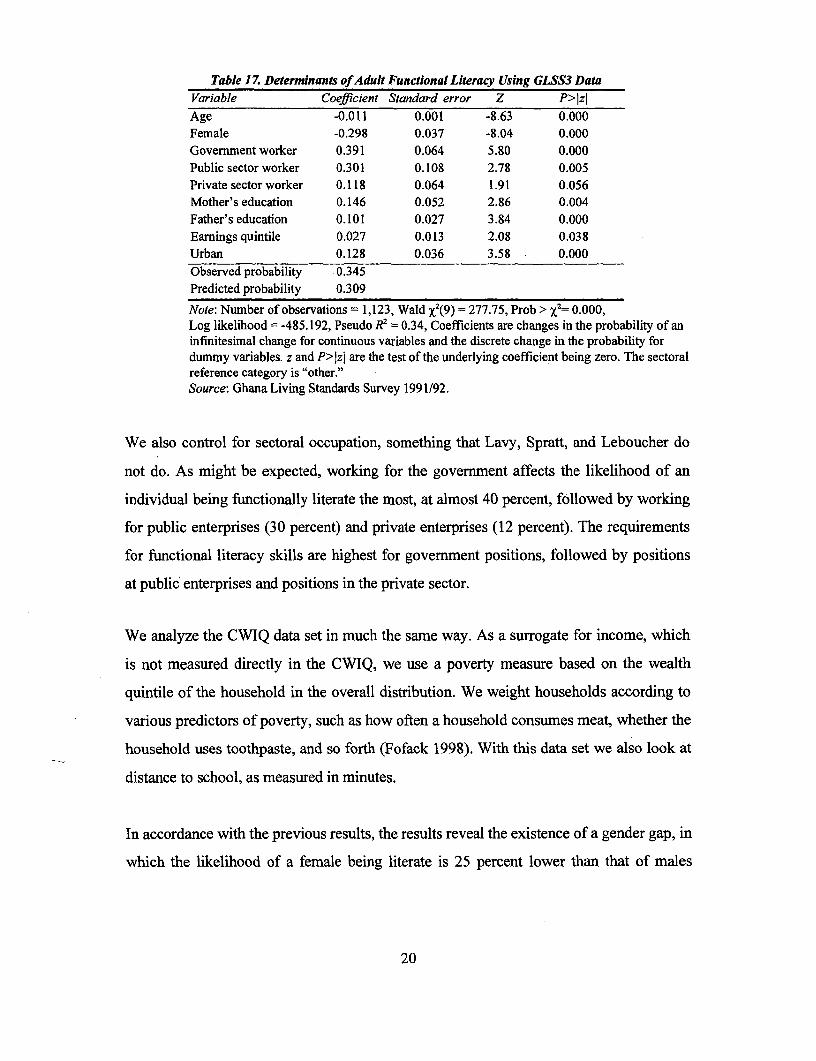
Table 17. Determinants of Adult Functional Literacy Using GLSS3 DataVariable Coefficient Standard error Z P> ziAge -0.011 0.001 -8.63 0.000Female -0.298 0.037 -8.04 0.000Government worker 0.391 0.064 5.80 0.000Public sector worker 0.301 0.108 2.78 0.005Private sector worker 0.118 0.064 1.91 0.056Mother's education 0.146 0.052 2.86 0.004Father's education 0.101 0.027 3.84 0.000Earnings quintile 0.027 0.013 2.08 0.038Urban 0.128 0.036 3.58 0.000Observed probability 0.345Predicted probability 0.309
Note: Number of observations = 1,123, Wald x2(9) 277.75, Prob > x2= 0.000,Log likelihood = -485.192, Pseudo R2 = 0.34, Coefficients are changes in the probability of aninfinitesimal change for continuous variables and the discrete change in the probability fordummy variables. z and P>lzl are the test of the underlying coefficient being zero. The sectoralreference category is "other."Source: Ghana Living Standards Survey 1991/92.
We also control for sectoral occupation, something that Lavy, Spratt, and Leboucher do
not do. As might be expected, working for the government affects the likelihood of an
individual being functionally literate the most, at almost 40 percent, followed by working
for public enterprises (30 percent) and private enterprises (12 percent). The requirements
for functional literacy skills are highest for government positions, followed by positions
at public enterprises and positions in the private sector.
We analyze the CWIQ data set in much the same way. As a surrogate for income, which
is not measured directly in the CWIQ, we use a poverty measure based on the wealth
quintile of the household in the overall distribution. We weight households according to
various predictors of poverty, such as how often a household consumes meat, whether the
household uses toothpaste, and so forth (Fofack 1998). With this data set we also look at
distance to school, as measured in minutes.
In accordance with the previous results, the results reveal the existence of a gender gap, in
which the likelihood of a female being literate is 25 percent lower than that of males
20
(table 18). Age and literacy are inversely related, with literacy decreasing by a modest 0.4
percent a year.
Private formal and informal sector employees tend to be less literate (a negative effect of
17 and 41 percent, respectively) than the reference category of public sector employees.
This result supports our previous results and suggests that the skills required by the
private sector, and in particular the infornal part of the private sector, differ from those
required by the public sector. Workers from all industries tend to be more literate, and
with different magnitudes, relative to agriculture, forestry, and fishing (the reference
category). This result should be interpreted as indicating that skills requirements vary
across industries.
Table 18. Determinants ofAdul Literacy Using CWIQ DataVariable Coefficient Standarderror Z P> IziFemale -0.245 0.013 -18.43 0.000Age -0.004 0.000 -10.24 0.000Private, formal -0.170 0.023 -6.61 0.000Private, informal -0.412 0.018 -19.18 0.000Parastatal/Semi-public -0.028 0.080 -0.35 0.727Minerals 0.380 0.061 4.97 0.000Construction 0.113 0.026 4.33 0.000Manufacturing 0.140 0.020 6.89 0.000Transportation & communication 0.195 0.028 6.85 0.000Wholesale 0.125 0.065 1.93 0.054Retail 0.092 0.015 6.33 0.000Finance 0.390 0.061 5.06 0.000Service 0.158 0.016 9.98 0.000Distance to school (in minutes) -0.041 0.003 -12.69 0.000Poverty quintile 0.100 0.004 23.62 0.000Urban 0.143 0.010 13.81Observed probability 0.410Predicted probability (evaluated at 0.400the mean)
Note: Number of observations = 30,438, Wald %2(15) = 2327.8661, Prob > x2 = 0.000, Log likelihood= -15820.678, Pseudo R2 = 0.23, Coefficients are changes in the probability for an infinitesimalchange for continuous variables and the discrete change in the probability for dummy variables. z andP>Izl are the test of the underlying coefficient being zero. The industry reference category isagriculture, forestry, and fishing. The sectoral reference category is private, inforrnalSource: Core Welfare Indicators Questionnaire 1997.
21
The distance to the nearest primary school is negatively associated with literacy, with a
10-minute increase in the time it takes to reach the school associated with a 4 percent
decline in the rate of literacy. Although the impact is relatively modest, the result points
to the importance of increasing the supply of primary schooling. Individuals from urban
communities are found to be more literate than individuals from rural areas and, which
supports the earlier finding, since the supply of education is generally greater in urban
communities. Poverty and literacy appear to be closely linked: Moving up one quintile in
the poverty distribution increases the likelihood of being literate by 10 percent.
6.2 Determinants of Earnings
The omission of nonworkers from the sample may bias the results if workers'
characteristics are different from those of nonworkers. Although we questioned the
relevance of the Heckman selection model for developing countries in our discussion of
the econometric methodology, following the general-to-specific-approach we first
estimate this model as the general model and then investigate whether the selection term
may be tested out.
We hypothesized above that the main determinants of earnings are education, age and age
squared (proxies for experience), and gender. Regional differences are also likely to exist
(because workers from urban areas receive higher average earnings to compensate them
for the higher cost of living in urban areas).
It may be that basic literacy rather than education is an important earnings-generating
factor in low-income countries. We include (dummy) variables for the highest level of
education completed, together with our composite measure of functional literacy. We also
introduce interaction terms between the highest level of education completed and
functional literacy. Including these terms allows us to investigate whether education
serves as a screening device (that is, a signal to employers of potential employees'
"quality") rather than as a productivity-enhancing (and thus income-enhancing) factor. If
education does not serve as a signal in Ghana, we would expect to see statistically
22
insignificant educational variables, while the composite measure of adult functional
literacy and the interaction variables would be statistically significant in the earnings
equation. Finally, we control for sectoral earnings differences by including sectoral
dummies.
After the earnings function is sketched, we model the selection equation. Initially, we
propose that "family dependence" in a broad sense is likely to affect the labor supply
decision. It is not clear a priori in which direction the effect should go. It is possible to
argue both that high family dependence induces a higher earnings requirement, which
would positively affect labor supply, and that there may be increasing returns to the
household from an additional household member, which could negatively affect labor
supply. We try to capture this effect by including a variable that indicates whether an
individual is married or not.
The other variables from the earnings equation, except the sectoral variables, are relevant
for capturing the characteristics of individuals supplying labor. Viewing the selection
equation as characterizing the labor supply decision may not be appropriate in developing
countries, where limited access to public safety nets implies that labor supply is demand
determined. Individuals without access to safety nets will work at any positive wage
(their reservation wage will be virtually zero). With this in mind, it seems more intuitive
to view possible selection taking place on the demand side. That is, the selection equation
quantifies the characteristics of individuals that are sought by prospective employers.
Being married, for example, may signal commitment and thus represent a desirable
worker characteristic. Because this effect may be different for females and males, we
include an interaction term (1 for married women, 0 otherwise).
The results of the estimation of the Heckman selection model of earnings are presented in
table 19. The general lack of statistical significance of variables in the earnings equation
is striking, and the large dropout of the sample is quite alarming - and implies that the
results should be interpreted with caution. In the earnings equation, age and the female
23
and private sector dummy variables are statistically significant at the 1 percent level,
while the marginal returns to middle school graduates and individuals with
technical/professional training are statistically significant and positive.
The result suggests the existence of a gender-related earnings gap and seems to indicate
that experience is an important earnings-generating factor.5 The educational variables are
generally not statistically significantly different from zero, possibly indicating that the
quality of education in Ghana is low, with middle school graduates and
technically/professionally trained workers as an exception. The latter may imply that a
positive earnings premium is only obtained after a certain level (and since there are only
few secondary school and very few university graduates in the sample, the possible
earnings premium for the latter may vanish in the sample as a whole). Workers in the
private sector obtain earnings that are higher than those of workers in other sectors. The
fact that private sector employees obtain higher than average earnings while the premium
for public employees is statistically insignificant suggests that workers obtain benefits
other than earnings from working in the public sector. These may include increased job
security and greater scope for applying one's education.
From the table it is seen that the inverse Mills' ratio is marginally statistically significant.
This indicates that sample selection should be taken into account in order to avoid biased
estimates in the earnings equation. Moving on to the selection equation, we note that the
variables age and Educoml (which takes a value of 1 when middle school is the highest
level of education completed and zero otherwise) are positive and statistically
significantly different from zero. Experience and middle school completion thus
positively affect the likelihood of working. Completing O/A-levels negatively affects the
likelihood of working. This may reflect the fact that students who complete their O/A-
levels often put off working in order to continue their education.
The gender gap in earnings and the fact that earnings rise (at a decreasing rate) over the life cycle areamong the best-established stylized facts of the empirical human capital literature for industrial economies(see Becker 1957, 1975; Blau 1996; Blau and Kahn 1992).
24
Being married and being functionally literate positively affect the likelihood of working
for both men and women (the female-married interaction variable is statistically
insignificantly different from zero). This result suggests that marriage is an important
determinant of labor supply and may indicate that being married signals commitment to a
prospective employer. Note that functional literacy works through the selection
mechanism rather than directly through earnings, possibly because functional literacy is a
prerequisite for entering the labor market.
The monetary returns to skills and education are not statistically significantly different
from zero. This result conceals the fact that being functionally literate is a prerequisite for
entering the labor market in the first place, however, which is realized when the results of
the selection equation are taken into account.
25
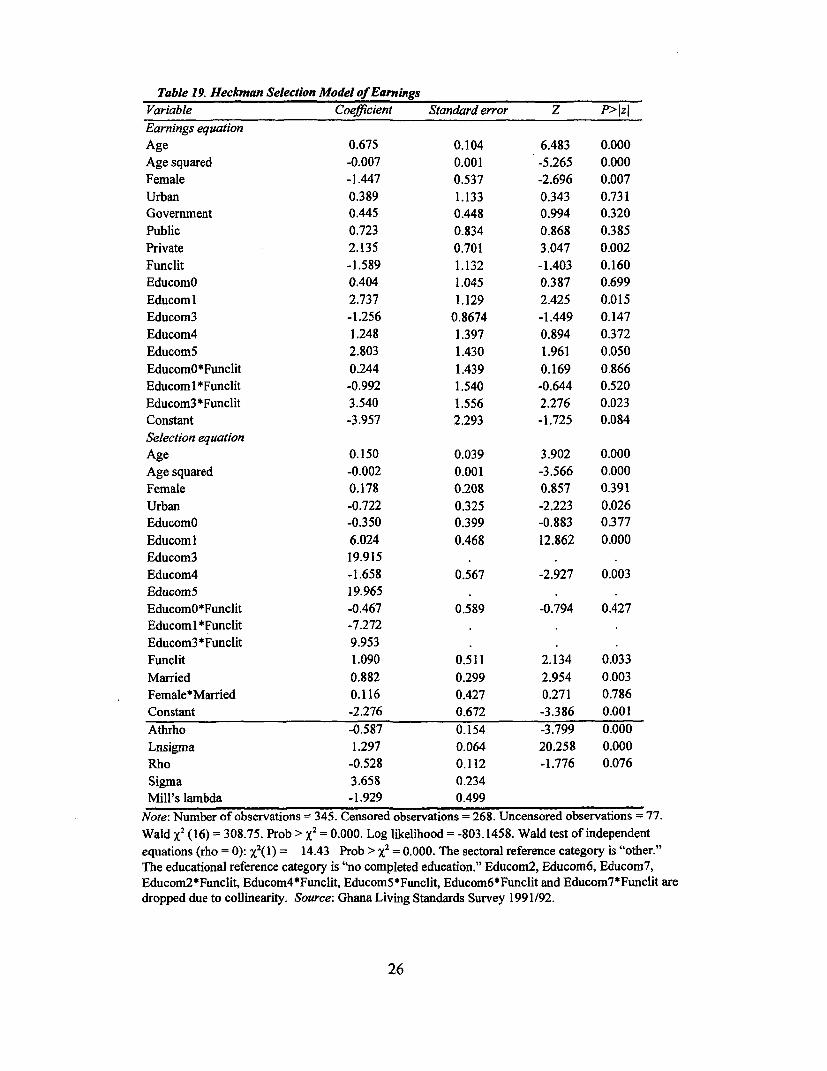
Table 19. Heckman Selection Model of EarningsVariable Coefficient Standard error Z P>IziEarnings equationAge 0.675 0.104 6.483 0.000Age squared -0.007 0.001 -5.265 0.000Female -1.447 0.537 -2.696 0.007Urban 0.389 1.133 0.343 0.731Government 0.445 0.448 0.994 0.320Public 0.723 0.834 0.868 0.385Private 2.135 0.701 3.047 0.002Funclit -1.589 1.132 -1.403 0.160EducomO 0.404 1.045 0.387 0.699Educoml 2.737 1.129 2.425 0.015Educom3 -1.256 0.8674 -1.449 0.147Educom4 1.248 1.397 0.894 0.372Educom5 2.803 1.430 1.961 0.050EducomO*Funclit 0.244 1.439 0.169 0.866Educoml*Funclit -0.992 1.540 -0.644 0.520Educom3*Funclit 3.540 1.556 2.276 0.023Constant -3.957 2.293 -1.725 0.084Selection equationAge 0.150 0.039 3.902 0.000Age squared -0.002 0.001 -3.566 0.000Female 0.178 0.208 0.857 0.391Urban -0.722 0.325 -2.223 0.026EducomO -0.350 0.399 -0.883 0.377Educoml 6.024 0.468 12.862 0.000Educom3 19.915Educom4 -1.658 0.567 -2.927 0.003Educom5 19.965EducomO*Funclit -0.467 0.589 -0.794 0.427Educoml*Funclit -7.272Educom3*Funclit 9.953Funclit 1.090 0.511 2.134 0.033Married 0.882 0.299 2.954 0.003Female*Married 0.116 0.427 0.271 0.786Constant -2.276 0.672 -3.386 0.001Athrho -0.587 0.154 -3.799 0.000Lnsigma 1.297 0.064 20.258 0.000Rho -0.528 0.112 -1.776 0.076Sigma 3.658 0.234Mill's lambda -1.929 0.499
Note: Number of observations 345. Censored observations = 268. Uncensored observations 77.Wald X2 (16) = 308.75. Prob> x2 = 0.000. Log likelihood = -803.1458. Wald test of independentequations (rho = 0): j 2(1) = 14.43 Prob > x2 = 0.000. The sectoral reference category is "other."The educational reference category is "no completed education." Educom2, Educom6, Educom7,Educom2*Funclit, Educom4*Funclit, Educom5*Funclit, Educom6*Funclit and Educomr7*Funclit aredropped due to collinearity. Source: Ghana Living Standards Survey 1991/92.
26
7. CONCLUSION
Using two different household surveys on Ghana, we analyze the determinants of literacy
and earnings. Our results establish important links between various variables and literacy
and earnings.
Age negatively affects the likelihood of being functionally literate, suggesting that
literacy has increased over time. This trend may reflect the increased attention toward and
supply of education and literacy programs in recent years or improvements in the quality
of educational programs that already existed.
A substantial gender gap in literacy exists, with female literacy rates far below those for
males. Rural residents are less literate than urban residents, which seems intuitive given
the relative scarcity of schools in rural areas. Distance to the nearest primary school
negatively affects the likelihood of being literate. These results suggest that supply
factors are important determinants of literacy.
Parents' educational level affects the likelihood of their children being literate, with
mothers' education having a greater effect than fathers' education. Literacy rates differ
across sectors, a reflection of the fact that job requirements vary across sectors. As might
be expected, working for the government affects the likelihood of an individual being
functionally literate the most, while working for semi-public and private informal
enterprises affects it the least. Finally, poorer households tend to be less literate than
wealthier households: Moving up one quintile in the income distribution increases the
likelihood of being literate by 10 percent.
Our analysis of earnings reveals that income rises with age but at a decreasing rate.
Gender also affects earnings, with men earning more than women. Both of these results
6 The gender gap in earnings and the fact that earnings rise (at a decreasing rate) over the life cycle areamong the best-established stylized facts of the empirical human capital literature for industrial economies(see Becker 1957, 1975; Blau 1996; Blau and Kahn 1992).
27
agrees with the existing empirical evidence in the human capital literature People
employed in the private sector earn more than people employed elsewhere. The premium
for public sector employees is not statistically significant, suggesting that public sector
employees enjoy other benefits, such as job security or the ability to apply their
education, from working in the sector.
The educational variables are generally not statistically significant. This finding. may
indicate that the quality of education in Ghana is poor. Alternatively, it may suggest that
education is not serving as a signaling device in Ghana. Any conclusions about these
results should be viewed with caution, however, because of the small number of
observations included in the earnings part of the analysis.
The basic earnings equation is extended with a selection equation. The results indicate
that being married and being functionally literate positively affect the likelihood of
working. Marriage, which is an important determinant of labor supply for both men and
women, may signal commitment. Functional literacy works through the selection
mechanism rather than directly through earnings. One interpretation, which is in line with
our earlier discussion of selection in labor markets in developing economies, is that
functional literacy is a prerequisite for entering the labor market. Monetary returns to
skills and education are generally not statistically significantly different from zero. Being
functionally literate is a prerequisite for entering the labor market in the first place,
however, which is realized when the results of the selection equation is taken into
account.
The primary policy implication of this study is that greater efforts should be directed at
developing functional literacy skills and increasing the quality of education. The focus
should be primarily on increasing the supply of basic education and literacy programs,
particularly in rural areas. Such programs should target poor households and females,
who generally have lower literacy rates than the rest of the population. These conclusions
28
are consistent with the goals and intentions set forth in the Republic of Ghana's
development strategy, "Ghana-Vision 2020."
29
References:
Becker, Gary S. 1957. The Economics of Discrimination. Chicago: University of ChicagoUniversity Press.
1975. Human Capital. 2nd ed. Cambridge, Mass.: National Bureau of EconomicResearch.
Blau, Francine D. 1996. "Where Are We in the Economics of Gender? The Gender PayGap." NBER Working Paper No. 5664. Cambridge, Mass.: National Bureau ofEconomic Research.
Blau, Francine D., and Lawrence M. Kahn. 1992. "The Gender Earnings Gap: SomeInternational Evidence." NBER Working Paper No. 4224. Cambridge, Mass.:National Burean of Economic Research.
Coy, J. J. 1988. "Adult Literacy from a Sociocultural Perspective." Paper presented at the26th Annual Meeting of the Florida Reading Association, Orlando, Florida, October12-15, 1988.
Fofack, Hippolyte. 1998. "Using Poverty Predictors as Expenditure Proxies for RankingHouseholds for Poverty Analysis." Draft. Institutional and Social Policy Division,Africa Region, World Bank, Washington, D.C.
Friere, P., and D. Macedo. 1987. Literacy: Reading the Word and the World. SouthHadley, Mass.: Bergin and Garvey.
Hass, R. 1996. "Passing on the Gift: The Importance of Literacy in America." Teachers& Writers 27 (4): 1-3.
Heckman, J. 1976. "The Common Structure of Statistical Models of Truncation, SampleSelection, and Limited Dependent Variables and a Simple Estimator for SuchModels." Annals of Economic and Social Measurement 5: 475-492.
. 1979. "Sampling Selection Bias as a Specification Error." Econometrica 47:153-161.
Khandker, S., V. Lavy, and D. Filmer. 1994. "Schooling and Cognitive Achievements inMorocco : Can the Government Improve Outcomes?". World Bank Discussion Paper264. Washington, D.C.
30
Lavy, V., J. Spratt, and N. Leboucher. 1995. "Changing Patterns of Illiteracy in Morocco:Assessment Methods Compared." World Bank LSMS Working Paper 115.Washington, D.C.
Lim, J. B. 1996. "Women and Literacy: Definition of Literacy, the Causes andManifestations of Illiteracy, and Implications for the Educator." EDRS.
Mason, Andrew, and S. Khandker. 1997. "Household Schooling Decisions inTanzania."Draft, World Bank, Washington, D.C.
Mincer, Jacob. 1974. "Schooling, Experience, and Earnings." New York: ColumbiaUniversity Press.
Republic of Ghana. 1995. Ghana-Vision 2020 (The First Step 1996-2000). Accra.
Street, B. V. 1995 "Adult Literacy in the United Kingdom. A History of Research andPractice." Philadelphia: National Center on Adult Literacy
Unesco (United Nations Educational, Scientific, and Cultural Organization). 1993. WorldEducation Report. Paris.
Verner, D. 1999. "What Factors Influence Literacy?" Draft. World Bank, Washington,DC.
World Bank. 1999a. "Statistical Infornation and Management and Analysis System."Washington, D.C.
. 1999b. World Development Report 1998/1999: Knowledge for Development.New York: Oxford University Press.
. 1997 World Development Report 1997: The State in a Changing World. NewYork: Oxford University Press.
31
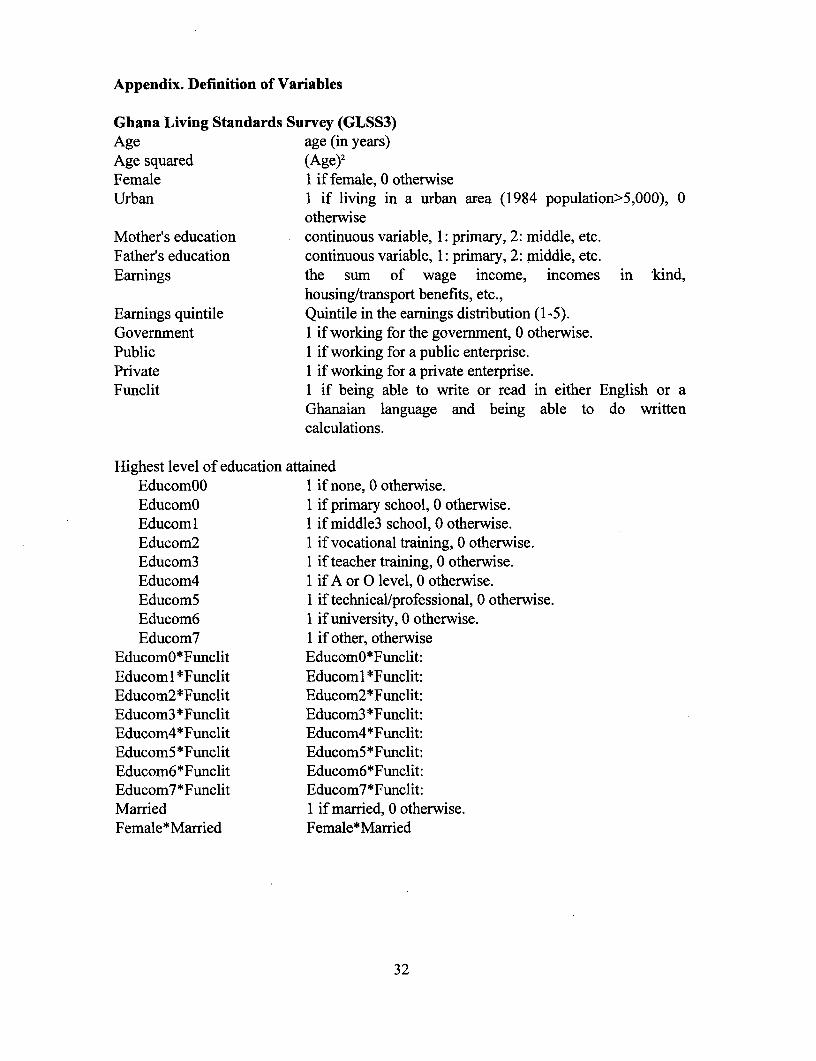
Appendix. Definition of Variables
Ghana Living Standards Survey (GLSS3)Age age (in years)Age squared (Age)2
Female I if female, 0 otherwiseUrban 1 if living in a urban area (1984 population>5,000), 0
otherwiseMother's education continuous variable, 1: primary, 2: middle, etc.Father's education continuous variable, 1: primary, 2: middle, etc.Earnings the sum of wage income, incomes in kind,
housing/transport benefits, etc.,Earnings quintile Quintile in the earnings distribution (1-5).Government 1 if working for the government, 0 otherwise.Public 1 if working for a public enterprise.Private 1 if working for a private enterprise.Funclit 1 if being able to write or read in either English or a
Ghanaian language and being able to do writtencalculations.
Highest level of education attainedEducomOO 1 if none, 0 otherwise.EducomO 1 if primary school, 0 otherwise.Educoml 1 if middle3 school, 0 otherwise.Educom2 1 if vocational training, 0 otherwise.Educom3 1 if teacher training, 0 otherwise.Educom4 1 if A or 0 level, 0 otherwise.Educom5 1 if technical/professional, 0 otherwise.Educom6 1 if university, 0 otherwise.Educom7 1 if other, otherwise
EducomO*Funclit EducomO*Funclit:Educoml *Funclit Educoml *Funclit:Educom2*Funclit Educom2*Funclit:Educom3 *Funclit Educom3 *Funclit:Educom4*Funclit Educom4*Funclit:EducomS *Funclit Educom5*Funclit:Educom6*Funclit Educom6*Funclit:Educom7*Funclit Educom7*Funclit:Married 1 if married, 0 otherwise.Female*Married Female*Married
32
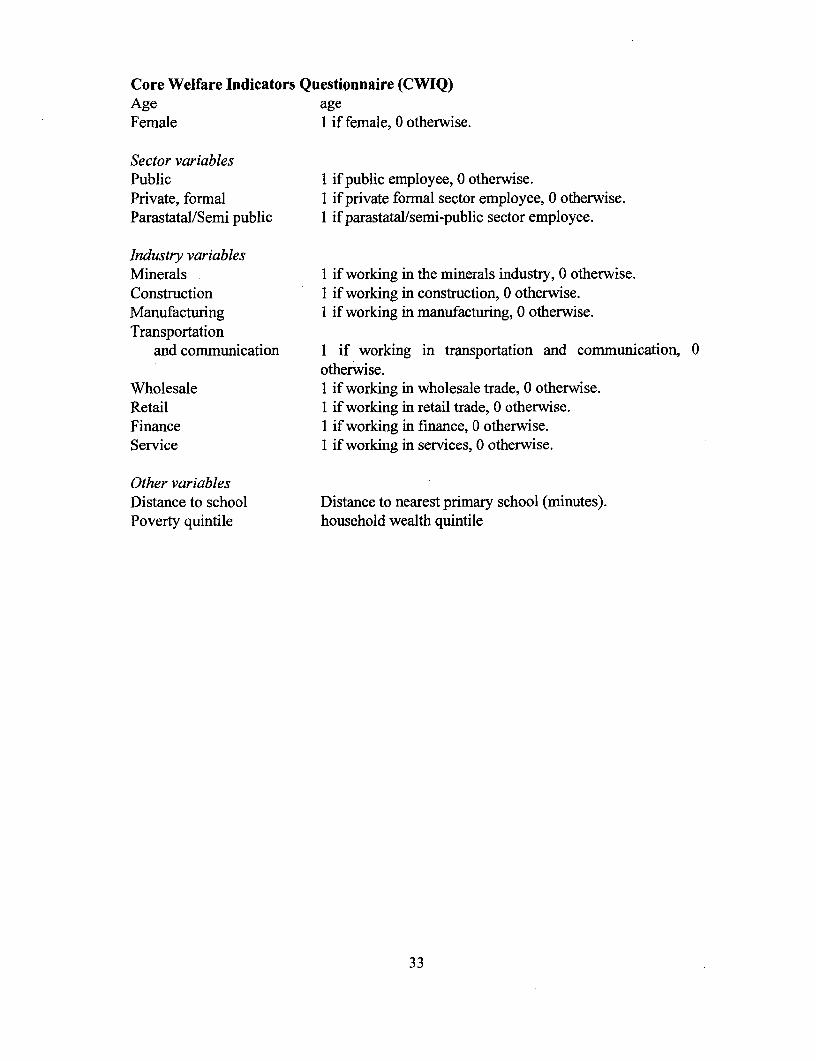
Core Welfare Indicators Questionnaire (CWIQ)Age ageFemale 1 if female, 0 otherwise.
Sector variablesPublic 1 if public employee, 0 otherwise.Private, formal 1 if private formal sector employee, 0 otherwise.Parastatal/Semi public 1 if parastatal/semi-public sector employee.
Industry variablesMinerals 1 if working in the minerals industry, 0 otherwise.Construction 1 if working in construction, 0 otherwise.Manufacturing 1 if working in manufacturing, 0 otherwise.Transportation
and communication 1 if working in transportation and communication, 0otherwise.
Wholesale 1 if working in wholesale trade, 0 otherwise.Retail 1 if working in retail trade, 0 otherwise.Finance 1 if working in finance, 0 otherwise.Service 1 if working in services, 0 otherwise.
Other variablesDistance to school Distance to nearest primary school (minutes).Poverty quintile household wealth quintile
33
Policy Research Working Paper Series
ContactTitle Author Date Oor paper
WPS2391 Are the Poor Protected from Budget Martin Ravallion July 2000 P. SaderCuts? Theory and Evidence for 33902Argentina
WPS2392 What Factors Appear to Drive Private Dipak Dasgupta July 2000 S. CrowCapital Flows to Developing Countries? Dilip Ratha 30763And How Does Official LendingRespond?
WPS2393 Will the Euro Trigger More Monetary Patrick Honohan July 2000 A. YaptencoUnions in Africa? Philip R. Lane 31823
WPS2394 Tax Evasion, Corruption, and the Waly Wane July 2000 H. SladovichRemuneration of Heterogeneous 37658Inspectors
WPS2395 Decentralizing the Provision of Health William Jack July 2000 H. SladovichServices: An Incomplete Contracts 37698Approach
WPS2396 Aid Dependence and the Quality of Stephen Knack July 2000 P. Sintim-AboagyeGovernance: A Cross-Country 38526Empirical Analysis
WPS2397 Verifying Exchange Rate Regimes Jeffrey Frankel July 2000 E. KhineEduardo Fajnzylber 37471Sergio SchmuklerLuis Serv6n
WPS2398 Determinants of Current Account Cesar Calder6n July 2000 H. VargasDeficits in Developing Countries Alberto Chong 38546
Norman Loayza
WPS2399 Managers, Investors, and Crises: Graciela Kaminsky July 2000 E. KhineMutual Fund Strategies in Emerging Richard Lyons 37471Markets Sergio Schmukler
WPS2400 Child Care and Women's Labor Force Monica Fong July 2000 P. SaderParticipation in Romania Michael Lokshin 33902
WPS2401 Telecom Traffic and Investment in Scott J. Wallsten July 2000 P. Sintim-AboagyeDeveloping Countries: The Effects 38526Of International Settlement RateReductions
WPS2402 Debt Management in Brazil: Afonso S. Bevilaqua July 2000 S. BeryEvaluation of the Real Plan and Marcio G. P. Garcia 85178Challenges Ahead
Policy Research Working Paper Series
ContactTitle Author Date for paper
WPS2403 Can the World Cut Poverty in Half? Paul Collier July 2000 E. KhineHow Policy Reform and Effective David Dollar 37471Aid Can Meet InternationalDevelopment Goals
WPS2404 The Distribution of Mexico's Public Gladys Lopez-Acevedo July 2000 M. GellerSpending on Education Angel Salinas 85155
WPS2405 Marginal Willingness to Pay for Gladys Lopez-Acevedo July 2000 M. GellerEducation and the Determinants of Angel Salinas 85155Enrollment in Mexico
WPS2406 How Mexico's Financial Crisis Gladys Lopez-Acevedo July 2000 M. GellerAffected Income Distribution Angel Salinas 85155
WPS2407 Utility Privatization and the Needs of Antonio Estache August 2000 G. Chenet-Smiththe Poor in Latin America: Have We Andres Gomez-Lobo 36370Learned Enough to Get It Right? Danny Leipziger
WPS2408 What Makes Banks Special? A Study Biagio Bossone August 2000 E. Mekhovaof Banking, Finance, and Economic 85984Development
WPS2409 How Did the World's Poorest Fare Shaohua Chen August 2000 P. Saderin the 1990s? Martin Ravallion MC3-556