Embed Size (px)
Citation preview

Document of
The World Bank
FOR OFFICIAL USE ONLY
Report No. 3 504-IN
STAFF APPRAISAL REPORT
INDIA
KANPUR URBAN DEVELOPMENT PROJECT
September 25, 1981
South Asia Projects DepartmentUrban Division
This document has a restricted distribution and may be used by recipients only in the performance oftheir official duties. Its contents may not otherwise be disclosed without World Bank authorization.
Pub
lic D
iscl
osur
e A
utho
rized
Pub
lic D
iscl
osur
e A
utho
rized
Pub
lic D
iscl
osur
e A
utho
rized
Pub
lic D
iscl
osur
e A
utho
rized
Pub
lic D
iscl
osur
e A
utho
rized
Pub
lic D
iscl
osur
e A
utho
rized
Pub
lic D
iscl
osur
e A
utho
rized
Pub
lic D
iscl
osur
e A
utho
rized

CURRENCY EQUIVALENTS
Currency Unit = Rupees (Ks)Rs 1 = US$0.125
US$1 R Rs 8.00
MEASURES AND EQUIVALENTS
1 meter (m) = 39.37 inches
1 meter (m) 2 = 3.28 feet
1 square meter (I) = 10.76 square feet1 cubic meter (m ) = 35.31 cubic feet1 kilometer (km) 0.62 miles1 hectare (ha) = 2.47 acres or 10,000 square meters1 liter (1) = 1.06 quarts liquid or
0.26 gallonslcd = liters per capita per daymld = million liters per day
PRINCIPAL ABBREVIATIONS AND ACRONYMS
DOI = Directorate of IndustriesEWS = Economically Weaker SectionGIC = General Insurance CorporationGOI = Government of India
GOUP = Government of Uttar PradeshRIG = High-Income Group
HUDCO = Housing and Urban Development CorporationKAVAL = [a group of towns]: Kanpur, Agra, Varanasi,
Allahabad, LucknowKDA = Kanpur Development AuthorityKESA = Kanpur Electricity Supply AdministrationKJS = Kanpur Jal Sansthan (city water and sewerage
authority)KNM = Kanpur Nagar Mahapalika (municipal authority)KUDP = Kanpur Urban Development ProjectLIC = Life Insurance CorporationLIG = Low-Income GroupMIG = Middle-Income GroupUNICEF = United Nations Children's FundUP = Uttar PradeshUPJN = Uttar Pradesh Jal Nigam
(State water and sewerage authority)

FOR OFFICIAL USE ONLY
STAFF APPRAISAL REPORT
INDIA
KANPUR URBAN DEVELOPMENT PROJECT
Table of Contents
Page No.
I. BACKGROUND ......... ............... . 1
A. Urbanization Trends in India and Uttar Pradesh. 1B. Urban Policies and Programs in India and Uttar Pradesh 2C. Bank Group Role and Strategy in India's Urban Sector 3D. Kanpur ........... .... . , ......... 4
II. THE PROJECT ..... .. .................... ......... 9
A. Objectives .... .. .. ....... ......... 9B. Main Features .. 9C. Project Description ...................... ..... ..... 11
III. PROJECT COSTS AND FINANCING .. . .. ... 23
A. Cost Estimates . ............................. 23B. Financing .................................. 25
IV. PROJECT MANAGEMENT, ORGANIZATION AND FINANCE .. ........... 26
A. Project Management ... .. . ............ .. .... 26B. Kanpur Development Authority. 27C. Kanpur Nagar Mahapalika . . ....................... 29D. Kanpur Jal Sansthan ................ ....................... 31E. Financial Statements ..... 35
V . PROJECT IMPLEMENTATION ... .. .. .. ....................... . 36
A. Execution ..................... 36Be Implementation Schedule ...... 37C. Procurement and Disbursement ... . .37
D. Accounts and Audits . . ...................... .40
E. Monitoring and Evaluation.. ....... 40F. Supervision . ........... .. .. .......... ........... 40
VI. COST RECOVERY, PRICING AND AFFORDABILITY .. 40
A. Cost Recovery ...... 40B. Pricirng . . . ................................................ 43C. Affordability ............................................. 44
This report is based on the findings of an appraisal mission which visitedKanpur in February 1981. The mission comprised Messrs. C. Godavitarne,K. Willen (IDA), A. Bertaud and G. Sengupta (Consultants).
| This document has a restricted distribution and may be used by recipients only in the performance of Itheir official duties. Its contents may not otherwise be disclosed without World Bank authorization.

- ii
Table of Contents (Continued) Page No.
VII. PROJECT JUSTIFICATION .. .... ............... 46
A. Economic Evaluation ,... .. . ................... 46
B. Risks ..... @ ........... ,........ . .... 48
VIII. AGREEMENTS REACHED AND RECOMMENDATIONS ....................... 49
TABLES
2.1 Main Project Components and Costs ...................... 103.1 Summary Costs .................... ............. ......... 243.2 Financing Plan ................................. 25
3.3 Annual Capital Expenditure Plan .......................... 26
5.1 Estimated Disbursement Schedule ... ........................., 39
6.1 Sites and Services: Plot Options, Costs,Indicative Charges, and Affordability ........... 45
6.2 Slum Upgrading: Plot Sizes, Costs, Indicative Charges,and Affordability ............ OO ..... ............ 45
ANNEXES
I Summary of UNICEF-sponsored Urban Community Development ProjectTable 1: Projected Urban Population Growth in Uttar Pradesh
2 Table 1: Sites and Services: Summary of Land Use (Percentages)Table 2: Sites and Services: Residential Plot DistributionTable 3: Sites and Services: Standards and Specifications for
InfrastructureTable 4: Sites and Services: Details of Small Industry PlotsTable 5: Solid Waste Management Component: Detailed Cost EstimatesTable 6: Details of Technical AssistanceTable 7: Sites and Services: D'etailed Cost EstimatesTable 8: Slum Upgrading: Detailed Cost EstimatesTable 9: Environmental SanLitation, Maintenance and Traffic
Management Measures: Detailed Cost EstimatesTable 10: Technical Assistance and Institutional Strengthening:
Detailed Cost Estimates
Table 11: Urban Poverty Impacts
Chart 1 Slum Household Income DistributionChart 2 Project Impact on Growth of Unserviced Households in KanpurChart 3 Flow of FundsChart 4 Project Implementation Schedule
Sketch: Sites and Services: EWS Plot Options

- iii -
ANNEXES (Continued)
3 Kanpur Development Authority - Organization ChartKanpur Nagar Mahapalika - Organization ChartKanpur Jal Sansthan - Organization Chart
Table 1: Kanpur Development Authority: Statement of Receipts andPayments (with Projections)
Table 2: Kanpur Nagar Mahapalika: Statement of Receipts and PaymentsTable 3: Kanpur Jal Sansthan: Statement of Receipts and PaymentsTable 4: Kanpur Development Authority: Capital Investments
4 Tables 1-4: Kanpur Jal Sansthan: Operational Targets
5 Selected Documents and Data Available in Project File
MAP S
1 IBRD 15671K: Location of Slum Upgrading and Sites and Services2 IBRD 15672R: Barra Sites and Services - Layout3 IBRD 15673R: Pokharpur Sites and Services - Infrastructure Details4 IBRD 15674R: Typical Slum Upgrading Layout: Gwaltoli No. 12/480


STAFF APPRAISAL REPORT
INDIA
KANPUR URBAN DEVELOPMENT PROJECT
I. BACKGROUND
A. Urbanization Trends in India and Uttar Pradesh
1.01 India is primarily an agricultural country with about 80% of itspeople living in rural areas. Total population is estimated at 683 millionaccording to provisional 1981 census figures. Due largely to migration, theurban population, over the period 1971-1981, has been growing at a higherannual rate (3.3%) than the general population (2.2%). About 4.5 millionpeople per year are being added to urban areas, creating demands for shelter,infrastructure services, and employment. About 50% of the urban populationlive in the more than 135 medium-sized cities with populations between 100,000and 1 million, while about 25% live in ten cities with more than 1 millionpeople each. Urban growth is more pronounced in the medium-sized cities,averaging about 6% annually, and by the year 2000 more than 40 cities in Indiaare expected to exceed 1 million in population. According to IDA estimates,the absolute urban poverty income level was about Rs 88/capita/ month in 1980in India (Rs 485 or about US$61 equivalent per month per household). About41% of urban households had incomes below this level.
1.02 Uttar Pradesh (UP) is India's most populous state, with an estimatedpopulation of about 110 million according to the provisional 1981 census. Itis also one of India's poorest states, with an annual per capita income ofabout Rs 1,000 (US$125), which is about 30% below the average for India. The1971 census indicates that agriculture dominates the UP economy, with 86% ofthe population residing in rural areas, 75% of all workers engaged in agricul-ture, and over 50% of total output arising from agriculture. Industry accountedfor less than 12% of state income in 1977-78. In terms of output and employ-ment, agricultural processing industries remain the state's most importantindustrial sector, followed by the engineering and textile industries. Despitethe slow growth in traditional industries, light engineering and chemicalsindustries have been growing much more rapidly than the average and now accountfor a significant proportion of output and employment in the UP organizedsector.
1.03 Urban growth in Uttar Pradesh has gained momentum in the last twodecades. The 1971 census indicated an urban population of 12.4 million, or14% of the total state population. The growth rates of urban population duringthe decades 1951-61 and 1961-71 were 0.9% and 2.7%, respectively, and thistrend is continuing. The provisional 1981 census indicates that 18% of the UPpopulation lived in urban areas, reflecting an urban population growth of 4.9%per year for the period 1971-81. The 1971 figures show that, out of a totalof about 290 cities and towns distributed fairly evenly throughout the state,22 cities had populations of 100,000 or more. The projected growth in urbanpopulation is unevenly distributed, with over 40% going into cities withpopulations of 100,000 or more (Annex 1, Table 1). The urban migration is

- 2 -
typically by low-income agriculture groups, primarily because of fragmentationof rural holdings, surplus rural labor force, and fluctuations in agriculturalproduction. Approximately one-third of Uttar Pradesh's urban population isconcentrated in the five largest cities, Kanpur, Agra, Varanasi, Allahabadand Lucknow, referred to as KAVAL towns, with 1981 populations conservativelyestimated at 1.7, 1.0, 0.8, 0.8 and 0.7 million, respectively.
B. Urban Policies and Programs in India and Uttar Pradesh
1.04 While responsibility for formulation and implementation of urbandevelopment programs in India rests with state governments and local bodies,overall development policies and strategies are influenced by objectives laiddown in the national five-year plans. Planned urban development did notreceive any particular attention by the Government of India (GOI) until the1960s. The Third and Fourth National Five-Year Plans, 1961-66 and 1969-74were aimed at control of urban land values, land use planning, standards forhousing and other services, and strengthening of municipal administrations.The Fourth National Plan recommended the enactment by state governments ofcomprehensive Town and Country Planning Acts. Also, it stressed the need forpositive steps to prevent unrestricted growth of metropolitan areas, by abalanced regional approach to urbanization. These objectives were furtheremphasized in the Fifth National Five-Year Plan, 1974-79, and the need forintegrated development of urban settlements and of improving the housing con-ditions of the urban poor was highlighted. The Sixth National Five-Year Plan(1980-85) stresses the need for providing affordable shelter to the urbanpoor, safe water supply and adequate sanitation. To achieve these objectives,particular attention would be given to, inter alia, modification of existingby-laws, land use controls and minimum plot size requirements. Efforts wouldalso be made to address problems of slums by improvement and upgrading ratherthan by relocation, to maintain easy access to employment centers and avoiddestruction of existing housing stock, however substandard it may be. Con-tinuing efforts would also be made to curb migration from rural areas to largecities, by distribution of economic and job opportunities in such a way thatexpansion takes place in medium-sized cities and small towns. Various planobjectives reflect a growing concern about achieving consistent urban policiesat the national and state level,
1.05 In terms of central funding of urban programs, GOI made a seriouseffort in the early 70s to begin tackling urban deterioration in larger metro-politan areas, by direct financial assistance to Calcutta. Similar effortsin Bombay and Madras followed. Also, a National Minimum Needs Program wasintroduced under the Fifth National Plan, including emphasis on provisionfor improvements in the environment of urban slums. Mention should also bemade of the Housing and Urban Development Corporation (HUDCO), a Governmentof India (GOI) enterprise set up in 1970. HUDCO is funded by GOI allocationsand market borrowings mainly from the Life Insurance Corporation (LIC) and theGeneral Insurance Corporation (GIC). Its mandate is to advance loans to stategovernment undertakings for housing and urban development programs. ThroughFY1979/80, total HUDCO loan commitments were about Rs 5,550 million (US$694million), corresponding to, inter alia, a nationwide sanction of about 620,000residential dwellings and about 31,600 sites and services plots. About 65% of

- 3 -
houses sanctioned by HUDCO are for Economically Weaker Section (EWS) familieswith incomes less than Rs 350 per month, and another 32% are for Low IncomeGroup (LIG) families with incomes between Ks 350 and Ks 600 per month. Totalloan sanctions in FY1980/81 are expected to be about Ks 890 million (US$111
million). About Rs 6,000 million (US$750 million) would be available fromHUDCO in the 1980-85 plan period for urban development.
1.06 Successive Uttar Pradesh (UP) State plans have stressed the impor-tance of power, rural development and agriculture sectors. The 1978-83 UPState Plan provided a modest 2.8% (Rs 2,160 million) of the total Plan's
allocation of Rs 77,500 million (US*9,688 million) for urban investments,
comprising Rs 1,510 million for water supply and sewerage, Rs 350 millionfor other infrastructure and Rs 300 million for housing. HUICO funding of
housing programs is classified as non-plan expenditure.
1.07 The relatively low priority accorded to urban development at the
national and state level results from the policy of encouraging rural develop-ment, with the growth of small- and medium-sized towns and the creation ofindustrial centers in special growth zones identified as a means to containurban migration to large urban areas. Heanwhile, urban service deliverycontinues to deteriorate, creating adverse effects on the urban economy andon the welfare of the population, especially for the urban poor. The absenceof shelter and other urban services affordable to the poor has created newpressures requiring the adoption of hitherto unconventional approaches.The effects of rent control and the Urban Land Ceiling Act have severelyconstrained private sector participation in development. The fiiiancialresources of municipalities are inadequate to provide a reasonable level ofservices, which continue to deteriorate. Urban management is so weak thatwhile current fund allocations are inadequate to respond to actual urbanneeds, the absorption capacity for increased allocation is limited.
1.08 However, there is now wide recognition among national policy makersand those in UP of the need to strengthen urban management and finance andreorient investments to benefit the majority of the urban poor. In UP, newinitiatives have been adopted to provide minimum basic needs through slumimprovement, water supply and sanitation and sites and services developmentsand EWS shelter programs with HUDCO's assistance.
C. Bank Group Role and Strategy in India's Urban Sector
1.09 In India, there are six urban projects assisted by the Bank Group.The First Calcutta Urban Development Project (Cr 427-IN, 1973/74-1978/79,US$35 million) supported a broad program of urban infrastructural works tomeet the most urgent needs of the metropolis, and measures to begin urbaninstitutional and financial reform. The Second Calcutta Urban DevelopmentProject (Cr 756-IN, 1977/78-1981/82, US$87 million) covers a large numberof sectors, including components directly aimed at low-income groups suchas area development, slum improvement, primary education, health care, and
small-scale enterprises. It also continues the support of institutional and

- 4 -
fiscal reform, and lays the foundation for formulation of a long-term urbandevelopmenit plan for Calcutta. The First Madras Urban Development Project( 68711N. 1977/78-1981/82, US$24 million) supports strengthening of metro-polLtan planning and capital programming, and includes low-cost investmentsin shelter and infrastructure services. The Second Madras Urban DevelopmentPro!ect (Cr 1982-IN, 1980/81-1984/85, US$42 million) supports continuedre-orientation of shelter and infrastructure investments for the benefit ofthe urban poor, and provides continued support for effective metropolitanplanning. The latter two projects include rather substantial support of.llrbani transport, which also is the direct focus of the Bombay Urban Transport
Proiect (Ln. 1335-IN, 1977/78 - 1982/83, US$25 million) and the Calcutta UrbanTransport Project (Cr 1033-IN, 1980/81-1983/84, USE56 million). These projectsassist in improving the quality and quantity of mass transport services inBombav (buses), Madras (buses), and Calcutta (buses and trams), by providingfor investments in public transport facilities and traffic engineering measures,and supporting institutional and productivity improvements. Finally, in thespeciFic context of UP, the Uttar Pradesh Water Supply and Sewerage Project(Cr 585-1N, 1977/78-1981/82, US$40 million), now nearing completion, supportswater supply and sewerage schemes in the five KAVAL towns, as well as about300 subproiects in rural areas.
1.10 The Bank Group's strategy in the urban sector, as reflected in thedesign of all these projects, has been to support GOI's and state governments'recognition of the need for the rapid expansion of service programs whichmaiDly focus on improved efficiency in the urban economy and on the needs ofurban low-income groups and the continued reorientation of these programstoward low-cost replicable service systems. The strategy also focuses onstrengthening of local institutions, in support of their efforts to sustainand expand their programs.
D. Kanpur
Perspective and Economy
i.1.1 With an estimated 1981 population of about 1.7 million, Kanpuris the eighth largest metropolis in India, and Uttar Pradesh's largest andmost important industrial city. The population increased in the 1970s at adecennial rate of 32.2% (2.8% p.a.), against 25.8% (2.3% p.a.) in the districtan2 19.8% (1.8%o p.a.) in the state. The K2npur district area is about 6,12Ukm of which Kanpur occupies about 300 km . The district's total populationis estimated at about 4 million, of which 58% live outside the city in 2re-dominantly rural areas. Population density is about 490 persons per km inthe dilstrict and 4,300 in the city.
1.JL 2anpur's industrial base was laid in the mid-1800s with the estab-listymeut of cotton and wool textile mills. Leather tanning and leather makingindustries followed. World War II caused a large increase in demand forKanp-ur's products. After Independence, a large fertilizer factory and severalaf-oaments factories were added. Light engineering such as rerolling, casting,

- 5 -
manufacture of agricultural implements, bicycles, chemicals, paints, varnishand other miscellaneous items dominate Kanpur's small-scale sector. In theearly 1970s, the Kanpur district accounted for 70% and 41% of the net valueadded in the cotton textile and leather industries in the state, respectively.Overall industrial growth has declined in the post-war period, yet in 1977Kanpur accounted for about 15% of the total employment and output in thestate's organized manufacturing sector, as well as a significant proportionof the informal small-scale production sector.
1.13 Economic conditions continue to remain stagnant, reflecting nationaltrends for the traditional industries. The very slow growth in UP's agricul-tural sector contributes to the lack of a buoyant market for consumer goodssuch as textiles and leather products. Successive state plans stress theimportance of small-scale and "tiny" enterprises, generally in the informalsector. Their contribution to employment is clearly significant, though theirshare of total industrial output is less than 30% in UP.
1.14 According to the 1971 census, 35.5% of the working population ofapproximately 380,000 in Kanpur was employed in industry and more than 60% wasemployed in trade, commerce and other services. The annual per capita incomeof Kanpur was estimated at Rs 860 (US$104 equivalent) in 1978 compared withRs 817 (US$98) for the state as a whole. About 45% of Kanpur's population,or about 800,000 persons, belong to households in the economically weaker sec-tion, with a monthly income of Rs 350 (US$44) or less per household in 1979.
Institutions
1.15 The main agencies responsible for urban services are the KanpurDevelopment Authority (KDA), the municipal authority or the Kanpur NagarMahapalika (KNM), the water and sewerage authority or the Kanpur Jal Sansthan(KJS) and the Kanpur Electricity Supply Administration (KESA).
1.16 KDA's investments have been steadily increasing over the past yearsto about Rs 40 million in 1979. Over the years, the functions of KNM havebeen pruned, transforming it largely into a maintenance organization. State-wide planning and execution of water supply and large sewerage works wascentralized in 1975 under a State Water Supply and Sewerage Corporation, UPJal Nigam (UPJN), supported by Cr 585-IN (para 1.09). Corresponding respons-ibilities for operation and maintenance were then successively transferredfrom local bodies to local water and sewerage authorities, Jal Sansthans.KJS is one of the five Jal Santhans. KDA lacks the capability for financialanalysis, cost control of projects and forward planning and budgeting. KNMoperations currently suffer from many organizational and financial problems.KJS is operating under severe constraints resulting from inadequate staffing,operating funds, accounting, billing and collection. Further details of KDA,KNM and KJS are given in Chapter IV.
1.17 KESA is responsible for electricity generation and distribution inKanpur. Unreliability and frequent interruptions to the supply have resultedin some larger industries either generating their own power or having standbyfacilities. The present consumption pattern indicates that 75% of powergenerated by KESA is used by industries.

- 6-
Environmental and Health Conditions
1.18 Environmental and health conditions in Kanpur are widely regardedas much worse than in other cities in the state, and indeed in India. Infra-structure facilities have not been significantly expanded in the recent decades,and poor maintenance of existing infrastructure has rendered much of existingservices unusable. About 47% of Kanpur households live in slum areas and"ahatas"--which are privately owned slum compounds--in extremely overcrowdedand unhygienic conditions, with virtually no access to basic sanitation.The health of the population, especially in slum areas, is at a low level,with a high incidence of waterborne and communicable diseases, such as gastro-enteritis, cholera, hepatitis and skin, eye and throat ailments. Kanpur hasthe highest incidence of tuberculosis in India with an estimated 60% ofchildren in slum areas affected by the disease. The 1965 figures indicatean extremely high infant mortality rate, 249 per 1,000 live births. 1/ Smokeand gas emissions from factories and the discharge of toxic effluents fromtanneries and textile mills may have a direct connection to the malaise.Thirty percent of the slum population has been classified as being "con-tinuously sick" and it is estimated that the average absenteeism among indus-trial workers runs as high as sixty days per year per worker.
Status of Basic Urban Services
1.19 Housing. Migration of labor to Kanpur has generated housing demands,particularly in the two last decades, which have not been adequately met. Ofabout 340,000 households in Kanpur, about 160,000 are estimated to be livingin slum conditions. A recent survey indicates that about 67% of total house-holds live in single rooms. Many people live in crowded conditions in rentedrooms in ahatas (slums on privately owned land) that are small in area andvolume, have limited access to water, and lack basic sanitation and otherservices. About 30,000 households living in slums on publicly-owned land havereceived basic services under the GOI-initiated 'minimum needs program' com-menced in 1972. This is a grant program with no tenure or cost recovery, andthe improved slums quickly fall back to their original state due to lack ofmaintenance. The ahatas in the central core have received no services, due tolegal restrictions of entering upon private land. Yet people have continued tocrowd into existing substandard dwellings under extremely unhygienic conditions.
1.20 The ahatas are on well located land, and starting in 1968 the thendevelopment wing oF the KNM acquired a number of ahatas with a view to redevel-oping them as commercial areas. However, due to difficulties of relocation,these plans have not been implemented. Owners of ahatas have little incentiveto upgrade or redevelop them. The UP Slum Areas (Improvement and Clearance)Act 1962 provides protection to tenants against eviction. Private sectorinvestments in shelter are generally minimal and nonexistent for low costshelter. The Rent Control Act and the Urban Land Ceiling Act act as disincen-tives to private sector shelter investments. Planning regulations discriminate
1/ Upper Volta had the highest infant mortality rate of 263/1,000 in 1960,according to World Development Report, 1980.

against private developers, especially with regard to minimum plot sizes,permissible under the public sector schemes. The burden of shelter provisioncontinues to rest in the public sector schemes. Within the resources availableto the public sector, there is little hope of meeting this demand. Any long-term effort at solving the shelter problem should count on private sector par-ticipation, and this will only occur when sufficient incentives are provided.
1.21 New household formation in Kanpur is estimated at about 10,000families per year of which about 50% are EWS households. Previous effortsmainly by KDA to increase the supply of adequate shelter for various economicgroups have been insufficient. Since its establishment in 1974, KDA hasprovided about 6,400 new housing units, of which about 3,300 were for theEWS group. An additional 5,400 units are currently under construction. KDAtook significant initiatives in 1978 to correct the serious imbalance in theprovision of shelter for low-income groups, increasing the proportion ofinvestments in shelter for this group. With the assistance of the state andHUDCO, the delivery by KDA of shelter to EWS households was increased to about1,800 annually by 1980, compared to an annual demand estimated at 5,000 newunits for this income range.
1.22 KDA has completed a pilot sites and services scheme comprising 860plots. This scheme was developed with financial assistance from HUDCO. Twoother sites and services projects comprising about 1,220 plots, also assistedby HUDCO, commenced in late 1979, one of which is nearing completion. Thepilot scheme has been popular and has been completed at an average cost ofRs 2,700 (US$340 equivalent) per plot including a core unit. These schemesare specifically designed to meet the needs and affordability of EWS. Untilthe inception of these programs, any housing project aimed at EWS familieshad to be heavilv subsidized. The new concept of incremental housing throughsites and services has been accepted by the state, and KDA plans to increaseits investment in sites and services. However, the gap between annual formalsector shelter delivery and new household formation is about 7,000 units.Growth of EWS households is estimated at an annual rate of about 5,000 house-holds. Substantial expansion in the program would be required to accommodategrowth and to eliminate the shelter backlog estimated at about 60,000 units.
1.23 Water Supply. About 80% of present water production for domesticrequirements is drawn from the River Ganga, and the balance from tubewells.During the past year a 20-22 hour supply has been maintained for some zones.Total production averages about 230 mld. The water distribution network, whichis mostly over 50 years old, has incomplete coverage and is inadequate forcurrent demands. Unaccounted for water is estimated at about 40%. About 50%of Kanpur's population is served by direct water connections. The remainderdepends on water supplies from about 2,500 public standposts, and to a lesserextent on shallow wells. About 50 households share supplies from each stand-post at an average consumption estimated to be about 30 lcd, compared to acity-wide average from all sources of about 125 lcd. Under the UP Water Supplyand Sewerage Project (Credit 585-IN), 42 new tubewells would be installed toincrease the installed capacity to about 385 mld by 1982. However, additionalimprovements to the zonal pumping stations, the distribution network and

- 8 -
reduction of wastage and leakage will be required to achieve an equitabledistribution of the improved water supply in Kanpur and would have priorityover further capital investments in sources of supply.
1.24 Sewerage. No central sewage treatment facilities exist in Kanpur.Raw sewage is either discharged directly into the Ganga, or mixed with riverwater for irrigation on a sewage farm of about 3,100 ha. The existing trunksewer network covers the central area of Kanpur, but is underutilized al-though branch sewers cover about 40% of the municipal area. Actual connec-tions serve only about 10% of the total population. Trunk sewers as well asbranch sewers are old, and the latter are partly blocked with silt and solidwastes and have inadequate flows. Additional connections take place onlyto a limited extent because of high hook-up charges and lack of efficientenforcement. Thus, about 600,000 persons depend on badly maintained publicconveniences or have no means of sanitation. About 400,000 persons dependon septic tanks, and about 580,000 persons are served by bucket latrines.
1.25 Stormwater Drainage. Thirteen main drainage outfalls (nallas) takestormwater north to the River Ganga and three south to the River Pandu (MapIBRD No. 15671R). These nallas also carry considerable amounts of sullageand sewage. Design capacity of all the outfalls is sufficient, but lack ofmainteniance has reduced their efficiency, requiring desilting, regrading,and widening in places. Collector drains in developed areas are inadequatein number and not functional due to blockage by silt and garbage. Slum areaswithout proper stormwater drainage become essentially flood storage basinsduring the monsoon, since many dwellings are constructed out of excavatedearth from within the plinth area.
1.26 Solid Waste Management including Night Soil Collection. Refusecollection in Kanpur is generally satisfactory, except in the central area.About 900 tons of refuse is generated daily, of which about 30% is notcollected. About 5% of refuse comprises food, leaves, vegetables and otherorganic matter which provides food for cattle and dogs that roam the streets.The remainder of uncollected refuse litters slum areas, drains and backyards,where people pick recyclable material. Part of the collected refuse istreated in a composting plant commissioned in 1980, with a design capacityof about 350 tons per day, and the balance is dumped and spread in depressedland areas near the outskirts of the city, in a highly unsatisfactory manner.Night soil collection in the city is also inadequate. It is estimated thatonly about 15,000 liters out of 375,000 liters of human waste generated dailyfrom unsewered areas of the city are collected by KNM. A further 190,000liters are collected by private sweepers and deposited in authorized collectiondepots. An estimated 85,000 liters/day of night soil from bucket latrines aredumped by private collectors and householders in open drains, while another85,000 liters/day from households with no toilet facilities are estimated tobe found in open areas. Seventeen pail depots exist, but nightsoil is ille-gally dumped in open channels and down manholes. The inadequate collectionof refuse and night soil seriously affects the proper functioning of storm-water drains and sewers in the central area of the city.

-9-
1.27 Roads, Traffic Management, and Street Li.ght:ing- Kanpur has a reason-ably adequate road network, constituting about 12%0 of the developed areas ofthe city. Two-hundred-and-fifty kilometers of the ci-ty-roads are surfaced; afurther 350 km consist of narrow roads with various standards of construction,mainly used for pedestrian access. While roads proper are comparatively wellmaintained, drains and sidewalks are not fully functional. They are poorlymaintained, with manhole covers and pavement slabs often missing, and encroach-ments by hawkers with temporary structures are common. Such conditions oftenmake the use of sidewalks impossible, and pedestrians generally use thecarriageway, in competition with other modes of traffic.
1.28 Bicycles are the dominating mode of traffic, representing over75% of all vehicles on Kainpur roads and about 50% of the peak hourly volume.The total slow moving vehicles--including also cycle rickshaws and hand andox-drawn carts--comprise about 90% of traffic and 83% of peak traffic, notconsidering the spillover into road space of pedestrians. Existing trafficproblems in Kanpur, particularly in the central area, are characterized byconflicts between fast and slow moving modes of traffic, exacerbated by undis-ciplined road user behavior, encroachment, and inadequate traffic enforcementand management. A first step solution should focus on enhanced enforcementand development of improved traffic management and circulation schemes; yetno traffic management and engineering function exists in the Kanpur NagarMahapalika.
II. THE PROJECT
A. Objectives
2.01 The main objective would be to increase the supply of serviced landto the poor through the provision of low-cost serviced residential and smallbusiness plots and to address the worst environmental conditions prevailingin the privately-owned ahatas and other slum areas in and around the centralcore of the city. Transfer of land ownership to beneficiaries and the phasedconstruction of dwellings would be a cornerstone of this approach. The reduc-tion and elimination of direct subsidies inherent in the ongoing "minimumneeds program" and other shelter programs would be pursued. Full cost recoveryof allocable costs in the sites and services and slum upgrading componentswould be aimed at, to enable replication of project features. The secondobjective of the project would be to strengthen key urban institutions inKanpur, particularly management and financing of service delivery. The thirdobjective would be to develop a strategy for state-wide urban development andmanagement. Implementation of the recommendations of already initiated insti-tutional and financial studies for KNM and KDA early in the project implemen-tation period is envisaged.
B. Main Features
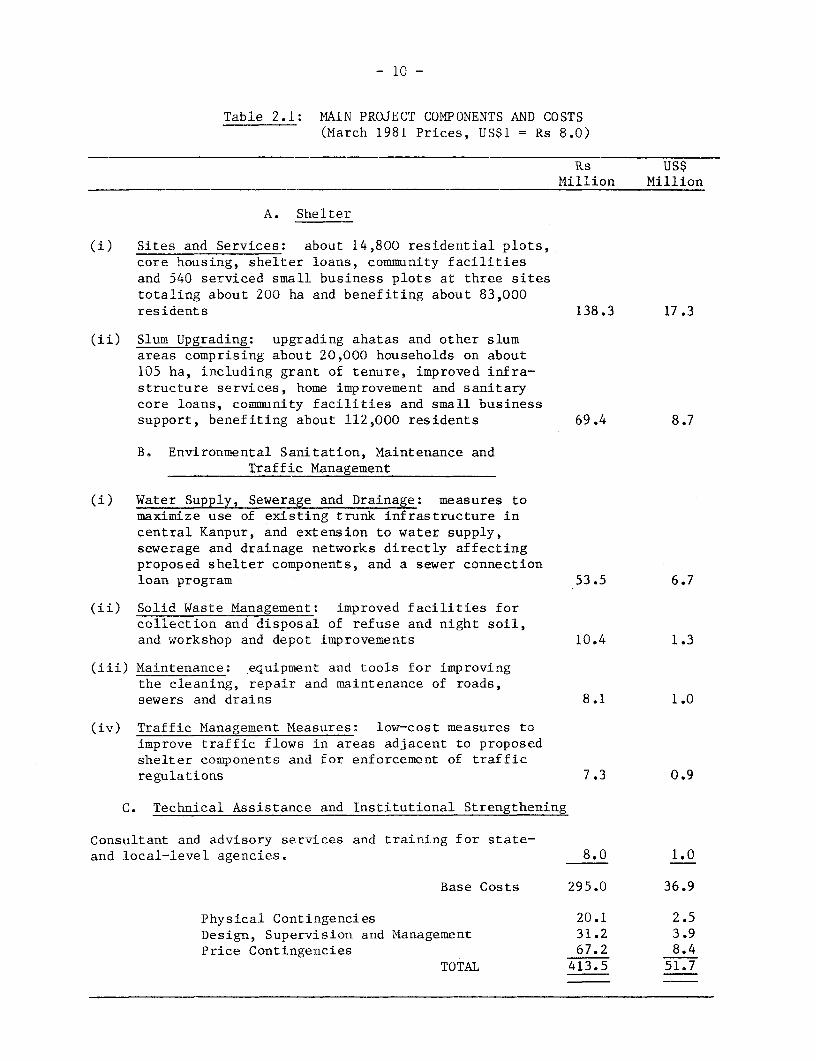
2.02 The main project components and costs are as shown in Table 2.1.
- 10 -
Table 2.1: MAIN PROJECT COMPONENTS AND COSTS(March 1981 Prices, US$1 = Rs 8.0)
Rs US$Million Million
A. Shelter
(i) Sites and Services: about 14,800 residential plots,core housing, shelter loans, community facilitiesand 540 serviced small business plots at three sitestotaling about 200 ha and benefiting about 83,000residents 138.3 17.3
(ii) Slum Upgrading: upgrading ahatas and other slumareas comprising about 20,000 households on about105 ha, including grant of tenure, improved infra-structure services, home improvement and sanitarycore loans, community facilities and small businesssupport, benefiting about 112,000 residents 69.4 8.7
B. Environmental Sanitation, Maintenance andTraffic Management
(i) Water Supply, Sewerage and Drainage: measures tomaximize use of existing trunk infrastructure incentral Kanpur, and extension to water supply,sewerage and drainage networks directly affectingproposed shelter components, and a sewer connectionloan program 53.5 6.7
(ii) Solid Waste Management: improved facilities forcollection and disposal of refuse and night soil,and workshop and depot improvements 10.4 1.3
(iii) Maintenance: equipment and tools for improvingthe cleaning, repair and maintenance of roads,sewers and drains 8.1 1.0
(iv) Traffic Management Measures: low-cost measures toimprove traffic flows in areas adjacent to proposedshelter components and for enforcement of trafficregulations 7.3 0.9
C. Technical Assistance and Institutional Strengthening
Consultant and advisory services and training for state-and local-level agencies. 8.0 1.0
Base Costs 295.0 36.9
Physical Contingencies 20.1 2.5Design, Supervision and Management 31.2 3.9Price Contingencies 67.2 8.4
TOTAL 413.5 51.7

1 Ii -
2.03 Total average costs per household, includiing costs for communityfacilities, on- and off-site irnfrastructure, building materials/home improve-ment loans, design, supervision and management charges and physical contin-gencies for the sites and services aInd slum upgrading components would beRs 10,850 (US$1,360) and Rs 3,900 (US$490), respectiveljl.
2.04 The annual supply of affordable EWS shelter through the sites andservices program would increase from about 1,800 to 2,500 units per year. Theslum upgrading program would affect about 5,000 households per year. Together,the two programs would help contain the growth of slums during the projectperiod (Chart 2, Annex 2). By continuation and expansion of the programsfurther reduction of slum areas could be achieved. The institutionalstrengthening programs commenced under the project would enable KDA, KNM andKJS to better service the needs of Kanpur residents.
Community Development
2.05 UNICEF would collaborate with GOUP and IDA for implementation ofa valuable and essential support activity of the project, namely, communitydevelopment. UNICEF has reachled agreement with GOI and the Government ofUttar Pradesh (GOUP) for assistance for the Urban Community DevelopmentProject (Kanpur) to be implemented concurrently with the proposed project. Itwill provide education, health, nutrition, employment generation and communitydevelopment facilities in the project areas with emphasis on women and children,The project cost is estimated at about Rs 3.5 million (US$0.4 million equiva-lent). IDA has collaborated with UNICEF in the preparation of this projectthrough joint missions, and coordination throughout project execution will bemaintained. Further details are given in Annex 1.
C. Project Description
Sites and Services
2.06 Three sites located within 3.5 km to 6 km of the city center (MapIBRD 15671R) would be developed to provide about 14,780 residential plotsand about 540 small-business plots. They are Barra (8,359 plots), Gujaini(5,658 plots) and Pokharpur (760 plots), totaling about 200 hectares. Siteshave been selected on the basis of proximity to employment opportunities,availability of trunk infrastructure, existing residential development andstatus of land acquisition. The sites are also within a 20 minute cyclingdistance of the city center--an important consideratiorn in view of thedominant role of the bicycle and cycie rickshaw as popular modes of trans-portation in Kanpur. All land for the component has been acquired.
2.07 The Barra site (187 ha), located south of the city, is 5 km fromthe city center. Only 123 ha would be developed in the first phase under theproject. The Guja.ini site (74 ha) is within 1 km of Barra and located 3.5 kmfrom the city center, Both sites have access to existing roads and wouldhave access in future to the city bypass under construction, Power supply isavailable and adjacent to both sites. City water and sewer networks are not

- 12 -
available to serve the two sites. The Pokharpur site (6 ha) is located eastof the city center close to the tanneries. Water, sewer and electricitynetworks are available adjacent to the site.
Site Layout and Land-use
2.08 Layouts for the three sites have been finalized. The design ensuresthe most effective use of land and infrastructure (see IBRD Maps 15672R and15673R). Most of the smaller residential plots would have pedestrian accessonly. Vehicular access would be limited to primary and secondary roads,providing access to within about 60 m of every plot. Plots are distributed insuch a manner that the larger residential plots, commercial and small-businessplots would have vehicular access. The locational and service advantages ofthese plots would be taken into account for differential pricing of land. Atypical cluster type layout has been adopted giving an average net density ofabout 800 persons per ha. About 66% of the land would be marketable, about25% would be allocated to circulation, and about 9% to open space as indicatedin Annex 2, Table 1.
Plot Sizes and Plot Development
2 2 2 22.092 Five residential plot sizes of 37 m , 58 m , 81 m , 180 m2 and300 m , would be provided. The residential plot distribution by site is shownin Annex 2, Table 2. About 68% of the residential plots in Barra ayd Gujainiand 75% of residential plots in Pokharpur would constitute the 37 m plot size,designed for families with incomes les2 than Rs 350 per month (EWS). Fouroptions would be available in the 37 m plot based on varying on-plot develop-ment. There will be no on-plot development on the low-income group (LIG),middle-income group (MIG) anj higher-iecome group 2HIG) plots. LIG plotswould be of two sizes: 58 m and 81 m . The 58 m plots would have locationaladvantages such as being corner plots facing open spaces and fronting 4.5 mand 7.5 m roads.
2.10 On-Site Infrastructure: Due to existing soils conditions and thelarge number (70%) of small plots, low-cost sanitation systems are not suit-able. Water and sewer networks would be laid to the boundaries of all plotsat the time of initial construction. This approach would avoid costly anddestructive road cuttings, and encourage maximum utilization of the installednetworks, 1/ Water and sewer connections would be made to the sanitary coreson the EWS plots only, with two plots sharing one inspection chamber. Ownersof other plots would effect connections, which do not form part of the project,by application to KJS. Most smaller plots would face 3.5 m and 4.5 m walkwayssurfaced with brick-on-edge pavements. 2/ Larger plots would face rights-of-way ranging from 7.5 m to 18 m which would have a single lane 3.7 m wide with
1/ One of the reasons for the constant blockages in the Kanpur sewer systemis the lack of sufficient flows to effect adequate self-cleansing of pipes.
2/ Stone aggregate is not available in the Kanpur areas. Brick is mostlyused due to the abundance of clay.

- 13 -
bituminous macadam surfacing. For rights-of-way (ROW) greater than l m con-stituting a main access, spine road or bus route, two-lane surfaced carriagewayswould be provided. Street lighting would be provided throughout accesswaysand bus routes. Electricity networks to permit individual domestic supply
would be provided under the project, but connections would be made by KanpurElectricity Supply Administration at the request of beneficiaries and wouldnot be included in the project. Concrete refuse bins would be located onaccess ways within easy reach of all plots. Tree planting would also be under-taken. Service standards for infrastructure are given in Annex 2, Table 3.
2.11 Off-Site Infrastructure: Both Barra and Gujaini would be providedwith independent water supply and sewage disposal facilities. Barra would beprovided with five on-site tubewells each about 300 m deep, along with twoservice reservoirs. Gujaini would be provided with three on-site tubewells ofabout the same depth, with one service reservoir. Both will operate indepen-dent of the city water supply system. Each site will have stabilization pondsfor sewage treatment. The ponds will discharge to the river Pandu.
22.12 The smallest plot of 37 m alone would be provided with four alter-native on-plot developments. The options range from a bare plot with asanitary core, to a completed room with sanitary core, courtyard walls anashelter loans as indicated in Sketch, Annex 2. The provision of courtyardwalls facilitates quick and simple expansion of dwellings to suit individualrequirements. Plot options in the EWS category would be as follows:
EWS 1: Plot with sanitary core without roof. optionalshelter loan of Rs 1,500 I/ for self-help firstroom construction for all beneficiaries.
EWS 2: Plot with anitary core without roof, common wallsfor 21.8 m room with no roof or shutters, andcourtyard walls. Optional shelter loan of Rs 90U 1/for roof construction and shutters for all bene-ficiaries.
EWS 3: Plot with sanitary core with roof, common wallsincluding roof for 21.0 m room with no shutters,and courtyard walls. Optional shelter loan ofRs 500 I/ for 25% of beneficiaries.
EWS 4: Completed sanitary core and 21.0 m2 room withshutters, and courtyard walls. Optional shelterloan of Rs 500 1/ for 25% of beneficiaries.
Optional shelter loans of Rs 3,000, Rs 3,500, Rs 4,000 and Rs 4,UO 1/ wouldbe provided for the LIG 1, LIG 2, LIG 3, and LIG 4 plots, respectively atan estimated 25% rate of uptake. Loans would be administered by KDA.
1/ Loan amounts are in 1981 prices.

- 14 -
2.13 Plot options, costs, indicative charges and affordability, inMarch 1981 prices, are set out in Table 6.1. Prices of the EWS options with-out shelter loans would be Rs 2,160, Rs 4,230, Rs 7030 and Rs 8,500, afterdifferential pricing (para 6.08 and Table 6.1).
Community Facilities
2.14 The layouts provide all land requirements for community facilities.The project would provide the initial requirements of buildings that are con-sidered essential for the community and for marketability of plots, and henceavoid delays in beneficiary settlement. A UNICEF-assisted Community Develop-ment Project would provide additional support during the project period.
2.15 The project would provide 18 primary schools and 3 high schoolshaving 5 and 7 classrooms per school, respectively. The above provision isbased on the following average enrollment rates for Kanpur: 65% and 25% inprimary and high schools, respectively, with 40 students per class. Over 50%of the schools are expected to be operated by private organizations, as isdone traditionally.
2.16 Three health centers, two at Barra and one at Gujaini, operatedby KNM would be provided to serve a total population of about 72,000. Eachcenter, for 24,000 people, would have a six-bed ward, one labor room andancillary facilities. The health centers would primarily serve EWS familiesand would provide curative, maternal and child, and preventive medicalfacilities.
2.17 Two sub-post offices would be provided, one each for Barra andGujaini. One police post and one police/fire station would be provided inGujaini and Barra, respectively. Additionally, three multi-purpose communitycenters would be provided, two at Barra and one at Gujaini. The communitycenters would consist of a hall, library, stores and offices. The UNICEF-assisted Community Development Project would provide equipment for thecommunity halls. KDA would operate the community centers, which would beavailable to the public on a rental basis for social occasions.
Small-Scale Industry and Commercial Activities
2.18 Economic activities including retail trade and small-scale businesswould be permitted on household plots, provided that they are not noxioustrades or activities that constitute a nuisance to the community. Consultantsengaged by the Directorate of Industries (DOI) have conducted a comprehensivesurvey in 1980 of formal and informal business activity in Kanpur. The studyindicates that considerable economic activity takes place in low-income resi-dential areas. The demand for business plots, training and common facilitiescenters is based on this study.

- 15 -
2.19 Small-Scale Industry: The project would provice a total of b30plots for small-scale business activities under the sites and services com-ponent. The 2b8 plots in the Pokharpur site would be residential plots of thleEWS and LIG types, on which small business activities would,be carried out bybeneficiaries. A further 542 open plots of bO m and 120 m would be providedin Barra and Gujaini for resiaential-cum-small business activities. The DOIwould select beneficiaries for the 830 plots and 1QA would offer the lease andadminister building loans as for the residential plots. Plots not taken upfor business purposes will be offered for residential use. Of the 26b plotsin Pokharpur, 237 would be of the EWS 1-4 types. EWS 1-3 types may be upgradedto the EWS 4 type, by KDA, at the request of the beneficiaries, for which anamount of Rs 0.5 million has been provided. The other plots would have noon-plot development, but an amount of Rs 2.U 1/ million would be provided forloans for building construction or extension. Loans for machinery and workingcapital would not be provided under the project. Plot details for residential-cum-small-business activities are given in Annex 2, Table 4.
2.20 DOI would provide assistance to small businesses in project areasto improve skills and expand operations as part of the technical assistanceunder the project. This program (base cost is 0.5 million, US*0.06 millionequivalent) would comprise: (a) identification of small entrepreneurs;(b) providing training for skills upgrading and apprising them of existingschemes and facilities for expansion; and (c) assisting and arranging contactbetween beneficiary and banks and UP Finance Corporation (where applicable)for credit facilities for equipment and working capital.
2.21 Two common facilities centers (base cost is 0.67 million, USE0.08million equivalent) would be constructed, one each at Barra and Pokharpur,and operated by DOI. The centers would provide equipment, tools and qualitycontrol facilities for small businesses unable to afford high initial invest-ments. Upon selection of beneficiaries, DOI would equip the centers withtools and equipment that would be in greatest demand. A charge to cover useof equipment and tools will be levied. Except for the EWS plots, all otherplots are priced at market prices, higher than cost. Profits generated fromplot sales would be used to reduce plot prices for low-income households.
2.22 DOI would use the services of the state industrial agencies to carryout the above program and private dealers for operation of marketing outlets.The project would also provide for monitoring, follow-up and post implementa-tion counseling to beneficiaries. DOI is capable of handling the programwith some consultant assistance provided under the project.
2.23 Commercial Activities: The sites and services areas would haveabout 6.6 ha (4.4%) of land for convenience shops and for commercial purposes.Plot sizes, distribution and layouts would be prepared based on demand. Plotswould be fully serviced but will have no on-plot aevelopment. Commercialplots would be auctioned and profits generated would be used to reduce plotprices for low-income households.
1/ Loan amounts are in 1981 prices.

- 16 -
Slum Upgrading
2.24 Eighty-nine ahatas located in the central core of the city wouldbe priority areas for upgrading under the project (Map IBRD No. 15671R).These ahatas contain about 20,000 households.
2.25 Twenty-eight ahatas comprising 7,070 households are in the posses-sion of KDA, having been acquired at various times commencing 1968. Acqui-sition of the remainder started in March 1981 with the publication of thenotice of 'Intention to Acquire' in respect of the first group of 40 ahatas.Acquisition is being carried out under the provisions of the UP Slum Areas(Improvement and Clearance) Act 1962, applied for the first time in the state.Physical works in the ahatas could commence only after the 'right of access'stage of the acquisition process is reached--estimated to take not less thanone year. In order to provide sufficient areas in which upgading could proceedwithout interruption, four abadis (villages) located within and adjacent tothe three sites and services project sites, comprising 1,650 households, havebeen included. Abadis are former villages now within the city boundary, whereresidents have traditional land ownership rights but have no formal title.Abadis lack basic services and conditions are similar to other slum areas.The total number of slum households thus immediately available (8,720) wouldbe sufficient for two years' upgrading work commencing April 1981.
2.26 Ahatas are located on potentially valuable land in and around thecentral commercial area. The Act specifies the formula for compensation (100times monthly rental income), but litigation over this issue is likely, andthe final cost of acquisition will not be known for some time (para. 6.09).Some ahatas are likely to be excluded from the program if the cost of acqui-sition or the cost per capita for services becomes prohibitive. If it becomesapparent that not all of the ahata acquisition program is likely to succeed,additional slums on public land (outside the central core) will be substitutedfor the ahatas.
2.27 The slum upgrading process would comprise provision of basic infra-structure services, home improvement loans, grant of tenure to the presentoccupiers of the land and recovery of costs of land and improvements frombeneficiaries. Displacements and demolitions would be kept to a minimum,limited to requirements of essential infrastructure. Due to high densitiesprevailing, lack of space and soil conditions, low-cost sanitation systemsare not appropriate for the ahatas. Waterborne sanitation has been adoptedin view of the availability of trunk sewer capacity. Education in the useof facilities and the need for flushing will be emphasized through communitydevelopment.
2.28 Layouts would take regard of existing land-use patterns based ondensities and community preferences. Where space is available, additional(infill) plots would be created. Most ahatas would be provided with internalpedestrian access only, as they have access to existing external roads.Commercial and small business plots would be created, when feasible, nearaccess points to ahatas. Land provision for community facilities except forsmall community rooms would be minimal due to space constraints. Densitiesin layouts already prepared range from about 400 to 2,100 persons per ha.

- 17 -
2.29 The average plot size would be about 25 m2 and conforms to thecurr2nt average lang occupancy in ahatas. Plot sizes would vary from about15 m to about 80 m . Price of plots will be differentiated based on plotsize, with smaller plots being sold at less than the cost of developmentand the larger plots at higher than cost. This measure would discouragelarger plot sizes, encourage plot exchanges and subdivisions, and aboveall enable accommodation of poorer beneficiaries.
2.30 Detailed upgrading proposals have been prepared for ten typicalahatas and component costs have been based on the average cost for the tenahatas. A scheme for a typical ahata is indicated in Map IBRD No. 15674.The upgrading of one ahata (Rolling Mill ahata) was taken up in late 1980 asa pilot project, using criteria proposed for the project. It was success-fully completed in March 1981. A key factor in the smooth implementationof the project has been the community involvement and understanding of theobjectives of upgrading by residents. Infrastructure services proposed wouldinclude brick-paved pedestrian access, water supply and sewerage networkssized to permit individual connections, drainage, landscaping and streetlighting. Surveys have indicated that about 70% of beneficiaries would wishto obtain individual water and sewer connections. Facilities for refusecollection would also be provided.
2.31 The following service levels would be provided where possible:
(a) Circulation: Pedestrian access lanes, about 2 m wide, toall dwellings and vehicular access to within about 75 min the larger ahatas.
(b) Water Supply: One standpipe and one bathing facility for35 persons, for the estimated 30% of all households thatwill have no individual facilities.
(c) Sewerage: Facility for individual connections to most dwellings.For residents that remain unconnected (about 30%), one toiletper 35 persons.
(d) Street Lighting: One security light per 40 m.
2.32 Two types of optional loan schemes would be provided for beneficia-ries in the upgraded areas. A home improvement loan of Rs 500 1/ per house-hold to supplement the beneficiaries' own efforts on additions or improvingthe dwelling structurally would be provided by KDA based on an estimated 30%rate of uptake. A second loan of Rs 1,000 1/ per household would be providedby KDA for construction of a sanitary core incluoing the water and sewerconnections for 50% of the beneficiaries. The two loan schemes would caterfor those households wishing to have individual connections, estimated at 70%from surveys, and able to afford the loans. The home improvement loan wouldbe given in cash and/or building materials, to permit beneficiaries the optionof paying artisan fees. The construction of the sanitary core comprisingthe seat, including connections, and the water point would be carried outby KDA as part of the project.
1/ Loan amounts are in 1981 prices.

- 18 -
2.33 No community facilities would be provided under the project in theupgraded ahatas mainly due to space constraints. Residents would largelydepend on existing city facilities in their neighborhood. The UNICEF-sponsoredCommunity Development Project (Annex I) would provide a number of communityfacilities particularly for women and children. Small plots for multi-purposecommunity halls would be provided in ahatas, where space permits. The threemobile health clinics recently introduced in Kanpur provide preventive andprimary health care for residents of ahatas. Space permitting, one commonfacilities center would be provided for use of small businesses in ahatas(base cost Rs 0.33 million (US$0.04 million equivalent)).
2.34 The upgrading proposals would be affordable to about 90% of theahata population. The r2mainder rould also be accommodated where possible,on very small plots (7 m to 10 m ) as was done in the pilot upgrading scheme.It may not be possible, however, to accommodate households below the 7thpercentile of the Slum Household Income Distribution, who would be forcedto continue as renters. Seventy percent of slum households in Kanpur haveincomes less than Rs 350 per month, as indicated in the Slum HouseholdIncome Distribution (Annex 2, Chart 1). Approximate plot sizes, indicativecharges and affordability, in 1981 prices, are set out in Table 6.2. Theaverage cost of upgrading is Rs 2,725, representing about Rs 1,200 for landand Rs 1,525 for improvements, excluding shelter loans.
Environmental Sanitation, Maintenance and Traffic Management
2.35 Investments under this component during the project period wouldcomprise provision of: (i) off-site infrastructure improvements in watersupply, sewerage and drainage to serve slum areas; (ii) drainage of theLatouche Road - Cooper Ganj - Bansmadi area; (iii) desilting and remodelingof existing drainage outfalls (nallas) in Kanpur; (iv) improved solid wastemanagement, including night soil collection on a citywide basis; (v) improve-ments in maintenance; and (vi) traffic management measures. KNM would alsoreceive assistance in studies and equipment related to its maintenance func-tions and reorganization of the solid waste management service (paras 2.50and 2.51).
Off-site Infrastructure: Water Supply
2.36 KJS assisted by the UP Jal Nigam has prepared a scheme that wouldaugment water supply to 88 ahatas identified for upgrading under the project.The basis for design is 135 lcd. A total of about 26,000 m of pipes would beinstalled comprising about 1,340 m of cast-iron pipes, 7,450 m of asbestoscement pipes, and 17,400 m of pvc pipes. In addition, about 155 sluice valveswould be provided, as well as necessary interconnections between existing andnew mains. Base cost for above works is estimated at Rs 3.7 million (US$0.4million equivalent).
2.37 A wastage and leakage program would be commenced to assess lossesand to implement measures to reduce losses to reasonable limits. Productionmetering and area-wide bulk metering would be commenced, and category-wiseconsumption would be established as a matter of priority. Base cost formeters and other equipment for the above program have been estimated atRs 0.5 million (US$0.06 million equivalent).

-_ 19 -
Off-site Infrastructure: Sewerage (Base Cost Rs 37.6 millions US$4.7 millionequivalent)
2.38 KNI'1 has prepared a scheme aimed at providing offT- site sewerage Lo
all the ahatas identified for upgrading under the project. The total designpopulation is about 60,000 households, of which about 20,000 1ive in theahatas proper, and about 40,000 in the immediate neighborhoods. Most of thelatter are "on-line" with sewer lines from the ahatas to cornecting trunksewers. A total of about 30,400 mr of new sewer lines would be installed, indiameters ranging from 150 mm to 300 mm. In addition, based on a thoroughsurvey by KhM, about 30,800 m of existing sewer lines in the 250-300 mm rangewould be replaced. They are either blocked beyornd salvage because of ingressof solid wastes and silt or require upgrading to accommodate increased designflows. Finally, about 53,000 m of existing blocked sewer lines that aresalvageable--in the range of 150-600 mm--would be desilted, to obtain designflows. Base cost of civil works is Rs 27.6 million (US*3.5 million equivalent).
2.39 Justification of the above investments in off-site sewerage isdependent on reliable measures to prevent further blockages by ingress ofsolid wastes, and to maintain necessary design flows. Introduction of anefficient solid waste management system in Kanpur would greatly reduce theoccurrence of sewer blockages. Maintenance of adequate flows requires asufficient degree of household connections to the sewerage system. In Kanpur,household connections have been lagging, due to weak enforcement of existingbylaws, and inadequate incentives to encourage connections. The Governmentof Uttar Pradesh (GOUP) introduced and funded a one-off program to encourageconnections several years ago, which was completed in 1979. It providedassistance on the basis of a 25% subsidy of the connection cost, and albout2,000 connections were made.
2.40 GOUP has agreed that further measures are required to ensure adequateutilization of sewer lines in Kanpur, particularly those to be constructedunder the proposed project. With regard to ahata households, Rs 10 million(US$1.25 million equivalent) 1/ has been provided for optional connection ofabout 10,000 households, at an estimated cost of about Rs 1,000 i/ per. house-hold, which would be recovered through their mortgage payments. Similarly,GOUP has decided to set up, under the project, an Rs 10 million 1/ revolvingloan fund, that would be administered by KJS, to assist households outside theahatas proper to obtain connections. Concurrently, KJS will take effectiveenforcement measures to obtain connections as provided for under its Act,Sewer connection loans to beneficiaries would be made at an interest rateof not less than 12% p.a. to be repaid over not more than 4 years. It hasbeen established through a household survey that there is adequate demhand forconnections. On the basis of an average 50% loan to households, the loan fundwould, during the project period, finance about 20,000 households, which haverelatively higher incomes than average ahata households and would be able tocontribute half the cost of connection= Up to 75% of the cost of a connectionwould be advanced under the loan scheme. Inicluding sites and services, theproject would provide loan funds for over 40,000 sewer connections, over thenext four years. It is expected that additional connections would result fromthe enforcement of bylaws on the relatively better off households. Beyond the
1/ Loan amounts are in 1981 prices.

20 -
project period, KJS will continue the enforcement measures and the loanprogram (until it is depleted) and achieve not less than 15,000 connectionsduring 1985/86 through 1989/90.
Off-site Infrastructure: Drainage(Base cost Rs 11.8 million, US$1.5 million equivalent)
2.41 KNM assisted by the UPJN has prepared a scheme for draining theslum areas to be upgraded under the project. Each slum would be connectedto existing outfalls by a stormwater drain, average length about 130 m, anddesigned to accommodate rainfalls on a two-year frequency basis.
2.42 Annual Work Program: Off-site Infrastructure. As pointed out inpara 2.25, about 60 ahatas comprising 11,270 households have yet to be acquiredfor slum upgrading. For various reasons, some of these ahatas may not becomeavailable, and other slums already on public land could be substituted. Addi-tionally, after more detailed investigations, the extension of sewers to someahatas may have to be reconsidered in view of possible high unit/capital costs,which would adversely affect affordability. Since the above three offsiteinfrastructure programs are subordinated to slum upgrading, they would thenhave to be adjusted to provide infrastructure services only to those ahatasacquired. However, the volume of works related to already acquired ahatas issufficient to provide for at least a one-year work program starting April 1981.It has been agreed that the annual work programs of off-site water supply,sewerage and drainage should be mutually agreed between GOUP and IDA annually,starting by April 1 of each year.
2.43 Drainage of the Latouche Road-Cooper Ganj - Bansmadi Area. Thisthickly populated area in the central core includes a large slum population,and a hospital. During the monsoon it is badly waterlogged. To remedy thissituation the KNM would implement an 1,800 m drainage system, connecting tothe existing Sisamau nalla. It would be provided as a stormwater sewer, withgully gratings, since heavy traffic conditions in the area prevent construc-tion of an open or covered stormwater drain proper. The basis of design israinfalls on a two-year frequency basis.
2.44 Desilting and Remodeling of Existing Drainage Outfalls (Nallas).While the design capacity of existing outfalls is sufficient to dewaterrespective catchment areas during the monsoon, disrepair and silting hasreduced actual discharge capacity. Under the project, KNM would undertakerepair and desilting of 13 existing stormwater drains, which drain slum areas.The volume of works represented by this backlog is too large for KNM's regularmaintenance staff to handle, and will be carried out by contractors.
Solid Waste Management
2.45 Refuse Collection and Disposal, (Base cost Rs 8.1 million, US$1.0million equivalent). This component is designed to assist KNM to improve andextend refuse collection and disposal within the city, particularly in thecentral core of the city where most ahatas are located. The project wouldprovide sweeper carts, masonry bins, trucks, frontend loaders and other equip-ment (see Annex 2, Table 5). Depot and workshop facilities would be improvedto better utilize vehicles and plant. At present fuel supply for all KNM
- 21 -
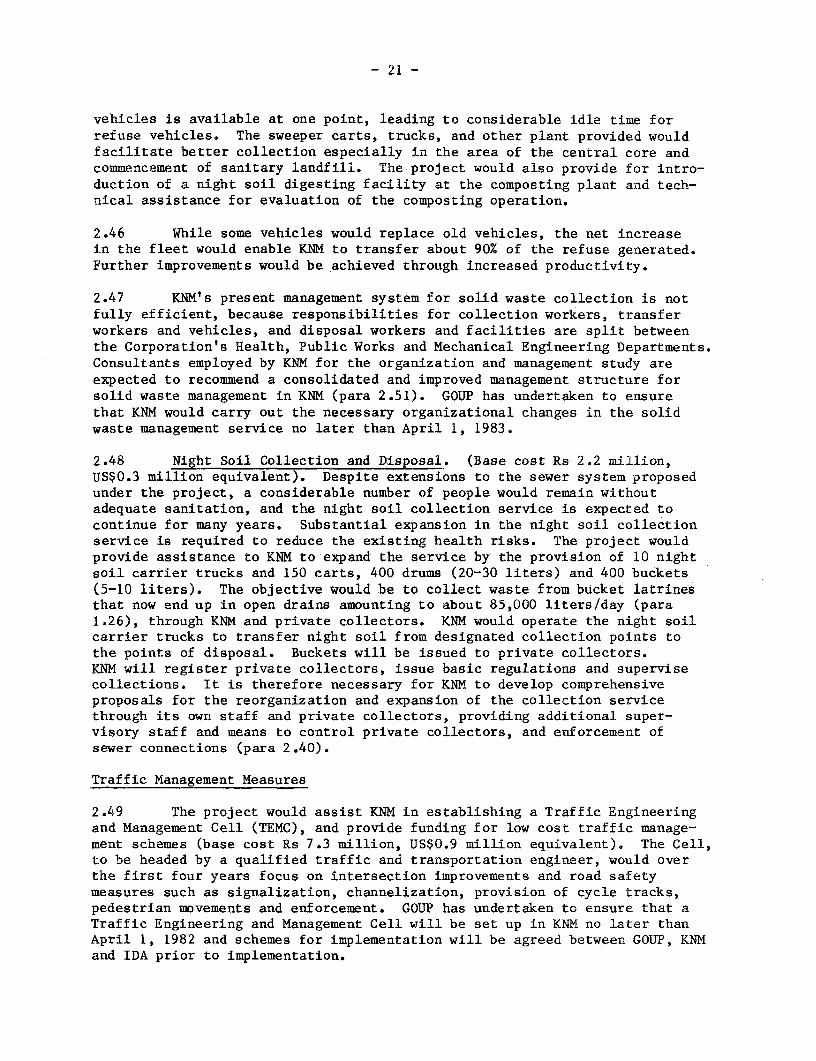
vehicles is available at one point, leading to considerable idle time forrefuse vehicles. The sweeper carts, trucks, and other plant provided wouldfacilitate better collection especially in the area of the central core andcommencement of sanitary landfill. The project would also provide for intro-duction of a night soil digesting facility at the composting plant and tech-nical assistance for evaluation of the composting operation.
2.46 While some vehicles would replace old vehicles, the net increasein the fleet would enable KNM to transfer about 90% of the refuse generated.Further improvements would be achieved through increased productivity.
2.47 KNM's present management system for solid waste collection is notfully efficient, because responsibilities for collection workers, transferworkers and vehicles, and disposal workers and facilities are split betweenthe Corporation's Health, Public Works and Mechanical Engineering Departments.Consultants employed by KNM for the organization and management study areexpected to recommend a consolidated and improved management structure forsolid waste management in KNM (para 2.51). GOUP has undertaken to ensurethat KNM would carry out the necessary organizational changes in the solidwaste management service no later than April 1, 1983.
2.48 Night Soil Collection and Disposal. (Base cost Rs 2.2 million,US$0.3 million equivalent). Despite extensions to the sewer system proposedunder the project, a considerable number of people would remain withoutadequate sanitation, and the night soil collection service is expected tocontinue for many years. Substantial expansion in the night soil collectionservice is required to reduce the existing health risks. The project wouldprovide assistance to KNM to expand the service by the provision of 10 nightsoil carrier trucks and 150 carts, 400 drums (20-30 liters) and 400 buckets(5-10 liters). The objective would be to collect waste from bucket latrinesthat now end up in open drains amounting to about 85,000 liters/day (para1.26), through KNM and private collectors. KNM would operate the night soilcarrier trucks to transfer night soil from designated collection points tothe points of disposal. Buckets will be issued to private collectors.KNM will register private collectors, issue basic regulations and supervisecollections. It is therefore necessary for KNM to develop comprehensiveproposals for the reorganization and expansion of the collection servicethrough its own staff and private collectors, providing additional super-visory staff and means to control private collectors, and enforcement ofsewer connections (para 2.40).
Traffic Management Measures
2.49 The project would assist KNM in establishing a Traffic Engineeringand Management Cell (TEMC), and provide funding for low cost traffic manage-ment schemes (base cost Rs 7.3 million, US$0.9 million equivalent). The Cell,to be headed by a qualified traffic and transportation engineer, would overthe first four years focus on intersection improvements and road safetymeasures such as signalization, channelization, provision of cycle tracks,pedestrian movements and enforcement. GOUP has undertaken to ensure that aTraffic Engineering and Management Cell will be set up in KNM no later thanApril 1, 1982 and schemes for implementation will be agreed between GOUP, KNMand IDA prior to implementation.

- 22 -
Maintenance (Base cost Rs 8.1 million, bS1.0 million equivalent)
2.50 Over the years, a considerable backlog of deferred maintenance ofservices has built up within KNH's jurisdiction, particularly for sewerage,drainage, roads and street lighting. The reasons for this situation are pooroperation and maintenance procedures, and inadequate plant and equipment.Consultants employed by KNM1 (para 2.51) will recommend, among other things,appropriate equipment for coping with this backlog and with additional main-tenance requirements caused by added investments under the project. It isexpected that the consultants will propose equipment for patch repair of roadsand sidewalks (such as road rollers, tar boilers, and trucks), for cleaningof sewers (such as rodding machines, sewer cleaning machines, and gully pitemptiers) and for general maintenance works (such as concrete mixers andvehicles). Equipment relating to sewer cleaning would be provided to KJSsince the responsibility for sewerage now rests with KJS. GOUP has agreedthat procurement of equipment and plant will be done after KNI1, KJS and IDAhave jointly reviewed the recommendations of the maintenance study and agreedon the course of action to be taken and plant and equipment to be procured.
Technical Assistance and Institutional Strengthening
2.51 Technical assistance and training would be included in the projectto support the strengthening of KDA, KiNM and KJS. KDA has commenced a 47man-month consultancy study to assist in improving its overall performance inthe delivery of shelter and related services. The study covers the specificareas of organization, systems and methods, collection system, accountingsystem, project cost accounting and management. The strengthening of KNMwill be tackled on three broad fronts, given its importance in the provisionand maintenance of services. KNI1 has retained consultants for: (a) an insti-tutional strengthening program covering organizational analysis, accountingsystems, management information system, stores operation, revenue collectionand the property assessment system and project cost accounting (60 man-months);(b) a financial strengthening program to improve the existing system ofrevenue generation and identify alternative sources of revenue (60 man-months);and (c) a study of its maintenance activities to improve citywide maintenanceservices (20 man-months). KJS has obtained about 4 man-months of consultancyassistance to commence a billing management program in order to administermore effectively its past due receivables. All the above studies were ini-tiated between December 1980 and harch 1981 using local consultants. Termsof reference for the consultancy studies for KDA, KNM and KJS were agreed withIDA. Finally, the project would provide start-up costs to KNI to help estab-lish the traffic engineering and management cell.
2.52 The state level component would assist the Departments of Housing(formerly Housing and Urban Development) and Urban Development (formerlyLocal Self-Government) to develop a strategy for statewide urban developmentand strengthen urban management and finance. A new division would be estab-lished in the Department of Town and Country Planning (T&CPD) which willdevelop programs in coordination with the Department of Urban Development.This unit will receive assistance to further develop economic, spatial andstrategic planning capabilities of T&CPD with particular emphasis on the

- 23 -
methodology and incentives for private sector participation in land andshelter development. The assistance would comprise start-up costs for estab-lishment of additional specialist staff, local consultancy assistance forspecific studies, equipment, specialized services and training. Based onthe institutional and financial strengthening program now being developed forKNM, the unit would introduce and implement similar appropriate strengtheningprograms in the other four KAVAL towns to strengthen management and finance.Details of the proposal are yet to be finalized.
2.53 The total consultant staff-months for the institutional strengthen-ing programs for both KDA and KNM include staff training provision over andabove the training they would receive on the job during the design and imple-mentation phases of these studies. Additionally, agency staff would receivespecific short-term training locally, as appropriate.
2.54 betails of costs are provided in Annex 2, Table 10.
III. PROJECT COSTS AND FINANCING
A. Cost Estimates
3.01 Total project cost, including contingencies, is estimated atRs 414 million (US$51.7 million). The foreign exchange component is Rs 40million (US$5 million) or about 10% of project costs with Rs 18 million(US$2.3 million) estimated as taxes and duties. Land acquisition costs areestimated at Rs 51 million (US$6.4 million). Summary cost estimates aregiven in Table 3.1 and detailed cost estimates for each component are givenin Annex 2, Tables 7-10.
3.02 Base cost estimates are in March 1981 prices. Cost estimatesfor the sites and services component are based on final engineering designfor all three sites (Barra, Gujaini and Pokharpur). Cost estimates for slumupgrading are based on final engineering for 10 typical ahatas representingvarying densities, locations and physical conditions, and costs derived fromthe pilot upgrading scheme at Rolling Mill ahata commenced in late 1980.Cost estimates for environmental infrastructure improvements are based onpreliminary engineering designs for civil works. Recent quotations fromsuppliers for materials, vehicles and equipment have been used to computecosts for the solid waste management and maintenance subcomponents. Averagestaff-month costs for consultant and advisory services are estimated atRs 8,500 for locally procured services. No foreign consultancy services willbe required. Physical contingencies have been estimated at 10% for civilworks with detailed engineering and 15% for civil works with preliminaryengineering. No physical contingencies have been applied to land, vehicles,equipment, shelter loans and technical assistance. Price contingencies havebeen estimated at 9%, 8.5%, 7.5% and 7.5% for FY82 through FY85 for both localand foreign costs, except for land.

Table 3.1; SUMIARY COSTS
Rupees (million) US$ million (US$1 = Rs 8) Foreign ofLocal Taxes Foreign Total Local Taxes Foreign Total Exchange Total
ShelterSites & Services 122.7 5.3 10.3 138.3 15.33 0.67 1.29 17.29 8 47Slum Upgrading 63.1 1.9 4.4 69.4 7.89 0.23 0.55 8.67 7 24
185.8 7.2 14.7 207.7 23.22 0.90 1.84 25.96
Environmental Sanitation, Mainte-nance & Traffic ManagementWater Supply 3.5 0.2 0.4 4.1 0.43 0.03 0.06 0.52 12 1Sewerage 30.6 1.9 5.1 37.6 3.82 0.24 0.64 4.70 14 13Drainage 10.3 0.3 1.2 11.8 1.29 0.04 0.15 1.48 10 4Maintenance 6.5 0.4 1.2 8.1 0.81 0.05 0.15 1.01 15 3Solid Waste Management 6.2 1.6 2.6 10.4 0.78 0.20 0.32 1.30 25 3Traffic Management Measures 6.2 0.4 0.7 7.3 0.77 0.05 0.09 0.91 10 2
63.3 4.8 11.2 79.3 7.90 0.61 1.41 9.92
Technical Assistance & Institu-tional StrengtheningConsultant and AdvisoryServices,Training, etc. 6.2 0.2 1.6 8.0 0.77 0.03 0.20 1.00 20 3
Total Base Costs 255.3 12.2 27.5 295.0 31.89 1.54 3.45 36.88 100
Physical Contingencies 16.9 0.9 2.3 20.1 2.11 0.12 0.28 2.51 11Design, supervision, management 26.4 1.5 3.3 31.2 3.29 0.18 0.42 3.89 11Price Contingencies 56.6 3.3 7.3 67.2 7.08 0.41 0.91 8.40 11
Total Project Costs 355.2 17.9 40.4 413.5 44.37 2.25 5.06 51.68

- 25
B. Financing
3.03 The proposed IDA credit of US$25 million would finance about 50% oftotal project costs net of taxes and duties. The credit would cover 100% ofthe estimated foreign exchange costs (US$5 million) and 45% of local costs.The credit would be made available to GOI, which will pass it on to GOUP onits standard terms and conditions as part of the central government assistanceto the state. GOUP would make all project funds available to implementingagencies on terms and conditions indicated in Table 3.2. The terms andconditions conform to current practices. Flow of funds is indicated inAnnex 2, Chart 3.
3.04 Retroactive financing would be provided as follows: (a) not exceed-ing US$250,000 to KDA, KNM and KJS for expenditures made after October 1,1980 for consultant services required for project preparation; and (b) up toUS$250,000 to KDA for expenditures incurred after April 1, 1981 for civil works.
Table 3.2: FINANCING PLAN (US$ million)
Principal Direct GOUP Loans Total of whichAgency Expenditure Cost IDA Funds
/a /b
A. Sites and Services KDA 1.6 23.1 24.7 12.30B. Slum Upgrading KDA 0.1 11.1 11.2 4.30C. Environmental Sanitation,
Maintenance and TrafficManagement
Water Supply KJS 0.9 0.9 0.40Sewerage KJS 7.2 7.2 3.70Drainage KNM 2.4 2.4 1.20Solid Waste Management KNM 1.5 1.5 0.95Maintenance KNM/KJS 1.2 1.2 0.55Traffic ManagementMeasures KNM 1.4 1.4 0.40
D. Technical Assistance and KDA/Institutional Strengthening KNM/KJS/
T&CPD/DOI 1.2 1.2 1.20TOTAL 2.9 48.8 51.7 25.00
/a Passed directly from GOUP to budgets of state departments for schools,health centers, police stations, post offices, community halls, commonfacilities centers and for state- and local-level agencies for insti-tutional strengthening and training.
/b GOUP loans to agencies at interest rate not exceeding 7% p.a. to berepaid over 25 years, which includes a five-year grace period.
3.05 Projections of annual expenditures during the project period areindicated in Table 3.3.

- 26 -
Table 3.3: ANNUAL CAPITAL EXPENDITURE PLAN(Rs million)
1981/82 1982/83 1983/84 1984/85 TOTAL
A. Sites and Services 30.9 69.9 63.0 33.9 197.7B. Slum Upgrading 11.8 31.0 31.3 15.6 89.7C. Environmenal Sanitation,
Maintenance & TrafficManagement MeasuresWater Supply 1.0 1.9 2.6 1.2 6.7Sewerage 7.8 15.3 20.1 14.5 57.7Drainage 2.6 8.3 7.0 1.1 19.0Solid Waste Management 6.9 4.4 0.7 - 12.0Maintenance 2.3 4.9 2.6 - 9.8Traffic Management Measures 1.0 4.4 4.7 1.3 11.4
D. Technical Assistance andInstitutional Strengthening 2.9 2.8 2.5 1.3 9.5
TOTAL 67.2 142.9 134.5 68.9 413.5
IV. PROJECT MANAGEMENT, ORGANIZATION A4D FINANCE
A. Project ianagement
4.01 A state-level steering committee formed during project preparationwill continue during implementation and will provide guidance on policy andproject-related matters. This committee, chaired by the Chief Secretary,includes secretaries of other state departments, chief town planner, andsenior officials from relevant organizations such as Jal Nigam, KDA, KNM andKJS. The support and commitment of the State Government to the project hasbeen consistently expressed, during project preparation, through this steeringcommittee. It has provided a forum at the highest level of government fordiscussion, for the project preparation team and IDA. It has lent supportto resolving problems, changing policies and procedures and adopting newideas.
4.02 A Project Management and Monitoring Committee was established inApril 1981 to perform the functions of coordination, monitoring and problemsolving related to project implementation at the local level. It will reportto the Steering Committee and IDA. The committee comprises the Secretariesof Housing (formerly Housing and Urban Development) and Urban Development(formerly Local Self-Government), the Chief Town Planner, Vice-Chairman ofKDA, the Administrator of KNM, and Chairman of KJS.

- 27 -
4.03 The Kanpur Development Authority (KDA) will have overall responsi-b:litv for coordination of project execution at the local level. The twoother agencies directly involved in implementing the project are the KanpurNagar hahapalika (KNM) (municipal authority) and the Kanpur Jal Sansthan(KJS) (city water and sewerage authority). The Project Management and Moni-toring Committee will receive monthly control and activity reports from KDA,as the coordinating agency, containing progress, status and current problemsrelating to each component. The information required for these reports willbe obtained from the relevant departments of KDA, KNM and KJS and processed bythe Organization and Methods (O&M) Officer of KDA. All involved agencies willsubmit information to the O&M officer on the basis of an agreed format andfrequency. Project activity data will originate from the various functionaldepartments of the executing agencies--such as planning, engineering, sales,finance, accounting, etc.
4.04 In varying degrees, serious shortcomings exist in the three localagencies. However, the Kanpur Development Authority has gradually succeededin improving its operational and management performance. Over the past two tothree years, it has increased the shelter program and commenced a sites andservices program to reorient shelter investments to the poorer sections ofthe community. Assisted by KNMi and KJS it has done an excellent and thoroughlyprofessional job of project preparation, completed the upgrading of one ahataas a pilot project and demonstrated innovativeness. About 75% of the totalproject costs will be directly expended by KDA. Despite their weaknesses, KNIMand KJS have recently begun to show improved performance. They now recognizetheir weaknesses and support the objectives of the institutional strengtheningprogram in the project. The State Government has given unqualified supportto the institutional strengthening program, the recommendations of which maybe adopted in other KAVAL towns and perhaps elsewhere. An action program toimprove operational efficiency of the agencies has been identified. Theproject would address organizational improvements, systems and procedures,accounting, billing, collection, revenue generation and management controlsystems.
B. Kanpur Development Authority
4.05 The Kanpur Development Authority (KDA) was carved out of thedevelopment wing of the municipal authority in 1974 to undertake develop-ment work and to exercise planning and development control functions overa large area. The KDA is constituted under the provisions of the UP UrbanPlanning and Development Act 1973. Its functions include: (a) acquisitionand development of land for residential and commercial purposes; (b) con-struction of housing as well as commercial and industrial estates; (c) manage-ment of land and buildings inherited from KNM and those developed by itself;and (d) regylation of private building activity. The area of jurisdictio" ofKDA (969 km ) is about four times that of the municipal authority (262 km ).

- 28 -
4.06 The State Secretary for Housing (formerly Housing and UrbanDevelopment) is the Chairman of the KDA board that directs its activitiesthrough the chief executive officer--the Vice-Chairman. The Vice-Chairmanis assisted by a Secretary who has direct responsibility for the planningand engineering departments. The sales, stores, accounts and administrationdepartments are directly responsible to the Vice-Chairman. The total estab-lishment of KDA numbers about 1,100. For physical execution of works, thereare at present six engineering divisions headed by a chief engineer. Anarchitect/planner deals with planning and development control. Two otherdepartments deal with general administration and accounts. While the plan-ning and execution functions are managed efficiently, the accounts departmenthas few qualified staff. The organization chart of KDA is shown in Annex 3.
4.07 Land, residential and commercial development comprise the bulkof KDA's capital works. The proportion of investments in shelter has beenincreasing over the years and in 1979/80 about 3,200 units were constructed,as indicated in Annex 3, Table 4. The proportion of investments for EWSshelter has also been increasing steadily, reflecting the government's changingpriorities.
4.08 As an executing agency, KDA has demonstrated the capability foreffective physical execution of projects. It does not, however, have thefinancial and accounting capability to undertake appropriate financialanalyses and cost control of projects, and forward planning and budgeting.Methods for accountability of funds are inadequate. The project accountingsystem lacks: (a) internal controls; (b) uniformity in data between operatingand accounting departments; and (c) appropriate and timely financial informa-tion for effective management control.
4.09 KDA's expenditures for 1979/80 were about Rs 67 million. Receiptsand payments since 1977/78, given in Annex 3, Table 1, indicate a steadygrowth. The primary sources of funds are sales of serviced land, buildingsand public facilities, rents and loan charges, and loans and grants. Duringfiscal year 1979/80, the total available funds of KDA amounted to aboutRs 92 million, of which about Rs 58 million (63%) were loans from Govern-ment and HUDCO, and the remainder, Rs 34 million (37%), was generated frominternal operations. Capital investments reached about Rs 40 million in1979/80 and were about Rs 60 million in 1980/81. As of March 1980, KDA'soutstanding debt obligations were approximately Rs 145 million with anaverage annual debt service of Rs 14 million. In recent years, debt servicehas been in the range of 14%-22% of gross funds disbursement.
4.10 KDA's ongoing projects, comprising about 5,400 housing units,are expected to be completed in the next two years. The proposed projectwould be handled as part of KDA's normal operations; and the level of annualcapital expenditure is expected to almost double over the next two yearsfrom about Rs 50 million to about Rs 100 million. Past trends indicate thatexpansion of KDA activities to this level in two years would be feasible.KDA will increase its staff to cope with the expanded operation as indicatedin the organization chart (Annex 3). A full-time land acquisition officer

- 29 -
has been employed and one additional chief engineer will be appointed. Underhis direction, the engineering staff will be gradually built up to handle theincreasing workload. It is expected that up to eight engineering divisionswill eventually be added, starting with four becoming operational in the firstyear. A town planner, sales staff, accounting staff and an organization andmethods officer would also be added to cope with the project functions. Mostof the staff will be drawn from the centralized services cadre.
4.11 The area of greatest need for improvements in KDA is administrativeand financial management. This would be addressed as part of the project.Consultants have been employed by KDA since April 1981 to design and imple-ment an appropriate accounting system, including training KDA personnel, andeffect improvements in the general systems and procedures. Specifically thestudy will cover organization and methods, collection systems, accountingsystem, project cost accounting and management, and internal controls formanagement. The new accounting system would be introduced by April 1982 andwould be fully operational by April 1983 (para 4.36). Consultancy assistancewould be provided to follow up implementation. As a matter of priority, theconsultants will set up a project cost accounting system for use in theproject. The program would be completed by March 1983.
C. Kanpur Nagar Mahapalika
4.12 The Kanpur Nagar Mahapalika (KNM), the municipal authority, wasestablished under the Nagar Mahapalika Act 1959 to perform functions ofcivic administration as an autonomous body. The KNM has had no electedcouncil since 1974. It is run by an Administrator appointed by the Depart-ment of Urban Development (formerly Department of Local Self-Government).
4.13 KNM is responsible for solid waste management, sanitation, streetlighting, traffic engineering, city roads, and to some extent, maternity andchild health, and education. Its duties are mainly operation and maintenanceof the facilities, but it also undertakes some new works in roads and streetlighting. The functions of the municipal authority have gradually been eroded,firstly by creation of.KDA (para 4.05) and recently by the decision to separatethe water supply and sewerage operations into the Kanpur Jal Sansthan (KJS)(para 4.20). The sewerage functions were transferred to KJS on April 1, 1981.
4.14 Departmental organization is vague. Based on the current organiza-tion chart (Annex 3), there appears to be six operational departments. Theyare administration (including stores), taxes, accounts and audits, health,education arid engineering. However, there are considerable functional over-laps between the departments. Solid waste management, education and accountsfunctions are split between departments and responsibilities are inadequatelydefined. The current organization set-up contributes to inadequate controlby management.

- 30 -
4.15 The low and deteriorating sanitary conditions prevailing in mostof Kanpur are ample evidence that the KNM has not been able to cope withthe city's needs. During fiscal year 1979/80 about Rs 33 million (31%)of expenditure was allocated to conservancy and drainage, which togetherconstitutes the largest expenditure category. 1/ A further Rs 6.5 million(6%) is allocated to capital expenditure, virtually all of which was forsewerage. KNM's budget in the fiscal year 1979/80 was about Rs 104 million.Statements of revenues and expenditure from 1977/78 onward are given inAnnex 3, Table 2. About 20% of KNM's funds was derived from government andthe remaining funds, generated internally. Government grants for recurrentexpenditure in 1979/80 amounted to Rs 18 million, or about 17% of totalreceipts. About 25% of this amount (Rs 4.5 million) comprised a grant forhealth and education facilities operated by KNM.
4.16 The major source of revenue is octroi--a tax levied on goods enter-ing the city, which constitutes about 45% of the total. Property tax formsabout 20% of total revenue, a portion (7.5%) of which was water and sewer tax.Most other categories of revenue have fallen as a proportion of total revenuein recent years, due to the increase in the octroi tax.
4.17 The total property tax levied in 1980/81 was 22% of assessedannual rental value of properties, out of a legal maximum of 25%. However,from April 1981 the water and sewerage tax portion of the property tax iscollected directly by KJS. With the separation of the water and seweragetax portion (7.5%), the KNM portion of tax will now amount to only 14.5%of assessed annual rent values. This permits KNM to progressively increasethe property tax from the present 14.5% to 25% and to achieve a significantincrease in its property tax revenues. The rental basis of property taxassessment and the existence of rent control tends to keep the assessedrentals artificially low, depriving KNM of much potential revenue. Theproject would develop options for generating additional property tax revenues(para 4.19).
4.18 The share of KNM's capital expenditure under the project will belimited to drainage, solid waste management, maintenance and traffic managementmeasures. KDA would, however, execute the drainage components on behalf ofKNM with additional staff mobilized from the centralized services for physicalexecution of works (para 4.10). The additional costs to be incurred by KNMin respect of the services expanded under the project would amount to Rs 2million annually. The maintenance charges from beneficiaries under theproject would amount to Rs 1.2 million annually. Additional property taxeswill accrue from the MIG, HIG and commercial and industrial properties.The various options for raising additional revenue will be addressed throughthe resource mobilization study under way (para 4.19).
1/ A major portion of the recurrent expenditure relates to cleaning ofsewers. With the improved solid waste management and increased sewerconnections planned under the project (para 2.40), this expenditureshould reduce substantially in future years, due to reduced blockage.

- 31 -
4.19 As part of project preparation, GOUP and KNM have taken action toeffect necessary organizational and financial improvements, with consultantassistance. KNM engaged consultants in December, 1980 for a comprehensiveinstitutional strengthening program to address, specifically, improvements inthe organizational structure, systems and procedures for various functions ofKNM, design and implementation of an appropriate accounting system, includingtraining KNM personnel in the system. The above program is being developedand is expected to be completed by March 1983. The above engagement providesfor consultant assistance to follow up implementation. A resource mobilizationstudy has also commenced in April 1981, with consultant assistance to identifyand implement measures to improve the resource base of KNM by: (i) improvinginternal efficiency; (ii) improving tax assessment and collection machinery;and (iii) tapping additional resources in the city. Following submission ofan interim report by consultants, a program for the study will be agreed.GOUP has agreed that following review of the recommendations of the resourcemobilization study, due for completion in December 1981, by GOUP, KNM andIDA, GOUP will cause KNM to adopt suitable measures to increase its revenues,satisfactory to GOUP and IDA, no later than April 1, 1983. A third studystarted in February 1981 to strengthen maintenance is being developed byconsultants. It is expected that the recommendations of the study, due aboutSeptember 1981, would, among other things, include provision of additionalplant, equipment and tools to KNM, clearing of the backlog of maintenanceservices and the adoption of maintenance schedules consistent with currentand projected revenues.
D. Kanpur Jal Sansthan
4.20 In 1975, the State Government created the Jal Nigam (state-levelwater and sewerage authority) to handle capital investments in the watersupply and sewerage sector and Jal Sansthans (city water supply and sewerageauthorities) to handle operation and maintenance. The Kanpur Jal Sansthan(KJS) was legally set up in 1976 by separating the water supply functionsfrom the municipality. Effective operations in water supply by KJS did notcommence until April 1980 and the sewerage function was transferred from KNMto KJS only on April 1, 1981. The departmental responsibility for watersupply and sewerage within GOUP was transferred from the then Department ofLocal Self-Government (now Department of Urban Development) to the Departmentof Housing in April 1980. The Chairman of KJS is also Administrator of KNM.A General Manager is responsible for the operations of KJS. The organiza-tional chart for KJS is shown in Annex 3.
4.21 Through the UP Water Supply and Sewerage Project (Credit 585-IN),it was intended to create an autonomous and financially viable water supplyand sewerage authority for Kanpur. The project included urgently neededinvestments such as tubewells, extensions to distribution networks, metering,a meter repair program and important institutional and financial improvements.
4.22 The civil works for Kanpur under the above project are nearingcompletion. Due to problems inherited from the time of its formation, KJS'soperational and financial performance has, however, been poor. It is indefault of the rate of return covenants agreed for 1978 and 1980 under the

- 32 -
UP Water Supply and Sewerage Project (Credit 585-IN). In 1978/79 and 1979/80,only about 73% of KJS's operating expenditures (excluding debt service) werecovered by self-generated revenues. 1/ Shortage of trained staff, a laggingmetering program, faulty water meters, water leakage and difficulties withbilling and collection are among the principal reasons for this situation.Quite substantial water tariff increases have been implemented since appraisalof the UP Water Supply and Sewerage Project, but they have not had the expectedimpact on KJS's financial performance, mainly due to the operational problemscited above. The most recent water tariff increase, averaging 150%, tookplace in November 1979, bringing: (a) do3estic tariffs up to Rs 0.50 per mand non-domestic tariffs to Rs 1.50 per m for metered connections; and (b)fixed domestic "tap charges" up to Rs 10 to Rs 30 per month depending on pipediameter. The water tax was doubled as of April 1981, from 6.25% to 12.5% ofannual assessed rental value.
4.23 Since early 1980, increasing emphasis has been given to attemptsto improve the operational performance of KJS and a rolling action programhas been regularly discussed with IDA in the course of the preparation ofthe proposed urban project. Significant progress has already been achievedand the proposed project will support further improvements. Specific opera-tional and financial performance targets have been discussed and agreed (seepara 4.32 and Annex IV). Status of the main issues is summarized in paras4.24-4.31.
4.24 Staffing. In August 1980, a new middle-level staffing plan forKJS was adopted, with 27 posts. Eighteen appointments had been made as ofJune 1981 and the remaining nine appointments would be made by October 31,1981. In February 1981, KJS also created the following additional lower-level posts: 6 accountants, 52 tubewell operators, 40 meter inspection andrepair staff, and I public relations officer. Recruitment for these positionsis underway. A new General Manager of KJS was appointed in February 1981.
4.25 Metering. During the period October 1980-June 1981, about 3,000faulty meters were replaced, as compared to about 50 meters during the 12months prior to October 1980. An estimated further 12,000 faulty meters needto be replaced and this backlog would be eliminated by April 1, 1983. Theconversion of unmetered connections to metered has commenced only recently.Over the past few years, only some 1,500-2,000 new metered connections havebeen installed annually. Meter installation would increase to an average ofabout 10,000 annually during the project period (about 13,500 conversions ofunmetered connections and about 25,000 new connections). The cost effective-ness of the metering program will be closely monitored from the outset toassess whether adjustments in this program should be made. Unmetered connec-tions with fixed tap charges may be more appropriate in areas of low consump-tion, intermittent supply, etc. Households with unmetered connections arethe water tax 2/, and the "tap charge" (para 4.22). Production and area bulk
1/ Excluding expenditures and revenues for sewerage which remained withKNM during this period.
2/ No tax is payable for properties with assessed rental value less thanRs 500 per year.

- 33 -
meters would be provided under the project to help improve current estimatesof production, consumption and leakage with a view to instituting furthermeasures to increase the proportion of water produced that is actually billed(para 2.37).
4.26 Billing. By mid-1981, KJS had become reasonably current in itsbilling of non-domestic and bulk consumers. The situation is less satis-factory with regard to domestic consumers (currently about 45,000 consumers,representing about 37% of potential revenues), where lack of basic informationand effective procedures prevented KJS from starting its billing on a signifi-cant scale until mid-1980. At that time, KJS had completed the preparation ofprovisional consumer registers from KNM property tax registers. By March 1981,billing for about 40% of due receivables for the period April 1977 to December1980 had been completed with emphasis on the early part of this period. Manyof these bills are being contested, due to incorrect consumer records, faultymeters, time lag, etc. To deal more effectively with domestic billing, KJS hastaken the following initiatives: (a) current billing on a six-monthly basishas been initiated as of April 1, 1981, with billing for previous consumptionand arrears to continue separately; and (b) consultants have been engaged toanalyze the data base on past consumption and arrears and to develop a cost-effective strategy for arrears collection. Quarterly meter reading commencedApril 1, 1981 and from April 1, 1982, billing will be quarterly instead ofsemi-annually. From April 1, 1981, KJS has taken over from KNM the billingfor water and sewer taxes, which will allow better billing coordination by KJSand simplify controls. Furthermore, to improve its data base, KJS in October1980, commenced a survey to provide more reliable information on the numberand the status of water connections (metered, unmetered, and illegal, by typeof consumer). The survey and related data processing was about 25% completeby June 1981 and will be fully completed by March 1982.
4.27 Collections. Due largely to the stepped up billing program, cashcollections have recently improved from Rs 11 million in 1979/80 to aboutRs 20 million in 1980/81 - just sufficient to cover operating expendituresfor water supply, excluding debt service. The billing delays and previouslack of enforcement of collection through disconnection of defaulting consumershave led to public indifference which has seriously affected KJS's collections.KJS commenced some disconnections of large consumers in early 1981, and willinitiate more systematic enforcement in parallel with the improvements inthe data base and in billing procedures.
4.28 Working Capital. KJS was established without provision for adequateworking capital. As required under the UP Water Supply and Sewerage Project(Credit 585-IN) and in view of the continuing financial difficulties of theagency, GOUP has, in August 1981, given an Rs 12.5 million (US$1.56 millionequivalent) loan for working capital to KJS. The loan will be repaid over7 years, which includes a two year grace period, at an interest rate of 10%per annum.
4.29 Sewerage. The transfer of the sewerage function to KJS on April 1,1981, will negatively affect KJS's financial performance. In spite of anincrease of the sewer tax from 1.25% to 3% of annual assessed rental valuesfrom April 1, 1981, sewer revenues are unlikely to cover more than 25% ofoperating expenditure for sewerage in 1981/82. This would improve during the

- 34 -
project period as the number of connections would increase from about 7,000to about 50,000 with only limited capital expenditure (the capacity of majorportions of the network is currently only about 20% utilized due to laggingconnections). Projections are shown in Annex IV, Table 5.
4.30 Accounting. An accrual based accounting system for KJS has beenprepared by consultants financed under the UP Water Supply and SewerageProject (Credit 585-IN). Expenditures are accounted for on an accrual basisstarting April 1, 1981 and the full system will be in operation from April1, 1982. The value of KJS fixed assets is being assessed. This will becompleted by April 1, 1982, and by March 31, 1983 it should be possible toprepare proper balance sheets for KJS and to properly determine the finan-cial rate of return on its operations.
4.31 Credit 585-IN provides that KJS (including both water and sewerageoperations) shall earn rates of return on its net fixed assets of not lessthan 2%, 4% and 6% at March 31, 1978, 1980 and 1984, respectively. Forreasons given above, the first two of these targets have not been achieved.Until better data are available, including revised fixed assets values, itis difficult to assess the likelihood that the 1984 target can be achieved.KJS is now focusing on operational efficiency targets and cash flow targetswhich would be consistent with the 1984 rate of return target. This will befurther assessed over the next 18 months as improved data become available.
4.32 Conclusion. Through on-going works, the installed water productioncapacity is being increased substantially. It is important that KJS: (a)makes effective use of this capacity, and of existing sewer capacity; (b)improves its internal efficiency; and (c) improves its revenue generation.The actions outlined above have been analyzed in some detail to assess theirlikely impact on various operating and financial indicators and to help estab-lish realistic targets for the future. This analysis, which has been discussedwith KJS, UPJI and GOUP, is presented in Annex IV. The analysis suggests thatif the rate of progress achieved in 1980/81 can be maintained, KJS would coverits operating expenditure and debt service starting with FY1983/84 (water sup-ply only) and 1984/85 (water supply and sewerage). This would require, inaddition to operating improvements, tariff and tax increases, averaging 30%for water supply and 100% for sewerage. To achieve this cash flow objective,tariff and tax increases would have to be correspondingly higher if operationalimprovements fail to materialize as projected.
4.33 Accordingly, agreement was reached with GOUP at negotiations that itwill cause KJS to:
(a) initiate, by April 1982, a wastage and leakage detection pro-gram, including production metering and area-wise bulk metering;develop by September 30, 1982, an action program to reducewastage and leakage to a level acceptable to IDA; and thereafterimplement such action program in accordance with a time scheduleacceptable to IDA;
(b) initiate an accelerated water connection program, to achievenot less than 80,500 total water-connections by March 31, 1985;

- 35 -
(c) introduce quarterly water meter reading and semi-annual bill-ing during 1981/82, progressing to quarterly billing witheffect from 1982/83;
(d) strengthen its meter repair and replacement capability, throughthe provision of adequate staff and spare parts, to ensure thatnot less than 75% and 90% of installed meters are fully func-tional in each quarter with effect from the quarter beginningJanuary 1 and October 1, 1983, respectively;
(e) improve its collection procedures, including procedures fordisconnection in the event of payment default, to achieve cashcollections of at least 60%, 65%, 70%, 75% and 80% of the cur-rent year's receivables during fiscal years 1981/82, 1982/83,1983/84, 1984/85 and 1985/86, respectively; and
(f) generate sufficient revenues, through operational improvements,and if necessary, tariff revisions, to cover not less than (i)75% of the operation and maintenance costs and debt servicerequirements for its water supply operations for the fiscalyear beginning April 1, 1982, (ii) 100% of the operation andmaintenance costs and debt service requirements for its watersupply operations for the fiscal year beginning April 1, 1983,and (iii) 100% of the operation and maintenance costs and debtservice requirements for its water supply and sewerage opera-tions for each year commencing with the fiscal year beginningApril 1, 1984.
4.34 A program to increase sewer connections under the project is discussedin para 2.40.
E. Financial Statements
4.35 KDA, KNM and KJS keep their accounts in a rudimentary cash form,with little meaningful analysis. Although some attempt is made, in each case,to separate capital transactions from current transactions, these separationsare arbitrary and do not strictly follow any standard accounting logic. Itwould have been helpful, had these separations been made, to have had separ-ately balancing statements for capital, current and special funds. In presentcircumstances, such an attempt at sophistication would be pointless. Instead,in Annex 3, simple statements of receipts and payments are given, categorizedin the best manner possible from available information. No balance sheets areshown, because assets and liabilities remain to be authentically established.This in itself will be no easy task, even with the assistance of consultants.
4.36 GOUP has undertaken to ensure that adequate accounting systems willbe fully operational for KDA and KNM by April 1983 and for KJS by April 1982.In the meantime, adequate arrangements will be in force for the safe andefficient handling of project funds and for the full and proper accountingthereof.

- 36 -
V. PROJECT IMPLEMENTATION
A. Execution
5.01 Responsibility for execution of the major portion of the projectfalls on the Kanpur Development Authority. Responsibilities are:
1. Sites and Services and Slum Upgrading
- Overall responsibility KDA- Land acquisition KDA- Site development, on- and
off-site infrastructureand core housing KDA
- Common facilities centers Directorate of Industries- Schools Department of Education- Health centers KNM- Police stations Department of Home- Community centers KDA- Community development
activities and training a/ KNM/KDA
- Beneficiary selection KDA (Directorate of Industriesfor small-business plots)
- Issue of leases KDA- Collection of charges KDA
2. Environmental Sanitation, Maintenance and Traffic Management
- Water supply KJS (executed by Jal Nigam)- Sewerage KJS (executed by KDA)- Drainage KNM (executed by KDA)- Solid waste management KNM- Maintenance KNM- Traffic engineering measures KNM
3. Technical Assistance and Institutional Strengthening
- Development of a strategy Departments of Housing and Urbanfor statewide urban devel- Development, b/ GOUP through Townopment and management and Country Planning Department
- Consultant services fororganizational managementand financial studies KDA, KNM and KJS
- Training and other services KDA, KNM, KJS, DOI, T&CPD
a/ UNICEF would provide assistance to KDA and KN1* under the UNICEF-sponsoredCommunity Development Project for Kanpur.
b/ The former Department of Local Self-Government responsible for localauthorities has been recently renamed the Department of Urban Development.

- 37 -
5.02 KDA will implement the shelter components and some of the majoroff-site infrastructure components of the project as part of its regularactivities. For the project period, KDA will increase its staff to cope withthe additional workload. KDA will obtain the necessary staff largely from thecentralized services on secondment. In addition to implementing the sheltercomponents, KDA will execute the off-site sewerage works or behalf of KJS andthe drainage works on behalf of KNM. Off-site water supply will be executedby UP Jal Nigam on behalf of KJS. KNM will implement the solid waste manage-ment, maintenance and traffic management components.
5.03 UP Jal Nigam has undertaken the design of water supply works and theLatuche Road-Cooper Ganj-Basmandi storm sewer for the project. The remainingoff-site works of drainage and sewerage, comprising secondary and tertiarynetworks, have been designed by KDA on behalf of KNM.
B. Implementation Schedule
5.04 The project would be implemented over the period, April 1, 1981to June 30, 1985. An implementation schedule is shown in Annex 3, Chart 4.Final engineering designs for all three sites and services sites have beencompleted. Bid documents for the two larger sites and services areas havebeen prepared and reviewed by IDA. Bids for 15 ahatas have been received andawards are to be made soon. A pilot upgrading project has been completed inApril 1981 (Rolling Mill ahata). All land for sites and services has beenacquired. Twenty-eight ahatas, sufficient for two years work, are in thepossession of KDA. Thus far, the preparation team has done an excellent job.GOUP attaches great importance to this project, and has assured every assis-tance in project implementation, including the supply of cement, which is insomewhat short supply in India. Disbursements are expected through March 31,1986 and the closing date would be June 30, 1986 (para 5.13).
C. Procurement and Disbursement
Procurement
5.05 Procurement of plant, equipment and vehicles under the projecttotals about US$2.4 million equivalent, exclusive of contingencies, includingan estimate for equipment to be procured for the maintenance component by KNMand KJS, which must await the outcome of the study referred to in para 2.51.Contracts totaling about US$1.9 million equivalent will be awarded on the basisof competitive bidding advertised locally, in accordance with procedures thatare acceptable to IDA. The items, to be procured in stages, are varied, smallin number and involve a number of manufacturers, and would not attract theinterest of foreign manufacturers. It was also recognized that local procure-ment had the important advantage of allowing project authorities to benefitfrom existing repair and spare parts facilities in the State. Contractsfor about US$300,000 equivalent would be awarded on the basis of internationalcompetitive bidding in accordance with Bank guidelines. A margin of preferenceof 15% or the applicable customs duties, whichever is lower, will be appliedto domestic bidders offering domestically manufactured goods.

- 38 -
5.06 The remaining equipment to be procured under the project (totalvalue US$200,000) would involve small contracts (under US$50,000) for itemsnormally procured without competitive bidding, which would be procuredthrough normal commercial channels after obtaining quotations from at leastthree suppliers.
5.07 The total estimated base cost value of civil works contracts underthe project is about US$25.3 million equivalent. Larger works comprisesites and services at Barra (US$7.6 million) and Gujaini (US$4.5 million),slum upgrading (US$4.6 million) and off-site branch sewers (US$4.7 million).The smaller works include off-site water supply (US$0.5 million), drainage(US$1.5 million), sites and services at Pokharpur (US$0.4 million), sitespreparation for sites and services (US$0.6 million) and traffic managementmeasures (US$0.9 million).
5.08 Concerning the sites and services works, design objectives pointto unsophisticated and India-specific construction methods: (a) the use ofbrick, lime and fly ash to minimize the use of cement, steel and stone aggre-gate (the latter unavailable in Kanpur); (b) the use of material and technologythat is simple, flexible and familiar to beneficiaries to permit re-use ofmaterial and to facilitate simple additions; and (c) the use of labor-intensivetechnology. Slum upgrading is distributed over about 90 slums on private land,of which so far 28 have been acquired. The works will have to be carried outon a slum-by-slum basis. As for the branch sewer works, they are subordinatedto slum upgrading, and have to be implemented under annual contracts--averagingabout US$0.8 million--in step with finalization of the slum acquisition program.The remaining civil works are small and scattered. Because of their numbers,size, nature and staggered implementation phases, civil works contracts wouldnot attract interest from foreign contractors.
5.09 The contracts for sites and services at Barra and Gujaini (totalingUS$12.1 million) and for off-site branch sewers (US$4.7 million) will be basedon "slice-and-packaging," and will be awarded following competitive biddingamong prequalified contractors on an all-India basis. The other contractswill be awarded following competitive bidding advertised locally in UttarPradesh.
5.10 The decision of GOUP and the agencies to execute the major civilworks through large contracts represents a major advance from current prac-tices. Apart from reducing delays and the burden of administering a largenumber of small contracts involving materials supply, the new conditionsof contract make contracting less of a gamble for contractors. On largecontracts, only cement will be supplied to contractors. GOUP and KDA haveagreed that a technical consultant, experienced in the administration oflarge civil works contracts, will be engaged prior to the bid evaluation forthe larger contracts.
Disbursement
5.11 Disbursement of the proceeds of the IDA Credit would be as follows:(a) 100% of foreign expenditure of directly imported plant, equipment, andvehicles, and 100% of local expenditure (ex-factory) of locally manufacturedplant, equipment and vehicles procured through international competitive

- 39 -
bidding; (b) 55% of expenditure on contracts for plant, equipment and vehicles,which will be awarded on the basis of competitive bidding advertised locallyand through local shopping; (c) 55% of expenditure on contracts for civilworks; (d) 70% of expenditure on loans made to beneficiaries for home construc-tion or improvement; (e) 70% of expenditure on loans made to small businessesfor construction or extension of buildings; (f) 70% of expenditure on loansmade to beneficiaries for sewer connection loans; and (g) 100% of expenditureon technical assistance.
5.12 Disbursements for (d), (e) and (f) above will be made against state-ments of expenditure and the executing agency will retain supporting documentsfor inspection by supervision missions. All other expenditures would be fullydocumented.
5.13 A schedule of disbursements of the IDA credit is shown in Table 5.1.The region-wide sectoral disbursement profile for the Urban Sector indicatesthat disbursements would cover a six-year period. In this project, however,the disbursement period is estimated at five years as: (i) all land forsites and services has already been acquired; (ii) land for 28 out of about90 slums designated for upgrading has already been acquired; and (iii) sitesand services and branch sewer contractors would be prequalified with largecontracts being awarded on a "slice and package" basis. The resultantcontracts would be fewer in number and easier to administer.
Table 5.1: ESTIMATED DISBURSEMENT SCHEDULE
CumulativeIDA Fiscal Year Quarter Ending Disbursements Disbursements
(US$'000) (USS'000)
1982 September 30, 1981December 31, 1981 - -March 31, 1982 400 400June 30, 1982 800 1,200
1983 September 30, 1982 1,600 2,800December 31, 1982 1,600 4,400March 31, 1983 1,800 6,200June 30, 1983 2,000 8,200
1984 September 30, 1983 2,000 10,200December 31, 1983 2,000 12,200March 31, 1984 1,800 14,000June 30, 1984 1,800 15,800
1985 September 30, 1984 1,700 17,500December 31, 1984 1,600 19,100March 31, 1985 1,500 20,600June 30, 1985 1,400 22,000
1986 September 30, 1985 1,200 23,200December 31, 1985 1,000 24,200March 31, 1986 800 25,000

- 40 -
D. Accounts and Audits
5.14 KDA, KNM and KJS will separately identify project-related trans-actions within their normal accounting and financial reporting systems.Consultant studies currently underway at KDA and KNM have been deliberatelydesigned to improve internal controls and accounting systems. KJS is imple-menting similar systems as part of the UP Water Supply and Sewerage Project.It has been agreed that the three agencies will complete the annual accountspromptly and that they will employ independent auditors acceptable to IDA toaudit their financial accounts and statements for each fiscal year. No laterthan nine months after the close of each financial year, the agencies willsubmit to IDA audited financial statements and auditor's report together withan evaluation of the internal controls and financial management of the agenciesaccompanied by recommendations for improvements, if deemed necessary.
E. Monitoring and Evaluation
5.15 Throughout project preparation, KDA performed excellently in sub-mitting succinct progress reports, monthly to GOUP and quarterly to IDA.KDA will continue to produce monthly summary status reports of all activitiesand submit such reports to the Project Management and Monitoring Committee,with recommendations for corrective action. The Project Management andMonitoring Committee will prepare quarterly reports on the progress of theproject toward its physical, financial and programmatic goals and submitthese reports to IDA within one month of the expiration of each quarter.
F. Supervision
5.16 About 70 staff-weeks of IDA supervision would be required over theproject implementation period spread evenly.
VI. COST RECOVERY, PRICING AND AFFORDABILITY
A. Cost Recovery
6.01 The basic premise of the project is to maximize recovery ofinvestment costs in order to ensure financial replicability of the program,as indicated below and in Annex 2, Chart 3.

- 41 -
Expenditure Item Means of Cost Recovery
1. Shelter
(a) Sites and ServicesLand Plot chargesOn-site infrastructure Plot chargesOff-site infrastructure Water and sewerage
partly recoveredthrough user charges
On-plot development Plot chargesShelter loans Loan chargesCommunity facilities Partly recovered (half cost
of land for schools and landfor community centers)
Small business loans Loan charges
(b) Slum UpgradingLand Plot chargesOn-site infrastructure Plot chargesHome improvement loans Loan chargesSanitary core loans Loan charges
2. Environmental Sanitation, Maintenance and Traffic Management
Infrastructure Water supply and seweragepartly recovered throughuser charges
Sewer connection loans Loan chargesSolid waste management Not recovered directlyMaintenance Not recovered directlyTraffic management measures Not recovered directly
3. Technical Assistance and Institutional Strengthening
Consultant and advisoryservices, training andstart-up costs for state-and local-level agencies Not recovered
Sites and Services
6.02 About 86% of component cost is for directly chargeable cost items(land, site preparation, on-site infrastructure, on-plot development andshelter loans) and would be fully recovered through plot sales and loanrepayments. Five percent of component cost is for community facilities(land, infrastructure, buildings and equipment) which would not be directlyrecovered, except for half the cost of land for schools and full cost ofland for community centers, which will be recovered through plot charges.Off-site infrastructure comprising about 7% of component cost would bepartially recovered through user charges. About 2% is for small-business,which is fully recovered except for the costs of common facilities centers,which are partially recovered.

- 42 -
6.03 Beneficiary selection will be mainly based on income. Additional
eligibility criteria include residency in Kanpur and no claim to ownershipof other properties in the Kanpur district. Income declaration will bebased on sworn affidavits by beneficiaries. EWS beneficiaries will be freeto construct incremental shelter without the requirement of building permits,subject only to setbacks at the front and rear of the plot and maximum sitecoverage of 66%. Assurances were obtained during negotiations that benefi-ciary selection criteria would be satisfactory to IDA.
6.04 Residential plots would be sold with 90-year leasehold titles. AllEWS (except EWS 1) and LIG plots would require a down payment of 10%, and thebalance would be repaid at not less than 12% interest per annum over not morethan 20 years. EWS 1 plots would be sold at the same terms except that the
down payment would be only 5%. All other plots, including commercial and smallbusiness plots, would require a 25% down payment, with the remainder being paidover not more than 10 years at not less than 12% interest p.a. Due to thephased construction of dwellings by beneficiaries, the assessed rental valueof dwellings may fall below the threshhold (Rs 500 per year) below whichproperty tax is not chargeable. To assist KNM to maintain the newly developed
areas, maintenance charges of Rs 2.5 per month for EWS, Rs 5-11 per month forLIG plots and Rs 30 per month for MIG plots will be levied in the interimperiod, and would be added to the monthly payment (Table 6.1). Maintenancecharges would cease when beneficiaries become eligible for payment of propertytaxes. KDA will pass on maintenance charges collected, to KNM. Beneficiariesmay not sell their plots for a period of 5 years without giving KDA firstoption to purchase and set the sales price. Thereafter, plots could be freelysold by title holders upon payment of the outstanding principal and interest.Optional shelter loans of Rs 1,500, Rs 900, Rs 500 and Rs 500 would be providedfor purchasers of EWS 1, 2, 3, and 4 plot options, respectively, and Rs 3,000,Rs 3,500, Rs 4,000 and Rs 4,000 for purchasers of LIG 1, 2, 3, and 4 plotoptions, respectively, to construct or expand homes. These loans would be atan interest rate of not less than 12% p.a. over not more than 20 years. Build-ing construction/expansion loans for small businesses would be provided at aninterest rate of not less than 12% p.a. over not more than 20 years. No loanswould be provided in the project for MIG and HIG households who would obtainhousing finance from commercial banks, cooperative societies and other sources.Assurances were obtained during negotiations that conditions of lease and mort-gage and terms and conditions for loans for beneficiaries in sites and serviceswould be on terms and conditions satisfactory to IDA.
6.05 The interest rate of not less than 12% p.a. adopted for plot chargesand loans reflects a substantial increase from the 4%-6% p.a. interest ratesadopted for EWS and LIG housing under the State and HUDCO-funded schemes. Thecommercial interest rate for middle and upper income housing is about 14% p.a.currently, and the inflation rate for India is expected to be about 9% p.a.over the project period.
Slum Upgrading
6.06 About 99% of the component cost is for directly chargeable costs(land, on-site infrastructure, and funds for home improvement) which would befully recovered through improvement charges and loan repayments. The remaining1% of component cost is for the common facilities center which would be partly

- 43 -
recovered through charges levied for use of the facilities. The cost of landfor the small multi-purpose community rooms would be recovered from benefi-ciaries. Off-site infrastructure for slum upgrading is included in theenvironmental sanitation component, and would be partly recovered throughuser charges.
6.07 The cost of land and improvements would be recoverej in monthlypayments by hoyseholds ranging in amounts from Rs 13 for 15 m plots toRs 52 for 45 m plots, over 20 years. A 5% down payment would be required.A monthly maintenance charge of Rs 2.50 for plots below 45 m and Rs 5 forall other plots will also be charged from beneficiaries (Table 6.2) and passedon to KNM. Repayment of the plot charges and home improvement loans would beat not less than 12% interest p. a. over not more than 20 years. Prepaymentof the loans for land and improvement would be permitted at any time withoutpenalty. Resale of the plots would be allowed on full payment of principaland interest due on land, infrastructure and home improvement loans. However,beneficiaries may not sell their plots for a period of 5 years without givingKDA first option to purchase and set the sales price. Beneficiaries onplots less than 60 m will be free to construct or improve houses withoutthe requirement of building permits subject only to minimum setbacks. Landtenure would be provided to the beneficiaries through 90-year leaseholdtitles. Assurances were obtained during negotiations that conditions of leaseand mortgage and terms and conditions of loans for slum households would beon terms and conditions satisfactory to IDA.
B. Pricing
6.08 Sites and Services. Prices of residential plots would reflectdifferences in infrastructure levels, on-plot development, location, accessi-bility and plot sizes. As a result, the EWS plot options would be pricedat less than average square meter cost, while prices of LIG, MIG, HIG andthe commercial and small industry plots would be set at above average costs.Overall, full cost recovery would be achieved. Current market prices chargedfor commercial and small-business plots are estimated at Rs 200 and Rs 100per square meter, respectively. The actual selling price would be determinedat time of offering, with-the commercial plots generally offered for sale byauction. The sale of commercial plots will not be limited to any incomegroup. Based on current practice, half the cost of land for schools willbe charged to the Department of Education. Land for community centers andmultipurpose community rooms will be borne by beneficiaries. Price of landfor other public and community facilities would be set at cost, and chargedto the budgets of the respective government departments.
6.09 Slum Upgrading. The ayerage cost of acquisition of the alreadyacquired ahatas is about Rs 25/m gross. They had been acquired under theprovisions of the Land Acquisition Act. The compensation formula for acqui-sition under the Slum Areas (Improvement and Clearance) Act, under which theremaining ahatas will be acquired, provides for 100 times monthly rentalincluding all buildings. From the rent information available at the municipalauthority, the likely cost of acquisition. of ahatas under the latter Act has

- 44 -
been computed and averages2about Rs 18/mr gross. Including management costs,it would amount to Rs 20/mr gross. The compensation provision is likely tobe subject to litigation and the final cost of acquisition will not be knownfor some time. However, in the computation of affordability a gross squaremeter cost of Rs 31 has been used, providing a cushion of about 55%.
Stamp Duty
6.10 All property transactions attract stamp duty and charges basedon the selling price. Minimum per square meter costs based on location areused by the Registrar of Deeds to check evasion of duty. In the case of plotpurchase over an extended period, the sum total of the payments (includinginterest charges) is usually considered as the "selling price." The stamp dutyand charges amount to about 11% of the "selling price." In the case of theproject, this amounts to about 26% of the price of the option. This amountis required to be paid upfront in one payment. Low income households wouldface serious problems raising this cash payment. The transfer of title takesplace soon after beneficiary selection and the title is then held by KDA untilall outstanding payments are made.
6.11 The State Government has agreed to proposals to alleviate the impactof stamp duty especially for the EWS and LIG beneficiaries. Transfer of titlefor the land only on the basis of the differential pricing system adopted willbe done at the outset soon after selection of beneficiaries. This sale ofland only will be treated as an outright sale, and KDA will use the downpayment from beneficiaries toward stamp duty payments. A separate agreementwill be effected between KDA and the beneficiary for the remainder of theoutstanding debt. This arrangement will bring the stamp duty and charges toabout Rs 230 for the EWS 1 plot option and Rs 360 for the LIG 3 plot option.Stamp duty and charges for the slum upgrading areas would be computed on thebasis of selling price for land only, taking account of the differentialpricing mechanism. The total down payments will be sufficient to meet stampduty and charges for the agreement. GOUP has approved these procedures to befollowed by the Registrar of Deeds with respect to the imposition of stampduty on sites and services and slum upgrading beneficiaries.
C. Affordability
6.12 About 68% of all plots in the sites and services area would beaffordable to EWS households with incomes less than Rs 350 per month, whichcorresponds to about the 45th percentile of the Kanpur urban household incomedistribution. The2monthly cParges for upgraded areas would be about Rs 12and Rs 21 for 15 m and 25 m plots respectively, exclusive of home improvementloans. For households with incomes of Rs 150 and Rs 200 per month, the abovemonthly charges represent 8% and 10.5% of income toward shelter. About 70% ofahata beneficiaries are estimated to have incomes below Rs 350 per month. Thedifferential pricing mechanism would provide beneficiaries with choices foradjustment of2plot sizes, exchanges within the ahata and further subdivisions.Plots of 15 m would be affordable to the 10th percentile of the Kanpur Slum

- 45 -
Income Distribution (Annex 2, Chart 1). Flexibility in the determination ofa minimum plot size would ensure that even poorest households would be accom-modated, as demonstrated in the pilot upgrading scheme ai Rolling Mill ahata,where the smallest plot size comprised one room of 7.5 m for a single person.Affordability analysis for sites and services and slum upgrading is givenin Tables 6.1 and 6.2, respectively.
(reduced Tables 6.1, 6.2 to be inserted here)
Table 6.1: SITES AND SERVICES: PLOT OPTIONS, COSTS, INDICATIVE CHARGES, AND AFFORDABILITY(March 1981 prices)
EWS1 EWS2 EWS3 EWS4 LIGI LIG2 LIG3 LIG4 IIIG 'dG
Plot Size (m 2) 36.75 36.75 36.75 36.75 57.75 57.75 57.75 81 180 300Number of Plots 1,456 5,000 1,856 1,800 203 612 350 1,620 1,696 184Percentage of Plots 9.85 33.84 12.56 12.18 1.37 4.14 2.37 10.96 11.48 1.25Land & Infrastructure Price (Rs) 975 976 1,085 1,085 4,394 4,652 4,824 6,615 17,424 37,831Superstructure Costs (Rs) 952 2,949 5,549 6,963Stamp Duty & Bond (Rs) 231 306 400 456 344 361 361 /a /a /a
Total Price of Option (Rs) 2,158 4,231 7,034 8,504 4,738 5,013 5,185 6,615 17,424 37,831Down Payment (Rs) 100 200 350 450 439 465 482 661 4,356 9,458Recovery Period (years) 20 20 20 20 20 20 20 20 10 10Monthly Payment (Rs) /b 22.66 44.38 73.60 88.68 47.34 50.07 51.78 65.56 187.49 407.07Monthly Maintenance Charge (Rs) 2.5 2.5 2.5 2.5 5.00 6.00 7.00 11.00 /c /cTotal Monthly Payment (Rs) 25.16 46.88 76.10 91.18 52.34 56.07 58.78 76.56 187.49 407.07Optional Building Loans 1,500 900 500 500 3,000 3,500 4,000 4,000 - -Monthly Payment on Building Loans (Rs) 16.52 9.91 5.51 5.51 33.03 38.54 44.04 44.04Total Monthly Expenditure (Rs) 41.68 56.79 81.60 96.69 85.37 94.61 102.82 120.60 187.49 407.07Monthly Income (Rs) 200 250 300 350 400 450 500 600 1,500 2,500Percent of Income on Shelter: Minimum /d 12.58 18.75 25.37 26.05 13.08 12.46 11.76 12.76 12.50 16.28
Maximum /d 20.84 22.72 27.20 27.63 21.34 21.03 20.56 20.10 12.50 16.28
/a Beneficiaries of LIG4, MIG and HIG plots will be required to provide stamp duty and and bond charges, in addition to downpayment, at transfer of title.
/b Recovery of plot charges and loans will be at an interest rate of not less than 12% per annum. Plot charges include physicalcontingencies, design, supervision and management and interest during construction.
/c MIG and RIG will qualify for property tax from the outset.Id Minimum and maximum expenditure relates to without and with building loans, respectively.
Table 6.2: SLUM UPGRADING: PLOT SIZES, COSTS, INDICATIVE CHARGES, AND AFFORDABILITY(March 1981 prices)
Plot Size 15m2
20m2
252 30m2
452 6Om2
80m2
100m2
Number of Plots 3,647 4,348 3,597 3,230 2,260 1,273 981 526Percentage of Plots 18.36 21.89 18.11 16.26 11.38 6.41 4.94 2.65
Land & Infrastucture Price (Rs) 898 1,299 1,951 2,603 4,231 6,339 9,615 13,618Stamp Duty & Bond (Rs) 142 176 235 316 481 /a /a /aTotal Price of Option (Rs) 1,040 1,475 2,186 2,919 4,712 7,076 10,743 15,285Down Payment (Rs) 52 74 109 146 236 354 537 764
Recovery Period (years) 20 20 20 20 20 20 20 20Monthly Payment (Rs) /b 10.88 15.43 22.87 30.53 49.29 74.02 112.38 159.89Monthly Maintenance Charge (Rs) 2.5 2.5 2.5 2.5 2.5 5 5 5Sanitary Core Loan (Rs) 1,000 1,000 1,000 1,000 1,000 1,000 1,000 1,000Monthly Payment on Construction Loan (Rs) 11.01 11.01 11.01 11.01 11.01 11.01 11.01 11.01Hone Improvement Loan (Rs) 500 500 500 500 1,000 1,000 - -
Monthly Payment on Building Loan (Rs) 5.51 5.51 5.51 5.51 11.01 11.01 - -
Monthly Expenditure (Rs) Minimum 13.38 17.95 25.37 33.03 51.79 79.02 117.38 169.89Maximum 29.90 34.45 41.88 49.55 73.81 101.04 128.39 187.90
Monthly Income (Rs) 150 200 250 300 400 550 650 900Minimum Percentage of Income 8.92 8.96 10.15 11.01 12.95 14.37 18.06 18.32Percent of Income with Construction Loan 16.26 14.47 14.55 14.68 15.70 16.37 19.75 19.52
Building Loan 19.93 17.22 16.75 16.52 18.45 18.37 19.75 19.54
/a Beneficiaries of plots greater than 50 m will be required to provide stamp duty and bond charges, in addition to down pay-ment, at transfer of title.
/b Recovery of plot charges and loans will be at an interest rate of not less than 12X per annum. Plot charges includephysical contingencies, design, supervision and management and interest during construction.

- 46 -
VII. JUSTIFICATION AND RISKS
A. Economic Evaluation
General
7.01 The shift in investments to low-cost shelter, commenced in 1978in Kanpur, would be given greater momentum through the project. The projectwould also be instrumental in shifting an increased proportion of GOUP Planfunds to urban development. Institutional weaknesses identified would beaddressed on a broad front, through strengthening organization and management,financial management and accounting, resource mobilization and collection.In varying degrees these efforts would affect KDA, KNM and KJS. Experiencesof the institutional improvement program would be used to improve the urbanagencies in the other KAVAL towns. The adoption of full cost recovery,realistic interest rates and affordable solutions would influence the StateGovernment to expand these measures and thus reduce subsidies to urban areas.The state-level program would develop a strategy for statewide urban develop-ment and management based on the above measures and additional programsintroduced under the project.
Sites and Services and Slum Upgrading
7.02 Estimates of economic benefits of the sites and services componentare derived from imputed rental values of similar serviced residential plotsbased on recent sample surveys by KDA, and market value of serviced commercialand small-business plots. The costs include shelter loans and all directlychargeable costs of land and on-site infrastructure and maintenance costs of2-1/2% and excludes taxes, costs of schools, health centers, other communityfacilities. On the above basis, the economic rate of return for the sites andservices component is estimated at 18%.
7.03 The economic benefits of the slum upgrading components are estimatedon the basis of the increase in imputed rental value created by infrastructureand service improvement. Costs, net of taxes, include all directly chargeablecosts of land, on-site infrastructure, home improvement loans and maintenancecosts of 2-1/2%. The economic rate of return on this basis is estimated at26%.
7.04 Rates of return were not computed for other project components dueto difficulties of quantifying their benefits. However, various qualitativebenefits are discussed below.
7.05 Health and educational benefits would accrue to 75,000 persons and43,000 primary and high school students, respectively, through the healthcenters and schools provided under the project. The general improvements inshelter and health facilities would generate many unquantifiable benefits,particularly reduction in the incidence of tuberculosis and infant mortality.The small-scale business program in the project would improve artisan andentrepreneurial skills of small business persons and lead to increased incomes.

- 47 -
Environmental Sanitation
7.06 Though primarily designed to cater for the project slum areas, thebenefits of the environmental sanitation subcomponent would accrue to a muchwider population, estimated at more than double the direct project benefi-ciaries, or about 200,000 people.
7.07 The program to expand the sewer system, the connection programand its enforcement would achieve a wide health and environmental impactin the central core of the city where almost 50% of the population resides.Generation of sufficient flows in the sewers would reduce the current annualexpenditure on clearing blocked sewers, amounting to about 20% of the KNIbudget, according to estimates. Extensions to the tertiary sewer system wouldachieve greater utilization of the trunk sewers installed sometime ago, butcurrently utilized at only about 20% capacity. The loan scheme for sewerconnections and the enforcement program would ensure that these benefits wouldbe realized.
7.08 The solid waste management program would primarily benefit over100,000 households in the central core where the ahatas are located. Refusecollections would be introduced in this area in a systematic manner whereup to now only a skeletal service exists. Improvements to the nightsoilcollection and disposal would reduce the serious health risk that now existsfor the residents of the slum areas. In addition to expanding the collectionof nightsoil, measures would be taken to prevent human excreta from endingup in neighborhood open drains through control over private collectors.
Urban Poverty Impact
7.09 The main thrust of the project would be to provide benefits to theurban poor. Eighty-seven percent of the upgrading beneficiaries or 18,000households are in the urban poverty group. In the sites and services compo-nent, 74% of the plots are affordable by the urban poor. About fifty percentof the environmental sanitation component would benefit the urban poor. Ofthe total project cost of US$51.7 million equivalent, 69% or US*35.9 equivalentis attributable to the urban poverty group. IDA estimated urban povertythreshold is US$132 per capita per year or Rs 485 per household per month (5.5persons per household).
7.10 The urban poverty impacts are tabulated in Table 11, Annex 2 and aresummarized below:
(a) about 74% of residential plots in the sites and services areasare affordable by the urban poor (11,000 out of 15,000 plots);
(b) about 50% of the annual demand for new shelter by theurban poor will be met by this project during the projectperiod;
(c) about 87% or 18,000 households in the upgrading areas arein the urban poverty group;

- 48 -
(d) about 45% of the benefits of the off-site water supply,sewerage and drainage are expected to accrue to theurban poor;
(e) solid waste management improvements will accrue mostly tothe low-income areas and about 70% of benefits are expectedto accrue to this group; and
(f) traffic management measures are concentrated in the densestareas of the city and about 45% of the benefits are expectedto accrue to the urban poor.
B. Risks
7.11 The main risk in the project relates to land acquisition of theahatas. The ahatas are well located in the central area of the town and thechances of success of the acquisition under the UP Slum Areas (Improvement andClearance) Act 1962 are uncertain, as the Act is yet to be tested in the State.Some of the ahatas, however, could be substituted with slums on public land.If the compensation payable substantially exceeds the provisions of the Act,there may come a point at which slum upgrading in the central area with fullcost recovery would not be feasible. A margin of about 55% has been allowedin the gross selling price for ahata land, yet in the absence of previousexperience, the risk remains. If the average costs of acquisition were toexceed the estimates substantially, a number of options would need to be con-sidered, including the deletion of the more expensive ahatas, reduction ofinfrastructure standards and a subsidy on the cost of land.
7.12 The second set of risks relates to the capacity of the agenciesto implement the project in the project period. For KDA, the project wouldalmost double annual expenditures from current levels. Following completionof ongoing works, KDA will need to carefully assess execution capacity beforeundertaking additional investments. KDA has, however, in the recent yearssuccessfully expanded its investment activities without undue strain. Thebulk of the civil works would be carried out under large contracts and wouldconsiderably ease the burden of administering a large number of small con-tracts. However, KDA would obtain the major portion of staff on secondmentfrom the centralized services. This arrangement will permit KDA to easilyadjust its staff strength so that its activity can be most easily ta4loredto fit future availability of funds and to rapidly scale down if such fundsare not available. Additionally, supply constraints in materials such ascement and steel constitute risks for timely completion of the works. Thesteel supply situation has eased, but cement supply and distribution isstrictly controlled. KNM and KJS will need to expand its maintenance cap-ability to serve the additional areas developed under the project.

- 49 -
VIII. AGREEMENTS REACHED AND RECOMMENDATIONS
8.01 During negotiations, the following principal agreements were reached:
(a) GOUP would ensure that, not later than April 1, 1983, theKNM would make such organizational and operational changesin its solid waste management service as would be agreed uponbetween IDA and the KNM, based on the recommendations of thestudy being conducted by the consultants on the organizationand management of the KNM (para 2.47).
(b) GOUP would ensure that KNM would (i) establish, by April 1,1982, a Traffic Engineering and Management Cell with adequatestaff, and (ii) implement such low cost traffic managementschemes as would be agreed upon between KNM and IDA (para2.49).
(c) GOUP would ensure that only such investments for maintenanceimprovements would be undertaken as would be agreed betweenIDA, KNM and KJS based on the recommendations arising fromthe study now being carried out of the maintenance functionsof the KNM and KJS (para 2.50).
(d) GOUP would cause KNM to implement, not later than April 1,1983, such measures to increase its revenues as would beagreed upon between GOUP, KNM and IDA on the basis of recom-mendations arising from the resource mobilization study,presently being carried out by consultants (para 4.19).
(e) GOUP would cause KJS to take steps to improve its operatingefficiency and financial performance through: (i) a wastageand leakage program to commence by April 1, 1982, includingproduction and bulk metering; (ii) an accelerated connectionprogram to achieve not less than 80,500 total water connec-tions by March 31, 1985; (iii) more frequent meter readingand billing commencing in the fiscal years 1981/82; (iv) aneffective collection program to achieve cash collectiontargets for the fiscal years 1981/82 through 1985/86; (v)revenue increases to cover fully the costs of operation, main-tenance and debt service for the water supply operation in thefiscal year 1983/84 and the water supply and sewerage opera-tions for each year with effect from the fiscal year beginning1984/85 (para 4.33).
(f) GOUP would cause to be taken all such action as may benecessary to introduce accounting systems, in respect of theKDA, KNM and KJS, satisfactory to IDA and to ensure that saidaccounting systems shall be fully operational in respect ofthe KJS by April 1, 1982 and in respect of the KDA and theKNM by April 1, 1983 (para 4.36).

- 50 -
(g) GOUP would ensure that KDA, KNM and KJS would (i) havetheir accounts and financial statements audited annually byindependent auditors acceptable to IDA, and (ii) furnish toIDA, no later than nine months after the close of each fiscalyear, certified copies of their financial statements and theauditor's report in such scope and detail satisfactory to IDA(para 5.14).
(h) GOUP would ensure that in respect of the sites and servicesto be developed by the KDA: (i) the beneficiary selectioncriteria, (ii) the terms and conditions of lease and mortgage;and (iii) the terms and conditions of shelter constructionand small business loans to the beneficiaries, shall all besatisfactory to IDA (paras 6.03-6.05).
(i) GOUP would ensure that, (i) the terms and conditions oflease and mortgage, and of improvement loans, to the benefi-ciaries of slum upgrading (para 6.07) and (ii) the terms andconditions of the sewer connection loans (para 2.40) shallall be satisfactory to IDA.
8.02 On the basis of the above agreements, the project would be suitablefor an IDA credit to GOI of US$25 million.

- 51 -ANNEX 1Page 1
INDIA
KANPUR URBAN DEVELOPMENT PROJECT
SUMMARY OF UNICEF-SPONSORED URBAN COMMUNITY DEVELOPMENT PROJECT
Objectives
1. The objectives of the project would be to: (a) encourage communityparticipation in the planning, provision and maintenance of urban services,(b) develop an awareness of civic responsibilities, (c) provide assistanceto beneficiaries to gain access to basic water supply and sanitation, (d)enhance planning and implementation capacities of urban agencies, partic-ularly KNM, to provide basic services to children, women and the urban poorgenerally, through the provision of programs in health, nutrition, education,income generation, recreation and assistance with shelter improvement; and(e) provide technical assistance and training to agencies and staff of KDAand KNM.
Organization
2. The UNICEF inputs will initially be over a three-year period 1981-83.Subject to review and mutual agreement, the program will be extended through1985. Initial responsibility for the program would be with KDA so thatactivities could be carried out in parallel with the Kanpur Urban DevelopmentProject. Eventually, KNM will take over full responsibility for supervision,implementation, monitoring and evaluation, with a 75% state support for itscontinuation.
Components
3. Project components will include:
(a) community participation in physical improvements in theneighborhood;
(b) environmental improvements;
(c) health, nutrition and educational programs;
(d) pre-school and literacy programs;
(e) social, cultural and recreational programs;
(f) income increasing programs and skills training; and
(g) technical assistance and training.

- 52 -ANNEX IPage 2
Costs
4. Project costs over the three-year period are estimated at Rs 3.48million, with a UNICEF grant of Rs 2.44 million, and the balance sharedbetween GOUP, KNM and KDA, as indicated below:
UNICEF GOUP KDA KNM Total--------------Rs '(O,000…--------------
Staff CostsSupervisory and Field Staff 7.50 7.50Other Staff 1.65 0.28 0.28 2.21
Program Costs 9.50 2.25 11.75Equipment 1.50 1.50Transport 2.08 2.08Training 1.00 1.00Community Halls 1.50 3.00 3.00 7.50Freight 0.30 0.30Monitoring and Evaluation 1.00 _ 1.00
Total 24.38 1.65 3.28 5.53 34.84
Table 1: PROJECTED URBAN POPULATION GROWTH IN UTTAR PRADESH(Population in millions)
UP Towns and Cities Cities with Populations of 100,000 and horePopulation Growth in Decade
Year/ Total Pop- Population Growth No. of Popu- % of TotalDecade ulation in Decade Cities lation Millions Urban Growth
1971 12.38 22 7.071971-1981 4.79 2.16 451981 17.17 26 9.231981-1991 6.44 2.99 461991 23.61 29 12.211991-2001 8.61 3.47 402001 32.22 36 15.68
Source: GOUP Town and Country Planning Department.

- 53 -ANNEX 2Page 1
Table 1: SITES AND SERVICES: SUMMARY OF LAND USE (Percentages)
Barra Gujaini Pokharpur Average
A. Marketable Land (to whichcosts are allocated)
Residential 49.89 49.10 55.16 51.38Commercial-cum-Residential 4.39 2.37 2.99 3.25Small Business-cum-Residential 3.13 1.79 - 1.64Educational 8.05 9.44 6.44 7.98Health 0.81 1.21 - 0.67Community Center & Post Office 0.77 0.90 0.24 0.64Police Station 0.66 0.51 - 0.39
Subtotal 67.70 65.32 64.83 65.95
B. Non-marketable Land (to whichcosts are not allocated)
Parks and Open Spaces 9.28 10.07 8.59 9.31Circulation 23.02 24.61 26.58 24.74
Subtotal 32.30 34.68 35.17 34.05
TOTAL 100.0 100.0 100.0 100.0
Table 2: SITES AND SERVICES: RESIDENTIAL PLOT DISTRIBUTION
Plot Size Barra Gujaini Pokharpur TOTAL
Plot Type m2 No. % No. % No. % No. %
EWS 1 36.75 924 11.1 458 8.1 74 9.7 1,456 9.9EWS 2 36.75 2,745 32.8 1,974 34.8 281 37.0 5,000 33.8EWS 3 36.75 1,029 12.3 712 12.5 115 15.2 1,856 12.5EWS 4 36.75 945 11.4 762 13.4 93 12.3 1,800 12.2Subtotal 5,643 67.6 3,906 68.8 563 74.2 10,112 68.4
LIG 1 57.75 147 1.8 51 0.9 5 0.7 203 1.4LIG 2 57.75 394 4.7 179 3.2 39 5.1 612 4.1LIG 3 57.75 195 2.3 127 2.2 28 3.7 350 2.4LIG 4 81.00 791 9.5 737 13.0 92 12.1 1,620 11.0
Subtotal 1,527 18.3 1,094 19.3 164 21.6 2,785 18.9
MIG 180.00 1,043 12.5 624 11.0 29 3.8 1,696 11.5HIG 300.00 132 1.6 52 0.9 - - 184 1.2
Subtotal 1,175 14.1 676 11.9 29 3.8 1,880 12.7
TOTAL 8,345 100.0 5,676 100.0 756 100.0 14,777 100.0

- 54 -ANNEX 2Page 2
Table 3: SITES AND SERVICES: STANDARDS AND SPECIFICATIONS FOR INFRASTRUCTURE
Water Supply
Standards: Design consumption 150 lpd; peak factor of 2.0; supplyfor 24 hours per day; four service connections per ferule; one firehydrant per 250 m radius (average).
Source: 300-400 m deep tubewells with overhead reservoirs for Barraand Gujaini, independent of city system; Pokharpur connected tocity network.
Network: 300 mm cast-iron mains, 250 mm-40 mm CI and asbestos cementsecondary mains and 12 mm GI service connections.
Sewerage
Standards: Designed for average flow of 110 lpd. with a peak factorof 3; rain-water infiltration at 175 I/sec per hectare allowed; minimumflow velocity of 0.75 m/second; sewage treatment in ponds to remove80% BOD (biological oxygen demand)
Network: 150 mm-450 mm concrete pipes and/or vitrified clay.
Disposal: Pokharpur site to city sewer system; Barra and Gujaini tostabilization ponds nearby and then to River Pandu.
Drainage
Drains designed for a 2-year storm frequency; curb and channel drainsand open masonry drains with outfalls.
Roads
Major through Roads: For the 36.0 m (oil pipeline reserve) and 24 mright-of-way 7.1 m wide bitumen macadam surfacing with 2.5 m brickedging and drains both sides; construction depth 28 cm.
Main Roads: For the 18 m and 12 m ROW, 3.7 m wide bitumen macadamsurfacing with single brick edging and drains both sides; constructiondepth 28 cm.
Collectors: For the 12 m ROW, 3.7 m wide bitumen macadam surfacingwith single brick edging; construction depth 20 cm.
Pedestrian ways: 3.5 m and 4.5 m ROW with brick-on edge paving, withcurb and channel drains; 3.5 m pedestrian way has curb and channeldrains on one side only.
Street Lighting and Electricity: Street lighting comprising tube lightsspaced 33 m apart with provision for individual connections.

- 55 -ANNEX 2Page 3
Table 4: SITES AND SERVICES: DETAILS OF SMALL INDUSTRY PLOTS
Landplot Plot Ar2a On-plot Pric Type Category m No. of Plots Development Rs/m
A EWS 1 36.75 29 Sanitary core 35B EWS 2-4 36.75 208 Sanitary core
+ room 35C LIG 1 57.75 2 None 70D LIG 2 57.75 5 None 80E LIG 3 57.75 13 None 85F LIG 4 81.00 31 None 90G 80.00 242 None 100H - 120.00 300 None 100
Table 5: SOLID WASTE MANAGEMENT COMPONENT
Detailed Cost Estimates (March 1981 Prices)
Rs '00,000
1. Refuse removal and disposal
750 Refuse carts and tools 3.7550 Masonry bins 1.0015 Tipper trucks (8 cu.m.) 30.004 Tractor/trailers (35 BHP) 4.001 Excavator cum payloader (90 BHP) 5.004 Payloaders (frontend, 49 BHP) 11.502 Dozers (49 BHP) 5.006 Two-ton tipping vehicles 3.602 Jeeps 1.601 Recovery vehicle 1.002 Motorcycles 0.20
Night soil digesting facility 4.00Improvements to workshops 5.00
Subtotal 75.65
2. Night soil collection and disposal
10 Night soil carrier trucks 17.50150 Night soil carts, 400 drums and 400 buckets 1.50
Protective Wear 0.85Construction of collection points 1.00
20.85
Total base cost (October 1980 prices) 96.50
Total at March 1981 prices (x 1.075) 103.74
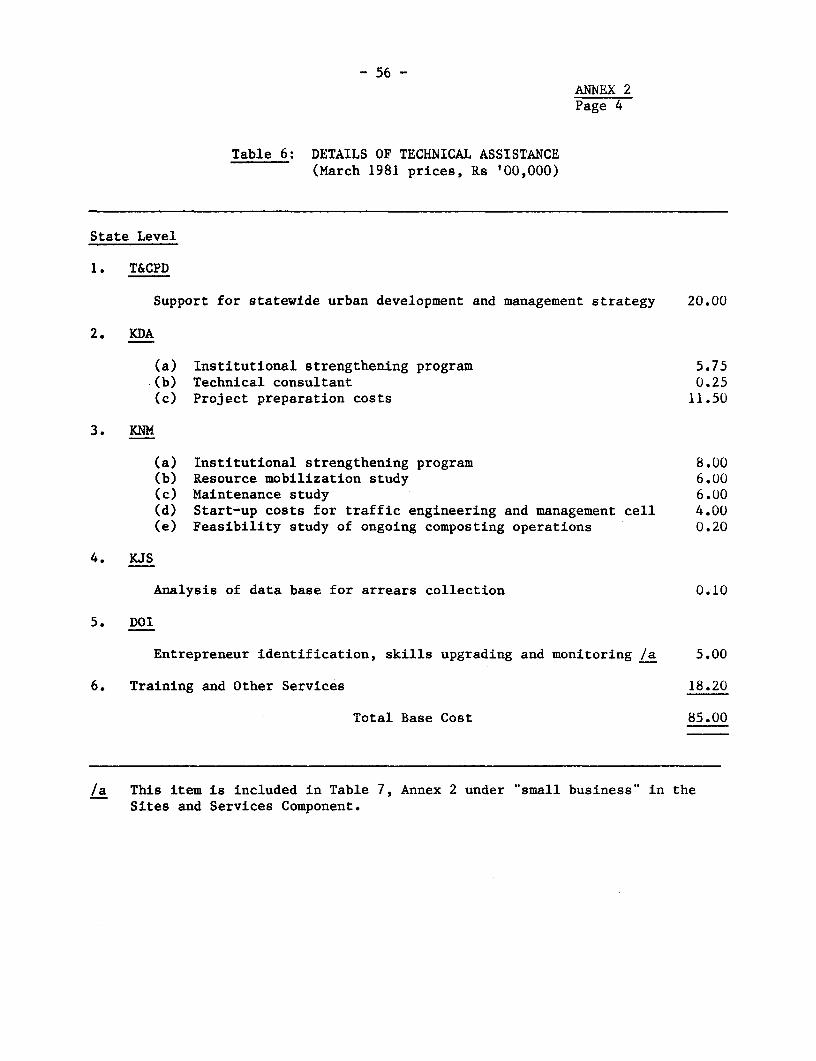
- 56 -ANNEX 2Page 4
Table 6: DETAILS OF TECHNICAL ASSISTANCE(March 1981 prices, Rs '00,000)
State Level
1. T&CPD
Support for statewide urban development and management strategy 20.00
2. KDA
(a) Institutional strengthening program 5.75.(b) Technical consultant 0.25(c) Project preparation costs 11.50
3. KNM
(a) Institutional strengthening program 8.00(b) Resource mobilization study 6.00(c) Maintenance study 6.00(d) Start-up costs for traffic engineering and management cell 4.00(e) Feasibility study of ongoing composting operations 0.20
4. KJS
Analysis of data base for arrears collection 0.10
5. DOI
Entrepreneur identification, skills upgrading and monitoring /a 5.00
6. Training and Other Services 18.20
Total Base Cost 85.00
/a This item is included in Table 7, Annex 2 under "small business" in theSites and Services Component.

INDIA
KANPUR URBAN DEVELOPME1NT PPOJECTTable 7: SITES AND SERVICES: DETAILED COST ESTIMATES
(Rs '00,000, MARCH 1981 PRICES)
YEAP I _EAX 2 Y_AR _ YE& & _f_T
LOCAL TAXES FOREIGN TOTAL LOCAL TAXES FOREIGN TOTAL LOCAL TAXES FOREIGN TOTAL LOCAL TAXES FOREIGN1 TOTAL LOCAL TAXES FOREIGN TOTAL
SITES AND SERVICES
A. LAND 160.45 - - 160.45 53.48 - 53.48 - - - - - - - - 213.93 - - 213.93
8. SITE PREPARATION 25.01 - 0.53 26.34 25.01 - 0.53 26.34 - - - - - - - 51.62 - 1.06 52.68
C. ON SITE INFRASTRUCTURE 53.81 3.06 7.56 64.43 165.55 9.43 23.27 198.25 124.16 7.07 17.45 148.68 70.36 3.99 9.90 84.25 413.88 23.55 50.18 495.61…-_- _ _ ----- _---- --- _------_---- -- ----- _------ --- - -- ------ _----- ------- _--- --- ------ --- ---- ------_-- ------ _-_- -_-_ _ -_-__ -_-_ _ -_ -
ROADS 13.42 0.7Y 1.58 15.79 41.30 2.43 4.86 48.59 30.97 1.82 3.64 36.43 17.55 1.03 2.07 20.65 103.24 6.07 12.15 121.46DRAINAGE 6.93 0.24 0.80 7.97 21.32 0.74 2.45 24.51 15.99 0.55 1.84 18.38 9.07 0.31 1.04 10.42 53.31 1.84 6.13 61.28SENERAGE 17.89 1.12 3.35 22.36 55.04 3.44 10.32 68.80 41.28 2.58 7.74 51.60 23.39 1.46 4.39 29.24 137.60 8.60 25.00 172.00ELECTRICITY 7.72 0.45 0.91 9.08 2376 1.40 2.80 27.96 17.82 1.05 2.10 20.97 10.10 0.59 1.19 11.8e 59.40 3.49 7.00 69.89WATER SUPPLY 6.54 0.38 0.77 7.69 20.11 1.18 2.37 23.66 15.08 0.89 1.77 17.74 8.54 0.50 1.01 10.05 50.27 2.95 5.92 59.14LANDSCAP. i REFUSE BINS 1.31 0.08 0.15 1.54 4.02 0.24 0.47 4.73 3.02 0.18 0.36 3.56 1.71 0.10 0.20 2.01 10.06 0.60 1.18 11.84
D. OFF SITE INFRASTRUCTURE 13.18 0.79 1.83 15.80 48.34 2.90 6.71 57.95 26.37 1.58 3.66 31.61 - - - - 87.89 5.27 12.20 105.36
WATER SUPPLY 9.18 0.54 1.08 10.80 33.68 1.98 3.96 39.62 18.37 1.08 2.16 21.61 - - - - 61.23 3.60 7.20 72.03SEWERAGE 4.00 0.25 0.75 5.00 14.66 0.92 2.75 18.33 8.00 0.50 1.50 10.00 - 26.66 1.67 5.00 33.33
E. ON PLOT DEVELOPMENT - - - - 112.50 6.25 6.25 125.00 126.55 7.03 7.03 140.61 42.19 2.34 2.34 46.87 281.24 15.62 15.62 312.48
ESWl (1456U. t 764) - - - - 4.01 0.22 0.22 4.45 4.50 0.25 0.25 5.00 1.50 0.08 0.08 1.66 10.01 0.55 0.55 11.11EWS2 (5000U. * 2365) - - - - 42.57 2.37 2.37 47.31 47.89 2.66 2.66 53.21 15.97 0.89 0.89 17.75 106.43 5.92 5.92 118.27EHS3 (1856U. t 4450) - - - - 29.74 1.65 1.65 33.04 33.45 1.86 1.86 37.17 11.15 0.62 0.62 12.39 74.34 4.13 4.13 82.60ESW4 (1800U. t 5584) - - - - 36.18 2.01 2.01 40.20 40.71 2.26 2.26 45.23 13.57 0.75 0.7S 15.07 90.46 5.02 5.02 100.50
F. SHELTER LOANS - - - - 13.03 0.58 0.87 14.48 34.76 1.54 2.32 38.62 39.11 1.74 2.61 43.46 86.90 3.B6 5.80 96.56
G. COMMUNITY FACILITIES - - - - 11.90 0.70 1.39 13.99 29.72 1.75 3.50 34.97 17.81 1.05 2.11 20.97 59.43 3.50 7.00 69.93
PRIMARY SCHOOLS - - - - 9.50 0.56 1.12 11.18 23.76 1.40 2.80 27.96 14.25 0.84 1.68 16.77 47.51 2.80 5.60 55.91HEALTH CENTERS - - - - 0.37 0.02 0.04 0.43 0.92 0.05 0.11 1.08 0.55 0.03 0.07 0.65 1.84 0.10 0.22 2.16HIGH SCHOOLS - - - - 1.28 0.08 0.15 1.51 3.20 0.19 0.38 3.77 1.92 0.11 0.23 2.26 6.40 0.38 0.76 7.54POLICE POSTS - - - - 0.19 0.01 0.02 0.22 0.46 0.03 0.05 0.54 0.27 0.02 0.03 0.32 0.92 0.06 0.10 1.08POST OFFICE - - - - 0.19 0.01 0.02 0.22 0.46 0.03 0.05 0.54 0.27 0.02 0.03 0.32 0.92 0.06 0.10 1.08COMMUNITY HALLS - - - - 0.37 0.02 0.04 0.43 0.92 0.05 0.11 1.08 0.55 0.03 0.07 0.65 1.84 0.10 0.22 2.16
H. SMALL BUSINESS 1.17 0.03 0.30 1.50 5.61 0.25 0.65 6.51 12.84 0.59 1.22 14.65 12.03 0.55 0.96 13.54 31,65 1.42 3.13 36.20
BUILDING LOANS - - - - 3.31 0.15 0.22 3.68 8.83 0.39 0.59 9.81 9.94 0.44 0.66 11.04 22.08 0.98 1.47 24.53COMMON FACILITIES CENTER - - - - 1.13 0.07 0.13 1.33 2.84 0.17 0.33 3.34 1.70 0.10 0.20 2.00 5.67 0.34 0.66 6.67SKILLS UPGRADING I MONITORING 1.17 0.03 0.30 1.50 1.17 0.03 0.30 1.50 1.17 0.03 0.30 1.50 0.39 0.01 0.10 0.50 3.90 0.10 1.00 5.00
BASE COSTS 254.42 3.88 10.22 268.52 436.22 20.11 39.67 496.00 354.40 19.56 35.18 409.14 181.50 9.67 17.92 209.09 1.226.54 53.22 102.99 1.382.75PHYSICAL CONTINGENCIES 9.28 0.39 0.99 10.66 30,90 1.62 3.51 36.03 24.64 1.42 2.8s 28.91 11.10 0.64 1.34 13.08 75.92 4.0' 8.69 88.68DESIGN. SUPERVISION MOMT 15.34 0.64 1.65 17.63 59.54 3.16 6.28 68.98 50.40 2.87 5.24 58.51 21.72 1.23 2.40 25.35 147.00 7.90 11.57 170.47PRICE CONTINGENCIES 10.57 0.44 1.13 12.14 84.96 4.47 8.85 98.28 115.63 6.43 11.60 133.66 79.15 4.27 7.98 91.40 290.31 15.61 29.56 335.48
TOTAL 289.61 5.35 13.99 308.95 611.62 29.36 5B.31 699.29 545.07 30.28 54.87 630.22 293.47 15.81 29.64 338.92 1.739.77 80.80 156.S1 I19P7.38

INDIA
KANPUR URB3AN DEVELOP14ENT PROJECTTable 8: SLUM UPGRADING: DETAILED COST ESTIMATES
(Rs '00,000, MARCH 1981 PRICES)
YEAR YEYEAR 2 YEAR 3 YER 4 TOTAL
LOCAL TAXES FOREIGN TOTAL LOCAL TAXES FOREIGN TOTAL LOCAL TAXES FOREIGN TOtAL LOCAL TAXES FOREIGN TOTAL LOCAL TAXES FOREIGN TOTAL
SLUh UPGRADING
A. LAND ALREADY ACQUIREB 46.20 - - 46.20 30.S0 - - 30.80 - - - - - - - - ?.o - - 77.30
LAND TG BE ACOUIRED - - - - 87.56 - - 37.56 109,45 - - 109.45 21.89 - - 21.89 21E.90 - - 218.-70
B. SITE PREPARATION 0,59 - 0.01 0.60 1.17 - 0.02 1.19 1.36 - 0.03 1.39 0.78 - 0.02 0.80 3.90 - 0.08 3.99
C. ON SITE INFRASTRUCTURE 27.17 1.5? 4.07 3,3.51 74.99 4.25 10.99 90.23 68.56 3.87 10.05 82.48 42.84 2.43 6.27 51.54 214.26 12.12 31.38 257.7t-
ROADS I DRAINAuE 4,49 0.15 0,52 5.16 12.08 0.42 1.39 13.89 11.04 0.38 1.27 12.69 6.90 0.24 0.7? 7.73 34.51 1.19 3.97 39.67
SEWERAGE 11.64 3.73 2.18 14.55 31.34 1.96 5.88 39.18 28.65 1.79 5.37 35.81 17.90 1,12 3.36 22.38 89.53 5.60 16.79 111.92
WATER SUPPLY 4.27 0.25 0.50 5.02 11.48 0.68 1.35 13.51 10.50 0.62 1.24 12.3t- 6.56 0.39 0.77 7.72 32.81 1.94 3.86 38.61
LANDSCAP. I REFUSE BINS 0.62 0.04 0.07 0.73 1.67 0.10 0.20 1.97 1.52 0.09 0.18 1.79 0.95 O.06 0.11 1.12 4.76 0.29 0.56 5.61
STREET LIGHTING 4.27 0.25 0.50 5.02 11.48 0.68 ;.35 13.51 10.50 0.62 1.24 12.36 6.56 C.39 0.77 7.72 32.81 1.94 3.86 38.61
PUBLIC LATRINES 2.58 0.15 0.30 3.03 6.94 0.41 O.82 8.17 6.35 0.37 0.75 7.47 3.97 0.23 0.47 4.67 19.84 1.16 2.34 23.34
D. LOANS 16.83 0.93 1.77 19.50 33.60 1.86 3.54 39.00 39.20 2.17 4.13 45.50 22.40 1.24 2.36 26.00 112.30' 6.20 11.80 130.00
SANITARY CORE LOANS 12.75 0.75 1.50 15.00 25.S0 1.50 3.00 30.00 29.75 1.75 3.50 35.00 17.00 '.00 2.00 20.00 85.00 5.00 10?00 100.00
BUILDING LOANS 4.05 0.18 0.27 4.50 8.10 0.36 0.54 9.00 9.45 0.42 0.63 10.50 5.40 0.24 0.36 6.00 27.00 1.20 1.80 30.00 co
E. COMNON FACILITIES CENTER - - - - 0.53 0.03 ?.10 0.66 1.06 0.07 0.20 1.33 1.06 0.07 0.20 1.33 2.65 0.17 0.50 3.32
F. COMMUNITY CENTERS 0.56 0.03 0.07 0.66 0.13 ..05 0.10 0.98 0.83 0.05 0.10 0.98 0.56 0.03 0.07 0.66 2.78 0.16 0.34 3.28
BASE COSTS 92.02 2.53 5.92 100.47 229.48 6.19 14.75 250.42 220.46 6.1l 14.51 241,13 89.53 3.7? 8.92 102.22 631.49 18.65 44.10 694.24
PHYSICAL CONTINGENCIES 4.27 0.24 9.61 5.12 11.51 0.64 1.67 13.82 10.64 0.59 1.54 12.77 t.71 0.37 0.97 .805 33.13 1.84 4.79 39.76
DESIGN, SUPERVISION MGNT 5.25 0.29 0.74 6.28 13.90 0.77 1.99 16.66 13.01 0,72 i.8, 15.58 8. I6 0.45 1.16 9,77 40.33 2.23 5.73 40.29
PRICE CONTINGENCIES 4.98 0.28 0.65 5.91 24.58 1.37 3.31 19.26 36.36 2.02 4.03 43.21 30.53 1.70 4.09 36.32 96.45 5.37 12.88 114.70
TOTAL 106.52 3.34 7.92 117.78 279.47 8.97 21.72 310.16 280.48 9.49 22.72 312.69 134.93 6.29 15.14 156.36 801.40 28.09 67.50 896.99
N.

INDIA
KANOPUR URBAN DEVELOPMENT PROJECT
Table 9: ENVIRONMENTAL SANITATION, MAINTENANCE AND TRAFFIC MANAGEXENT MEASURES: DETAILED COST ESTIMATES(Rs o00,000, MARCH 1981 PRICES)
YEAR I YEAR 2 YEAR 3 YEAR 4 TOTALLOCAL TAXES FGREIGN TOTAL 10oa. TAXES FOREIE TOTAL LOCAL TAXES FONEIX- TOTAL LOCAL TAXES FOREIGN TOTAL LOCAL TAXES FOREIGN TOTAL
ENVIRONMENTAL SANITATIDN,MAINTENANCE I TRAFFIC NGNT
VATER SFPLY 6.21 0.37 0.73 7.31 1o.45 0.70 1.33 12.48 12.75 0,09 1.66 15.30 5.41 0.37 0.70 6.48 34.02 2.33 4.42 41.57
CIVIL WORKS 6.21 0.37 0.73 7.31 S.32 0.55 0.10 10.97 10.87 0,64 1.28 12.79 4.66 0.27 0.55 5.40 31.06 1.83 3.66 36.55WASTAGE I LEAKAGE REDUCTION - - - - 1.13 0.15 0.23 0.51 1.80 0.25 0.38 2.51 0.75 0,10 0.15 0.00 3.76 0.50 0.76 5.02
SEKOAGE 44.16 2.76 8.20 55.20 83.24 5.14 04.42 002.0 02.78 6.33 07.49 126.60 75.62 4,57 10.21 91.40 305.00 10.00 51.40 376.00-- -- ---- - --- - -- - - --- - - -- - --- - - -- - -- - --- ---- - ---- - -- - --- ----- ---- ----- --- ---- ---------
CIVIL WORKS 44.16 2.76 8.20 55.20 66.24 4.14 12.42 82,80 77.28 4.83 14,49 96.60 33,12 2,07 6.21 41.40 220.80 13.0 41.40 276.00CONNECTION LOANS - - - - 17.00 1.00 2.00 20.00 25.50 1,59 3.00 30.00 42.50 2.50 5.00 50.00 85.00 5.00 10.00 100.00
ORAINAGE 15.43 0.53 1.77 17.73 46.29 1.60 5.32 53.21 36.00 1024 4.14 40.39 5.14 O.I 0.59 5.91 102.87 3.55 11.02 010.24
MAINTENANCE 16.20 1.01 3.04 20.25 32.40 2.03 6.08 40.51 16.20 1,01 3.04 20.25 - - - - 64.80 4.05 12.16 01.01
SOLID WASTE OAAGE00NT 37.34 9.34 15.56 62.24 21.79 5.45 9.08 36.32 3.11 0.78 1.30 5.19 - - - - 62.24 15.57 25.94 003.75
TRAFFIC NANAGOENOT HEASURES 6.21 0.37 0.73 7.31 24.82 1.46 2.02 29.20 24.02 1.46 2.92 29.20 6.21 0,37 0.73 7.31 62.06 3.66 7.30 73.02
BASE COSTS 125.55 14.30 30.11 170.04 210.99 16.30 39.05 274.52 195.67 11.71 30.55 237.93 92.30 5.49 13.23 111.10 632.59 47.96 113.04 n3.59FHYSICAL CONTINGENCIES 10.40 0.59 1.69 12.76 20.93 1.12 3.15 25.20 21.30 1.19 3.33 25.90 7,17 0.44 1.20 S.80 59.96 3.34 9.37 72.67BESIGN. SrIPERVISIO0 lGHT 13.44 0.90 2.36 16.70 26.74 1.52 4.11 32.37 26.73 1.56 4.13 32.36 9,40 0.56 1.51 01.47 76.31 4.40 12.11 92.90PRICE CONTINGENCIES 13.45 1.43 3.07 17.95 40.00 3.42 0,35 59.77 65.02 3,89 00.26 79.07 40.31 2.40 5.90 40.61 067.50 01,14 27.s5 206.30
-- -- --- - ----- - - --- ---- ----- ---- ---- ---- ------ ------ -- - _- --- ----- ----- - -- ---- --- -,----- - - -- --
TOTAL 162.92 17.30 37.23 217.45 314.66 22.44 54.76 391.06 309.60 18,29 40.27 376.16 149,26 8.89 21.84 179.99 936.44 66.92 162.10 10165.46
Table 10: TECHNICAL ASSISTANCE AND INSTITUTIONAL STRENGTHENING: DETAILED COST ESTIMATES(Rs 00,000, MARCH 1981 PRICES)
YEAR I YEAR 2 YEAR 3 YFAR A TOTALLOCAL TAXES FOREIGN TOTAL LOCAL TAXES FOREIGN TOTAL LOCAL TAXES FOREIGN TOTAL LOCAL TAXES FOREIGN TOTAL LOCAL TAXES FOREIGN TOTAL
TECHNICAL ASSISTANCE 1INSTITUTIONAL STRENGTHENING
STATE LEVEL 4.68 0.12 1.20 6.00 4.60 0.12 1.20 6.00 4.60 0,12 1.20 6.00 1,56 0.04 0.40 2.00 15.60 0.40 4.00 20.00
KDA 5.46 0.14 1.40 7.00 4.10 0.11 1.05 5.26 2.73 0,07 0.70 3.50 1.37 0.04 0.35 1.76 13.66 0.36 3.50 17.52
K0N 7.55 0.19 1.94 9.60 5.66 0.05 1.45 7.26 3.78 0,10 0.97 4.05 1.09 0.o5 0.48 2.42 18.00 0.49 4.84 24.21
KJS 0.02 - 0.01 0.03 0.02 - 0.1 0.03 0.02 - - 0.02 0,02 - - 0.02 0.00 - 0.02 0.10
TRAINING 2.73 5.10 0.73 3.64 4.10 0,27 1.09 5.46 4.10 0.27 1.09 5.46 2.73 0.10 0.73 3.e4 13.66 0.90 3.64 18.20
BASE COSTS 20,44 0.63 5.20 26.35 00.56 0.65 4.80 24.01 15.31 0.56 3.96 19.3 7,57 0o31 1.96 9.84 61,88 2.15 16.00 00.03PRICE CONTINGENCIES 1.,4 0.06 0.40 2.30 3.34 0.12 0.06 4.32 4.13 0.15 1.07 5.35 2.80 0.11 0.73 3.64 12.11 0.44 3.14 15.69
TOTAL 22.28 0.69 5.76 20.73 21.90 0.77 5.60 20.33 19.44 0.1 5.03 25.10 10.37 0.42 2.69 13.48 73.99 2.59 19.14 95.72

INTDIA
KANPUR UR3AN DEVELOPMENT 'RO.JECT
Table 11: URBAN POVERTY IMPACTS
Component % Spent Amount Total Number UP Cost UPP Bene- Urban Poor Urban PoorCost on Poor Spent on of Benefi- Per Capita ficiaries in Need of yet to be
Poor ciaries Services ServedUS$ million US$ million US$
Sites & Services 24.7 74 18.3 83,000 300 6z1,000 110,000 49,000
Slum Upgrading 11.2 37 9.7 115,000 100 100,000 300,000 700,000 °
Environmental Sanitation,Maintenance and TrafficManagement Measures(Water Sipply, Sewe-rage, Drainage, SolidWa3te Management,Maintenance andTraffic ManagementMeasures) 14.6 50 7.3 800,000 20 400,000 300,000 400,000
Technical Assistance 1.2 50 0.6
TOTA-L 51.7 69 35.9
== _= w~~~~~~~~~~~~~~~~~~~~~~~~~~~~~~~~~~~~~0

- 61 - ANNEX 2
Page 9
INDIAKANPUR URBAN DEVELOPMENT PROJECT
CHART 1: SLUM HOUSEHOLD INCOME DISTRIBUTION*Household (1980 Prices)cumulativePercentile
100 .... _
90
80 7 /_____
.-- IDA ESTIMATED*
POVERTY THRESHOLD70 1 A______
60 _ _ _ _
:--MAXIMUM INCOME*EWS HOUSEHOLDS
50 on 1 u f 0 h o K
40 _ _4_ _ _ _
30
20 _ _ _ _ _ _
10 _ _ _ _ _
100 200 300 400 500 600 700 g00 900 1000
MONTHLY HOUSEHOLD INCOME (Rupees)
'Based on 1980 Survey of 27,000 slum households in Kanpur
-IDA estimated poverty threshold (1980 prices) is Rs 88 per capita per month (or Rs 485 per household).
World Bank-22709

- 62 -ANNEX 2
INDIA Paee 10KANPUR URBAN DEVELOPMENT PROJECTCHART 2: PROJECT IMPACT ON GROWTHUNSERVICED HOUSEHOLDS IN KANPUR
550,00O
Based On: Annual Population Growth Rate = 2.6%Natural Growth Rate =1.9%
500.00 Migration = 0.6%Base Year: 1971 268.500 HousehoWds IHH)
POTENTIALKANPUR URBAN
HOUSEHOLDS
460,O
400,OO -
360,0010 -
u)
030I'U
0
itMPOTENTIAL SLUMw HOUSEHOLDS300,000
z
250,000 -
IMPACT DUE TO SITES AND SERVICESCOMPONENT (15,000 HH)_ --
IMPACT DUE TO SLUM UPGRADINGCOMPONENT (20.000 HH)
200,OO0
PERIOD
100,00( I I ~~~I N II
1 970 11975 1980 1985 1990 1995 2000YEARS
World Bank - 22778

INDIAKANPUR URBAN DEVELOPMENT PROJECT
CHART 3: FLOW OF FUNDS (RUPEES MILLIONS)
INTERNAT..IONA RVELOOEENT
GOVERNMENTOF IN=IA
1 97 a, 2 5 22 13r
ADSERVCES UFRADIN. AIITSWAESALYMNEACENDONNECTION
NOT DIRECTLY NO DECTLY NOT RECOVERE
LOANS I ~~WRK LANS A NED L TDALOL.
G LINDTITOIONSISENEEICIARIES NORES
RESIOENT AL / \ , S(UMP I / \ I / 11 OPROJQ OT COMPONENTSSUALL-ESLINESS L O COVERY MECRANISM
I \ I LITY ) CHARGES PARECOVERI LOAN CRARGES
) F~~~~~~~LOT AND THRGUGIOT AN. LOAN .IRE CHARGESLOAN CAGES
GEAR DES
'011 W~~~~~~~~~~~~~~~~~~~~~~~~~~~ld B-~~~~~~~~~~~~~~~~~~~~~~~ 22189~~~~~~~~~~~~WODRRE 25

- 64 -
ANNEX 2Page 12
INDIAKANPUR URBAN DEVELOPMENT PROJECT
CHART 4. PROJECT IMPLEMENTATION SCHEDULE
19S1 1982 1983 1984 1985
3 2 3 4- -1 2 3-4 _ 2 1 2 4
1. SITES AND SERVICES'
Detailed Design
Bid Document Preparation
Biddtng and Award
Or-site ,f rastructu.d
Off-site I nfrastructure
On-plct Developr,meti __t51 l l wl wl_
Beneficiary Selection -i_
Schools Construction-
Health Centers
Police Station and Post Offices
Phased Settlement
Shelter Loans i ........
Co-munity Develcpment
Comnr Facilities CDnters
Small-business Loans
2, SLUM UPGRADING
Land Acquisition
Community Preporar on r
Detailed Design
Bid Document Preparatio
Biddighan dAwa ,
infrastructure Construction-
Transfer of Land Ownership
Shelter Loans
Sanitary CDre Loans
Common Facilities Center
Community Developmrnr3. ENVIRONMENTALSANITATION,
MAINTENANCE AND TRAFFIC MANAGEMi--NTWater Supply
Sewerage - Civ Work
-Loans {||TT
Drainagei i _
Solid Waste Managemnt|
Maintenance
Traffic Management Measures - _4. TECHNICAL ASSISTANCE
(a) Kan,,r Da-elopme-t AuthorityInstitutional and Financial
Strengthening Study
r|plementati-n
(b) Kanpur Nagar Mahapaiika
(1) Institutional and FinoncialoStrefgthesing Study
rImplementation
(2) Resource Mfobilization Study
Implementati-o
(3) Maintenance StudVl
Implementation
1(4 Traffice Engineering an Management Ca,.
(c) Kanpur Jal Sansthran
Anelysis of Arrears BllinglAWestage and Leakage Reduction
Id) State Level Assistance
Urban Strategy Development
lel Other Services and Training
m1 _ Activity at 8arra World Bank-22849.Activity at Gu.aini
_ _ _ _ Activity at Pokharpur

OPTION -1C36.75.2 OPTION - 2 36 75m2 OPTION - 3 36.75m2 OPTION 4 36.76m2SANITARY CORE ONLY AS IN OPTION- 1. BUT VV.C., ROOM/KITCHEN COVERED AS IN OPTION -3, BUTVVALLS OF ROOM/KITCHFN AND WITH R C C. SLAB WITH SPOUTS, WITH ALL SHUTTERSCO URTYARD VVALLS. AND WITHOUT SHUTTERS
INDIA: KANPUR URBAN DEVELOPMENT PROJECT o SITES AND SERVICES :
EWS PLOT OPTIONS
World B..k-22710


|g~~~~~~~~~~~~~~~~~~~~~~~~~~-- ------ ~
r-----s L _ , _, J _~~~r-- - --- --
&rY1
ifi 1~~~~~ ~ ...
t{Xe~~~~~
12O1~~~~~~~~~~~~~L___
0~ ~ , 1.-
e-z H ___ _
2' . _ _L __


ORGANIZATION CHART
I I I | ATIR (T MACAP I I~~~~~~~~~~~~~~~~~~~~~~~~~~~~~~~~~~~~~~~~~~~T
ILS1IET3I[XI 1TT il [XM 1 1 1 [tH t [X~~~~~~~~~~~~~~~~~~~~~~~~T1"


KANPUR JAL SANSTHAN ANNEX IIIORGANIZATION CHART Page 3
PEA REMAN.
ISREIERAL MANAGCS
E T O AMAMANAQER MANAGER MANAGER MANAGER
ESEASLS RMENE EMANAG6 WAhS5STE E A ffAGER | E GASS S{g A i i R NUIPPEENT EQUIPMENT M WASTE PREVENTION MANAGER R I ASO AUDI I
OFFIE ACE TUIS TETETADAO NPLANT( II AND PLANT (11) CIToRTOLA DETECT O SEWERS COLLECTION OFIFICERPOLLUTION CONTROL CO~~~~~~~~~~~~~~~~~~~~~NTROLANGO METERG
ASSISTNNT heANAGFR S -ISTART MANAGER |ASSiTANT MANE6FEW ASSISrANT MAR ASS ASSISTANT MANAGERAASSISTANT MANAGEA IASSISTANT MANAGER ASSSTNT SIANAGER'"T '
ST RAWAfER PUMPfING 7ONAL PIMPINGANi AN * BILRLTLON ER MET DVTE ATI|O SEW RAND CLEAI |NINNCE ANS ACCOUNTS1 TREATMENT GITIRESATIEAO EAISOUPNOSATNCOLLECT ION PO
ASSIST~ ~ ~ ~ ~ ~~~~~~~AS~ANT MANAGEFR ASSISTATANTA EKAASTRE ANAGER ASSIS ES AAE SITANT MANAGERCHIEF IHLMIST QLEAR WATER PUMPiNG ~SSISTANT MANAGER
GRATUITY ROVIGENT CRIEF CHEIST CIEA!REAEEA PMPING ZINAL ROMPIG AGE IEA$RiRuTIN tIo) MElIER REMOVAL GNU GRAPE CLEANING
PESO AND PENSION S ATIONR TUEEWELLS A1 N ISTAILATION AND MAINTENANCE
ASSISTANT MANAGER DISTRIBUTION 111 I
INDEX
E POSTS CREATED AND FILLED
E POSTS CREATED OUT NOT FILLED WOEI R-1, - 227R8


INDIAKANPUR URBAN DEVELOPMENT PROJECT
Table 1: KANPUR DEVELOPMENT AUTHORITY: STATEMENT OF RECEIPTS AND PAYMENTS (With Projections)(Rs 00.000)
Four Years of History Vour Years of RUDP Period Four Years of ProjectionsActual Actual Actual Estimated Estimated Estimated Estimated Estimated Estimated Estimated Estimated Estimated1977-78 1978-79 1979-80 1980-81 1981-82 1982-83 1983-84 1984-85 1985-86 1986-87 1987-88 1988-89
RECEIPTSA. Revenue Account
(1) Ongoing Operations:- Lease & Rental Income 143 122 115 120 125 125 125 125 125 125 125 125- Sale of Buildings 44 38 35 20 10 - - - - - - -- Mortgage Receipts 11 8 9 10 10 20 40 60 80 160 250 300- Interest Income 22 17 13 15 20 25 40 30 15 10 10 10- Others 30 21 15 20 20 20 20 20 20 20 20 _ 20
250 206 187 185 185 190 225 235 240 315 405 455(2) KUDP Operations:
- Downpayments - - - - 138 10 13 8 - - - -- Mortgage Receipts - - - - 5 26 89 172 209 209 209 209-Loan Payments - - - - 1 5 15 26 31 31 31 31- Maintenance Charges - - - 2 6 12 13 14 16 17- Sale of Industrial &Commercial Land - - - - 9 20 47 133 101 - - -
- - - - 153 63 170 351 354 254 256 257TOTAL: Revenue Account 250 206 187 185 338 253 395 586 594 569 661 712
B. Capital Account(1) Ongoing Operations:
- Government Grants 12 3 - - - - - - - -- Government Loans 70 97 434 100 - - - 200 500 1000 900 1000- HUDCO Loans 30 92 148 150 - 90 220 200 500 1000 1000 1100
112 192 582 250 - 90 220 400 1000 2000 1900 2100(2) KUDP Operations:
- Government Grants - - - - 13 10 8 4 - - - -- Government Loans - - _ - 582 834 891 446 - - - >
- - - - 595 844 899 450 -- 2TOTAL: Capital Account 112 192 582 250 595 934 1029 850 1000 2000 1900 2100 a z
C. Deposit & Suspense Account 118 138 151 160 170 180 190 200 210 220 230 240
TOTAL RECEIPTS 480 536 920 595 1103 1367 1614 1636 1804 2789 2791 3052

TAblpa 1:. (Continued)
Four Years of History Four Years of KUDP Period Four Years of ProjectionsActual Actual Actual Estimated Estimated Estimated Estimated Estimated Estimated Estiimated Estimated Estimated1977-78 1978-79 1979-80 1980-81 1981-82 1982-83 1983-84 1984-85 1985-86 1986-87 1987-88 1988-89
EXPENDITURESA. Revenue Account
(1) Ongoing Operations: 41 45 52 57 61 66 71 76 81 87 93 100- Establishment 74 77 87 100 110 115 120 125 130 150 160 170- Debt Service to State
Government 68 44 32 33 40 50 60 60 60 70 80 90- Debt Service to HUDCO- Maintenance & Other 20 19 7 10 15 17 20 23 26 30 34 40
203 185 178 200 226 248 271 284 297 337 367 400(2) KUDP Operations:
- Project Preparation - - - 20 5 - -
- Establishment - - - 10 18 40 42 33 34 35 38 41- Stamp Duty & Bond Fees - - - - 33 26 42 30 - - _ -
- Transfer and MaintenanceCharges - - - - - 1 4 10 12 13 14 15
- Debt Service::Principal - - - - - - - - - 184 184 184:Interest - - - - - - - - 590 180 167
- - - 30 56 67 88 73 46 822 416 407TOTAL: Revenue Account 203 185 178 230 282 315 359 357 343 1159 783 807
GB. Capital Account(1) Ongoing Operations
- Land Acquisition 128 21 24 10 20 20 30 100 200 250 280 320- Infrastructure Works 98 98 100 130 100 20 30 350 650 750 900 1000- Buildings 48 62 234 290 180 40 50 150 300 330 400 460- Material Loans & Other 4 17 9 20 30 10 20 100 150 170 180 220
278 198 367 450 330 90 130 700 1300 1500 1750 2000(2) KUDP Operations:
- Construction and Civil Works - - - - 269 764 766 329 - - - -
- Loans to Beneficiaries - - 22 70 125 117 - - - -
- Consultant Services - - - - 13 10 8 4 - - - -
- - - - 304 844 899 450 - - - -TOTAL: Capital Account 278 198 367 450 634 934 1029 1150 1300 1500 1750 2000
C. Deposit & Suspense Account 138 128 128 130 140 150 160 170 180 190 200 210
TOTAL EXPENDITURES 619 511 673 780 1056 1399 1548 1677 1823 2849 2733 3017

- 71 - ANNEX 3
INDIA Page 6KANPUR URBAN DEVELOPMENT PROJECT
Table 2: KANPUR NAGAR MARAPALIKASTATEMENT OF RECEIPTS & PAYMENTS FOR YEARS 1977/78-1980/81
(Rs '00,000)
FY 77/78 FY 78/79 FY 79/80 FY 80/81Capital Recurrent eapital Recurrent Capital Recurrent Capital Recurrent
REVENUE RECEIPTSFrom TaxesProperty Tax 151.1 168.6 219.1 235.0Vehicle Tax 12.8 13.7 16.3 17.0Octrof Tax 377.8 448.1 484.4 520.0Advertisement Tax 1.3 2.0 2.7 4.0Show Tax 1.7 0.3 4.6 5.0Water Tax 60.2 28.9 - -Drainage Tax 8.1 9.5 11.7 12.5
Sub-Total 613.0 671.1 738.8 793.5Other Receipts
Fees 19.1 17.3 17.2 27.2Rents 16.3 15.2 19.1 26.8Unserviced Land 1.4 0.7 0.2 2.7Nazul Land Rent 0.3 0.6 0.7 2.2Water Charges 28.4 95.8 19.1 88.2Sewage Farm 4.2 8.5 2.1 8.0Conservancy Charges - - - 0.8Fines 3.7 3.8 3.3 18.9Interest 0.1 0.1 - 1.0Miscellaneous 52.7 51.1 42.3 6.3
Sub-Total 126.2 193.1 104.0 182.1Government Grants
In lieu of fines - - - 3.5General Purpose 66.6 93.0 76.7 89.0Roads 36.3 33.8 61.9 117.6Education 26.0 21.3 39.7 32.0Medical 9.0 2.5 5.0
Sub-Total 128.9 157.1 180.8 247.1Sub-Total Revenue Receipts 868.1 1021.3 1023.6 1222.7
CAPITAL RECEIPTSGovernment Loans 12.0 - - - - -Bank Loans _ 37.3 10.7 20.8Government Grants 2,5 20.2 23.1 12.4 -Other Grants 53.1 4,0Sub-Total Capital Receipts 67.6 57.5 37.8 33.2
TOTAL RECEIPTS 935.7 1076.8 1061.4 1255.9REVENUE EXPENDITUREGeneral Administration 62.3 71.7 75.1 89.1Loan Charges P la 3.8 3.8 10.0 11.2
I /b 0.5 0.8 1.2 2.3Water Supply 0.6 107.2 - 138.2 - 37.7 88.2
Loan Charges P 8.5 2.2 - 1.3I 9.1 2.7 - 6.1
Drainage 6.5 26.3 5.3 3.3 1.7 30.0 7.2 35.8Loan Charges P 3.8 3.9 4.7 6.3
I 3.6 2.8 2.7 4.2Conservancy 2.9 241.5 4.1 266.5 4.8 298.1 9.3 329.0Loan Charges P 0.2 12.0 25.7 32.3
I 2.1 8.2 18.6Public Works 108.1 5.4 51.3 6.5 113.1 24.5 143.6 29.8Loan Charges P 2.4 2.4 2.7 3.1
I 1.8 1.6 1.5 1.4Medical & Health 1.1 62.1 1.1 72.3 3.5 80.7 4.3 94.7Public Safety & Conveniences 16.9 50.4 21.1 50.8 25.6 75.6 34.5 90.6Loan Charges P 0.7
I - - 0.5Education 2.0 44.3 2.1 51.9 3.0 53.4 7.7 67.2Miscellaneous 97.1 87.9 89.7 138.4Sub-Total RevenueExpenditure 138.1 730.3 85.0 783.4 151.7 822.7 206.6 1049.1
CAPITAL EXPENDITUREWater Supply & Sewerage - 1.2 8,2Drainage 0.4 0,6 2,2 2.0Conservancy 27.9 60.8 44,2 65.6Public Health 35.0 _ _ _Public Safety 2.4 5.0 0.5 -Buildings - - - 0.8Roads - 27.0 6.0 -Education 1.9 1.0 0,8 1.0Sub-Total Capital Ex- -penditure 67.6 95,6 53.7 77.6
TOTAL EXPENDITURE 936.0 966.0 1028.1 1333.3
/a Represents repayment of principal. /b Represents repayment of interest.

- 72 -
ANNEX 3Page 7
Table 3: KANPUR JAL SANSTHAN
STATEMENT OF RECEIPTS AND PAYMENTS FOR YEARS 1977-78 TO 1980-81(Rs '00,000)
1977-78 1978-79 1979-80 1980-81Item (Budgeted)
INCOMEWater Tax 60.2 73.6 78.7 83.0Cost of Water 27.4 18.2 26.1 104.0Other 1.0 3.7 8.0 15.0
Total 88.6 95.5 112.8 202.0
EXPENDITUREEstablishment 35.6 40.6 45.3 53.2Electricity & Power 43.2 63.1 68.1 83.0Store Purchases 11.8 10.0 13.0 17.2Repairs & Maintenance 1.7 1.9 2.8 4.8Chemicals 13.2 13.7 17.1 25.5Administrative Overhead 1.6 1.9 4.2 5.9Other 0.1 0.2 0.8 1.7
Total 107.2 131.4 151.3 191.3
Table 4: KANPUR DEVELOPMENT AUTHORITY: CAPITAL INVESTMENTS(Rs '00,000)
1977/78 1978/79 1979/80 1980/81Item Units (Rs) Units (Rs) Units (Rs) Units (Rs)
Land Acquisition (acres) 17 128 93 21 201 24 225 25Land Development (acres) 268 84 113 87 122 165 120 1 1 0 aHousing: HIG 10 8 - - - - 76 42
MIG 102 27 353 101 175 51 816 216LIG 126 16 12 2 417 52 842 105EWS - - 645 30 1,785 84 2,397 113
Sites and Services - - - - 863 7 1,223 7Refugee Quarters 158 16 - - 12 1 8 1Shopping Centers - 3 - 10 - 2 - -Cattle Sheds - - 10 100 5 - -
Total =96 -b 2 8 2 1,O 0 Qb26 3,2 5 2 fb39 5 3 62 Lb620
La Expenditure up to November 1980./b Total indicates number of units of housing; excludes land development.
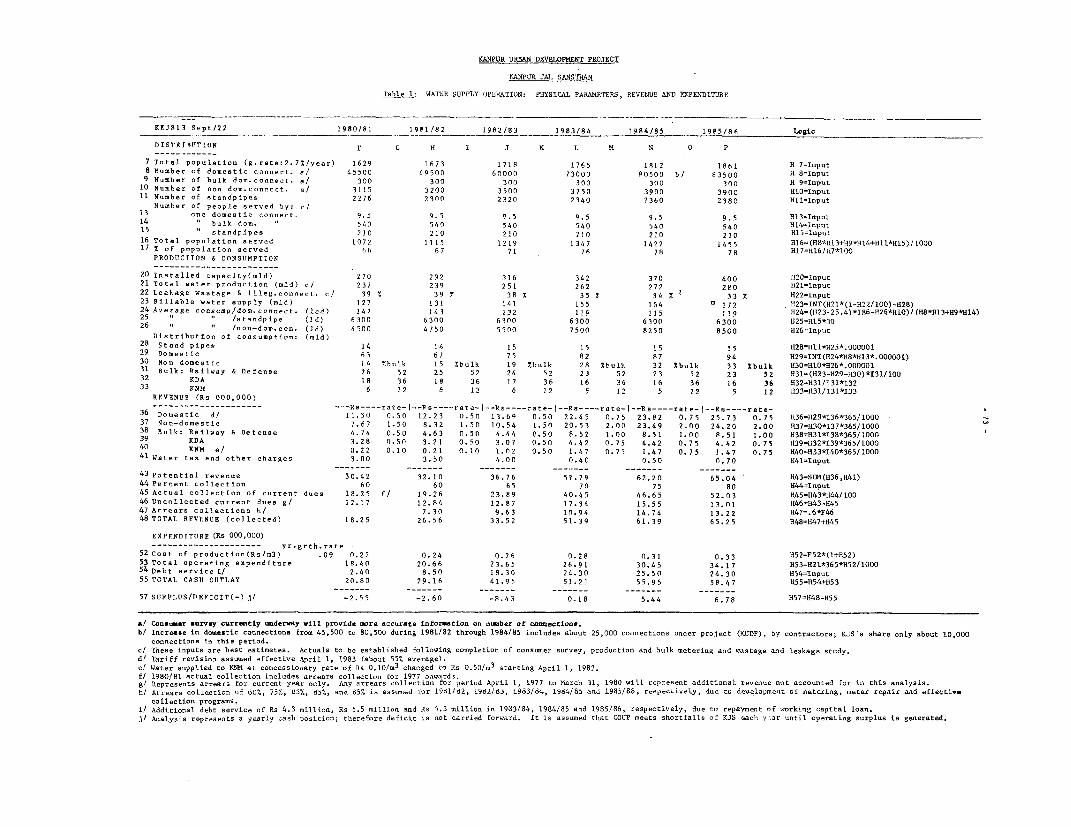
KANPU. URBAN DEVELPSIENT PROJECT
KANPUR JAL SANSTHAN
Table 1: WATER SUPPLY OPERATION: PHYSICAL PARAMETERS, REVENUE AND EXPENDITURE
_KJS13 Sept/22 1980/81 1981/82 1982/83 1983/84 1984/85 1985/86 Logic
DISTRIBPTION F G H I J K L N N 0 p
7 Total populatton (g.r.te:2.7%/year) 1629 1673 1718 1765 1812 1861 H 7=Input
8 Number of dorest ic connect. a/ 45500 49500 60000 73000 s0500 b/ 83500 H 8=Input
9 Number of bulk dom.-conect. a/ 300 3 00 300 300 300 300 H 9=.Input10 Number of non do.co- e-ect. o/ 3115 3200 3500 3750 3900 3900 Hl0=Input
11 Number of standpipes 2276 2300 2320 2340 2360 2380 Hll=Input
Number of people served by: c/13 one domestic con-ect. 9.5 9.5 9.5 9.5 9.5 9.5 H13-Input
14 bulk dor. 540 540 540 540 540 540 H14=lnput
15 " standplpes 210 210 210 210 210 210 H15=Input
16 Total populatio- served 1072 1115 1219 1347 1422 1455 1116=(H8*H13+N9*Hl11+HII*HI5)/1000
17 X of population served 66 67 71 76 78 78 H17=H16/h7*100
PRODUCTION f CONSUMPTION
20 Installed capacity(mld) 270 292 316 342 370 400 H20-Input
21 Total water production (mId) c/ 232 239 251 262 272 280 H21=Input
22 Leakage wastage & illeg.connect. c/ 39 2 39 Y 38 35 Z 34 % 33 2 H22=Input
23 Billable water supply (mid) 127 131 141 155 164 m 172 ii23=INT(H21*(1-H22/lO0)'R28)
24 Average consump/dom.connect. (lcd) 147 143 132 119 115 119 H24=(H23-25.4)*1E6-H26*HIO)/(R8*N13+H9*H14)
25 * /standpipe (Cd) 6300 6300 6300 6300 6300 6300 H25=H15*3026 , /non-dom.con. (Cd) 4500 4750 5500 7500 8250 8500 N2
6=Input
Distribution of consumption; (.Id)28 Stand pipes 14 14 15 15 15 15 H28-Hll*H25*.000001
29 Domestic h3 67 75 82 87 94 H29=INT(H24*H8*H13*.O00001)
30 Non domestic 14 Xbblk 15 Xbulk 19 2bulk 28 2bulk 32 %bulk 33 Ibulk H30=HIO*H26*.000001
31 Bulk: Railvay 4 Defense 26 52 25 52 24 52 23 52 23 52 23 52 H31=(N23-H29-H3O)*I31/10O
32 KDA 19 36 18 36 17 36 16 36 16 36 16 36 H32-1131/131*132
33 i(NM 6 12 6 12 6 12 5 12 5 12 5 12 H33=H31/131*133
REVENUE (Rs 000,000)--------------------- --- R----…rate- -- Ps----rate- -- Rs----rate- -- Rs----rate- -- N …rate- -- R…----rate-
36 Do..estic d/ 11.50 0.50 12.23 0.50 13.69 0,50 22.45 0.75 23.82 0.75 25.73 0.75 1136=H29*136*365/l000
37 Non-domestic 7.67 1.50 8.32 1.50 10.54 1.50 20.53 2.00 23.49 2.00 24. 20 2.00 H37=H30*137*365/lOOO
38 Bulk: Raillay 6 Defense 4.74 0.50 4.63 0.50 4.44 0.50 8.52 1.00 8.51 1.00 8.51 1.00 H38=H31*138*365/1000
39 KDA 3.28 0.50 3.21 0.50 3.07 0.50 4.42 0.75 4.42 0.75 4.42 0.75 H39=1132*139*365/l000
KIM e/ 0.22 0.10 0.21 0.I0 1.D2 0.50 1.47 0.75 1.47 0.75 1.47 0.75 H40=R33*I40*365/l000
41 Water tao and other charges 3.00 3.50 4.00 0.40 0.50 0.70 R41=Input
43 Potential revenue 30.42 32.10 36.76 5F.79 62.20 65.04 H43=SIM(H36,1{41)
44 Percent collection 60 60 65 70 75 80 H44=Input
45 Actual collection of current dues 18.25 f/ 19.26 23.89 40.45 46.65 52.03 N45=1143*1144/l00
46 Uncollected current dues g/ 12.17 12.84 12.87 17.34 15.55 13.01 1H46=N43-H45
47 Arrears collections h/ 7.31r 9.63 10.94 14.74 13.22 H47=.6*F46
48 TOTAL REVENUE (collected) 18.25 26.56 33.52 51.39 61.39 65.25 N48=H47+H45
EXPENDITTURE (Rs 000,000)--------------------- yr.grth.r.te
52 Cost of production(Rs/m3) .09 0.22 0.24 0.26 0.28 0.31 0.33 H52=F52*(1+E52)
53 Total operating expenditure IR.40 20.66 23.65 26.91 30.45 34.17 H53=H21*365*H52/1000
54 Debt service i/ 2.40 8.50 18.30 24.30 25.50 24.30 N54=Input
55 TOTAL CASH OUTLAY 20.80 29.16 41.95 51.21 55.95 58.47 H55=H54+N53
57 SUFPLUS/DEFTCIT(-) J/ -2.55 -2.60 -8.43 0.18 5.44 6.78 H57=H48-H55
a/ Consusar survy currently underway will provide wre accurate infortion on number of cooaectiooa.b/ Increase in domestic connections from 45,500 to 80,500 during 1981/82 through 1984/85 includes about 25,000 connections under project (KUDP), by contractors; KJS's share only about 10,000
connections is this period.c/ These inputs are beSt estimates. Actuals to be established following completion of conssmer survey, production and bulk metering and wastage and leakage study.
dl Tariff revision assumed effective April 1, 1983 (aboot 557 average).e/ Water supplied to ENM at concestsonary rate of Rs 0.10/m
3changed to Rs 0.50/m
3starting April 1, 1982.
t/ 1980/81 actual collection includes arrears collection fot 1977 onwards.g/ Represents arrears for current year only. Any arrears collection for period April 1, 1977 to March 31, 1980 will represent additional revenue not accounted for in this analysis.h/ Arrears collection of 507., 75%, 057,, 037,, and 85'/ is assu-ced tor 1981/82, 1982/d3, 1983/84, 1984/85 and 1985/8S, rep-Lcti-oly, duc to develapo-eact of metering, meLer repair and effectia-
collection programs.i/ Additional debt service of Rs 4.3 million, Rs 5.5 million and Rs 4.3 million in 1933/84, 1984/85 a,d 19S5/86, respectively, due to repayment of working capital loan.j/ Analysis represents a yearly cash position; therefore deficit is not carried forward. It is assumed that COUP meets shortfalls of KJS sach y:ar until operating surplus is generated.

INDIA
KANPUR URBAN DEVELOPMENT PROJECT
KANPUR JAL SANSTHAN
Table 2: WATER CONNECTION, CONVERSION AND METER REPAIR PROGRAM
Net Net Meters Meters New Con- Total Total Total
Working Defective Repaired Defective New Cons Working Defective Cot
Meters Meters during yr. during yr. Meters Meters
Bulk
At April 1, 1981 100 200 100 200 300
During year (200) 200
At April 1, 1982 300 300 300
Domestic - Metered
At April 1, 1981 20,600 12,000 32,600
During year 9,600 (600) 5,600 4,000 4,000 4,000
At April 1, 1982 30,200 10,400 30,200 10,400 40,600
During year 15,500 (1,000) 6,500 5,500 10,500 4,000
At April 1, 1983 45,700 9,400 45,700 9,400 55,100
During year 19,000 (2,000) 8,000 6,000 13,000 4,000
At April 1, 1984 64,700 7,400 64,700 7,400 72,100 1
During year 12,100 (3,000) 9,000 6,000 7,500 1,600
At April 1, 1985 76,800 4,400 76,800 4,400 81,200 t
Domestic - Unmetered
At April 1, 1981 13,600
During year (4,000)
At April 1, 1982 9,600
During year (4,000)
At April 1, 1983 5,600
During year (4,000)
At April 1, 1984 1,600
During year (1,600)
At April 1, 1985
Non-Domestic
At April 1, 1981 700 2,415 700 2,415 3,115
During year 1,115 (930) 1,000 70 185
At April 1, 1982 1,815 (1,485) 3,300 3,300
During year 1,140 (940) 1,000 60 200At April 1, 1983 2,955 545 3,500 3,500
During year 585 (385) 545 60 200
At April 1, 1984 3,540 160 3,700 3,700
During year 360 (160) 200
At April 1, 1985 3,900 3,900 3,900
_ _ _ _~~~~~~~~~~~~~~

- 75 -ANNEX 4
INDIA Page 3
KANPUR URBAN DEVELOPMENT PROJECT
KANPUR JAL SANSTRAN
Table 3: SEWERAGE OPERATION
1980/81 1981/82 1982/83 1983/84 1984/85 1985/86
Physical Parameters
Total city population ('000) 1,629 1,676 1,720 1,768 1,816 1,865Population with water connections ('000) 530 569 638 723 800 862Number of sewer connections 7,000 10,000 19,500 40,500 52,000 57,000Population with sewer connections ('000) 67 95 186 386 495 542
Sewer Connection Program
Sites and Services - - 1,500 9,000 4,500 2,000Slum Upgrading - - 2,000 5,000 3,000 1,000City-wide - 3,000 6,000 7,000 4,000 2,000
TOTAL 3,000 9,500 21,000 11,500 5,000
Distribution of New Consumers
Sites and Services
Rs 2,400/yr assessed rental (30%) 450 3,150 4,500 5,100 a/Rs 1,200/yr assessed rental (30%) 450 3,150 4,500 5,100Rs 500/yr assessed re?tal (40%) 600 4,200 6.000 6,800
1,500 10,500 15,000 17,000
Slum Upgrading
Rs 2,400/yr assessed rental (10%) 200 700 1,000 1,100Rs 1,200/yr assessed rental (25%) 500 1,750 2,500 1,750Rs 500/yr assessed rental (65%) 1,300 4,550 6,500 7,150
2,000 7,000 10,000 11,000
City-wide
Rs 2,400/yr assessed rental (35%) 1,050 3,150 5,600 7,000 7,700Rs 1,200/yr assessed rental (35Z) 1,050 3,150 5,600 7,000 7,700Rs 500/yr assessed rental (30%) 900 2,700 4,800 6,000 6,600
3,000 9,000 16,000 20,000 22,000
Total New Consumers by Category
Rs 2,400/yr assessed rental 1,050 3,800 9,450 12,500 13.900Rs 1,200/yr assessed rental 1,050 4,100 10,500 14,000 15,550Rs 500/yr assessed rental 900 4.600 13,550 18,500 20,550
3,000 12,500 33,500 45,000 50,000
Revenues (Rs '000,000)
From existing connections - Tax 3.10 3.40 7.20 7.60 7.60Sewage Farm 0.80 1.00 1.20 1.40 1.60New Connections
Rs 2,400/yr assessed rental 0.80 b/ 0.27 b/ 1.42 c/ 1.88 c/ 2.09 c/Rs 1,200/yr assessed rental 0.04 0.15 0.79 1.05 1.17Rs 500/yr assessed rental 0.01 0.07 0.41 0.56 .62
Total Potential Revenue 4,75 4.89 11.02 12,49 13.08
Percent Collection 60 65 70 75 80
Total Cash Collection 2.85 3,18 7.71 9.37 10.46
Expenditure (Rs '000,000)
Operating Expenses 7.30 8.90 9.60 11.52 13.82Debt Service 0.70 1.50 1.50 3.20 b/ 3.20
Total Expenditure 8.00 10.40 11.10 14.70 17.02
Surplus/(Deficit) (5.2) (7.2) (3.4) (5.3) (6.6)
a/ Cumulative totals.b/ Sewer tax of Rs 72, Rs 36 and Rs 15 p.a. for assessed annual rental values of Rs 2,400, Rs 1,200 and Rs 500
respectively.c/ Sewerage charges doubled to Rs 150, RS 75 and Rs 30 p.a. for assessed annual rental values of Rs 2,400, Rs 1,200
and Rs 500, respectively. Sewerage charges would include tax and a charge based on water usage,d/ Debt service increase due to additional essential investments to keep sewage pumping stations operational.

INDIA
KANPUR URBAN DEVELOPMENT PROJECT
Table 4: REVENUE AND EXPENDITURE PROJECTIONS FOR WATER SUPPLY AND SEWERAGE OPERATIONS
1980/81 1981/82 1982/83 1983/84 1984/85 1985/86
Expenditure (Rs '000,000)
Operating Expenditure
Water Supply 18.4 20.7 23.7 26.9 30.5 34.2
Sewerage 6.6 7.3 8.9 9.6 11.5 13.8
Debt Service
Water Supply 2.4 8.5 18.3 24.3 25.5 24.3
Sewerage 0.7 0.7 1.5 1.5 3.2 3.2
Total Expenditure 28.1 37.2 52.4 62.3 70.7 75.5
Revenue
Water Supply 18.2 26.6 33.5 51.4 61.4 65.3
Sewerage 1.6 2.9 3.2 7.7 9.4 10.5
Total Revenue 19.8 a/ 29.5 36.7 59.1 70.8 75.8
Surplus/(deficit) (8.3) (7.7) (15.7) (3.2) 0.1 0.3
a/ Represents actuals for the year. c j

- 77 -
ANNEX 5
INDIA
KANPUR URBAN DEVELOPMENT PROJECT
Selected Documents and Data Available in Project File
I. General
1. Kanpur Urban Development Project: An Approach Document2. Master Plan for Kanpur3. Uttar Pradesh: Draft Five Year Plan 1978-19834. Report of the Working Group on Housing and Urban Development
for the Sixth Five Year Plan (1980-85)5. UNESCO Sponsored Urban Community Development Project, Kanpur6. Kanpur Draft Urban Sector Background Note7. Kanpur Traffic and Transportation Plan 1971-1991
II. Sites and Services and Slum Upgrading
1. Project Report on Sites and Services and Slum Upgrading2. Annexure I: Detailed Design and Cost Estimates for Sites and
Services and Slum Upgrading3. Feasibility Report on Small-Scale Employment by UPICO, Ltd.4. Report on Housing Demand5. Household Income Distribution Survey6. Detailed Engineering Drawings for Barra, Gujaini and Pokharpur7. Detailed Engineering Drawings for Ten Slum Upgrading Sites
III. Environmental Sanitation
1. Kanpur Water Supply Master Plan Project2. Kanpur Sewerage Master Plan Project3. Consultants' Report on Solid Waste Management4. Project Report on Sewerage5. Project Report on Stormwater Drainage6. Project Report on Traffic Engineering and Management7. Project Report on KNM Maintenance Activities8. Project Report on Water Supply9. Project Report on Solid Waste Management
IV. Financial and Institutional
1. Consultants' Report on Kanpur Jal Sansthan2. Internal Accounts of Kanpur Nagar Mahapalika


____r_____- - ________ ____________ ____ INDIA IBRD 15671R
0 1l ~~~~~~~~~~~~~~~~~~IN DIA
NT JE .F M ONFtF TL +.+.+ l ''I KANPUR URBAN DEVELOPMENT PROJECT
\~~~~~~~~~Nh FNFNt6AAD ErIIF.CA NFONN NUsp. EONNe FAnM ! N1 O.vE FJAF NO SF00 ON
....... 1 1 ITI fN 1-.
NENMENT A O' 50.5 LOCATION OF SLUM UPGRADING AND SITES AND SERVICES
1 . N A -r "A' Ir HT.elA NTe D l
t
-
i , q F ABAD 5 Nu -l -ODE CeF .D-AF
rILOMETEnn~ ~ ~ ~ ~ ~ ~ ~ ~ ~ ~ ~ ~ ~~ ~ ~~ ~ ~ ~~ ~ ~ ~ ~ ~ ~ ~ ~ ~~~~~~~~~~~~~~~~~~~~~~~~~~~~~~~~~~~~~SPEBR18
_ _ ___.____ __ _. ____. ___ ___, _ ,_: _ , I \ ___ ____ _ .E _ _ __-N
>1\' -fffb:;'_,,9F; \E NA /
NEPTEMOeFR 019


_ _ _ _ _ __ _ I~~~~~~~~~~~~~~~~~~~~~~~~~~~~~~~~~~~~~~~~~~~~~~BRD 15672R
I ND I A
KANPUR URBAN DEVELOPMENT PROJECT hmAmmsAm
Barra Sites and Services \\----~. ; Aae6;l dUtt
PRC-JE-T N4C>l fROJt_ T \\__,,Uee;Wolv
L_Pr -g. Sch-. Gr-ebelt Et Flsg Ol Pls el?__:L _
-~/dmee@flyf
=H,,, Schos_ pnAI.I,ndPuL F-lt nq RwB , :__--~
X Commerclol - ~KUDP (F-nk P-M c t E-:fi,q P-l Lne ----- ~ _- --
-- brk Ar-o ceeBudr __ ~~ < --- r- --- \
L~E-R .G P -- -- --
-
M,G 5PI.,,5R 9


br, S,tes o,,d se-sces
I N D IA
KANPUR URBAN DEVELOPMENT PROJECTPokharpur Sites and Services Infrastructure
F-~~~~~~~~~~~~__
PROJECTI ~~~~~~~~~~~~~~~~-Project Boundary --- Fielo Boundaries
- Con,,,erc.cal Buildings --- Boundlary Wolis to be DOsmontedfire Hydrants Trees
0 ~~~~~~~~~~~~~~~~~~~~~~~~~~~~~~Plots Abodi to be Upgraded
B ____________________________ V M n~~~~~~~~~~~~~~~~~~~Wed !,,fll RontsWae osNON -PROJECT
Sewers ~~~~~~Cantonment Boundary
7 ~~~~~~~~~~~~ Van~es En,sting Roads
-o ~~~~~~~~~Cannecri- Cra,casets [:]~ Ex stin,g Buidings
Manholes*nEstgWe
I Elect:,. Lines ~~~~~~~~~~~~~~~o Emst,ng Electric Lin,es and Poles
Ah - j~~~~~~~~~~~~~~~~~~~~~~-j
X u~~~~~~~~~~~~~~~~~~~~~~~~~~~~~~~~~~~~~~~~~~~~~~~B.A' ~~~~~~~~~~~~~~~~~~~' ~ ~ ~ -
y~~~~~~~~~~~~~~~~~~~~~~~~~~~~~~~~~~-V9 ic


IBRD 15674R
b hnwL nn t~~~~~;9 wAp | $ 9 ~~~G W A L T 0 L I fUddmez Nf I l I N
,,OWALTOLG No 12.480r , @ 1 , ,? Ll-u -. - - =---=- -'----' =0 d _ <-r - - r R
= _==_* ................... i ,a ,K,,r 1! ................. -.1 < a E-t,g P.ca Strcture
V~ ~~~~~~~~~~~~~~~~~~~~ 7 -
/ T w MFTERS MACPOBERT GAIIJ~~~~~~~~~~~~~~~~~~~~~~~~~~~~~~~~~~~~~~~~~BudayofAo oS ,
Smell EM ePt
7," Elect- Lines and Po[es
~~~~~~1 2~~~~~~SHGL- d
'7J17]f ~~~~~~~~---~~~~-- ~ ~ ~ TYPK)ICAL SLUMA PGRDIN
A / GWALTO~~~~~~~~~~~~~~~~~~~~~~~~~~~~~~~~~~~~~~LT o 1/8A ,, S\ - - ~ ~ ~ ~ ~ ~ ~ ~ ~ ~~ Existing SenicEucca Structures~~~~~~~~~~~~~~~~~VCIH 2 5- ~ ~ ~ ~ ~ ~ ~ ~ ~1 Existing Kutcha Structures~~~~~~~~~~~~~~~~~~~~~~~~~~~~~~~~~~M
1r7 I~~~~~~~~~~~~~~~~~~~~~~~~~~~~~~~ 1R1N OLG
1/ - I~~5 i Struckies to be Demolishe
IL FTERstngTSei/i K'~~~~~~~~~~~~~~~~~~~~~~~~~~~~~~~~~~~~~~~~~~~~~~~RBR GAr I)Eisin Wl
y ~ ~ ~ ~ ~ ~ 'r-.-~~~~~~~~~~~~i ~ ~ ~ ~ ~ ~ Ot.N.,CCL'GL Parks~~~~~~~~~~~~~~~~~~~~~EPEME 18


![Untitled-1 [hclinfosystems.in] · The Company has tied up long term borrowings during the year and repaid a part of its short term borrowings. Net Borrowings ` crores Particulars](https://img.pdfslide.us/doc/110x75/5e7f6cd958ba933e346222ff/untitled-1-the-company-has-tied-up-long-term-borrowings-during-the-year-and.jpg)