Embed Size (px)
Citation preview
Does Easing Controls on External Commercial Borrowings boost Exporting Intensity of Indian Firms?
Udichibarna Bosea, Sushanta Mallickb, Serafeim Tsoukasc
a Finance Subject Group, Essex Business School, University of Essex, Colchester CO4 3SQ,
UK
b School of Business and Management, Queen Mary University of London, London E1 4NS, UK
c Economics Subject Group, Adam Smith Business School, University of Glasgow, Glasgow
G12 8QQ, UK
20th March 2017
Abstract
This paper focuses on the impact of the export-oriented policy initiative, namely foreign
exchange management act (FEMA) in enabling greater globalisation of Indian firms and their
access to external commercial borrowing (ECB), on firms’ share of exports, using a rich
dataset of 11,612 Indian firms over the period 1988-2014. Using a difference-in-differences
approach, the results show a positive and significant effect of this policy initiative on firm-
level exports. Further, we take into account firms which are recipients of government grants
and subsidies and explore how the export share has diverged among these firms after the
policy change. Finally, we focus on the sensitivity of exporting activities across financially
vulnerable firms and industries. We conclude that firms with access to ECB have higher
exporting activity compared to matched companies with only domestic sources of financing.
Moreover, our results suggest that this effect is particularly stronger for firms which receive
extra incentives in the form of grants and subsidies. Finally, we find that when financially
constrained firms and firms operating in vulnerable industries gain access to foreign
financing, they are able to increase their export participation.
Keywords: Exporting; Financing; Indian firms; FX market liberalization JEL Classification Codes: F4, O4, H2
1
1. Introduction
It is already well established that access to financing is critical for firm growth (Rajan and
Zingales, 1998; Demirgüç-Kunt and Maksimovic, 1998; Rahaman, 2011). But due to limited
outward orientation on the flow of capital, lack of access to external financing became a
major constraint for emerging market firms in the 1990s so as to help accelerate their
exporting activity. Many governments in the developing world have been liberalising their
capital account transactions namely external borrowings by firms in order to enable them to
have better access to financing, which in turn will help them compete in the global market
place and to expand their market share and thereby increase economic activity. In the context
of India, the foreign exchange management act (FEMA), which came into being in 1999 (and
became effectively operational starting 2000), was a policy shift that can help us analyse the
effectiveness of such liberalisation in enabling firms to access funds from abroad and in
achieving greater globalisation of Indian firms during the post-1991 reform period.
Liberalising foreign exchange market rules and regulations to enable access to financing will
likely facilitate trade flows and overseas flow of funds. This legislation replaced the earlier
more rigid regulatory regime called foreign exchange regulation act (FERA) that remained in
place since 1973. To test the impact of this international transaction liberalisation, this paper
aims to capture the effect of this regulatory change on exporting activity at firm level in
India.
In another strand of literature on exporting and firm performance, it has been established
that exporting firms are different (see a recent survey paper with meta-analysis, Yang and
Mallick, 2014) identifying the key determinants of the mixed evidence on learning-by-
exporting hypothesis. Learning-by-exporting promotes firm-level productivity, and transfers
information from international buyers and competitors that help improve the post-entry
performance of exporters (Greenaway and Kneller, 2004; Yasar et al., 2006; Crespi et al.,
2
2008). In this literature, foreign financing has not been emphasised as a channel to improve
exporting performance due to lack of evidence on such capital account liberalisation in the
context of emerging market economies. Therefore, the key question that has been paid little
attention in the literature is whether access to external trade financing makes a difference to
the exporting activity. Paravisini et al. (2015) suggest that credit shortages can hamper
exports as the variable cost of production increases rather than sunk entry costs.
The key contribution of this paper is to study whether access to foreign financing
increases exporting activity. This idea of linking financing with exporting is less well
researched in the literature (see Eck et al., 2015). Theoretically, Eck et al. (2015) show that
internationally active firms intensively use cash-in-advance financing because it serves as a
quality signal and reduces the high uncertainty related to international transactions. Such
trade credits come from a foreign buyer to an exporter as small size advances rather than
bigger loans from the international debt market that can help exporting firms to meet their
expenses towards imported intermediate inputs and technology (machinery and equipment
imports). Therefore the data we use in this paper to capture debt market access of exporting
firms can provide better insights as to whether such capital account policy liberalisation for
these outward-oriented firms can help increase their participation in the global market place.
We find that firms with access to external commercial borrowing derive positive effects on
their export intensity or exporting decision.
The hypotheses considered can display endogeneity where exporting status might
influence financing or alternatively, financing could influence export intensity. It is for this
reason we consider a non-parametric method – propensity score matching (hereafter PSM) –
to accommodate potential endogeneity (see Rosenbaum and Rubin, 1983; Heckman et al.,
1997, 1998; Yang and Mallick, 2010; Mallick and Yang, 2011, 2013). PSM technique
enables ‘like-for-like’ comparison and is an appropriate method to examine the relationship
3
between foreign financing and exporting intensity through estimating how distinct the
exporting firms are based on their ability to access external debt financing (i.e., those with
foreign financing and those only with domestic financing). We follow Leuven and Sianesi’s
(2003) technique to isolate firms with foreign financing (treated firms) from the population of
firms with domestic financing (non-treated firms), and then look for control firms that best
match treated firms in multiple dimensions such as firm size, profit, profit squared, collateral,
collateral squared, age, age squared and industry dummies before the treatment (FEMA
policy).
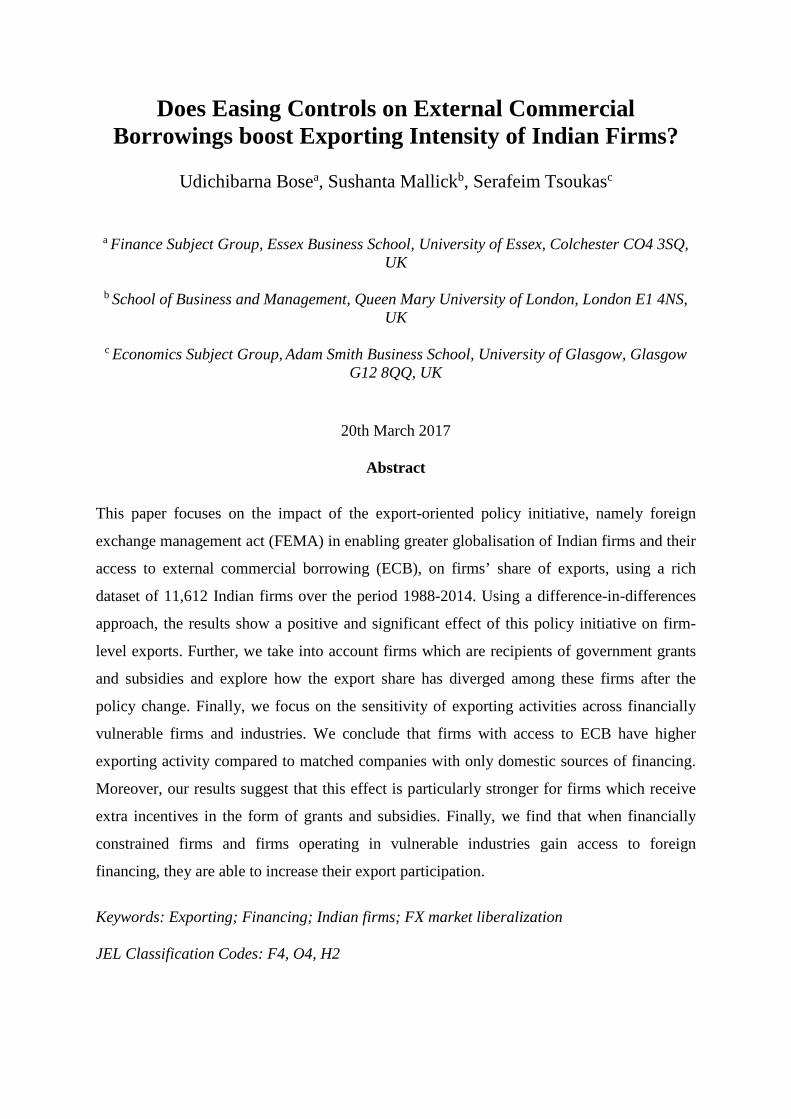
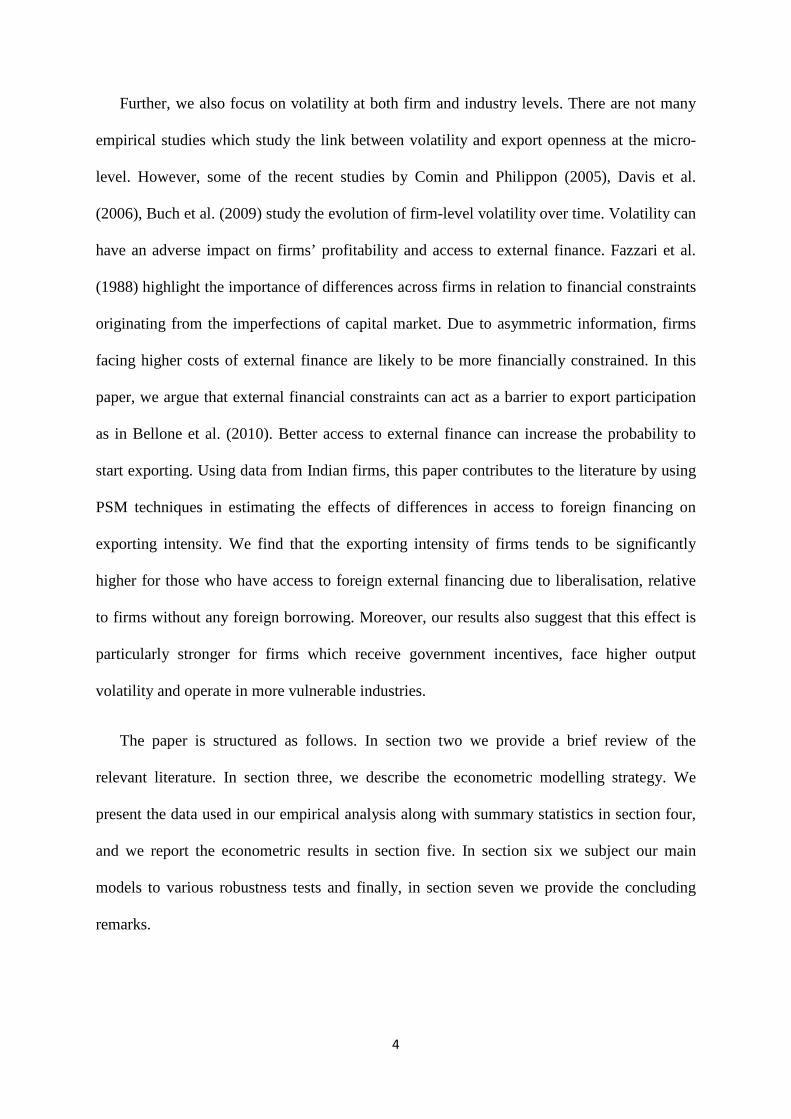
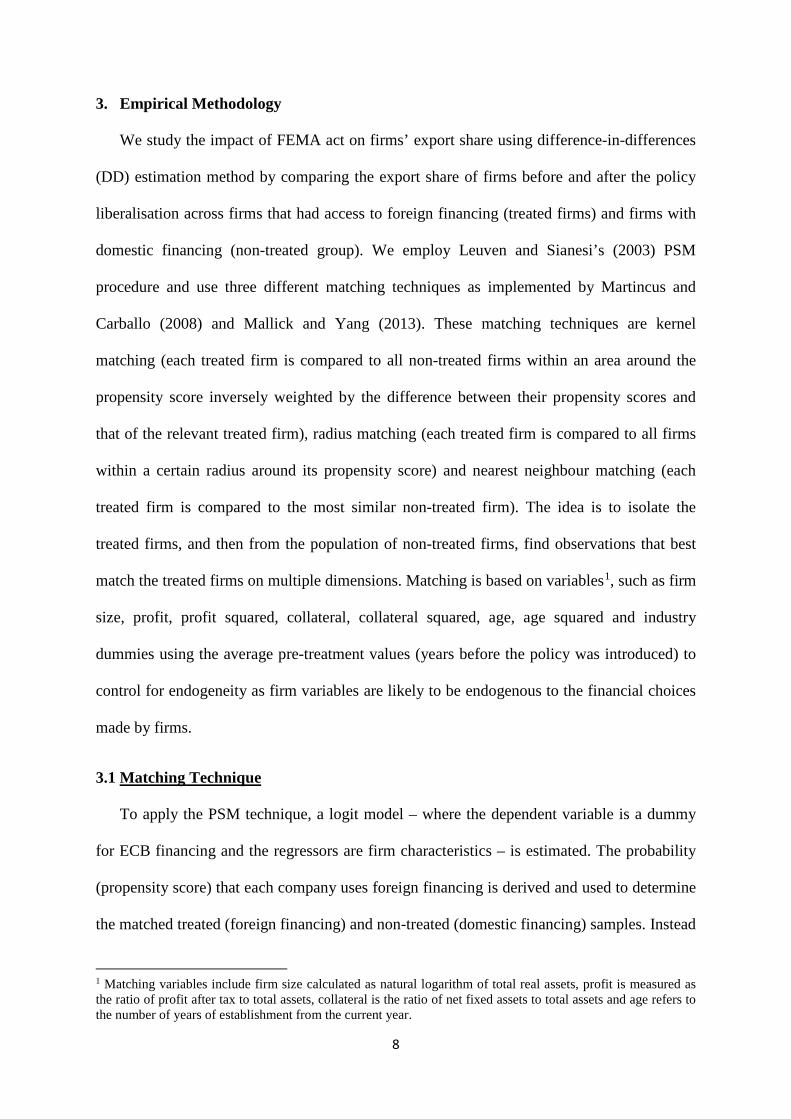
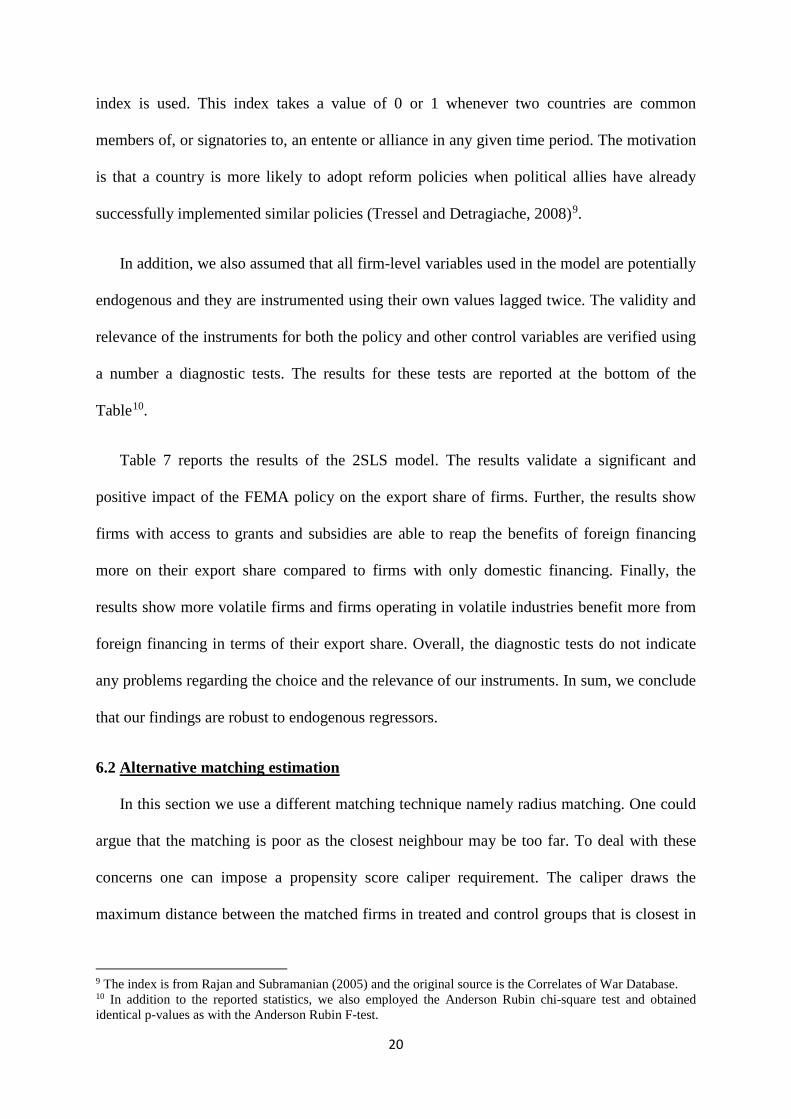
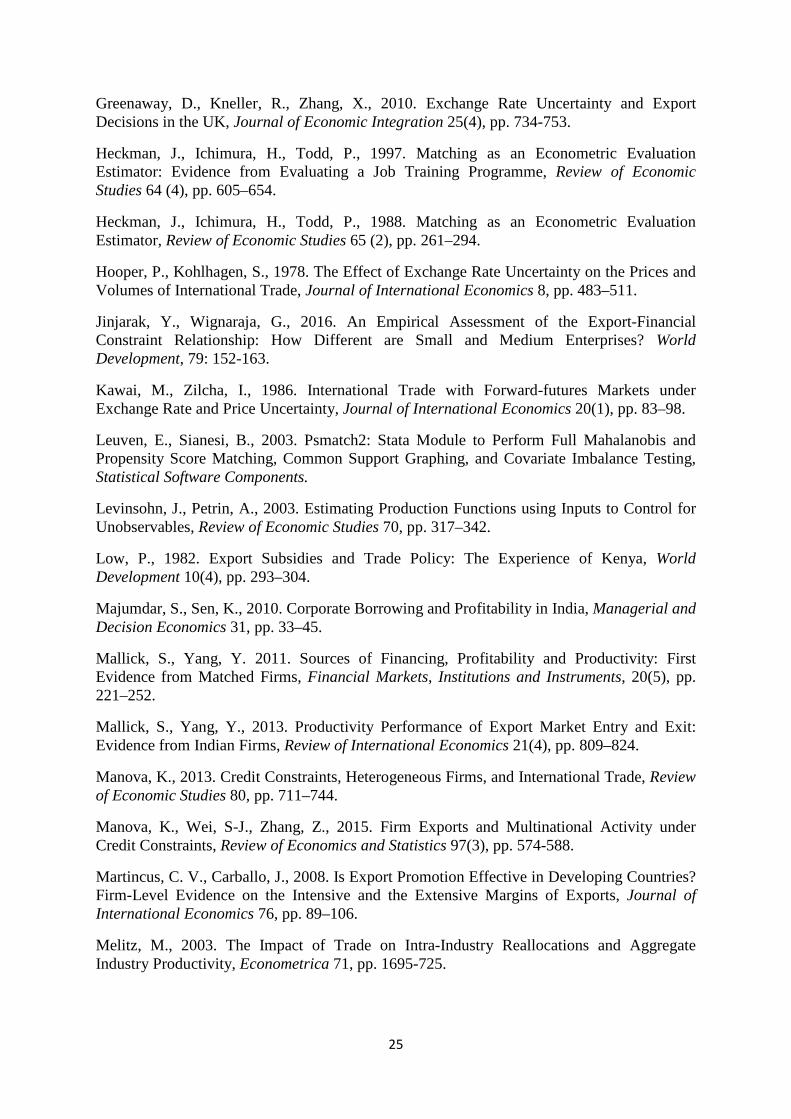
Figure 1 graphs the trend of export intensity among Indian firms over the sample period
of 1988-2014. Panel A shows an upward trend in the export share of firms after the FEMA
policy became operational in 2000. Further, Panel B displays a graph which shows a rise in
export share of treated firms after the policy in 2000, compared to control firms. This graph
satisfies the parallel trends assumption of the model suggesting that in the absence of the
reform both treated and control groups would have exhibited a similar growth trend in their
export shares.
We also take into account firm-level heterogeneity by focusing on firms which have
access to grants and subsidies. As firms which are involved in selling abroad involve sunk
costs and only the most efficient and productive firms are able to overcome the entry barriers
and export (Bernard and Jensen, 1999; Melitz, 2003). Görg et al. (2008) study the
relationship between government grants and subsidies and exporting activity of firms. They
find that if grants are large enough, then they can encourage already exporting firms to
compete more effectively on the international market. In this paper, we further explore the
role of grants and subsidies for firms which have access to foreign financing.
4
Further, we also focus on volatility at both firm and industry levels. There are not many
empirical studies which study the link between volatility and export openness at the micro-
level. However, some of the recent studies by Comin and Philippon (2005), Davis et al.
(2006), Buch et al. (2009) study the evolution of firm-level volatility over time. Volatility can
have an adverse impact on firms’ profitability and access to external finance. Fazzari et al.
(1988) highlight the importance of differences across firms in relation to financial constraints
originating from the imperfections of capital market. Due to asymmetric information, firms
facing higher costs of external finance are likely to be more financially constrained. In this
paper, we argue that external financial constraints can act as a barrier to export participation
as in Bellone et al. (2010). Better access to external finance can increase the probability to
start exporting. Using data from Indian firms, this paper contributes to the literature by using
PSM techniques in estimating the effects of differences in access to foreign financing on
exporting intensity. We find that the exporting intensity of firms tends to be significantly
higher for those who have access to foreign external financing due to liberalisation, relative
to firms without any foreign borrowing. Moreover, our results also suggest that this effect is
particularly stronger for firms which receive government incentives, face higher output
volatility and operate in more vulnerable industries.
The paper is structured as follows. In section two we provide a brief review of the
relevant literature. In section three, we describe the econometric modelling strategy. We
present the data used in our empirical analysis along with summary statistics in section four,
and we report the econometric results in section five. In section six we subject our main
models to various robustness tests and finally, in section seven we provide the concluding
remarks.
5
2. Background literature
Policy liberalisation on capital account flows can influence the financial constraint-export
relationship in a temporal sense. Caggese and Cuñat (2013) found that financing constraints
reduce the aggregate productivity gains induced by trade liberalization by 25 percent by
distorting the incentives of the most productive firms to self-select into exporting. Although
there are empirical studies reporting a positive link between export participation (extensive
margin) and the share of exports in total sales (intensive margin) and the availability of
different types of domestic financing (see Jinjarak and Wignaraja, 2016), there is little
evidence in terms of whether regulatory policy shift matters in this relationship that would
require separating the sample into firms with access to foreign financing and those who do
not have such access, especially in countries like India and China where closed capital
accounts still remain in place.
It is already well known that there are both static and dynamic gains from exporting –
static gains resulting from access to larger external markets and dynamic gains in terms of
learning from exporting and productivity gains. Cheaper imported inputs due to lower tariffs
can raise productivity via learning, variety, and quality effects (see Amiti and Konings, 2007;
Goldberg et al., 2009). For exporting to occur, cheaper imported inputs can be a key channel
through which trade policy reforms and FDI inflows could influence firm-level productivity
(see for example Topalova and Khandelwal, 2011). But trade financing remains an important
constraint for these export oriented firms who need imported raw materials and technology to
enhance their productivity. Firms with access to funds from overseas therefore may
outperform those firms which are financially constrained. Bandyopadhyay et al (2015)
provide evidence that there are there are increasing returns to foreign loans, while there are
diminishing returns to foreign aid, using country-level data from 131 developing nations.
6
Trade-related financial constraints can therefore reduce a firm’s ability to finance the costs of
maintaining its presence in a foreign market.
Focusing on firms rather than on country-level aggregates, Muûls (2008) analysed the
interaction between credit constraints and export behaviour at firm-level. The results showed
that chances of firms being exporters were more if they enjoyed lower credit constraints and
higher productivity levels. Further, Bellone et al. (2010) analysed the relationship between
financial constraints and firms’ exports behaviour, and showed that firms which were
financially healthy were more likely to become exporters, and financial constraints acted as
barriers to export participation. Thus firms which had better access to external finance were
more likely to start exporting.
Berman and Héricourt (2010) used a large cross-country and firm-level data of nine
developing and emerging economies to study the effect of financial factors on firms’
exporting decisions and exporting volumes. The results showed that firms’ access to finance
played an important role in their entry decision to enter the export market. However, better
financial health does not increase the probability of a firm remaining in the exporting market.
They further find that productivity is an important determinant of exporting decision of firms
if firms have better access to external finance. Finally, they show that an improvement in a
country’s financial development has a positive impact on both number of exporters and
exporters’ selection process.
Manova et al. (2015) used Chinese exports data at firm-product-destination level to
investigate how comparative advantage of firms reflected local credit constraints. They
showed that foreign-owned firms and joint ventures displayed better export performance
compared to private domestic firms, with a greater advantage in sectors with higher financial
vulnerability. They further found that private Chinese firms were more successful exporters
7
than state-owned enterprises in financially dependent industries. Using Argentine exporters’
sources of financing, Castagnino et al. (2013) show that firms with better access to foreign
financing export a wide variety of products and serve more distant and developed markets.
The above studies provide a useful background to setup a linkage between financial
constraints faced by firms and how it influences firms’ exporting decisions. In this context,
policy liberalisation allowing access to foreign credit can play a role that we intend to explore
in this paper using Indian firm-level data. The pro-liberalisation policies of the Government
of India in enacting FEMA in the winter session of parliament in 1999 (replacing FERA)
were aimed to help support foreign exchange transactions in both capital account and current
account transactions to achieve greater trade and financial openness. The key objective of the
act was to facilitate foreign exchange payments and acquisition/holding of FX flows,
consistent with full current account convertibility and progressive liberalisation of capital
account transactions. Patnaik et al. (2015) provide a detailed account of the existing
regulations including recent policy changes on capital controls for foreign currency
borrowing by Indian firms. Historically, Indian interest rates have always been higher than
interest rates offshore which will encourage Indian firms to borrow at a cheaper rate from
overseas. However the maximum amount of ECB that can be raised without RBI approval
has increased gradually since FEMA was introduced (USD 750mn or equivalent currently
during a financial year). Such limit can prevent any emergence of systemic risk due to
currency mismatch or excessive borrowing. Thus the policy shift since early 2000 could have
made a difference to exporting activity of Indian firms that requires detailed empirical
analysis in order to conclude whether progressive liberalisation of capital account
transactions led to any beneficial effect on India’s external trade via easing access to external
debt market.
8
3. Empirical Methodology
We study the impact of FEMA act on firms’ export share using difference-in-differences
(DD) estimation method by comparing the export share of firms before and after the policy
liberalisation across firms that had access to foreign financing (treated firms) and firms with
domestic financing (non-treated group). We employ Leuven and Sianesi’s (2003) PSM
procedure and use three different matching techniques as implemented by Martincus and
Carballo (2008) and Mallick and Yang (2013). These matching techniques are kernel
matching (each treated firm is compared to all non-treated firms within an area around the
propensity score inversely weighted by the difference between their propensity scores and
that of the relevant treated firm), radius matching (each treated firm is compared to all firms
within a certain radius around its propensity score) and nearest neighbour matching (each
treated firm is compared to the most similar non-treated firm). The idea is to isolate the
treated firms, and then from the population of non-treated firms, find observations that best
match the treated firms on multiple dimensions. Matching is based on variables1, such as firm
size, profit, profit squared, collateral, collateral squared, age, age squared and industry
dummies using the average pre-treatment values (years before the policy was introduced) to
control for endogeneity as firm variables are likely to be endogenous to the financial choices
made by firms.
3.1 Matching Technique
To apply the PSM technique, a logit model – where the dependent variable is a dummy
for ECB financing and the regressors are firm characteristics – is estimated. The probability
(propensity score) that each company uses foreign financing is derived and used to determine
the matched treated (foreign financing) and non-treated (domestic financing) samples. Instead
1 Matching variables include firm size calculated as natural logarithm of total real assets, profit is measured as the ratio of profit after tax to total assets, collateral is the ratio of net fixed assets to total assets and age refers to the number of years of establishment from the current year.
9
of regressing exporting on FEMA regulation enabling financing access in the whole sample,
the average effect of the regulatory change with foreign financing on exporting in the
matched samples (also known as the average treatment on treated effect; hereafter ATT) is
estimated. The magnitude of difference in exporting pattern between the treatment
(companies using foreign financing) and control groups (companies with domestic financing)
is then derived. Across all the different matching methods, the average exporting
performance differs between companies with foreign financing and firms without such
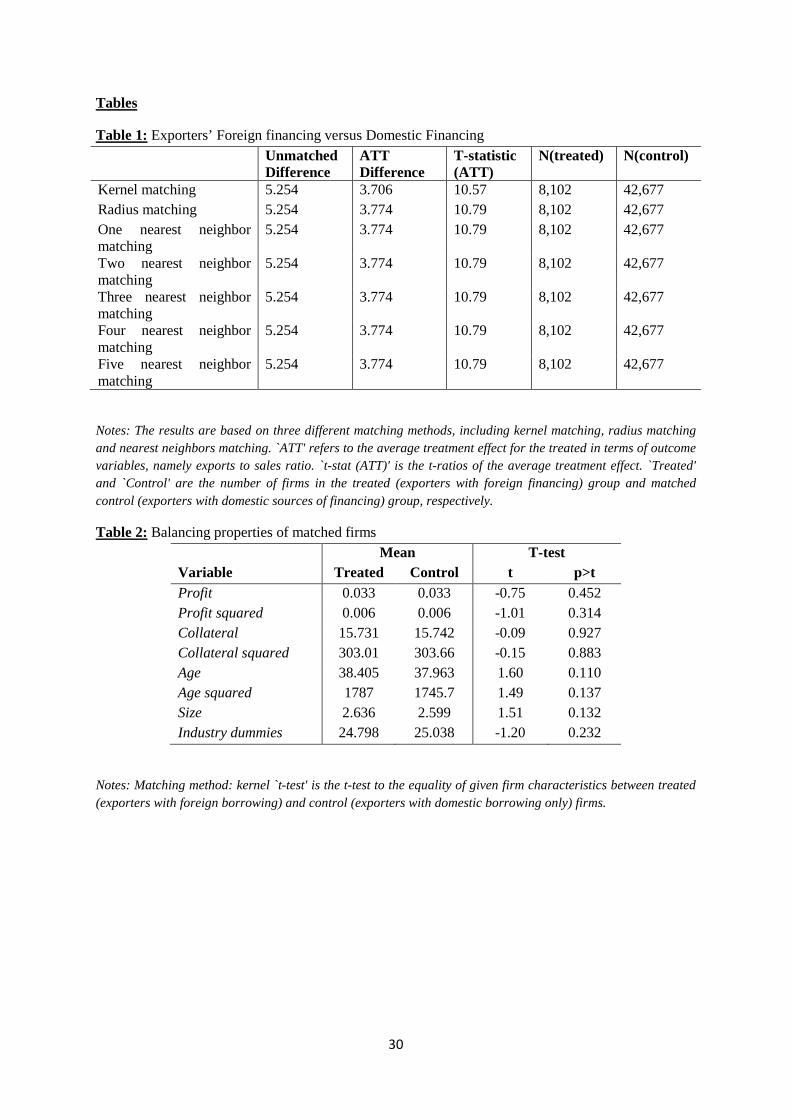
financing is statistically significant. In Table 1 all the matching methods show that there is
significant difference between companies with access to foreign borrowing and the ones with
no foreign financing.
Quality of matching:
It is possible that the above results on matched firms could be biased if the quality of
matching is poor. We therefore have conducted the tests on the quality of matching obtained.
Propensity score test implemented in our analysis helps us find whether the firm
characteristics are similar between matched treated and control groups, allowing an adequate
`like-for-like' comparison between two groups. We test the equality of the given firm
characteristics between matched treatment and control groups and confirm whether there is
significant difference between these two groups in terms of their characteristics using t-tests
after matching. The quality of matching appears good as the covariates are not significantly
different between matches obtained, suggesting there is an adequate `like-for-like'
comparison in the matching exercise, as the p-value of the difference between treatment and
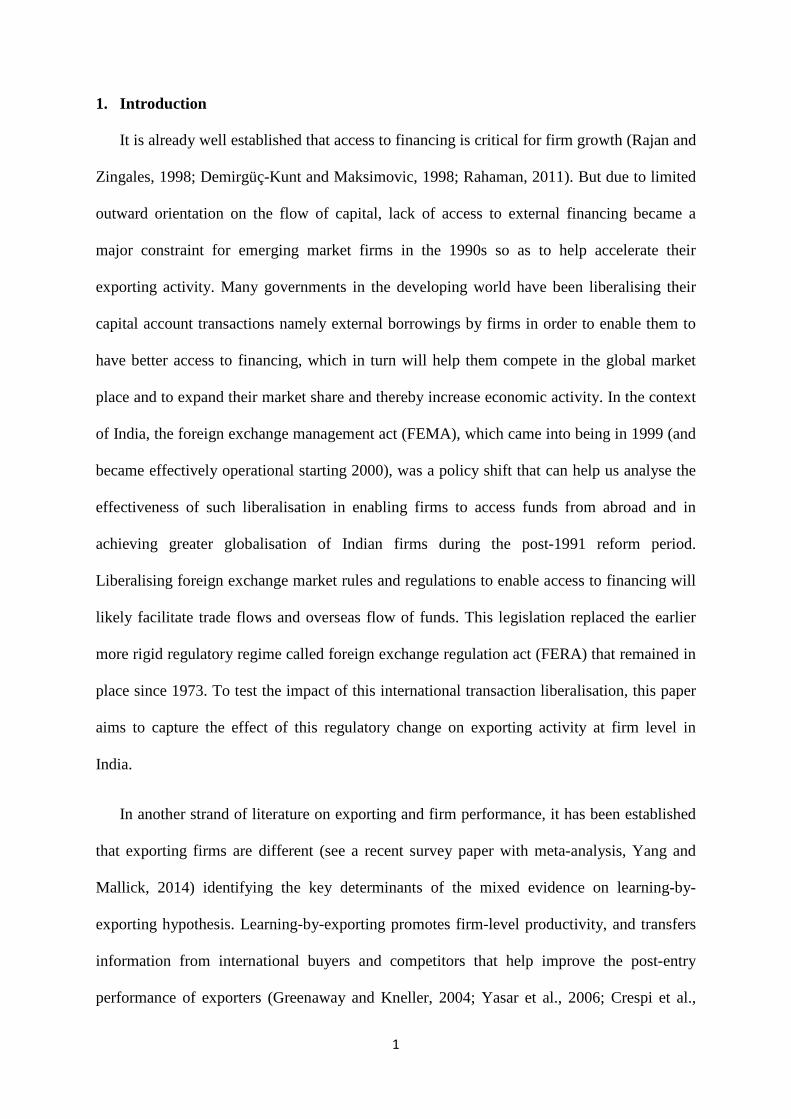
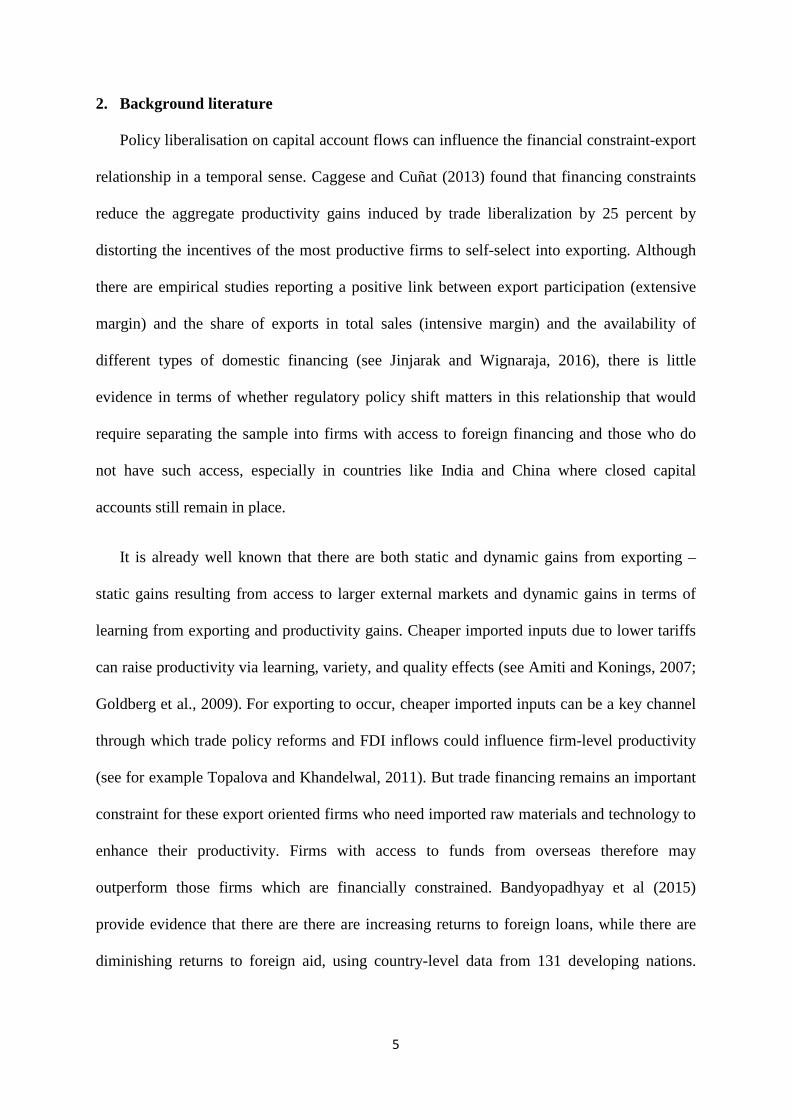
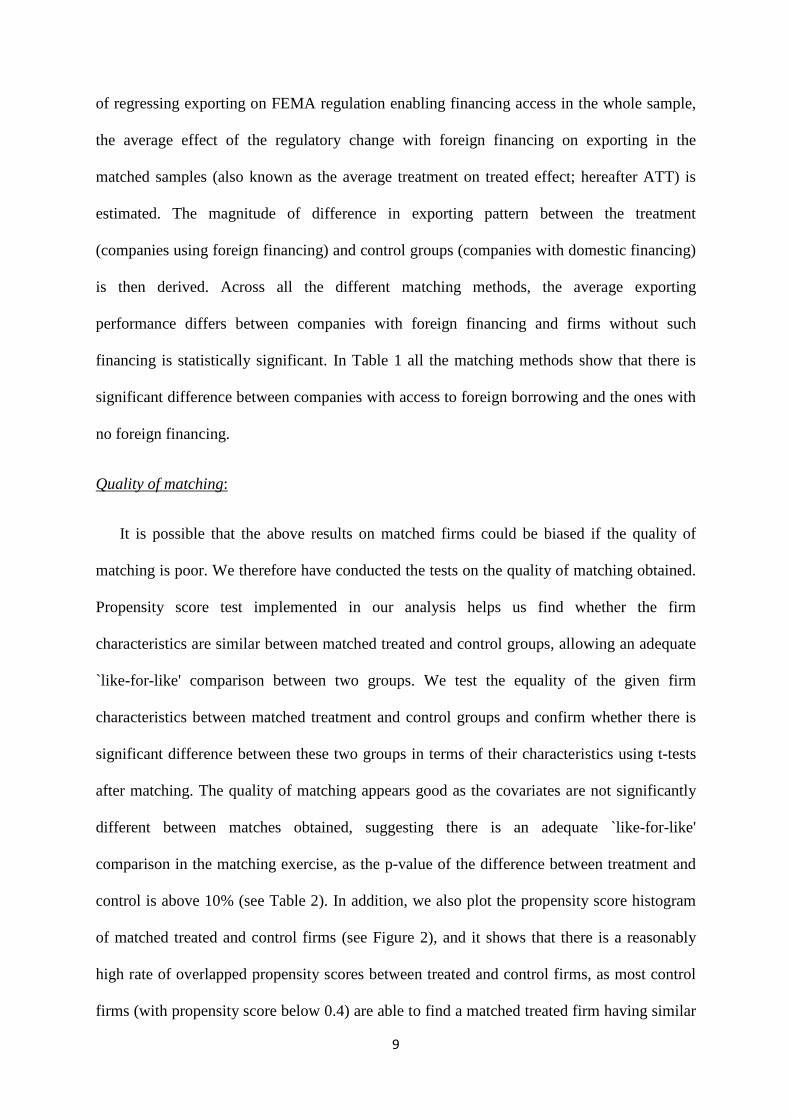
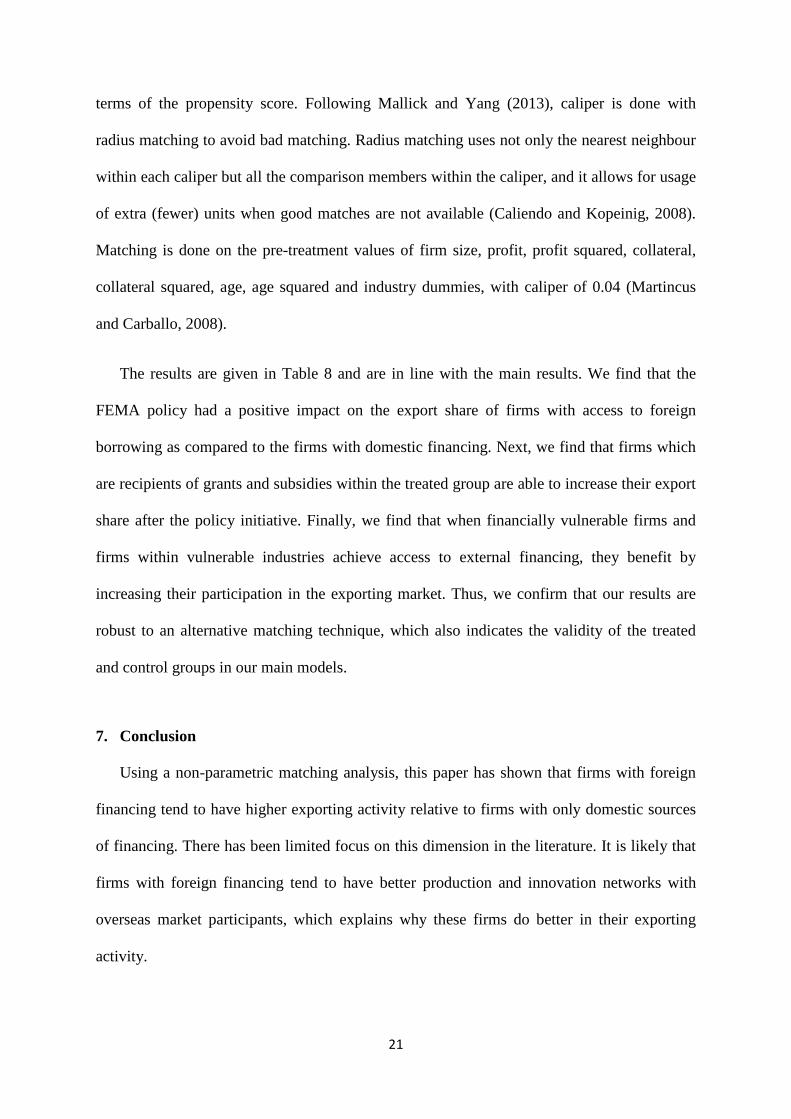
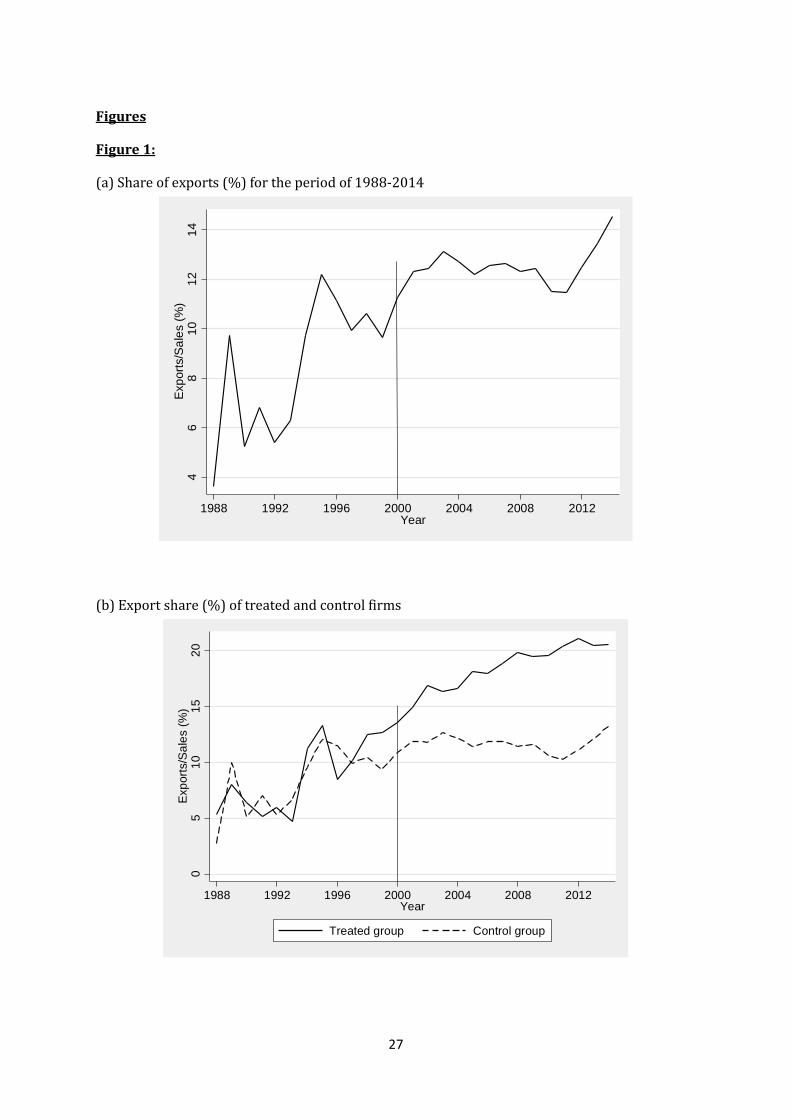
control is above 10% (see Table 2). In addition, we also plot the propensity score histogram
of matched treated and control firms (see Figure 2), and it shows that there is a reasonably
high rate of overlapped propensity scores between treated and control firms, as most control
firms (with propensity score below 0.4) are able to find a matched treated firm having similar
10
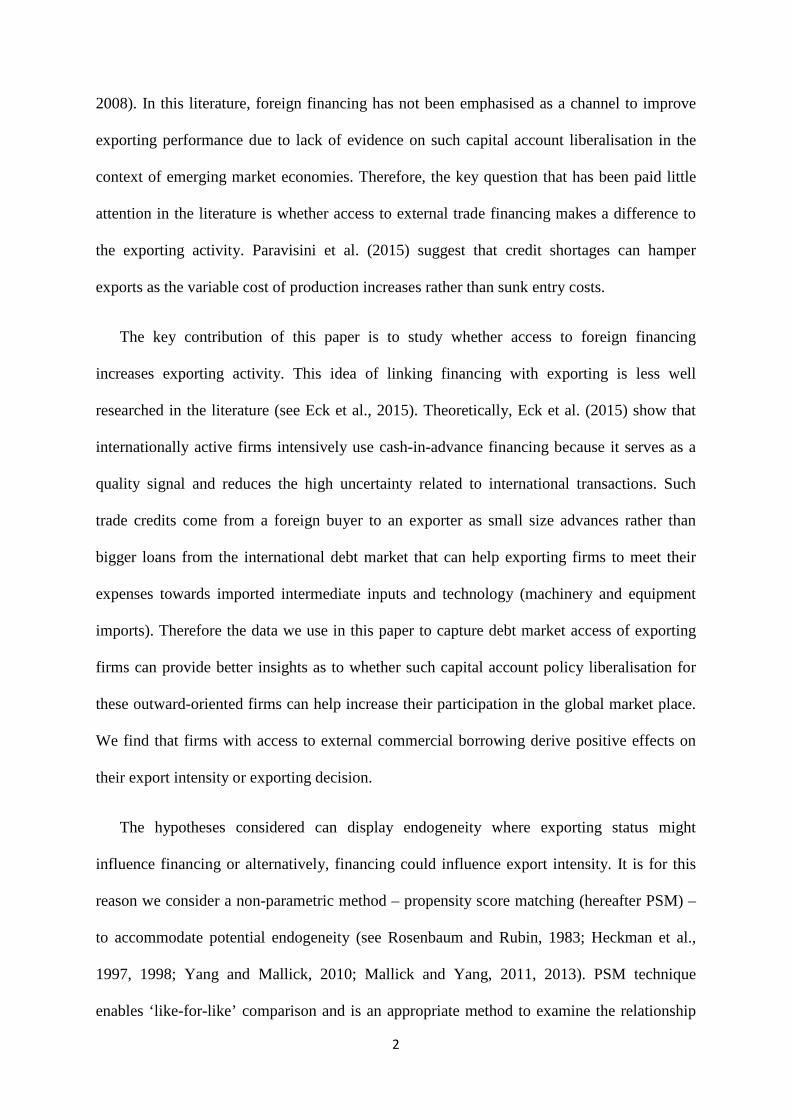
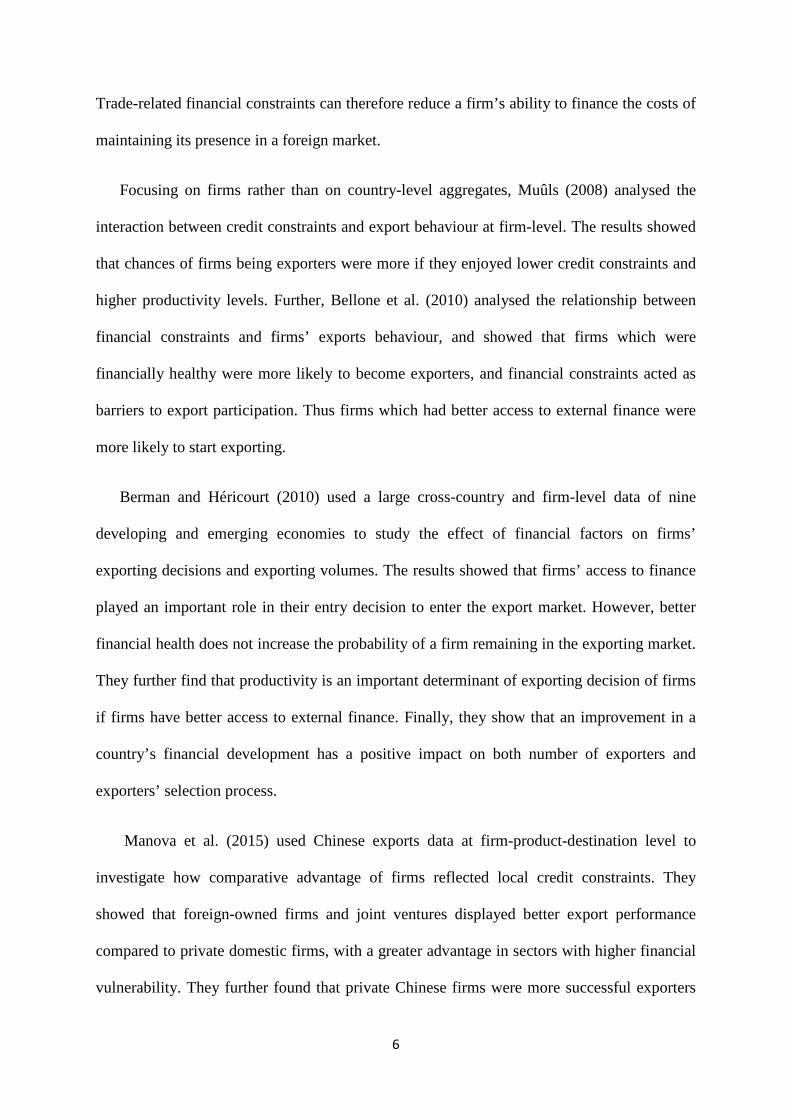
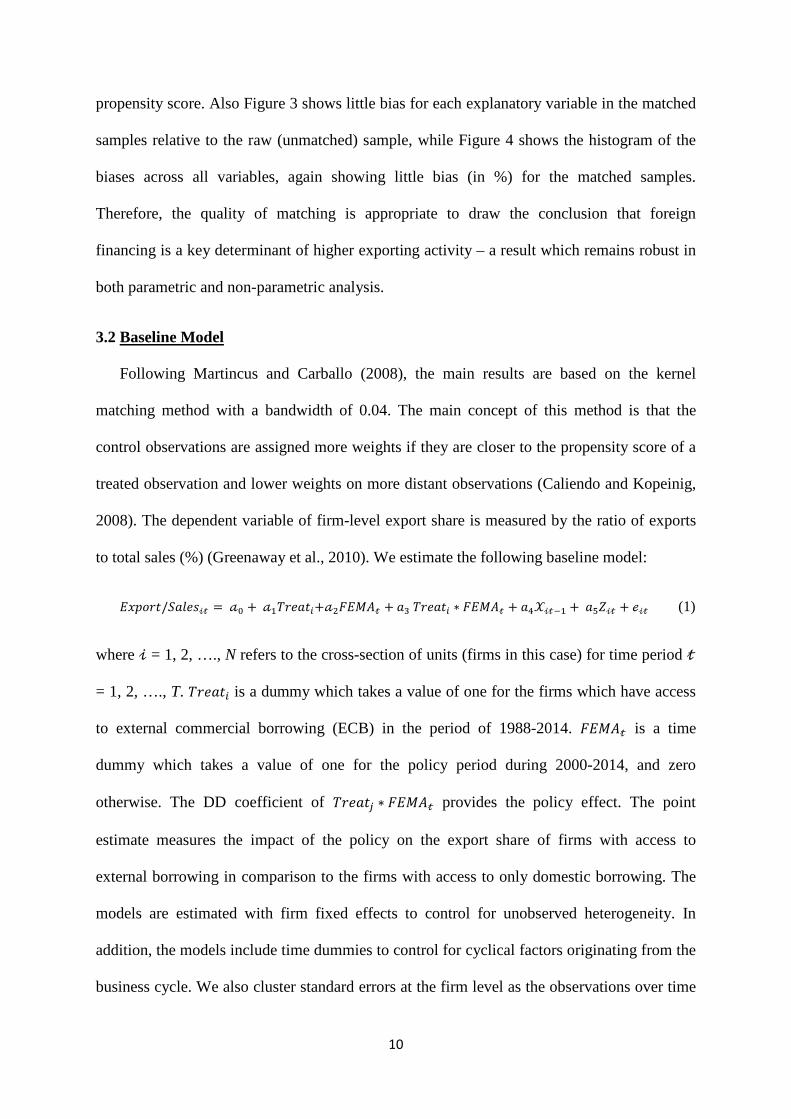
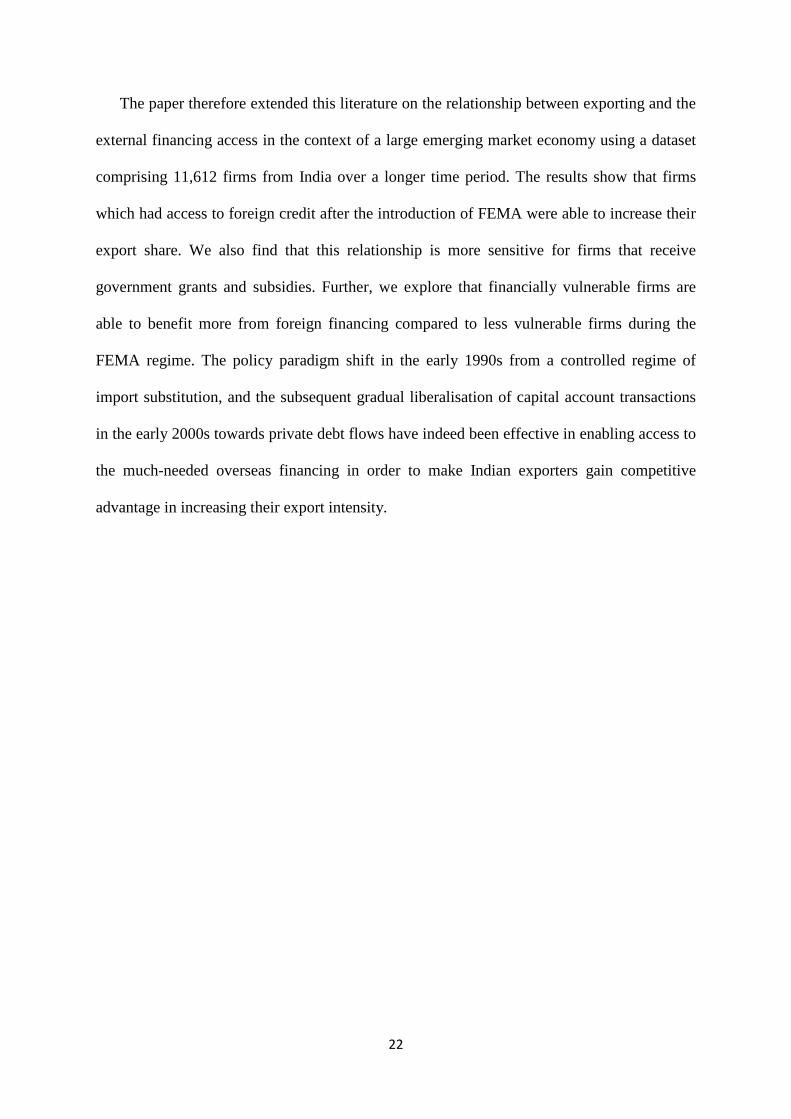
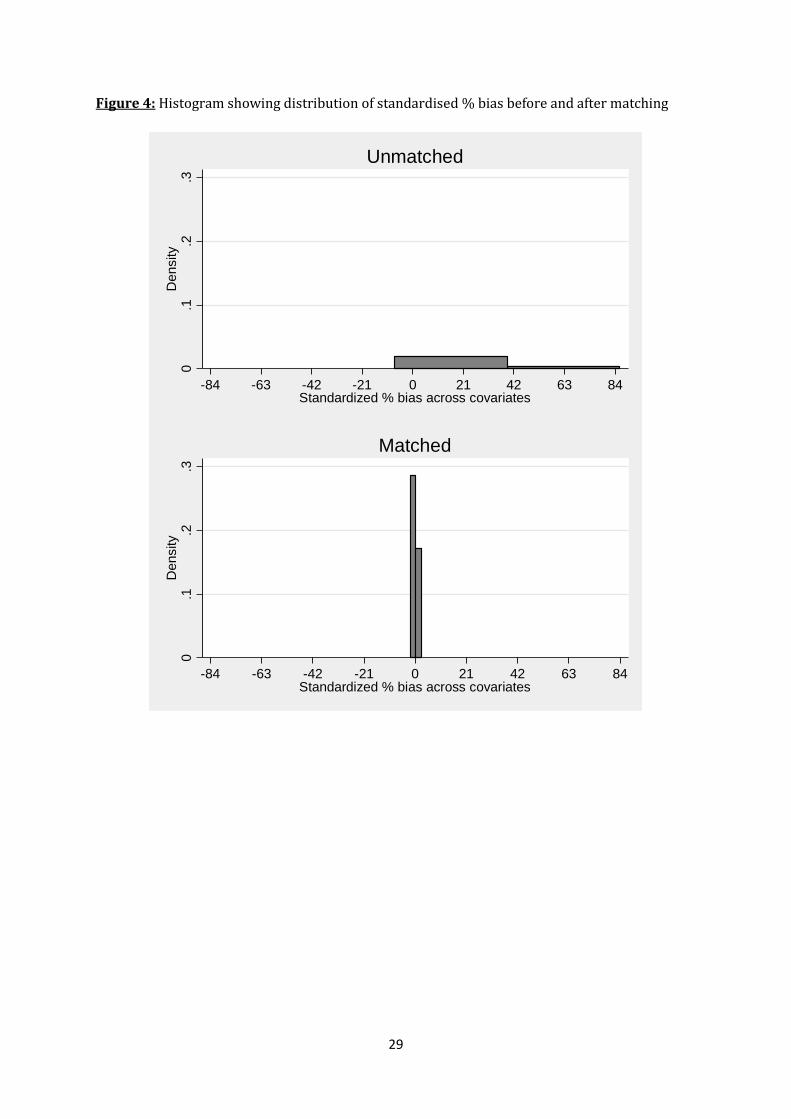
propensity score. Also Figure 3 shows little bias for each explanatory variable in the matched
samples relative to the raw (unmatched) sample, while Figure 4 shows the histogram of the
biases across all variables, again showing little bias (in %) for the matched samples.
Therefore, the quality of matching is appropriate to draw the conclusion that foreign
financing is a key determinant of higher exporting activity – a result which remains robust in
both parametric and non-parametric analysis.
3.2 Baseline Model
Following Martincus and Carballo (2008), the main results are based on the kernel
matching method with a bandwidth of 0.04. The main concept of this method is that the
control observations are assigned more weights if they are closer to the propensity score of a
treated observation and lower weights on more distant observations (Caliendo and Kopeinig,
2008). The dependent variable of firm-level export share is measured by the ratio of exports
to total sales (%) (Greenaway et al., 2010). We estimate the following baseline model:
𝐸𝐸𝐸𝐸𝐸𝐸𝐸𝐸𝐸𝐸𝐸𝐸/𝑆𝑆𝑆𝑆𝑆𝑆𝑆𝑆𝑆𝑆𝒾𝒾𝒾𝒾 = 𝒶𝒶0 + 𝒶𝒶1𝑇𝑇𝐸𝐸𝑆𝑆𝑆𝑆𝐸𝐸𝑖𝑖+𝒶𝒶2𝐹𝐹𝐸𝐸𝐹𝐹𝐹𝐹𝒾𝒾 + 𝑆𝑆3 𝑇𝑇𝐸𝐸𝑆𝑆𝑆𝑆𝐸𝐸𝑖𝑖 ∗ 𝐹𝐹𝐸𝐸𝐹𝐹𝐹𝐹𝒾𝒾 + 𝑆𝑆4𝒳𝒳𝒾𝒾𝒾𝒾−1 + 𝑆𝑆5𝑍𝑍𝒾𝒾𝒾𝒾 + ℯ𝒾𝒾𝒾𝒾 (1)
where 𝒾𝒾 = 1, 2, …., N refers to the cross-section of units (firms in this case) for time period 𝒾𝒾
= 1, 2, …., T. 𝑇𝑇𝐸𝐸𝑆𝑆𝑆𝑆𝐸𝐸𝑖𝑖 is a dummy which takes a value of one for the firms which have access
to external commercial borrowing (ECB) in the period of 1988-2014. 𝐹𝐹𝐸𝐸𝐹𝐹𝐹𝐹𝒾𝒾 is a time
dummy which takes a value of one for the policy period during 2000-2014, and zero
otherwise. The DD coefficient of 𝑇𝑇𝐸𝐸𝑆𝑆𝑆𝑆𝐸𝐸𝑗𝑗 ∗ 𝐹𝐹𝐸𝐸𝐹𝐹𝐹𝐹𝒾𝒾 provides the policy effect. The point
estimate measures the impact of the policy on the export share of firms with access to
external borrowing in comparison to the firms with access to only domestic borrowing. The
models are estimated with firm fixed effects to control for unobserved heterogeneity. In
addition, the models include time dummies to control for cyclical factors originating from the
business cycle. We also cluster standard errors at the firm level as the observations over time
11
might be correlated within firms. Finally, 𝒳𝒳 and Z are vectors which include other
explanatory variables at both firm and aggregate levels, respectively and ℯ𝒾𝒾𝒾𝒾 are the
disturbance terms. All time-varying firm-level variables are lagged by one period to reduce
possible simultaneity problems.
Vectors 𝒳𝒳 and Z include various factors from the literature which are found to influence
firm-level exports. Firms’ decision to export is based on a combination of sunk cost and firm-
level factors (Melitz, 2003). Exporting is associated with additional upfront expenditures that
make production for foreign markets more dependent on external financing. Sunk costs of
trade involve collecting information about the profitability of potential export markets, setting
up and maintaining foreign distribution networks, making market-specific investments in
capacity, product customization and regulatory compliance (Manova, 2013).
To begin with firm specific characteristics, Firm size, measured as real total assets, is an
important determinant of exports. Firms which are larger in size are able to cope well with
financial constraints and have greater access to external finance, which is necessary to
finance the sunk and fixed costs of exports (Cheung and Sengupta, 2013). Wages are
measured by the real wage bill. This variable controls for systematic differences between
firms in terms of human capital (Bellone et al., 2010). Total factor productivity (TFP) of
firms is included as the natural logarithm of TFP and is calculated using the Levinsohn and
Petrin’s (2003) methodology which is further developed by Petrin et al. (2004). TFP captures
the efficiency of the firms. Efficient firms are more likely to handle unfavourable movements
in exchange rates and output levels. Also, productivity of firms is one of the important
determinants of export market decision as more productive firms are less likely to exit the
market (Görg and Spaliara, 2013; Mallick and Yang, 2013). GDP growth is a proxy for the
overall economic development of a country (Manova, 2013). Finally, REER volatility refers
12
to the exchange rate uncertainty at the macro-level. Using monthly real exchange rate series2,
a GARCH (1,1) model is implemented and the monthly measures are annualised to match the
frequency of the panel data (Caglayan and Demir, 2014)3. Movements in exchange rate can
affect the profits of firms and hence, firms are more likely to reduce exports in order to
minimise the risk exposure in the absence of hedging incentives (Hooper and Kohlhagen,
1978; Kawai and Zilcha, 1986).
3.3 Access to grants and subsidies
In this sub-section we investigate the differential impact of government grants and
subsidies on firms’ export intensity. We explore whether firms which are recipients of
governments’ grants and subsidies4 within the treated group behave differently in terms of
their export market participation. We use a dummy ‘Grant_recipient’ which takes value one
for firms which have access to such grants and subsidies, and zero otherwise and then
estimate the following model:
𝐸𝐸𝐸𝐸𝐸𝐸𝐸𝐸𝐸𝐸𝐸𝐸/𝑆𝑆𝑆𝑆𝑆𝑆𝑆𝑆𝑆𝑆𝒾𝒾𝒾𝒾 = 𝒶𝒶0 + 𝒶𝒶1𝑇𝑇𝐸𝐸𝑆𝑆𝑆𝑆𝐸𝐸𝑖𝑖+𝒶𝒶2𝐹𝐹𝐸𝐸𝐹𝐹𝐹𝐹𝒾𝒾 + 𝑆𝑆3 𝐺𝐺𝐸𝐸𝑆𝑆𝐺𝐺𝐸𝐸_𝐸𝐸𝑆𝑆𝑟𝑟𝑟𝑟𝐸𝐸𝑟𝑟𝑆𝑆𝐺𝐺𝐸𝐸𝑖𝑖𝑖𝑖 + 𝑆𝑆4𝑇𝑇𝐸𝐸𝑆𝑆𝑆𝑆𝐸𝐸𝑖𝑖 ∗ 𝐹𝐹𝐸𝐸𝐹𝐹𝐹𝐹𝒾𝒾 ∗ + 𝑆𝑆5𝑇𝑇𝐸𝐸𝑆𝑆𝑆𝑆𝐸𝐸𝑖𝑖 ∗ 𝐹𝐹𝐸𝐸𝐹𝐹𝐹𝐹𝒾𝒾 ∗
𝐺𝐺𝐸𝐸𝑆𝑆𝐺𝐺𝐸𝐸_𝐸𝐸𝑆𝑆𝑟𝑟𝑟𝑟𝐸𝐸𝑟𝑟𝑆𝑆𝐺𝐺𝐸𝐸𝑖𝑖𝑖𝑖 + 𝑆𝑆6𝐹𝐹𝐸𝐸𝐹𝐹𝐹𝐹𝒾𝒾 ∗ 𝐺𝐺𝐸𝐸𝑆𝑆𝐺𝐺𝐸𝐸_𝐸𝐸𝑆𝑆𝑟𝑟𝑟𝑟𝐸𝐸𝑟𝑟𝑆𝑆𝐺𝐺𝐸𝐸𝑖𝑖𝑖𝑖 + 𝑆𝑆7𝑇𝑇𝐸𝐸𝑆𝑆𝑆𝑆𝐸𝐸𝑖𝑖 ∗ 𝐺𝐺𝐸𝐸𝑆𝑆𝐺𝐺𝐸𝐸_𝐸𝐸𝑆𝑆𝑟𝑟𝑟𝑟𝐸𝐸𝑟𝑟𝑆𝑆𝐺𝐺𝐸𝐸𝑖𝑖𝑖𝑖 + 𝑆𝑆8𝒳𝒳𝒾𝒾𝒾𝒾−1 + 𝑆𝑆9𝑍𝑍𝒾𝒾𝒾𝒾 + ℯ𝒾𝒾𝒾𝒾 (2)
where the main term is the triple interaction coefficient of 𝑇𝑇𝐸𝐸𝑆𝑆𝑆𝑆𝐸𝐸𝑗𝑗 ∗ 𝐹𝐹𝐸𝐸𝐹𝐹𝐹𝐹𝒾𝒾 ∗
𝐺𝐺𝐸𝐸𝑆𝑆𝐺𝐺𝐸𝐸_𝐸𝐸𝑆𝑆𝑟𝑟𝑟𝑟𝐸𝐸𝑟𝑟𝑆𝑆𝐺𝐺𝐸𝐸𝑖𝑖𝑖𝑖 which measures the impact of the policy on the export share of firms with
access to government incentives in addition to foreign external borrowing with respect to the
firms with access to only domestic borrowing. There is a considerable literature highlighting
2 Real exchange rates are more accurate and superior indicators of changes in competitiveness which are calculated after correcting for the movements in nominal exchange rates for inflation differentials. Effective exchange rate changes are not measured against one particular currency, but instead use an average index of a whole basket of currencies, each weighted according to the issuing countries' respective importance as a trade partner (UNCTAD, 2012). 3 This measure resembles the volatility clustering which is often found in high frequency financial series (Caglayan and Demir, 2014). 4 In our dataset grants and subsidies are defined as “any assistance received by a company from the government in cash or kind for its compliance with certain conditions in the past, or its agreement to comply with certain conditions in the future. Government grants do not include those forms which cannot be reasonably valued, and which cannot be distinguished from the normal trading transactions of the enterprise.”
13
the effectiveness of export subsidies in developing countries (Low, 1982; Arslan and Van
Wijnbergen, 1993; Moreira and Figueiredo dos Santos, 2001). However, the results from
these industry-level studies are conflicting and the overall verdict is negative. Studies on
firm-level analysis of export subsidies are scarce for developed countries and almost non-
existent for developing countries. Bernard and Jensen (2004) study the effect of export
subsidies on exports of US firms. They find an insignificant impact of subsidies on exports.
Recently, Görg et al. (2008) analysed a sample of 11,730 manufacturing firm-year
observations in Ireland over the period 1983–2002 and concluded that grants aimed at
increasing investment in technology, training, and physical capital, when large enough, are
generally effective in increasing total exports of already exporting firms.
Studies such as Görg and Strobl (2007) and Girma et al. (2007) provide evidence that
grants can be effective. Government grants which are directed towards technological
enhancement can help to improve innovation activity of firms and also overall productivity.
In this paper, we further argue that in addition to increased productivity and effectiveness of
firms, government grants and subsidies can also encourage firms with foreign financing to
remain in the exporting market as compared to firms without any government grants and
subsidies. The government of India introduces different incentives to boost exports from time
to time, when the country experiences decline in exports in the wake of sharp currency
appreciation, in the form of interest subsidy on loans or export subsidy on shipments.
Exporters can be given full or partial refund of any import duty, if they paid on imported
materials used in the manufacture of exported product.
3.4 Accounting for financial vulnerability
In this sub-section we investigate the impact of policy on export intensity of financially
constrained firms and firms those are affiliated with vulnerable industries with better access
to foreign financing. We examine if firms and industries facing different levels of volatility
14
within the treated group exhibit different sensitivities to their exporting shares after the
FEMA act was implemented as compared to control firms. We construct a Cons dummy and
interact it with DD coefficient of ‘𝑇𝑇𝐸𝐸𝑆𝑆𝑆𝑆𝐸𝐸𝑗𝑗 ∗ 𝐹𝐹𝐸𝐸𝐹𝐹𝐹𝐹𝒾𝒾’. Cons dummy takes value one for volatile
firms or industries if measures of volatility at firm- or industry-levels are above the 50th
percentile of the distribution for all firms in the sample period, and zero otherwise. The
following model is estimated:
𝐸𝐸𝐸𝐸𝐸𝐸𝐸𝐸𝐸𝐸𝐸𝐸/𝑆𝑆𝑆𝑆𝑆𝑆𝑆𝑆𝑆𝑆𝒾𝒾𝒾𝒾 = 𝒶𝒶0 + 𝒶𝒶1𝑇𝑇𝐸𝐸𝑆𝑆𝑆𝑆𝐸𝐸𝑖𝑖+𝒶𝒶2𝐹𝐹𝐸𝐸𝐹𝐹𝐹𝐹𝒾𝒾 + 𝑆𝑆3 𝐶𝐶𝐸𝐸𝐺𝐺𝑆𝑆𝑖𝑖𝑖𝑖 + 𝑆𝑆4𝑇𝑇𝐸𝐸𝑆𝑆𝑆𝑆𝐸𝐸𝑖𝑖 ∗ 𝐹𝐹𝐸𝐸𝐹𝐹𝐹𝐹𝒾𝒾 ∗ + 𝑆𝑆5𝑇𝑇𝐸𝐸𝑆𝑆𝑆𝑆𝐸𝐸𝑖𝑖 ∗ 𝐹𝐹𝐸𝐸𝐹𝐹𝐹𝐹𝒾𝒾 ∗
𝐶𝐶𝐸𝐸𝐺𝐺𝑆𝑆𝑖𝑖𝑖𝑖 + 𝑆𝑆6𝐹𝐹𝐸𝐸𝐹𝐹𝐹𝐹𝒾𝒾 ∗ 𝐶𝐶𝐸𝐸𝐺𝐺𝑆𝑆𝑖𝑖𝑖𝑖 + 𝑆𝑆7𝑇𝑇𝐸𝐸𝑆𝑆𝑆𝑆𝐸𝐸𝑖𝑖 ∗ 𝐶𝐶𝐸𝐸𝐺𝐺𝑆𝑆𝑖𝑖𝑖𝑖 + 𝑆𝑆8𝒳𝒳𝒾𝒾𝒾𝒾−1 + 𝑆𝑆9𝑍𝑍𝒾𝒾𝒾𝒾 + ℯ𝒾𝒾𝒾𝒾 (3)
where the main variable is the triple interaction coefficient of 𝑇𝑇𝐸𝐸𝑆𝑆𝑆𝑆𝐸𝐸𝑗𝑗 ∗ 𝐹𝐹𝐸𝐸𝐹𝐹𝐹𝐹𝒾𝒾 ∗ 𝐶𝐶𝐸𝐸𝐺𝐺𝑆𝑆𝑖𝑖𝑖𝑖 which
measures the impact of the policy on the export share of vulnerable firms or firms operating
in vulnerable industries with access to foreign external borrowing compared to the firms with
access to only domestic borrowing.
There is a large literature that establishes a link between firm-level output volatility and
export openness (Comin, 2000; Campbell et al., 2001; Comin and Mulani, 2006). In
particular, Buch et al. (2006) provided a theoretical model of trade openness and output
volatility, highlighting that exporting firms are exposed to domestic and foreign demand
shocks and the correlation between these demand shocks affects the exposure of firms which
in turn affects output volatility. According to Manova et al. (2015), credit constraints restrict
their product scope, number of trade partners and their trade volumes. They highlight that as
MNC subsidiaries are able to secure additional funding from foreign capital markets, they are
less credit constrained. As a result MNC firms have a comparative advantage over local firms
and are also able to perform better in financially vulnerable industries.
In this paper, we argue in similar terms that when financially constrained firms and firms
operating in vulnerable industries gain access to external borrowing, they are able to cover
15
the variable trade costs and expand their sales to foreign markets. Firm volatility is measured
using the squared residual of a regression of sales growth on its own lagged values and a set
of time fixed effects (Buch et al., 2009a)5. Industry volatility is measured using Braun (2005)
and are based on data for all listed US-based companies from Compustat’s annual industrial
files. External finance dependence is the share of capital expenditures not financed with cash
flows from operations and is averaged over 1988–2014 for the median firm in each industry.
Rajan and Zingales (1998) and Braun (2005) argue that this measure captures a large
technological component that is innate to the manufacturing process in a sector and are thus
good proxies for ranking industries in all countries. Firms or industries are less (more)
constrained if volatility at firm- or industry-levels is below (above) the 50th percentile of the
distribution for all firms in the sample period. We consider volatility as a measure of credit
constraints as firms or industries facing higher volatility are more risky, thus, they have
difficulty in obtaining external finance at lower costs (García-Vega et al., 2012). Credit
constraints distort the level of firm exports as firms lower their export quantities in order to
reduce the amount of external capital they need for variable costs (Manova, 2013). Thus,
volatility provides a source of variation that can be exploited to identify the impact of credit
frictions on firms’ exports.
4. Data and summary statistics
4.1 The dataset
We construct our dataset from profit and loss and balance sheet data assembled by Centre
for Monitoring Indian Economy (CMIE) in their Prowess database. CMIE is a private
research organisation in India which collects data and makes it available through Prowess.
5 These regressions help to avoid growth rates from autocorrelation dynamics and from macroeconomic development affecting all firms uniformly. Thus, this measure gives a ‘conditional’ idiosyncratic volatility of output growth.
16
The Prowess database covers large and medium-sized Indian firms with detailed information
on over 25,346 firms. The majority of the companies incorporated in the database are listed
on stock Exchanges6. In addition, data for the macroeconomic variables are drawn from the
World Bank database.
Following normal selection criteria, firm-years with missing values for export sales and
other control variables in the main models are excluded from the data. In addition,
observations in the 1% from upper and lower tails of the distribution of the financial variables
are excluded to control for outliers. Finally, the panel has an unbalanced structure with
80,996 observations and a matched sample of 50,779 observations for the period of 1988-
2014 from three broad industries such as non-finance companies, non-banking finance
companies and banking companies.
4.2 Summary statistics
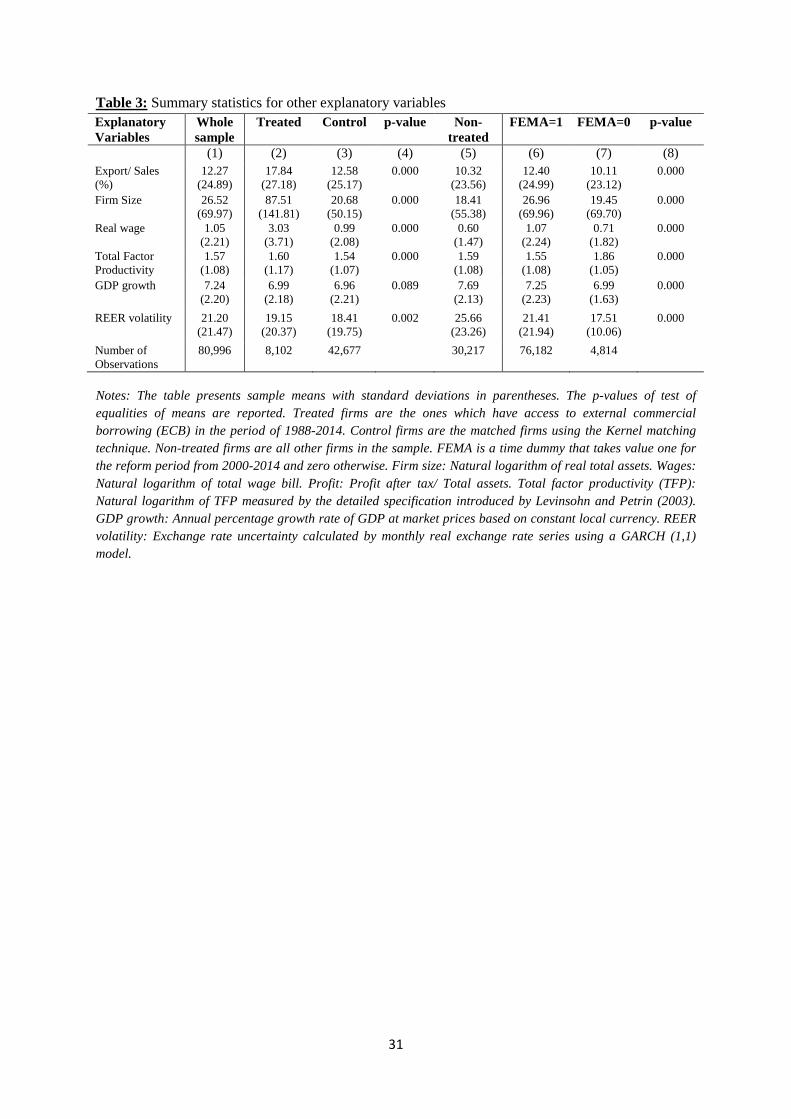
Table 3 provides the summary statistics for all the variables, distinguishing between
treated and control groups, as well as before and after the introduction of the FEMA policy
liberalisation on capital account transactions. We report values for the whole sample (column
1); treated, control and non-treated groups (columns 2, 3 and 5); after and before the policy
initiative (columns 6 and 7). We also report p-values for the test of equality of means
between treated and control groups (column 4) and before and after FEMA (column 8). We
begin by analysing the level of export share in the two groups across different time periods.
We find that the level of export share is much higher amongst the treated firms compared to
the control firms. Further, the export share has increased in the post-FEMA policy period or
after the policy was initiated. With respect to firm-level variables, treated firms are larger in
size, pay higher average wage, have more profits and greater productivity. Moving to
6 See www.cmie.com for more information on the Prowess database, which has been widely used in several studies such as Majumdar and Sen (2010) and Mallick and Yang (2013).
17
columns 6 and 7, there is a significant difference in the mean values of all variables before
and after the policy was introduced at the 1% level.
Taken together, three main points can be highlighted from the summary statistics. First,
the export share has increased after the introduction of the FEMA policy. Second, treated
firms enjoy a greater export share compared to control firms. Third, firms with access to
external borrowing (treated firms) are financially healthy and more productive compared to
firms with access to domestic credit only (control firms). The following sections provide
formal regression tests on the relationship between the policy initiative and firms’ export
share.
5. Empirical results
5.1 Baseline model
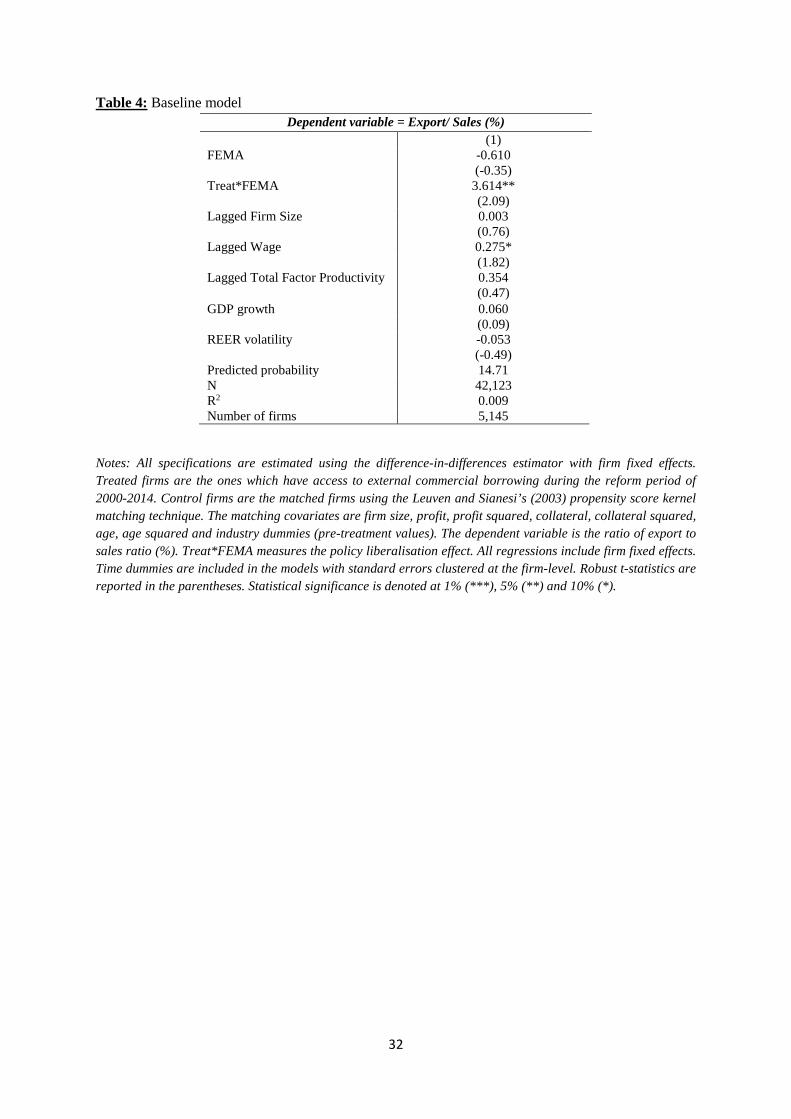
Table 4 provides the results of the baseline model using difference-in-differences with
firm fixed effects. The main variable of interest is Treat*Fema, which captures the impact of
the policy on the treated firms as compared to control firms. This variable shows a positive
and significant coefficient which means that after the introduction of the FEMA policy, firms
with access to ECB were able to expand their exporting intensity as compared to firms with
access to domestic borrowing only (control firms). We calculate the magnitude of this DD
coefficient in percentages by dividing the coefficient value (marginal effect) with the
predicted probability of the model. We find that the introduction of the policy increased the
firm-level exports within the treated group by 24.56%7. This finding suggests that firms
which have access to foreign borrowing are likely to face lower financial constraints, are less
subject to distortions and hence are able to expand further in terms of global sales. This
7 This is calculated as follows: dividing the coefficient of 3.614 with the predicted probability of this model (14.71) implies an increase of 24.56%.
18
finding is supported by the evidence shown in Manova et al. (2015) which argue that MNC
firms have better export performance than private domestic firms due to access to funding
from foreign capital markets. Further, real wage shows a positive and significant effect on
export share which implies that firms which are intensive in human capital are more likely to
go abroad (Bellone et al., 2010). Finally, all other control variables show an insignificant
effect on export share.
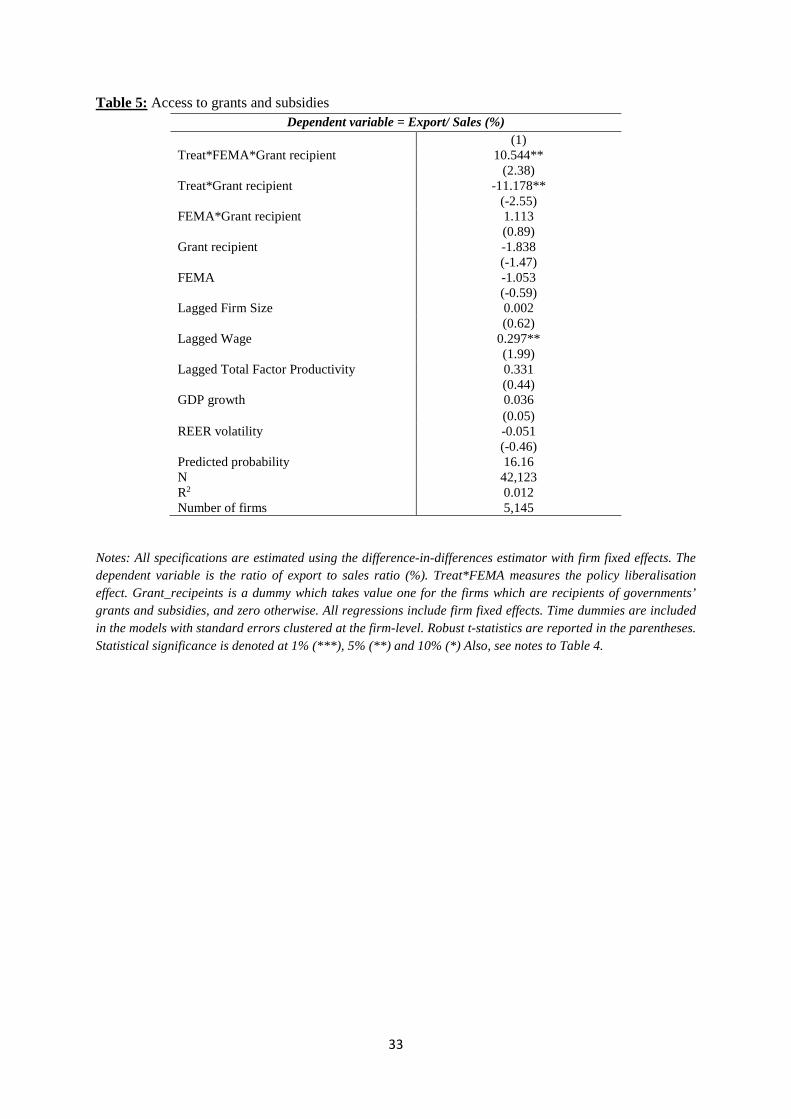
5.2 Access to grants and subsidies
In this section, we focus on the impact of access to foreign financing on the level of
exports for the recipients of grants and subsidies. The results are reported in Table 5. The
estimation results of the main variable of interest ‘𝑇𝑇𝐸𝐸𝑆𝑆𝑆𝑆𝐸𝐸𝑗𝑗 ∗ 𝐹𝐹𝐸𝐸𝐹𝐹𝐹𝐹𝒾𝒾 ∗ 𝐺𝐺𝐸𝐸𝑆𝑆𝐺𝐺𝐸𝐸_𝐸𝐸𝑆𝑆𝑟𝑟𝑟𝑟𝐸𝐸𝑟𝑟𝑆𝑆𝐺𝐺𝐸𝐸𝑖𝑖𝑖𝑖’ show
that firms which receive grants and subsidies within the treated group (i.e they have access to
foreign financing) are able to significantly increase their export share compared to similar
firms in the control group8. In economic terms, after the introduction of the policy, firms
which received grants in the treated group were able to increase their export share by 65.25%.
This is a novel finding in the context of the Indian economy which highlights the importance
of export promotion policies. These results are in line with Görg et al. (2008) which show
that if grants received from governments are large enough then they can encourage already
exporting firms to compete more effectively in the international market. Further, all other
control variables behave as conjectured.
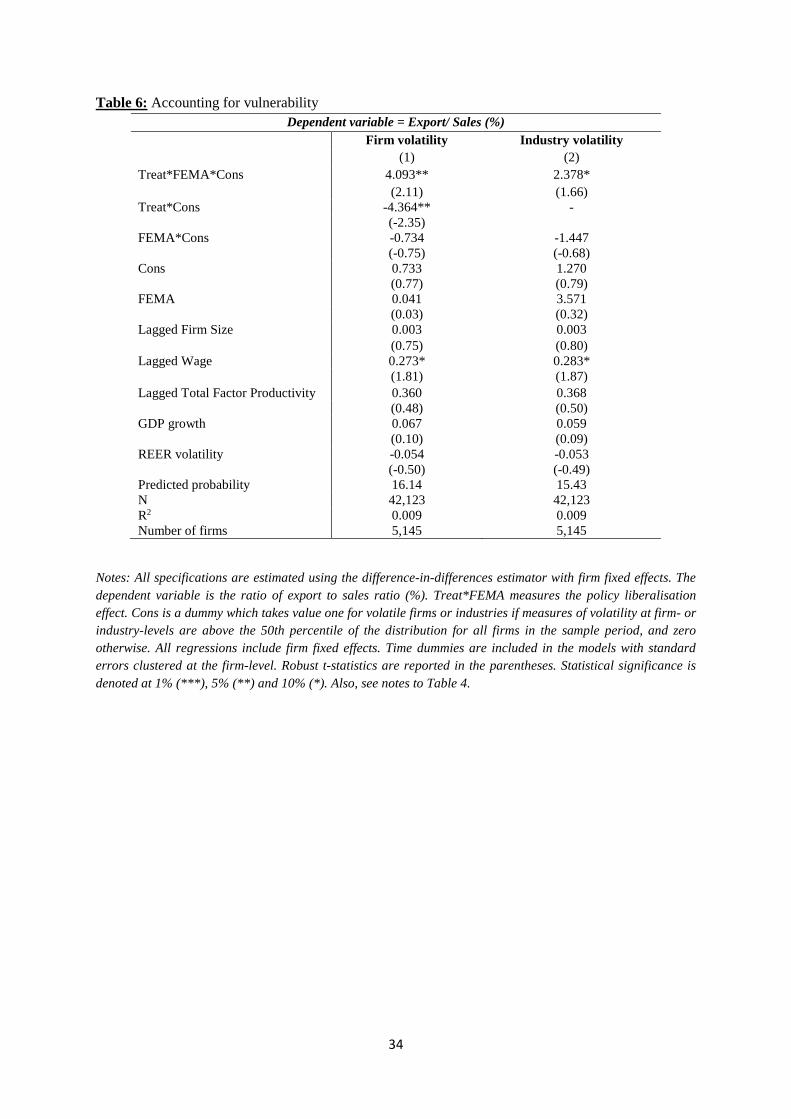
5.3 Accounting for financial vulnerability
In this section, we take into account financial vulnerability at the firm and industry level.
The results are reported in Table 6. Column 1 reports results for firm-level volatility,
followed by column 2 for industry-level volatility. The estimation results in column 1 show
8 The interaction term of Treat*FEMA are dropped from these regressions due to high correlation with the main variable Treat*FEMA*Grant_recipeint.
19
that when firms facing higher volatility receive foreign financing, they are able to expand
their exports share as compared to similar firms within the control group. Further, estimation
results in column 2 indicate that firms operating in more risky (or highly volatile) industries
perform better in terms of exports share when they gain access to external finance, compared
to control firms. These results are in line with earlier studies which show that firms which
have access to external financing benefit more compared to other firms. Manova et al. (2015)
highlight that foreign affiliated firms are able to outperform the domestic firms specifically
when those domestic firms face higher trading costs. They also show that firms with foreign
affiliations have better export performance in financially vulnerable industries as they have
access to foreign capital markets. Thus, availability of outside capital plays an important role
when markets face higher trade costs and exporters require more external finance to meet
these costs.
In economic terms, we find that higher volatile firms with greater access to foreign
financing are able to increase their export share by 25.36% after the introduction of FEMA.
Further, when firms operating in more volatile industries gain access to external financing,
they are able to expand their exporting intensity by 15.41%. Further, all other control
variables behave as conjectured.
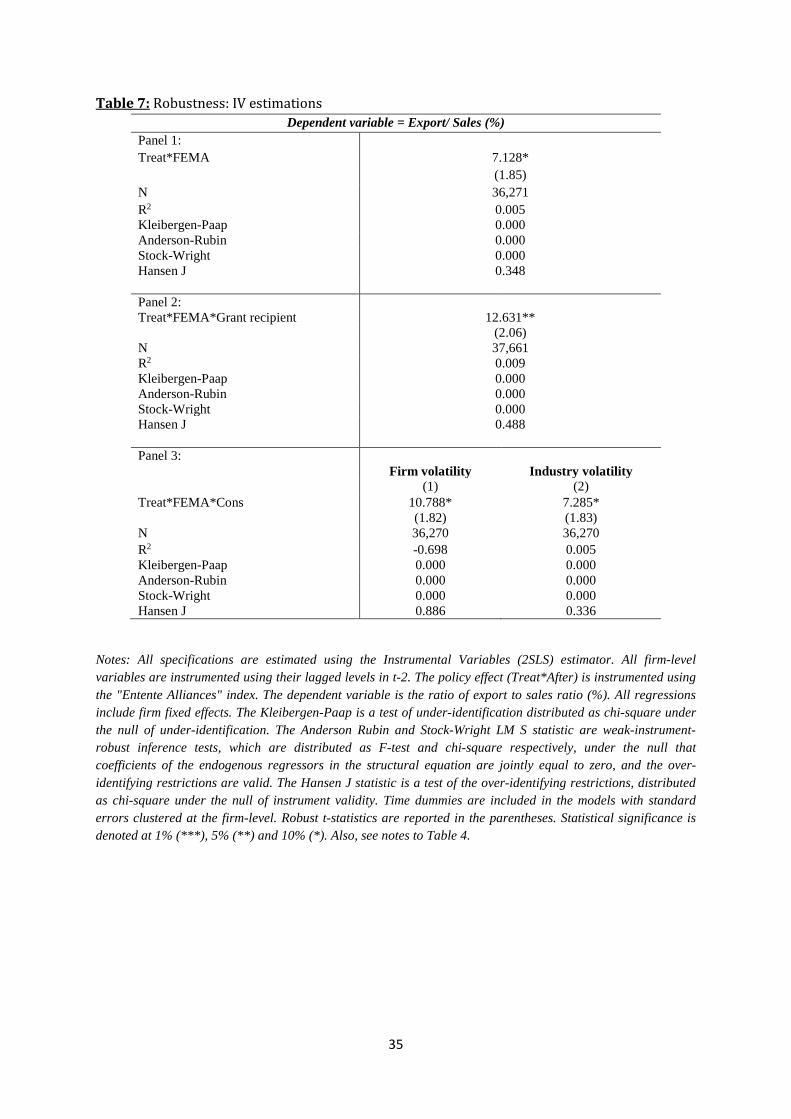
6. Robustness tests
6.1 Endogeneity concerns
This section considers an instrumental variable method (two-stage least squares 2SLS) to
deal with the potential endogeneity of our explanatory variables and the policy initiative. The
identification of the policy initiative requires an exogenous variable which is correlated with
the policy of FEMA but does not directly impact firms’ export share. Following Bose et al.
(2017), as plausible exogenous instrument for the policy initiative, the “Entente Alliances”
20
index is used. This index takes a value of 0 or 1 whenever two countries are common
members of, or signatories to, an entente or alliance in any given time period. The motivation
is that a country is more likely to adopt reform policies when political allies have already
successfully implemented similar policies (Tressel and Detragiache, 2008)9.
In addition, we also assumed that all firm-level variables used in the model are potentially
endogenous and they are instrumented using their own values lagged twice. The validity and
relevance of the instruments for both the policy and other control variables are verified using
a number a diagnostic tests. The results for these tests are reported at the bottom of the
Table10.
Table 7 reports the results of the 2SLS model. The results validate a significant and
positive impact of the FEMA policy on the export share of firms. Further, the results show
firms with access to grants and subsidies are able to reap the benefits of foreign financing
more on their export share compared to firms with only domestic financing. Finally, the
results show more volatile firms and firms operating in volatile industries benefit more from
foreign financing in terms of their export share. Overall, the diagnostic tests do not indicate
any problems regarding the choice and the relevance of our instruments. In sum, we conclude
that our findings are robust to endogenous regressors.
6.2 Alternative matching estimation
In this section we use a different matching technique namely radius matching. One could
argue that the matching is poor as the closest neighbour may be too far. To deal with these
concerns one can impose a propensity score caliper requirement. The caliper draws the
maximum distance between the matched firms in treated and control groups that is closest in
9 The index is from Rajan and Subramanian (2005) and the original source is the Correlates of War Database. 10 In addition to the reported statistics, we also employed the Anderson Rubin chi-square test and obtained identical p-values as with the Anderson Rubin F-test.
21
terms of the propensity score. Following Mallick and Yang (2013), caliper is done with
radius matching to avoid bad matching. Radius matching uses not only the nearest neighbour
within each caliper but all the comparison members within the caliper, and it allows for usage
of extra (fewer) units when good matches are not available (Caliendo and Kopeinig, 2008).
Matching is done on the pre-treatment values of firm size, profit, profit squared, collateral,
collateral squared, age, age squared and industry dummies, with caliper of 0.04 (Martincus
and Carballo, 2008).
The results are given in Table 8 and are in line with the main results. We find that the
FEMA policy had a positive impact on the export share of firms with access to foreign
borrowing as compared to the firms with domestic financing. Next, we find that firms which
are recipients of grants and subsidies within the treated group are able to increase their export
share after the policy initiative. Finally, we find that when financially vulnerable firms and
firms within vulnerable industries achieve access to external financing, they benefit by
increasing their participation in the exporting market. Thus, we confirm that our results are
robust to an alternative matching technique, which also indicates the validity of the treated
and control groups in our main models.
7. Conclusion
Using a non-parametric matching analysis, this paper has shown that firms with foreign
financing tend to have higher exporting activity relative to firms with only domestic sources
of financing. There has been limited focus on this dimension in the literature. It is likely that
firms with foreign financing tend to have better production and innovation networks with
overseas market participants, which explains why these firms do better in their exporting
activity.
22
The paper therefore extended this literature on the relationship between exporting and the
external financing access in the context of a large emerging market economy using a dataset
comprising 11,612 firms from India over a longer time period. The results show that firms
which had access to foreign credit after the introduction of FEMA were able to increase their
export share. We also find that this relationship is more sensitive for firms that receive
government grants and subsidies. Further, we explore that financially vulnerable firms are
able to benefit more from foreign financing compared to less vulnerable firms during the
FEMA regime. The policy paradigm shift in the early 1990s from a controlled regime of
import substitution, and the subsequent gradual liberalisation of capital account transactions
in the early 2000s towards private debt flows have indeed been effective in enabling access to
the much-needed overseas financing in order to make Indian exporters gain competitive
advantage in increasing their export intensity.
23
References
Amiti, M. & Konings, J., 2007. Trade liberalization, intermediate inputs, and productivity: Evidence from Indonesia, American Economic Review 97(5), 1611-1638.
Arslan, I., Van Wijnbergen, S., 1993. Export Incentives, Exchange Rate Policy and Export Growth in Turkey, Review of Economics and Statistics 75(1), pp. 128–33.
Bandyopadhyay, S., Lahiri, S., Younas, J., 2015. Financing growth through foreign aid and private foreign loans: Nonlinearities and complementarities, Journal of International Money and Finance, 56, pp. 75-96.
Bellone, F., Musso, P., Nesta, L., Schiavo, S., 2010. Financial Constraints and Firm Export Behaviour, World Economy 33(3), pp. 347-373.
Berman, N., Héricourt, J., 2010. Financial Factors and the Margins of Trade: Evidence from Cross-Country Firm-Level Data, Journal of Development Economics 93(2), pp. 206–217.
Bernard, A., Jensen, J., 1999. Exceptional Exporter Performance: Cause, Effect, or Both?, Journal of International Economics 47(1), pp. 1-25.
Bernard, A. Jensen, B., 2004. Why Some Firms Export, Review of Economics and Statistics 86(2), pp. 561–9.
Bose, U., MacDonald, R., Tsoukas, S., 2017. Policy Initiatives and Firms' Access to External Finance: Evidence from a Panel of Emerging Asian Economies, Forthcoming in Journal of Corporate Finance.
Braun, M., 2005. Financial Contractibility and Asset Hardness, mimeo: University of California - Los Angeles. Avilable at: http://dx.doi.org/10.2139/ssrn.2522890.
Buch, C. M., Döpke, J., Stahn, K., 2009. Great Moderation at the Firm Level? Unconditional Vs. Conditional Output Volatility, The B.E. Journal of Economic Analysis & Policy 9(1), pp. 1935-1682.
Buch, C. M., Döpke, J., Strotmann, H., 2006. Does Export Openness Increase Firm-level Volatility?, Deutsche Bundesbank Discussion Paper 40/2006.
Buch, C. M., Döpke, J., Strotmann, H., 2009a. Does Export Openness Increase Firm-level Output Volatility, The World Economy 32(4), pp. 531-551.
Caggese, A., Cuñat, V., 2013. Financing constraints, firm dynamics, export decisions, and aggregate productivity, Review of Economic Dynamics, 16 (1): 177-193.
Caglayan, M., Demir, F., 2014. Firm Productivity, Exchange Rate Movements, Sources of Finance, and Export Orientation, World Development 54, pp. 204–219.
Caliendo, M., Kopeinig, S., 2008. Some Practical Guidance for the Implementation of Propensity Score Matching, Journal of Economic Surveys 22, pp. 31–72.
Campbell, J. Y., Lettau, M., Malkiel, B., Xu, Y., 2001. Have Individual Stocks Become More Volatile? An Empirical Exploration of Idiosyncratic Risk, Journal of Finance 56(l), pp. l-43.
24
Castagnino, T., D’Amato, L., Sangiácomo, M., 2013. How Do Firms in Argentina Get Financing to Export? ECB Working Paper Series No 1601, November.
Cheung, Y-W., Sengupta, R., 2013. Impact of Exchange Rate Movements on Exports: An analysis of Indian Non-financial Sector Firms, Journal of International Money and Finance 39, pp. 231–245.
Comin, D., 2000. An Uncertainty-Driven Theory of the Productivity Slowdown, Harvard University, unpublished thesis.
Comin, D., Mulani, S., 2006. Diverging Trends in Macro and Micro Volatility: Facts, Review of Economics and Statistics 88(2), pp. 374-383.
Comin, D., Philippon, T., 2005. The Rise in Firm-Level Volatility: Causes and Consequences, NBER Working Paper 11388.
Crespi, G., Criscuolo, C., Haskel, J., 2008. Productivity, Exporting and the Learning by-Exporting Hypothesis: Direct Evidence from UK Firms’, Canadian Journal of Economics 41 (2), pp. 619–38.
Davis, S., Haltiwanger, J., Jarmin, R., Miranda, J., 2006. Volatility and Dispersion in Business Growth Rates: Publicly Traded Versus Privately Held Firms, NBER Working Paper 12354.
Demirgüç-Kunt, A., Maksimovic, V., 1998. Law, Finance, and Firm Growth, Journal of
Finance 53 (6), pp. 2107-2137.
Eck, K., Engemann, M., Schnitzer, M., 2015. How trade credits foster exporting, Review of World Economics, 151 (1): 73-101.
Fazzari, S., Hubbard, G., Petersen, B., 1988. Finance Constraints and Corporate Investment, Brookings Papers on Economic Activity 1, pp. 141–195.
Garcia-Vega, M., Guariglia, A., Spaliara, M.-E., 2012. Volatility, Financial Constraints, and Trade, International Review of Economics and Finance 21(1), pp. 57–76.
Girma, S., Görg, H., Strobl, E., 2007. The Effect of Government Grants on Plant Level Productivity, Economics Letters 94(3), pp. 439–444.
Goldberg, P., Khandelwal, A., Pavcnik, N. & Topalova, P., 2009. Trade liberalization and new imported inputs, American Economic Review 99(2), 494-500.
Görg, H., Henry, M., Strobl, E., 2008. Grant Support and Exporting Activity, Review of Economics and Statistics 90(1), pp.168-174.
Görg, H., Spaliara, M-E., 2013. Export Market Exit, Financial Pressure and the Crisis, CESifo Working Paper Series No. 4363.
Görg, H., Strobl, E., 2007. The Effect of R&D Subsidies on Private R&D, Economica 74(294), pp. 215-234.
Greenaway, D., Kneller, R., 2004. Exporting and Productivity in the United Kingdom, Oxford Review of Economic Policy 20(3), pp. 358–71.
25
Greenaway, D., Kneller, R., Zhang, X., 2010. Exchange Rate Uncertainty and Export Decisions in the UK, Journal of Economic Integration 25(4), pp. 734-753.
Heckman, J., Ichimura, H., Todd, P., 1997. Matching as an Econometric Evaluation Estimator: Evidence from Evaluating a Job Training Programme, Review of Economic Studies 64 (4), pp. 605–654.
Heckman, J., Ichimura, H., Todd, P., 1988. Matching as an Econometric Evaluation Estimator, Review of Economic Studies 65 (2), pp. 261–294.
Hooper, P., Kohlhagen, S., 1978. The Effect of Exchange Rate Uncertainty on the Prices and Volumes of International Trade, Journal of International Economics 8, pp. 483–511.
Jinjarak, Y., Wignaraja, G., 2016. An Empirical Assessment of the Export-Financial Constraint Relationship: How Different are Small and Medium Enterprises? World Development, 79: 152-163.
Kawai, M., Zilcha, I., 1986. International Trade with Forward-futures Markets under Exchange Rate and Price Uncertainty, Journal of International Economics 20(1), pp. 83–98.
Leuven, E., Sianesi, B., 2003. Psmatch2: Stata Module to Perform Full Mahalanobis and Propensity Score Matching, Common Support Graphing, and Covariate Imbalance Testing, Statistical Software Components.
Levinsohn, J., Petrin, A., 2003. Estimating Production Functions using Inputs to Control for Unobservables, Review of Economic Studies 70, pp. 317–342.
Low, P., 1982. Export Subsidies and Trade Policy: The Experience of Kenya, World Development 10(4), pp. 293–304.
Majumdar, S., Sen, K., 2010. Corporate Borrowing and Profitability in India, Managerial and Decision Economics 31, pp. 33–45.
Mallick, S., Yang, Y. 2011. Sources of Financing, Profitability and Productivity: First Evidence from Matched Firms, Financial Markets, Institutions and Instruments, 20(5), pp. 221–252.
Mallick, S., Yang, Y., 2013. Productivity Performance of Export Market Entry and Exit: Evidence from Indian Firms, Review of International Economics 21(4), pp. 809–824.
Manova, K., 2013. Credit Constraints, Heterogeneous Firms, and International Trade, Review of Economic Studies 80, pp. 711–744.
Manova, K., Wei, S-J., Zhang, Z., 2015. Firm Exports and Multinational Activity under Credit Constraints, Review of Economics and Statistics 97(3), pp. 574-588.
Martincus, C. V., Carballo, J., 2008. Is Export Promotion Effective in Developing Countries? Firm-Level Evidence on the Intensive and the Extensive Margins of Exports, Journal of International Economics 76, pp. 89–106.
Melitz, M., 2003. The Impact of Trade on Intra-Industry Reallocations and Aggregate Industry Productivity, Econometrica 71, pp. 1695-725.

26
Moreira, S. V., Figueiredo dos Santos, A., 2001. Políticas Públicas de Exportção: o caso do PROEX, Texto para Discussão No. 836, IPEA.
Muûls, M., 2008. Exporters and Credit Constraints: A Firm Level Approach, National Bank of Belgium Working Paper Research No. 139.
Patnaik, I., Shah, A., Singh, N., 2015. Foreign Currency Borrowing by Indian Firms: Towards a New Policy Framework, IGC Working Paper, September.
Paravisini, D., Rappoport, V., Schnabl, P., Wolfenzon, D., 2015. Dissecting the Effect of Credit Supply on Trade: Evidence from Matched Credit-Export Data, Review of Economic Studies 82, pp. 333–359.
Petrin, A., Poi, B., Levinsohn, J., 2004. Production Function Estimation in Stata using Inputs to Control for Unobservables, The Stata Journal 4, pp. 113–23.
Rajan, R., Subramanian, A., 2005. Aid and Growth: What Does Cross-Country Evidence Really Show?, NBER Working Paper No. 11657.
Rajan, R., Zingales, L., 1998. Financial Dependence and Growth, American Economic Review 88(3), pp. 559-586. Rahaman, M., 2011. Access to Financing and Firm Growth, Journal of Banking and Finance 35(3), pp. 709-723.
Rosenbaum, P., Rubin, D., 1983. The Central Role of the Propensity Score in Observational Studies for Causal Effects, Biometrika 70, pp. 41–55.
Topalova, P. & Khandelwal, A., 2011. Trade liberalization and firm productivity: The case of India, Review of Economics and Statistics 93(3), 995-1009.
Tressel, T., Detragiache, E., 2008. Do Financial Sector Reforms Lead to Financial Development? Evidence from a New Dataset, IMF Working Paper WP/08/265.
Yang, Y., Mallick, S., 2010. Export Premium, Self-selection and Learning-by-Exporting: Evidence from Chinese Matched Firms, The World Economy 33, pp. 1218–1240.
Yang, Y., Mallick, S., 2014. Explaining cross-country differences in exporting performance: The Role of Country-Level Macroeconomic Environment, International Business Review 23(1), pp. 246–259.
Yasar, M., Nelson, C. H., Rejesus, R. M., 2006. Productivity and Exporting Status of Manufacturing Firms: Evidence from Quantile Regression, Review of World Economics ⁄Weltwirtschaftliches Archiv 142(4), pp. 675–94.
27
Figures
Figure 1:
(a) Share of exports (%) for the period of 1988-2014
(b) Export share (%) of treated and control firms
46
810
1214
Expo
rts/S
ales
(%)
1988 1992 1996 2000 2004 2008 2012Year
05
1015
20Ex
ports
/Sal
es (%
)
1988 1992 1996 2000 2004 2008 2012Year
Treated group Control group
28
Figure 2: The propensity score histogram of matched firms
Notes: Matching method used is kernel. `Non-treated' and `Treated' are firms in the control group and treatment group, respectively. Exporters with foreign financing are in the treatment group, while exporting firms with domestic financing are in the control group.
Figure 3: Dot chart showing standardised % bias for each covariate before and after matching
0 .2 .4 .6 .8Propensity Score
Untreated Treated
0 20 40 60 80Standardized % bias across covariates
Profit sqaured
Collateral squared
Industry dummies
Collateral
Age squared
Age
Profit
Firm size
UnmatchedMatched
29
Figure 4: Histogram showing distribution of standardised % bias before and after matching
0.1
.2.3
Den
sity
-84 -63 -42 -21 0 21 42 63 84Standardized % bias across covariates
Unmatched0
.1.2
.3D
ensi
ty
-84 -63 -42 -21 0 21 42 63 84Standardized % bias across covariates
Matched
30
Tables
Table 1: Exporters’ Foreign financing versus Domestic Financing Unmatched
Difference ATT Difference
T-statistic (ATT)
N(treated) N(control)
Kernel matching 5.254 3.706 10.57 8,102 42,677 Radius matching 5.254 3.774 10.79 8,102 42,677 One nearest neighbor matching
5.254 3.774 10.79 8,102 42,677
Two nearest neighbor matching
5.254 3.774 10.79 8,102 42,677
Three nearest neighbor matching
5.254 3.774 10.79 8,102 42,677
Four nearest neighbor matching
5.254 3.774 10.79 8,102 42,677
Five nearest neighbor matching
5.254 3.774 10.79 8,102 42,677
Notes: The results are based on three different matching methods, including kernel matching, radius matching and nearest neighbors matching. `ATT' refers to the average treatment effect for the treated in terms of outcome variables, namely exports to sales ratio. `t-stat (ATT)' is the t-ratios of the average treatment effect. `Treated' and `Control' are the number of firms in the treated (exporters with foreign financing) group and matched control (exporters with domestic sources of financing) group, respectively.
Table 2: Balancing properties of matched firms Mean T-test Variable Treated Control t p>t Profit 0.033 0.033 -0.75 0.452 Profit squared 0.006 0.006 -1.01 0.314 Collateral 15.731 15.742 -0.09 0.927 Collateral squared 303.01 303.66 -0.15 0.883 Age 38.405 37.963 1.60 0.110 Age squared 1787 1745.7 1.49 0.137 Size 2.636 2.599 1.51 0.132 Industry dummies 24.798 25.038 -1.20 0.232
Notes: Matching method: kernel `t-test' is the t-test to the equality of given firm characteristics between treated (exporters with foreign borrowing) and control (exporters with domestic borrowing only) firms.
31
Table 3: Summary statistics for other explanatory variables Explanatory Variables
Whole sample
Treated Control p-value Non-treated
FEMA=1 FEMA=0 p-value
(1) (2) (3) (4) (5) (6) (7) (8) Export/ Sales (%)
12.27 (24.89)
17.84 (27.18)
12.58 (25.17)
0.000 10.32 (23.56)
12.40 (24.99)
10.11 (23.12)
0.000
Firm Size 26.52 (69.97)
87.51 (141.81)
20.68 (50.15)
0.000 18.41 (55.38)
26.96 (69.96)
19.45 (69.70)
0.000
Real wage 1.05 (2.21)
3.03 (3.71)
0.99 (2.08)
0.000 0.60 (1.47)
1.07 (2.24)
0.71 (1.82)
0.000
Total Factor Productivity
1.57 (1.08)
1.60 (1.17)
1.54 (1.07)
0.000 1.59 (1.08)
1.55 (1.08)
1.86 (1.05)
0.000
GDP growth 7.24 (2.20)
6.99 (2.18)
6.96 (2.21)
0.089 7.69 (2.13)
7.25 (2.23)
6.99 (1.63)
0.000
REER volatility 21.20 (21.47)
19.15 (20.37)
18.41 (19.75)
0.002 25.66 (23.26)
21.41 (21.94)
17.51 (10.06)
0.000
Number of Observations
80,996 8,102 42,677 30,217 76,182 4,814
Notes: The table presents sample means with standard deviations in parentheses. The p-values of test of equalities of means are reported. Treated firms are the ones which have access to external commercial borrowing (ECB) in the period of 1988-2014. Control firms are the matched firms using the Kernel matching technique. Non-treated firms are all other firms in the sample. FEMA is a time dummy that takes value one for the reform period from 2000-2014 and zero otherwise. Firm size: Natural logarithm of real total assets. Wages: Natural logarithm of total wage bill. Profit: Profit after tax/ Total assets. Total factor productivity (TFP): Natural logarithm of TFP measured by the detailed specification introduced by Levinsohn and Petrin (2003). GDP growth: Annual percentage growth rate of GDP at market prices based on constant local currency. REER volatility: Exchange rate uncertainty calculated by monthly real exchange rate series using a GARCH (1,1) model.
32
Table 4: Baseline model Dependent variable = Export/ Sales (%)
(1) FEMA -0.610
(-0.35) Treat*FEMA 3.614** (2.09) Lagged Firm Size 0.003 (0.76) Lagged Wage 0.275* (1.82) Lagged Total Factor Productivity 0.354 (0.47) GDP growth 0.060 (0.09) REER volatility -0.053 (-0.49) Predicted probability 14.71 N 42,123 R2 0.009 Number of firms 5,145
Notes: All specifications are estimated using the difference-in-differences estimator with firm fixed effects. Treated firms are the ones which have access to external commercial borrowing during the reform period of 2000-2014. Control firms are the matched firms using the Leuven and Sianesi’s (2003) propensity score kernel matching technique. The matching covariates are firm size, profit, profit squared, collateral, collateral squared, age, age squared and industry dummies (pre-treatment values). The dependent variable is the ratio of export to sales ratio (%). Treat*FEMA measures the policy liberalisation effect. All regressions include firm fixed effects. Time dummies are included in the models with standard errors clustered at the firm-level. Robust t-statistics are reported in the parentheses. Statistical significance is denoted at 1% (***), 5% (**) and 10% (*).
33
Table 5: Access to grants and subsidies Dependent variable = Export/ Sales (%)
(1) Treat*FEMA*Grant recipient 10.544** (2.38) Treat*Grant recipient -11.178** (-2.55) FEMA*Grant recipient 1.113 (0.89) Grant recipient -1.838 (-1.47) FEMA -1.053 (-0.59) Lagged Firm Size 0.002 (0.62) Lagged Wage 0.297** (1.99) Lagged Total Factor Productivity 0.331 (0.44) GDP growth 0.036 (0.05) REER volatility -0.051 (-0.46) Predicted probability 16.16 N 42,123 R2 0.012 Number of firms 5,145
Notes: All specifications are estimated using the difference-in-differences estimator with firm fixed effects. The dependent variable is the ratio of export to sales ratio (%). Treat*FEMA measures the policy liberalisation effect. Grant_recipeints is a dummy which takes value one for the firms which are recipients of governments’ grants and subsidies, and zero otherwise. All regressions include firm fixed effects. Time dummies are included in the models with standard errors clustered at the firm-level. Robust t-statistics are reported in the parentheses. Statistical significance is denoted at 1% (***), 5% (**) and 10% (*) Also, see notes to Table 4.
34
Table 6: Accounting for vulnerability Dependent variable = Export/ Sales (%)
Firm volatility Industry volatility (1) (2) Treat*FEMA*Cons 4.093** 2.378* (2.11) (1.66) Treat*Cons -4.364** - (-2.35) FEMA*Cons -0.734 -1.447 (-0.75) (-0.68) Cons 0.733 1.270 (0.77) (0.79) FEMA 0.041 3.571 (0.03) (0.32) Lagged Firm Size 0.003 0.003 (0.75) (0.80) Lagged Wage 0.273* 0.283* (1.81) (1.87) Lagged Total Factor Productivity 0.360 0.368 (0.48) (0.50) GDP growth 0.067 0.059 (0.10) (0.09) REER volatility -0.054 -0.053 (-0.50) (-0.49) Predicted probability 16.14 15.43 N 42,123 42,123 R2 0.009 0.009 Number of firms 5,145 5,145
Notes: All specifications are estimated using the difference-in-differences estimator with firm fixed effects. The dependent variable is the ratio of export to sales ratio (%). Treat*FEMA measures the policy liberalisation effect. Cons is a dummy which takes value one for volatile firms or industries if measures of volatility at firm- or industry-levels are above the 50th percentile of the distribution for all firms in the sample period, and zero otherwise. All regressions include firm fixed effects. Time dummies are included in the models with standard errors clustered at the firm-level. Robust t-statistics are reported in the parentheses. Statistical significance is denoted at 1% (***), 5% (**) and 10% (*). Also, see notes to Table 4.
35
Table 7: Robustness: IV estimations Dependent variable = Export/ Sales (%)
Panel 1: Treat*FEMA 7.128* (1.85) N 36,271 R2 0.005 Kleibergen-Paap 0.000 Anderson-Rubin 0.000 Stock-Wright 0.000 Hansen J 0.348 Panel 2: Treat*FEMA*Grant recipient 12.631** (2.06) N 37,661 R2 0.009 Kleibergen-Paap 0.000 Anderson-Rubin 0.000 Stock-Wright 0.000 Hansen J 0.488 Panel 3: Firm volatility Industry volatility (1) (2) Treat*FEMA*Cons 10.788* 7.285* (1.82) (1.83) N 36,270 36,270 R2 -0.698 0.005 Kleibergen-Paap 0.000 0.000 Anderson-Rubin 0.000 0.000 Stock-Wright 0.000 0.000 Hansen J 0.886 0.336
Notes: All specifications are estimated using the Instrumental Variables (2SLS) estimator. All firm-level variables are instrumented using their lagged levels in t-2. The policy effect (Treat*After) is instrumented using the "Entente Alliances" index. The dependent variable is the ratio of export to sales ratio (%). All regressions include firm fixed effects. The Kleibergen-Paap is a test of under-identification distributed as chi-square under the null of under-identification. The Anderson Rubin and Stock-Wright LM S statistic are weak-instrument-robust inference tests, which are distributed as F-test and chi-square respectively, under the null that coefficients of the endogenous regressors in the structural equation are jointly equal to zero, and the over-identifying restrictions are valid. The Hansen J statistic is a test of the over-identifying restrictions, distributed as chi-square under the null of instrument validity. Time dummies are included in the models with standard errors clustered at the firm-level. Robust t-statistics are reported in the parentheses. Statistical significance is denoted at 1% (***), 5% (**) and 10% (*). Also, see notes to Table 4.
36
Table 8: Robustness: Alternative matching techniques Dependent variable = Export/ Sales (%)
Panel 1: Treat*FEMA 3.646** (2.11) N 42,123 R2 0.009 Panel 2: Treat*FEMA*Grant recipient 10.593**
(2.39) 42,123 0.012
N R2 Panel 3: Firm volatility Industry volatility (1) (2) Treat*FEMA*Cons 4.126** 2.414* (2.13) (1.69) N 42,123 42,213 R2 0.009 0.008
Notes: All specifications are estimated using the difference-in-differences matching estimator. The dependent variable is the ratio of export to sales ratio (%). Treat*FEMA measures the policy liberalisation effect. All regressions include firm fixed effects. Time dummies are included in the models with standard errors clustered at the firm-level. Robust t-statistics are reported in the parentheses. The remaining specifications, which are not reported for brevity, are identical to those in Tables 4-6. Statistical significance is denoted at 1% (***), 5% (**) and 10% (*).
![Untitled-1 [hclinfosystems.in] · The Company has tied up long term borrowings during the year and repaid a part of its short term borrowings. Net Borrowings ` crores Particulars](https://img.pdfslide.us/doc/110x75/5e7f6cd958ba933e346222ff/untitled-1-the-company-has-tied-up-long-term-borrowings-during-the-year-and.jpg)