Embed Size (px)
Citation preview
Workplace Practices and Firm Performance inmanufacturing: a Comparative Study of Italy and
UK.
Annalisa Cristini ∗
University of BergamoDario Pozzoli†
Aarhus School of Business
August 18, 2008
Abstract
Using data from the 2004 Workplace Employee Relations Survey on Britishestablishments and two surveys on manufacturing firms located in the North ofItaly, we look at the diffusion of new workplace practices in the two countriesand at their impact on the firm’s value added. We find that the adoption ofinnovation practices has spread substantially more across the British manufac-turing firms than across the Italian ones; however our results also indicate thatthe practices’ association with the firms’ VA is much lower in the Uk than inItaly. The counterfactual analysis shows that had the Italian workplaces thesame characteristics of British ones, in terms of diffusion of practices, capitalintensity and skills, their average predicted value added would triplicate. On theother hand, were the Italian establishments to move and operate in the Britishcontext, their performance would improve very modestly.
JEL Classification: C33, J41, J53, L20Keywords: Workplace practices, financial performance, Italy, UK
∗Corresponding Author. Address: Department of Economics, University of Bergamo, Via dei Ca-niana 2, 24127 Bergamo, Italy. Email: [email protected]. Tel.: +39 035 2052 549; Fax: +39035 2052549.†Aarhus School of Business, Department of Economics Prismet, Silkeborgvej 2, DK 8000 Aarhus
C, Denmark. E-mail: [email protected]
1

1 Introduction
Since the late eighties a growing number of studies has investigated the economic impact
of some innovative workplace practices centered on the concepts of employees’ involve-
ment, empowerment and autonomy. Although the extensive empirical literature has
helped delimiting a consensus set of such practices, which typically include informa-
tion sharing, formal arrangements to discuss production problems, systems of rewarded
suggestions, autonomous team-working, job rotation and de-layering, the further ob-
jective of a common definition and measurement of these practices is more difficult
to reach. The reason is, quite simply, that workplace practices data are survey-based
and partly qualitative in nature; hence the definition of a practice crucially depends
on the questions posed, on how they are phrased and ordered in the questionnaires
and how the latter are collected. Another usual difficulty is the need to match survey
data with balance sheet information referred to the same unit of investigation (firm
or establishment), unless the relevant accounting items are collected in the survey it-
self, but this is uncommon. On the whole, these specificities have limited somewhat
cross-country comparison exercises even where nationally representative surveys exist,
like in France (REPONSE), in USA (EQW-NES), in Britain,(WERS). Consequently,
although most of the evidence agrees that these practices exert a positive impact on
firms’ productivity and this is true in a number of countries (Greenan (1996), Cappelli
and Neumark (2001), Godard (2001), Black and Lynch (2004), Thomas (2004)1, their
relevance in explaining across country firm performance remains largely unexplored. A
recent contribution to cross-country evidence, is the work by Bloom and Van Reenen
(2007) based on a survey accurately designed and targeted to collect information on
managerial practices; the survey addressed a sample of 732 medium-sized manufac-
turing firms in the United States, the United Kingdom, France, and Germany. They
1These findings also explains why such practices are also referred to as high performance workplacepractices (HPWP)
2
find a considerable variation of practices across countries and a significant association
between better management practices and higher productivity, profitability, Tobins
Q, sales growth rates, and firm-survival rates. Another example is Caroli and Van
Reenen (2001) who use French REPONSE and British WIRS (successively denomi-
nated WERS) to test the skilled-biased organizational change hypothesis across the
two countries and the two data sets.
Our paper adds to this limited cross-country literature by comparing innovative work-
place practices in the manufacturing sector in Britain and Italy. We use two existing
surveys: WERS for Britain and, for Italy, a survey designed on WERS but addressed
only to the manufacturing sector of two provinces of Lombardy (described in the next
section). The basic research question we pose is whether differences in productivity
across the two samples are associated to differences in innovative workplace practices.
Our initial objective is therefore to sketch a picture of the diffusion of a commonly
defined set of ’standard’ innovative workplace practices in the manufacturing sectors of
the two countries and our second objective is to investigate the role of these practises
on the firm’s VA and TFP in the two samples.
At this regard, a crucial point made in the economic and managerial literature is that
the productivity enhancing effect of these practices is not granted by their adoption:
their distinctive function of addressing the management of people, aiming to obtain the
employees’ involvement in the production process and their active interaction, implies
that these practices’ effectiveness rests greatly on how they are made operative (Black
and Lynch, 2001). An effective implementation usually implies a deeper reorganiza-
tion, it is likely to involve higher costs and probably resistance on the part of some
groups (typically, middle managers (Batt, 2004)), and to be a lengthy process2. It may
2Kato and Morishima (2002) find that participatory human resource management practices leadto a significant increase in productivity only seven years after their introduction; Brynjolfsson et al.(2002) find that the performance effect of the interacted ICT-reorganization term is evident from thethird year; similarly Bauer (2003) shows that the productivity effect of implementing high performanceworkplace practices rises over time and has a positive impact on labor efficiency only in the long run.
3
therefore happen that innovative practices are present, for example because they pay in
terms of image, but their productivity effect is low because substantial reorganizations
are avoided or because a poor management quality prevents a full exploitation of their
potential.
Our final research question then addresses this issue of the efficacy of the practices
versus their extension of adoption and investigates how these two factors contribute to
the gap in the average VA (and TFP) between the two sample of firms. By applying
a standard decomposition exercise we distinguish the contribution of a different ’en-
dowment’ of practices from the contribution of a different efficacy of the same set of
practices. We find that 40% of the higher productivity of the British manufacturing
firms relative to the Italian firms is explained by a different extent of adoption of the
practices and that the remaining 60% is ascribable to a different efficacy of the prac-
tices adopted. The practices that the most contribute to the overall higher efficacy
are good industrial relations and functional flexibility (job rotation); the practice that
mostly contributes to the higher overall ’endowment’ effect is financial participation.
2 The determinants of practices across countries
Generally speaking, differences in the extent of adoption and in the effectiveness of
the adopted practices may be expected because of firms heterogeneity and because
the context in which firms operate is different and leads to different organizational
choices. Looking first at the latter argument, one expects market competition to be
of some relevance. First of all, because it affects managers’ behaviour, and managers
are responsible for the decision to innovate; secondly because it also affects workers’
behaviour, and workers are those who take active part in the reorganization and influ-
The Danish Ministry of Business and Industry (1996) documents that the implementation of bothICT investments and organizational changes deploys a positive and rising impact on productivity fromthe fourth year after adoption.
4

ence its effectiveness.
Drawing on the extensive literature on managers’ effort, a well known result is that
market competition has theoretically an ambiguous effect on managerial effort essen-
tially for the negative effect that competitiveness exerts on profits, which are a source of
managers’ earnings (Nickell, 1996 and reference therein). This implies that managers,
in a competitive setting, are not necessarily willing to go for the most innovative prac-
tices and/or to implement them ’effectively’; the fact that the positive returns from
the innovative process may be collected only after a few years may hold back even
further the decision to innovate. Hence, as long as the decision to innovate rests on the
firm’s management, a higher market competition, ceteris paribus, does not guarantee,
a priori, a more extensive use of HPWP nor a better implementation.
In fact, the existing evidence on cross-country comparison of workplace practices con-
cludes that competitiveness is crucial for good management practices and generally for
organizational changes. Bloom and Van Reenen (2007) show that the degree of market
competition, measured in terms of import penetration, Lerner index of competition,
number of competitors, is positively and significantly related to the score of good per-
forming management practices and that, by reverse, low competition accounts for a
large proportion of the gap in good practices between Anglo-Saxon countries and con-
tinental Europe. Similarly, Caroli and Van Reenen (2001) argue, by comparing Britain
and France, that deregulation can be a strong stimulus to organizational changes; in
particular they find that in France firms belonging to the public sector as well as
unionized firms retard organizational restructuring, while in Britain the substantial
legislative changes towards liberalization and the decline of union strength that took
place in the eighties appeared to have acted as triggers of dramatic re-organizations
(Caroli and Van Reenen (2001) p.27). However, typical indicators of market com-
petitiveness were not found to add significant explicative power to the probability of
5
organizational changes in their samples3.
As market competition reduces rents, also reduces the possibility for workers to share
the rents, either through higher wages or less effort (Nickell 1996). Workers’ effort
then increases with competition and, other things equal, any practice can therefore
be expected to be more efficient in a competitive setting. However, with regards to
innovative workplace practices, the more important issue is the workers’ resistance to
change. Recessions, by rising unemployment and lowering the probability of finding
an alternative jobs, generally reduce resistance to change (Schmidt, 1997). Channels
that give employees voice and specifically unions also reduce resistance to change as
unions’ presence guarantees against possible job losses and worsening working condi-
tions (Lynch, 2007). However unions may fear the introduction of innovative practice
as the latter may weaken their role by allowing employees to have a direct voice with
the management (Freeman and Rogers 1999). On whole, we conclude that whereas the
presence of unions has a priori an ambiguous sign on the probability of adoption, and
this is indeed confirmed in the empirical literature (Lynch 2007 and references therein),
unions’ presence is expected to be beneficial to the effectiveness of the existing prac-
tices.
Two other determinants of managerial effort emphasized in the literature are share-
holders’ control and financial pressure (Nickell, 1996). Managerial ownership can in
principle discipline the managers but conflicting objectives may prevail beyond a cer-
tain equity ownership; external control is usually a safer way to reduce managerial
slack: Nickell, Nicolitsas and Drymes (1997), on a sample of UK firms, find that only
the presence of an external dominant shareholder affects firms’ productivity. Bloom
and Van Reenen (2007) find that the probability of bad management rises where the
3Lynch (2007) on a sample of US firms finds that having an external focus (incidence of exportson sales, benchmarking) rises the probability of organizational changes in manufacturing. A broaderexternal focus means more opportunity for comparison of performance, which is also a facet of com-petition.
6
CEO is the eldest son of the founder: on the whole, primogeniture and market com-
petition, taken together, account for about half of the badly performing firms in their
sample. Cucculelli and Micucci (2008), on a sample of 3548 Italian manufacturing
firms, find that post-succession firm performance decreases more in family succession,
where the heir is appointed CEO than in firms where the CEO is unrelated to the
family. Finally, with regards to the firm’s financial pressure, high interest payments
relative to earnings raise, ceteris paribus, the probability of bankruptcy and hence the
pressure for mangers to perform well (Schmidt, 1997); the threat of bankruptcy could
then induce substantial organizational changes4.
Turning to firms’ heterogeneity, differences in the production process may also deter-
mine different practices. A highly specialized production, for example, may need more
training-related practices; smaller firms may need relatively less information sharing;
autonomous team working can be more useful where products are technically complex.
The presence of high skills and/or ICT investments may induce the adoption of com-
plementary practices. In section... we discuss heterogeneity in our samples which will
be taken care, in the regression analysis, by proper controls.
3 The context in Britain and Italy
In this section we discuss the differences of the economic contexts in which the British
and Italian firms operate. We will mainly focus on the extent of market competitition
drawing from country-level information. Some firm-level information on the degree of
competition and on the ownership structure is also available in the two samples and is
described in section... below.
4Market, financial pressure and corporate governance can substitute each other in disciplining themanagers (Aghion and Howitt (1996); indeed, Nickell, Nicolitsas and Drymes (1997) find that financialpressure and corporate governance are more effective on firm productivity where market competitionis low and rents are high. Likewise, the productivity enhancing effect of innovative practices may notbe linearly linked to the degree of market competition as long as other disciplining factors are relevant.
7

Take a manufacturing firm and place it first in Britain, then in Italy. Which differences
in terms of the economic context, would she mostly perceive?
The extent of regulation of the manufacturing sector is likely to be one. According to
Nicoletti and Scarpetta (2003, p.29) this is well captured by the administrative burdens
and by tariff and non tariff barriers to trade. Indeed, the OECD (2003) indicator of ad-
ministrative burdens, which varies between 0-6 from least to most regulated, although
it declined from 4.64 in 1998 to 2.44 in 2003 is still much larger in Italy than in the
UK (0.66 in 2003). Similarly, Djankov et al. (2002) find that Italy is one of the most
restrictive countries for the number of procedures required to set-up a business and the
UK is one of the least demanding 5. Regarding barriers to trade, the difference between
the two countries is less striking, thanks to the UE participation: the indicator is 1.15
in 2003 in Italy and 0.36 in the UK.
In addition, the manufacturing firm would also discover that in Italy a further penal-
ization comes from the use of services which also operate in a more regulated market.
Indeed, the OECD (2003)’s all-economy measure of product market regulations6 ranks
Italy fifth, after Poland, Turkey, Mexico and Hungary while the UK sits at the other
end, just before Australia.
Another difference between the two contexts is the employment protection legislation:
again, the UK is one of the most liberal countries and Italy one of the strictest (Nico-
letti et al. (2000)) although the surge in temporary contracts, since the late nineties,
have reduced somewhat the famous rigidity of the Italian labour market.
5An entrepreneur in Italy has to follow 16 different procedures to acquire the necessary permitsto start a business, which is the same number required in Senegal, Ecuador, Romania and Vietnam,and well above the worldwide average number of 6.04 procedures. The corresponding number for UKis only 5. This study also finds, that in Italy the minimum time to start up a firm is about 62 days,while in UK is just about 4 days.
6This measure captures: (1) barriers to entrepreneurship (e.g., administrative burdens on start-ups and corporate firms, licensing and permit systems, existence of antitrust exceptions for publicenterprises), as well as (2) state control over business enterprises (e.g., size of public enterprise sector,price controls in competitive industries) and barriers to international trade and investments
8

If innovative workplace practices are a way to perform better7, and competition exerts
a positive pressure to do so, then, other things equal, we expect innovative practices
to be less common in the Italian context.
4 The datasets
For the Italian sample of firms, workplace data are drawn from two surveys jointly
conducted in two adjacent provinces of Lombardy. Lombardy, located in the North of
Italy, is the most industrialized region of the country, producing over 27% of the Ital-
ian industrial VA (excluding constructions) and employing over a fourth of the Italian
employees of the industrial sector (all data refer to 2003). The two provinces together
make up, in 2003, 23% of the region’s industrial VA (excluding construction) and em-
ploy an equal percentage of workers in the same sector. Their productive structure is
well representative of large areas of the North of Italy and some areas of Central Italy,
which make us believe that the analysis, although carried out on a specific sample of
firms, can provide valid results beyond the local context.
In particular, the sources of information used for the empirical analysis are the fol-
lowing: 1) a survey conducted in 2003 and addressed to all the firms with more than
50 employees belonging to the Industrial Employers Confederation of the province of
Bergamo; 2) a very similar survey conducted in the same year and addressed to all firms
7Most of the evidence supports the productivity enhancing effect of high performance workplacepractices. Ichniowski, Shaw and Prennushi (1997) find that in the US steel finishing industry produc-tivity rises by 6.7% under innovative human resource management systems. Black and Lynch (2000)confirm the role of workplace reengineering and new human resource practices for productivity usingUS nationally representative data. Similar conclusions have been reached for Germany (Bauer, 2003;Zwick, 2004), France (Greenan, 1996; Caroli and Van Reenen, 2001) and Italy (Cristini, Gaj andLeoni, 2003). However, Freeman and Kleiner (2000) and Capelli and Neumark (2001) do not finda significant impact of employee involvement programs on productivity and Godard (2004) arguesthat the literature all together may have emphasized the positive productivity results more than thenegative ones.
9
with more than 50 employees belonging to the Industrial Employers Confederation of
the province of Brescia; 3) a longitudinal balance sheet data-set relative to both sam-
ples of firms. The questionnaire 8 were sent to a stratified sample of 380 firms located
in Bergamo and to a stratified sample of 290 firms located in Brescia. The response
rate was respectively 24 and 28 percent, implying a sample of 87 firms located in the
province of Bergamo and 78 located in the province of Brescia. For the empirical anal-
ysis we combine these two samples given that the questionnaires are identical in the
sections of interest and that the two surveys were conducted in parallel and followed
by the same team of researchers. The final sample contains 165 firms, representing
16% of the firm population with more than 50 employees recorded in the last Industry
Census conducted in 2001 (Table ??). The main sections of the questionnaire are based
on WERS and include complete information on teamworking, industrial relations, hir-
ing and selection procedures, extent and quality of training, consultation, information
sharing and incentive pay systems; detailed data on firm characteristics (size, sector,
market share, etc ) at plant level are also included.
The questionnaires was jointly designed by a team of Department of Economics of the
University of Bergamo9 and the Bergamo Personnel Managers Association (DIPER)
whose collaboration had been essential both in helping formulating the questions in a
management comprehensible language and in advocating the relevance of the survey
among the firms10. The panel information on accounting data (value added, capital
8An English version of the questionnaires is available upon request from the authors.9Leoni (ed.) (2008) provides a full account of the whole project, substantially financed by the
Ministry of University and Research (PRIN, 2001), which took care of the various steps of the surveys.The first wave, in 1999, was addressed to the employers of the firms located in the provinces ofBergamo; the second wave, in 2003, was again addressed to the employers of the firms located inBergamo and, in addition, to the Unions’ representatives of the same firms (Leoni et al, 2001 andLeoni et al., 2003). In 2003 the survey was extended to the confining province of Brescia and was hereaddressed to the employers (Albertini and Paloia, 2008); Albertini and Leoni, (2008). Econometricanalysis on the first wave are in Leoni (2008), Cristini et al. (2004) and Cristini and Leoni (2008).
10The surveys were proceeded also by a series of conferences mainly addressed to the employers andwere followed by a conference in which the results and the Report were presented. A recent volumeby Albertini and Leoni (2008) compares the findings of the surveys in the two provinces.
10

stock, accumulation rate, leverage and profits) is drawn either directly from the Balance
Sheets Collector (Centrale dei Bilanci di Torino) or from a huge database of accounts,
balance sheet ratios and activities at company level for Italy (AIDA), available from
Bureau Van Dyck. For comparability with the cross-section financial performance in-
formation available for the British sample, we use only information of the accounting
year in which the survey was conducted. One inevitable disadvantage of using balance
sheets data is that financial information may not match plant level practices if firms are
multi-plant; in our sample almost 60% of firms are mono-plant and in the regression
analysis we take care of this by a suitable dummy variable..
For the UK we use the WERS 2004 which is nationally representative survey of work-
places with five or more employees. WERS Management Questionnaire provides data
on workplace practices and subjective measures of performance, while the Financial
performance questionnaire provides objective measures on the performance of individ-
ual establishments for the accounting year 2003. The latter is a four page question-
naire that was issued to all workplaces at the end of the cross-section Management
interview11. Although respondents were encouraged to complete the additional ques-
tionnaire solely about the workplace that had been the subject of the management
interview, they were given the option to report on some larger observational unit,
typically, the whole enterprise. About 90% of the manufacturing sector workplaces
completed the financial questionnaire with reference only to the WERS workplace; as
for the Italian sample, we take care of this in the regression analysis by a dummy
variable. The alternative to the Financial questionnaire is to rely on the subjective
measures about the establishment performance relative to average performance in the
11The Financial performance questionnaires were distributed in 2076 of the 2295 workplaces thatparticipated in the cross-section survey (Chaplin et al., 2005). Following a three-stage reminder pro-cess, Financial performance questionnaires were obtained for 1070 workplaces, representing a responserate of 52% among workplaces accepting placement of the questionnaire and a rate of 47% among allcross-section workplaces.
11
industry; this information is present in the Management questionnaire12. T. Kersley et
al. (2006) undertake a careful comparison of the subjective and accounting-based pro-
ductivity measures for the private sector in WERS 2004 and find that the correlations
between the two measures are modest. Hence we decided to use both the objective and
the subjective measures in the econometric analysis.
On the whole, the usable sample of workplaces in the private manufacturing sector
for which information on objective financial performance is also available is of 161
observations (123 if we consider only workplaces with more than 50 employees).
4.1 A description of the samples
In line with the population distribution by sector, almost 40% of the firms in the Ital-
ian sample belongs to the metal and machinery sector, 14% to the textile sector and
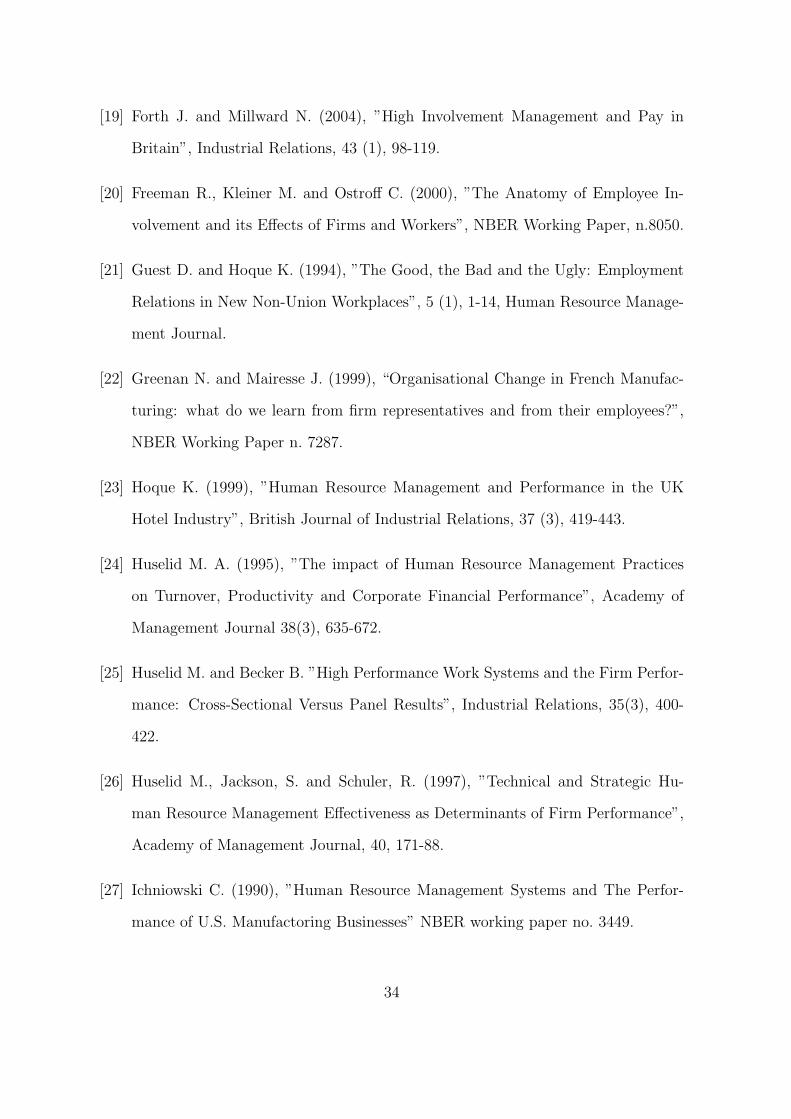
12% to the chemical sector (Table ??). The sector distribution of the British firms is
quite different: the presence in the metal and machinery sector is below 10% and the
presence in the textile sector is around 3%. British establishments are prevalently in
the chemical and food sectors (each absorbing 15% of the establishments) and in the
wood and paper sector (12%).
Regarding firms’ size, though the Italian survey excludes companies below 50 employ-
ees, the sample is still predominantly of small-medium size, 67% of the firms having
between 50 and 250 employees; in fact this is an even lower percentage than that of
the 2001 Census for the two provinces of interest (85%). The pervasive presence of
small firms in Italy is well know: according to the 2001 Census 99% of the manufac-
turing firms had less than 250 employees and accounted for 77% of the manufacturing
12The responses, given on a Likert scale: ”A lot better than average” ”Better than average” ”Aboutaverage” ”Below average” or a ”A lot below average, are skewed towards positive values, as usuallythe case in this type of qualitative questions. In the estimation sample, for example, only 9 percent ofmanagers rates the financial performance at their workplaces to be ”a lot below” or ”below average”,whereas 40 per cent rates it as ”average”, 53 per cent rates it ”above average” and 13 per cent ratesit ”a lot above average”
12

workforce13. In the British sample, 25% of the establishments are below 50 employees
(Table ??)14; this implies that, if we had to include only establishments with more
than 50 employees, coherently with the Italian sample, the average size of the British
establishments would be much larger than that of the Italian firms: more than 50% of
the establishments have more than 250 employees in the British sample compared with
30% in the Italian sample. The distribution by size of the two samples is more similar
if we consider all British establishments, including those with less than 50 employees.
In the empirical section we presents estimations for all British establishments as well
as for the subsample with more than 50 employees.
Table 3 reports summary statistics of the accounting data. Italian firms are smaller in
terms of employees, sales, VA and capital; the average firm has 318 (461) employees in
Italy (Britain) and a turnover (nominal sales) of 109000 (125000). VA per employee is
also lower in the Italian sample, being on average 85% of that of the British sample15.
4.2 Market competition and firm ownership: sample informa-
tion.
The questionnaire addressed the Italian firms differ slightly between the two provinces.
In particular, firms located in the province of Brescia were asked o answer a set of
additional questions concerning the corporate governance whereas firms located in the
province of Bergamo were asked additional questions concerning the degree of compet-
itiveness of their market of operation. We discuss both features below and compare
13To take account of the over-representation of large firms in our sample, we use weighted regressionanalysis, the weights being the inverse of the firm size, defined by number of employees.
14Notice that, for the sake of comparability with the descriptive statistics of the Italian sample,the reported descriptive statistics for the British sample are unweighted. In the econometric analysis,however, we take account of the complex sample design used for WERS04, which involved dispro-portionate stratified sampling by workplace size and industry sector, by using the sampling weightsprovided in the data set; these weights being approximately equal to the inverse of the probability ofselection of each establishment into the sample. For a straightforward discussion of the importance ofaccounting for the sample design in analysis of WERS data, see Purdon and Pickering 2001.
15In both sample we have excluded firms with values of capital stock above the 99th percentile
13

them with similar information present in WERS.
Firms located in the province of Brescia are, according to the sample, predominantly
owned by individuals: in 60% of the cases the first shareholder is an Italian individual,
in 24% of the cases is an Italian private industrial firms, in 4% of the cases it is a foreign
industrial firms. Ownership is also particularly concentrated: in 80% of the cases the
first shareholder controls more than 30% of the equity and in most cases the first five
shareholders own the whole firm. Coalitions are also rather stable in time. Typically,
ownership and control overlap: in 77% of the cases the first shareholder takes active
part in the firm’s activity and the percentages are similar for all the first five share-
holders. Regarding the role of the family, in 80% of the cases the owner is also the
CEO and in 62% of the cases family members perform managerial tasks; nonetheless,
managers with no family links have recently increased and are present in 58% of the
firms. Finally, in 41% of the firms the founder is the CEO, in 32% is one of the children
to have the main responsibilities and in 6% is one of the nephews (Albertini and Paiola,
2006). Using a much larger sample of more than 3500 firms located in four regions of
Italy (Veneto, Emilia Romagna, Abruzzo and Molise) Cucculelli and Micucci (2008)
find a larger percentage of first generation firms: the CEO is the founder in 65% of the
cases and is the heir in 23% of the cases (Cucculelli and Micucci, 2008 BdI).
Comparing the Brescia firms with the WERS manufacturing sample, the latter appears
to have a less concentrated ownership and less overlapping of ownership and manage-
ment: 40% of the WERS manufacturing establishments have a single individual or
a family owning more than 50% of the equity and only in 64% of the cases are any
of the controlling owners actively involved in day-to-day management activities. For-
eign ownership is also more common in the UK, where 28% of the establishments are
owned/controlled by a foreign company.
The features of extensive overlapping of ownership and management and the presence
of second and third generations of family firms, together with stable coalitions, do not
14

bend, altogether, in favor of sharp organizational changes in Italy. The decisive in-
ternationalization and the less extensive relation between ownership and management
could, instead, favor more diffused organisational innovations in Britain.
The questionnaire addressed to the firms located in the province of Bergamo included
a few of the questions on market competition present in WERS. One direct question
asks on the perceived degree of competition in the market in which the firm operates:
85% (28%)of the British (Italian) respondents feels it’s very high and 5% (13%) thinks
it is very low (Table ??). In terms of value of goods, the largest client of the Italian
(British) firms has a share of over 50% in 32% (14%) of the cases and a share less than
5% in 3% (11%) of the cases. In both samples most of firms operate in the international
markets but Italian firms operate comparatively more in the local and regional market.
On the whole, it looks as if British establishments face a higher number of competitors.
5 Definition of workplace practices and their diffu-
sion among firms
The precise definition of an innovative workplace practices necessarily involves some de-
gree of arbitrariness (OECD 1999, Greenan and Mairesse 1999; Millward 2000; Cristini
et al 2003); to reduce this risk and facilitate the comparison with the existing evidence
for Britain, we follow the terminology adopted by Forth et al (2004) and Bryson et al
(2005) and focus on three large sets of practices: task practices (defining how the work
is done), individual support practices, designed to give employees the skills and the
information needed to work in an involved manner; organisational support practices,
aimed to secure and retain a stable and committed workplace16. In particular, task
practices include:
16Appendix A reports a detailed list of questions extracted from the Italian and the British surveyused to define these workplace practices.
15

i) team working, defined as whether at least 60% of employees in the largest occupa-
tional group work in formally designed team and team members jointly decide how the
work is to be done;
ii) functional flexibility, defined as whether employees are actually requested to carry
out tasks different from their official duty.
Individual support practice include:
iii) meetings between senior managers and the whole workforce taking place at least
monthly and where at least 10% of time is given over to questions or contributions
from employees;
iv) information disclosure, i.e. regular information from the management to employees
or their representatives about the establishment’s financial position, internal invest-
ment plans and staffing plans;
v) human relations training which may cover teamworking, communication or problem
solving for the largest occupational group and in the last 12 months.
Organisational support practices include:
vi) financial participation schemes targeted to non-managerial employees in the last
12 months (employee share ownership scheme or profit- or performance related pay or
formal evaluation to determine wage increases or premiums).
Table 4 provides an overview of the diffusion of such practices. Starting from the
task practices, Italian firms prefer functional flexibility to teamworking while British
firms make the opposite choice: only 22% use functional flexibility and 37% have their
employees working in teams. In Italy teamworking involves, instead, only 11% of the
firms and functional flexibility almost 32%. Information disclosure is largely diffused
in both countries and is highest in Italy, being present in nearly 70% of the firms (60%
in Britain). Human relation training, probably the most important individual sup-
port practice is the most diffused practice in Britain (62%) although the proportion
16

is considerably smaller in larger firms (51%). Maybe because of the small presence
of teamworking, employer-employee meetings are rather diffused in Italy (35%), less
so in Britain (18%). Finally, only a fifth of Italian firms offer some form of financial
participation to their employees while such schemes are present in half of the British
firms. On the whole, larger firms, in Britain, make less use of innovative workplace
practices.
A first glance to the two countries then reveals that the difference is not so much in
the magnitude of the practices adopted (the average number of practices is around 2 in
both samples) as in the quality of the set of practices. In Britain the choice has been
towards teamworking supported by human relations training and employees’ financial
participation17. In Italy firms seem to have chosen a ’softer’ road to innovation based
on sharing information, meetings and job rotation18.
Table ?? also reports a measure of skills 19 and a measure of the quality of industrial re-
lations20; these additional measures, though not being proper workplace practices, are
important ’adjuvant’. In terms of skills the Italian firms appear to be about 15% less
equipped than the British firms. With regards to industrial relations..DA FINIRE.....
Table ?? presents the correlation matrix for the six workplace practices in the three
samples: Italy, all British establishments and British establishments with more than
50 employees. In the Italian sample, the most used task practice, functional flexibility,
is negatively correlated with all individual support practices (information disclosure,
meetings and human relations training) while in Britain, functional flexibility is posi-
17Millwards and Forth (2004) on the basis of WERS (1998) also show a diffused adoption of team-working but also of functional flexibility practices and problem-solving groups, all present in 30% to50% of the establishments,
18Comparing the first wave conducted for the only province of Bergamo to this second wave, for thesame sub-sample, it emerges that the diffusion of team working and financial participation is almostunchanged, while there is a slight increase in the diffusion of functional flexibility, up from 25%.
19This is a dummy taking the value of 1 if in the firm/establishment the share of managerial andprofessional occupations is above the median and the share of manual skills is below the median.
20This is a dummy taking a value of 1 if the respondent agrees on the statement that employeerepresentatives generally help to find the best ways to improve company performance.
17
tively correlated to the most important individual supports: human relation training
and meetings. However, the more ’employee-involving’ task practice, teamworking, is
positively related to training and information disclosure, in both countries. Financial
participation is negatively related to both task practices in Britain and appears jointly
with training and information disclosure; in Italy it is negatively related to all prac-
tices, except functional flexibility21. Next we turn to the multivariate analysis.
6 Econometric issues
We assume a standard Cobb Douglas production function where:
log(Yi = constant+ aXi + blog(Hi) + clog(Ki) + dZi + eIi + εi (1)
The subscript i refers to the firm or establishment; Y is the firm’s 2003 objective
VA in euros, K is the 2003 book value of capital stock in euros, Z is the vector of
the six workplace practices described above, X is the vector of controls including size,
sector and region dummies, I is the ’good industrial relations’ dummy variable, H is a
skill-augmented labour input defined as follows: Hi = eγhskiNi where hskj is the high
skill dummy previously defined and Nj is the number of employees. The production
function is estimated as a cross section because for the British sample VA and capital
are available only for the accounting year 2003.22.
The estimation of equation (1) presents some well-known problems that are likely to
21One reading of the correlations is the following: in Britain training is pivotal (and indeed it ispositively and significantly elated to all practices): financial participation is through training which inturn is linked to the most used task practice, teamworking; in Italy, financial participation is directlylinked to the most used task practice, functional flexibility, but it is negatively related to training andteamworking
22See for example Black and Lynch (1999) for a similar cross-section production function usingworkplace practices as regressors.
18

bias the coefficients of the explanatory variables: possible correlations between the
unobservable time invariant part of the error term and the regressors; errors in the
measurement of some variable and particularly of capital; simultaneity between the
choice of inputs and output determination; possible underestimation of the true impact
of workplace practices as long as their productivity effect takes some time to come
through. We will therefore interpret the estimates of the effects of workplace practices
on establishment performance as statistical correlations that give some guidance on the
true causal effect but we will be careful to draw policy conclusions. In order to check
if the potential bias on the coefficients of labour and capital affect the estimation of
the effects of practices, we also run regressions on the total factor productivity (TFP)
calculated by inputing ’standard’ values to the coefficients of capital and labour23. As
an alternative measure of performance we compute an indicator of each firm’s average
labour productivity relative to the industry average. In this case the ordinal nature of
the dependent variable leads us to employ the standard ordered probit model:
Qi = Giβ + ui Ii = m if m≤ Ii ≤ m+ 1 (2)
where Qi is an indicator of relative productivity of firm i calculated as either relative
value added per head or relative sales per head, m are the industry specific quartiles of
the distribution of either value added per head or sales per head and Gi are the same set
of regressors of equation (1). For the British sample, we also use, in alternative toQ, the
subjective measure of labour productivity reported in the management questionnaire.
23The total factor productivity is calculated as following: ln(TFP)i = yi − 0.65 ∗ ni − 0.35 ∗ ki.
19

7 Empirical evidence
Table ?? reports the results of estimating equation (1) for the Italian sample and the
British samples (all establishments and more than 50 employees)24. In Model 1, the
dependent variable is VA and in Model 2 it is TFP, calibrated as previously described.
For Italy the estimated coefficients of K and N are very close to the conventional shares
in value added; for Britain, though not as satisfactory, they are also reasonably close
to their expected values if the whole sample of establishments is used. In fact, when
limiting the analysis to the British establishments with more than 50 employees, none
of the workplace practices is significant and the estimates of the inputs’ shares are far
from their expected magnitudes; still, even when calibrating the TFP, workplace prac-
tices remain totally insignificant. In what follows we therefore focus, for the British
sample, on the results obtained on the whole sample of establishments.
Functional flexibility has a positive and strongly significant effect on the performance
of both sample of firms, Italian and British, and it is robust to both definitions of the
dependent variable. Likewise, human relation training shows a coefficient that is con-
sistent across samples and models but its impact is negative suggesting that, at least
on the contemporaneous VA and TFP, it counts more as an expense than as a resource.
Teamworking is a strongly significant and productivity enhancing task practice for the
Italian firms for which both task practices are therefore relevant. On the contrary,
teamworking has a negative effect, though far from being statistically significant, for
the productivity of the British firms. For the latter, financial participation exerts a
large and positive effect both on VA and on TFP. Finally, good industrial relations
raise TFP for the British firms; it has a positive but not significant effect for the Ital-
24Stratification is accounted for in all regressions. By using subsample a situation in which somestrata are represented by just one workplace are possible and are remedied by identifying these singlestrata and combining each of them with its closest neighbouring stratum. The impact of the sampledesign on standard errors is accounted for by the use of a linearised variance estimator (Bryson et al2005).
20

ian firms 25.
All the results described above are confirmed when using the relative performance
indicator as dependent variable (Table ??). However, the subjective measure of per-
formance, directly taken from WERS, gives less precise and in some cases opposite
results, specially when using the whole sample of establishments. On the other hand,
the subsample of establishments with more than 50 employees confirms some of the
previous findings on the whole sample: a positive and significant role of financial par-
ticipation, a negative and significant effect of meetings, a positive effect of functional
flexibility and a negative effect of training although these latter two coefficients are not
significant at conventional levels26.
7.1 The productivity gap and workplace practices: a counter-
factual analysis
In Italy, a flattening of the labour productivity in manufacturing dates back to the
beginning of the decade 2000; in the same period and up at least to 2004, the level
of labour productivity in the UK manufacturing sector followed an upward trend,
diverging from Italy and the Euro average. From 2000 to 2003, labour productivity
25For Italy, the existing evidence is only based on local surveys covering some areas of Lombardyand Emilia-Romagna (see for example Colombo and del Mastro (2000), Pini (2004) and Cainelli et al(2001). Although the definition of workplace practices is a little different, econometric results fromthe first wave of the survey for Bergamo, found that most workplace practices increased productivityonly if industrial relations were good and the organizational structure relatively flat (Cristini, Gay,Labory and Leoni (2003)).
26Previous results from the UK found that the labour productivity effects of the practices, if esti-mated using national representative data, are overall, rather limited: Wood and Menezes, 1998 andde Menezes et al. (2001) find little association between systems of involvement practices, at variousdegrees, and subjective measures of labour productivity; similarly Bryson et al (2005), using WERS(1998), find that high-involvement practices have a positive impact on a subjective measure of labourproductivity but this effect is confined to unionized workplaces and is not at all significant on a sub-jective measure of financial performance. On the other hand, studies using specific samples do find apositive association between workplace practices and either subjective ratings of labour productivity(Hoque, 1999; Guest et al., 2003; Guest and Hoque, 1994) or quantitative measure of productivitygrowth (Patterson et al, 1997). This could suggest that productivity effects might depend on specificfirm characteristics or specific bundles of practices which are hard to pin down at the economy level.
21
in manufacturing showed virtually zero growth in Italy (0.1%) while it grew at 3.4%
on average per year in the UK (OECD Statistical database, 2007). Consistently with
this macro view, our sample of Italian firms shows a significantly lower average VA per
employee, relative to the British sample, as reported in Table ??.
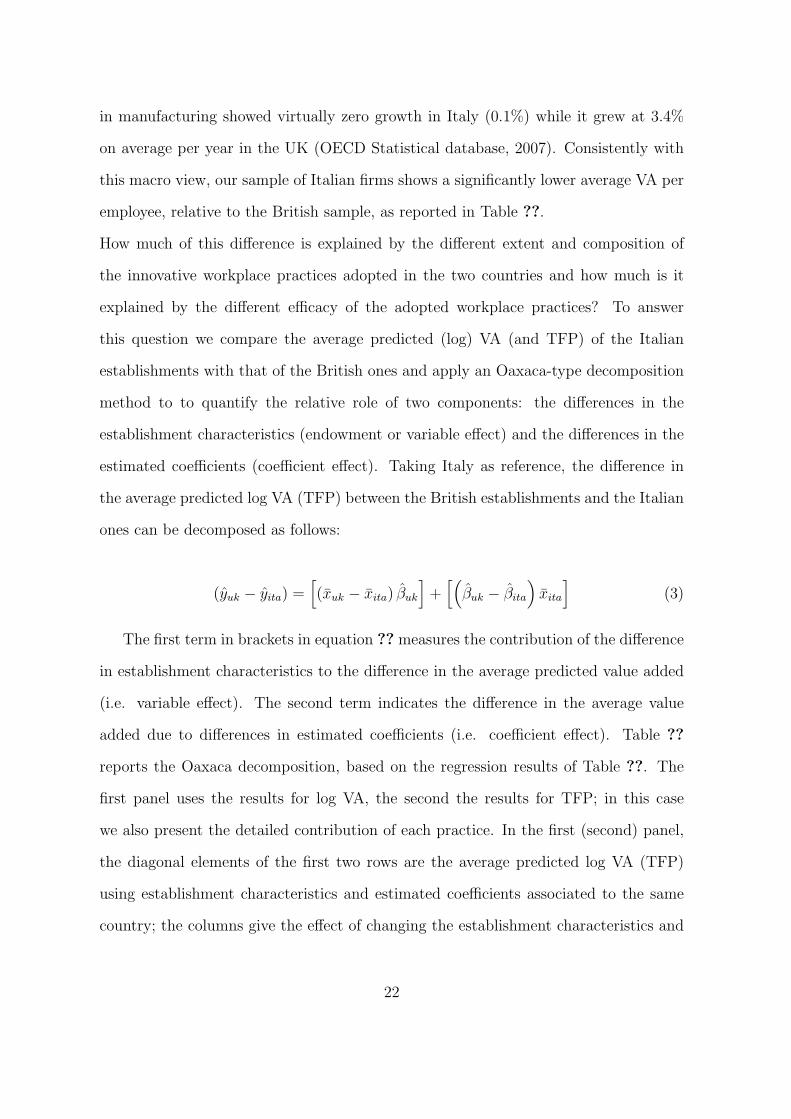
How much of this difference is explained by the different extent and composition of
the innovative workplace practices adopted in the two countries and how much is it
explained by the different efficacy of the adopted workplace practices? To answer
this question we compare the average predicted (log) VA (and TFP) of the Italian
establishments with that of the British ones and apply an Oaxaca-type decomposition
method to to quantify the relative role of two components: the differences in the
establishment characteristics (endowment or variable effect) and the differences in the
estimated coefficients (coefficient effect). Taking Italy as reference, the difference in
the average predicted log VA (TFP) between the British establishments and the Italian
ones can be decomposed as follows:
(yuk − yita) =[(xuk − xita) βuk
]+[(βuk − βita
)xita
](3)
The first term in brackets in equation ?? measures the contribution of the difference
in establishment characteristics to the difference in the average predicted value added
(i.e. variable effect). The second term indicates the difference in the average value
added due to differences in estimated coefficients (i.e. coefficient effect). Table ??
reports the Oaxaca decomposition, based on the regression results of Table ??. The
first panel uses the results for log VA, the second the results for TFP; in this case
we also present the detailed contribution of each practice. In the first (second) panel,
the diagonal elements of the first two rows are the average predicted log VA (TFP)
using establishment characteristics and estimated coefficients associated to the same
country; the columns give the effect of changing the establishment characteristics and
22

the rows report the effect of changing the estimated coefficients. The difference in
the average predicted VA between the British and the Italian samples is 25% and
the difference in the predicted TFP is 13%. The large role of the magnitude of the
variables in explaining differences in VA is likely to be driven by the firm’s size, both
in terms of employment and capital. Instead, by looking at the TFP difference, we
keep constant the size and the effect of K and N and analyse the sole role of workplace
practices, skills and industrial relations. In this case, we find that the contribution of
the endowments to the total difference in the predicted TFP, drops to 40% and the
remaining 60% is due to the different effect or efficacy of the explanatory variables. The
final panel shows the contribution of each variable. Information disclosure, which is the
most diffused practice in both samples, is more effective for the British firms; functional
flexibility and financial participation also contribute to explain the ’coefficient effect’ in
favor of Britain but it is the difference efficacy of good industrial relations that mostly
contribute to the overall coefficient effect. Financial participation largely contributes
to explain the difference in terms of endowment and, similarly, meetings although their
efficacy favors the Italian sample. Finally, the difference in skills brings a positive
but relatively small contribution to both the endowment and the coefficient effect.
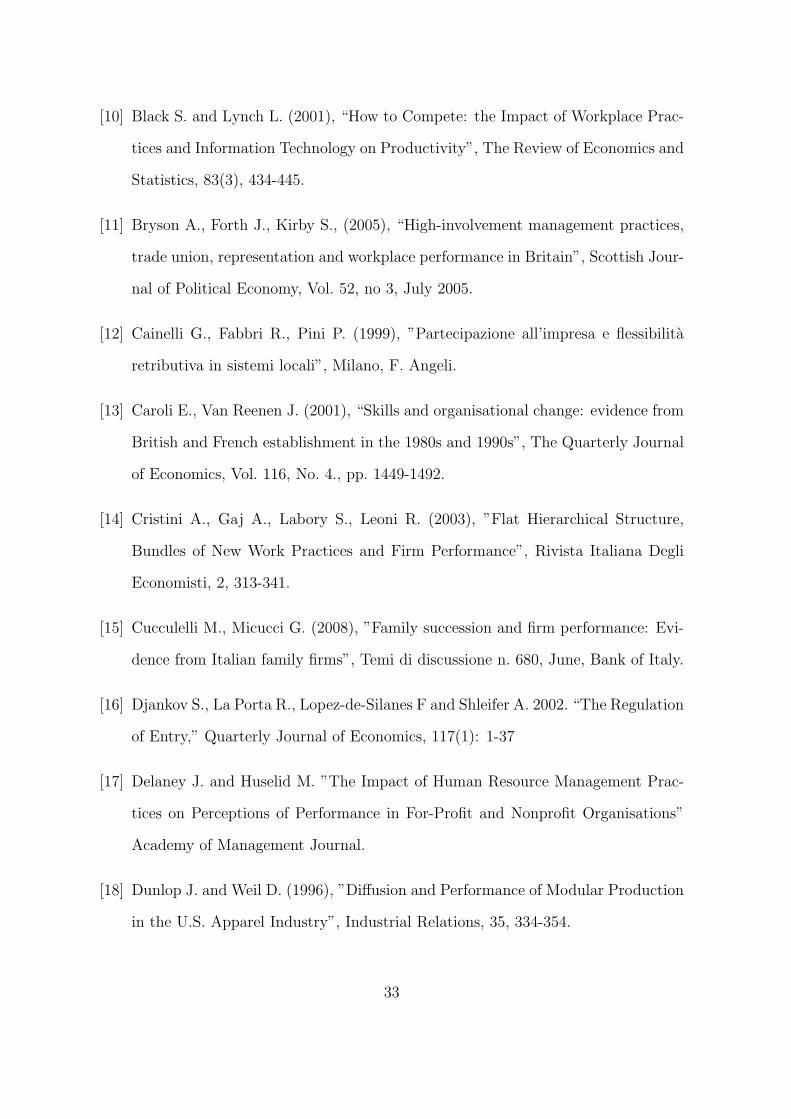
Figure 1a illustrates the kernel densities of the predicted TFP for the Italian and the
British establishments; the other figures in the panel represent the predicted TFP of
the Italian establishments when they are attributed the characteristics of the British
establishments (Figure 1b) and when they are attributed the efficacy of the British
establishments. The TFP distribution of the Italian firms moves rightwards in both
cases27. By assigning the British sample’s endowment, the distribution of the TFP
rises in mean but also in variance: all the distribution moves to the right implying
that both bad and good performing firms would benefit from the different endowment.
27In both cases the counterfactual distribution is significantly different from the initial predictedone according to a Kolmogrov test (p.value 0.00)
23
By assigning the coefficients of the British sample to the Italian firms, which can be
interpreted as moving the Italian firms in the British context, the variance of the
distribution rises less (DARIO INSERISCI SE CREDI UTILE; MEdie e VARIANZE
DELLE DISTRIBUZIONI), the left tail is trimmed only a little while the right hand
side tail becomes fatter indicating that the best performing firms are those that would
gain more from a change of the context: the best firms would do even better28.
7.2 The progression of the reorganization process and its ef-
fect on the firm’s performance
In the regression analysis we have not attempt to interact workplace practices, mainly
for the small number of observations in our samples. In fact, it is well documented
that practices, when forming complementary bundles, can exert a larger effect on pro-
ductivity 29. It has also been suggested (Freeman et al. (2000)) that practices may
be adopted along an ideally sequential path where the easiest practices are the first
ones to be introduced, gradually followed by the more difficult ones. In this case, the
bundle of practices, at a point in time, would be indicative of how far, along the reor-
ganization path, has the firm proceeded. In what follows we exploit this idea. First of
all, we check to what extent the data on the diffusion of workplace practices confirm
a sort of sequential path, i.e. we test whether the most diffused practices are indeed
the easiest and the least diffused are the most difficult ones; secondly, we compute, for
each firm, a measure of the of the reorganization process and use this as a regressor in
the production function.
In order to investigate whether the most widely adopted workplace practices are also
28Kernel densities of analogous predicted values using VA are qualitatively similar although thedistribution of VA in the British sample is less compressed. Moreover, kernel densities by subsections(region and sector) do not show a significantly different results across sub-samples
29For the evidence see, for example: Ichniowski, Shaw and Prennushi (1997), Brynjolfsson et al.(2002); Breshnan et al. (2002); for the theoretical production function see: Milgrom and Roberts(1990)
24
the easiest to adopt we apply the Rasch analysis. This belongs to the so called ”
unidimensional latent trait models” largely applied in education to assess the ability
of a person in response to a set of questions. In this case the latent variable we want
to measure is the reorganisation process and we measure it along an ideal continuum;
this means that the more difficult is the adoption of a given practice, the further away
this practice will be placed along the reorganization path and the more its adoption
will be retarded in comparison to easier practices.
More formally, let yij be the binary response to whether the practice is adopted or not,
where i = 1, ...., n with n the number of the establishments and j = 1, ....,m, with m
the number of practices. The Rasch model can be written as a logit-linear model:
log itPr (yij = 1| αi) = αi − θj (4)
here αi can be interpreted as an unobserved firm ability to innovate and θj as an
item-difficulty parameter. It is assumed that conditional on αi, the yi∗ are indepen-
dent (local independence). Actually Rasch (1960) gave an axiomatic derivation of the
model in which next to local independence, the main characterizing properties were
that the y∗j and yi∗ form a sufficient statistic for αi θj. Andersen (1980) showed that
the conditional maximum likelihood estimator of θj, where conditioning occurs on the
subject’s score yi∗ , is efficient and is actually asymptotically normal distributed, with
all the nice properties of ml properties analogous to those of the standard likelihood-
ratio test.
We estimate equation (2) using both the conditional fixed effects and the random ef-
fects estimators. Results are given in Table ??. The estimates obtained assuming that
θj are fixed or random effects indicate the same order of the items. For the British
sample with more than 50 employees the order of the practices, from the most diffused
to least, is the same order resulting from the estimated coefficients confirming that the
25

most frequently adopted practice, i.e. information disclosure, in this case, is also the
”easiest”; likewise, functional flexibility is the lest frequently adopted practice and the
most difficult to adopt. For the whole sample of establishments, this correspondence
is less precise: the easiest practice is again information disclosure but human relation
training is the most diffused; functional flexibility is the least diffused but still easier
than meetings. For the Italian sample the correspondence is also confirmed: team-
working is the most difficult practice and information disclosure is the easiest30.
Since the Rash measure is unidimensional, the estimated coefficients indicate the po-
sition of each practice along an ideal continuum (the reogranization process). The
position of the practices along such a ’reorganization-meter’ indicates that for the
Italian firms the most difficult change is to go beyond the first practice (information
disclosure), in the sense that the increase in the difficulty is highest in this step; for
the British firms the most difficult step is to introduce teamworking.
We decide to use the practice difficulty parameters obtained from the Rasch analysis as
weights of a count weighted measure that adds up each of the practices. With respect
to the raw count variable, which identify the number of practice adopted (”quantity”),
the weighted one should capture, more properly, the progression of the reorganization
process, accounting more weight to the practices more advanced along the reorganiza-
tion path. It is not clear, a priori, if the firm’s performance is linearly linked to the
progression of the reorganization process or if the relation is non-linear involving an
initial decrease, in correspondence, for example, with the initial expenses and a still
insufficient complementary bundle of practices.
We estimate an equation like (1) where Z is now a vector including the count of the
30We ran Hausman specification test to investigate whether the difficulty parameters are the samefor the “the most innovative” firms and the “least innovative” firms, distinguished via their totalnumber of practices. By comparing the theta estimates obtained from the full sample with the thetaestimates obtained from the “most innovative” firms, i.e. those adopting more than two practices or“least innovative” firms, i.e. those adopting less than two practices, we conclude that the difficulty ofitems does not differ across the sub-samples. Results are available on request from the authors.
26

practices, the linear measure of the progression of the reorganization progression (the
weighted count described above) and its squared term. Results are presented in Table
??.
VA rises linearly with the progression of the reorganization in the Italian sample but
in the British sample the relation is non linear. In particular for the whole sample of
British establishments, the reorganization process initially lowers VA and starts exert-
ing a positive impact for values of the indicator grater than 2.9 ..SAY MORE HERE
FROM THE DISTRIBUTION OF THE INDICATOR: A QUALE PERCENTILE
CORRISPONDE???....The results for the subsample of establishments with more than
50 employees show a similar non linearity but are less reliable both in terms of the vari-
ance explained and because of the large upward bias of the coefficient of employment.
8 Conclusions
Using data from the 2004 Workplace Employee Relations Survey on British establish-
ments and two comparable surveys on manufacturing firms located in the North of
Italy, this paper contrasts the adoption of workplace practices in the manufacturing
private sectors of the two countries and looks at the impact of new workplace practices
on objective measures of financial performance. Our main results are summarizable in
the following points: (i) the average incidence of the innovation practices in the Italian
and British sample is very similar; on average each firm has adopted two innovative
practices; the main difference between the two countries is in terms of the compo-
sition of the set of workplace practices. Italian firms privilege functional flexibility
(job rotation), information sharing and meetings while British firms have opened to
teamworking, human relation training and employees’ financial participation. (ii) Re-
gardless the different diffusion, the statistical associations between practices and the
firm’s performance shows some features that are robust across countries: functional
27

flexibility is positively related to VA, TFP and to a relative performance measure; hu-
man relation training is negatively related to any of the (contemporaneous) measures
of firm performance. On the contrary, the effect of financial participation is positive
and significant only in the British sample and the effect of teamworking is positive
and significant only in the Italian sample. (iii) Could the Italian firms operate in the
British context, their TFP would rise by 8%, on average; were they given the same
endowments of the British establishments, in terms of skills, industrial relations and
workplace practices, their TFP would raise, on average by 5%. (iv) When regarded as
parts of a whole reorganization process, workplace practices can be used to measure
the progression of such reorganization. Borrowing from psicometry, we attempted to
’measure’ the progression of the reorganization process, separately for the Italian and
the British sample, by using the Rasch approach. We find that as reorganization ad-
vances, the performance of the Italian firms improves linearly whereas the relationship
between reorganization and firms’ performance is non linear in the British sample; in
this case the reorganization improves performance once it has progressed sufficiently
but not at its initial stage.
28
A Appendix: Questions used to defined workplace
practices in the Italian and WERS 2004 survey
1. Team working (Italy): 1) ”What proportion of employees work in groups (teams,
project teams, continuous improvement teams, etc.) formally set up? All (100%);
Almost all (80-90%); Most (60-79%); About half (40-59%); Few (1-19%); None
(0%)”; 2) ”The team members decide together how to do the work? Yes; No”;
2. Team working (WERS): 1) ”What proportion, if any, of the largest occupational
group at this workplace work in formally designated teams? All (100%); Almost
all (80-90%); Most (60-79%); About half (40-59%); Few (1-19%); None (0%)”;
2)”Which, if any, of the following statements apply to the way that team working
operates among at this workplace.... team members jointly decide how the work
is to be done? Yes; No”;
3. Functional flexibility (Italy): 1) Employees are frequently requested to carry out
tasks different from their official duty? Mostly agree; agree; neither agree nor
disagree; disagree; mostly disagree”;
4. Functional flexibility (WERS): 1) What proportion of largest occupational group
actually do jobs other than their own at least once a week? All (100%); Almost
all (80-90%); Most (60-79%); About half (40-59%); Few (1-19%); None (0%)”;
5. Meetings (Italy): 1) ”Do you have meetings between senior managers and the
employees? Yes, No”; 2) ”During meetings of heads with their collaborators,
what proportion of time is dedicated to questions raised or suggestions made by
collaborators? None; A small part; up to 25%, More than 25%”;
6. Meetings (WERS): 1) ”Do you have meetings between senior managers and the
whole workforce (either altogether or group by group)? Yes; No”; 2) ”On average,
29
what proportion of the time at the meetings is usually available for questions from
employees, or for employees to offer their views? None; A small part; up to 25%,
More than 25%”
7. Information disclosure (Italy): 1) ”Does the top management regularly provides
information to employees on investment programmes? Yes; No”; 2) ”Does the
top management regularly provides information to employees on economic per-
formance of the company? Yes; No”;
8. Information disclosure (WERS): 1) ”Does management regularly give employees,
or their representatives, any information about internal investment plans? Yes;
No”; 2) ”Does management regularly give employees, or their representatives,
any information about the financial position of the establishment? Yes; No”;
9. Human relations training (Italy): 1) ”In the last 12 months have experienced
members of the largest occupational received off the job training covering team
work, interpersonal relationships and communication or problem solving meth-
ods? Yes; No”;
10. Human relations training (Italy): 1) ”In the last 12 months have experienced
members of the largest occupational received off the job training covering team-
working, communication skills or problem solving methods? Yes; No”;
11. Financial participation (Italy): 1) ”What is the share of employees who are
subject periodically to formal evaluation?all (100%); Almost all (80-90%) Most
(60-79%); About half (40-59%); Few (1-19%); None (0%); 2) ”Is the objective of
evaluation to determine wage increases or premiums? Yes; No”
12. Financial participation (Italy): 1) ”What proportion of non-managerial employ-
ees at this workplace are eligible for the employee share ownership scheme(s)? all
(100%); Almost all (80-90%) Most (60-79%); About half (40-59%); Few (1-19%);
30

None (0%); 2) ”What proportion of non-managerial employees at this workplace
receive profit or performance related pay? all (100%); Almost all (80-90%) Most
(60-79%); About half (40-59%); Few (1-19%); None (0%)”
31

References
[1] Addison J., Belfield C. (2000), “The Impact of Financial Participation and Em-
ployee Involvement on Financial Performance: a Re-Estimation Using the 1998
WERS”, Scottish Journal of Political Economy, n.5.
[2] Arthur J. (1992), “The Link between Business Strategy and Industrial Relations
Systems in American Steel Minimills”, Industrial and Labour Relations Review,
45(3), 488-506.
[3] Arthur J. (1994), “Effects of Human Resources Systems on Manufacturing Perfor-
mance and Turnover”, Academy of Management Journal, 37, 670-87.
[4] Bailey T. (1993) , ”Organisational Innovation in the Apperel Industry”, Industrial
Relations, 32(1), 30-48.
[5] Bartel A. (1989), ”Formal Employee Training Programs and Their Impact on
Labor Productivity: Evidence from a Human Resource Survey”, NBER working
paper no.3026.
[6] Batt R. (1995), ”Performance and Welfare Effects of Work Restructuring: Evi-
dence from Telecomunications Services”, unpublished doctoral dissertation, MIT
Sloan School of Management.
[7] Berg P., Appelbaum E., Bailey T., Kalleberg A., ”The Performance Effects of
Modular Production in the Apparel Industry”, Industrial Relations 35(3), 356-
373.
[8] Bertola, G. (1990). “Job Security, Employment, and Wages,” European Economic
Review, 54(4): 851-79.
[9] Black S. and Lynch L., (2000), “What’s driving the New Economy: The Benefits
of Workplace Innovation”, NBER Working Paper Series, n. 7479, January.
32
[10] Black S. and Lynch L. (2001), “How to Compete: the Impact of Workplace Prac-
tices and Information Technology on Productivity”, The Review of Economics and
Statistics, 83(3), 434-445.
[11] Bryson A., Forth J., Kirby S., (2005), “High-involvement management practices,
trade union, representation and workplace performance in Britain”, Scottish Jour-
nal of Political Economy, Vol. 52, no 3, July 2005.
[12] Cainelli G., Fabbri R., Pini P. (1999), ”Partecipazione all’impresa e flessibilita
retributiva in sistemi locali”, Milano, F. Angeli.
[13] Caroli E., Van Reenen J. (2001), “Skills and organisational change: evidence from
British and French establishment in the 1980s and 1990s”, The Quarterly Journal
of Economics, Vol. 116, No. 4., pp. 1449-1492.
[14] Cristini A., Gaj A., Labory S., Leoni R. (2003), ”Flat Hierarchical Structure,
Bundles of New Work Practices and Firm Performance”, Rivista Italiana Degli
Economisti, 2, 313-341.
[15] Cucculelli M., Micucci G. (2008), ”Family succession and firm performance: Evi-
dence from Italian family firms”, Temi di discussione n. 680, June, Bank of Italy.
[16] Djankov S., La Porta R., Lopez-de-Silanes F and Shleifer A. 2002. “The Regulation
of Entry,” Quarterly Journal of Economics, 117(1): 1-37
[17] Delaney J. and Huselid M. ”The Impact of Human Resource Management Prac-
tices on Perceptions of Performance in For-Profit and Nonprofit Organisations”
Academy of Management Journal.
[18] Dunlop J. and Weil D. (1996), ”Diffusion and Performance of Modular Production
in the U.S. Apparel Industry”, Industrial Relations, 35, 334-354.
33
[19] Forth J. and Millward N. (2004), ”High Involvement Management and Pay in
Britain”, Industrial Relations, 43 (1), 98-119.
[20] Freeman R., Kleiner M. and Ostroff C. (2000), ”The Anatomy of Employee In-
volvement and its Effects of Firms and Workers”, NBER Working Paper, n.8050.
[21] Guest D. and Hoque K. (1994), ”The Good, the Bad and the Ugly: Employment
Relations in New Non-Union Workplaces”, 5 (1), 1-14, Human Resource Manage-
ment Journal.
[22] Greenan N. and Mairesse J. (1999), “Organisational Change in French Manufac-
turing: what do we learn from firm representatives and from their employees?”,
NBER Working Paper n. 7287.
[23] Hoque K. (1999), ”Human Resource Management and Performance in the UK
Hotel Industry”, British Journal of Industrial Relations, 37 (3), 419-443.
[24] Huselid M. A. (1995), ”The impact of Human Resource Management Practices
on Turnover, Productivity and Corporate Financial Performance”, Academy of
Management Journal 38(3), 635-672.
[25] Huselid M. and Becker B. ”High Performance Work Systems and the Firm Perfor-
mance: Cross-Sectional Versus Panel Results”, Industrial Relations, 35(3), 400-
422.
[26] Huselid M., Jackson, S. and Schuler, R. (1997), ”Technical and Strategic Hu-
man Resource Management Effectiveness as Determinants of Firm Performance”,
Academy of Management Journal, 40, 171-88.
[27] Ichniowski C. (1990), ”Human Resource Management Systems and The Perfor-
mance of U.S. Manufactoring Businesses” NBER working paper no. 3449.
34

[28] Ichniowski C. (1992), ”Human Resource Practices and Productive Labor-
Management Relations” (pp.239-271), in D. Lewin, O. Mitchell, and P. Sherer
(Eds.), Research Frontiers in Industrial Relations and Human Resources (Ithaca,
NY: ILR Press, Cornell University Press).
[29] Ichniowski C., Shaw K., Prennushi G., (1997), “The Effects of HRM Systems on
Productivity: A Study of Steel Finishing Lines”, American Economic Review, 87,
291-313.
[30] Lazear, E. (1990). “Job Security Provisions and Employment,” Quarterly Journal
of Economics, 105(3): 699-726.
[31] Leoni R., Cristini A., Mazzoni N., Labory S. (2000), “Disegni Organizzativi, Stili
di Management e Performance d’Impresa. Risultati di un’indagine in un campione
di imprese industriali’, Monografie e Rapporti di ricerca”, Dipartimento di Scienze
Economiche, Universita degli Studi di Bergamo, n.1.
[32] Milgrom P. and Roberts J. (1995), “Complementaries and Firms: Strategy, Struc-
ture and Organisational Change in Manufacturing”, Journal of Accounting and
Economics, 19, 179-208.
[33] Millward, N., A. Bryson and J. Forth, (2000), All Change at Work? London:
Routledge. Ministry of Labour (1994), Yearbook of Labour Statistics, Tokyo.
[34] Nicoletti, G., Scarpetta S. and Boylaud O. (2000. “Summary Indicators of Product
Market Regulation with an Extension to Employment Protection Legislation,”
OECD Economics Department WorkingPapers No. 226.
[35] Osterman P. (1994), “How common is workplace transformation and who adopts
it?”, Industrial and Labor review, 47(2), 173-88.
35

[36] Patterson, M., West, M., Lawthorn, R. and Nickell, S. (1997), ”Impact of People
Management Practices on Business Performance”, Issues in People Management
No.22, London: Institute of Personnel and Development.
[37] Purdon S. and Pickering K. (2001), ”The Use of Sampling Weights in the Analysis
of the 1998 Workplace Employee Relations Survey. London: National Centre for
Social Research.
[38] Kelley M. (1994), ”Information Technology and Productivity: The Elusive Con-
nection” Management Science”, 40(3), 1406-1425.
[39] Kelley M. (1996), ”Partecipative Bureaucracy and Productivity in the Machined
Products Sector”, Industrial Relations, 35, 374-399.
[40] Krafcik J. (1988), ”Triumph of the Lean Production System”, Sloan Management
Review 30(1), 41-52.
[41] Womack J., Jones D., Roos D., ”The Machine That Changed the World”, New
York: Rawson/Macmillan, 1991.
[42] Wood S. and De Menezes L. (1998), ”High Commitment Management in the UK:
Evidence from the Workplace Industrial Relation Survey and Employers Man-
power and Skills Practices Survey”, Human Relations, 51(4) , pp.485-515.
36
0.511.5
1.5
22.
53
3.5
dens
ity ita
dens
ity uk
0.511.5
1.5
22.
53
3.5
fitted
tfp i
taly
dens
ity ita
dens
ity ita
if br
itish f
irms c
hara
cteris
tics
0.511.5
1.5
22.
53
3.5
fitted
tfp i
taly
dens
ity ita
dens
ity ita
in th
e br
itish c
ontex
t
Fig
ure
1:K
ernel
den
sity
ofth
epre
dic
ted
TF
Pfo
rIt
alia
nan
dB
riti
shfirm
san
dth
eir
counte
rfac
tual
s.
37

Tab
le1:
Dis
trib
uti
onby
size
and
sect
orof
firm
slo
cate
din
the
pro
vin
ces
ofB
erga
mo
and
Bre
scia
:20
01C
ensu
sve
rsussa
mpl
e.
Food
Tex
tile
Wood
-Pap
Ch
emic
als
Met
al-
Mach
Oth
erC
lass
size
tota
l
50-9
9
nr.
firm
s22
271
729
083
8318
16
50
17
573
50
per
cent
54,3
30,3
row
per
cent
3,8
4,0
12,4
14,0
5,1
0,0
14,5
16,0
55,5
32,0
8,7
34,0
100,0
100,0
100-1
99
nr.
firm
s7
051
11
12
237
5130
18
34
12
271
48
per
cent
25,7
29,1
row
per
cent
2,6
0,0
18,8
22,9
4,4
4,2
13,7
10,4
48,0
37,5
12,5
25,0
100,0
100,0
200-2
49
nr.
firm
s3
08
31
14
025
46
547
13
per
cent
4,5
7,9
row
per
cent
6,4
0,0
17,0
23,1
2,1
7,7
8,5
0,0
53,2
30,8
12,8
38,5
100,0
100,0
250-4
99
nr.
firm
s3
013
13
07
347
14
99
82
27
per
cent
7,8
16,4
row
per
cent
3,7
0,0
15,9
3,7
3,7
0,0
8,5
11,1
57,3
51,9
11,0
33,3
100,0
100,0
≥500
nr.
firm
s0
113
24
08
48
11
50
583
23
per
cent
7,9
13,9
row
per
cent
0,0
4,3
15,7
8,7
4,8
0,0
9,6
17,4
9,6
47,8
60,2
21,7
100,0
100,0
Secto
rto
tal
nr.
firm
s35
3156
23
49
3139
20
528
64
149
51
1056
165
per
cent
3,3
1,8
14,8
13,9
4,6
1,8
13,2
12,1
50,0
38,8
14,1
30,9
100,0
100,0
38
Table 2: Distribution by size and sector of British establishments in the sample.
Food Textile Wood-Pap Chemicals Metal-Mach Other Size class total
0-49
nr.est 3 2 6 3 4 21 39percent 25.32row percent 7.69 5.13 15.38 7.69 10.26 53.85 100.00
50-99
nr.est 2 0 3 5 3 7 20percent 12.99row percent 10.00 0.00 15.00 25.00 15.00 35.00 100.00
100-199
nr.est 6 1 2 8 2 12 31percent 20.13row percent 19.35 3.23 6.45 25.81 6.45 38.71 100.00
200-249
nr.est 2 0 1 0 0 2 5percent 3.25row percent 40.00 0.00 20.00 0.00 0.00 40.00 100.00
250-499
nr.est 5 2 4 5 1 12 29percent 18.83row percent 17.24 6.90 13.79 17.24 3.45 41.38 100.00
≥ 500
nr.est 5 0 3 2 3 17 30percent 19.48row percent 16.67 0.00 10.00 6.67 10.00 56.67 100.00
Sector total
nr.est 23 5 19 23 13 71 154percent 14.94 3.25 12.34 14.94 8.44 46.10 100.00
Notes: Source, Workplace Relations Survey 2004.
39
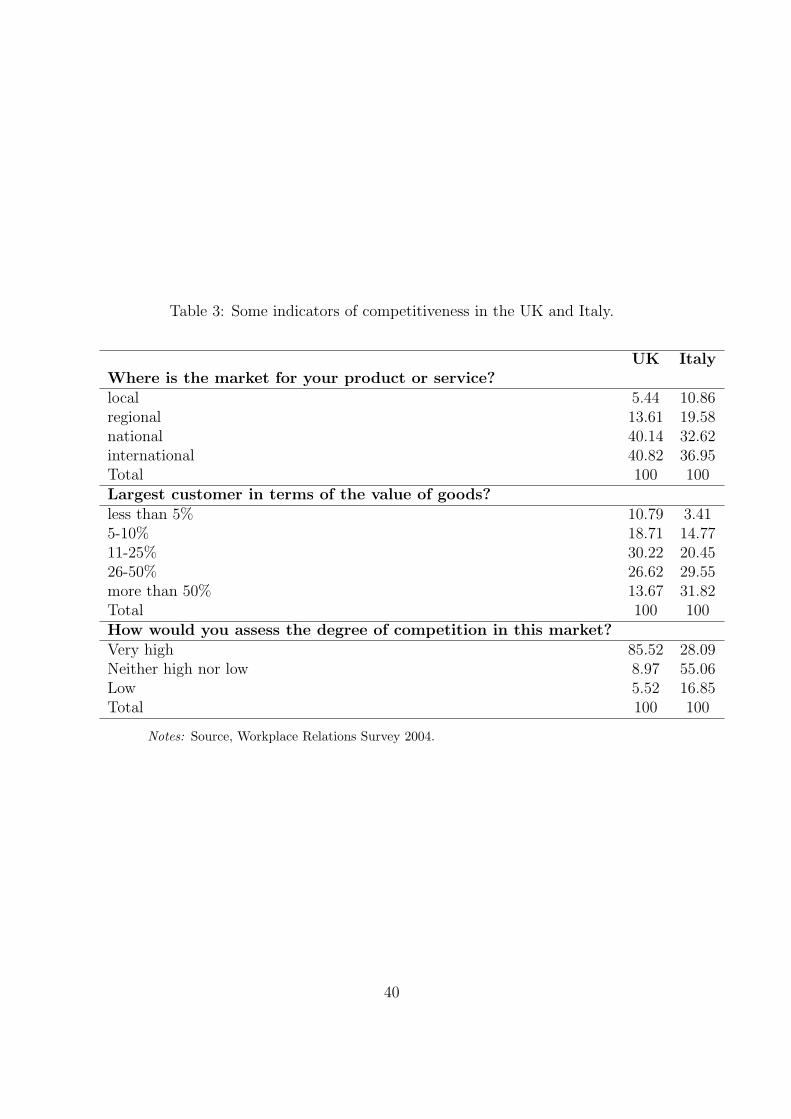
Table 3: Some indicators of competitiveness in the UK and Italy.
UK ItalyWhere is the market for your product or service?local 5.44 10.86regional 13.61 19.58national 40.14 32.62international 40.82 36.95Total 100 100Largest customer in terms of the value of goods?less than 5% 10.79 3.415-10% 18.71 14.7711-25% 30.22 20.4526-50% 26.62 29.55more than 50% 13.67 31.82Total 100 100How would you assess the degree of competition in this market?Very high 85.52 28.09Neither high nor low 8.97 55.06Low 5.52 16.85Total 100 100
Notes: Source, Workplace Relations Survey 2004.
40

Tab
le4:
Sum
mar
yst
atis
tics
:It
aly
and
Bri
tain
.
Italy
Bri
tain
all
Bri
tain≥
50
Vari
ab
les:
ob
sm
ean
s.d
.m
inm
ax
ob
sm
ean
s.d
.m
inm
ax
ob
sm
ean
s.d
.m
inm
ax
Ave
rage
nr.
emp
loye
es16
131
8.0
600.
721
.043
42.8
126
460.
673
6.3
4.4
4467
102
563.
178
4.3
50.4
4467
Val
ue
add
ed∗
145
3315
4.8
1549
27.3
40.9
1791
044.
011
2647
545.
311
8759
.520
072
9306
.210
254
843.
812
6101
.310
96.3
7293
06.2
Sal
es∗
147
1087
58.3
4009
17.8
0.0
4284
702.
012
612
5354
.435
3468
.445
0.7
3112
593.
010
215
0702
.138
7243
.723
75.4
3112
593.
0
Cap
ital∗
145
4062
5.1
2384
80.4
0.0
2832
450.
013
130
055.
9979
182.
25.
875
9182
.611
234
655.
684
784.
653
.675
9182
.6
Val
ue
add
edp
erem
plo
yee∗
141
67.0
73.1
0.3
635.
112
579
.213
6.3
7.8
1307
.210
285
.414
9.3
7.8
1307
.2
Hig
hsk
ill
du
mm
y16
50.
210.
410
115
40.
250.
440
113
00.
260.
440
1
Su
bje
ctiv
ela
bp
rod
141
2.40
0.78
14
122
2.38
0.80
14
Not
es:
Sour
ce,
Wor
kpla
ceR
elat
ions
Surv
ey20
04an
dIt
alia
nsa
mpl
e,20
03.
*N
omin
alva
lues
inth
ousa
nds
ofeu
ros
41
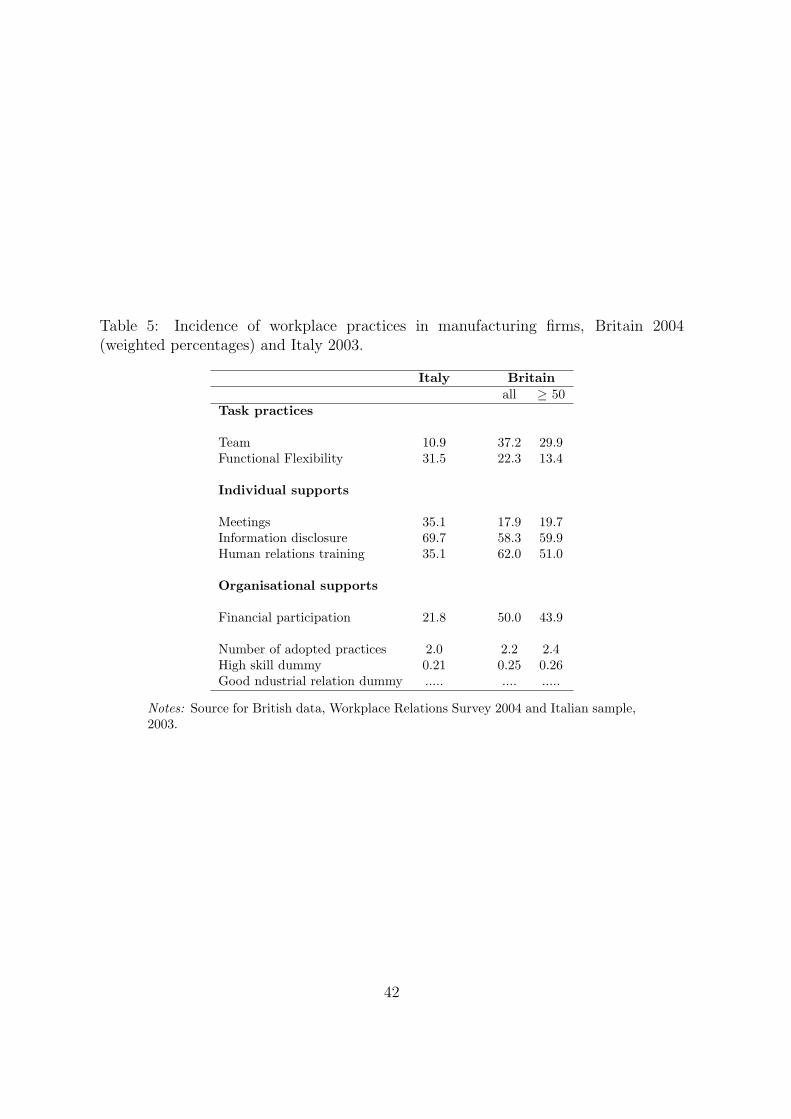
Table 5: Incidence of workplace practices in manufacturing firms, Britain 2004(weighted percentages) and Italy 2003.
Italy Britainall ≥ 50
Task practices
Team 10.9 37.2 29.9Functional Flexibility 31.5 22.3 13.4
Individual supports
Meetings 35.1 17.9 19.7Information disclosure 69.7 58.3 59.9Human relations training 35.1 62.0 51.0
Organisational supports
Financial participation 21.8 50.0 43.9
Number of adopted practices 2.0 2.2 2.4High skill dummy 0.21 0.25 0.26Good ndustrial relation dummy ..... .... .....
Notes: Source for British data, Workplace Relations Survey 2004 and Italian sample,2003.
42

Table 6: Correlation matrix for workplace practices, Britain 2004 and Italy 2003.
Italy1 2 3 4 5 6
Information disclosure 1Functional flexibility -0.092* 1Meetings 0.099* -0.035 1Human relations training 0.184* -0.092* 0.067* 1Financial participation -0.0005 0.081* -0.023 -0.146* 1Team working 0.188* -0.028 -0.013 0.189* -0.092* 1
Britain all1 2 3 4 5 6
Information disclosure 1functionalf -0.098* 1Meetings -0.011 0.099* 1Human relations training 0.170* 0.014 0.176* 1Financial participation 0.180* -0.130* -0.066* 0.158* 1Team working 0.044 0.154* 0.121* 0.133* -0.103* 1
Britain ≥ 501 2 3 4 5 6
Information disclosure 1functionalf -0.091* 1Meetings -0.044 0.085* 1Human relations training 0.128* 0.082* 0.254* 1Financial participation 0.220* -0.061* -0.006 0.096* 1Team working 0.053 0.099* 0.073* 0.175* -0.084* 1
Notes: ** Statistically significant at 0.05 level. Source for British data, WorkplaceRelations Survey 2004.
43

Tab
le7:
The
effec
tsof
wor
kpla
cepra
ctic
eson
firm
per
form
ance
.
Italy
Bri
tain
all
Bri
tain≥
50
Mod
el1
Mod
el2
Mod
el1
Mod
el2
Mod
el1
Mod
el2
lnK
0.35
***
0.20
***
0.15
**(0
.02)
(0.0
5)(0
.07)
lnN
0.67
***
0.95
***
1.08
***
(0.0
9)(0
.10)
(0.1
5)H
igh
skille
d0.
050.
080.
170.
25**
–0.1
2–0
.05
(0.1
2)(0
.11)
(0.1
3)(0
.12)
(0.2
3)(0
.22)
Tea
m0.
25**
0.29
**–0
.09
–0.1
5–0
.12
–0.0
8(0
.11)
(0.1
3)(0
.14)
(0.1
4)(0
.19)
(0.2
0)F
unct
ional
flex
ibilit
y0.
19**
0.25
***
0.41
***
0.37
**–0
.29
–0.2
2(0
.08)
(0.0
9)(0
.14)
(0.1
5)(0
.30)
(0.3
1)M
eeti
ngs
0.03
0.07
–0.3
6*–0
.56*
*–0
.11
–0.2
8(0
.10)
(0.1
0)(0
.18)
(0.2
2)(0
.22)
(0.2
5)In
form
atio
ndis
clos
ure
–0.0
3–0
.05
0.17
0.22
0.32
0.34
(0.1
1)(0
.10)
(0.2
2)(0
.22)
(0.3
6)(0
.34)
Hum
anre
lati
ons
trai
nin
g–0
.16*
–0.2
5**
–0.3
7**
–0.3
1**
–0.3
5–0
.37
(0.0
9)(0
.11)
(0.1
4)(0
.13)
(0.2
1)(0
.22)
Fin
anci
alpar
tici
pat
ion
0.00
4–0
.13
0.43
***
0.39
**0.
32*
0.23
(0.1
0)(0
.14)
(0.1
5)(0
.16)
(0.1
9)(0
.20)
Indust
rial
rela
tion
s0.
050.
100.
210.
36**
–0.1
8–0
.16
(0.0
9)(0
.11)
(0.1
7)(0
.17)
(0.2
4)(0
.25)
Rsq
.0.
950.
290.
920.
480.
730.
31N
132
132
113
113
8989
Not
es:
For
the
Ital
ian
sam
ple:
i)al
lre
gres
sion
sin
clud
ein
dust
rydu
mm
ies
and
adu
mm
yva
riab
lere
late
dto
whe
ther
the
firm
isa
mon
o-pl
ant
one;
ii)es
tim
ates
are
obta
ined
usin
gw
eigh
ted
leas
tsq
uare
s,th
ew
eigh
tsbe
ing
the
inve
rse
ofth
efir
msi
ze,d
efine
dby
the
num
ber
ofem
ploy
ees;
iv)
hete
rosc
heda
stic
cons
iste
ntst
anda
rder
rors
.Fo
rth
eB
riti
shsa
mpl
es:
i)al
lre
gres
sion
sin
clud
ein
dust
ry,r
egio
nald
umm
ies
adu
mm
yre
late
dto
whe
ther
the
acco
unti
ngda
taw
ere
prov
ided
atsi
tele
vel;
ii)es
tim
ates
take
acco
unt
ofth
eco
mpl
exsa
mpl
ede
sign
.*S
tati
stic
ally
sign
ifica
ntat
the
.10
leve
l,**
atth
e.0
5le
vel,
***a
tth
e.0
1le
vel.
Mod
el1:
depe
nden
tva
riab
leis
the
log
ofva
lue
adde
d;M
odel
2:de
pend
ent
vari
able
isth
elo
gof
tota
lfa
ctor
prod
ucti
vity
.
44

Tab
le8:
The
effec
tsof
the
wor
kpla
cepra
ctic
eson
rela
tive
firm
pro
duct
ivit
yco
mpar
edw
ith
other
firm
sin
the
sam
ein
dust
ry.
Italy
Bri
tain
all
Bri
tain≥
50
Mod
el1
Mod
el2
Mod
el1
Mod
el2
Mod
el3
Mod
el1
Mod
el2
Mod
el3
Hig
hsk
ille
d–0
.05
0.18
0.83
**0.
210.
67*
0.36
–0.4
60.
02(0
.33)
(0.3
4)(0
.40)
(0.4
5)(0
.34)
(0.5
0)(0
.45)
(0.3
5)T
eam
0.44
*0.
22–0
.37
–0.3
00.
13–0
.05
–0.0
30.
20(0
.23)
(0.3
7)(0
.38)
(0.4
3)(0
.42)
(0.3
6)(0
.39)
(0.3
3)F
unct
ional
flex
ibilit
y0.
41*
0.39
*1.
55**
*2.
31**
*–0
.64
–0.0
60.
251.
10(0
.23)
(0.2
2)(0
.41)
(0.4
3)(0
.58)
(0.6
2)(0
.65)
(0.7
2)M
eeti
ngs
0.29
0.21
–0.9
7*–0
.09
–0.2
9–0
.59
0.25
–1.1
4**
(0.2
6)(0
.27)
(0.5
0)(0
.36)
(0.4
5)(0
.50)
(0.3
8)(0
.53)
Info
rmat
ion
dis
clos
ure
0.00
0.03
0.60
0.25
–0.6
9*0.
640.
76–0
.23
(0.2
9)(0
.30)
(0.4
7)(0
.48)
(0.3
5)(0
.62)
(0.5
4)(0
.39)
Hum
anre
lati
ons
trai
nin
g–0
.50*
–0.4
8*–0
.97*
*–0
.48
–0.2
2–0
.74*
–0.3
0–0
.36
(0.2
9)(0
.27)
(0.3
9)(0
.37)
(0.3
7)(0
.39)
(0.4
1)(0
.43)
Fin
anci
alpar
tici
pat
ion
–0.2
7–0
.19
1.02
***
1.62
***
–0.3
41.
07**
*0.
70**
0.74
**(0
.26)
(0.2
9)(0
.38)
(0.4
1)(0
.34)
(0.3
3)(0
.32)
(0.3
3)In
dust
rial
rela
tion
s0.
120.
010.
83**
–0.3
90.
67–0
.27
–0.4
5–0
.42
(0.2
6)(0
.28)
(0.3
6)(0
.44)
(0.4
6)(0
.38)
(0.4
0)(0
.33)
N13
213
211
311
310
289
8982
Not
es:
For
the
Ital
ian
sam
ple:
i)al
lre
gres
sion
sin
clud
ein
dust
rydu
mm
ies
and
adu
mm
yva
riab
lere
late
dto
whe
ther
the
firm
isa
mon
o-pl
ant
one;
ii)es
tim
ates
are
obta
ined
usin
gw
eigh
ted
leas
tsq
uare
s,th
ew
eigh
tsbe
ing
the
inve
rse
ofth
efir
msi
ze,d
efine
dby
the
num
ber
ofem
ploy
ees;
iv)
hete
rosc
heda
stic
cons
iste
ntst
anda
rder
rors
.Fo
rth
eB
riti
shsa
mpl
es:
i)al
lre
gres
sion
sin
clud
ein
dust
ry,
regi
onal
dum
mie
sa
dum
my
rela
ted
tow
heth
erth
eac
coun
ting
data
wer
epr
ovid
edat
site
leve
l;ii)
esti
mat
esta
keac
coun
tof
the
com
plex
sam
ple
desi
gn.
*Sta
tist
ical
lysi
gnifi
cant
atth
e.1
0le
vel,
**at
the
.05
leve
l,**
*at
the
.01
leve
l.M
odel
1:de
pend
ent
vari
able
isth
ere
lati
veva
lue
adde
dpe
rhe
ad;M
odel
2:de
pend
ent
vari
able
isth
ere
lati
vesa
les
per
head
;Mod
el3:
sub
ject
ive
prod
ucti
vity
.
45

Table 9: Rasch model results: conditional fixed and random effects estimates. Sampleof Italian firms.
ItalyFixed effects Random effectsCoeff P-value Coeff P-value
Practice difficulty parameterTheta1 - - -0.88 0.00Theta2 1.56 0.00 0.62 0.00Theta3 1.51 0.00 0.57 0.001Theta4 1.75 0.00 0.82 0.00Theta5 2.16 0.00 1.23 0.00Theta6 3.04 0.00 2.13 0.00
Britain allFixed effects Random effectsCoeff P-value Coeff P-value
Practice difficulty parameterTheta1 - - -0.04 0.81Theta2 -0.38 0.103 -0.43 0.01Theta3 0.31 0.199 0.26 0.13Theta4 0.95 0.00 0.91 0.00Theta5 2.02 0.00 1.97 0.00Theta6 1.53 0.00 1.49 0.00
Britain ≥ 50Fixed effects Random effectsCoeff P-value Coeff P-value
Practice difficulty parameterTheta1 - - -0.94 0.00Theta2 0.46 0.10 -0.48 0.01Theta3 0.93 0.00 -0.02 0.93Theta4 1.93 0.00 0.99 0.00Theta5 2.46 0.00 1.52 0.00Theta6 3.32 0.00 2.39 0.00
Notes: In the Italian sample, Theta1 corresponds to information disclosure, Theta2to meetings, Theta3 to human relations training, Theta4 to functional flexibility,Theta5 to financial participation, Theta6 to team. For Britain, all sample: Theta 1corresponds to human relations training, Theta 2 to information disclosure, Theta 3 tofinancial participation, Theta 4 to teamworking, Theta 5 to functional flexibility andTheta 5 to meetings. For the British establishments with more than 50 employees,Theta1 corresponds to information disclosure, Theta2 to human relations training,Theta3 to financial participation, Theta4 to team, Theta5 to meetings, Theta6 tofunctional flexibility. Source for British data, Workplace Relations Survey 2004.
46

Tab
le10
:T
he
effec
tsof
the
qual
ity
and
the
quan
tity
ofpra
ctic
esad
opte
don
firm
per
form
ance
.
Italy
Bri
tain
all
Bri
tain≥
50
Mod
el1
Mod
el2
Mod
el3
Mod
el1
Mod
el2
Mod
el3
Mod
el1
Mod
el2
Mod
el3
lnK
0.37
***
0.36
***
0.36
***
0.14
***
0.16
***
0.15
***
0.15
*0.
150.
14*
(0.0
2)(0
.02)
(0.0
2)(0
.05)
(0.0
5)(0
.05)
(0.0
9)(0
.09)
(0.0
8)ln
N0.
67**
*0.
68**
*0.
68**
*0.
96**
*0.
93**
*0.
95**
*1.
07**
*1.
04**
*1.
07**
*(0
.10)
(0.0
9)(0
.10)
(0.1
2)(0
.11)
(0.1
1)(0
.18)
(0.1
7)(0
.15)
Hig
hsk
ille
d0.
080.
050.
070.
070.
040.
07–0
.08
–0.1
5–0
.14
(0.1
2)(0
.12)
(0.1
2)(0
.15)
(0.1
5)(0
.16)
(0.2
4)(0
.24)
(0.2
4)N
um
ber
ofp
ract
ices
–0.1
3–0
.10
–0.0
40.
01–0
.02
–0.1
00.
140.
170.
41**
(0.1
0)(0
.10)
(0.1
3)(0
.10)
(0.1
0)(0
.09)
(0.1
7)(0
.17)
(0.1
7)Q
ual
ity
ofw
orkp
lace
inn
ovat
ion
0.11
**0.
10*
0.08
–0.0
1–0
.29*
*–0
.00
–0.1
8**
–0.4
1**
–0.4
0***
(0.0
4)(0
.04)
(0.0
7)(0
.07)
(0.1
5)(0
.08)
(0.0
8)(0
.18)
(0.1
3)(Q
ual
ity
ofw
orkp
lace
inn
ovat
ion
)20.
010.
10**
0.04
*(0
.01)
(0.0
4)(0
.02)
Nu
mb
erof
pra
ctic
es*
Ind
ust
rial
rela
tion
s–0
.14
0.23
–0.5
4(0
.18)
(0.1
9)(0
.34)
Qu
alit
yof
wor
kp
lace
inn
ovat
ion
*In
dust
rial
rela
tion
s0.
03–0
.02
0.38
**(0
.11)
(0.1
5)(0
.17)
Ind
ust
rial
rela
tion
s0.
020.
040.
220.
280.
22–0
.20
–0.1
2–0
.11
0.34
(0.1
0)(0
.10)
(0.1
9)(0
.22)
(0.2
1)(0
.47)
(0.2
6)(0
.26)
(0.6
7)R
sq.
0.95
0.95
0.96
0.89
0.90
0.90
0.71
0.72
0.73
N13
213
213
211
311
311
389
8989
Not
es:
For
the
Ital
ian
sam
ple:
i)al
lre
gres
sion
sin
clud
ein
dust
rydu
mm
ies
and
adu
mm
yva
riab
lere
late
dto
whe
ther
the
firm
isa
mon
o-pl
ant
one;
ii)es
tim
ates
are
obta
ined
usin
gw
eigh
ted
leas
tsq
uare
s,th
ew
eigh
tsbe
ing
the
inve
rse
ofth
efir
msi
ze,
defin
edby
the
num
ber
ofem
ploy
ees;
iv)
hete
rosc
heda
stic
cons
iste
ntst
anda
rder
rors
.Fo
rth
eB
riti
shsa
mpl
es:
i)al
lre
gres
sion
sin
clud
ein
dust
ry,r
egio
nald
umm
ies
adu
mm
yre
late
dto
whe
ther
the
acco
unti
ngda
taw
ere
prov
ided
atsi
tele
vel;
ii)es
tim
ates
take
acco
unt
ofth
eco
mpl
exsa
mpl
ede
sign
.*S
tati
stic
ally
sign
ifica
ntat
the
.10
leve
l,**
atth
e.0
5le
vel,
***a
tth
e.0
1le
vel.
Mod
el1-
Mod
el3:
depe
nden
tva
riab
leis
the
log
ofva
lue
adde
d.
47

Table 11: Oaxaca decomposition of the average predicted value added and total factorproductivity.
Predicted Value Added
CoefficientsCharacteristics Italy BritainItaly 9.12 9.08Britain 9.8 9.37Oxaca decomposition1) Variable effect 0.282) Coefficient effect -0.033) Coefficient*Variable effect 0Total effect 0.25
Predicted Total Factor Productivity
CoefficientsCharacteristics Italy BritainItaly 2.53 2.61Britain 2.7 2.66
Oxaca decomposition1) Variable effect 0.052) Coefficient effect 0.083) Coefficient*Variable effect 0Total effect 0.13Oxaca decomposition for each variable: Variable effect Coefficient effectHigh skilled 0.01 0.03Team -0.06 -0.05Functional flexibility -0.06 0.12Meetings 0.09 -0.22Information disclosure -0.02 0.19Human relations training -0.06 -0.02Financial participation 0.10 0.12Industrial relations 0.05 0.20Other variables 0 -0.29Total 0.05 0.08
48