Embed Size (px)
Citation preview

Workload, Situation Awareness, and Teamwork
Office of Nuclear Regulatory Research
NUREG/CR-7190

NRC Reference Material
As of November 1999, you may electronically access NUREG-series publications and other NRC records at NRC’s Public Electronic Reading Room at http://www.nrc.gov/reading-rm.html. Publicly released records include, to name a few, NUREG-series publications; Federal Register notices; applicant, licensee, and vendor documents and correspondence; NRC correspondence and internal memoranda; bulletins and information notices; inspection and investigative reports; licensee event reports; and Commission papers and their attachments.
NRC publications in the NUREG series, NRC regulations, and Title 10, “Energy,” in the Code of Federal Regulations may also be purchased from one of these two sources. 1. The Superintendent of Documents
U.S. Government Printing Office Mail Stop SSOP Washington, DC 20402–0001 Internet: bookstore.gpo.gov Telephone: 202-512-1800 Fax: 202-512-2250
2. The National Technical Information Service Springfield, VA 22161–0002 www.ntis.gov 1–800–553–6847 or, locally, 703–605–6000
A single copy of each NRC draft report for comment is available free, to the extent of supply, upon written request as follows: Address: U.S. Nuclear Regulatory Commission
Office of Administration Publications Branch Washington, DC 20555-0001
E-mail: [email protected] Facsimile: 301–415–2289
Some publications in the NUREG series that are posted at NRC’s Web site address http://www.nrc.gov/reading-rm/doc-collections/nuregs are updated periodically and may differ from the last printed version. Although references to material found on a Web site bear the date the material was accessed, the material available on the date cited may subsequently be removed from the site.
Non-NRC Reference Material
Documents available from public and special technical libraries include all open literature items, such as books, journal articles, transactions, Federal Register notices, Federal and State legislation, and congressional reports. Such documents as theses, dissertations, foreign reports and translations, and non-NRC conference proceedings may be purchased from their sponsoring organization.
Copies of industry codes and standards used in a substantive manner in the NRC regulatory process are maintained at—
The NRC Technical Library Two White Flint North 11545 Rockville Pike Rockville, MD 20852–2738
These standards are available in the library for reference use by the public. Codes and standards are usually copyrighted and may be purchased from the originating organization or, if they are American National Standards, from—
American National Standards Institute 11 West 42nd Street New York, NY 10036–8002 www.ansi.org 212–642–4900
AVAILABILITY OF REFERENCE MATERIALS IN NRC PUBLICATIONS
Legally binding regulatory requirements are stated only in laws; NRC regulations; licenses, including technical specifications; or orders, not in NUREG-series publications. The views expressed in contractor-prepared publications in this series are not necessarily those of the NRC. The NUREG series comprises (1) technical and administrative reports and books prepared by the staff (NUREG–XXXX) or agency contractors (NUREG/CR–XXXX), (2) proceedings of conferences (NUREG/CP–XXXX), (3) reports resulting from international agreements (NUREG/IA–XXXX), (4) brochures (NUREG/BR–XXXX), and (5) compilations of legal decisions and orders of the Commission and Atomic and Safety Licensing Boards and of Directors’ decisions under Section 2.206 of NRC’s regulations (NUREG–0750). DISCLAIMER: This report was prepared as an account of work sponsored by an agency of the U.S. Government. Neither the U.S. Government nor any agency thereof, nor any employee, makes any warranty, expressed or implied, or assumes any legal liability or responsibility for any third party’s use, or the results of such use, of any information, apparatus, product, or process disclosed in this publication, or represents that its use by such third party would not infringe privately owned rights.
Workload, Situation Awareness, and Teamwork Manuscript Completed: March 2015 Date Published: March 2015 Prepared by: Lauren Reinerman-Jones, Svyatoslav Guznov, and James Tyson University of Central Florida Institute for Simulation and Training 3100 Technology Parkway Orlando, Florida 32726 Amy D’Agostino and Niav Hughes U.S. Nuclear Regulatory Commission Office of Nuclear Regulatory Research Washington, D.C. 20555-0001
NUREG/CR-7190


iii
ABSTRACT
Many of the twelve review elements contained in the NRC’s Human Factors Engineering Program Review Model, NUREG-0711, Rev. 3 (NRC, 2012) highlight the importance of workload (WL), situation awareness (SA) and teamwork (TW). The primary purpose of this NUREG/CR is to enhance NRC staff knowledge of the human performance metrics used to measure WL, SA, and TW, and, to provide a tool for evaluating the use of such metrics in applications (e.g., design certification) and proposed license amendments. This report summarizes the most widely used definitions and theories of each of the three constructs (i.e., WL, SA and TW) along with discussing factors that contribute to each. In addition, it describes the psychometric criteria used to evaluate metrics and specifically discusses the measurement and associated metrics of WL, SA and TW. This report also introduces a database of human performance metrics and a tool to assist NRC technical staff in evaluating their use in license applications and proposed amendments. The tool is available on the CD “Workload, Situation Awareness and Teamwork Generic Metrics Catalog (GMC) and Decision Making Wizard (DMW)” located in the back of this report. A user guide to instruct and train NRC technical staff (reviewers) on the organization, capabilities, and applications of the tool can be found in an appendix to this report. For those who are unfamiliar with the NRC’s Human Factors Engineering Program Review Model, an additional appendix includes a review of the NUREG-0711 general activities with an emphasis on the role that WL, SA, and TW measurement plays in the process.
NUREG/CR-7190 has been
reproduced from the best available copy.


v
TABLE OF CONTENTS ABSTRACT ..................................................................................................................... iii TABLE OF CONTENTS .................................................................................................. v LIST OF FIGURES ......................................................................................................... vii LIST OF TABLES ........................................................................................................... viii EXECUTIVE SUMMARY ................................................................................................. ix ABBREVIATIONS ........................................................................................................... xi 1 INTRODUCTION........................................................................................................ 1 1.1 Purpose and Scope ............................................................................................. 1 1.2 Workload ............................................................................................................. 1
1.2.1 Definitions and Theories of Workload ........................................................ 1 1.2.2 Factors that Contribute to Workload .......................................................... 3
1.3 Situation Awareness ........................................................................................... 5 1.3.1 Definitions and Theories of Situation Awareness ...................................... 5 1.3.2 Factors that Contribute to Situation Awareness ........................................ 6
1.4 Teamwork .......................................................................................................... 7 1.4.1 Definitions and Theories of Teamwork ..................................................... 7 1.4.2 Factors Contributing to Teamwork............................................................ 7 1.4.3 Related Team Constructs ......................................................................... 9
2 MEASUREMENT ...................................................................................................... 11 2.1 Psychometric Properties.................................................................................... 11
2.1.1 Validity .................................................................................................... 11 2.1.2 Reliability ................................................................................................. 13 2.1.3 Intrusiveness ........................................................................................... 13 2.1.4 Sensitivity ................................................................................................ 13 2.1.5 Diagnosticity ............................................................................................ 14 2.1.6 Additional Considerations ........................................................................ 14
2.2 Workload Measurement .................................................................................... 14 2.2.1 Subjective Metrics ................................................................................... 15 2.2.2 Performance Metrics ............................................................................... 16 2.2.3 Physiological Metrics ............................................................................... 16 2.2.4 Workload Metrics: Key Issues ................................................................. 17
2.3 Situation Awareness Measurement ................................................................... 17 2.3.1 Explicit Metrics ........................................................................................ 17 2.3.2 Implicit Metrics ........................................................................................ 18 2.3.3 Subjective Metrics ................................................................................... 19 2.3.4 Situation Awareness Metrics: Key Issues ................................................ 19

vi
2.4 Teamwork Measurement .................................................................................. 19 2.4.1 Measurement of Constructs Related to Teamwork ................................. 20 2.4.2 Teamwork Metrics: Key Issues ............................................................... 20
3 GENERIC METRICS CATALOG AND DECISION MAKING WIZARD ..................... 21 3.1 Generic Metrics Catalog: Overview ................................................................... 21
3.1.1 Detailed Description of Generic Metrics Catalog ..................................... 21 3.2 Decision Making Wizard: Overview ................................................................... 24
3.2.1 Detailed Description of the Decision Making Wizard ............................... 24 3.2.2 Decision Making Wizard Decision Logic .................................................. 25
4 REFERENCES ......................................................................................................... 29 APPENDIX A - Generic Metrics Catalog and Decision Making Wizard User Guide . A-1 APPENDIX B - Workload, Situation Awareness, and Teamwork in NUREG-0711 .... B-1
vii
LIST OF FIGURES Figure 1: GMC screenshot ...................................................................................................23 Figure 2: Details used to by the DMW to compare information to the GMC ..........................26 Figure 3: Enable content .................................................................................................... A-2 Figure 4: Tab linking to Table of Contents .......................................................................... A-3 Figure 5: The DMW portion of the Table of Contents ......................................................... A-4 Figure 6: Teamwork DMW spreadsheet ............................................................................. A-5 Figure 7: DMW Questions ................................................................................................. A-5 Figure 8: Accessing the GMC............................................................................................ A-7 Figure 9: SAGAT selection ................................................................................................ A-8 Figure 10: Example Metric Spreadsheet: SAGAT ............................................................... A-9 Figure 11: Pop-up definition feature showing Scoring Method ........................................... A-10 Figure 12: Similarities Table spreadsheet ......................................................................... A-11 Figure 13: Screenshot of References spreadsheet............................................................ A-12 Figure 14: GMC Metric Summary Spreadsheet ................................................................. A-12 Figure 15: Select tab from Table of Contents or the list at the bottom of the window ......... A-13 Figure 16: Questions asked by the GMC and Instructions in the DMW ............................. A-14 Figure 17: Input selections indicated by a drop-down menu under Inputs column ............. A-14 Figure 18: Flow of DMW instructions, inputs, and areas of concern. ................................. A-15 Figure 19: Individual or team measurement. ..................................................................... A-16 Figure 20: Administration of metric. ................................................................................... A-16 Figure 21: Areas of concern appear as selections are made. ............................................ A-16 Figure 22: Select who completes the metric. ..................................................................... A-17 Figure 23: Example of generated information based on inputs to the DMW. ..................... A-17 Figure 24: To clear all selections, click on "Refresh" at the top of the tab. ......................... A-18 Figure 25: Summary of AOC spreadsheet shows WL, SA, and TW recommendations ..... A-18 Figure 26: Summary of Areas of Concern showing results from practice input. ................. A-18 Figure 27: Saving results from a specific DMW session .................................................... A-19 Figure 28: Questions for Reviewers spreadsheet. ............................................................. A-19 Figure 29: Suggested Questions for Reviewers generation. .............................................. A-20 Figure 30: Disclaimer. ....................................................................................................... A-20 Figure 31: SA Metric Suggested Questions for Reviewers example. ................................. A-21 Figure 32: Checking MS Excel version .............................................................................. A-22 Figure 33: Selecting the File Tab. ...................................................................................... A-22 Figure 34: Save As option on the File tab. ......................................................................... A-23 Figure 35: Choose Excel Macro-Enabled Workbook ......................................................... A-23 Figure 36: MS Excel 2007 Menu. ...................................................................................... A-24 Figure 37: MS Excel 2010 Menu. ...................................................................................... A-25 Figure 38: MS Excel 2007 Select Trust Center. ................................................................. A-26 Figure 39: MS Excel 2007 Select Trust Center Settings. ................................................... A-26 Figure 40: MS Excel 2007 Enable macros. ....................................................................... A-27

viii
LIST OF TABLES
Table 1 DMW questions and their relationship to metric evaluation ..................................... A-6 Table 2 Columns on the GMC Metric Spreadsheets ............................................................ A-9

ix
EXECUTIVE SUMMARY The human factors engineering (HFE) staff of the Nuclear Regulatory Commission (NRC) evaluates the HFE programs of applicants for construction permits (CPs), operating licenses (OLs), standard design certifications (DCs), and combined licenses (COLs) using the Human Factors Engineering Program Review Model, NUREG-0711, Rev. 3 (NRC, 2012). NUREG-0711 identifies 12 review elements important to effective Human Factors Engineering (HFE) in nuclear power plants (NPPs). Several of these elements identify the constructs of workload (WL), situation awareness (SA), and teamwork (TW) to be important considerations during the design process. As such, in order to demonstrate successful implementation for these elements in their HFE design program, applicants propose a variety of metrics to measure these constructs. Many methods (i.e., metrics) for measuring these influences on human performance have been developed for use in other domains (e.g., military, aerospace, aviation), with specific populations (e.g., air traffic controllers), under specific conditions (e.g., participant ratings via freeze-probe administration). These metrics often have particular limitations (e.g., wired physiological equipment restricts operator movement). Consequently, these metrics were reviewed to determine the domains for which each metric has been validated and each metric’s strengths and limitations. This report is intended to be used in conjunction with the CD-ROM “Workload, Situation Awareness and Teamwork Generic Metrics Catalog (GMC) and Decision Making Wizard (DMW)” accompanying this report. The staff initiated this work to develop a WL, SA, and TW knowledge base and tool to enhance NRC staff knowledge of metrics used to measure these constructs when evaluating a proposed implementation of the HFE standards in NUREG-0711. Chapter 1 of this report provides an overview of the WL, SA, and TW constructs, including their most widely used definitions, and summarizes theories and contributing factors for each. Chapter 2 of this report describes the psychometric criteria used to evaluate metrics and specifically discusses the measurement and associated metrics of WL, SA and TW. Chapter 3 describes a database of human performance metrics (i.e., the GMC) and a tool (i.e., the DMW) for assisting reviewers in evaluating the acceptability of metrics described in applications and license amendment request (Note: Chapter 3 provides a description of the GMC and DMW, however, the database and tool are found together on the CD-ROM accompanying this report). A user guide to instruct and train NRC technical review staff on the organization, capabilities, and applications of the tool can be found in an appendix to this report. For those who are unfamiliar with the NRC’s Human Factors Engineering Program Review Model, an additional appendix includes a review of the NUREG-0711 general activities with an emphasis on the role that WL, SA, and TW measurement plays in the process.


xi
ABBREVIATIONS
DMW Decision Making Wizard ECG Electrocardiogram EEG Electroencephalography GMC Generic Metrics Catalog GMC DMW Generic Metrics Catalog Decision Making Wizard HFE Human Factors Engineering HRA Human Reliability Analysis HSI Human-System Interface I&C Instrumentation and Control ICA Index of Cognitive Activity ISA Instantaneous Self-Assessment ISV Integrated System Validation MCR Main Control Room NASA-TLX NASA-Task Load Index NNI Nearest Neighbor Index NPP Nuclear Power Plant NRC Nuclear Regulatory Commission OER Operating Experience Review SA Situation Awareness SACRI Situation Awareness Control Room Inventory SART Situation Awareness Rating Technique TA Task Analysis TW Teamwork TWA Team Workload Assessment V&V Verification and Validation WL Workload


1
1 INTRODUCTION 1.1 Purpose and Scope Purpose NUREG-0711, Rev 3 (NRC, 2012) provides NRC’s technical review staff with HFE guidelines for evaluating the HFE programs of applicants for construction permits (CPs), operating licenses (OLs), standard design certifications (DCs), and combined licenses (COLs) in order to obtain reasonable assurance that the plant will be designed such that it can be operated safely. Many of the twelve review elements contained in NUREG-0711 highlight the importance of workload (WL), situation awareness (SA) and teamwork (TW). The primary purpose of this report is to provide reviewers with a knowledge base to enhance their understanding of the metrics used to assess WL, SA and TW, and, provide a tool to assist reviewers in evaluating the acceptability of metrics for the specific uses proposed by applicants and licensees requesting license amendments (e.g., in support of design modifications). Overview Whereas the primary focus of this report is to enhance NRC staff knowledge of metrics used to measure WL, SA, and TW, it is first necessary to discuss the ways in which the constructs of WL, SA, and TW are defined. These constructs are “fuzzy” in the sense that they do not have universally accepted definitions or theories. Rather, each construct has multiple definitions based on a variety of underlying theories. Chapter 1 provides the most widely used definitions and theories of each of the three constructs along with discussing factors that contribute to each. This provides staff with a general sense of the scope of the construct and an understanding of where various definitions diverge or overlap. This information allows reviewers to better evaluate the extent to which a metric assesses the construct of interest. In order to determine the quality of a metric, there must be a standard for comparison. The second chapter of this report describes the psychometric criteria used to evaluate metrics, the measurement of WL, SA and TW, and their associated metrics. Chapter 3 is a description of a database of human performance metrics and a tool to assist reviewers in evaluating the acceptability of metrics for specific uses proposed by applicants and licensees (database and tool are on the CD in the back of this NUREG/CR). This report is intended to be used in conjunction with the CD “Workload, Situation Awareness and Teamwork Generic Metrics Catalog (GMC) and Decision Making Wizard (DMW)” located in the back of this report. As a note, this report was not intended to provide a comprehensive literature review of WL, SA, and TW, but, rather, an overview to orient the reader. Additionally, although it is recognized that these constructs interrelate, exploration of these relationships was beyond the scope of the work documented in this report. 1.2 Workload 1.2.1 Definitions and Theories of Workload Despite over 50 years of workload research (e.g., Knowles, 1963), there is yet to be a universally agreed upon definition. Early concepts of workload focused on the objective physical demands imposed by the task (e.g., actions required, number of actions taken, amount

2
of time standing) as measured by metrics such as Goals, Operators, Methods, and Selection rules (GOMS; Card, Newell, & Moran, 1983). As the construct evolved, the focus shifted to operators’ “experienced workload” or perception of task demands. As stated by Hart and Staveland (1988), “…workload is not an inherent property, but rather it emerges from the interaction between the requirements of a task, the circumstances under which it is performed, and the skills, behaviors, and perceptions of the operator.” In 1977, the North Atlantic Treaty Organization (NATO) Special Panel on Human Factors conducted a workshop with the goal of defining workload and identifying the components that comprise it (Moray, 1979). Current definitions of workload are built upon the results of that workshop. Workload is defined in a variety of ways, including; 1) the portion of operator’s limited capacity required to perform a particular task (Gopher & Donchin, 1986; O’Donnell & Eggemeier, 1986), 2) a hypothetical construct that represents the investment by the operator to perform a task at a desired level (Hart & Staveland, 1988) and 3) the total quantity of resources required by task demands (Kahneman, 1973). Workload has been proposed as both a uni-dimensional and a multi-dimensional construct (Boles & Adair, 2001; Hart & Staveland, 1988; Rasmussen, 1979). Multidimensional implies that workload is composed of more than one aspect. For example, workload as a multidimensional construct might consist of mental demand, temporal demand, and frustration in contrast to a single rating of overall workload (i.e., unidimensional). All of the definitions agree on two fundamental tenets. First, all consider workload as an active interaction between the operator and their task (Megaw, 2005). Second, all characterize workload as the amount of effort/resources required for task performance, relative to operator capacity (Abich, 2013; Eggemeier, Wilson, Kramer, & Damos, 1991; Gopher & Donchin, 1986; Hockey, 1997; Kahneman, 1973; Kramer, Sirevaag, & Braune, 1987; Moray, 1979; Taylor, 2012; Veltman & Gaillard, 1996). The foundational definitions of workload are reflected in the way workload is defined and treated in the guidance of NUREG-0711, Rev.3, “Workload is comprised of the physical, cognitive, and other demands that tasks place on plant personnel. The impact of one or many of these aspects of workload should be considered in the application of performance measures and while comparing alternative design elements.” There are two popularly ascribed to theories of workload: 1) unitary resource theory (Kahneman, 1973; Moray, 1967) and 2) multiple resource theory (MRT); (Wickens, 1984, 1992, 2008). Both postulate the idea that humans possess a finite amount of cognitive resources. Specifically, both support the notion of a “pool of resources” that is allocated to meet task demands. The major difference between the theories lies in the proposed constraints on these resources (Kantowitz & Knight, 1976; Navon & Gopher, 1979; Wickens, 1976). Resource theory argues that humans possess one central pool of resources whereas MRT asserts that humans possess multiple resource pools with varying capacities (Kahneman, 1973; Moray, 1967; Wickens, 1984; Wickens & Hollands, 2000). Resource theory asserts that workload occurs as a result of the amount of resources allocated to a task and the resultant depletion of those resources from the unitary pool. Cognitive resources drawn from this unitary pool might include verbal processing, spatial processing, working memory, etc. Regardless of the type of resource required, the unitary pool is used to meet the demand of the task at hand. Therefore, workload will increase and performance may suffer even when tasks are drawing on different types of resources (Friedenberg & Silverman, 2006; Kahneman, 1973). Whereas, MRT asserts that global workload does not increase just because one or more pools of resources are depleted. For example, the depletion of verbal processing resources should not affect performance on tasks that require spatial resources. Therefore, if resource demand is equal, two tasks that both demand one type of resource will inhibit each other more than two tasks that require different types of resources (Wickens, 2000).

3
1.2.2 Factors that Contribute to Workload As stated previously, the various definitions and theories of workload agree that workload is an interaction between the operator and their task. Thus, elements of the task and characteristics of the operator are contributors to workload. Both are discussed in this section. Huey and Wickens (1993) identified factors that are important contributors to WL in complex task environments (e.g., air traffic control, NPP operation, unmanned vehicle control). These factors were classified into four high level categories described below: performance criteria, task structure, human system interface, and individual factors. Performance criteria. Demanding performance requirements are frequently associated with elevated WL (Yeh & Wickens, 1988). This is particularly relevant to NPP operation because of high performance and safety standards expected from operators. Operators are under continuous performance scrutiny and are expected to perform with minimal errors. Research has shown low error tolerance to be a significant source of WL in various complex task environments (Yeh &Wickens, 1988). Task structure. Another important factor that likely affects the WL of NPP operators is the structure of the task itself. Huey and Wickens (1993) identified information flow, multitasking, task difficulty, and task duration as task structure factors that impact WL. In NPP operation, high rate of information flow (Ha et al., 2006), complexity of the information, and time pressure (Jou et al., 2009) can be present, leading to increased WL, which has the potential to overload operators. In addition, multi-tasking is common in NPP operation in both normal and off-normal operations. Multi-tasking refers to the requirement to complete multiple goals, accomplished by frequent task switching (Delbridge, 2000). For example, NPP operators may be simultaneously responsible for monitoring plant parameters along with performing surveillance testing (Reinartz, 1989). Studies examining supervisory control of multiple systems on a single display (e.g., Moray & Rotenberg, 1989) concluded that operators tend to deal with one complex task at a time and, as a result, fail to maintain optimal performance on multiple tasks. In an extreme case when a large number of tasks are required to be performed in parallel, WL can reach such a high level that an operator might adopt a strategy of ignoring the tasks that appear to not be critical at the moment (i.e. task shedding; Hart & Wickens, 1990). This is particularly important to the NPP domain because task shedding might have safety implications. An example of task shedding might be omitting or reducing the amount or quality of team communications. Changes in task priorities also influence WL (Huey and Wickens, 1993) such as transitioning from normal to off-normal events. WL is likely to increase because the operators switch from supervisory tasks consisting primarily of monitoring the state of the plant to tasks that require implementing multiple procedural steps, analyzing information from instrumentation, and communicating with other crewmembers. Human System Interface (HSI). Poor interface design, such as a flawed interface layout, is a potential source of increased WL. One HSI component where poor design has been found to create issues for operators is the user interface for automatic systems. Automation is the sharing or allocation of tasking from a human to a machine agent in an effort to improve overall performance and reduce the chance of error by reducing task demands on the operator and thus, workload (Scerbo, 2007; Reinerman-Jones, Cosenzo, & Nicholson, 2010). According to Liu, Nakata and Furuta (2004), “…only by visualizing the working of the automatic systems in an interface can an operator track what an automatic system is doing, why and how it is doing it, and what it will do next.” If this is not done effectively, the HSI will be a contributor to undue workload. Individual factors. The three previous factors addressed task characteristics that affect WL. However, workload is experienced subjectively, and thus is also influenced by individual factors.
4
The following individual factors have been shown to influence the amount of WL an operator will experience (Huey and Wickens, 1993):
• Years of experience • Sleep • Type of plants where one previously worked • Similarity of I&C layout to previously worked plants • Amount of time on shift • Time spent training • Time in current NPP • Stress coping techniques • Accuracy of mental model
The individual differences that will come into play in a particular situation are partly determined by the type of task being performed. Thus, individual differences are couched within task type in the following paragraphs. Skill-based tasks (often a physical action) require minimal conscious attention for completing the task. Because skill-based tasks are performed with limited conscious processing, we often perform them automatically and experience them as second nature. The level of WL for a skill-based task may be influenced by the degree of interference (i.e. current required behavior conflicts with previous required behavior) and the likelihood of a person making an error. According to Chang and Mosleh (2006), both interference and likelihood of error are influenced by a variety of individual differences including years of experience, age, sleep, the type of plants previously worked (e.g., PWR to BWR), the similarity of I&C layout to previously worked plants, amount of time on shift, time spent training, and time in current NPP. Rule-based tasks require rules and procedures for task completion (Rasmussen, 1983; Yeh & Wickens, 1988). Reason (1990) states, “Here, errors are typically associated with the misclassification of situations leading to the application of the wrong rule or the incorrect recall of procedures”(p.43). Misclassifications of situations often occur because an operator’s mental model is inaccurate. A mental model is a cognitive representation of the system with which an individual is interacting (Matthews et al, 2000). A person’s willingness and ability to learn and integrate new rules into their existing mental model, in order to maintain an accurate mental model, may influence WL level when carrying-out a rule-based task. Knowledge-based tasks rely on the operator’s knowledge of the system and understanding of the system’s current state (i.e. accurate mental model) to support decisions for task completion. Reason (1990) states, “errors at this level arise from resource limitations (‘bounded rationality’) and incomplete or incorrect knowledge.” As a note, increasing expertise shifts knowledge-based tasks to skill-based tasks, but all three levels can co-exist at any one time. Differences in stress coping techniques influence and are influenced by workload in all task types. The most widely accepted model of stress is the transactional theory of stress posited by Lazarus and Folkman (1984), which states that a stressor is evaluated in terms of the resources a person has available to cope (Matthews, 2001). Resources, in this instance, might be internal or external to the person. An example of an internal resource is the amount of attention directed toward a task, whereas an example of an external resource is time available. Two primary coping strategies are emotion-focused and task-focused coping (Matthews & Campbell, 1998). An emotion-focused coper tries to manage the feelings associated with the stressor and might use techniques such as meditation or distraction. If the task is not resolvable (i.e. outside of the person’s control) then emotion-focused coping may be the only means to cope and reduce

5
workload If the problem is resolvable, task-focused coping is most effective at reducing workload because the coper focuses on mitigating the stressor that is increasing the workload. 1.3 Situation Awareness 1.3.1 Definitions and Theories of Situation Awareness Situation Awareness (SA) refers to an individual’s understanding of the information provided in their current environment and the relevance of the information to their current goal and goals in the near future (Gilson, 1995; Endsley, 1995; Endsley, 2001). Although there is some agreement regarding the generalities of SA, there has been much debate as to how it should be characterized specifically (Salmon et al., 2009). Smith & Hancock (1994) describe the status of this disagreement as “a tacit recognition that our understanding is still incomplete” (p. 59). With many theoretical models attempting to underpin SA (Fracker, 1991; Endsley, 1995; Smith and Hancock, 1995; Bedny & Mesiter, 1999), Smith and Hancock’s ecological approach (1995) and Endsley’s three-level model (1995), have held the most support, with Endsley’s model being the predominant theory. Smith and Hancock’s (1995) ecological approach to SA stresses the importance of a person’s iterative interaction with a dynamic environment and the way in which goals influence this interaction. Their characterization of SA is conceptually based on Neisser’s (1976) perception-action cycle model. Neisser’s model includes three main interacting components: the information available in the environment, the individual’s knowledge, and the action taken. All three components dynamically interact and update one another as a situation unfolds. In other words, interaction with information from the environment modifies the individual’s knowledge, which in turn influences future actions that impact the environment. Time is an inherently important factor in this model due to the fact that an individual’s iterative interaction with the environment unfolds over time. Smith and Hancock expand this model by adding what they call an ‘invariant’ at the core of the model which represents a set of externally defined goals that guide the person’s adaptive behavior. The invariant might be a set of pre-defined rules that influence how an individual interprets the environment and makes judgments and decisions. For example, in safety focused environments (e.g., NPP operations, air traffic control) risk thresholds are often used to help determine a course of action. Under the Smith and Hancock approach, SA is defined as a generative process of knowledge creation and informed action-taking within the constraints of externally defined goals. This interaction continues to repeat in a cyclical manner, which Smith and Hancock (1995) account for as the acquisition and sustainment of SA. Whereas Smith and Hancock characterize SA as a process, Endsley’s (1988) model characterizes SA as a product of the processes used to achieve SA. Endsley (1988) defined SA as “the perception of the elements in the environment within a volume of time and space, the comprehension of their meaning, and the projection of their status in the near future.” In this model, SA is formed through three-levels: perception (level one), comprehension (level two), and projection (level three). Each level builds from the preceding level’s information, leading to higher SA. Level one involves the perception of status, attributes and dynamics of the surrounding environment, which is attained through visual, auditory, tactile, taste and olfactory inputs (Endsley, 2003). Level two deals with taking the inputs from level one and comprehending the degree of importance it holds in terms of the overall goal. This level also deals with the merger of inputs to create a bigger picture. Level three takes the preceding information and uses it to project possible future states (Endsley, 1995).

6
The two theories propose different mechanisms regarding how SA is achieved and characterized, however, both theories recognize that a goal and time are important factors impacting SA. NUREG 0711, Rev. 3 ascribes to Endsley’s SA model by defining SA as “the degree to which personnel’s perception of plant parameters and understanding of the plant's condition corresponds to its actual condition at any given time and influences predictions about future states.” 1.3.2 Factors that Contribute to Situation Awareness Applying Endsley’s (1995) definition to the nuclear domain, operators need to perceive and monitor a variety of system parameters and alarms. Two categories of factors have been identified as affecting SA in Endsley’s (1995) model: individual factors and system factors. Individual factors. There are several cognitive components that differ among individuals and affect levels of SA. Specifically, Endsley (1995) identified the effects of individual processing constraints and coping mechanisms on SA. Processing constraints are associated with attention and working memory. In complex environments, such as an NPP main control room (MCR), attention demands can exceed an operator’s attention capacity which can inhibit the operator perceiving important task-relevant information. This missed information could hinder an operator’s ability to form a complete picture of the state of the NPP and, ultimately, negatively affect safe NPP operation. If important information is perceived (level 1 SA), it is stored in working memory. The working memory must integrate the new information with existing information (for level 2 SA) and determine how the information will affect future system conditions (level 3 SA). Working memory has been viewed as the “main bottleneck for SA” such that there are processing constraints related to how much new information one can hold in short-term memory and process effectively.Endsley (1995) identified several coping mechanisms that help manage attention and working memory constraints. They include mental models, goal-driven processing, and automaticity 1(Endsley, 1995). A mental model is a framework for understanding information for a certain system. Within mental models are schemas of prototypical situations that operators have previously encountered. When an NPP operator has an accurate mental model of the NPP system, he or she is able to match the current situation to a previous situation they have encountered. This allows the operator to process a large amount of system information efficiently to achieve SA. Schemas and mental models are developed through training and experience. In addition to mental models developing as a result of experience, automaticity may also develop. Automaticity is described as a highly practiced procedure or action that requires few attentional resources (Matthews et al., 2000). According to Endsley, the automaticity of some tasks can provide a mechanism for overcoming limited attention capacity. NPP operation often consists of executing a learned sequence of actions. Some procedures (or portions of procedures) and the associated actions are practiced habitually. The operator will give sufficient attention to the task to retrieve necessary information or take necessary action, but no additional effort is expended determining what information to look for or how to take action. Goal-driven processing occurs when a person’s perceptions, interpretations, and judgments of a situation are impacted by their specific goal. As stated by Endsley (1995), “…a person’s goals…direct which aspects of the environment are attended to in the development of SA.”
1 Automaticity refers to automatic information processing and the associated action.

7
Information that does not pertain to one’s goal is not actively attended to, thus helping overcome limited attention capacity and preserving working memory for only important information. System factors. System factors including interface design, system complexity, and automation all influence NPP operators’ SA. Good interface design in plants may support SA by integrating information from various sources or by minimizing the amount of information to which an operator must attend (e.g., alarm filtering features; Hallbert et al., 2000). The accuracy of operators’ SA can affect overall task performance, thus, it follows that designing displays in a way that supports SA is beneficial (Hogg, Folleso, Strand-Volden, & Torralba, 1995). Another system factor that might influence SA is system complexity. A typical NPP control room consists of a large number of gauges, displays, knobs, and alarms, making it quite complex. Different strategies have been employed in an attempt to mitigate complexity including careful design, thorough testing of the HSI and increasing the amount of system automation. Changes in automation, such as increased function allocation to machine systems have the potential to affect operator SA (Hallbert et al., 2000). Poorly implemented automation or overreliance on automated systems can negatively impact SA making an operator ineffective at understanding the system, specifically, recognizing when manual control is required, and ultimately leading to errors (e.g., Billings, 1997). It has been suggested that performance decrements may be the result of automation where operators are out-of-the-loop (Carmody and Gluckman, 1993; Endsley,1987; Wickens, 1992). In addition to the factors mentioned, Endsley (1995) also discusses stress and workload as factors that may affect SA. However, the nature of the relationship between SA and these factors varies based on system design, task type and individual differences (see Endsley, 1995). 1.4 Teamwork 1.4.1 Definitions and Theories of Teamwork Cooke, Salas, Kiekel, and Bell (2004) define team as a group of people working as an integrated and coordinated unit, with the common goals of detecting and interpreting cues, remembering, reasoning, planning, solving problems, acquiring information and making decisions. Salas, Stagl, and Burke, (2004) postulate that a team must consist of two or more people working to accomplish a common goal, while interacting with multiple information sources. Although these definitions are distinctive, they share the principle that a team is a group of people working together within a system to achieve a goal (Stanton & Walker, 2013). “Teamwork is a set of interrelated thoughts, actions, and feelings of each team member that are needed to function as a team and that combine to facilitate coordinated, adaptive performance and task objectives resulting in value-added outcomes” (Salas, Sims, Burke, 2005). There are challenges associated with distinguishing teamwork from other team constructs (e.g., team workload, team SA) as all are aimed at understanding team behavior and performance. The way in which teamwork and other team constructs (e.g., team workload) are related is still being investigated. Team research is still relatively new. As the research develops, it is the hope that definitions, theories, and models will become more well-defined. 1.4.2 Factors Contributing to Teamwork There is a fair amount of literature on the topic of TW, with various models and metrics proposed (Salas, Sims, & Burke, 2005). However, there is a large degree of inconsistency in theory, terminology, and key variables (Shanahan, Best, Finch, & Sutton, 2007). This is, in part, due to the various fields in which TW research is conducted, from psychology to business to engineering. In order to organize the existing knowledge on TW, Salas et al. (2005) conducted an extensive literature review and identified five TW factors and three coordinating mechanisms.
8
Factors are elements of TW, whereas coordinating mechanisms are means to achieving TW. TW factors (team leadership, mutual performance monitoring, backup behavior, adaptability and team orientation) and mechanisms (shared mental modes, closed-loop communication and mutual trust) are described in the following pages.
1.4.2.1 Teamwork Factors Team leadership. Studies indicate that leadership is crucial to effective and safe team performance (e.g., Mearns, Flin, Gordon, & Fleming, 2001; O’Dea & Flin, 2000). There are various skills that are present in a successful team leader including effective communication, conflict resolution capabilities, efficient planning, and ability to delegate task assignments (Huey & Wickens, 1993). An effective team leader would actively participate in conflict resolution, which involves analysis of conflict origins, confrontation reduction, and future conflict prevention. In order to ensure high performance standards for the team, an effective team leader would also take an active part in task planning by providing clear objectives. Specifically, a team leader would divide a task into subtasks and assign them to the team members (Salas et al., 2005). Also, a team leader would cultivate an understanding of the interdependence of team member actions. The shift manager and shift supervisor often function as the team leaders in NPP MCRs. Mutual performance monitoring. Another key component of successful TW is support. Support consists of monitoring the activities of other team members, taking action to correct errors, giving and receiving feedback in a non-defensive manner, and providing and seeking assistance or backup when needed (Johnston, Smith-Jentsch, & Cannon-Bowers, 1997; Weil et al., 2004). These behaviors can lead to identification of mistakes and misinterpreted information, as well as combat groupthink2 (Weaver et al., 2009). In NPPs, operators often check each other’s instrument readings to ensure accuracy. Backup behavior. Several studies highlight the importance of team member coordination in team performance (e.g., Chiocchio, 2007; Dickinson & McIntyre, 1997; McCallum, Oser, & Salas, 1989). In many situations (e.g., off-normal events), additional demands are imposed on team members, potentially causing a WL imbalance in the team. A team member coordination technique known as back-up behavior is often employed to mitigate this imbalance. Back-up behavior is advising, assisting, or performing a task for the overloaded team member (Marks, Mathieu, & Zaccaro, 2001). For example, if a control board operator has to leave the area from which his or her control board can be directly monitored (e.g., to check a back panel), then the remaining board operator will balance that task responsibility by monitoring those controls during the operator’s absence. Adaptability. Adaptability in a team environment is the ability to adapt individual actions of team members to produce coordinated team action. Adaptability helps teams respond to unexpected demands. The state of a NPP can change quickly during an emergency. Crews of operators (teams) must be able to quickly adapt to changing condition in order to mount a coordinated and effective response. Team Orientation. Team orientation is attitudinal. It is defined as “a preference for working with others but also a tendency to enhance individual performance through the coordination, evaluation and utilization of task inputs from other members while performing group tasks” (Driskell & Salas, 1992). Team orientation has been shown to improve both individual and team performance (Driskell & Salas, 1992; Salas et al, 2005; Shamir, 1990; Wagner, 1995).
2 Groupthink is a phenomenon in which the desire to not disrupt group cohesiveness leads to final decisions without consideration of alternative viewpoints (Janis, 1982).

9
1.4.2.2 Coordinating Mechanisms Shared mental models. A shared mental model is commonly referred to as “an organized understanding of relevant knowledge that is shared by team members” (Mohammed & Dumville, 2001, p. 89). Shared mental models enable task planning and setting task priorities (Lim & Klein, 2006). Understanding the progression of the task helps each team member to take appropriate, coordinated steps for maintaining task performance. For example, crewmembers at an NPP must have a common understanding of the current state of the NPP, which will enable effective communication and event mitigation. Shared mental models allow individual team members to anticipate the kind of information each team member will need during a particular task. Also, it can help with resource allocation, and decision-making (e.g., Cannon-Bowers & Salas, 2001). Shared mental models are supported by several common practices in NPP MCRs. For example, during a crew update, a crewmember announces “update”and gives pertinent information to the entire crew. The rest of the crew acknowledges the update, ensuring that everyone has the same information, thus encouraging a shared understanding or mental model of the current state of the plant. Another instance is the formal communication, commonly referred to as “turnover,” that occurs between shift changes. Closed-loop communication. Communication and operation as a cohesive team are inseparable (Cannon-Bowers & Salas, 1997). Closed-loop communication involves the exchange of information from the giver to the receiver, the acknowledgement that the information was received by repeating what was heard, and the approval from the giver that the information was processed correctly. This process is known as three-way communication in NPP operation. Communication between team members is critical for the successful completion of team tasks (Patrashkova-Volzdoska, McComb, Green, & Compton, 2003; Pinto, M. & Pinto, J., 1991; Scholtes, 1988; Weil et al., 2004). Mutual Trust. Mutual trust among team members is necessary because, in order to work effectively, team members must be willing to “accept a certain amount of risk” and rely on each other to complete a task successfully (Salas et al., 2005). If trust is not present, team member behaviors may be suspect leading to degradations in team functioning. For example, in NPPs, operators monitor each other’s performance. If trust is present, the team members will likely interpret this behavior as helpful. However, if trust is lacking team members may feel others are scrutinizing their work. 1.4.3 Related Team Constructs As stated previously, teamwork can be difficult to distinguish from other team constructs. For illustrative purposes, two examples of other relevant team constructs are presented below. Team Workload. Team-based activities can include two components: teamwork and taskwork. Teamwork occurs when people within a team co-ordinate their behavior to accomplish tasks associated with the team’s goals. Taskwork occurs when a team member performs a task separate from the team (Stanton & Walker, 2013). Team WL is defined as including taskwork and TW components (Cannon-Bowers & Salas, 1997). For example, in NPPs taskwork, might include system monitoring and surveillance testing and TW might include team communication and coordination. As a note, although this construct is labeled as “workload,” it is not explicitly tied to the resource theories described previously for individual workload. The challenge associated with framing team WL in terms of resource theory is that it is not known if the individual resources of the team members can be characterized as a cumulative pool of resources. More research is needed in this area.

10
Team Situation Awareness. Team SA is often referred to as the aggregate of individual SA levels (Endsley, 1995). The higher the SA levels for individuals the higher the team SA. However, the theoretical foundation for team SA is still in its infancy and more research is necessary to outline a precise definition of team SA. There is a debate regarding whether aggregate scoring is most appropriate or if using the lowest individual SA score should be the standard scoring methodology. It is possible that low SA in one individual cannot be compensated for by other team members; rather, that person could drive the team to failure (Endsley, 1995).

11
2 MEASUREMENT The first chapter provided a general overview of each of the constructs Workload (WL), Situation Awareness (SA), and Teamwork (TW). This chapter focuses on the measurement of these constructs. Specifically, this chapter provides NRC technical staff with information about the properties of metrics by which acceptability for specific uses can be discerned. In addition, it provides information about the various types of metrics available for each construct. Examples of each type are provided. 2.1 Psychometric Properties In establishing a metric, it is essential to build a case for the quality of the metric based on evidence collected from research. Psychometric criteria are quantitative and qualitative standards used to evaluate the overall quality of a metric. Information concerning the extent to which a particular metric meets established criteria is relevant for NRC staff as it provides a basis for assessing the metrics proposed by applicants. The psychometric properties that will be addressed in this chapter include: validity, reliability, sensitivity, diagnosticity, and intrusiveness. 2.1.1 Validity The ultimate goal for metric development is to create a valid assessment; that is, the metric assesses the construct that it claims to, and not some other construct (for example, a metric measures WL and not SA). The process for establishing validity is provided by Standards for Educational and Psychological Testing (1999) published jointly by the American Educational Research Association (AERA), American Psychological Association (APA) and National Council on Measurement in Education (NCM). According to the Standards, “The process of validation involves accumulating evidence to provide a sound scientific basis for the proposed score interpretations.” (AERA, APA, & NCME, 1999, p. 9). The Standards list five types of evidence that support validity.
1. Test content evidence refers to whether the metric samples relevant domain content, often determined by expert analysis. For example, a WL metric may need to sample multiple factors that contribute to workload (e.g., mental demand, physical demand) depending on the ascribed to definition of WL.
2. Response processes evidence refers to evidence that the metric is not contaminated by extraneous influences such as socially desirable responding (e.g., reporting a lower level of workload than that actually experienced to appear competent).
3. Internal structure evidence refers to whether the internal psychometric properties of the metric match those of the construct. It is determined by use of factor analysis3 or other multivariate analytic techniques.
4. Relation to other variables evidence refers to research findings that show the metric is related to other variables as expected on theoretical grounds. For example, a WL metric should be associated with error rate, and it should be sensitive to objective levels of demand. Evidence can be obtained from correlational and experimental studies.
5. Consequences of testing evidence refers to the ability of a metric to demonstrate utility. For example, a WL metric may be intended to identify operators at risk of performance failure.
3 Factor analysis is a statistical technique used to evaluate the correlations among various factors or components to identify a smaller, subset of factors.

12
Although there are different types of evidence, validity remains a unitary construct. Thus, building a case for validity typically requires performing multiple empirical tests to confirm the various aspects of validity. As a note, metrics are typically designed to measure constructs in specific circumstances, and will often show different results in other circumstances. For example, the NASA-TLX, a workload metric, was validated in the aviation domain, thus, using it for the nuclear power domain creates a different circumstance. Likewise an individual being assessed creates a different circumstance than a team, an operator completing a self-assessment creates a different circumstance than an observer completing an observational-assessment and a post-task administration creates a different circumstance than a freeze-probe. If a metric was designed to be used in a particular way for a specific domain and was validated under those circumstances, applying different circumstances could make the validity of the metric suspect. Therefore, the “new” circumstance would need to be empirically tested to ensure the metric’s validity. Quantitative criteria There is no single quantitative criterion that can be used to determine whether a test is “valid”. However, quantitative information about a metric can be evaluated using the statistical concept of effect size, defined as the strength of a relationship between variables (Cohen, 1988). For example, a WL metric might strongly predict error rate (large effect size), or it might be only weakly associated (small effect size). As with other statistical concepts, such as significance levels, there are some useful conventions for interpreting effect size indices. In experimental studies that compare two group means, the effect size indicator is Cohen's d, defined as the difference between the two means divided by the standard deviation for the measure. Conventionally, d values of 0.2, 0.5 and 0.8 are considered small, medium, and large effect sizes respectively (Cohen, 1988). For multi-group or multi-condition designs, for which analysis of variance (ANOVA)4 is appropriate, Cohen’s f2 statistic may be used as an indicator of effect size: values of 0.02, 0.15, and 0.35 are defined as small, medium, and large. Pearson’s correlation, used as an indicator of effect size for paired quantitative data, r values of 0.1, 0.3 and 0.5 are considered small, medium and large effect sizes respectively. Some key quantitative guidelines are as follows: Convergence with related constructs (relation to other variables evidence). Metrics of the same construct should correlate highly. Thus, effect sizes should be strong (e.g., a new WL metric should correlate at 0.5 or higher with existing WL metrics). Divergence from unrelated constructs (relation to other variables evidence). Metrics should not be strongly correlated with measures of other, distinct constructs. Generally, such correlations should be less than 0.3. For example, WL is a distinct construct from depression, thus WL metrics (e.g., NASA-TLX) should have only small (≤ 0.1) correlations with metrics that measure depression (e.g., Beck depression inventory). However, moderate correlations with theoretically related measures are acceptable. For example, WL and stress are distinct constructs but might be expected to correlate moderately (i.e. less than 0.5). Relationships with outcome measures (consequences of testing evidence). One application for metrics may be to predict some specified outcome (e.g., a WL metric might be used to predict operational errors). In this case, quantitative guidelines should reflect the importance of the objective. For example, if it is critical that a WL metric predicts errors, a large effect size is required (i.e., a correlation of 0.5 or greater). If it is merely desirable, but not critical that the metric predicts errors, a moderate effect size of r = 0.3 would be acceptable. Small effect sizes 4 An analysis of variance (ANOVA) is a collection of statistical models used to analyze the differences between group means.

13
are often of no practical significance, and exceptions to this principle must be carefully justified. For example, a small-magnitude decrease in operator WL might be meaningful if, over time, it led to reduced operator stress, through a gradual accumulation of small benefits. Although quantitative guidelines are useful, it is important to keep in mind that some forms of validity evidence specified in the AERA/APA/NCME (1999) standards (e.g., expert analysis of test content) are necessarily qualitative. 2.1.2 Reliability Validity should be distinguished from reliability, which refers to the accuracy and consistency of metric (irrespective of what is actually being measured). A reliable metric will give consistently similar values for the construct of interest; an unreliable metric will give fluctuating values. Reliability is necessary, but not sufficient for validity. For example, a scale can repeatedly provide a weight of 150lbs for a person and thus is reliable. However, if the scale is not calibrated and the person actually weighs 200 lbs, it is not accurate and, thus, is not valid. Reliable metrics require further evaluation to determine if they are also valid. An unreliable metric cannot be valid and should not be used. Some key quantitative guidelines for reliability are as follows. For multi-item scale metric (e.g., survey with multiple questions), the most popular statistic is Cronbach’s alpha (Nunnally & Bernstein, 1994). It varies from 0-1.0, and may be thought of as the internal consistency of a metric. In other words, it is the inter-correlations of test items to demonstrate that all items are measuring the same construct. The minimum acceptable value is 0.70; an alpha below 0.70 indicates that the measurement metric is too inaccurate for use. It is preferable for alpha to exceed 0.80. For assessment of individuals, alpha should exceed 0.90. For example, if a WL metric is administered to an individual operator repeatedly for the same task, alpha should exceed 0.90. A metric’s credibility of being reliable is increased by administration in multiple studies, which confirms test-retest reliability. 2.1.3 Intrusiveness Intrusiveness describes the extent to which the metric interferes with task performance. For example, frequent requests to complete a questionnaire during the task or physiological sensor equipment that restricts mobility are likely to distract the operator. If the metric is intrusive, it may be difficult to validate it against operator performance as it will not be clear whether errors are due to task characteristics or the distraction caused by the metric. Intrusiveness may be assessed in relation to the loss of performance resulting from introducing the metric. Only a small loss of performance (Cohen’s d ≤ 0.2) would constitute an acceptable level of intrusiveness in a research study. 2.1.4 Sensitivity Two additional psychometric properties that are relevant to the assessment of WL and SA include sensitivity and diagnosticity.5 Sensitivity refers to the capacity of the metric to detect changes in task difficulty or demands. An experimental study might vary a task feature, such as the rate at which critical events occur, and test whether, according to the metric, WL increased as task demands increased. Sensitivity may
5 These properties are not evaluated for teamwork due to the fact that measurement of teamwork is still in its infancy. It is not clear how individual scores should be used to accurately represent a team. For example, if individual scores are averaged, it may over or under-represent the sensitivity of the metric.

14
be quantified in relation to effect sizes as previously discussed. For example, a large increase in task demands should elicit a large magnitude change in WL (Cohen’s d ≥ 0.8). 2.1.5 Diagnosticity Diagnosticity is the extent to which the metric indicates the source or reason for changes in the metric. For example, a change in WL might reflect various factors such as a change in the pace of work, a change in physical demands or a change in the effort applied by the operator. Some metrics provide multiple scores indicative of different sources of WL. Those that provide only an overall WL score are less diagnostic. This psychometric property is generally assessed qualitatively by analyzing the content and structure of the metric. 2.1.6 Additional Considerations In evaluating the evidence for psychometric properties, the reviewer must also evaluate the quality of the evidence. Weaknesses in the methods used to conduct an empirical test will limit the conclusions that can be drawn from it. Poor methodology may lead to both over- and under-estimation of validity. For example, a critical feature of empirical studies is the sample size. The accuracy of statistical tests increases with sample size, thus findings from small samples may not be trustworthy. Another example is using simulated environments to make inferences about real world operations, as is common in the NPP domain. Lack of fidelity in the simulation may threaten generalization to real environments. If the psychometric properties and the methodologies to determine the psychometric properties are sound, one can be reasonably confident in the quality of the metric. 2.2 Workload Measurement The research documented by this report entailed a comprehensive review of the metrics available for WL, SA, and TW. This section categorizes the types of WL metrics available. In addition, it provides examples of metrics for each category. The information provided in the examples is the type of information that staff can acquire by using the WL, SA and TW GMC and DMW CD located in the back of this report. The sections that follow addressing SA and TW are similarly structured. Workload metrics vary to the extent that they are grounded in theory. Many are founded on theories such as MRT or resource theory; others are developed for practicality purposes in a given experiment. Additionally, workload metrics have often been developed for use in a specific domain or for use with a specific experimental task. Thus, many workload metrics might not be valid for all domains or all tasks within a domain. However, researchers frequently use metrics that were originally developed for use in a specific domain in domains for which they were never intended and for which the psychometric properties have not been sufficiently assessed (Nygren, 1991). For example, Hart and Staveland (1988) developed the NASA-TLX for aviation, but it has become the most commonly used workload measure, crossing multiple domains. No single workload metric has been widely validated and accepted for use across domains (Gopher & Donchin, 1986). In fact, workload metrics often yield low, inconsistent correlations with one another (Reinerman-Jones, Taylor, Cosenzo, & Lackey, 2011). Thus it is possible that a metric might be sensitive to workload changes in the aviation domain but not the nuclear domain. Additionally, different tasks within a domain might require different workload measures. Understanding the domains and tasks for which a metric has been validated, allows for a better understanding of how it may be used appropriately. There are various types of WL metrics including subjective and objective metrics. Both types of metrics are meant to reflect the effects that performing a task has on an operator. Subjective

15
metrics include self-report questionnaires, interviews and third-party observation and report. The latter two types of subjective metrics are typically highly context dependent and one-off in nature (e.g., interview questions may be based on a particular observation with a particular person in a particular situation). Thus, only a self-report questionnaire example is provided in section 2.2.1. Objective metrics include physiological response and performance indicators. Performance metrics come in the form of primary and secondary task performance, where decrements indicate a change in workload (Wickens & Hollands, 2000). Physiological metrics continuously monitor bodily responses as they relate to changes in the task environment (Cain, 2007). 2.2.1 Subjective Metrics Definition: Subjective metrics are based on the operators’ self-evaluations of WL. These metrics are often administered after the task or interrupt the task. Advantages: This metric type is easily integrated into validation testing and is inexpensive. Also, metrics administered after the task are non-intrusive (Rubio, Diaz, Martin, & Puente, 2004). Limitations & Factors to Consider: Subjective metrics are susceptible to participant bias. For example, a participant might report lower than actual level of WL to represent oneself as competent or proficient at the task. Also, post-task WL metrics provide only a WL summary without showing real-time WL fluctuations associated with the task. Finally, subjective metrics are intended to capture the full WL experienced during the task, but often the participant responds according to his or her perceived WL for only a particular segment of the task (frequently the end of the task). Therefore, their score might not be an accurate reflection for the entire task. Subjective WL metrics should be tailored to the WL components they intend to measure. For example, if the applicant is seeking to measure overall WL experienced by NPP operators, generic instructions for the metric would be appropriate. Alternatively, if the applicant is measuring the WL imposed by the HSI, the metric instructions should explicitly ask the participant to evaluate WL related to the HSI. However, caution must be exercised when using a modified metric because the modifications could negatively affect the psychometric properties. If a post-task WL metric (e.g., NASA-Task Load Index) was used, the applicant needs to demonstrate that responses of WL are for the entire task and not for an unknown task period deemed by the operator. This can be accomplished by proper instruction to the operator regarding the specific timeframe or tasks that they should evaluate in terms of workload (e.g., report the amount of workload you experienced during task A). In the case when WL needs to be assessed multiple times throughout one task, preference should be given to metrics with low task intrusiveness. Examples of subjective WL metrics are described below. National Aeronautics and Space Administration Task Load Index. The National Aeronautics and Space Administration Task Load Index (NASA-TLX) (TLX; Hart & Staveland, 1988) is a self-report metric of perceived WL that has been validated in numerous studies and applied in various performance settings (Hill et al., 1992; Moroney, Biers, Eggemeier, & Mitchell, 1992; Wierwille & Eggemeier, 1993). This metric offers several advantages over other self-report subjective metrics due to its high reliability, simplicity of administration, and non-intrusiveness (Farmer & Brownson, 2003). The NASA-TLX can be administered via paper and pencil or on a computer. In addition, the NASA-TLX has been used in the NPP domain. As with any self-report metrics, the NASA-TLX is subject to participant bias. It also does not provide a real time, continuous WL index, but just a WL summary of the entire task or the task up to the point of metric administration. However, it does provide diagnosticity through sub-scales to understand the aspects influencing WL. The six sub-scales are mental demand, physical demand, temporal
16
demand, performance, frustration, and effort. The source publication (Hart & Staveland, 1988) establishes the NASA-TLX as sensitive to a variety of task demand manipulations. Instantaneous Self-Assessment. The instantaneous self-assessment (ISA) is a simple metric for evaluating perceived WL (Tattersall & Ford, 1996). It involves asking the operators to rate their WL, on a single scale, multiple times during task performance. The ISA is highly correlated with other self-report WL metrics (Castle & Leggatt, 2002, as cited in Gawron, 2008). The ISA metric is a one-dimensional WL metric and does not distinguish between types of demand, thus it is not very diagnostic. However, it can be tailored to a specific task by modifying the questionnaire instructions. For example, “respond with your WL rating according to how the HSI is influencing your WL”. Generic instructions might read, “please rate your WL on a scale of one to five with five being the highest”. Administration and response can occur in writing or as an auditory prompt and verbal response. 2.2.2 Performance Metrics Definition: Generally, increased WL is associated with declines in performance (Cain, 2007). Performance metrics indirectly estimate WL level based on task performance. Performance metrics of WL consist of primary and secondary task measures. A primary task is one that is specified to be the most important or most frequently performed (e.g., monitoring NPP parameters). A secondary task is one that is of lesser importance to job success or occurs infrequently (e.g., reviewing log entries). A secondary task measure can be used to indicate the spare resource capacity left from the primary task. It is important to look at the quantity and type of errors for both types of tasks. The highest levels of WL will likely elevate errors in both aspects of performance (Wickens, 1991). A lesser, but still high level of WL, is suggested when a task manipulation increases errors on secondary, but not primary task performance. It may be inferred that an individual is maintaining primary task performance at the expense of declining secondary task performance (Matthews et al., 2000). Similarly, degradation of other performance measures like detection rate, detection accuracy, and response time identify likely points of increased WL (Cain, 2007; Wickens & Hollands, 2000). In particular, increasing WL tends to slow the speed of response to stimuli or events, especially for secondary activities (Ogden, Levine, & Eisner, 1979; Lansdown, Brook-Carter, & Kersloot, 2004; Matthews et al., 2000). Advantages: The advantage of including primary task performance measures is that they are non-intrusive. Limitations and Factors to Consider: The disadvantage of the primary performance measure is that it has low sensitivity in low to moderately demanding tasks. The disadvantage of the secondary task is that it is often intrusive to the primary task. Also, a decline in performance might not be observed if different task modalities are chosen. If one task is presented visually and another auditorily, performance might not suffer because they are drawing on different resources. Thus, the secondary task also is not always sensitive to changes in task load (O’Donnell & Eggemeier, 1986). 2.2.3 Physiological Metrics Definition: Physiological Workload metrics are based on the premise that varying levels of WL produces changes in physiological response. Examples of some physiological metrics used for assessing WL include brain activity (e.g., EEG), cardiac metrics (e.g., heart rate variability), and eye tracking (e.g., blink rate, blink duration and blink latency). Advantages: The advantages of physiological metrics include the continuity of the data recording, cognitive non-intrusiveness to the task, and absence of participant bias. Particular to
17
the NPP domain, physiological WL metrics may be valuable because they are able to continuously capture WL level changes during scenario testing. Limitations and Factors to Consider: Some physiological metrics can be physically intrusive and others require extensive training of research personnel. Scoring might be more complex than for questionnaires. Several examples are described below. Electroencephalography. Electroencephalography (EEG) is the measurement of electrical activity of the brain recorded from electrodes placed on the scalp. Changes in EEG have been associated with changes in WL as shown by several studies (e.g., Gevins et al., 1998; Raabe, Rutschmann, Schrauf, & Greenlee, 2005). The EEG metrics provide high temporal resolution, meaning EEG metrics are sensitive to changes over short time intervals when measuring WL. An effort must be made to minimize intrusiveness when collecting EEG data. For example, if the NPP simulator is large and requires the participant to move around, wired EEG technology would be physically intrusive to the task. Analyses of the EEG data can be used as indicators of WL as shown throughout literature (Parasuraman & Wilson, 2008). EEG systems do require a trained technician for set-up and data interpretation. Cardiopulmonary. The contraction of the heart is produced by electrical impulses. Electrocardiogram (ECG) measures electrical heart rate activity. Heart rate (HR), Heart Rate Variability (HRV), and Inter-beat Interval (IBI) are common measures used for evaluating changes in WL (Veltman & Gaillard, 1996; Miller, 2001). Eye tracking. Most eye tracking systems record blink frequency, eye closure fraction, blink duration, fixations, pupil diameter, and saccades (Ha et al., 2006). Eye tracking technology has evolved from early systems that required long calibrations and participants to sit completely still. Today, there are a variety of systems available, ranging from head-mounted to desk-mounted. Eye trackers are relatively easy to use and results are generally straightforward, but researchers require training before use. 2.2.4 Workload Metrics: Key Issues One of the key issues in WL assessment is deciding whether to use a single or multiple metrics. Use of a single, validated metric will typically be the quickest to administer. However, diagnosticity may be enhanced by using a combination of several WL metrics to capture the WL profile in the NPP domain. Research has not yet determined the combination of metrics that capture the entire “workload picture.” The metrics have been inconsistently correlated with one another throughout the literature. The limited information that is available regarding the relationships between metrics is captured in the Similarities Table located on the Workload, Situation Awareness, and Teamwork GMC DMW CD. 2.3 Situation Awareness Measurement The types of SA metrics include explicit, implicit, and subjective metrics. The metrics can be further divided into two categories: 1) those that measure SA via real time probes (intrusive) and, 2) those that measure SA post-task (non-intrusive). One of the greatest challenges with SA metric development is that SA is context dependent and therefore, a single set of questions is not likely to apply across domains. 2.3.1 Explicit Metrics Definition: Explicit metrics of SA are based on self-report information about the situation retrieved from memory. Fracker (1991) distinguished several types of explicit metrics including retrospective, concurrent, and freeze metrics. Retrospective metrics are used to determine
18
participants’ SA after the task by asking about the events that occurred during a certain stage of the task. Concurrent SA metrics are administered during the task. The participants are asked to provide verbal feedback or talk to a confederate6 who evaluates the participants’ awareness of events and processes. Finally, freeze probe SA metrics require pausing the task and asking a set of questions to assess SA. Advantages: The advantage of explicit metrics is that they allow comparison of operators’ awareness of the processes occurring in the plant to the actual state of the plant. The explicit metrics of SA appear to be directly measuring SA by asking questions related to the state of the system. Limitations and Factors to Consider: There are several disadvantages related to explicit metrics including reliance on memory and subjective interpretation. In other words, people report their interpretation of the situation instead of the actual situation, thus assigning meaning to the situation and not the facts that compose the situation. Also, concurrent and freeze-probe metrics are potentially intrusive to task performance. Situation Awareness Control Room Inventory. Situation Awareness Control Room Inventory (SACRI) is an example of an explicit metric for NPP design evaluation with a freeze probe administration. SACRI was developed by Hogg et al. (1995) based on the Situational Awareness Global Assessment Technique (SAGAT). The items in SACRI were specifically designed to be relevant to the NPP domain. Several studies found that freeze-probe techniques can be intrusive to the primary task (e.g., Sarter & Woods, 1991), however, it was found that SACRI does not significantly impact primary task performance (Hogg et al., 1995). 2.3.2 Implicit Metrics Definition: Implicit metrics infer SA indirectly from performance data, on the basis that loss of SA will surface as poor task performance. The simplest technique is simply to assess global (i.e. primary) task performance. Another approach relies on use of an external task. That is, some external stimulus changes (e.g., an alarm sounds in a NPP MCR that is unrelated to the current task), and SA is measured in terms of the operator’s response to the event (e.g., silencing the alarm and/or taking appropriate action if necessary). A third approach is to use embedded task metrics. In this case, a subtask that is compatible with the overall task environment is used to assess SA. For example, an alarm event might be generated periodically during NPP operation; rapid response to the alarm, such as acknowledging and silencing the actuation, would indicate high SA. Advantages: The advantages of such metrics are they can be non-intrusive and easy to implement. Limitations and Factors to Consider: The main disadvantage of inferring SA from primary task performance is that the link between SA and performance is not necessarily direct. Poor task performance could be caused by factors other than low SA, thus making interpretation of results ambiguous. The disadvantage of the external task and embedded task approach is that they are potentially intrusive to the primary task performance. Furthermore, an operator might be aware of an external or embedded task event, but fail to respond to it. Situation Present Assessment Metric. Situation Present Assessment Metric (SPAM) is an objective unidimensional metric of SA that records reaction time and accuracy to probes with
6 An actor who participates in a psychological experiment pretending to be a subject, but in actuality is working for the researcher.
19
displays remaining in view. This metric has almost solely been used to assess air traffic controllers. 2.3.3 Subjective Metrics Definition: Subjective is another category of SA metrics that includes direct self-ratings, comparative self-ratings, and observer ratings (Uhlarik & Comerford, 2002). Subjective SA metrics are based on the rating by the operators themselves or observers. Advantages: These metrics are easy to administer and inexpensive to implement. Limitations and Factors to Consider: They are subject to participants’ and observers’ biases. Observers’ ratings of SA metrics require high inter-rater reliability, (i.e. degree of agreement among raters), thus entailing extensive research personnel training and preparation of the materials to ensure quality data collection. Situation Awareness Rating Technique. The Situation Awareness Rating Technique (SART) is a self-report metric of SA, which consists of 10 dimensions (10-D SART), or three dimensions (3-D SART; Taylor, 1990). The original 10-dimension version of SART provides more detailed information and thus is more diagnostic. However, 3-D SART requires less time and seems to be sufficient at providing an accurate picture of SA and it is easy to interpret results. As SART is a post-task metric, it should be used for assessment of overall SA. Care should be taken when using a single administration of SART in long scenarios because the accuracy of SA estimation could be affected by participant memory decay. 2.3.4 Situation Awareness Metrics: Key Issues As with WL, the researcher must decide to use either a single metric or multiple metrics. Regarding measurement, typically, SA metrics are developed to adhere to a particular theory (Salmon et al., 2009). Stanton, Chambers & Piggott (2001) suggest that the various theories of SA, including lesser-known theories (Bedney & Meister, 1999; Fracker, 1991; Taylor, 1994), may present a part of the global SA picture and thus, a multiple metric approach may be prudent. The optimal compliment of SA measures has not been determined through research. 2.4 Teamwork Measurement The main reason for assessing teamwork is to evaluate the cost of performing tasks as a team (Stanton & Walker, 2013). Teamwork measurement is challenging because of the ambiguity regarding the dimensions that constitute TW and the lack of metrics with psychometric properties falling into acceptable ranges (Dyer, 1984). Stanton and Walker (2013) classified team performance metrics into five broad categories: team task analysis (TTA) methods, team cognitive task analysis (CTA) methods, team communication assessment methods, team behavioral assessment methods, and team mental workload assessment methods. In addition, there are several team performance assessments that fall into their own unique category. Many experiments use TW questionnaires that researchers created specifically for that particular study. In most of these instances, reliability and validity are not considered. Experiment-specific metrics are most often subjective and are often completed by one of several parties, 1) directly by operators, 2) supervisor or 3) trained observer. General considerations for self-report metrics should also apply to those for TW (see section 2.2.1). Team Interaction Behaviorally Anchored Rating Scale. A Behaviorally Anchored Rating Scale (BARS) metric, such as the one developed by Hallbert, Sebok, and Morisseau (2000), is an example of a TW metric. BARS-based metrics provide an assessment technique that aims to

20
combine the benefits of narratives, critical incidents, and quantified ratings by anchoring a quantified scale. This is often completed by trained observers. 2.4.1 Measurement of Constructs Related to Teamwork
2.4.1.1 Team Workload Measurement Little research has been conducted on measurement of team WL. The majority of researchers modify existing individual WL metrics (e.g., NASA-TLX) by changing instructions and the number of items in order to capture team WL dimensions. Modifying existing measures to fit new circumstances may negatively affect the metric’s psychometric properties. Also, the use of individual WL metrics raises the issue of scoring and interpretation. For example, determining team WL is a challenge because authors use various means to decide the score including a sum, minimum, or maximum of the individual WL scores. Team Workload Assessment. Team Workload Assessment (TWA) is a self-report questionnaire that was developed to evaluate WL in teams (Lin, Hsieh, Tsai, Yang, & Yenn, 2011). This questionnaire assesses WL in teams through several dimensions, including coordination, communication, support and leadership, and time sharing. Lin et al. (2011) compared the effectiveness of TWA with NASA-TLX in assessing team WL in the NPP domain. Results showed that TWA was a more sensitive metric of team WL, when compared to team WL metrics based on aggregated individual NASA-TLX scores.
2.4.1.2 Team Situation Awareness Measurement Team Situation Awareness metrics are in their developmental stages, as only recently has the theoretical framework of team SA been identified. The best examples of metrics for assessing team SA are the Computerized Adaptive Rating Scale (CARS; McGuinness, 1999) and Team-related Knowledge Measurement Instrument (Team KMI; Johnson et al., 2007). CARS is a subjective metric of SA that assesses perception, comprehension, projection, and integration. It is administered after a task and scores for individuals are often aggregated to provide a team SA rating. Team KMI is a subjective metric of team SA that focuses on measuring a level of team related knowledge that can be used to calculate the degree of shared knowledge, which represents the team’s shared mental model. 2.4.2 Teamwork Metrics: Key Issues Teamwork is a key element of NPP operation, but valid metrics are lacking. Thus, in applications that include TW assessment, it may be important to evaluate whether evidence of reliability and validity of the metric are provided. Findings from TW metrics are likely to be somewhat tentative, and so excessive weight should not be placed on them.
21
3 GENERIC METRICS CATALOG AND DECISION MAKING WIZARD 3.1 Generic Metrics Catalog: Overview The purpose of the Generic Metrics Catalog (GMC) is to compile information about WL, SA, and TW metrics in a readily accessible and easy-to-use format. It provides information about both the psychometric properties of a metric and the soundness of the methods used to investigate these properties. The information is captured in three groups of Excel spreadsheets corresponding to WL, SA, and TW (located on CD in the back of this report). The GMC serves as a technical reference for NRC staff assessing a metric proposed by an applicant. 3.1.1 Detailed Description of Generic Metrics Catalog The information in this section is most useful when used in conjunction with the GMC located on the WL, SA and TW GMC and DMW CD. For more detailed information and associated visuals, see Appendix A.
3.1.1.1 Presentation of Information Access to the Generic Metric Catalog (GMC) can be found in the Table of Contents on the Workload, Situation Awareness, and Teamwork GMC and DMW CD. The Table of Contents allows the user to access a spreadsheet for each WL, SA, and TW metric. In order to access the desired sheet, the user first clicks on the corresponding construct title (e.g., Workload Metrics) and subsequently the specific metric title of interest (e.g., NASA-TLX) in the list provided. The metric sheets are color-coded with the sheets colored in red representing WL metrics, sheets colored in blue representing SA metrics, and sheets colored in green representing TW metrics. The metric sheets are organized in the form of a table. In brief, the information provided for each metric is as follows: The name of the metric and short description is provided at the top of each sheet. This description provides reviewers with the full metric name and acronym (if relevant), and a high-level description of the metric. Each row of the table refers to a specific study where the metric was used, organized in relation to the research domain in which it was conducted. The columns of the table provide information for understanding the study.
3.1.1.2 Description of Table Columns This section describes the information provided for each study using a given metric, and its relevance for NRC staff. Each column has a header to indicate the content provided. Users can find column definitions within the GMC by holding the mouse over the heading and clicking once to open the definition. The first column (References) gives the corresponding number in the linked references spreadsheet that contains the full citation for the study, so that the user can locate the article if desired. The next column (Frequency) provides a code of 1 to confirm that the metric was used in the study. The frequency column is later tallied in the “GMC Metric Summary” spreadsheet for a total frequency for each domain and then for each metric. Higher frequency of use lends to a metric’s credibility and is related to the idea of sample size (see section 3.2). The next set of columns provides information on sample size. Several columns are necessary because samples may be based on either individuals or teams (groups). Also, samples drawn from a general population should be distinguished from samples of operators. Specifically, “Sample Size Non-operator” represents the number of participants drawn from a general

22
population (e.g., college students). “Sample Size Operator” represents the number of participants drawn from a specific “operator” population (e.g., NPP operators, air traffic control operators). For both types of samples, an indication of team or individual is provided along with the number in a team, and the total number of participants. As noted in Section 2.1.6., sample size is relevant to determining how much confidence can be attached to the findings of a given study. Other things being equal, more weight should be attached to findings from operator samples than non-operator samples, given that operators have a higher level of domain specific training and skill. Across multiple studies (rows), the Sample Size Non-operator (general sample) and Sample Size Operator (operator sample) group of columns also show information on how extensively each metric was used across the domains. Those within the NPP domain will likely be of most direct relevance. However, the features of other domains may be similar to the NPP domain, thus, it is helpful to understand which domains a metric has been used in to evaluate its potential utility for the NPP domain. The Scoring and Administration group of columns provides information about how each metric is typically scored and additional issues related to scoring and administrations practices. NRC staff can use this information in evaluating whether the applicant is administering and scoring the metric in the traditional way. The Psychometric Properties set of columns informs the reviewer about important psychometric properties of metrics as reported in each article including reliability, validity, sensitivity, diagnosticity, and intrusiveness (refer to section 2.1 for psychometric property descriptions). Taken together, the properties indicate the extent to which the metric is effective at measuring WL, SA and TW and the confidence that can be placed in study findings. The remaining columns are as follows. The Task Completion Time column provides information about the durations of the experiments in which the metrics were used. This information can be used to compare the duration of the experiment to that of a realistic work shift. It also describes time allocated to training, which provides an understanding of the level of participant knowledge. This is important because using a non-expert population for research in complex domains requires adequate training so that the results are more likely to be informative. Training is also necessary in order to ensure that performance is not an artifact of learning. The Task Fidelity column specifies the simulator fidelity used in the study in which the metric was administered, categorized as high, medium, or low. High fidelity is preferable as it is more ecologically valid, however, lower fidelities may be adequate for metric validation in some circumstances (e.g., to show sensitivity of the metric to some simple manipulation such as short term memory load). Finally, the Special Requirements column describes any special considerations that are required to replicate the study or to use the metric (e.g., special equipment/software). The tabs at the bottom of the table allow the reviewer to navigate the database without returning to the Table of Contents. They allow the user to switch directly between different metrics, they provide access to the DMW (described in the next section), and they provide access to supplemental information spreadsheets (Key Terms, Similarities Table, and References). In Figure 1, the red tabs (ATWIT, BRFS etc.) refer to other WL metrics.

23
Figure 1: GMC screenshot
3.1.1.3 Supplemental Sheets Returning to the Table of Contents, links to supplemental sheets (See Figure 5 in Appendix A) may be found: Key Terms, Similarities Table, and References (color coded in yellow) and the GMC Metric Summary, and Past Application (color coded in olive green). The content of each of these supplemental sheets is described below: The Key Terms spreadsheet is a glossary containing relevant definitions. The Similarities Table spreadsheet (See Figure 12 in Appendix A) provides a similarities matrix between metrics within WL, SA, and TW. The exact correlation values are highlighted in green and ratings of similarities are highlighted in orange. Ratings of similarities between two metrics were determined by experts answering a set of questions related to the metrics’ use and known psychometric properties (described in Chapter 2). Ratings of similarities were determined by the score obtained from the sum of three criteria: 1. Domain, 2. Administration Method (Interrupted, Post-Task, Continuous), and 3. Type of Metric (Subjective or Objective). Ratings ranged from 0-3 and Low, Medium, and High were assigned to 0-1, 1.1-2, and 2.1-3 ratings respectively. Ratings of similarities are provided in terms of low, medium, or high to represent the level of similarity between the metrics and should be distinguished from actual correlations that were found in the literature. Five individuals, well-informed on each metric, completed the ratings of similarity independently and then inter-rater reliability was calculated. A resulting similarity rating was entered into the table if at least three expert ratings were the same for a pair of metrics. Ratings of similarity were not calculated for metrics with less than three references due to high error of estimation.

24
The purpose of the similarities matrix is to provide reviewers an opportunity to compare metrics. This is important to the concept of “relation to other variables evidence” described in section 2.1. For instance, a reviewer might be familiar with the NASA-TLX, but the applicant is proposing to use a less familiar metric (e.g., ATWIT) to assess WL. The reviewer can access the Similarities Table to better understand if the properties of each metric are more similar than different. This is accomplished by reading the criteria provided below the Similarities Table spreadsheet in the GMC and then viewing the rating determined from inter-rater agreement shown in the corresponding cell of the metrics of interest. This comparison provides the reviewer a frame of reference for the metric being reviewed. The Similarities Table can be used as a starting point for acquiring additional information regarding metric pairs, but the ratings of similarity should be used with caution as these have not been experimentally tested. The References spreadsheet includes the references for all articles, books, or chapters that were used in the GMC. The sources within the metrics sheets are linked to the References sheet. The GMC Metric Summary spreadsheet is a compilation of all the data from each metric sheet into one table(See Figure 14 in Appendix A). The Past Application spreadsheet is a list of all saved application results to be recalled at a later date.
3.2 Decision Making Wizard: Overview The DMW is an excel-based tool that provides a decision tree to assist reviewers in evaluating the choice and implementation of a metric. The DMW accepts inputs from reviewers regarding the metric of interest. It compiles information entered by the reviewer and information stored in the GMC, and uses decision logic to generate a list of suggested questions that the reviewer may want to ask the applicant. 3.2.1 Detailed Description of the Decision Making Wizard The Workload, Situation Awareness, and Teamwork spreadsheets include flow charts and are identical in layout. Each decision making flow chart consists of the following columns: 1) Questions Asked by the DMW, 2) Instructions, 3) Inputs, and 4) Areas of Concern. The column “Questions Asked by the DMW” provides the questions the DMW asks in order to evaluate a particular metric. The Instructions column provides the directions technical review staff should follow for providing information in the Inputs column. The Instructions column will have a path arrow through it if the GMC automatically provides the information. Path arrows along with instructions guide the reviewer through the flow chart. The Inputs column allows the reviewer to select an option from a dropdown menu or shows automatically populated information from the GMC. To be clear, two types of inputs are used by the DMW: Reviewer Generated and GMC Generated. For Reviewer Generated inputs, the reviewer uses a selection menu to input information into the DMW, whereas GMC Generated inputs are automatically populated based on the information amassed in the GMC. Details regarding these automatically populated choices are detailed in Figure 2. The Areas of Concern (AOC) column lists potential questions regarding the quality and appropriate usage of the proposed metric that review staff may want to ask applicants. The Summary of Areas of Concern spreadsheet summarizes all of the comments from the Areas of Concern columns from the Workload, Situation Awareness, and Teamwork spreadsheets. There is a save feature that allows reviewers to save the “Areas of Concern”

25
resulting from the current session. Later, these results can be recalled for side-by-side comparison of results from revised inputs. The Questions for Reviewers spreadsheet compiles the information from the Summary of Areas of Concern spreadsheet and converts them into a user-friendly format (i.e., Word or PDF). The resulting saved Word document enables editing of the AOC whereas the saved PDF does not allow editing. It is important to note the disclaimer, “NRC reviewers may use questions generated by the DMW as input when composing RAIs. The GMC and DMW should not be used in place of technical reviewer judgment. The NRC reviewer is responsible for making a final decision based upon all content of the entire application.” The GMC and DMW is merely a tool to assist reviewers during the review process. 3.2.2 Decision Making Wizard Decision Logic The Decision Making Wizard (DMW) utilizes answers to ten questions to generate feedback to the technical review staff regarding the metric of interest. An explanation of the logic behind each of the questions is detailed in this section.
The first four questions require the reviewers’ input (i.e., answer) because the information must be extracted from the application under review. The inputs for the last six questions are automatically generated by the GMC from the information collected and compiled for the metric.
The DMW compares the input provided by reviewers to the information in the GMC in order to determine whether a metric is being used appropriately (i.e., in accordance with the DMW assessment criteria). Based on this comparison, technical review staff will either be directed to move to the next question, if the metric is being used appropriately, or will see comments in the “Areas of Concern” column for staff consideration if the metric is not being used appropriately. The logic that determines whether the DMW generates a comment in the “Areas of Concern” column is described and illustrated in Figure 2.
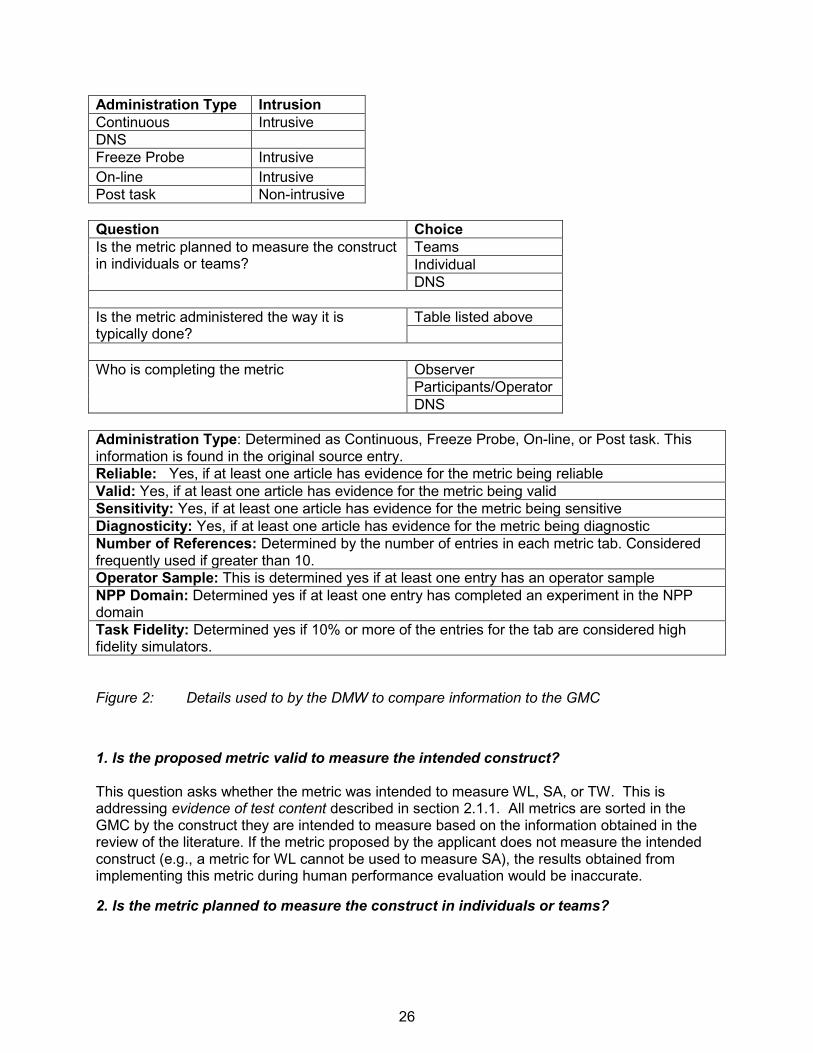
26
Administration Type Intrusion Continuous Intrusive DNS Freeze Probe Intrusive On-line Intrusive Post task Non-intrusive Question Choice Is the metric planned to measure the construct in individuals or teams?
Teams Individual DNS
Is the metric administered the way it is typically done?
Table listed above
Who is completing the metric Observer
Participants/Operator DNS
Administration Type: Determined as Continuous, Freeze Probe, On-line, or Post task. This information is found in the original source entry. Reliable: Yes, if at least one article has evidence for the metric being reliable Valid: Yes, if at least one article has evidence for the metric being valid Sensitivity: Yes, if at least one article has evidence for the metric being sensitive Diagnosticity: Yes, if at least one article has evidence for the metric being diagnostic Number of References: Determined by the number of entries in each metric tab. Considered frequently used if greater than 10. Operator Sample: This is determined yes if at least one entry has an operator sample NPP Domain: Determined yes if at least one entry has completed an experiment in the NPP domain Task Fidelity: Determined yes if 10% or more of the entries for the tab are considered high fidelity simulators. Figure 2: Details used to by the DMW to compare information to the GMC
1. Is the proposed metric valid to measure the intended construct? This question asks whether the metric was intended to measure WL, SA, or TW. This is addressing evidence of test content described in section 2.1.1. All metrics are sorted in the GMC by the construct they are intended to measure based on the information obtained in the review of the literature. If the metric proposed by the applicant does not measure the intended construct (e.g., a metric for WL cannot be used to measure SA), the results obtained from implementing this metric during human performance evaluation would be inaccurate.
2. Is the metric planned to measure the construct in individuals or teams?

27
Metrics developed to measure constructs in individuals are likely not valid, or, have not been validated for measuring the constructs in teams and vice versa. The DMW evaluates whether the metric usage (i.e. individuals or teams) proposed by the applicant has been validated (discussed in section 2.4) by comparing it to the usage in the original source. Physiological metrics are exceptions to the decision making logic of the original source as they can only be used for individuals.
3. Is the metric administered in its traditional manner? Each metric has been created and validated for use with a particular administration type (e.g., NASA-TLX was created as a post-task metric). If the applicant proposes an administration type that has not been validated, the results may be inaccurate or misleading. The DMW evaluates the proposed administration (e.g., post-task, freeze probe) by comparing it to the original source.
4. Who is completing the metric?
Some metrics are designed to be completed directly by the participant/operator (e.g., SWAT), and others are to be completed by observers or raters (e.g., SABARS). This information is found in the original source and supported by other literature available for the metric. If the applicant does not plan to have the appropriate respondent completing the metric, the results obtained from implementing this metric during the human performance evaluation may be invalid or misleading.
5. Is the metric potentially intrusive to the scenario? Intrusiveness is discussed in section 2.1.3. A metric is labeled as non-intrusive if it does not interfere with the primary task. If intrusive, the way in which it is intrusive is listed in the areas of concern (e.g., physical, cognitive, task freeze). Intrusion may significantly alter the psychological or physical processes that are being investigated. The inputs previously entered into questions 3 and 4 will determine if the metric is intrusive to the experimental scenario.
6. Is the metric sufficiently reliable, valid, sensitive, and diagnostic? Standards for these psychometric properties are discussed in section 2.1. Validity, for this question, refers to all evidences discussed in section 2.1.1 other than test content, which is addressed in Question 1. If there is one study demonstrating a particular psychometric property, then the metric is considered sufficient in demonstrating that property (i.e., reliable, valid, sensitive, or diagnostic). If the metric proposed by the applicant is not sufficiently reliable, valid, sensitive, and/or diagnostic, the results obtained will be suspect.
7. Has the metric been frequently used? The more a metric has been used lends to its credibility and is related to the idea of sample size presented in section 2.1.6. Ten articles were required for the DMW as an indication that the metric has some acceptance in the field and has been used by more than the creators of that metric. However, frequency of use does not necessarily imply the quality of the metric. It should be considered alongside the other psychometric properties. 8. Has the metric been used with operator samples?
28
This question informs the reviewer whether the metric proposed by the applicant has been used with operator samples from any domain. Experts differ from novices in performance of tasks and therefore, responses to metrics can also differ between experts and novices. It is possible that a metric is, for instance, sensitive for novices but not for experts. In the NPP domain, the population of interest is typically licensed operators, therefore metrics found to be sensitive and diagnostic with experts from similar domains will likely be more suitable. 9. Has the metric been used in the NPP domain? A metric that has not been validated in the NPP domain (i.e., there are no studies from nuclear domain) may not be suitable for use in the NPP domain. For example, metric items worded for the air traffic control domain may not be suitable for use in the NPP domain.
10. Has the metric been used with high fidelity simulators? This question informs the reviewer whether the metric proposed by the applicant has been used with simulators with a high level of realism in at least 10% of the studies using the given metric. In order to gain an accurate assessment of task performance within an integrated system, the NPP domain uses high fidelity, full-scale simulators to ensure the system design supports the safe operation of the plant. For this reason, a metric validated using a high fidelity simulator may be more applicable for use in the NPP domain. The10% cut-off was determined because nearly all metrics have been used with at least one high fidelity simulator; therefore, the requirement was 10% to differentiate metrics more widely used with high fidelity simulators.
29
4 REFERENCES Abich, J. IV. “Investigating the Universality and Comprehensive Ability of Measures to Assess the State of Workload.” Doctoral Dissertation. University of Central Florida. 2013 Alexander, A. L., T. E. Nygren, and M. A. Vidulich. “Examining the Relationship between Mental Workload and Situation Awareness in a Simulated Air Combat Task.” Wright-Patterson AFB. 2000. American Educational Research Association, American Psychological Association, and National Council on Measurement in Education. Standards for Educational and Psychological Testing. Washington, DC: American Educational Research Association. 1999. Bedney, G. and Mesiter, D. “Theory of Activity and Situation Awareness.” International Journal of Cognitive Ergonomics, Vol. 3, No. 1: pp. 63-72. 1999. Billings, C. E. Aviation Automation: The Search for a Human-Centered Approach. Mahwah, NJ; Lawrence Erlbaum Associates, 1997. Bochner, S. “Defining Intolerance of Ambiguity.” Psychology Record, Vol.15, pp. 393-400. 1965. Boles, D. B., and Adair, L. P. “The Multiple Resources Questionnaire (MRQ).” Proceedings of the Human Factors and Ergonomics Society Annual Meeting, Vol. 45, No. 25: pp. 1790–1794. 2001a. Brannick, M. T., Salas, E., and Prince, C. W. (Eds.). Team Performance Assessment and Measurement: Theory, Methods, and Applications. Psychology Press. 1997. Brown, T. J., S. H. Conrad, and W. E. Beyeler. Complex Adaptive Systems Engineering-Improving Our Understanding of Complex Systems and Reducing Their Risk. 2012. Busby, J. S., and Hughes, E. J. “Projects, Pathogens and Incubation Periods.” International Journal of Project Management, Vol. 22, pp. 425-434. 2004. Cacioppo, J. T., Petty, R. E., and Kao, C. F. “The Efficient Assessment of Need for Cognition.” Journal of Personality Assessment, Vol.48, pp. 306–307. 1984. Cain, B. “A Review of The Mental Workload Literature.” Defense Research and Development, Toronto, Canada. 2007. Cannon-Bowers, J. A., and E. Salas. “Reflections on Shared Cognition.” Journal of Organizational Behavior. Vol. 22, No. 2: pp. 195-202. 2001. Cannon-Bowers, J. A., and E. Salas. “Teamwork Competencies: The Interaction of Team Member Knowledge, Skills, and Attitudes.” In H. F. O’Neil (Ed.), Workforce Readiness: Competencies and Assessment (pp. 151–74). Mahwah, NJ: Erlbaum, 1997. Camilli, M., M. Terenzi, and F. Di Nocera. “Concurrent Validity of an Ocular Measure of Mental Workload.” In D. de Waard, G.R.J. Hockey, P. Nickel, and K.A. Brookhuis (Eds.), Human Factors Issues in Complex System Performance (pp. 117-129). Maastricht, the Netherlands: Shaker Publishing. 2007. Card, S. K., Newell, A., & Moran, T. P. (1983). The psychology of human-computer interaction. Castle, H., and H. Leggatt. Instantaneous Self-Assessment (ISA) –Validity and Reliability. Bristol, United Kingdom: BAE Systems, 2002. Chang, Y.H.J. & Mosleh, A. “Cognitive modeling and dynamic probabilistic simulation of operating crew response to complex system accident. Part 2: IDAC performance influencing factors model.” Reliability Engineering and System Safety, 92, 1014-1040. 2006. Chiocchio, F. “Project Team Performance: a Study of Electronic Task and Coordination Communication.” Project Management Journal. Vol. 38, No 1: pp. 97-109. March 2007. Cohen, J. Statistical Power Analysis for the Behavioral Sciences (second ed.).Hillsdale, NJ: Lawrence Erlbaum Associates. 1988. Cooke, N. J., Salas, E., Kiekel, P. A., and Bell, B. “Advances in Measuring Team Cognition.” Team Cognition: Understanding the Factors that Drive Process and Performance, pp. 83-106. 2004.

30
Davies, D. R., and R. Parasuraman. The Psychology of Vigilance. New York: Academic Press, 1982. De Waard, D. “The Measurement of Drivers’ Mental Workload.” Doctoral Dissertation. University of Groningen, Groningen. 1996. Delbridge, K. A. “Individual Differences in Multi-Tasking Ability: Exploring a Nomological Network.” Unpublished doctoral dissertation, Michigan State University, East Lansing. 2000. Dickinson, T. L., and R. M., McIntyre. “A Conceptual Framework for Teamwork Measurement.” In M. T. Brannick, E. Salas, and C. Prince (Eds.), Team Performance Assessment and Measurement: Theory, Methods and Applications (pp. 19-43). Mahwah, NJ: Lawrence Erlbaum Associates, 1997. Dyer, J.L. “Team Research and Team Training: A State-of-the-Art Review.” Human Factors Review. pp. 285-323. 1984. Eggemeier, F. T., G. F. Wilson, A. F. Kramer, and D. Damos. “Workload Assessment in Multi-Task Environments.” In D. L. Damos (Ed.), Multiple-task performance (pp. 207-216). London, England: Taylor & Francis. 1991. Endsley, Mica R. "Design and evaluation for situation awareness enhancement." Proceedings of the Human Factors and Ergonomics Society Annual Meeting. Vol. 32. No. 2. SAGE Publications, 1988. Endsley, M. R. “Toward a Theory of Situation Awareness in Dynamic Systems.” Human Factors. Vol. 37, No. 1: pp. 32-64. March 1995. Endsley, M. R. “Designing for Situation Awareness in Complex Systems.” In Proceedings of the Second International Workshop on Symbiosis of Humans, Artifacts, and Environment. 2001, November. Endsley, Mica R. "Design and evaluation for situation awareness enhancement." Proceedings of the Human Factors and Ergonomics Society Annual Meeting. Vol. 32. No. 2. SAGE Publications, 1988. Farmer, E., and A. Brownson. Technical Report CARE-Integra-TRS-130-02-WP2, EUROCONTROL. “Review of Workload Measurement, Analysis and Interpretation Methods.” 2003. Flin, R., P. O'Connor, and K. Mearns. Crew Resource Management: Improving Safety in High Reliability Industries. Team Performance Management. Vol. 8: pp. 68-78. 2002. Fracker, M.L. “Measures of Situation Awareness: Review and Future Directions.” Wright-Patterson AFB. 1991. Friedenberg, J., & Silverman, G. Cognitive Science: An Introduction to the Study of Mind. Sage. 2006. Gawron, V. J. Human Performance, Workload, and Situational Awareness Measures Handbook. Taylor & Francis Group, 2008.

31
Gevins, A., Smith, M.E., Leong, H., McEvory, L., Whitfield, S., Du, R., & Rush, G. “Monitoring Working Memory Load during Computer-Based Tasks with EEG Pattern Recognition Methods.” Human Factors. Vol. 40, No. 1: pp. 79–91. March 1998. Gilson, R. D. “Special Issue Preface.” Human Factors: The Journal of the Human Factors and Ergonomics Society, Vol. 37, No. 1, pp: 3-4. 1995. Gopher, D., and Donchin, E. “Workload: An Examination of the Concept.” In K.R. Boff, L. Kaufman, & J.P. Thomas (Eds.), Handbook of Perception and Human Performance, Volume II, Cognitive Process and Performance (pp. 1-49). New York: Wiley. 1986. Ha, C. H.,Kim, J.H., Lee, S.J., & Seong, P.Hl. “Investigation on Relationship between Information Flow Rate and Mental Workload of Accident Diagnosis Tasks in NPPs.” IEEE Transactions on Nuclear Science. Vol. 53, No. 3: pp. 1450-1459. June 2006. Hallbert, B. P., A. Sebok, and D. Morisseau. NUREG/IA-0137, “A Study of Control Room Staffing Levels for Advanced Reactors.” NRC: Washington, D.C. 2000. Hart, S. G., and C. D. Wickens. “Workload Assessment and Prediction.” In H. R. Booher (Ed.), An Approach to Systems Integration (pp. 257–296). New York: Van Nostrand Reinhold. 1990. Hart, S. G., and L. E. Staveland. “Development of a Multi-Dimensional Workload Scale: Results of Empirical and Theoretical Research.” In P. A. Hancock & N. Meshkati (Eds.), Human Mental Workload (pp. 139-183). Amsterdam: North-Holland. 1988. Hill, S. G., Iavecchia, H.P., Byers, J.C., Bittner, A.C. Zaklade, A.L., Christ, R.E. “Comparison of Four Subjective Workload Rating Scales.” Human Factors. Vol. 34, No. 4: pp. 429-439. August 1992. Hockey, G. R. J. “Compensatory Control in the Regulation of Human Performance Under Stress and High Workload: A Cognitive-Energetical Framework. Biological Psychology, Vol. 45, No.1-3: pp. 73-93. 1997. Hogg, D.N., Folles, K., Stand-Volden, F. & Torralba, B. “Development of a Situation Awareness Measure to Evaluate Advanced Alarm Systems in Nuclear Power Plant Control Rooms.” Ergonomics. Vol. 38, No. 11: pp. 2394-2413. November 1995. Huey, B. M., and C. D. Wickens. Workload Transition: Implications for Individual and Team Performance. Washington, DC: National Academy Press, 1993. Hwang, S. L., Yau, Y. J., Lin, Y. T., Chen, J. H., Huang, T. H., Yenn, T. C., and Hsu, C. C. (2008). Predicting Work Performance in Nuclear Power Plants. Safety Science, 46(7), 1115-1124. Johnston, J., K., Smith-Jentsch, and J. A. Cannon-Bowers. “Performance Measurement Tools for Enhancing Team Decision-Making Training.” In M. T. Brannick, E. Salas, & C. Prince (Eds.), Team Performance Assessment and Measurement: Theory, Methods, and Applications. Hillsdale, NJ: LEA, 1997.

32
Johnson, T., Lee, Y., Lee, M., O’Connor, D.L., Khalil, M.K., & Huang, X. "Measuring Sharedness of Team-Related Knowledge: Design and Validation of a Shared Mental Model Instrument." Human Resource Development International, Vol. 10, No. 4: pp. 437-454. 2007. Jou, Y., T., Yenn, T, Lin, C.J., Yang, C., Chiang, C. “Evaluation of Operators’ Mental Workload of Human-System Interface Automation in the Advanced Nuclear Power Plants.” Nuclear Engineering and Design. Vol. 239, No. 11: pp. 2537-2542. March 2009. Kahneman, D. Attention and Effort. Englewood Cliffs, NJ: Prentice Hall. 1973. Kantowitz, B. H., and J. L. Knight. Testing Tapping Timesharing, II: Auditory Secondary Task. Acta Psychologia, Vol.40, No. 5: pp. 343-362. 1976. Knowles, W. B. “Operator Loading Tasks. Human Factors, Vol., No.5, pp. 155-162. Kramer, A. F., E. J. Sirevaag and Braune, R. “A Psychophysiological Assessment of Operator Workload During Simulated Flight Missions. Human Factors, Vol. 29, No. 2: pp. 145-160. 1987. Lansdown, T.C., Brook-Carter, N. & Kersloot, T. “Distraction from Multiple In-Vehicle Secondary Tasks: Vehicle Performance and Mental Workload Implications.” Ergonomics, Vol. 47, No. 1, pp: 91-104, DOI: 10.1080/0014013031000162977. 2004. Lim, B. C., and K. J. Klein. “Team Mental Models and Team Performance: A Field Study of the Effects of Team Mental Model Similarity and Accuracy.” Journal of Organizational Behavior. Vol. 27: pp. 403-418. June 2006. Lin, C. J., Hsieh, T., Tsai, P., Yang, C., & Yenn, T. “Development of a Team Workload Assessment Technique for the Main Control Room of Advanced Nuclear Power Plants.” Human Factors and Ergonomics in Manufacturing & Service Industries. Vol. 21, No. 4: pp. 397–411. January 2011. Liu, Q., Nakata, K., & Faruta, K. (2004). Making control systems visible. Cognition, Technology and Work, 6(2), 87-106. DOI: 10.1007/s10111-003-0148-5. Marks, M. A., J. E., Mathieu, and S. J. Zaccaro. “A Temporally Based Framework and Taxonomy of Team Processes.” The Academy of Management Review. Vol. 26: pp. 356-376. July 2001. Matthews, G., & Campbell, S. E. (1998, October). Task-induced stress and individual differences in coping. In Proceedings of the Human Factors and Ergonomics Society Annual Meeting (Vol. 42, No. 11, pp. 821-825). SAGE Publications. Matthews, G., Davies, D., Stammers, R., & Westerman, S.J. Human Performance: Cognition Stress and Individual Differences. UK: Psychology Press, 2000. McCallum, G. A., R., Oser, and E. Salas. “Toward a Definition of Teamwork: Behavioral Patterns of Effective Teams”. Naval Training Systems Center. Orlando, FL. 1989. McGuinness, B. Proceeding of the Avionics Conference; ERA Technology Report 99-0815, “Situational Awareness and the CREW awareness rating scale (CARS).” ERA. Heathrow; November 1999.
33
Mearns, K., Flin, R., Gordon R., & Fleming, M. “Human and Organizational Factors in Offshore Safety.” Work & Stress. Vol. 15, No. 1: pp. 144-160. January 2001. Megaw, E. “The Definition and Measurement of Mental Workload.” In J. Willson, & N. Corlett (Eds.), Evolution of Human Work (3rd Ed.) (521-551). London: Taylor & Francis. 2005. Meshkati, N., and P. A Hancock. (Eds.). Human Mental Workload. New York, NY: Elsevier. 2011. Miller, S. Literature review: Workload Measures. Iowa City, IA: National Advanced Driving Simulator Technical Report N01-006. 2001. Mohammed, S., and B. C. Dumville. “Team Mental Models in a Team Knowledge Framework: Expanding Theory and Measurement across Disciplinary Boundaries.” Journal of Organizational Behavior. Vol. 22, No. 2: pp. 89-106. 2001. Moray, N. “Where is Capacity Limited? A Survey and a Model.” Acta Psychologica, Vol. 27: pp. 84– 92. 1967. Moray, N. “Models and Measures of Mental Workload.” Mental workload: Its Theory and Measurement. New York, NY: Plenum Press. 1979. Moray, N., and I. Rotenberg. “Fault Management in Process Control: Eye Movement and Action.” Ergonomics. Vol. 23, No. 11: pp. 1319-1342. November 1989. Moroney, W.F., Biers, D. W., Eggemeier, F. T., & Mitchell, J. A. “A Comparison of Two Scoring Procedures with the NASA Task Load Index in a Simulated Flight Task.” Aerospace and Electronics Conference. 1992. Mulder, G. “The Concept and Measurement of Mental Effort.” In G. R. J. Hockey, A. W. K. Gaillard, & M. G. H. Coles (Eds.), Energetics and Human Information Processing. Dordrecht: Martinus Nijhoff. 1986. Navon, D., and D. Gopher. “On the Economy of the Human-Processing System.” Psychological Review, Vol. 86, No. 3: pp. 214. 1979. Neisser, U. Cognition and reality: Principles and implications of cognitive psychology. New York: Freeman.1976. NRC. Human Factors Engineering Program Review Model (NUREG-0711, Rev. 3). Washington, D.C.: U.S. Nuclear Regulatory Commission. 2012. Nunnally, J.C., & Bernstein, I.H. Psychometric Theory (3rd ed.). New York: McGraw-Hill. 1994. Nygren, T. E. “Psychometric Properties of Subjective Workload Measurement Techniques: Implications for their Use in the Assessment of Perceived Mental Workload. Human Factors, Vol. 33, pp 17–33. 1991. O’Dea, A., and R., Flin. “Site Managers and Safety Leadership in the Offshore Oil and Gas Industry.” Safety Science. Vol. 37, No.1: pp. 39-57. June 2000.

34
O’Donnell, R.D., and F.T. Eggemeier. “Workload assessment methodology.” In: K.R. Boff, L. Kaufman, & J.P. Thomas (Eds.), Handbook of Perception and Human Performance: Vol. II. Cognitive Processes and Performance. New York: Wiley Interscience (pp. 42-49).1986. Ogden, G. D., Levine, J. M., & Eisner, E. J. “Measurement of workload by secondary tasks”. Human Factors, Vol. 21, pp. 529-548. 1979. Parasuraman, R., & Wilson, G. F. “Putting the Brain to Work: Neuroergonomics Past, Present, and Future.” Human Factors: The Journal of the Human Factors and Ergonomics Society, Vol. 50. No. 3: pp. 468–474. 2008. Patrashkova-Volzdoska, R. R., McComb, S.A., Green, S.G., & Compton, W.D. “Examining a Curvilinear Relationship between Communication Frequency and Team Performance in Cross-Functional Project Teams.” IEEE Transactions on Engineering Management. Vol. 50, No. 3: pp. 262-269. August 2003. Patrick, J., James, N., Ahmed, A., & Halliday, P. “Observational Assessment of Situation Awareness, Team Differences and Training Implications.” Ergonomics. Vol. 49: pp. 393-417. March 2006. Pinto, M.B., and J.K. Pinto. “Determinants of Cross-Functional Cooperation in the Project Implementation Process.” Project Management Journal. Vol. 20: pp. 13–20. June 1991. Raabe, M., Rutschmann, R.M., Scrauf, M., Greenlee, M.W. “Neural Correlates of Simulated Driving: Auditory Oddball Responses Dependent on Workload.” In D. D. Schmorrow (Ed.), Foundations of Augmented Cognition (pp. 1067-1076). Mahwah, NJ: Lawrence Erlbaum Associates, Inc. Publishers, 2005. Rasmussen, J. “Reflection on the Concept of Workload.” In N. Moray (Ed.), Mental Workload (pp. 29–40). New York, NY: Plenum Press. 1979. Rasmussen, J. “Skills, Rules, and Knowledge; Signals, Signs, and Symbols, and other Distinctions in Human Performance Models.” IEEE Transactions on Systems, Man and Cybernetics, Vol. 3, pp. 257-266. 1983. Rasmussen, J. Proceedings of the Human Factors Society 26th Annual Meeting. “The Role of Cognitive Models of Operators in the Design, Operation, and Licensing of Nuclear Power Plants.” October 1982. Rasmussen, T. H., and H. J., Jeppesen. “Teamwork and Associated Psychological Factors: A Review.” Work & Stress. Vol. 20, No. 2: pp. 105-128. April 2006. Reason, J. Human Error. Cambridge, UK: Cambridge University Press. 1990. Reinartz, S.J. “Analysis of Team Behavior during Simulated Nuclear Power Plant Incidents.” In Megaw, E.D. (Ed) Contemporary Ergonomics. Taylor and Francis, London (pp. 188-193). 1989. Reinerman-Jones, L.E., Taylor, G., Sprouse, K., Barber, D., and Hudson, I. “Adaptive Automation as a Task Switching and Task Congruence Challenge.” Proceedings of the Human Factors and Ergonomics Society. 2011.

35
Reinerman-Jones, L.E., Taylor, G., Cosenzo, K., & Lackey, S. “Analysis of Multivariate Physiological Data.” Proceedings of the Bi-Annual Meeting of HCI International. 2011. Rubio, S. Diaz, E., & Puente, J.M. “Evaluation of Subjective Mental Workload: A Comparison of SWAT, NASA-TLX and Workload Profile Methods.” Applied Psychology: An International Review. Vol. 53, No. 1: pp. 61-86. January 2004. Salas, E., D. E., Sims, and C. S., Burke. “Is There a “Big Five” in Teamwork?” Small Group Research. Vol. 36, No. 5: pp. 555-599. October 2005. Salas, E., Stagl, K. C., and Burke, C. S. “25 Years of Team Effectiveness in Organizations: Research Themes and Emerging Needs.” International Review of Industrial and Organizational Psychology, Vol. 19, pp. 47-92. 2004. Salmon, P., Stanton, N., Walker, G., and Green, D.. Situation Awareness Measurement: A Review of Applicability for C4i environments. Applied Ergonomics, Vol.37, No. 2: pp. 225-238. 2006. Sarter, N. B. and D. D. Woods. “Situation Awareness: A Critical but Ill-Defined Phenomenon.” The International Journal of Aviation Psychology. Vol. 1, No. 1: pp.45-57. 1991. Shamir, B. (1990). Calculations, values, and identities: The sources of collectivistic work motivation. Human Relations, 43(4), 313-332. Shanahan, C., Best. C., & Sutton, C (2007). DSTO Technical Report “Measurement of the Behavioral, Cognitive and Motivational Factors Underlying Team Performance.” Edinburgh, South Australia. Scholtes, P. The Team Handbook: How to Use Teams to Improve Quality. Madison, WI, Joiner Associates. 1988. Smith, K., and Hancock, P. A. Situation Awareness is Adaptive, Externally-Directed Consciousness. In: R.D. Gilson., D.J. Garland, and J.M. Koonce (Eds.). Situational Awareness in Complex Systems. Embry-Ridlle Aeronautical University Press: Daytona Beach, Fl, (pp. 59-68) 1994. Smith, K., and Hancock, P. A. “Situation Awareness is Adaptive, Externally Directed Consciousness.” Human Factors: The Journal of the Human Factors and Ergonomics Society, Vol. 37, No. 1, pp. 137-148. 1995. Stanton, N. A., Chambers, P. R. G., and Piggott, J. “Situational Awareness and Safety.” Safety Science, Vol. 39, No. 3: pp. 189-204. 2001. Stanton, N. A., and Walker, G. H. Human Factors. Methods: A Practical Guide for Engineering and Design. Ashgate Publishing, Ltd. 2013. Tattersall, A. J., and P. S. Foord. “An Experimental Evaluation of Instantaneous Self-Assessment as a Measure of Workload.” Ergonomics. Vol. 39, No. 5: pp. 740-748. 1996. Taylor, G. S. “Comparing Types of Adaptive Automation within a Multi-tasking Environment.” Doctoral Dissertation. University of Central Florida. 2012.

36
Taylor, R. M. “Situational Awareness Rating Technique (SART): The Development of a Tool for Aircrew Systems Design.” Situational Awareness in Aerospace Operations, AGARD-CP- 478. 3-1 - 3-37. 1990. Theureau, J. “Nuclear Reactor Control Room Simulators: Human Factors Research and Development.” Cognition, Technology & Work. Vol. 2, No. 2: pp. 97-105. November 2000. Uhlarik, J., and D.A. Comerford. “A Review of Situation Awareness Literature Relevant to Pilot Surveillance Functions.” Department of Transportation. Federal Aviation Administration, Washington, D.C. 2002. Veltman, J. A., and A. W. K. Gaillard. “Physiological Indices of Workload in a Simulated Flight Task.” Biological Psychology, Vol.42: pp. 323–342. 1996. Wagner, J. A. (1995). Studies of individualism-collectivism: Effects on cooperation in groups. Academy of Management Journal, 38, 152-172 Weaver, S. J., et al. Proceedings of the 43rd Annual Interservice Industry Training, Simulation, and Education Conference (I/ITSEC), “Team Training for Medical Military Teams: Using Simulation to Improve Teamwork.” Orlando, 2009. Weil, S. A., Hussain, T.S., Diedrich, Ferguson, W., & MacMillan, J. Proceedings of the 2004 Interservice/Industry Training, Simulation, and Education Conference (I/ITSEC). “Assessing Distributed Team Performance in DARWARS Training: Challenges and Methods.” Orlando, 2004. Wickens, C. “Processing Resources and Attention.” In D. Damos (Ed.), Multiple-Task Performance (3-34). Bristol, PA: Taylor & Francis Ltd. 1991. Wickens, C. D. (1984). Engineering Psychology and Human Performance. New York, NY: Harper Collins. Wickens, C. D. (1992). Engineering Psychology and Human Performance (2nd ed.). New York, NY: Harper Collins. Wickens, C. D., & Hollands, J. G. Engineering psychology and human performance (3rd ed.). Upper Saddle River, NJ: Prentice Hall. 2000. Wickens, C. D. “Multiple resources and mental workload.” Human Factors, Vol. 50, No. 3: pp. 449-455. 2008. Wickens, C. D., & Hollands, J. G. “Engineering Psychology and Human Performance” (3rd ed.). Prentice Hall. 2000. Wierwille, W. W. and F. T., Eggemeier. “Recommendations for Mental Workload Measurement in a Test and Evaluation Environment.” Human Factors. Vol. 35, No. 2: pp. 263-281. 1993. Yeh, Y. Y., and C.D. Wickens. “Dissociation of Performance and Subjective Measures of Workload.” Human Factors. Vol. 30, No. 1: pp. 111–120. February 1988.
A-1
APPENDIX A - Generic Metrics Catalog and Decision Making Wizard User Guide
1. About the User Guide The goal of this user guide is to instruct and train technical review staff on the organization, capabilities, and applications of the GMC and DMW. Readers should use this manual in conjunction with the Workload, Situation Awareness, and Teamwork GMC and DMW tool which can be found on the CD accompanying this NUREG/CR. Upon the completion of this guide, staff should achieve a general understanding of the GMC and DMW composition. The user guide discusses the general layout and main functions of the DMW and the GMC. The user guide also provides directed practice using both tools for evaluating a metric from a hypothetical application. 2. Navigating the GMC AND DMW This section has two objectives: 1) familiarize the user with the GMC and DMW and 2) provide the user with an understanding and the rationale behind the elements included in the GMC and DMW. The GMC and DMW consists of two distinct, yet integrated, components: 1) the GMC which compiles information about WL, SA, and TW metrics and 2) the DMW which is a tool that obtains information from the technical review staff and the GMC and uses decision logic to generate a list of suggested questions that technical review staff may want to ask an applicant. These two components are presented in a manner that allows the user to move between them with ease to best suit the user’s needs. The GMC and DMW is an Excel file consisting of multiple color-coded spreadsheets. The users will only need basic Excel skills to use the GMC and DMW. Below, are steps to show the components and navigation within the GMC and DMW. The italicized directions move through the structure and content of the GMC and DMW, beginning with the DMW followed by the GMC.

A-2
Figure 3: Enable content
STEP 1: Open the GMC and DMW by double-clicking on the file. Enable content and macros if prompted.
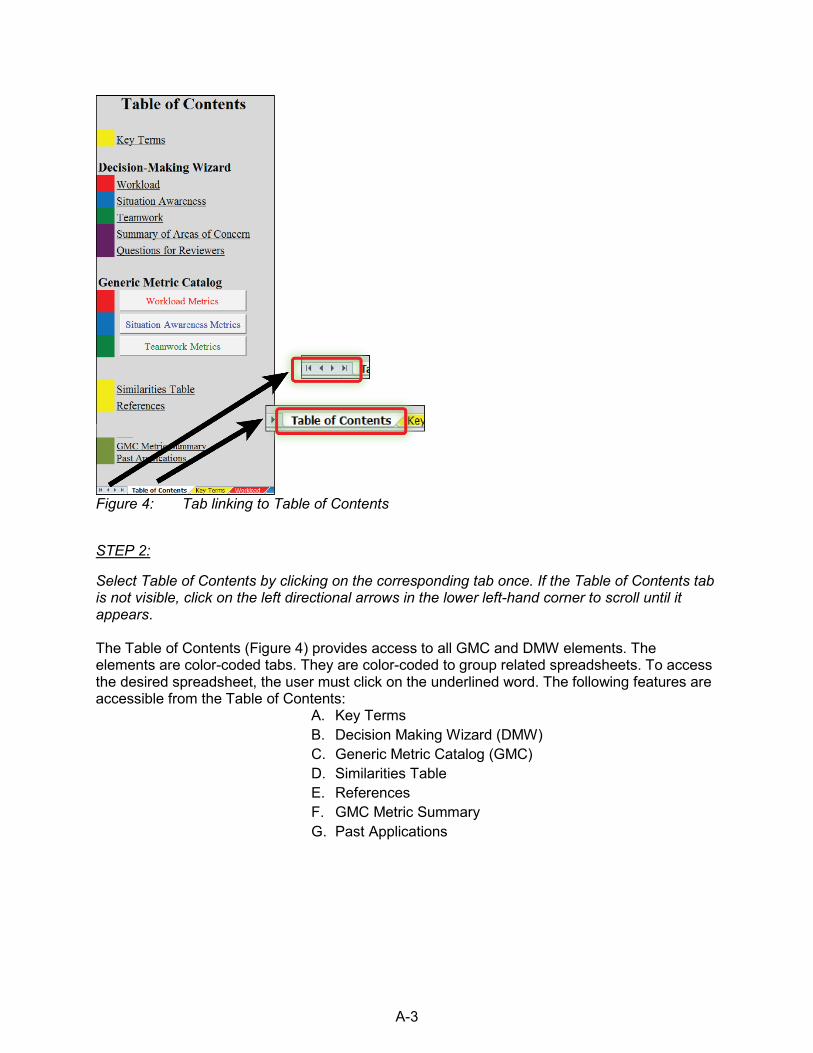
A-3
Figure 4: Tab linking to Table of Contents
STEP 2:
Select Table of Contents by clicking on the corresponding tab once. If the Table of Contents tab is not visible, click on the left directional arrows in the lower left-hand corner to scroll until it appears. The Table of Contents (Figure 4) provides access to all GMC and DMW elements. The elements are color-coded tabs. They are color-coded to group related spreadsheets. To access the desired spreadsheet, the user must click on the underlined word. The following features are accessible from the Table of Contents:
A. Key Terms B. Decision Making Wizard (DMW) C. Generic Metric Catalog (GMC) D. Similarities Table E. References F. GMC Metric Summary G. Past Applications

A-4
Each element is described below:
A. Key Terms: A glossary to help the user understand terminology used in the GMC and DMW.
B. DMW: Technical review staff may use the DMW to support their review process by selecting inputs according to the information provided in an NPP application. The Workload, Situation Awareness, and Teamwork spreadsheets are identical in layout.
Figure 5: The DMW portion of the Table of Contents
STEP 3: Click on Teamwork under the DMW in the Table of Contents. The Workload, Situation Awareness, and Teamwork spreadsheets include flow charts and are identical in layout (See Figure 6 for a sample of the layout for the Teamwork spreadsheet). Each decision making flow chart consists of the following columns: 1) Questions Asked by the DMW, 2) Instructions, 3) Inputs, and 4) Areas of Concern. The column “Questions Asked by the DMW” provides the questions the DMW asks in order to evaluate a particular metric. The Instructions column provides the directions reviewers should follow for providing information in the Inputs column. The Instructions column will have a path arrow through it if the GMC automatically

A-5
provides the information. Path arrows along with instructions guide the reviewer through the flow chart.
Figure 6: Teamwork DMW spreadsheet
The DMW asks two types of questions: 1) questions that require an input from the technical review staff and 2) questions for which inputs are automatically generated based on information provided by the GMC (more on the content of the GMC is in Section 2.2). The questions on the left of the screen are questions of interest with regard to the evaluation of a particular metric (See Figure 7). The first question, which requires input by the review staff, examines whether scientists designed the selected metric to measure the intended construct (e.g., TW). If the selected metric measures the intended construct, additional questions will appear. Otherwise, no additional questions appear. The three subsequent questions will also require input from the review staff by selecting from a drop-down menu. The final six questions will automatically populate from data in the GMC. All inputs allow for the “does not specify” (DNS) option if the information is unknown or not available.
Figure 7: DMW Questions

A-6
Table 1 provides the questions included in the DMW along with the reason for why each is important to the evaluation of a metric. The questions in the Questions Asked by the DMW column link back to the Key Terms spreadsheet. Click on the cell to activate the link. This feature provides direct access to definitions and additional information for the vocabulary and concepts in each row.
Table 1 DMW questions and their relationship to metric evaluation
Questions asked of the GMC Importance
Does the proposed metric measure the intended construct?
A metric that was created to measure the intended construct is important to provide evidence of test content, which is one aspect of validity.
Is the metric planned to measure the construct in individuals or teams?
A metric created to measure the construct in individuals might not be valid to measure the construct in teams.
Is the metric administered in its tradition manner?
A metric validated for a specific method of administration (e.g., post-task) is not necessarily valid if administered differently (e.g., freeze-probe).
Who is completing the metric? A metric validated for being completed by a specific individual (e.g., supervisor) is not necessarily valid for completion by a different individual (e.g., participant/operator).
Is the metric potentially intrusive to the scenario?
A metric that is intrusive to the task or the person might impact the operator’s state or performance.
Is the metric sufficiently reliable, valid, sensitive, and diagnostic?
Reliability describes how consistently the metric measures the construct. Validity describes the metric's ability to accurately represent the construct to be measured. Sensitivity describes how effective the metric is at detecting changes in task manipulations. Diagnosticity describes the metric’s capability to differentiate reasons for the measurement results (e.g., why was WL high).
Has the metric been frequently used?
The more a metric has been used, contributes to its credibility and is related to the idea of sample size presented in section 3.2. However, frequency of use does not necessarily imply the quality of the metric. It should be considered alongside the other psychometric properties.
Has the metric been used with operator samples?
A metric found to be applicable for use with operator samples may be more suitable for the NPP domain because of increased generalizability.
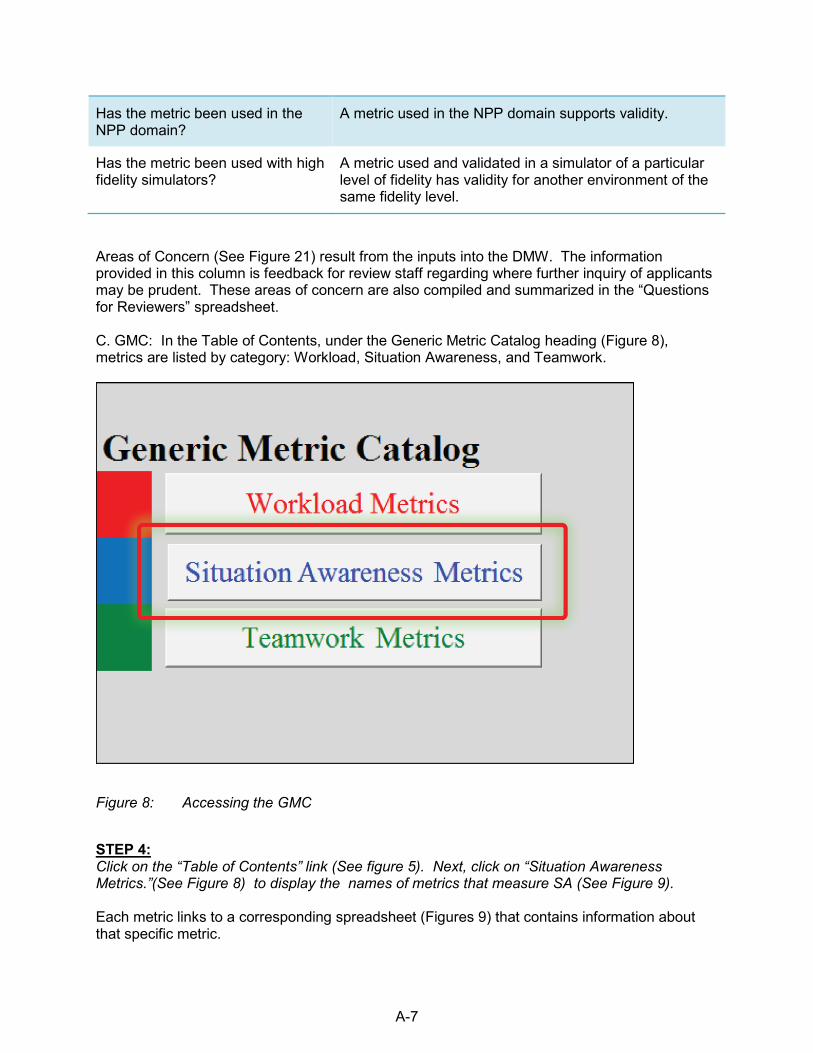
A-7
Has the metric been used in the NPP domain?
A metric used in the NPP domain supports validity.
Has the metric been used with high fidelity simulators?
A metric used and validated in a simulator of a particular level of fidelity has validity for another environment of the same fidelity level.
Areas of Concern (See Figure 21) result from the inputs into the DMW. The information provided in this column is feedback for review staff regarding where further inquiry of applicants may be prudent. These areas of concern are also compiled and summarized in the “Questions for Reviewers” spreadsheet. C. GMC: In the Table of Contents, under the Generic Metric Catalog heading (Figure 8), metrics are listed by category: Workload, Situation Awareness, and Teamwork.
Figure 8: Accessing the GMC
STEP 4: Click on the “Table of Contents” link (See figure 5). Next, click on “Situation Awareness Metrics.”(See Figure 8) to display the names of metrics that measure SA (See Figure 9). Each metric links to a corresponding spreadsheet (Figures 9) that contains information about that specific metric.

A-8
Figure 9: SAGAT selection
STEP 5: Click on SAGAT. Each metric spreadsheet contains a collection of organized and synthesized information gathered via an extensive literature review. Figure 10 provides a sample of the information compiled for SAGAT. The information includes: (1) a brief description of the metric; (2) the domain(s) in which the metric has been applied or tested; (3) reference links to the full publication citation; (4) details about metric properties and usage (i.e., sample sizes from non-operational and operational personnel, scoring and administration method, psychometric properties, task completion time, task fidelity, and special requirements); and (5) A return link to the Table of Contents.

A-9
Figure 10: Example Metric Spreadsheet: SAGAT
Table 2 Columns on the GMC Metric Spreadsheets
Description of information provided for each metric found in the columns on GMC Metric Spreadsheets
Column Importance
Reference This column shows a number that corresponds to the linked references spreadsheet that contains the full citation.
Sample Size This group of columns shows the population from which the sample was drawn. Sample Size Non-operator (general sample) represents the number of participants drawn from a general population (e.g., college students). Sample Size Operator (operator sample) represents the number of operators (e.g., NPP operators, air traffic control operators, etc.). Both types of samples include an indication of crew or individual and the number of members in a crew.
Scoring and Administration This group of columns describes the process for scoring or administering the metric.
Psychometric Properties This group of columns provides information about psychometric characteristics of the metric including reliability, validity,
Table of Contents
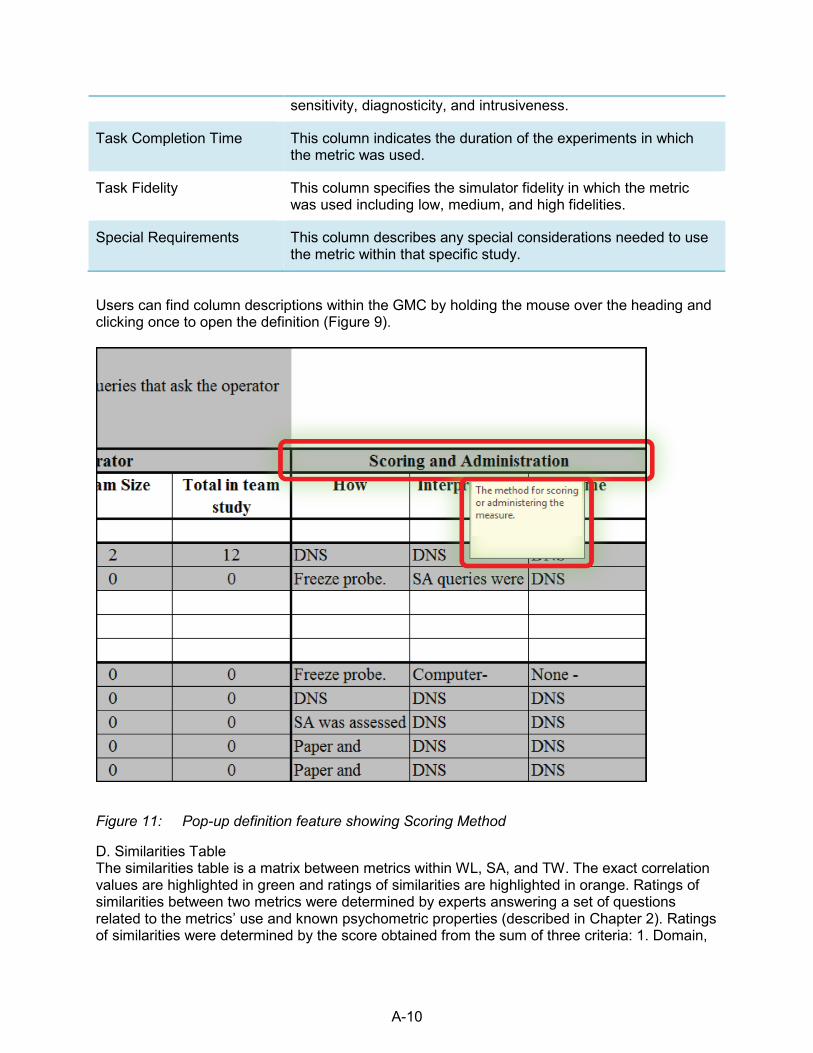
A-10
sensitivity, diagnosticity, and intrusiveness.
Task Completion Time This column indicates the duration of the experiments in which the metric was used.
Task Fidelity This column specifies the simulator fidelity in which the metric was used including low, medium, and high fidelities.
Special Requirements This column describes any special considerations needed to use the metric within that specific study.
Users can find column descriptions within the GMC by holding the mouse over the heading and clicking once to open the definition (Figure 9).
Figure 11: Pop-up definition feature showing Scoring Method
D. Similarities Table The similarities table is a matrix between metrics within WL, SA, and TW. The exact correlation values are highlighted in green and ratings of similarities are highlighted in orange. Ratings of similarities between two metrics were determined by experts answering a set of questions related to the metrics’ use and known psychometric properties (described in Chapter 2). Ratings of similarities were determined by the score obtained from the sum of three criteria: 1. Domain,

A-11
2. Administration Method (Interrupted, Post-Task, Continuous), and 3. Type of Metric (Subjective or Objective). Ratings ranged from 0-3 and Low, Medium, and High were assigned to 0-1, 1.1-2, and 2.1-3 ratings respectively. Ratings of similarities are provided in terms of low, medium, or high to represent the level of similarity between the metrics and should be distinguished from actual correlations that were found in the literature. Five individuals, well-informed on each metric, completed the ratings independently. Following the independent assessments, inter-rater agreement was calculated. A rating was entered into the table if at least three of the five raters’ ratings were the same for a pair of metrics. Ratings for metrics with less than three citations were not calculated due to high error of estimation. The purpose of this matrix is to provide reviewers an opportunity to compare the similarity of metrics. For instance, a reviewer might be familiar with the NASA-TLX, but the applicant is proposing to use an unfamiliar metric called ATWIT to assess WL. The reviewer can access the Similarities Table to better understand if the properties of each metric are more similar than different. This is accomplished by reading the criteria provided below the Similarities Table located in the GMC and then viewing the rating determined from inter-rater agreement shown in the corresponding cell of the metrics of interest. This comparison provides the reviewer with a frame of reference for the metric being reviewed. The Similarities Table should be a starting point for acquiring additional information regarding metric pairs, but the ratings of similarity should be used with caution as these have not been empirically validated.
Figure 12: Similarities Table spreadsheet STEP 6: From the SAGAT metric spreadsheet, click the “Back to Table of Contents” link (shown in figure 10. Click “Similarities Table” in the table of contents tab.
E. References The References spreadsheet (Figure 13) includes all of the articles and publications that support the GMC. The numbers in the brackets (Figure 10, Number 3) in the first column are the linked reference numbers that appear in the Metric spreadsheets. Scrolling to the top of the

A-12
page will show the link to return to the Table of Contents or use the tabs at the bottom of the screen to navigate to any point within the GMC or the DMW.
Figure 13: Screenshot of References spreadsheet
G. GMC Metric Summary The GMC Metric Summary sheet is a compilation of all of the data from each metric sheet into one table. See Figure 14 below for an illustration of the GMC Metric Summary spreadsheet. For a clearer view, click on the GMC Metric Summary in the TOC of the GMC DMW located on the CD.
Figure 14: GMC Metric Summary Spreadsheet

A-13
H. Past Application The Past Applications spreadsheet is a list of all saved session results to be recalled at a later date. 3. Practice Using the GMC and DMW
In this section, a step-by-step NPP application example using the GMC and DMW is presented to give users hands-on practice..
Scenario: An application proposes to use the Situation Awareness Control Room Inventory (SACRI) metric. The applicant plans to administer this metric to individual operators after task completion. Information received from the applicant reveals important details to input into the DMW, such as the human performance area being measured (SA), the metric (SACRI), team or individual, and method of administration (participant/operator, post-task). Steps for Using the DMW Follow each step carefully to enter all pertinent information into the DMW.
Figure 15: Select tab from Table of Contents or the list at the bottom of the window
STEP 1:
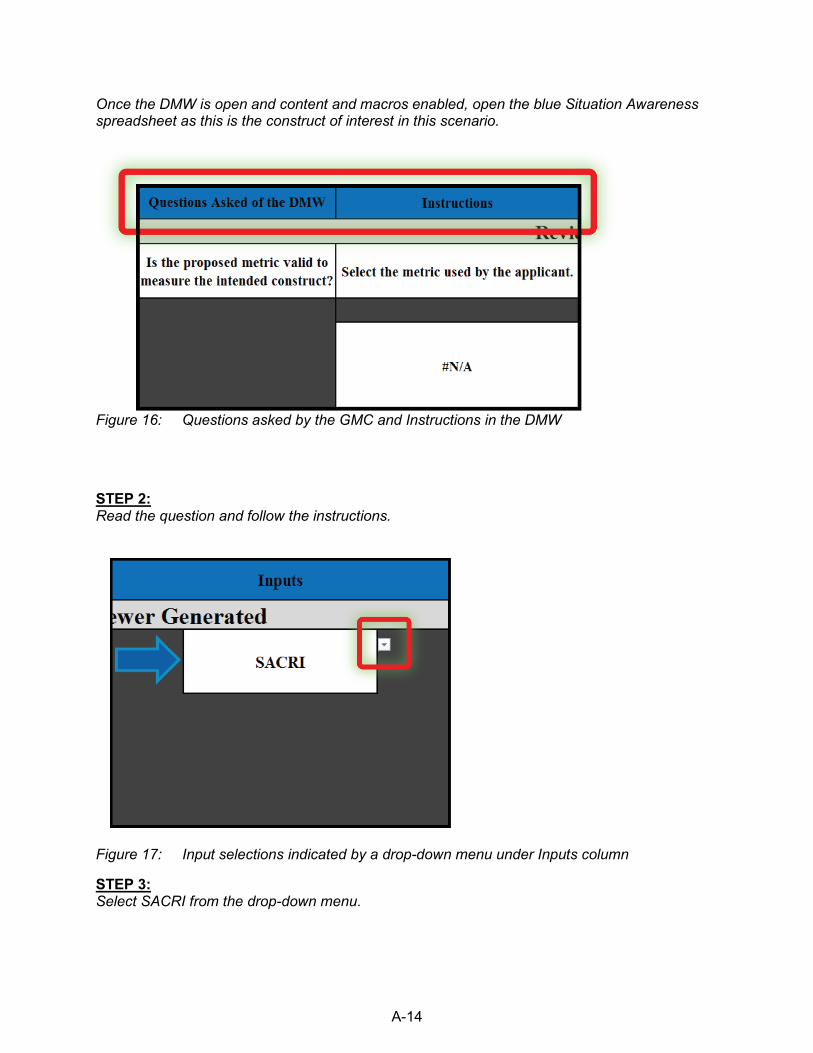
A-14
Once the DMW is open and content and macros enabled, open the blue Situation Awareness spreadsheet as this is the construct of interest in this scenario.
Figure 16: Questions asked by the GMC and Instructions in the DMW
STEP 2: Read the question and follow the instructions.
Figure 17: Input selections indicated by a drop-down menu under Inputs column STEP 3: Select SACRI from the drop-down menu.

A-15
Once the reviewer makes a selection, a series of questions and instructions will appear. Notice the flow of the page in Figure 18.
Figure 18: Flow of DMW instructions, inputs, and areas of concern.
Note: If applicants did not provide details for any of the questions asked by the DMW, select “DNS” (Does Not Specify). The first four questions require an input from the reviewer.
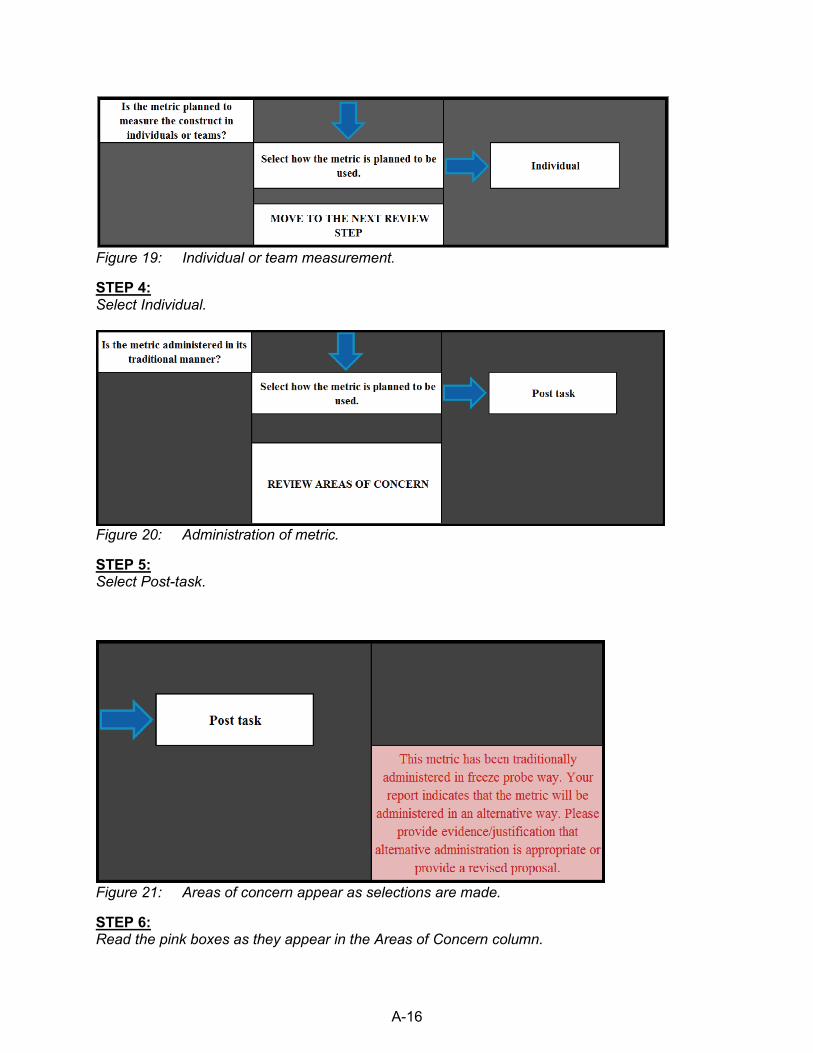
A-16
Figure 19: Individual or team measurement. STEP 4: Select Individual.
Figure 20: Administration of metric. STEP 5: Select Post-task.
Figure 21: Areas of concern appear as selections are made. STEP 6: Read the pink boxes as they appear in the Areas of Concern column.

A-17
Figure 22: Select who completes the metric.
STEP 7: Select Participant/Operator. After the first four questions that require reviewer input, the GMC generates information for the remainder of the questions (Figure 24).
Figure 23: Example of generated information based on inputs to the DMW.
The Refresh button is located at the top of the screen (Figure 25) and clicking this will clear all selections.

A-18
Figure 24: To clear all selections, click on "Refresh" at the top of the tab.
At this point in the process, all of the available drop down menus should be completed and all areas of concern provided. The feedback in the Areas of Concern column is compiled in the Summary of Areas of Concern spreadsheet (Figure 26) and translated into Suggested Questions for Reviewers. If there are any blank selections in the DMW, suggested questions for reviewers cannot be generated.
Figure 25: Summary of AOC spreadsheet shows WL, SA, and TW recommendations
If the review staff has put information into the DMW for SA, WL, and TW metrics, results from all three will appear on the Summary of Areas of concern spreadsheet (Figure 25). Otherwise, it will only contain the feedback generated for constructs that were populated.
Figure 26: Summary of Areas of Concern showing results from practice input.

A-19
In the SACRI example, the DMW does not produce recommendations in the Workload or Teamwork summary sections due to the lack of information provided. Saving results from a specific DMW session The reviewer has the ability to save the results from each application entered into the DMW. This feature is located at the top of the Summary of Areas of Concern spreadsheet. To save, first the reviewer must input the application name into the cell stating “(Type name of application here).” Then click on “Save Current Application.” Once the reviewer saves the application he/she can retrieve past applications by clicking “Drop down menu of previous application.”
Figure 27: Saving results from a specific DMW session
Generating the Suggested Questions for Reviewers The feedback report is located in the Suggested Questions for Reviewers spreadsheet (Figure 29). To save a Word or PDF version of the report, click “Save as Word” or “Save as PDF” (Figure 30).
Figure 28: Questions for Reviewers spreadsheet. STEP 9: Select Questions for Reviewers.

A-20
Figure 29: Suggested Questions for Reviewers generation.
STEP 10: Click the Generate Report button to see the summary of Suggested Questions for Reviewers. STEP 11: When the pop up disclaimer (Figure 31) appears, read carefully then select “OK”. STEP 12: Select Save as Word or Save as PDF at the top of the table to save or print the report
Figure 30: Disclaimer.
After completing the above steps, a complete set of Suggested Questions for Reviewers should generate (Figure 32). If the Suggested Questions for Reviewers do not generate, go to the Situation Awareness spreadsheet, refresh, and repeat the steps. Take care to select the inputs provided on pages 50-55. When saving to Word, the information appears in a table where reviewers have the option of manually editing recommendations.

A-21
Figure 31: SA Metric Suggested Questions for Reviewers example.
4. Troubleshooting
Occasionally, problems arise during the navigation of the GMC and DMW. Often this is due to macros working improperly in Microsoft (MS) Excel. A macro is a predetermined formula or set of instructions triggered by a keyboard shortcut, button, or icon used to eliminate repetitive tasks or to navigate easily through a MS Excel document. This section provides step-by-step instructions on how to enable Microsoft Excel macros in the GMC DMW file.
Steps to Enable Macros Macros are essential to the use of the GMC and DMW. The macros needed for the GMC and DMW are pre-set and require no alterations. However, if users encounter issues with the GMC and DMW, the following steps can alleviate problems. Currently, the GMC and DMW works only with MC Excel 2007 and 2010 versions. Refer to Figure 35 for the step to check the version of MS Excel.

A-22
Figure 32: Checking MS Excel version
STEP 1: Click on the Start Menu and double check the version of MS Excel (should be either 2007 or 2010). In order to function properly reviewer must save the GMC and DMW as macro-enabled file type. This means that the file name should end in .xlsm. The following steps show how to save an .xlsm file (Figures 33-35).
Figure 33: Selecting the File Tab.

A-23
STEP 2: Click on the File tab in the top left corner of the MS Excel window
Figure 34: Save As option on the File tab.
STEP 3: Select Save As, the second icon from the top, on the File tab After the Save As option is chosen in the File tab a window will pop up. Under Save as type choose Excel Macro-Enabled Workbook from the drop down menu. This will save the file type as .xlsm.
Figure 35: Choose Excel Macro-Enabled Workbook
Enable Macros within the File If steps 1-3 do not allow the reviewer to access the GMC and DMW properly, make sure the user enables the macros within the GMC and DMW file. For step-by-step instructions please refer to Figures 36-40.
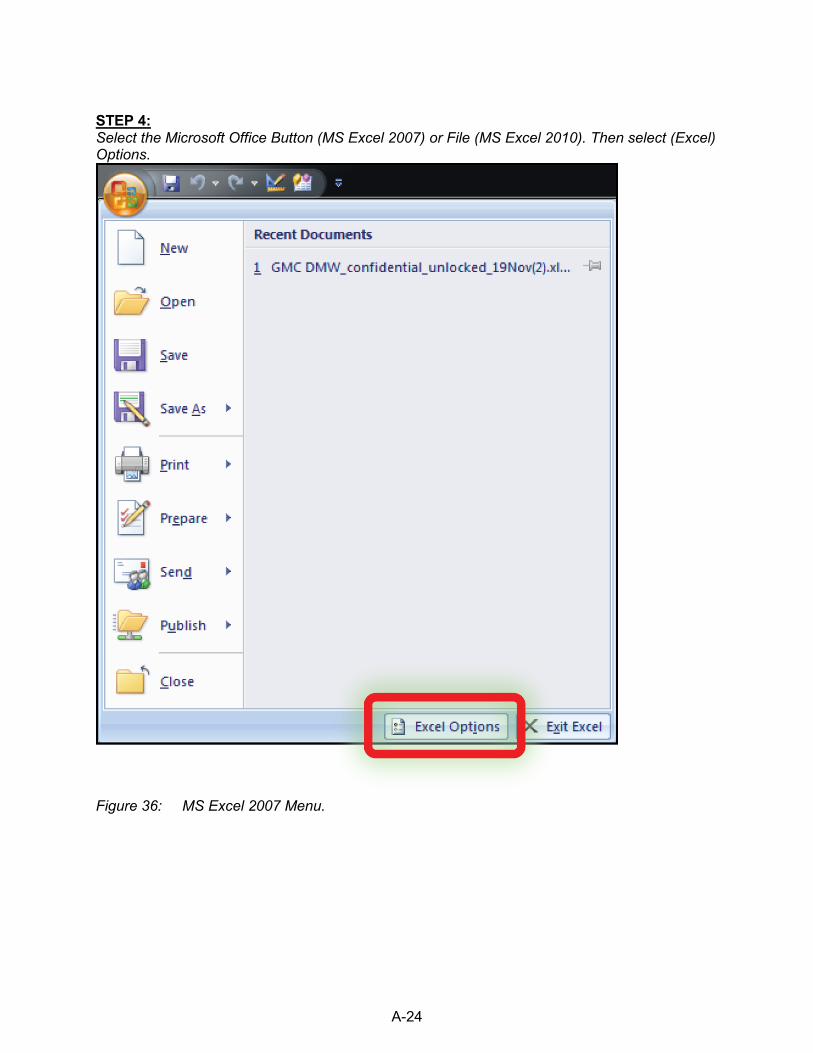
A-24
STEP 4: Select the Microsoft Office Button (MS Excel 2007) or File (MS Excel 2010). Then select (Excel) Options.
Figure 36: MS Excel 2007 Menu.

A-25
Figure 37: MS Excel 2010 Menu.
STEP 5: Click on the Trust Center in the right hand column
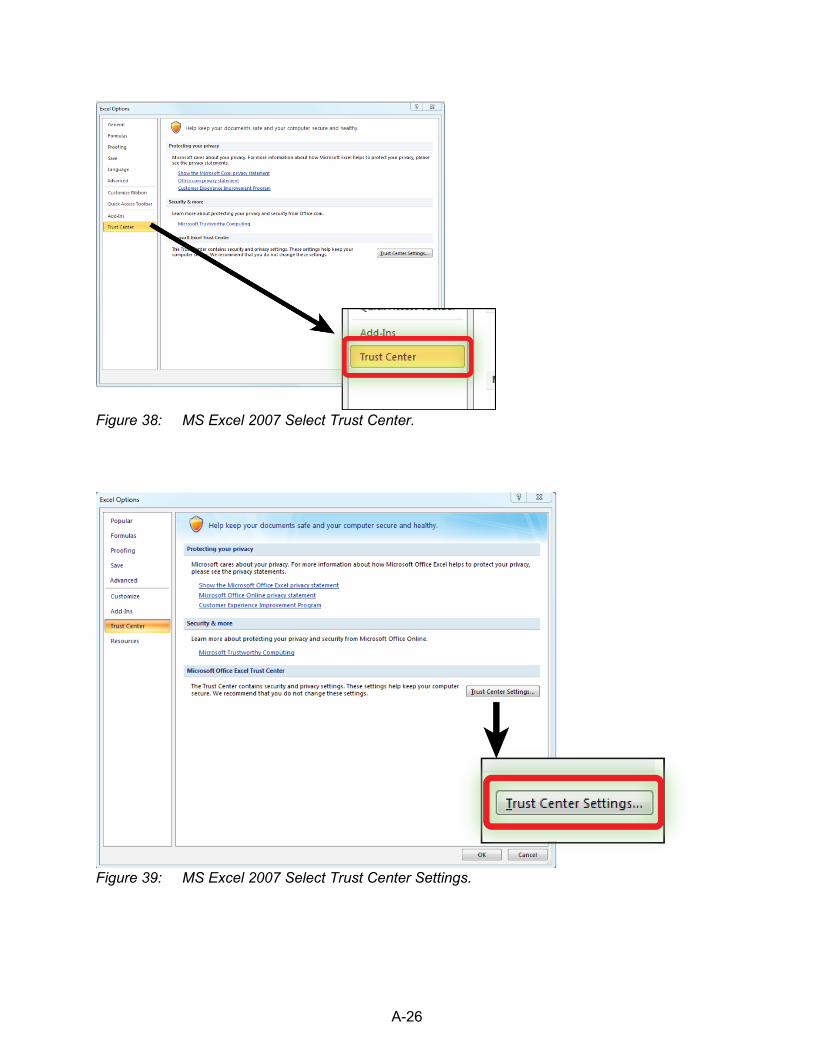
A-26
Figure 38: MS Excel 2007 Select Trust Center.
Figure 39: MS Excel 2007 Select Trust Center Settings.

A-27
STEP 6: Select Trust Center Settings.
Figure 40: MS Excel 2007 Enable macros. STEP 8: Click on Macro Settings STEP 8: Select Enable all macros STEP 9: Click OK


B-1
APPENDIX B - Workload, Situation Awareness, and Teamwork in NUREG-0711 This appendix is included for those not familiar with the NRC’s Human Factors Engineering Program Review Model (e.g., new NRC technical review staff, members of the public). The Human Factors Engineering Program Review Model (NUREG-0711) is intended to provide NRC technical review staff with a structured guide for the evaluation of submittals pertaining to applications for construction permits, operating licenses, standard design certifications, combined operating licenses, and license amendments. This appendix gives a high-level overview of the NUREG-0711 HFE Program Review Model and highlights the importance of WL, SA and TW. NUREG-0711 General Activities For new NPPs (i.e. new builds), NUREG-0711 consists of 12 review elements covering four general activities including Planning and Analysis, Design, Verification and Validation (V&V), and Implementation and Operation. NUREG-0711 describes the incorporation of Human Factors Engineering (HFE) principles into an NPP design as an iterative process. Information identified in one element is utilized in later elements and revisited and re-assessed as information is gathered and the design is finalized. Planning and Analysis The Planning and Analysis general activity consists of the first six NUREG-0711 review elements including HFE Program Management, Operating Experience Review (OER), Functional Requirements Analysis and Functional Allocation (FRA/FA), Task Analysis (TA), Staffing and Qualifications, and Treatment of Important Human Actions. During this process an applicant provides two types of documents, 1) implementation plans that detail the proposed methodology for meeting the acceptance criteria for each element and, 2) a results summary report that details the results of the applicant’s efforts related to each element. The purpose of providing information for each element is to give the NRC technical review staff a detailed and thorough understanding of the intended NPP HFE design and implementation plan. The review staff evaluates the information the applicant provides related to each element in order to make regulatory decisions. Each review element complementarily builds upon the information provided in other elements. Element 1: HFE Program Management The objective of the HFE Program Management element is to ensure that the applicant has a HFE team in place and that the team has a staged plan for incorporating state-of-the-art human factors principles into the design of the NPP. Element 2: OER The Operating Experience Review element is intended to capitalize on lessons learned from predecessor designs in new designs. Element 3: FRA/FA The Functional Requirements Analysis/Function Allocation element identifies the functions within NPPs required to satisfy plant safety objectives and assigns the functions to either human operators or plant automation. These assignments should exploit the strength of both the human and the system. When allocating functions to human operators, the applicant must consider “the overall personnel role… allocations should …be considered in the context of other

B-2
responsibilities personnel have to help ensure that, together, all functions allocated to personnel are acceptable and do not interfere with each other” (NRC, 2012, p. 29). Thus, applicants should be aware of the WL associated with the functions they are allocating and determine the allocation of functions with acceptable WL levels in mind. Element 4: TA The Task Analysis element is used to identify task requirements for accomplishing the functions allocated to human operators in the FRA/FA element. Tasks are defined as “a group of related activities with a common objective” (NRC, 2012, p.31). NUREG-0711 provides guidance that applicants should analyze tasks for a variety of factors including the estimated WL and the amount of TW and coordination expected. This element includes verifying that task requirements do not exceed operators’ capabilities. Element 5: Staffing and Qualification The Staffing and Qualification element determines the number and qualifications of staff required to provide reasonable assurance of safe operation. According to NUREG-0711, “The applicant should use the results of the task analysis as an input to the staffing and qualification analyses.” Personnel tasks, addressed in task analysis, should be assigned to staffing positions to ensure that jobs are defined considering:
• the task characteristics, such as the knowledge and abilities required, relationships among tasks, time required to perform the task, and estimated workload
• the person’s ability to maintain SA within the area of assigned responsibility • teamwork and team processes, such as peer checking” (NRC, 2012, p.38).
Element 6: Treatment of Important Human Action Finally, the Treatment of Important Human Action element seeks to identify and evaluate the potential for human error. This identification can subsequently inform the HSI design and other elements in terms of desirable design characteristics to minimize error. Design The Design general activity includes the next three NUREG-0711 review elements: Human-System Interface (HSI) Design, Procedure Development, and Training Program Development. Element 7: HSI The HSI design element verifies that the applicant has translated functional and task requirements identified in the planning and analysis stage into the detailed design of alarms, displays, controls, and other components of the HSI. HSIs are tested during the design phase via trade-off evaluations and performance-based tests. Applicants are asked to look at a variety of factors including performance measures to make design decisions (e.g., large overview display vs. smaller individual displays). Performance issues along with a reduction in SA, a reduction in the quality of TW and/or elevated WL may be an indication of poorly designed or confusing HSIs. Element 8: Procedure Development The Procedure Development element verifies that HFE principles have been applied in the development of procedures and that they are accurate, comprehensive, explicit, validated, and easy to use.

B-3
Element 9: Training Program Development Finally, the Training Program Development element verifies that the applicant has developed a systematic training approach that evaluates the knowledge and skill requirements of personnel. Procedures must be written to support and guide personnel interactions with plant systems and with one another. Applicant training programs must ensure that operators are provided with the knowledge, skills, and abilities needed to perform their roles. V&V testing is when both procedures and training are examined. Sub-optimal performance during testing may relate back to WL, SA, or TW considerations. The Design general activity uses the information from the Planning and Analysis general activity in order to construct the HSI, identify the operating rules or procedures, and develop training to prepare for the next general activity, which is Verification and Validation (V&V) of the NPP design. Verification and Validation The V&V general activity consists of only one review element, the Human Factors V&V review element. Element 10: Human Factors V&V There are two aspects to this element: 1) Verification and 2) Validation. NUREG-0711 defines verification as “the process by which the design is evaluated to determine whether it (1) provides the information, controls, and task-support needed to accomplish tasks; and (2) conforms to the HFE design guidance” (NRC, 2012, p.118). NUREG-0711 defines validation or, more specifically, integrated system validation (ISV), as an “evaluation using performance-based tests to determine whether an integrated system design meets performance requirements and acceptably supports safe operation of the plant” (NRC, 2012, p.115). The ISV process is conducted using a plant simulator that accurately reproduces both the physical (e.g., HSI panels, room size) and task environments (e.g., EOPs, crew composition). This phase of the process is an evaluation to determine whether the integrated system (hardware, software, and personnel elements) meets performance requirements and supports safe operation. This evaluation involves testing operating crews on realistic scenarios while using human performance metrics. “Plant performance, personnel task performance, situation awareness, cognitive workload, and anthropometric/physiological factors” (NRC, 2012, p.87) are measured during testing. Implementation and Operation The Implementation and Operation general activity includes the Design Implementation and Human Performance Monitoring review elements. Element 11: Design Implementation The Design Implementation element, as defined by NUREG-0711, is “the implementation of the HFE aspects of the plant design for new plants and plant modifications” (NRC, 2012, p.xii). This element has two objectives, which are: 1) ensuring the applicant’s as-built design conforms to the verified and validated design resulting from the HFE design process, and 2) ensuring

B-4
implementation of plant changes considers the effect on personnel performance and provides the necessary support to provide reasonable assurance of safe operations. Element 12: Human Performance Monitoring The Human Performance Monitoring review element is defined by NUREG-0711 as a program that “will help to provide reasonable assurance that the confidence developed by completing a thorough HFE program, culminating in a verification and validation of the control room and integrated systems design, is maintained over time” (NRC, 2012, p.103). This review element provides reasonable confidence that no degradation in skill level of plant staff occurs


NU
REG
/CR
-7190
Workload, Situation Aw
areness, and Teamw
ork M
arch 2015