Embed Size (px)
Citation preview

Risk-Informed Revision of the Risk-Informed Revision of the NRC’s Rules Regulating
Pressurized Thermal Shock (PTS)Pressurized Thermal Shock (PTS)
Mark EricksonKirkMark EricksonKirkRES/DE/CIB
[email protected] i k ki k@ i [email protected]
American Nuclear Society Meeting – MIT Section6th April 2009Massachusetts Institute of TechnologyCambridge, MA

Presentation Outline
• What is PTS• Current (circa-1984) PTS regulations• Why revise? Why risk-informed?
PTS U i d li & j h• PTS – Uncertainty modeling & project approach• PTS – Major outcomes
L l d & ff t i f d• Lessons learned & efforts moving forward

Presentation Outline
• What is PTS• Current (circa-1984) PTS regulations• Why revise? Why risk-informed?
PTS U i d li & j h• PTS – Uncertainty modeling & project approach• PTS – Major outcomes
L l d & ff t i f d• Lessons learned & efforts moving forward
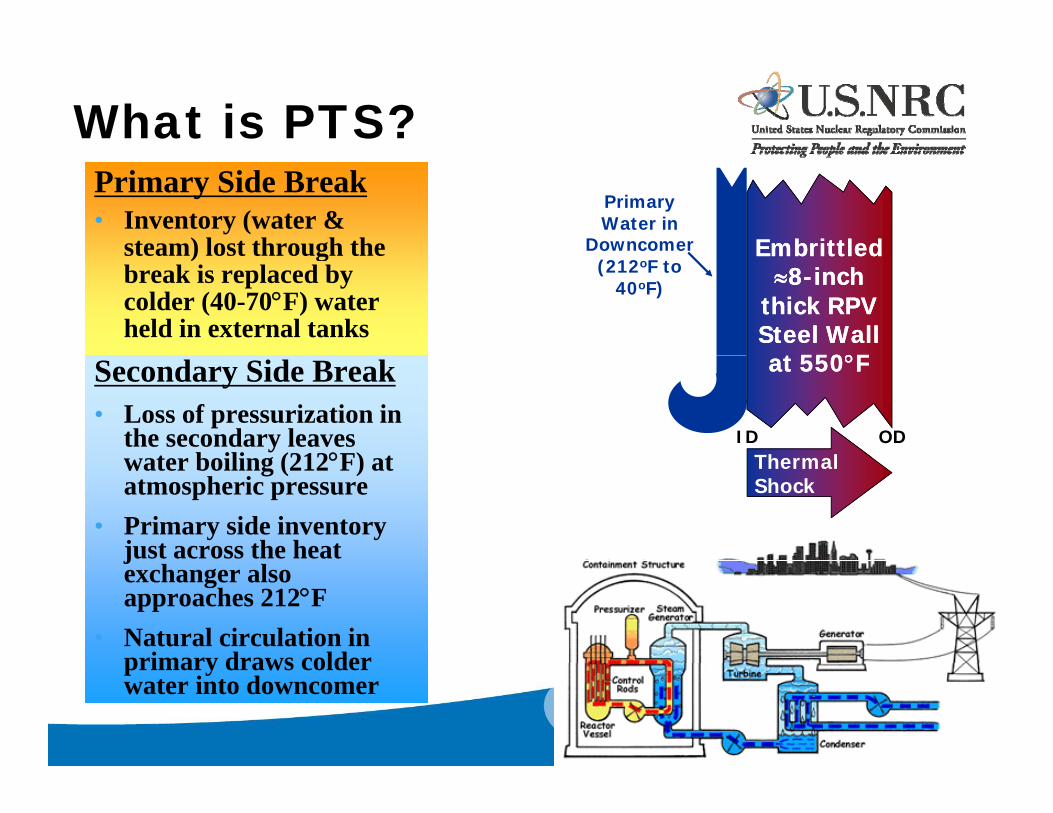
What is PTS?Primary Side Break• Inventory (water &
steam) lost through the
Primary Water in
Downcomer EmbrittledEmbrittledsteam) lost through the break is replaced by colder (40-70F) water held in external tanks
(212oF to 40oF)
Embrittled 8-inch
thick RPV Steel Wall
t 550F
Embrittled 8-inch
thick RPV Steel Wall
t 550FSecondary Side Break• Loss of pressurization in
the secondary leaves t b ili (212F) t
ID OD
at 550F
Thermal
at 550F
water boiling (212F) at atmospheric pressure
• Primary side inventory just across the heat
ThermalShock
jexchanger also approaches 212F
• Natural circulation in primary draws colderprimary draws colder water into downcomer

What is PTS?
1. Rapid cooling high thermal stresses
Primary Water instresses
2. Pressure may add to stresses3 Years of operation
Water in Downcomer
(212oF to 40oF)
Embrittled 8-inch
thick RPV Steel Wall
Embrittled 8-inch
thick RPV Steel Wall3. Years of operation
embrittled vessel
• Combination of 1&2&3 may ID OD
Steel Wall at 550F
Steel Wall at 550F
• Combination of 1&2&3 may challenge vessel integrity
b Th l l t i t
ID ODThermalShock
• n.b.: Thermal-only transients excluded a priori in 1980s … should not have been

Presentation Outline
• What is PTS• Current (circa-1984) PTS regulations• Why revise? Why risk-informed?
PTS U i d li & j h• PTS – Uncertainty modeling & project approach• PTS – Major outcomes
L l d & ff t i f d• Lessons learned & efforts moving forward

10CFR50.61 Provisions• Vessel condition monitored using
an estimate of the steel’s fracture toughness transition temperature f i di i (RT ) b i d
Primary Break T = 35oFafter irradiation (RTNDT) obtained
through a 10CFR50 App. H surveillance program. Secondary Break
TMIN = 212oF
TMIN = 35 F
hnes
s
• If RTNDT exceeds 300ºF (for circ. welds) or 270ºF (for all other materials) before end of license (EOL), the licensee must re
Tou
gh( )
– Do something to keep RTNDT below 300ºF or 270ºF
• Reduce Flux: Reduce embrittlement rateA l b i l h i l
Frac
tur
• Anneal: De-embrittle the material (see RG 1.162)
– Show that RTNDT above 300ºF or 270ºF is safe
• Analyze: Plant specific analysis T t
RTNDTRTNDTRTNDTRTNDT RTNDTRTNDTRTNDT@LIMIT
• Analyze: Plant specific analysis per RG 1.154
TOPERATING = 550oF
Temperature

Presentation Outline
• What is PTS• Current (circa-1984) PTS regulations• Why revise? Why risk-informed?
PTS U i d li & j h• PTS – Uncertainty modeling & project approach• PTS – Major outcomes
L l d & ff t i f d• Lessons learned & efforts moving forward

Technical Motivations PRA
• Use of latest PRA/HRA d t
Developments since the 1980s suggested the overalldata
• More refined binning• Operator action
credited PFM
1980s suggested the overall conservatism of the rule.
• Acts of commission considered
• External events considered
• Significant conservative bias in toughness model removed
• Spatial variation in fluence recognized
• Medium and large-break LOCAs considered
TH
• Most flaws now embedded rather than on the surface, also smaller
• Material region dependent embrittlement props• Many more TH
sequences modeled• TH code improved
embrittlement props.• Non-conservatisms in arrest
and embrittlement models removed

Regulatory Motivations
• Produces unnecessary burdenTechnical improvements suggest strongly that current RT limits of 300ºFTechnical improvements suggest strongly that current RTNDT limits of 300 F and 270ºF are more conservative than needed to maintain safety.
• Does not necessarily increase overall plant safetyFocus on unnecessarily conservative RTNDT limits can divert resources from other more risk-significant matters.
• Creates an artificial impediment to license renewalpUnnecessarily conservative RTNDT limits alter perception of the safe operational life of a nuclear power plant.
• Causes work that produces no real benefit• Causes work that produces no real benefit

Why Risk Informed / Probabilistic?Probabilistic?
• Consistent with Commission policy guidance
• Provides a logical and systematic way to address uncertainties in a complex physical systemuncertainties in a complex physical system
• EnablesEnables– Engineers to do engineering– Decision makers to make decisions

Presentation Outline
• What is PTS• Current (circa-1984) PTS regulations• Why revise? Why risk-informed?
PTS U i d li & j h• PTS – Uncertainty modeling & project approach• PTS – Major outcomes
L l d & ff t i f d• Lessons learned & efforts moving forward

PTS ProjectParticipantsParticipants
PEAI
PNLSandiaNational
SARTREX
NationalLaboratories
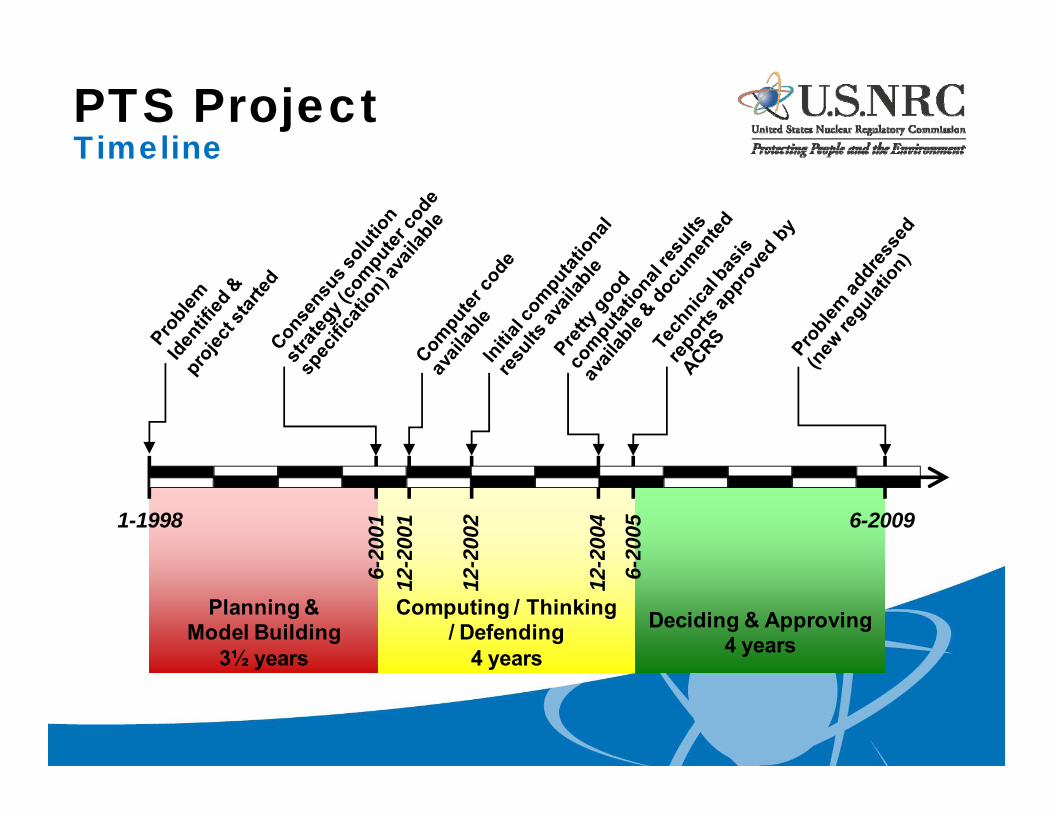
PTS ProjectTimelineTimeline
1-1998
2001
2001
2002
2005 6-2009
2004
Planning &Model Building
3½ years
Computing / Thinking/ Defending
4 years
Deciding & Approving4 years
6- 12-
12- 6-12-
3½ years 4 years

PTS ProjectUncertainty Modeling a Central Feature
Good engineering practiceOur approach features
• Explicit treatment of Good engineering practice
Ensures that themathematical model
t t i ti
• Explicit treatment of uncertainties
• Uncertainty classification & separation represents uncertainties as
they are physicallyunderstood (or believed)
to exist.
separation Aleatory Epistemic
• Uncertainty
Epistemic Uncertainty (per Scott Adams)Irreducible
yquantification
Following a systematic (per Scott Adams)
Knowable(in principal)
Irreducibleprocess makes uncertainties “visible” and, thereby, improves
comprehensiveness

Uncertainty TreatmentJanus Approach Janus Approach
• Examine / characterize uncertainties duringuncertainties during model development
• Examine / characterize uncertainties after
l i i lanalysis is complete
Uncertainty TreatmentDuring Model DevelopmentDuring Model Development
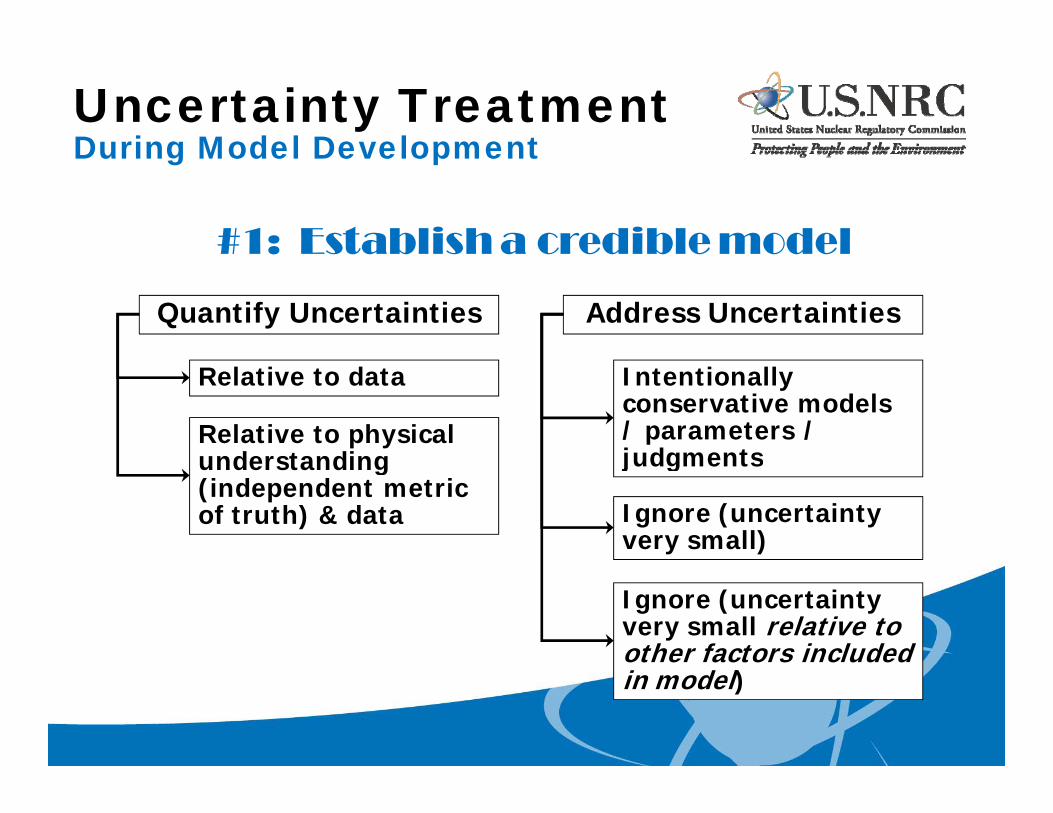
#1: Establish a credible model
Quantify Uncertainties Address Uncertainties
#1: Establish a credible model
Relative to data
Relative to physical understanding
Intentionally conservative models / parameters / judgmentsunderstanding
(independent metric of truth) & data
judgments
Ignore (uncertainty very small)
Ignore (uncertainty very small relative to other factors included in model)

Uncertainty TreatmentFollowing AnalysisFollowing Analysis
#1: Perform sensitivity studies on credible perturbations to baseline model.perturbations to baseline model.
#2: Assess “balance” of residual uncertainties.
ResidualConservatisms
ResidualNon-Conservatisms

Scope of Analysis• Detailed analysis of 3 PWRs
– All PWR manufacturers
Beaver ValleyBeaver ValleyPalisadesPalisades
• 1 Westinghouse (W)• 1 Combustion Engineering (CE)• 1 Babcock & Wilcox (B&W)
1 l t f i i l (1980 )– 1 plant from original (1980s) PTS study
– 2 plants very close to the current PTS screening criteriaPTS screening criteria
• Generality to all PWRs assessed– Characteristics of dominantCharacteristics of dominant
transients– Examination of 5 more high
embrittlement plantsOconeeOconee

Overall Model
PRA E tTh lP b bili ti
Probabilistic Estimation of Through-Wall Cracking FrequencyAcceptance Criterion for TWC Frequency
PRA EventSequenceAnalysis
(SAPPHIRE)
ThermalHydraulicAnalysis(RELAP)
ProbabilisticFractureAnalysis(FAVOR)
SequenceDefinitions
P(t), T(t), &HTC(t)
Established consistent with• 1986 Commission safety goal
policy statement• June 1990 SRM• RG1.174
ConditionalProbability of
Thru-WallCracking, CPTWC
YearlyF f [CPTWC]
Screening Limit Development
SequenceFrequencies
freq
Frequency ofThru-WallCracking
[CPTWC]x
[freq]
Freq
uenc
y of
Wal
l Cra
ckin
g
freq
Vessel damage, age,
Year
ly F
Thru
-W Screening Limit
Generalizationto all U.S.
PWRs
20
or operational metric
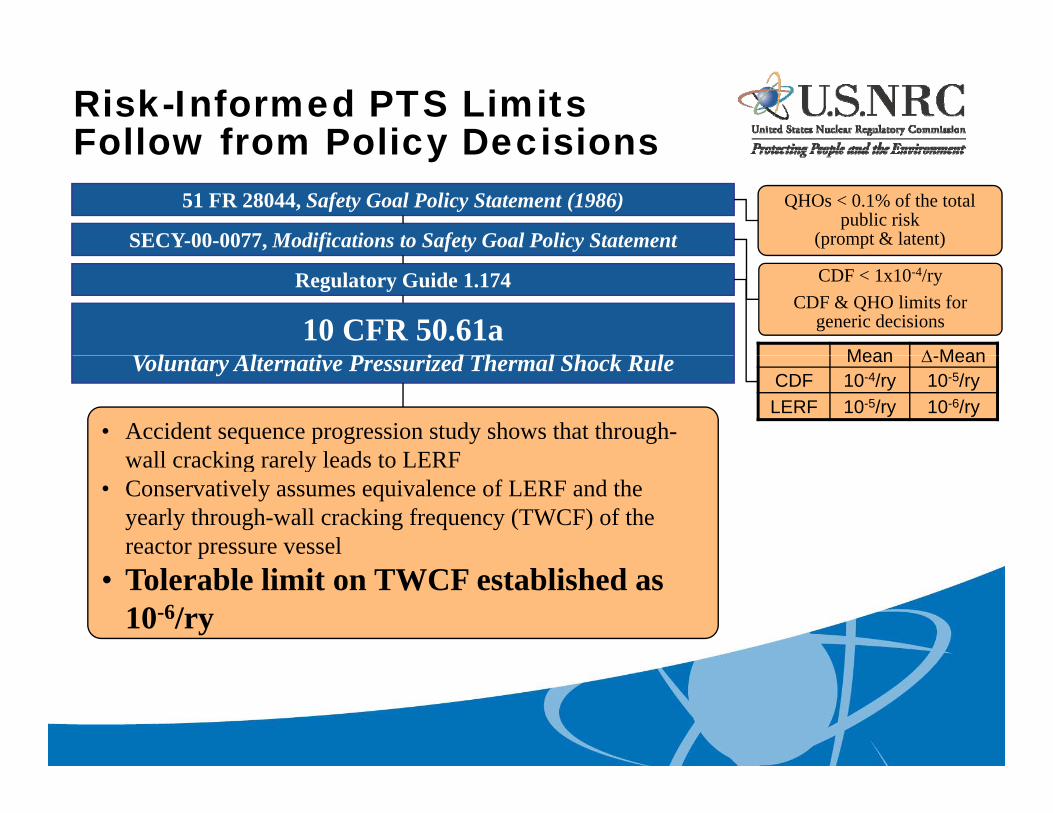
Risk-Informed PTS Limits Follow from Policy DecisionsFollow from Policy Decisions
51 FR 28044, Safety Goal Policy Statement (1986)
SECY-00-0077, Modifications to Safety Goal Policy Statement
QHOs < 0.1% of the total public risk
(prompt & latent)
Mean Mean
Regulatory Guide 1.174 CDF < 1x10⁻⁴/ryCDF & QHO limits for
generic decisions10 CFR 50.61aV l Al i P i d Th l Sh k R l Mean -Mean
CDF 10-4/ry 10-5/ryLERF 10-5/ry 10-6/ry
Voluntary Alternative Pressurized Thermal Shock Rule
• Accident sequence progression study shows that through-wall cracking rarely leads to LERFwall cracking rarely leads to LERF
• Conservatively assumes equivalence of LERF and the yearly through-wall cracking frequency (TWCF) of the reactor pressure vessel
• Tolerable limit on TWCF established as 10-6/ry

Model for TWCF EstimationManagement ViewManagement View
PRA EventSequence
ThermalHydraulic
ProbabilisticFracture SP(t) T(t) & Sequence
Analysis(SAPPHIRE)
HydraulicAnalysis(RELAP)
FractureAnalysis(FAVOR)
SequenceDefinitions
P(t), T(t), &HTC(t)
ConditionalProbability of
Thru-WallCracking, CPTWCg, TWC
YearlyFrequency of
Thru-Wall[CPTWC]
xf
SequenceFrequencies
Cracking [freq]
Frequenciesfreq

Pressurevs. time in
Downcomer
Temperaturevs. time in
Downcomer
Vapor• Viscosity• Density• Enthalpy• Conductivity
STOP
NO LookupTablesPlant State
att + t
ProductForm
Weld% SMAW
Plate & Forging Cladding-
% Repair
TWCF Model – Some Details
Physical Plant
Fluid StaticEquilibrium
Model
Fluid• Viscosity• Density• Enthalpy• ConductivitySequence
Definition
Conditions ateach node_____• Pressure• Temperature• Fluid velocity• Gas velocity• Void fraction
FlowRegime
Correlations
HeatTransfer
Coefficients
YES
IsTMIN < 400F
ANDdT/dt > 100F/hr? Increment
Time
t = t+t
time = 0Initial
ConditionGuess
Equilibrium Conditions ateach node_____• Pressure• Temperature• Fluid velocity• Gas velocity• Void fraction
SequenceComplete?
YES
NO
T vs. tto PFM Metal
• Thermal conductivity• Metal surface
roughness• Metal area
ShorehamWeld Flaw
DensityModel
Sh. & PVRFlaw Size
Model
Sh. & PVRAspectRatioModel
E.J.Truncation
Model(=2-in)
Weld Dir.Orientation
Model(Phys + Obs)
Distribution of EmbeddedWeld Flaws x
WeldFusionArea
Sh. WeldFlaw Density
Model(/10 lg.,/40 sm.)
(E.J.)
Sh. & PVRWeld
Flaw SizeModel
Sh. & PVRWeld
AspectRatio Model
E.J.Truncation
Model(0.43-in.)
Coin TossOrient. Model
(Obser. & Phys.)
Distribution of EmbeddedPlate Flaws x Plate
Volume
Obs. BuriedClad FlawDensity
in PVRUF/ 10(E.J.)
E.J. FlawDepthModel
(a = tCLADALWAYS)
PVR & HCAspectRatioModel
E.J.Truncation
Model (tCLAD)
Circ. Orient.Model(Obs.)
Distribution of Surface Flawsin Plates& Welds x Clad
Area
Flaw Locationin Vessel Wall, x’
# ofLayers?
NoSurf.Flaws
1
>1
Bead Size
Groove Design
Weld LengthPlate Area
Vessel Thickness
Vessel Inner Rad.
Vessel Length
Clad Bead Width
% SAW
Vessel Thickness
P&T vs. tto PFM
Best-EstimateID Fluence
(Reg-Guide Calcs.)
GlobalFluence
THModel
1
Layout “inside” the • SG steam outlet• SG feed line• ECCS input
THNodalization(1D Model)
MathematicalIdealization
of Plant
Control System
Geometric LossCoefficients
(e.g., for elbows)
Clad Thickness
CTEPLATE
Flaw Depth, a
Flaw AspectRatio, 2c/a
Flaw Density,
STOP
NO
YESIs
Location > 3/8T from ID?
Weld residual
CTE Mismatchresidual
CTEWELD
CharpyIrradiation
ShiftCharpy
TemperatureShift (T30)
Cu(RVID)
Thru-WallAttenuation
Model
Ni(RVID)
P
FluenceUncertainty
SampledID Fluence
LocalFluence
Uncertainty
FluenceAt Flaw
CuUncertainty
SampledCu
NiUncertainty
SampledNi
PSampled
Flaw Model
CrackInitiationM d l Applied
KI
Elastic Modulus
Vessel Diameter
IrradiatedInitiation
ToughnessIndex
Temperature(RTTOUGH(I))
ResistanceKIc
dKI/dt > 0AND
A-KI > R-KIc
InitiationToughnessTransition
Curve
CPI>0
OperatingProcedures
SelectionCriteria
SingleSequence ofEvents that
Represent Bin
BinFrequencyHistogram
StressIntensity
FactorModeldKI/dt
RTNDT(u)Method
YES
Generic?
YES
NO(u) = 0
C i
IrradiatedToughness Shift
(RTTOUGH)
+
CPI=0
NO
Vessel Thickness
Poisson’s Ratio
CoarseBinningLogic
Coarse Binned
Sequences(50 - 150)
RiskDominantSequencesPRA
JudgmentsOK?
TWCFSEQUENCE>
1% TWCFTOTAL?
ANALYSISCOMPLETE
RefinePRA
P&T vs. t
T vs. t
WeldFlaw?
NO
YES
YESNO
YES
INDEX TEMPERATURE SHIFT MODEL
UNIRRADIATED INDEXTEMPERATURE MODEL
FRACTURE DRIVINGFORCE MODEL
SampledFluence At Flaw
ModelShift (T30)
Oper.Temp.
P(RVID)
Oper.Time
ProductForm
VesselMfg.
Conversionto Toughness
Shift
PUncertainty
SampledP
PRAModel
Completion CheckModel
Un-IrradiatedIndex
Temperature(RTNDT(u)*)
EventTree
Analysis(SAPPHIRE)
Simulator Info.
Plant Equipment
Plant Design
Training
Sequence &Cut Set
Definitions(1E5)
FineBinningLogic
(SAPPHIRE)
Fine Binned
Sequences(300)
ExpertJudgments
HistoricalIncidence
of Plant Upsets
RTNDT(u)(RVID)
YES
(u) = S()+Conversion
to ToughnessTransition
TemperatureUn-Irradiated
Toughness IndexTemperature(RTTOUGH(U))
NUREG/CR-5750
g(50 50)COMPLETE YES
RTTOUGH(I) =MAXIMUM OF RTTOUGH(I)
WELD, & RTTOUGH(I)
ADJACENT PLATE
Initiation-ArrestTransition Curve
SeparationModel
RTARREST
ArrestToughnessTransition
Fluenceat Flaw
Thru-WallAttenuation
Model+Irradiated
ArrestToughness
IndexTemperatureResistance
KIa*
Pf 1=S{ RAND[0,1] }
MAT=Weld&
ResistanceKIa@T
NoInitiation-Arrest
Interaction Model ONKIa(MAX) = KIc
a’>¼T
NO
ResistanceKIa* @T
ld
YES
MAT=Weld&
a’ in Next ¼ TMatrix
Multiply
Yearly VesselFailure
Frequency(TWCF)
Curve
NO
YES
AppliedKI
A-KI>
R-KI
CPF=CPI*FAIL/COUNT
YES
1Irradiated
Toughness Shift(RTTOUGH)
NO
Extend flaw to Infinite Length
Increment Flaw Deptha’ = a + a
Re-Sample
Cu
Ni
P
T vs. t
&a’ in Next ¼ T
Pf xT/4=S{ RAND[0,1] }
Yes
a >¼T?
YES
MINResistance
KI @T
CRACK ARREST MODEL
PROPERTYGRADIENT
MODEL
Initiation-ArrestInteraction Model OFF
Unrestricted KIa(MAX)
Weld?
NO
ResistanceKIa@T
A
FAIL = 0
COUNT = 0
FAIL=FAIL+1
COUNT=COUNT+1
COUNT=100?
YES
Initiation-ArrestInteraction Model ON
KIa(MAX) = KIc
StressIntensity
FactorModel
TUSModelTUS
Upper ShelfToughness
Vs.Temperature
Curve
T vs. t
ResistanceK{J-R}@T
Elastic Modulus
Vessel Diameter
Vessel Thickness
Clad Thickness
CTEPLATE
Poisson’s Ratio
P&T vs. t
Weld residual
CTE Mismatchresidual
CTEWELD
FRACTURE DRIVINGFORCE MODEL
DUCTILE TEARING MODEL
A
NO
Thru-WallCrackingModel
Irradiated InitiationToughness Index
Temperature(RTTOUGH(I))
(from initiation model)

ProductForm
Weld% SMAW
Plate & Forging Cladding-
% Repair
Focus on the PFM Models
ShorehamWeld Flaw
DensityModel
Sh. & PVRFlaw Size
Model
Sh. & PVRAspectRatioModel
E.J.Truncation
Model(=2-in)
Weld Dir.Orientation
Model(Phys + Obs)
Distribution of EmbeddedWeld Flaws x
WeldFusionArea
Sh. WeldFlaw Density
Model(/10 lg.,/40 sm.)
(E.J.)
Sh. & PVRWeld
Flaw SizeModel
Sh. & PVRWeld
AspectRatio Model
E.J.Truncation
Model(0.43-in.)
Coin TossOrient. Model
(Obser. & Phys.)
Distribution of EmbeddedPlate Flaws x Plate
Volume
Obs. BuriedClad FlawDensity
in PVRUF/ 10(E.J.)
E.J. FlawDepthModel
(a = tCLADALWAYS)
PVR & HCAspectRatioModel
E.J.Truncation
Model (tCLAD)
Circ. Orient.Model(Obs.)
Distribution of Surface Flawsin Plates& Welds x Clad
Area
Flaw Locationin Vessel Wall, x’
# ofLayers?
NoSurf.Flaws
1
>1
Bead Size
Groove Design
Weld LengthPlate Area
Vessel Thickness
Vessel Inner Rad.
Vessel Length
Clad Bead Width
% SAW
Vessel Thickness
Best-EstimateID Fluence
(Reg-Guide Calcs.)
GlobalFluence
1Clad Thickness
CTEPLATE
Flaw Depth, a
Flaw AspectRatio, 2c/a
Flaw Density,
STOP
NO
YESIs
Location > 3/8T from ID?
Weld residual
CTE Mismatchresidual
CTEWELD
CharpyIrradiation
ShiftCharpy
Temperaturehif ( )
Cu(RVID)
Thru-WallAttenuation
Model
Ni(RVID)
FluenceUncertainty
SampledID Fluence
LocalFluence
Uncertainty
FluenceAt Flaw
CuUncertainty
SampledCu
NiUncertainty
SampledNi
Flaw Model
CrackInitiation
AppliedKI
Elastic Modulus
Vessel Diameter
IrradiatedInitiation
ToughnessIndex
Temperature(RTTOUGH(I))
ResistanceKIc
dKI/dt > 0AND
A-KI > R-KIc
InitiationToughnessTransition
Curve
CPI>0
StressIntensity
FactorModeldKI/dt
RTNDT(u)Method
YES
Generic?
NO (u) = 0
IrradiatedToughness Shift
(RTTOUGH)
+
CPI=0
NO
Vessel Thickness
Poisson’s Ratio
P&T vs. t
T vs. t
WeldFlaw?
NO
INDEX TEMPERATURE SHIFT MODEL
UNIRRADIATED INDEXTEMPERATURE MODEL
FRACTURE DRIVINGFORCE MODEL
SampledFluence At Flaw
ShiftModelShift (T30)
Oper.Temp.
P(RVID)
Oper.Time
ProductForm
VesselMfg.
Conversionto Toughness
Shift
PUncertainty
SampledPModel
Un-IrradiatedIndex
Temperature(RTNDT(u)*)
(RTTOUGH(I))
RTNDT(u)(RVID)
YES
(u) = S()+Conversion
to ToughnessTransition
TemperatureUn-Irradiated
Toughness IndexTemperature(RTTOUGH(U))
YES
RTTOUGH(I) =MAXIMUM OF RTTOUGH(I)
WELD, & RTTOUGH(I)
ADJACENT PLATE
Initiation-ArrestTransition Curve
SeparationModel
RTARREST
ArrestToughness
Fluenceat Flaw
Thru-WallAttenuation
Model+Irradiated
ArrestToughness
IndexTemperatureResistance
KIa*
Pf 1=S{ RAND[0,1] }
MAT=WeldResistance
NoInitiation-Arrest
Interaction Model ONKIa(MAX) = KIc
NO
Resistance*
YES
MAT=Weld&
a’ in Next ¼ TMatrix
Multiply
Yearly VesselFailure
Frequency(TWCF)
TransitionCurve
NO
YES
AppliedK
A-KI>
R-KI
CPF=CPI*FAIL/COUNT
YES
1Irradiated
Toughness Shift(RTTOUGH)
NO
Extend flaw to Infinite Length
Increment Flaw Deptha’ = a + a
Re-Sample
Cu
Ni
P
Ia
T vs. t
MAT=Weld&
a’ in Next ¼ T
KIa@T
Pf xT/4=S{ RAND[0,1] }
Yes
a’>¼T?
YES
KIa* @T
MINResistance
KI @T
CRACK ARREST MODEL
PROPERTYGRADIENT
MODEL
Initiation-ArrestInteraction Model OFF
Unrestricted KIa(MAX)
Weld?
NO
ResistanceKIa@T
A
FAIL = 0
COUNT = 0
FAIL=FAIL+1
COUNT=COUNT+1
COUNT
YES
Initiation-ArrestInteraction Model ON
KIa(MAX) = KIc
BinFrequencyHistogram
KI
StressIntensity
FactorModel
TUSModelTUS
Upper ShelfToughness
Vs.Temperature
Curve
T vs. t
ResistanceK{J-R}@T
Elastic Modulus
Vessel Diameter
Vessel Thickness
Clad Thickness
CTEPLATE
Poisson’s Ratio
P&T vs. t
Weld residual
CTE Mismatchresidual
CTEWELD
FRACTURE DRIVINGFORCE MODEL
DUCTILE TEARING MODEL
=100?
A
NO
Thru-WallCrackingModel
Irradiated InitiationToughness Index
Temperature(RTTOUGH(I))
(from initiation model)

Focus on the Crack Initiation ModelsOverall Diagram
Best-EstimateID Fluence
(Reg-Guide Calcs.)
GlobalFluence
Uncertainty
Flaw Locationin Vessel Wall, x’
Flaw Depth, a
Flaw Aspect
Flaw Density,
Thru-WallAttenuation
Model
Uncertainty
SampledID Fluence
Vessel Diameter
1Clad Thickness
CTEPLATE
Flaw AspectRatio, 2c/a
Weld residual
CTE Mismatchresidual
CTEWELD
CharpyIrradiation
ShiftModel
CharpyTemperatureShift (T30)
Cu(RVID)
Ni(RVID)
P
LocalFluence
Uncertainty
FluenceAt Flaw
CuUncertainty
SampledCu
NiUncertainty
SampledNi
PSampled
AppliedKI
Elastic Modulus
Vessel Diameter
StressIntensity
FactorModeldKI/dt
CPI=0
NO
Vessel Thickness
Poisson’s Ratio
P&T vs. t
INDEX TEMPERATURE SHIFT MODEL
FRACTURE DRIVINGFORCE MODEL
SampledFluence At Flaw
Model
Oper.Temp.
(RVID)
Oper.Time
ProductForm
VesselMfg.
Conversionto Toughness
Shift
UncertaintyP
Un Irradiated
IrradiatedInitiation
ToughnessIndex
Temperature(RTTOUGH(I))
ResistanceKIc
ResistanceKIc
dKI/dt > 0AND
A-KI > R-KIc
InitiationToughnessTransition
Curve
CPI>0
RTNDT(u)Method
YES
Generic?
YES
NO(u) = 0
Conversion
IrradiatedToughness Shift
(RTTOUGH)
+
T vs. t
WeldFlaw?
NO
YES
INDEX TEMPERATURE SHIFT MODEL
UNIRRADIATED INDEXTEMPERATURE MODEL
Un-IrradiatedIndex
Temperature(RTNDT(u)*)
RTNDT(u)(RVID)
(u) = S()+Conversion
to ToughnessTransition
TemperatureUn-Irradiated
Toughness IndexTemperature(RTTOUGH(U))
YES
RTTOUGH(I) =MAXIMUM OF RTTOUGH(I)
WELD, & RTTOUGH(I)
ADJACENT PLATE

Crack Initiation ModelsCoded for Accuracy
Best-EstimateID Fluence
(Reg-Guide Calcs.)
GlobalFluence
Uncertainty
Accurate
Unknown
Accurate
Unknown
y
Thru-WallAttenuation
Model
Uncertainty
SampledID Fluence
Flaw Locationin Vessel Wall, x’
Flaw Depth, a
Flaw Aspect
Flaw Density,
Other ModelsAvailable
Conservative
Accurate, ConservativeJ d t h U k
Other ModelsAvailable
Conservative
Accurate, ConservativeJ d t h U k
Vessel Diameter
1Clad Thickness
CTEPLATE
Weld residual
CTE Mismatchresidual
CTEWELD
CharpyIrradiation
ShiftModel
CharpyTemperatureShift (T30)
Cu(RVID)
Ni(RVID)
P
LocalFluence
Uncertainty
FluenceAt Flaw
CuUncertainty
SampledCu
NiUncertainty
SampledNi
PSampled
Flaw AspectRatio, 2c/a Judgments when UnknownJudgments when Unknown
AppliedKI
Elastic Modulus
Vessel Diameter
StressIntensity
FactorModeldKI/dt
CPI=0
NO
Vessel Thickness
Poisson’s Ratio
P&T vs. t
INDEX TEMPERATURE SHIFT MODEL
FRACTURE DRIVINGFORCE MODEL
SampledFluence At Flaw
Model
Oper.Temp.
(RVID)
Oper.Time
ProductForm
VesselMfg.
Conversionto Toughness
Shift
UncertaintyP
Un Irradiated
IrradiatedInitiation
ToughnessIndex
Temperature(RTTOUGH(I))
ResistanceKIc
ResistanceKIc
dKI/dt > 0AND
A-KI > R-KIc
InitiationToughnessTransition
Curve
CPI>0
RTNDT(u)Method
YES
Generic?
YES
NO(u) = 0
Conversion
IrradiatedToughness Shift
(RTTOUGH)
+
T vs. t
WeldFlaw?
NO
YES
INDEX TEMPERATURE SHIFT MODEL
UNIRRADIATED INDEXTEMPERATURE MODEL
Un-IrradiatedIndex
Temperature(RTNDT(u)*)
RTNDT(u)(RVID)
(u) = S()+Conversion
to ToughnessTransition
TemperatureUn-Irradiated
Toughness IndexTemperature(RTTOUGH(U))
YES
RTTOUGH(I) =MAXIMUM OF RTTOUGH(I)
WELD, & RTTOUGH(I)
ADJACENT PLATE

Crack Initiation ModelsCoded for Probabilistic
Best-EstimateID Fluence
(Reg-Guide Calcs.)
GlobalFluence
Uncertainty
Probabilistic – Aleatory
Probabilistic – Epistemic
Probabilistic – Aleatory
Probabilistic – Epistemic
Thru-WallAttenuation
Model
Uncertainty
SampledID Fluence
Flaw Locationin Vessel Wall, x’
Flaw Depth, a
Flaw Aspect
Flaw Density,
Deterministic – Accurate
Deterministic – Conservative
Deterministic – Accurate
Deterministic – Conservative
Vessel Diameter
1Clad Thickness
CTEPLATE
Weld residual
CTE Mismatchresidual
CTEWELD
CharpyIrradiation
ShiftModel
CharpyTemperatureShift (T30)
Cu(RVID)
Ni(RVID)
P
LocalFluence
Uncertainty
FluenceAt Flaw
CuUncertainty
SampledCu
NiUncertainty
SampledNi
PSampled
Flaw AspectRatio, 2c/a
AppliedKI
Elastic Modulus
Vessel Diameter
StressIntensity
FactorModeldKI/dt
CPI=0
NO
Vessel Thickness
Poisson’s Ratio
P&T vs. t
INDEX TEMPERATURE SHIFT MODEL
FRACTURE DRIVINGFORCE MODEL
SampledFluence At Flaw
Model
Oper.Temp.
(RVID)
Oper.Time
ProductForm
VesselMfg.
Conversionto Toughness
Shift
UncertaintyP
Un Irradiated
IrradiatedInitiation
ToughnessIndex
Temperature(RTTOUGH(I))
ResistanceKIc
ResistanceKIc
dKI/dt > 0AND
A-KI > R-KIc
InitiationToughnessTransition
Curve
CPI>0
RTNDT(u)Method
YES
Generic?
YES
NO(u) = 0
Conversion
IrradiatedToughness Shift
(RTTOUGH)
+
T vs. t
WeldFlaw?
NO
YES
INDEX TEMPERATURE SHIFT MODEL
UNIRRADIATED INDEXTEMPERATURE MODEL
Un-IrradiatedIndex
Temperature(RTNDT(u)*)
RTNDT(u)(RVID)
(u) = S()+Conversion
to ToughnessTransition
TemperatureUn-Irradiated
Toughness IndexTemperature(RTTOUGH(U))
YES
RTTOUGH(I) =MAXIMUM OF RTTOUGH(I)
WELD, & RTTOUGH(I)
ADJACENT PLATE

Initiation Fracture ToughnessFracture Toughness
400 E1921 Valid E399 Valid
ASME KIC Curve
Parameters of the Initiation 200
300
MPa
*m0.
5 ]
KIc
Model
RT100
KJc
[M
RTNDT0-150 -100 -50 0 50
T-RT NDT [oC]

Mixed Epistemic (RTNDT) & Aleatory (KI ) UncertaintiesAleatory (KIc) Uncertainties
• Need to be separated for accuracyI th t K tt• Increase the apparent KIc scatter
RTNDT too high
Need to quantifythe epistemicuncertainty in
ness
g
A t
uncertainty inRTNDT so that wecan get the KIcscatter correct
re T
ough
n
Correct RTNDT
Apparent KIc scatter too large
scatter correct
Frac
tur
Correct KIc Scatter
T - RTNDT

Separation of Uncertainties Using T
400E1921 V lid
Uncertainties Using To• Fracture toughness models
based on the RT index
300
5 ]
E1921 Valid E399 Valid
ASME KIC Curve
based on the RTNDT index temperature contain both epistemic & aleatory uncertainties
E1921 Valid
E399 Valid
1% LB
Median
99% UB
200
[MPa
*m0.
5uncertainties• Use of the best-estimate
Master Curve index temperature (T ) effectively
99% UB
100
KJc
[temperature (To) effectively removes epistemic uncertainty, leaving only the aleatory uncertainties
0-150 -100 -50 0 50
T RT [oC]
aleatory uncertainties produced by material variability
T T [oC]T-RT NDT [ C]T-To [oC]

Presentation Outline
• What is PTS• Current (circa-1984) PTS regulations• Why revise? Why risk-informed?
PTS U i d li & j h• PTS – Uncertainty modeling & project approach• PTS – Major outcomes
L l d & ff t i f d• Lessons learned & efforts moving forward

Major Outcomes
• What operational transients most influence PTS risk?
• What material features most influence PTS risk?
• Are these dominant material features / transients common across the fleet?common across the fleet?
• New limits on embrittlement based on RI calculationsNew limits on embrittlement based on RI calculations

Technical BasisTransient Classes ModeledTransient Classes Modeled
Primary System Faults Secondary System Faultsi li b k• Pipe breaks
– LargeMedium
• Main steam line break• Stuck open valves• Steam generator tube– Medium
– Small• Stuck open valves that
• Steam generator tube rupture
• Pure overfeedplater re-close
• Feed and bleed
33

Important Transient ClassesClasses
1.E-05
1.E-04
5
4
5
4Medium & Large
Pipe
Main Steam Line
Stuck-Open
Primary
1.E-07
1.E-06
7
6
7
6
TWC
F
Pipe Breaks
Line Breaks
Primary Valves
1 E 10
1.E-09
1.E-08
August 2006 0
9
8
August 2006 0
9
8
August 2006rcen
tile
T
1.E-12
1.E-11
1.E-10 August 2006FAVOR 06.1
Beaver 2
0 August 2006FAVOR 06.1
Beaver 2
1
0 August 2006FAVOR 06.1
Beaver
95th
Pe
1.E-14
1.E-13
550 650 750 850
Oconee
Palisades
Fit4
3
550 650 750 850
Oconee
Palisades
Fit4
3
550 650 750 850
Oconee
Palisades
Fit
34
550 650 750 850Max RT [R]
550 650 750 850Max RT [R]
550 650 750 850Max RT [R]

Important Transient ClassesClasses
100%
WC
F
60%
80%
Tota
l TW
40%
60%
tion
to T Medium and Large Diameter Pipe Breaks (LOCAs)
Stuck Open Valves, Primary SystemMain Steam Line Breaks
20%
ontr
ibut
0%200 250 300 350 400 450
Co
Max RT [oF]
35
Max RT [ F]

Summary of FindingsImportant Transient ClassesImportant Transient Classes
• Primary side faults dominate riskl i id (3 )– Due to low temperature on primary side (35oF)
• Very severe secondary faults (MSLB) make a minor contributioncontribution– Primary side temperature cannot fall below 212oF, so
material still tough even at high embrittlement• All other transient classes produce no significant risk
– Challenge is low even if transient occurs
36

Important Material FeaturesFeatures
1.E-04
1.E-03August 2006FAVOR 06.1
August 2006FAVOR 06.1 August 2006
FAVOR 06.1
TWC
F
1 E-07
1.E-06
1.E-05
7 7
Circumferential Weld Flaws
Plate Flaws
erce
ntile
T
1.E-09
1.E-08
1.E-07 7 7
Axial Weld
95th
Pe
1.E-12
1.E-11
1.E-10
Beaver
Oconee
Beaver
Oconee
Beaver
Oconee
Flaws
1.E-14
1.E-13
550 650 750 850
Oconee
Palisades
Fit
550 650 750 850
Palisades
Fit
550 650 750 850
Palisades
Fit
37
Max. RTAW [R] Max. RTPL [R] Max RTCW [R]

Important Material FeaturesFeatures
100%
WC
F
60%
80%
Tota
l TW
40%
60%
tion
to T Axial Weld Flaws
Flaws in Plates (remote from welds)Circumferential Weld Flaws
20%
ontr
ibut
0%200 250 300 350 400 450
C
Max RT [oF]
38
[ ]
Summary of FindingsImportant Material FeaturesImportant Material Features
• Axial cracks dominate risk, circumferential cracks do not– Circ cracks arrest due to vessel geometry– Axial cracks are much less likely to arrest
• Thus the properties of materials associable with axial flaws• Thus, the properties of materials associable with axial flaws dominate– Axial weld properties
Pl i– Plate properties• 3-parameter characterization of RPV embrittlement unifies results
across all study plants– Failures are blamed on the responsible material/flaw features
39

10 CFR 50.61a RT LimitsImplementation for Plate PlantsImplementation for Plate Plants
350
4001x10-6/ry TWCF limit 300
1x10⁻⁶/ry TWCF limit
250
300
o F]
Simplified ImplementationRTMAX-AW ≤ 269F, andRTMAX-PL ≤ 356F, andRTMAX-AW + RTMAX-PL ≤ 538F.
200
250
AX-
PL [
o F] Simplified ImplementationRTMAX-AW ≤ 222F, andRTMAX-PL ≤ 293F, andRTMAX-AW + RTMAX-PL ≤ 445F.
Plate Welded Plants at 48 EFPY (EOLE)
150
200
250
T MA
X-PL
[o
Palo Verde 1, 2, and 3at 48 EFPY (EOLE)
100
150RT M
50
100
150RT
0
50
0 50 100 150 200 250
tWALL = 10½- to 11½-in.
0
50
0 50 100 150 200 250 300
0 50 100 150 200 250
RTMAX-AW [oF]tWALL < 9½-in.
40
RTMAX-AW [oF]

10 CFR 50.61aSummarySummary
• Limits apply to all currently operating U S PWRs 12
14 Plate Welded Plants at 48 EFPYRing Forged Plants at 48 EFPY
PYPY
ng
operating U.S. PWRs• All plants assessable based
only on available materials and fluence information
8
10
12
Rea
ctor
s
o 4E
-7
of O
pera
tinW
Rs
fluence information• All PWRs conform to limits,
even through 60 years of operation 2
4
6
Pow
er R
2E-7
to
Num
ber o PW
operation• To use less restrictive limits of
10CFR50.61a, plant specific aspects must be checked
0
Below E-13
13 to
E-1212
to E-11
11 to
E-10E-10
to E-9
E-9 to
E-8E-8
to E-7
E-7 to
E-6
Naspects must be checked (defense in depth)– Flaw distribution
Embrittlement
BelE-13 E-12 E-11 E-1 E E E
95th Percentile TWCF
– Embrittlement

Presentation Outline
• What is PTS• Current (circa-1984) PTS regulations• Why revise? Why risk-informed?
PTS U i d li & j h• PTS – Uncertainty modeling & project approach• PTS – Major outcomes
L l d & ff t i f d• Lessons learned & efforts moving forward

Lessons Learned
1. Conservatisms are not an absolute goodConservatisms create the perception of plant specificity which– Conservatisms create the perception of plant specificity, which may not exist
– Converse: Realistic models can reveal general trends, if they exist
2. An important point for our European colleagues– Deterministic and probabilistic analyses are not as different as
they may initially seemy y y3. Human perception challenges associated with small
numbers4 The PTS project has taken a very long time to complete4. The PTS project has taken a very long time to complete
– Need it have been so?– Is there a better way?

Deterministic / ProbabilisticOverviewOverview
• A PTS Analysis is just a structural integrity assessmentassessment
• To perform the analysis, you calculate– Structural driving force (DF) to fractureStructural driving force (DF) to fracture– Materials’ resistance (R) to fracture
and you comparey p• DF and R are inherently distributed quantities• Deterministic and probabilistic analyses both provide
a mathematical representation these distributed quantities

Deterministic / ProbabilisticDF & R are Distributed QuantitiesDF & R are Distributed Quantities
PFAILURE Distributions DeterministicRepresentation of Distributions
ProbabilisticActual Situation
DF RZero
DF R DF RDF R DF R DF REstimate: No Failure Estimate: PFAIL=0
DF RSmall
DF R DF REstimate: Failure Estimate: PFAIL= Very Small
DF RLarge
DF R DF RDF R DF R DF REstimate: Failure Estimate: PFAIL= Large
Note: The actual DF and R distributions are also shown, lightly, in the deterministic and probabilistic columns.

Deterministic / ProbabilisticMathematical RepresentationMathematical Representation
PFAILURE Distributions DeterministicRepresentation of Distributions
ProbabilisticActual Situation
DF RZero
DF R DF RDF R DF R DF REstimate: No Failure Estimate: PFAIL=0
DF RSmall
DF R DF REstimate: Failure Estimate: PFAIL= Very Small
DF RLarge
DF R DF RDF R DF R DF REstimate: Failure Estimate: PFAIL= Large
Note: The actual DF and R distributions are also shown, lightly, in the deterministic and probabilistic columns.

Deterministic / ProbabilisticSimilarities and DifferencesSimilarities and Differences
• Similaritiesh i
• Differencesl i d– Both treat uncertainty
• Deterministic models bound uncertaintyP b bili i d l
– How result is expressed• Deterministic: “Failed” or “Not
Failed”P b bili i A f il b bili• Probabilistic models
quantify uncertainty– Probabilistic models
t i
• Probabilistic: A failure probability– Who the decisionmaker is
• Deterministic: Only the may contain many deterministic aspects
engineering analyst (because “failure” is unacceptable)
• Probabilistic: Many people (because some failure probability(because some failure probability can be tolerable)

Human Perceptions of Small NumbersSmall Numbers
• 1.14E-5 / year
?y
– My probability of dating a supermodel
• Basis: Baer, G., “Life, The Odds”?&
• 3.4E-8 / year– Probability of PTS failing a US
334x more likely
Probability of PTS failing a US vessel after 60 years of operation (worst case)
• Basis: NUREG-1806153x less
lik l
• 2.2E-10 / year– Probability of an extinction
level meteor impact on Earth
likely
level meteor impact on Earth• Basis: 1 event in 4.5 billion years

Regulatory Resolution of a Complex Issue Takes a LONG TiLONG Time
1-1998
2001
2001
2002
2005 6-2009
2004
Planning &Model Building
3½ years
Computing / Thinking/ Defending
4 years
Deciding & Approving4 years
6- 12-
12- 6-12-
3½ years 4 years

ObservationThe Same Features Define Every St t l I t it P bl
E
Structural Integrity Problem
Environment• Feature Summary
TAT
E
Loading
Environment– Environment, Loading, Geometry, and
Material,
ND
ST
Geometry• The temporal variation (or not) of these• A definition of the end state or states
EN
Material
A definition of the end state, or states, we care about
time

Proposed 4 Components of A Generic Approach to Probabilistic A t f St t l I t itAssessment of Structural Integrity
• A general template onto which any structural integrity problem can be mappedintegrity problem can be mapped
• A questionnaire designed to comprehensively identify and define the models and parameters thatidentify and define the models and parameters that populate the template– This becomes the programming specification
• A modular computer code that mirrors the structure of the template
• A standard documentation and review process that• A standard documentation and review process that mirrors the structure of the template

General Template for …A Generic Approach to Probabilistic A t f St t l I t itAssessment of Structural Integrity
Define Initial Conditions
(t 0)
Define Temporal Variations
(t>0)
Define End StateWhat does end(t=0)
Geometry
Material
(t>0)# of timescales that
define problem?
What (of geometry,
What does end state (or states)
matter?
Max tolerable failure frequency
for reg latorLoading
Environment
What (of geometry, material, loading, &
environment) change in each
timescale?
C l
for regulatory review?
Max tolerable failure frequency for mitigation?
In each case:• Define models and
parameters (M&P)• Define relationships
between M&P• Decide if each M&P is
Can progress along the timescale be
altered?
for mitigation?
Decide if each M&P is modeled as• Certain or uncertain• If uncertain,
epistemic or aleatory• Characterize M&P
quality
• For each M&P, answer the same questions as for the initial condition
• Define interdependenciesquality
• Pretty good• Conservative
interdependencies between models and parameters

Application of Lessons LearnedLearned
• We are trying the general template and questionnaire out in a new projectout in a new project
• Risk informed revision of leak before break guidance• Risk-informed revision of leak before break guidance
• Too soon to say how well it has workedToo soon to say how well it has worked
• Check back again later (hopefully in less than aCheck back again later (hopefully in less than a decade!!)

Thank You for Your AttentionAttention
• Questions?????