Embed Size (px)
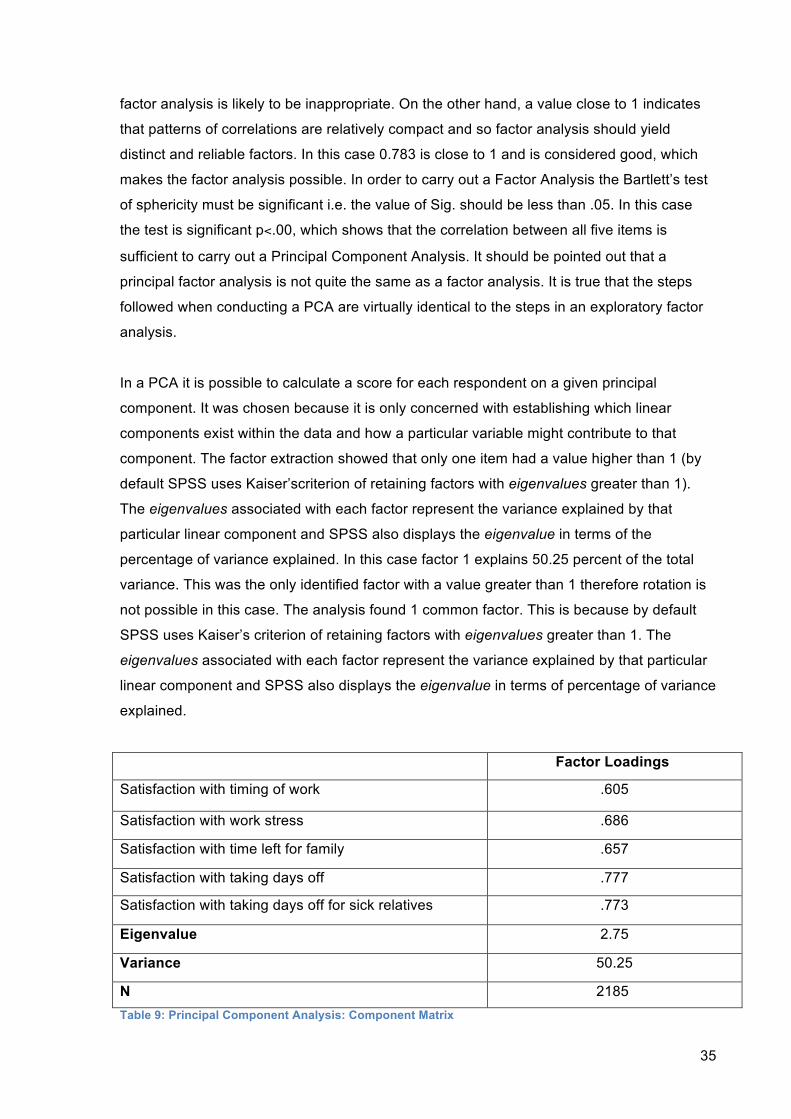
Citation preview
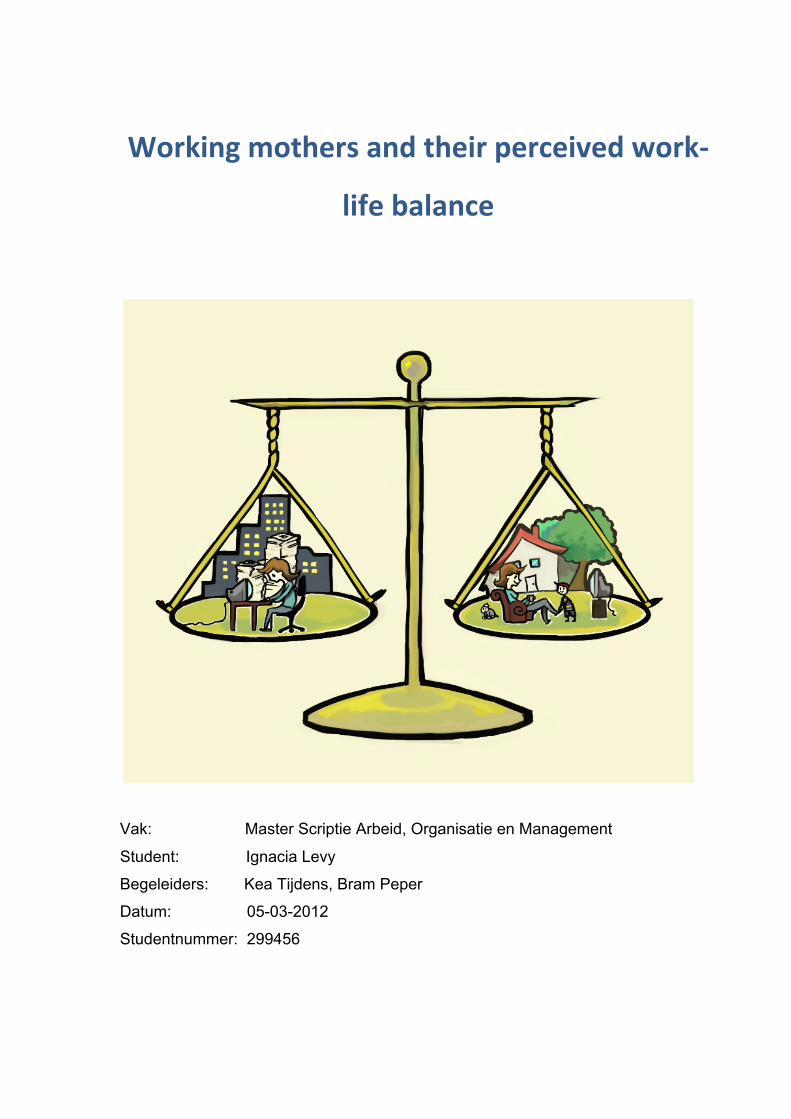
Working mothers and their perceived work-‐
life balance
Vak: Master Scriptie Arbeid, Organisatie en Management Student: Ignacia Levy
Begeleiders: Kea Tijdens, Bram Peper
Datum: 05-03-2012
Studentnummer: 299456
2
Abstract Many studies have focused on working women’s strains when it comes to the balance
between paid work and family responsibilities. Yet few studies analyze women’s subjective
sense of success in balancing these two separate spheres in terms of full-time and part-time
employment.
In this thesis, I will explore the ways in which full-time and part-time work affects women and
their perceived work-life balance. First, with the help of data from the Dutch database of the
WageIndicator I will examine the influence of child-care support, educational attainment,
age of youngest child, number of hours worked, conflict at work, and high workload on the
perceived work-life balance of working women.
Second, I examine how influential these variables are by separating them into two different
domains: life and work and carried out a statistical analysis using SPSS.
Furthermore I will outline six hypotheses regarding the influence of the aforementioned
variables divided in the life and work domain. I demonstrate that work-domain variables
affect the perceived work-life balance more than life-domain variables. Regarding role
conflict I demonstrate that for women employed full-time young children in the household
has a significant negative impact on success in balancing paid work and family life.
In the conclusion I reflect on the implications of these findings for the traditional values of
“good mothering” and an evaluation is presented with ideas for further research including
better methods for conceptualisation and operationalisation.
3
Table of Contents
Working mothers and their perceived work-‐life balance .................................................. 1
Table of Contents ............................................................................................................. 3
1. Introduction ................................................................................................................. 5
1.1 Introduction to the problem.............................................................................................................................5 1.2. Social Relevance ........................................................................................................................................................6 1.3 Scientific relevance ...................................................................................................................................................7
2) Literature research and theoretical framework ............................................................ 9
2.1. Perceived work-‐life balance.................................................................................................................................9 2.2 Determinants of the perceived work-‐life balance .................................................................................... 12 2.3 Life domain................................................................................................................................................................ 13 2.3.1 Perceived work-life balance and child-care support............................................................................ 13 2.3.2 Perceived work-life balance, age of children ........................................................................................... 14 2.3.3 Perceived work-life balance and educational attainment................................................................. 15
2.4 Work domain ............................................................................................................................................................ 15 2.4.1 Perceived work-life balance and the number of hours worked ....................................................... 15 2.4.2 Perceived work-life balance, conflict at work, and high workload................................................ 16
2.5 The rational model: “time bind” and reversing roles............................................................................. 18 2.6 Conclusion literature research ......................................................................................................................... 20
3. Methodology...............................................................................................................21
3.1 Leading question..................................................................................................................................................... 21 3.2 Hypotheses and Conceptual Model................................................................................................................. 21 3.2.1 Hypotheses involving the life domain.......................................................................................................... 22 3.2.2 Hypotheses involving the work domain ..................................................................................................... 22
3.3 Selection of Data...................................................................................................................................................... 23 3.3.1 List of independent variables: Life domain............................................................................................... 24 3.3.2. List of independent variables: Work domain.......................................................................................... 25
3.4 Missing values .......................................................................................................................................................... 27
4) Data Analysis and Empirical Results.............................................................................28
4.1 Descriptive Statistics: Independent and Dependent Variables .......................................................... 28 4.1.1 Descriptive statistics in three age groups ................................................................................................. 28
4
4.1.2 Independent variables: Life domain ............................................................................................................ 29 4.2.2 Independent variables: Work domain ........................................................................................................ 32
4.3 Dependent variable: Perceived work-‐life balance ................................................................................... 33 4.4 One way ANOVA tests ........................................................................................................................................... 36 4.4.1 Means of the perceived work-life balance on the subgroups of the variable educational
attainment ......................................................................................................................................................................... 37 4.4.2 Means of the perceived work-life balance on age youngest child (up to 12 years old)
divided into two categories ........................................................................................................................................ 37 4.4.3 Means of the perceived work-life balance on child-care support ................................................... 38 4.4.4 Means of the perceived work-life balance on high workload ........................................................... 39 4.4.5 Means of the perceived work-life balance on conflict at work......................................................... 39 4.4.6 Means of the perceived work-life balance on number of hours worked ...................................... 40
4.5 Regression analyses............................................................................................................................................... 41 4.5.1 Regression analysis of the independent variables ................................................................................. 42
4.6 Conclusion data analysis ..................................................................................................................................... 45 4.6.1 Childcare support and the perceived work-life balance ..................................................................... 45 4.6.2 Age of youngest child and the perceived work-life balance .............................................................. 45 4.6.3 Educational attainment and the work-life balance.............................................................................. 46 4.6.4 Number of worked hours and the perceived work-life balance....................................................... 46 4.6.5 Conflict at work, high workload, and the perceived work-life balance........................................ 46
5. Conclusion and Discussion ...........................................................................................48
5.1 Answer to the central question ........................................................................................................................ 48 5.2 The perceived work-‐life balance...................................................................................................................... 48 5.3 Discussion: Limitations and ideas for further research......................................................................... 50
Bibliography....................................................................................................................53
5
1. Introduction
This first chapter deals with the central question of the thesis, which will be answered with
the help of several hypotheses. What follows is a brief explanation of the social and
scientific relevance of the research question posed.
1.1 Introduction to the problem
Research on work-life balance has presented important insights into the problems of
combining family responsibilities with paid work in relation to policy relevant agendas.
Work-life balance scales are problematic for many scholars and researchers because they
conceptualize the work component more specifically than the life component, therefore what
“life” means remains rather abstract apart from general references to the “home”,
“housework, and “family responsibilities”. However, this conceptualization neglects different
dimensions to work-life balance common to specific subgroups and renders the
measurement rather intangible (Pichler, 2008: 449). Furthermore, the wordings of work-life
balance indicators already include their most probable explanations. There is thus the
danger of a circular argument here and many explanations seem causal. This makes it
difficult to conclude on the effects of other than work-related aspects on work-life balance,
which are, arguably, also important aspects of work-life balance. Finally, work-life balance
scales hardly correlate with relevant external criteria, for instance, subjective wellbeing
(Pichler, 2008).
Among the reasons for the increasing interest in the work-life balance we find the increase
of female employment, feminism, de-industrialization, higher unemployment among men,
low-level (new) service jobs as well as an intensification of “life” (see Crompton & Lyonette,
2006; MacInnes, 2006). Despite an apparently clear meaning of the concept- “to combine
work and life in a way that both are pursuable” (Pichler, 2008: 450), there is some variety in
meanings, origins and approaches to the concept, which emphasize the aforementioned
reasons to different degrees.
Work-life balance is generally related to working time, flexibility, welfare, social security,
family, fertility, migration, demographic changes, consumption, leisure time and so on (see
also Dez & Bond, 2005; Noor, 2003; Smithson & Stokoe, 2005). Research that examines
6
demographic trends (e.g. ageing, low fertility, migration), emphasize a structural component
of work-life balance, whereas approaches referring to personal circumstances, family
arrangements, (care, gender roles) and wellbeing focus on the individual. That is, the
individual’s assessment of work-life balance includes some references to the family
situation, household composition, breadwinner models, family size, and life plans turning
this into a more comprehensive picture instead of an isolating approach to work-life balance
as a concept.
This thesis attempts a more critical analysis of the impact of the different aspects of the
work and family domain on the work-life balance of working mothers.
• Leading question:
How do work domain variables and life-domain variables influence the perceived work-
life balance of working mothers?
After a thorough literature analysis on the perceived work-life balance and its determinants
a more specific research questions will be posed. Consequently a data analysis will be
carried out in order to examine the correlations of the variables of each domain on the
perceived work-life balance.
1.2. Social Relevance
Ever since the 1970s social change has initiated the decline of institutional arrangements
between the state, the economy and the family. The famous male breadwinner model where
men worked and their wives cared for the children has become less and less sustainable in
Western countries. Moreover, feminist approaches to the work-life balance emphasize an
increased strain for women in employment, whilst gender roles and ethics of care remain
rather stable concerning work in the household and child-care responsibilities (Pichler,
2008; Smithson & Stokoe, 2005).
Public policy in the Netherlands is mainly directed towards the increase in the labour
participation of women. The government set goals and has established they wanted 65
percent of the women participating in paid work by 2010 and 80 percent by 2016 (Ministerie
van OCW, 2008). It is clear that there are social expectations that come as a result of
increased female labour participation. This is expected not only before childbearing but also
after the birth of one or more children. However, in the Emancipatiebeleid 2008-2011, the
issue of men and household tasks has been practically deleted from the agenda. This is
7
mainly due to the government’s priority on the combination of work and household tasks for
couples, and not necessarily on the re-distribution of household tasks at home (Ministerie
van OCW, 2008). This means that women automatically assume a disadvantageous
position in the labour market. The fact that public policy is needed to stimulate the
participation of women in the labour market is already quite a significant phenomenon. In
addition, the struggle for a better combination of paid and unpaid work explains that this
phenomenon deserves some attention. More importantly, many of the publications that have
been published over the topic (see Ministerie van OCW, 2008; Portegijs et al. 2006) show
that women in high positions are quite difficult to find.
Educational attainment does not seem to be the problem. Recent studies show that women
younger than 35 years old have more educational attainment that most men their same age
(CBS, 2007) This is why it is interesting to examine the influence of educational attainment
on the work-life balance of working mothers. Despite it all, number of worked hours seems
to always be influential in the work-life balance. For instance, research increasingly offers
labour market relevant policy recommendations to increase work-life balance as public
debates tends to focus on long working hours as the most likely threat to a balanced life
(Fleetwood, 2007). But work-life balance is further considered as a cause of other things,
such as low fertility, population aging and their consequences (Dey, 2006; MacInnes, 2006).
This further explains why policy makers are interested in work-life balance in order to
discover ways in which the population matches the upcoming needs of the economy, the
labour market, and social security.
1.3 Scientific relevance
Generally it is assumed that work-life balance is experienced when demands from the
domain of (paid) work are compatible with demands from other domains, e.g. family or
leisure time (Pichler, 2008). Byrne (2005: 54) describes work-life balance very broadly as
“juggling five aspects of our lives at any one point in time: work, family friend, health and
spirit (or self) “. It can therefore be assumed that a “balanced” living occurs when activities
and aspirations in one domain do not have negative effects on activities in the other one.
Many studies have, however, put emphasis on the relationship between work and (family)
life and thus narrowed down the scope of what scholars and researchers of work-life
balance are most interested in. Furthermore, in the majority of analyses of survey data,
working conditions explain by far the largest part of the variation on the one hand (Pichler,
2008). More importantly, some working conditions are explicitly presented as a clear threat
8
to the work-life balance. On the other hand, measures of work-life balance show to be
hardly significant when tested for correlations with components such as child-care
responsibilities or number of children. It can therefore be argued that an accurate measure
of work-life balance is sensitive to all aspects of life and merely (family) life-related variation
in work-life balance is only one aspect of it. The model used in this dissertation includes a
variety of competing explanations of both the life and family domains of the work-life
balance of working mothers.
9
2) Literature research and theoretical framework
This chapter gives an overview of the existing literature and studies regarding the perceived
work-life balance of working mothers. The first part of the chapter starts with an overview of
the studies that have already been carried out on this particular subject. This will be
examined more carefully throughout the whole chapter. What follows are the hypotheses,
which will be examined separately from the literature research.
2.1. Perceived work-‐life balance
The concept of work-life balance is attracting increasing attention at both the national and
international level. Rising levels of employment among women were a consequence not
only of changes in the attitudes and values of women, but also of developments in the wider
economy.
So what exactly does perceived work-life balance refer to? A rich research literature already
addresses some aspects of work-life balance. For example, there is a well- developed
literature pertaining to work and family domains (see Edwards & Rothbards, 1999; 200;
Greenhaus & Beutell, 1985; Voydanoff, 2002; Crooker et al., 2002, Pichler, 2008).
As such, family is typically defined in terms of parent/child or dual-career relationships, and
studies target specific demographic groups such as working mothers. Research also
examines employer programs, such as flexible work schedules, alternative work
arrangements (Powell & Mainiero, 1999), and child-care responsibilities (see Hughes &
Galinsky, 1988) that are developed to support oriented demographic groups. However, in
the study of Crooker et al. (2002) this perspective on work-life excludes other demographic
groups such as “singles who may have less financial flexibility and fewer resources of social
support, men who may be primary caregivers, family members who may be responsible for
elder care, and cultures with dissimilar value systems” (p. 388).
The traditional approach to addressing work-family issues has been challenged in the press
and is not fully compatible with current patterns of the twenty-first century workforce. For
example, the expanding globalization of operations will welcome more cultural diversity, and
the workforce will see a continued influx of women and minorities. This diverse workforce
10
will be increasingly likely to telecommute or work at decentralised locations and maintain
contingent employment relationships as temporary or contract workers (Crooker et al.,
2002). Evolving work relationships, placing more pressure on organizations, as well as on
individuals balancing multiple domains of their lives, illustrate the need both heuristically and
theoretically to expand the conceptualization of work-life balance issues.
In their research Crooker et al., (2002) argued that higher levels of life complexity and
dynamism experienced by individuals will result in lower levels of perceived work-life
balance. However, this relationship will vary with the munificence and accessibility of
resources in one’s environment as well as with individual differences of values and
personality traits. As a result, they incorporated the impact of four sets of moderating
variables, two macro-level variables and two micro-level variables, on the relationship
between life complexity/dynamism and work-life balance. At the micro-level, the relationship
is influenced by the personal value system (Rokeach, 1973) and individual applies and
holds dear to himself or herself (value intensity) as well as the values that are shared across
domains of one’s life (values pivotal space) and values that are shared with members of his
or her work life and personal life (value crystallization) (Chatman, 1989).
The study of Crooker et al., (2002) focused particularly on those personality constructs that
may explain how individuals respond to complexity and dynamism in life. In their model
there is a representation of the antecedents of work-life balance in which life complexity and
dynamism are posited as an independent variable set affecting the dependent variable
work-life balance.
According to Hildebrandt & Littig (2006) the long-term tendencies of changing societal value
orientations also play an important role. Currently, we can observe a certain synthesis of
traditional, performance and reliability-oriented values on the one hand, and modern
demands for self-determination and self-realization on the other hand. This shift has for a
long time been interpreted as an increased emphasis on free time, as a diminution of the
significance of work-related obligations in favour of leisure time. The various changes in
work organization have increased the need for new skills and self-organization, but people
have also become more aware of the obligations and duties of private, every-day life.
Unfortunately, the work-life balance formula does not prevent the dominance of work over
the time patterns of life.
Another characteristic is the extent to which normative standards are taken into account,
both directly and indirectly. Many studies focus mainly on female employment and new
11
family constellations (see Milkie & Peltola, 1999). Their normative point of reference is
gender equity in employment participation and the distribution of care work, but different
ideas about the right balance between public assistance for families and individual
responsibility are considered as well. In this way, some studies associate balance with a
state of near stability, whereas others emphasise the act of balancing in a situation of
(permanent) imbalance (see Hildebrandt & Littig, 2006). Work-life balance studies examine
negotiation processes that involve different interests and different areas of life, including the
possibilities to attain the individually desired conditions (such as working time) and thus
maintain or improve the quality of life.
The term work-life balance is based on the assumption that these are two individual and
clearly separated spheres, the interplay of which significantly affects the quality of life, but
many, especially feminist, researchers often doubt the validity of this assumption. They
criticize the separation of work and family life as being a “simplified dualism” (Hildebrandt &
Littig, 2006: 220). Furthermore they argue that day-to day life also happens under
employment conditions, and that the family and household have always involved hard and
involuntary work.
The proposed difference between the work and family spheres has been strengthened by
the continuous reduction of time spent at the workplace and the resulting increase of free
time. Some more recent developments have cast further doubt on this type of differentiation
and cause at least some of the boundaries between work and family life to disintegrate. In
spite of the increasing tendency to individualize employment, free time has been reduced by
various work-related activities such as the trip to and from work, vocational training, health
programs, or simply working overtime. The boundaries between time spent at the workplace
and the time set aside for private life may vary in each individual case and need to be
continually re-determined.
The main obstacle lies in adequately conceptualising these boundaries and/or their removal.
In addition the work-life balance formula mainly concentrates on short-term, individual
reconciliation efforts, which are in most cases only a reaction to existing imbalances.
Many different requirements have to be met at the same time and relevant work- and family-
related conditions need to be reconciled with everyday life. However, it is also possible to
attain balance by focusing on different things at different times, i.e. step by step, rather than
trying to get everything done simultaneously. This leads to a so-called biographical balance,
which makes it possible and/or easier to accomplish all elements of a fulfilling existence
during the course of one’s life.
12
This dual way to organize life comprises a life story that is separated into different phases
(education, employment, family). So far, the biographical balance has hardly been
considered, although it should be taken into account that these two types of balances do
indeed have a strong mutual effect on each other.
2.2 Determinants of the perceived work-‐life balance
Some researchers assert that the way individuals evaluate their own particular mode of
work-life balance will, apart from more objective role demands, depend on specific needs,
expectations, and satisfactions. Determinants such as long working hours and a high
workload are likely to be critical to determine the degree to which an individual is able to “
balance the demands of work and family responsibilities “ (Steibler, 2009: 470). Moreover,
large-scale surveys most definitely play an important role in contemporary social science.
Nevertheless, there are small-scale (partly non-representative) surveys as well as more
qualitative studies dealing with the work-life balance in varying depth (see Hyman et al.
2005; Noor, 2003). Some authors have used a 22-item scale to differentiate between
various forms (time-based; strain based) of work-to-family and family-to-work conflicts (see
Kelloway et al. 1999; Noor, 2003). Whilst these measures tackle the issues at hand from a
slightly different perspective, they apply the same conceptual ideas to the study of work-life
balance. Qualitative research, such as the one by Hyman et al. (2005) often investigates the
nature of the boundaries between work and home (family). This highlights the problematic
distinction between work and home, which cannot be upheld in all situations (e.g. shift work,
work on short notice, etc) and thereby negatively impacts the subjective feelings of balance
(Pichler, 2008).
In the literature, the work-life balance is mostly considered more important for women, who
continue to bear the burden of domestic duties. Behson (2002) found evidence that family-
friendly work cultures were slightly more important to satisfaction and commitment for
women than men. When testing for organizational variables Sturges & Guest (2004) found
that age, gender, marital status and dependent children had no effect on the work-life
balance. Similarly, Greenhaus et al (2003) did not find any moderating effects of gender,
parenthood, and career aspirations on relations between the work-life balance and the
quality of life (Parkes & Langford, 2008).
In the following pages I make a sharp distinction between life and work domain. For each
domain I examine the literature on the correlation of several factors that can have an
influence on the perceived work-life balance. At the end of the chapter it will be concluded
which variables will be examined in the data analysis. The chapter will end with a more
13
specific research question in which the chosen life and work domain variables will be
named.
2.3 Life domain
What follows is a literature research investigating the relationship or correlations found in
previous studies between the perceived work-life balance and each of the independent
variables of the life domain; child-care support, age of youngest child, and educational
attainment.
2.3.1 Perceived work-‐life balance and child-‐care support
For the most part, the entry of women into the labour force has resulted in an extension of
women’s roles rather than a redefinition of gender roles. Hochschild (1989) found that 80
percent of the men in her sample did not share in the housework and child-care
responsibilities, even when their partners had full-time jobs. Their study also showed that
women seemed to be restructuring work on a regular basis in response to needs of the
family, spouse or children. Therefore, the results support those of earlier studies (Hertz,
1986) showing that women beared a greater burden when adapting to work and family
demands on a daily basis. More than fifteen years later it seems that this situation has not
changed. Crompton & Lyonette (2006) found a negative perceived work-life balance of
working women in five different European countries (Finland, Norway, Britain, France,
Portugal) in particular when it came to childcare responsibilities (in their study referred to as
“domestic tasks”). They argued that at the individual level, attitudes to gender roles would
certainly have an impact; for example, a highly “traditional” domestic division of labour might
lower the perceived work-life balance. This is because by convention, women carry out the
larger part of domestic work, although the extent of gender differences varies considerably
between different countries. The findings of their research show that the presence of a more
“traditional division of domestic labour made a contribution to lower levels of perceived
work-life balance (Crompton & Lyonette, 2006).
The literature on women and men’s daily lives is fairly consistent in reporting that the total
demands on employed women (paid work, housework, and child care) are higher than on
employed men (Milkie & Peltola, 1999). In a study by Robinson and Godbey (1997) using
time diaries, they report that for those employed more than 20 hours a week, women spend
30.8 hours doing paid work per week, and men spend 39.7 hours. Women spend 25.6
hours and men spend 14.3 hours on family care, including standard housework, shopping,
and caring for the children. This means that for employed women, the total time demands
from unpaid and paid work exceed men’s total by about 1 ½ hours per week. This proved to
14
have a negative influence on the balancing of work and family responsibilities for women,
and therefore a negative perception of the work-life balance. Hochschild (1989) reports that
employed mothers put in an “ extra month per year” of a 24-hour day, compared with
employed fathers.
Not only are employed women and men likely to have different total workloads but they also
allocate their time in different ways. Men typically engage in more paid work, and women
engage in more housework, childcare, and eldercare. It is commonly acknowledged that
women often choose for part-time work due to the presence of children (in particular young
children) in the household. This is due to the fact that in most EU countries women still carry
the burden of unpaid household and family work (Fagan & Burchell, 2002). This is important
to consider when thinking about women’s work-life balance. Moreover, the literature shows
that men generally do not adjust their home time in response to their wives’ feelings of
balance may be less affected by husbands’ work life.
The importance of child-care cannot be undermined. Dual-earner families in The
Netherlands are increasingly dependent on support from grandparents, babysitter, crèche,
in order to leave their children to go to work. It is important to investigate whether having
this support influences the perceived work-life balance positively.
2.3.2 Perceived work-‐life balance, age of children
A study by Lundberg et al (1994) comparing total workload (sum of paid and unpaid work),
conflict between demands of work and family, and control over housework between men
and women in white-collar occupations, showed that number of children at home was a
crucial factor with regard to these variables. In families with no children at home, the total
workload of full-time employed women was about 60 hours per week. For women, the
number of hours per week increased rapidly with children at home, but this increase was
much smaller for men. In families with three or more children, women’s total workload was
almost 90 hours. In addition, conflict between demands of work and family roles increased
and control over home and household work decreased with number of children at home.
Many scholars argue that unpaid work takes up a great deal of time for women, particularly
when there are children in the family (Craig, 2006). Moreover, the burden of childcare
occurs when children are very young and decreases as the children mature (Craig, 2007).
Pichler (2008) found that very small children do not make a difference everything else being
equal. However, women with children aged three to five (0.10) and children aged six to
eleven (0.05) reported slightly lower levels of perceived work-life balance. Interestingly,
15
people with children under the age of three are as good (or bad) off in terms of perceived
work-life balance than people without children under twelve.
2.3.3 Perceived work-‐life balance and educational attainment
For working women with young children it applies that, the higher their educational
attainment the higher their participation in the labour force. For the last decade, the general
trend has been an overall decrease in the number of hours spent on unpaid labour by
women, in particular regarding domestic responsibilities. In 1995 women were spending as
much as twice the time on domestic and family responsibilities compared to men. However,
that year was also busy for men, since they also spent more time on both paid and unpaid
labour (Knijn & Van Wel, 2001). Furthermore, the level of educational attainment of couples
living together seems to have little effect on the amount of time that men spend on domestic
tasks. Robinson & Godbey (1997) report that “time crunch” is more common among women,
particularly divorced women and women in the paid labour force. Their findings also indicate
that parents are more time pressured than non-parents and that well-educated and affluent
respondents are more likely to report feeling highly time crunched. Furthermore, Pichler
(2008) argues that the highest level of education also impacts on the work-life balance,
though to a minor extent. Education was among other social-demographic variables such as
gender, occupational class, and age, which accounted for only 2 percent of the variance in
the work-life balance.
Twenty years ago education had a positive influence on the work-life balance. In a study by
Ross and Huber (1985), the results showed that, when other aspects of status are held
constant, education is the single most important aspect of status for women’s well being. In
addition, for women, whether employed or not, education has the largest effect on reducing
stress. It is therefore predicted that educational attainment will have a positive influence on
the work-life balance.
2.4 Work domain
What follows is a literature research investigating the relationship or correlations found in
previous studies between the perceived work-life balance and each of the independent
variables of the work domain; number of hours worked, conflict at work, and high workload.
2.4.1 Perceived work-‐life balance and the number of hours worked
Several studies show that the most powerful predictors of the work-life balance are work-
related objective criteria such as working hours and working outside “normal hours”
16
(evenings, weekends, and working overtime on short notice). Pichler’s study (2008) shows
that women who work part-time experience even better work-life balance as indicated by a
negative interaction term of -0.06. The longer the working hours, the higher their imbalance
by 0.01 and working evenings, weekends or overtime on short notice are severe causes of
a disruption in the work-life balance.
In their study Marks & Macdermid (1996) argued that people who have well balanced role
systems, which they conceptualize as full engagement in and enjoyment of all (unspecified)
roles, have higher levels of wellbeing. Using a sample of employed mothers, they showed
that those who were more “role balanced”, who enjoy every part of life equally well, were not
necessarily the ones who worked the fewest hours. They worked the same number of hours
as the less balanced, and they report less overload, had higher self-esteem, and lower
depression levels. Similarly using a sample of college students, they showed that role
balance was not related to less demanding roles. The more balanced students did not have
fewer friends, did not work fewer hours, nor did they take fewer classes.
Marks & Macdermid (1996) also argued that the structure of everyday relations and cultural
norms suggest that women having less power may lead to greater sacrifice so that work-
family life can run smoothly. For example, the role of mother makes demands that often
cannot be scheduled and that may be exacerbated by the culturally normative expectations
attached to “good mothering”. In fact, some studies suggest that the role of mother is the
principle source of stress for women (see Barnet & Baruch, 1987).
Women can be committed to and enjoy their roles as mothers and workers equally and still
feel strains- more so than men- because their responsibilities to home are likely greater and
they may sacrifice more (Shelton, 1992).
2.4.2 Perceived work-‐life balance, conflict at work, and high workload
In order to explain differences in the work-life balance, Pichler (2008) referred to subjective
and objective factors in the areas of work and the household. As for house-related factors
he used breadwinner models (partner is also working or not), presence of children of
specific ages in the household, main type of childcare (for youngest child), and hours spent
on housework as objective criteria. Subjective household-related aspects then are economic
strain, amount of housework, time flexibility, concerning housework and stressful
housework. Objective household criteria explained only 2 percent of the variation in the
work-life balance. As mentioned earlier, their most interesting finding concerning the
household is that women with children aged three to five (0.10) and children aged six to
17
eleven (0.05) report slightly higher levels of perceived imbalance. Interestingly, people with
children under the age of three are as good (or bad) off in terms of work-life balance than
people without children under twelve living in the household. On the other hand, subjective
household conditions explained 6 percent of the variation.
Perceptions such as an overload of household work, the lack of flexibility concerning
schedules of housework, and the level of perceived stress in household related tasks
contributed significantly to the explanation of work-life balance. However, by far the most
powerful predictors of work-life balance in this study are work-related objective criteria such
as working hours and working outside “normal hours” (evenings, weekend, and working
overtime on short notice). On top of household conditions, they explained another 14
percent of the variation. The results indicated that part-timers experience much lower levels
of imbalance (-0.19) than full-time workers.
Finally, work-related subjective aspects also contribute to the explanation of work-life
balance. Three percent was additionally explained by perceptions of job (in)security (0.04),
an effort-dependent wage or salary (0.02), time (in)flexibility (0.03), a hard job (0.09) and a
heavy work (over)load (0.09).
Despite a somewhat different question wording the underlying ideas about the work-life
balance in large-scale surveys is quite similar. Work-life balance is threatened if people are
too tired from work to do necessary things at home (Pichler, 2008), if they cannot perform
according to their roles because of the time they spend on their job and if household or
family responsibilities impede concentration at work.
Most empirical studies based on the demands and resources approach have used a single
item asking respondents about their level of satisfaction or success with the balance
between their work and family lives, demands, or responsibilities. Valcour & Batt (2003),
however, developed a scale based on items asking the level of satisfaction with the division
of time and attention between work and personal life, ability to balance needs across
domains, ability to perform job and home duties adequately, and fit between work life and
personal or family time. In addition, the scale produced in the study of Hill et al. (2004)
included items on the extent to which work resources such as flexibility and time away from
work are sufficient to maintain balance as well as questions regarding overall balance.
These measures provide an insight of the extent to which balance of demands and
resources allows an adequate role performance in work and family life. Results showed that
within-domain and boundary-spanning demands such as long work hours, job demands,
18
conflict, elder-care responsibility, and job-related travel generally were negatively related to
work-life balance, whereas the relationship between balance and young children at home
was statistically significant in some studies but not others (Hill et al., 2004; Batt & Valcour,
2003). Within-domain and boundary-spanning resources such as job autonomy and
complexity, part-time work; supervisor work-family support, and a supportive work-family
culture generally showed positive relationships to work-family balance, whereas flexible
working hours and on-site child-care were unrelated to balance (see Batt & Valcour, 2003).
2.5 The rational model: “time bind” and reversing roles
Although work can compliment- and, indeed, improve- family life, in recent decades it has
largely competed with the family (Hochschild, 1997).
Hochschild (1997) first introduced the term “time bind’ to describe a situation in which one
prefers to divide time between work and home differently than it is usually done, but
fulfilment of this preference is very difficult to achieve. The “time bind” implies that both men
and women have limited amounts of time available to allocate to the home and the work
domain. Thus, time becomes a valuable resource to families.
In the context of this dissertation the time bind can be understood as a perceived imbalance
between the work and life domain. This explanation allows for the possibility that individuals
might prefer more or less work time and/or less family or personal time and all would
perceive work-life imbalance. The opposite of a time bind is a perceived work-life balance
(Tausig & Fenwick, 2001). Hochschild (1997) argues that as the first shift (at the workplace)
takes more time, the second shift (at home) becomes more hurried and rationalized. The
longer the workday at the office, the more pressure to hurry home and to segment the
remains of family time. Furthermore, Hochschild (1997) argues that the more attached
individuals are to the world of work, the more its deadlines, its cycles, its pauses and
interruptions shape their lives and the more family time is forced to accommodate to the
pressures of work. What may seem to working parents like a solution for their bind-
efficiency and time segmentation- can eventually become problematic. Therefore, in order
to be efficient with whatever time they do have at home, many working parents try to go
faster. Therefore as time becomes something to “save” at home as much as or even more
than work, domestic life becomes a second shift; it becomes all about efficiency.
The rational view of work-life balance postulates that the levels of imbalance one perceives
rises in proportion to the number of hours one expends in both work and family roles
(Greenhaus, Bedeian, & Mossholder, 1987). According to this view, the more hours a
19
person spends on work activities, the more she or he should experience interference from
work to family. Similarly, the more time spend in family activities responsibilities the more he
or she should experience imbalance in both domains. Furthermore, the rational view also
predicts that the total amount of time spent performing work and family roles is positively
associated with role overload (Greenhaus & Beutell, 1985). Research indicates that
employed women spend many more hours than employed men on family and household
chores and more hours on work and family activities in total (Hochschild, 1989; Pleck,
1979).
Kahn et al. (1964) distinguished among different types of role conflict, all having one more
major characteristic: member of the role set exert role pressures to change behaviour of the
focal person. For the purpose of this thesis only inter-role conflict will be examined. The
nature of one’s relations with his/her role senders affects the way working mothers
experience and respond to imbalance, created mostly by role conflict. That is, interpersonal
relations mediate in various ways the emotional and behavioural consequences of role
conflict.
Role expectations refer to the prescriptions and proscriptions held by members of a role set.
Individuals develop beliefs and attitudes about what they should and should not do as part
of their role (Kahn et al., 1964). The content of these expectations may include preferences
with respect to specific acts and personal characteristics or styles; they may deal with what
the person should do, what kind of person he/she should be, what she should think or
believe, and how she should relate to others. From the different types, other complex forms
of conflict develop. For example, a very prevalent form of conflict is role overload. Overload
could be regarded as a kind of inter-sender conflict in which various role senders may hold
legitimate expectations that a person perform a wide variety of tasks, all of which are often
mutually incompatible (Kahn et al., 1964). Individuals are likely to experience overload as a
conflict of priorities. Therefore role conflict and ambiguity tend to create special problems of
adjustment for the individual and this in turn affects the work-life balance. It is costly for the
person and for the organizational unit in which the individual works. This creates an
imbalance because the individual is not able to manage the work and the home domain
successfully. It is because of the importance of role and time conflict that the
operationalization of work-life balance in this thesis will be related to the satisfaction that
working mothers perceive in the relationship between the different determinants of the work
and life domain as well as the work-life balance. I therefore focus on the psychological
experience of the perceived work-life balance by operationalizing it as (1) satisfaction with
20
timing of work, (2) satisfaction with work-stress, (3) satisfaction with time left for family, (4)
satisfaction with taking days off, and (5) satisfaction with taking days off for sick relatives.
After examining both life and work domain determinants, the leading question can be
specified:
Leading question:
How do child-care support, age of children, educational attainment, number of hours
worked, conflict at work, high workload, influence the perceived work-life balance of working
mothers?
2.6 Conclusion literature research
The literature concerning the work-life balance is abundant. Many theories are used to
explain the level of (im) balance of men and women. Most studies examine the effect of
work and life domain determinants on both men and women. For many researchers, the
normative point of reference is gender equity in employment participation and the
distribution of care work. The problem with this is that different determinants have different
levels of relevance to both men and women and of course, the pressures experienced can
also differ greatly when comparing the effect of certain determinants with gender.
Furthermore, it can also be concluded that much of the research done on this subject gives
importance to both the work and life domain determinants. Nevertheless, it still remains
difficult for researchers to separate the boundaries between work and home. The term work-
life balance is based on the assumption that these are two individual and clearly separated
spheres, the interplay which significantly affects the quality of life. But many researchers, in
particular feminist, often doubt the validity of this assumption criticizing it for being simplistic
and dualistic. Therefore the solution is to try and adequately conceptualise both domains.
21
3. Methodology
This chapter deals with the methodology that will be used for the data analysis. In the
sections that will follow the conceptual model will be presented and the hypotheses will be
explained. Subsequently, the main concepts will be operationalized. Section 3.2 describes
the data that will be used and the research plan. The chapter finishes with section 3.3,
which illustrates the dependent and independent variables.
3.1 Leading question
How do child-care support, age of children, educational attainment, number of hours
worked, conflict at work, high workload, influence the perceived work-life balance of working
mothers?
3.2 Hypotheses and Conceptual Model
In the literature research it was concluded that women still bear primary responsibility for
home and child-care responsibilities regardless of their employment status (Hochschild,
1997). Based on the findings of the literature research a series of hypotheses were
formulated that deal with the positive, negative, or no relationship between life and work
domain variables and the perceived work-life balance. The hypotheses created mainly
assess for positive, negative or no correlations between the determinants and the perceived
work-life balance. Furthermore, the hypotheses were separated into two categories in the
section that follows, the work and the life domain. The categorization of these variables into
two domains is crucial when analysing the influence of the selected independent variables
on the work-life balance. The life domain includes hypotheses that investigate a positive,
negative, or simply no correlation between childcare support, age of children, and
educational attainment on the one hand. On the other hand, the work domain includes
hypotheses concerning number of hours worked, and working conditions, such as high
workload and conflict at workplace. The next section shows the hypotheses that will be
examined and the conceptual model.
22
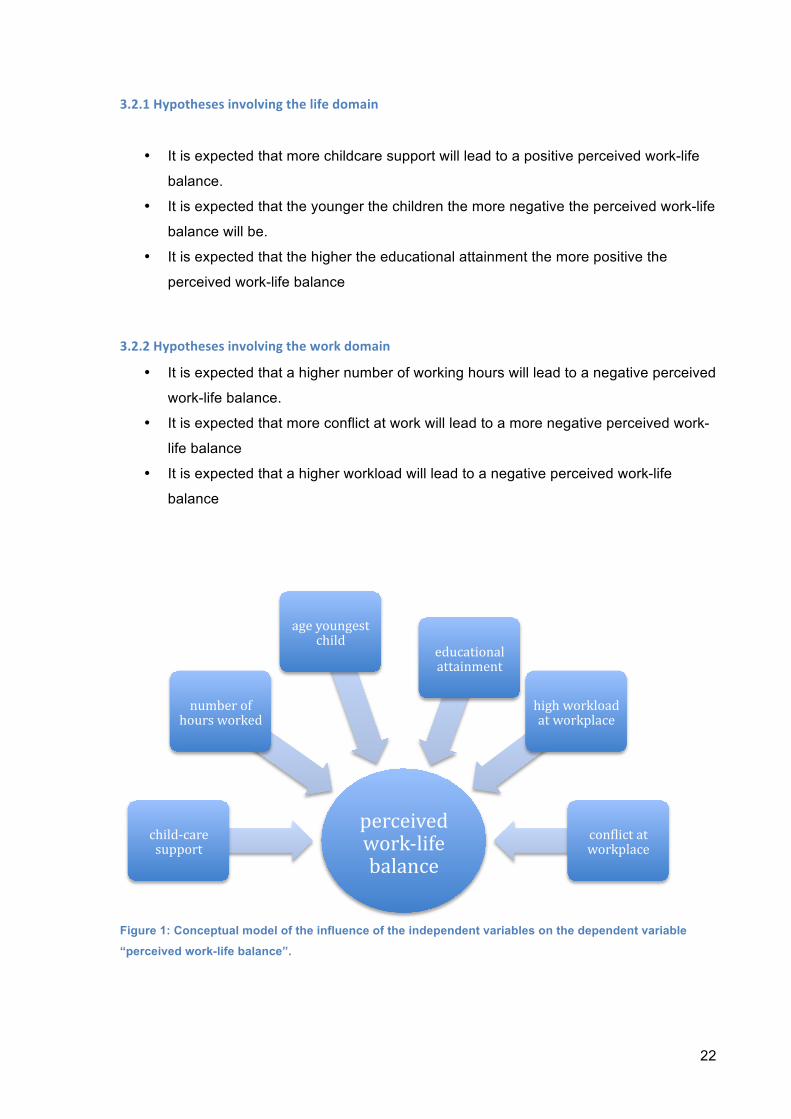
3.2.1 Hypotheses involving the life domain
• It is expected that more childcare support will lead to a positive perceived work-life
balance.
• It is expected that the younger the children the more negative the perceived work-life
balance will be.
• It is expected that the higher the educational attainment the more positive the
perceived work-life balance
3.2.2 Hypotheses involving the work domain
• It is expected that a higher number of working hours will lead to a negative perceived
work-life balance.
• It is expected that more conflict at work will lead to a more negative perceived work-
life balance
• It is expected that a higher workload will lead to a negative perceived work-life
balance
Figure 1: Conceptual model of the influence of the independent variables on the dependent variable
“perceived work-life balance”.
perceived work-‐life balance
child-‐care support
number of hours worked
age youngest child
educational attainment
high workload at workplace
conWlict at workplace
23
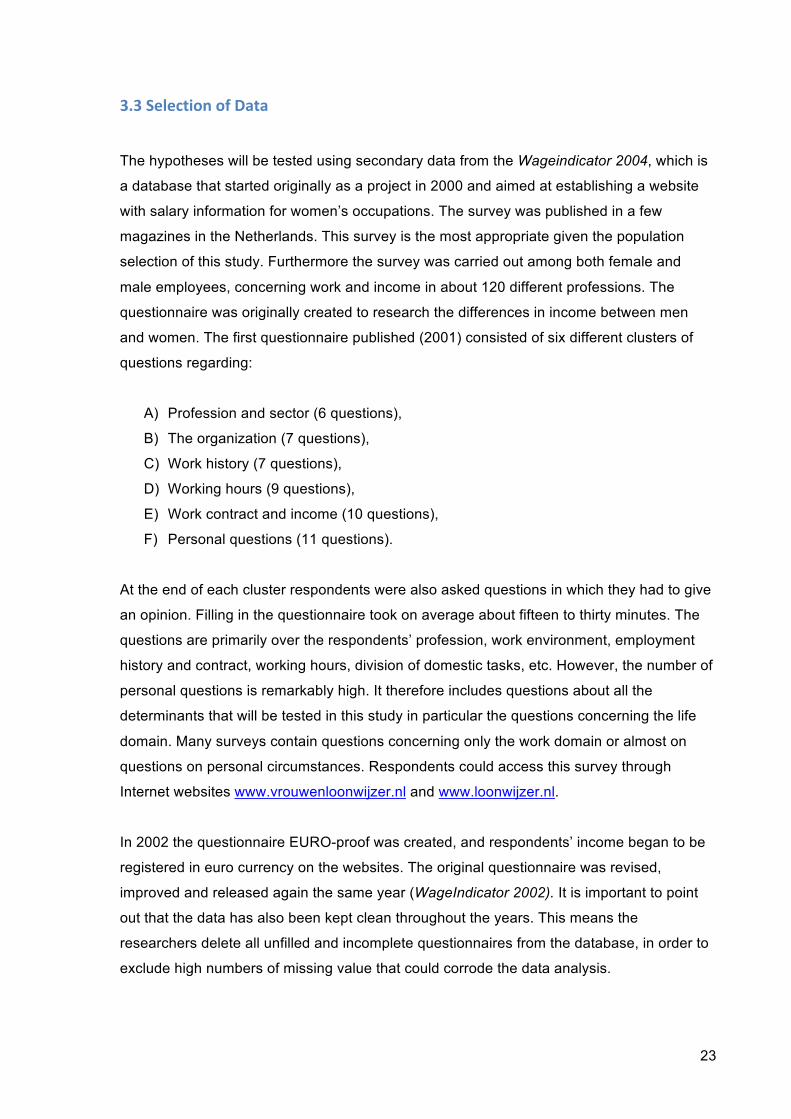
3.3 Selection of Data
The hypotheses will be tested using secondary data from the Wageindicator 2004, which is
a database that started originally as a project in 2000 and aimed at establishing a website
with salary information for women’s occupations. The survey was published in a few
magazines in the Netherlands. This survey is the most appropriate given the population
selection of this study. Furthermore the survey was carried out among both female and
male employees, concerning work and income in about 120 different professions. The
questionnaire was originally created to research the differences in income between men
and women. The first questionnaire published (2001) consisted of six different clusters of
questions regarding:
A) Profession and sector (6 questions),
B) The organization (7 questions),
C) Work history (7 questions),
D) Working hours (9 questions),
E) Work contract and income (10 questions),
F) Personal questions (11 questions).
At the end of each cluster respondents were also asked questions in which they had to give
an opinion. Filling in the questionnaire took on average about fifteen to thirty minutes. The
questions are primarily over the respondents’ profession, work environment, employment
history and contract, working hours, division of domestic tasks, etc. However, the number of
personal questions is remarkably high. It therefore includes questions about all the
determinants that will be tested in this study in particular the questions concerning the life
domain. Many surveys contain questions concerning only the work domain or almost on
questions on personal circumstances. Respondents could access this survey through
Internet websites www.vrouwenloonwijzer.nl and www.loonwijzer.nl.
In 2002 the questionnaire EURO-proof was created, and respondents’ income began to be
registered in euro currency on the websites. The original questionnaire was revised,
improved and released again the same year (WageIndicator 2002). It is important to point
out that the data has also been kept clean throughout the years. This means the
researchers delete all unfilled and incomplete questionnaires from the database, in order to
exclude high numbers of missing value that could corrode the data analysis.
24
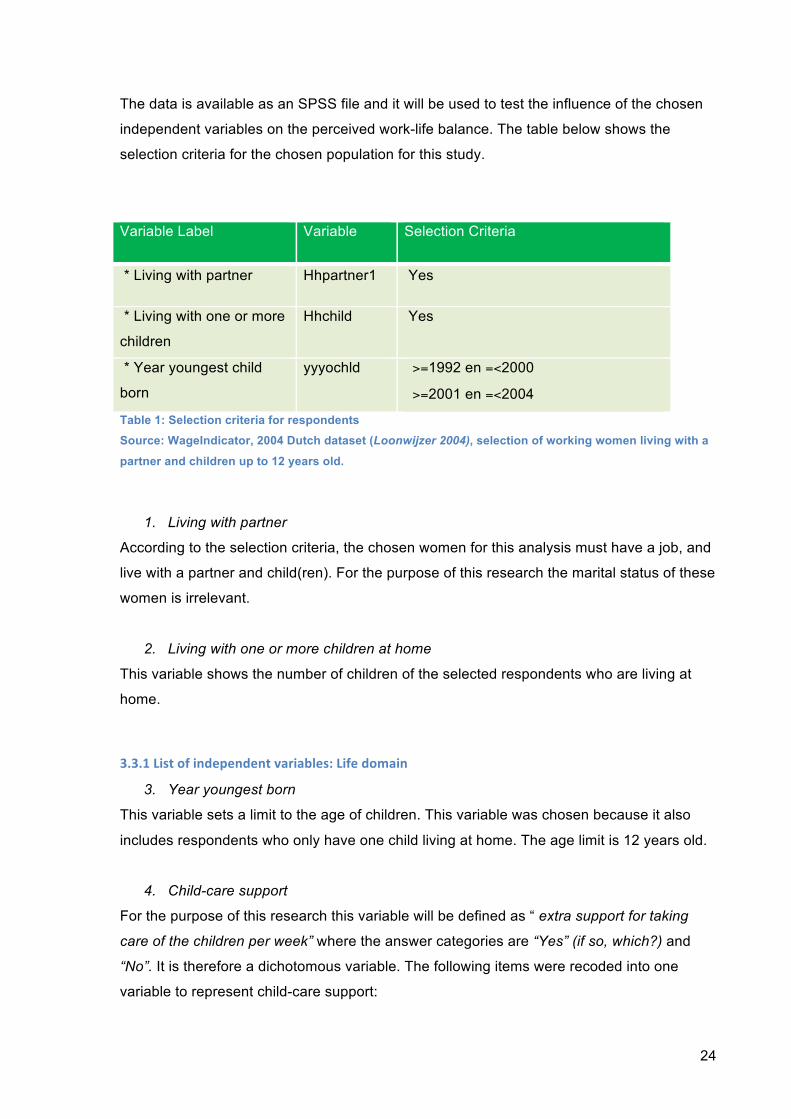
The data is available as an SPSS file and it will be used to test the influence of the chosen
independent variables on the perceived work-life balance. The table below shows the
selection criteria for the chosen population for this study.
Variable Label Variable Selection Criteria
* Living with partner Hhpartner1 Yes
* Living with one or more
children
Hhchild Yes
* Year youngest child
born
yyyochld >=1992 en =<2000
>=2001 en =<2004
Table 1: Selection criteria for respondents Source: WageIndicator, 2004 Dutch dataset (Loonwijzer 2004), selection of working women living with a
partner and children up to 12 years old.
1. Living with partner
According to the selection criteria, the chosen women for this analysis must have a job, and
live with a partner and child(ren). For the purpose of this research the marital status of these
women is irrelevant.
2. Living with one or more children at home
This variable shows the number of children of the selected respondents who are living at
home.
3.3.1 List of independent variables: Life domain
3. Year youngest born
This variable sets a limit to the age of children. This variable was chosen because it also
includes respondents who only have one child living at home. The age limit is 12 years old.
4. Child-care support
For the purpose of this research this variable will be defined as “ extra support for taking
care of the children per week” where the answer categories are “Yes” (if so, which?) and
“No”. It is therefore a dichotomous variable. The following items were recoded into one
variable to represent child-care support:
25
• Babysitter or guest parent took care of child
• Others took care of child
• Partner took care of child
• Nursery took care of child
The age of children will be limited to 12 years old.
5. Age of children
This variable is numerical and will be separated into two categories, age of children from 0
to 3 years of age, and 4 to 12 years of age. Only working women with partner and child(ren)
living at home up to 12 years old will be included in the analysis.
6. Educational attainment
The educational attainment variable is nominal will be divided into low, middle, and highest
attained education. The variable represents low educational attainment, middle educational
attainment, and high educational attainment. “What is the highest level of education you
have attained (with diploma)?
The three levels represent the following diplomas:
Low: Bassischool/ VBO/ VMBO/ MAVO/ ULO
Middle: HAVO/ MMS/ VWO/ HBS/ MBO
High: HBO/ WO
3.3.2. List of independent variables: Work domain
7. Number of hours worked
This is a numerical variable. Respondents were asked to fill in the amount of hours worked
as stated in their job contract “Fill in the number of hours worked as stated in your job
contract”. In the dataset the selected cases where those that corresponded to working
women with partner and children living at home. Therefore single mothers, or women
without children or partner were not included in the analysis.
8. High workload at workplace
This variable is interval and measured by means of a Likert scale of 5 items that range from
1= ”Fully disagree”, 2= ”Disagree”, 3= ”Neutral”, 4= ”Agree”, and 5= “Fully agree”.
Respondents where asked to answer to what extent they agreed with the following
statement “At workplace workload is high”.
26
9. Conflict at workplace
This variable is nominal with three categories. Respondents where asked to the following
statement “At workplace conflict regularly occurs”. Answer categories where “yes”, “no”, and
“I don’t know”.
10. Perceived work-life balance
For the purpose of this analysis, the operationalization of the work-life balance must include
variables that concern both the work and life domain. In the dataset there is no variable,
which accurately represents both domains. Based on the literature research and the central
question of this analysis, the work-life balance will be operationalized by creating a variable
including the following five variables:
• Satisfaction with timing of work
• Satisfaction with work stress
• Satisfaction with time left for family
• Satisfaction with taking days off
• Satisfaction with taking days off for sick relatives
These five variables are interval and the Likert items range from 1= “Highly dissatisfied”, 2=
“Dissatisfied”, 3= “Neutral”, 4= “Satisfied”, and 5= “Highly satisfied. In part 4 a principal
component analysis will be carried out.
This analysis begins with communalities of 1 with all factors retained (because we assume
that all variance is common variance). A reliability analysis will also be carried out in order to
test the reliability of the scale. A common interpretation of Cronbach’s alpha is that it
measures “undimensionality”, i.e. the extent to which the scale measures one underlying
factor or construct. This interpretation stems from the fact that when there is one factor
underlying the data, Cronbach’s alpha is a measure of the strength of that factor. This will
be examined in detailed at a later stage of the data analysis
27
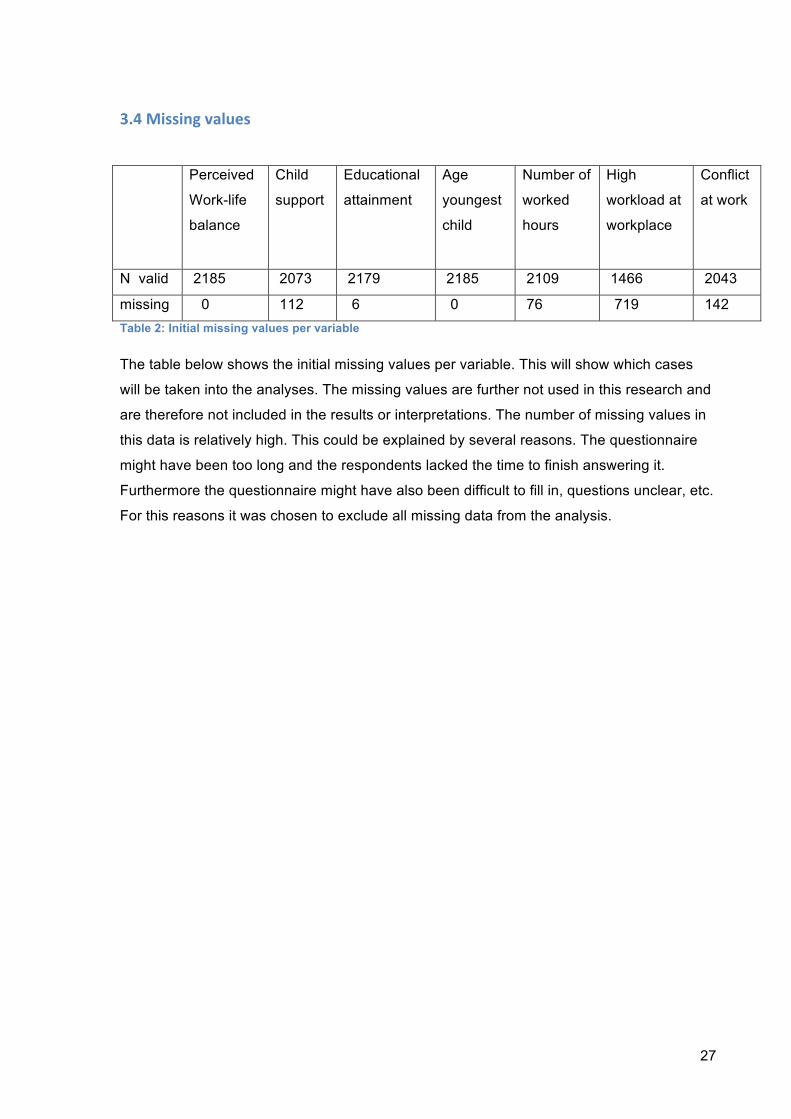
3.4 Missing values
Perceived
Work-life
balance
Child
support
Educational
attainment
Age
youngest
child
Number of
worked
hours
High
workload at
workplace
Conflict
at work
N valid 2185 2073 2179 2185 2109 1466 2043
missing 0 112 6 0 76 719 142 Table 2: Initial missing values per variable
The table below shows the initial missing values per variable. This will show which cases
will be taken into the analyses. The missing values are further not used in this research and
are therefore not included in the results or interpretations. The number of missing values in
this data is relatively high. This could be explained by several reasons. The questionnaire
might have been too long and the respondents lacked the time to finish answering it.
Furthermore the questionnaire might have also been difficult to fill in, questions unclear, etc.
For this reasons it was chosen to exclude all missing data from the analysis.
28
4) Data Analysis and Empirical Results
The empirical results are central in this chapter. It first begins with a review of the descriptive
statistics for both the life and work domains. The chapter then continues with a close view of the
means scores of the dependent variable on some of the variables used in the selection criteria. The
hypotheses will then be tested using SPSS secondary data from the WageIndicator 2004.
Consequently the hypotheses will be tested with ANOVA and regression analyses.
4.1 Descriptive Statistics: Independent and Dependent Variables
Before introducing the variables that will be tested it is important to look at the descriptive of
the different means of the age groups of the sample. The table below shows the means and
standard deviations on the three different age groups in this sample.
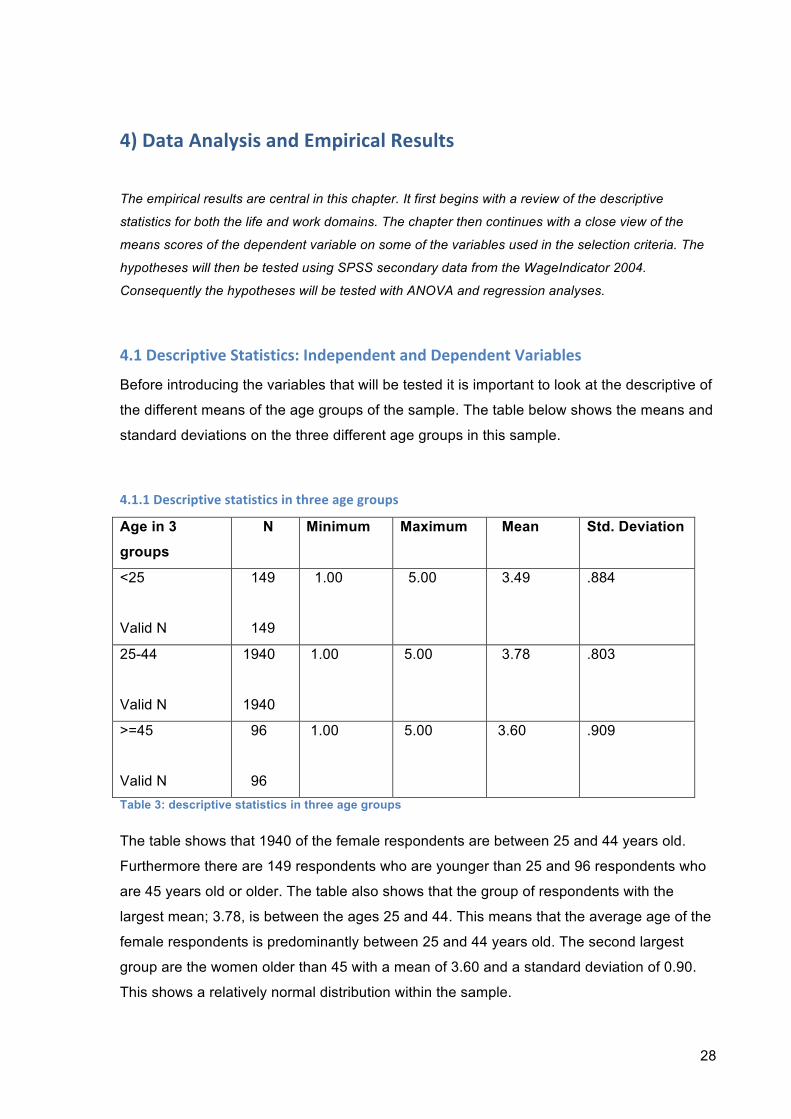
4.1.1 Descriptive statistics in three age groups
Age in 3
groups
N Minimum Maximum Mean Std. Deviation
<25
Valid N
149
149
1.00 5.00 3.49 .884
25-44
Valid N
1940
1940
1.00 5.00 3.78 .803
>=45
Valid N
96
96
1.00 5.00 3.60 .909
Table 3: descriptive statistics in three age groups
The table shows that 1940 of the female respondents are between 25 and 44 years old.
Furthermore there are 149 respondents who are younger than 25 and 96 respondents who
are 45 years old or older. The table also shows that the group of respondents with the
largest mean; 3.78, is between the ages 25 and 44. This means that the average age of the
female respondents is predominantly between 25 and 44 years old. The second largest
group are the women older than 45 with a mean of 3.60 and a standard deviation of 0.90.
This shows a relatively normal distribution within the sample.
29
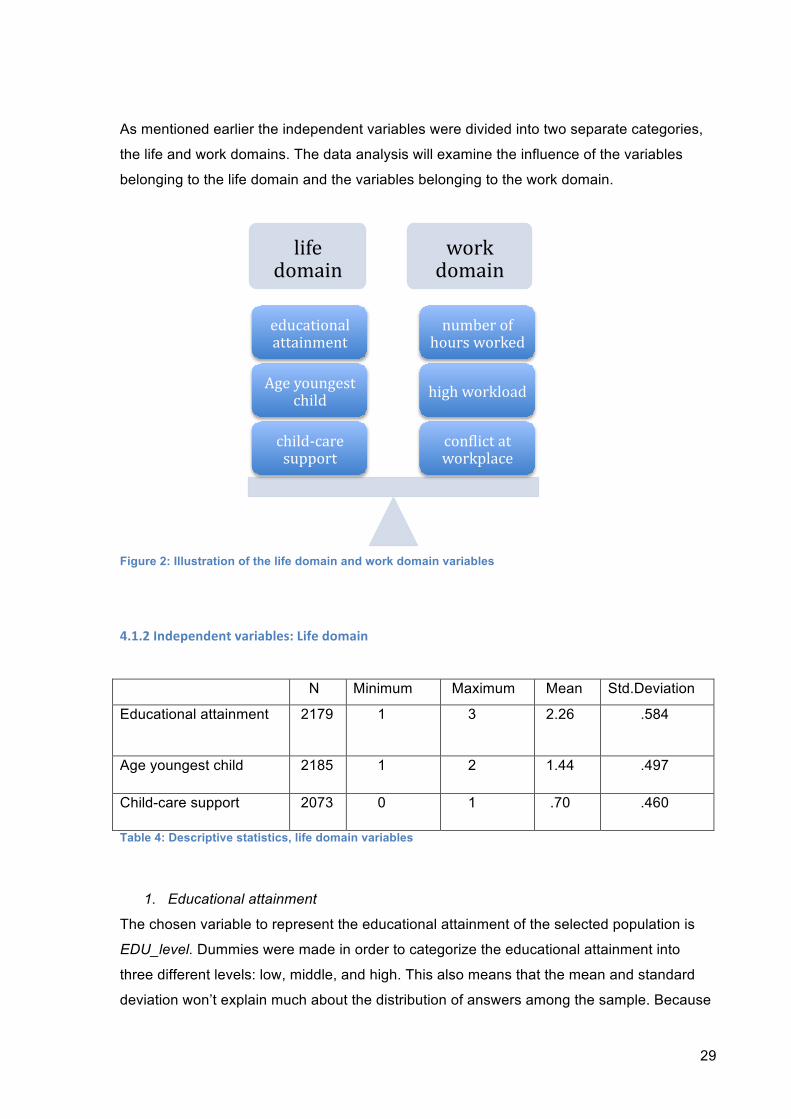
As mentioned earlier the independent variables were divided into two separate categories,
the life and work domains. The data analysis will examine the influence of the variables
belonging to the life domain and the variables belonging to the work domain.
Figure 2: Illustration of the life domain and work domain variables
4.1.2 Independent variables: Life domain
N Minimum Maximum Mean Std.Deviation
Educational attainment
2179 1 3 2.26 .584
Age youngest child 2185 1 2 1.44 .497
Child-care support 2073 0 1 .70 .460
Table 4: Descriptive statistics, life domain variables
1. Educational attainment
The chosen variable to represent the educational attainment of the selected population is
EDU_level. Dummies were made in order to categorize the educational attainment into
three different levels: low, middle, and high. This also means that the mean and standard
deviation won’t explain much about the distribution of answers among the sample. Because
life domain
work domain
conWlict at workplace
high workload
number of hours worked
child-‐care support
Age youngest child
educational attainment
30
this variable is separate into groups a frequency analysis was chosen in order to examine
the educational attainment of the respondents. The respondents where asked the following
question:
“What is the highest level of education you have attained (with diploma)?
The three dummies represent the following diplomas:
• Low: Basisschool/ VBO/ VMBO/ MAVO/ ULO
• Middle: HAVO/ MMS/ VWO/ HBS/ MBO
• High: HBO/ WO
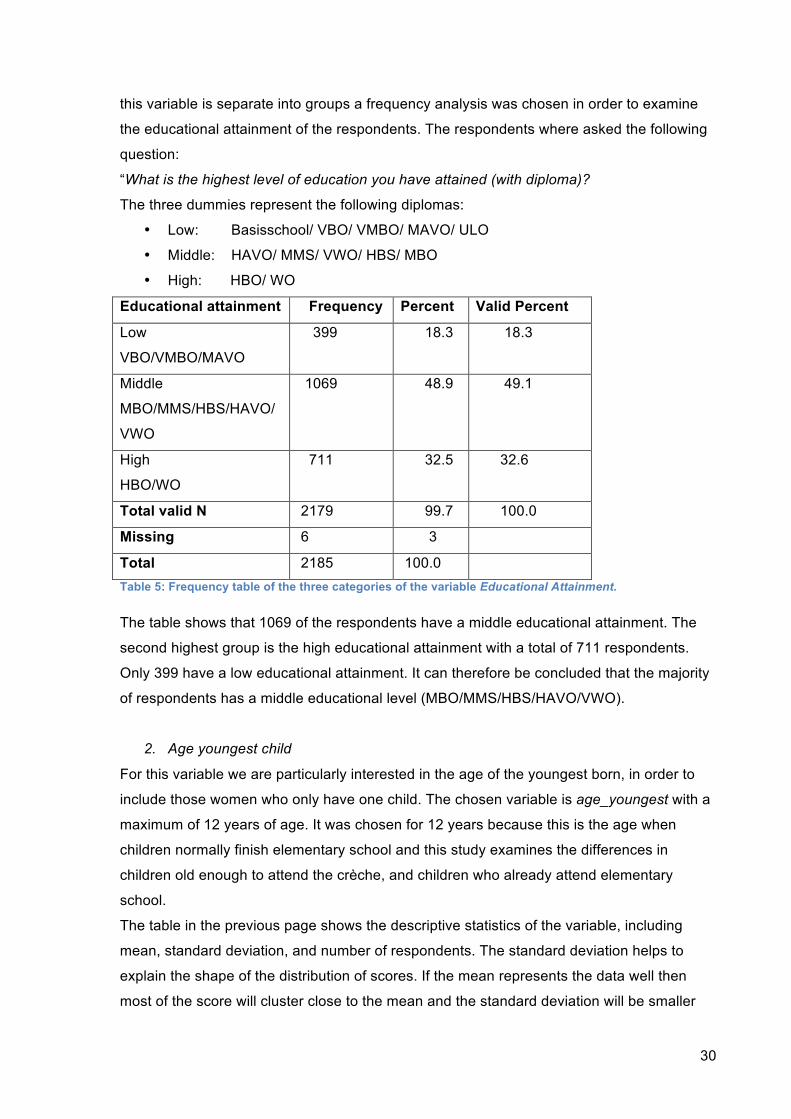
Educational attainment Frequency Percent Valid Percent
Low
VBO/VMBO/MAVO
399 18.3 18.3
Middle
MBO/MMS/HBS/HAVO/
VWO
1069 48.9 49.1
High
HBO/WO
711 32.5 32.6
Total valid N 2179 99.7 100.0
Missing 6 3
Total 2185 100.0 Table 5: Frequency table of the three categories of the variable Educational Attainment.
The table shows that 1069 of the respondents have a middle educational attainment. The
second highest group is the high educational attainment with a total of 711 respondents.
Only 399 have a low educational attainment. It can therefore be concluded that the majority
of respondents has a middle educational level (MBO/MMS/HBS/HAVO/VWO).
2. Age youngest child
For this variable we are particularly interested in the age of the youngest born, in order to
include those women who only have one child. The chosen variable is age_youngest with a
maximum of 12 years of age. It was chosen for 12 years because this is the age when
children normally finish elementary school and this study examines the differences in
children old enough to attend the crèche, and children who already attend elementary
school.
The table in the previous page shows the descriptive statistics of the variable, including
mean, standard deviation, and number of respondents. The standard deviation helps to
explain the shape of the distribution of scores. If the mean represents the data well then
most of the score will cluster close to the mean and the standard deviation will be smaller
31
than the mean. In this case the mean age of the youngest child, is 7,4 years old and the
standard deviation is 3,6. The population is normally distributed.
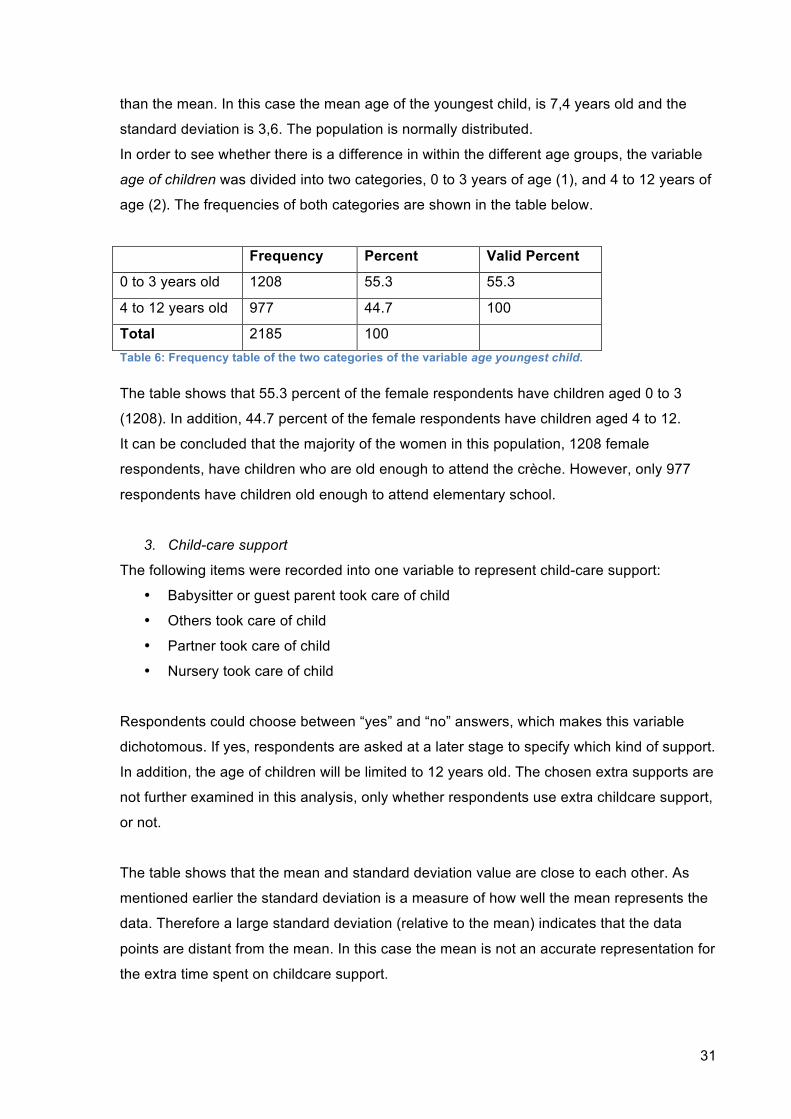
In order to see whether there is a difference in within the different age groups, the variable
age of children was divided into two categories, 0 to 3 years of age (1), and 4 to 12 years of
age (2). The frequencies of both categories are shown in the table below.
Frequency Percent Valid Percent
0 to 3 years old 1208 55.3 55.3
4 to 12 years old 977 44.7 100
Total 2185 100 Table 6: Frequency table of the two categories of the variable age youngest child.
The table shows that 55.3 percent of the female respondents have children aged 0 to 3
(1208). In addition, 44.7 percent of the female respondents have children aged 4 to 12.
It can be concluded that the majority of the women in this population, 1208 female
respondents, have children who are old enough to attend the crèche. However, only 977
respondents have children old enough to attend elementary school.
3. Child-care support
The following items were recorded into one variable to represent child-care support:
• Babysitter or guest parent took care of child
• Others took care of child
• Partner took care of child
• Nursery took care of child
Respondents could choose between “yes” and “no” answers, which makes this variable
dichotomous. If yes, respondents are asked at a later stage to specify which kind of support.
In addition, the age of children will be limited to 12 years old. The chosen extra supports are
not further examined in this analysis, only whether respondents use extra childcare support,
or not.
The table shows that the mean and standard deviation value are close to each other. As
mentioned earlier the standard deviation is a measure of how well the mean represents the
data. Therefore a large standard deviation (relative to the mean) indicates that the data
points are distant from the mean. In this case the mean is not an accurate representation for
the extra time spent on childcare support.
32
4.2.2 Independent variables: Work domain
N Minimum Maximum Mean Std.
Deviation
Number of
hours worked
2109 0 80.00 33.5 8.5
High workload 1466 1 5 3.54 1.11
Conflict at
work
2043 0 1 0.31 0.46
Table 5: Descriptive Statistics independent variables work domain
The table shows that the average (mean) hours worked is approximately 30.6. The
population is evenly distributed with a standard deviation of approximately 15. The standard
deviation is also used as a measure of how representative the mean was of the observed
data. Therefore a small standard deviation represents a scenario in which most data points
are close to the mean, while a large standard represented a situation in which data points
are widely spread from the mean. In this case the standard deviation is relatively close to
the mean so the distribution is normal. This is not the case, however, for the variable
number of hours worked. The mean is 33,5, which means the average is 33,5 hours per
week. The standard deviation is 8,5; this indicates that there isn’t a normal distribution of the
responses for this particular variable among this sample.
1. Number of hours worked
The chosen variable was working hours according to contract= HRSCON.
There were three dummies made for this group in order to divide between small part-timers
(1-20 hours per week), medium part-timers (21-36 hours per week), and small part-timers
(37 or more hours per week). A frequency table was chosen to illustrate the respondents’
frequencies of the three different dummy groups.
Frequency Percent Valid Percent
Small part-timers 509 23.3 24.1
Medium part-timers 1268 58.0 60.1
Full-timers 332 15.2 15.7
Total Valid N 2109 96.5 100.00
Missing 76 3.5
Total 2185 100.00
33
Table 6: Frequencies of the three categories of the variable number of hours worked: small part-timers,
medium part-timers, and full-timers.
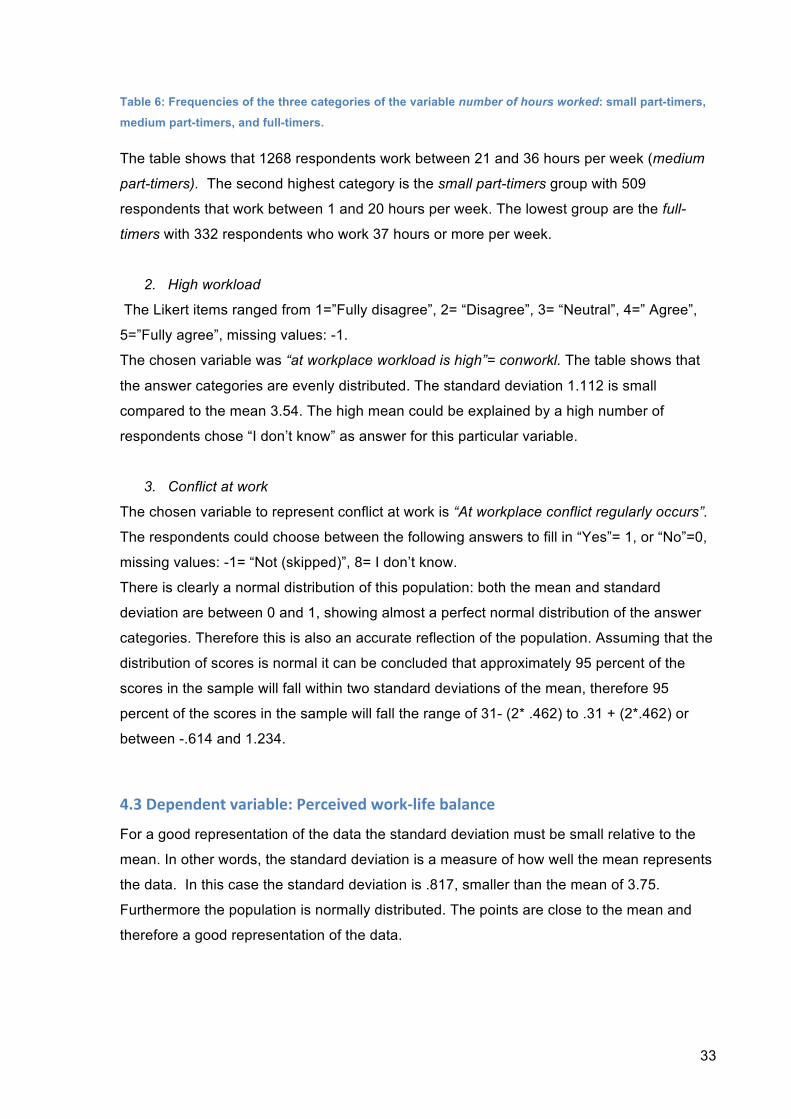
The table shows that 1268 respondents work between 21 and 36 hours per week (medium
part-timers). The second highest category is the small part-timers group with 509
respondents that work between 1 and 20 hours per week. The lowest group are the full-
timers with 332 respondents who work 37 hours or more per week.
2. High workload
The Likert items ranged from 1=”Fully disagree”, 2= “Disagree”, 3= “Neutral”, 4=” Agree”,
5=”Fully agree”, missing values: -1.
The chosen variable was “at workplace workload is high”= conworkl. The table shows that
the answer categories are evenly distributed. The standard deviation 1.112 is small
compared to the mean 3.54. The high mean could be explained by a high number of
respondents chose “I don’t know” as answer for this particular variable.
3. Conflict at work
The chosen variable to represent conflict at work is “At workplace conflict regularly occurs”.
The respondents could choose between the following answers to fill in “Yes”= 1, or “No”=0,
missing values: -1= “Not (skipped)”, 8= I don’t know.
There is clearly a normal distribution of this population: both the mean and standard
deviation are between 0 and 1, showing almost a perfect normal distribution of the answer
categories. Therefore this is also an accurate reflection of the population. Assuming that the
distribution of scores is normal it can be concluded that approximately 95 percent of the
scores in the sample will fall within two standard deviations of the mean, therefore 95
percent of the scores in the sample will fall the range of 31- (2* .462) to .31 + (2*.462) or
between -.614 and 1.234.
4.3 Dependent variable: Perceived work-‐life balance
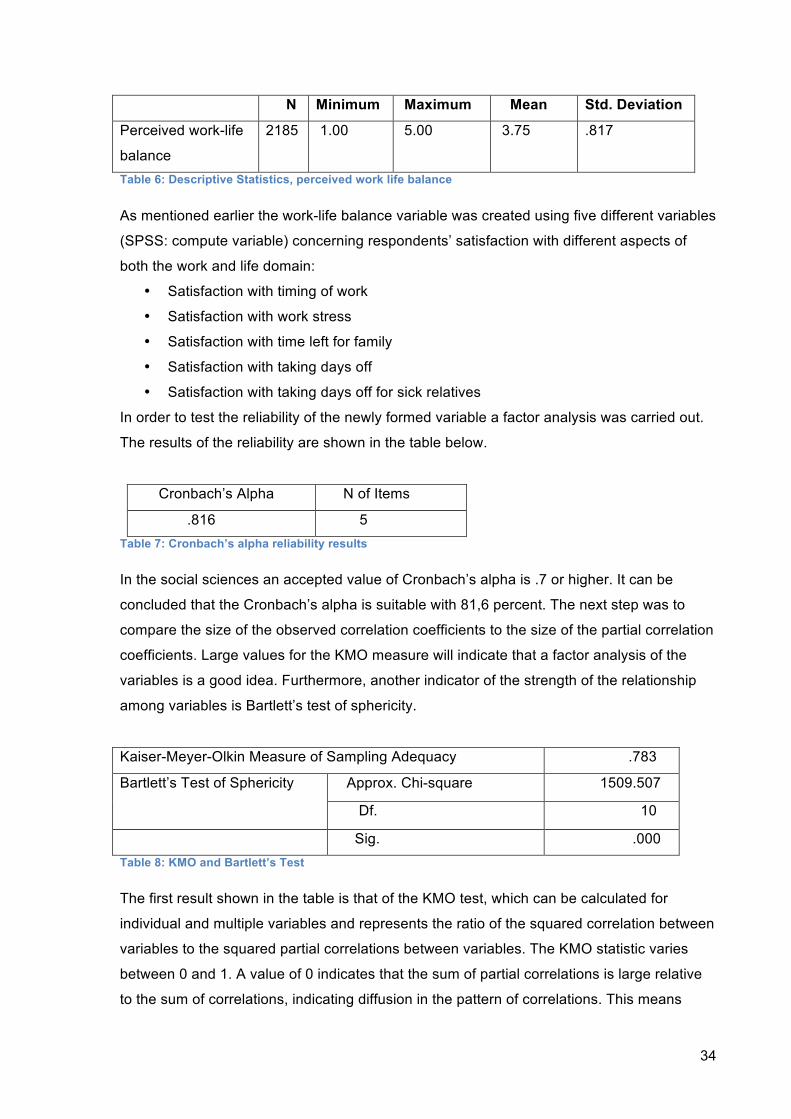
For a good representation of the data the standard deviation must be small relative to the
mean. In other words, the standard deviation is a measure of how well the mean represents
the data. In this case the standard deviation is .817, smaller than the mean of 3.75.
Furthermore the population is normally distributed. The points are close to the mean and
therefore a good representation of the data.
34
N Minimum Maximum Mean Std. Deviation
Perceived work-life
balance
2185 1.00 5.00 3.75 .817
Table 6: Descriptive Statistics, perceived work life balance
As mentioned earlier the work-life balance variable was created using five different variables
(SPSS: compute variable) concerning respondents’ satisfaction with different aspects of
both the work and life domain:
• Satisfaction with timing of work
• Satisfaction with work stress
• Satisfaction with time left for family
• Satisfaction with taking days off
• Satisfaction with taking days off for sick relatives
In order to test the reliability of the newly formed variable a factor analysis was carried out.
The results of the reliability are shown in the table below.
Cronbach’s Alpha N of Items
.816 5 Table 7: Cronbach’s alpha reliability results
In the social sciences an accepted value of Cronbach’s alpha is .7 or higher. It can be
concluded that the Cronbach’s alpha is suitable with 81,6 percent. The next step was to
compare the size of the observed correlation coefficients to the size of the partial correlation
coefficients. Large values for the KMO measure will indicate that a factor analysis of the
variables is a good idea. Furthermore, another indicator of the strength of the relationship
among variables is Bartlett’s test of sphericity.
Kaiser-Meyer-Olkin Measure of Sampling Adequacy .783
Approx. Chi-square 1509.507 Bartlett’s Test of Sphericity
Df. 10
Sig. .000 Table 8: KMO and Bartlett’s Test
The first result shown in the table is that of the KMO test, which can be calculated for
individual and multiple variables and represents the ratio of the squared correlation between
variables to the squared partial correlations between variables. The KMO statistic varies
between 0 and 1. A value of 0 indicates that the sum of partial correlations is large relative
to the sum of correlations, indicating diffusion in the pattern of correlations. This means
35
factor analysis is likely to be inappropriate. On the other hand, a value close to 1 indicates
that patterns of correlations are relatively compact and so factor analysis should yield
distinct and reliable factors. In this case 0.783 is close to 1 and is considered good, which
makes the factor analysis possible. In order to carry out a Factor Analysis the Bartlett’s test
of sphericity must be significant i.e. the value of Sig. should be less than .05. In this case
the test is significant p<.00, which shows that the correlation between all five items is
sufficient to carry out a Principal Component Analysis. It should be pointed out that a
principal factor analysis is not quite the same as a factor analysis. It is true that the steps
followed when conducting a PCA are virtually identical to the steps in an exploratory factor
analysis.
In a PCA it is possible to calculate a score for each respondent on a given principal
component. It was chosen because it is only concerned with establishing which linear
components exist within the data and how a particular variable might contribute to that
component. The factor extraction showed that only one item had a value higher than 1 (by
default SPSS uses Kaiser’scriterion of retaining factors with eigenvalues greater than 1).
The eigenvalues associated with each factor represent the variance explained by that
particular linear component and SPSS also displays the eigenvalue in terms of the
percentage of variance explained. In this case factor 1 explains 50.25 percent of the total
variance. This was the only identified factor with a value greater than 1 therefore rotation is
not possible in this case. The analysis found 1 common factor. This is because by default
SPSS uses Kaiser’s criterion of retaining factors with eigenvalues greater than 1. The
eigenvalues associated with each factor represent the variance explained by that particular
linear component and SPSS also displays the eigenvalue in terms of percentage of variance
explained.
Factor Loadings
Satisfaction with timing of work .605
Satisfaction with work stress .686
Satisfaction with time left for family .657
Satisfaction with taking days off .777
Satisfaction with taking days off for sick relatives .773
Eigenvalue 2.75
Variance 50.25
N 2185 Table 9: Principal Component Analysis: Component Matrix
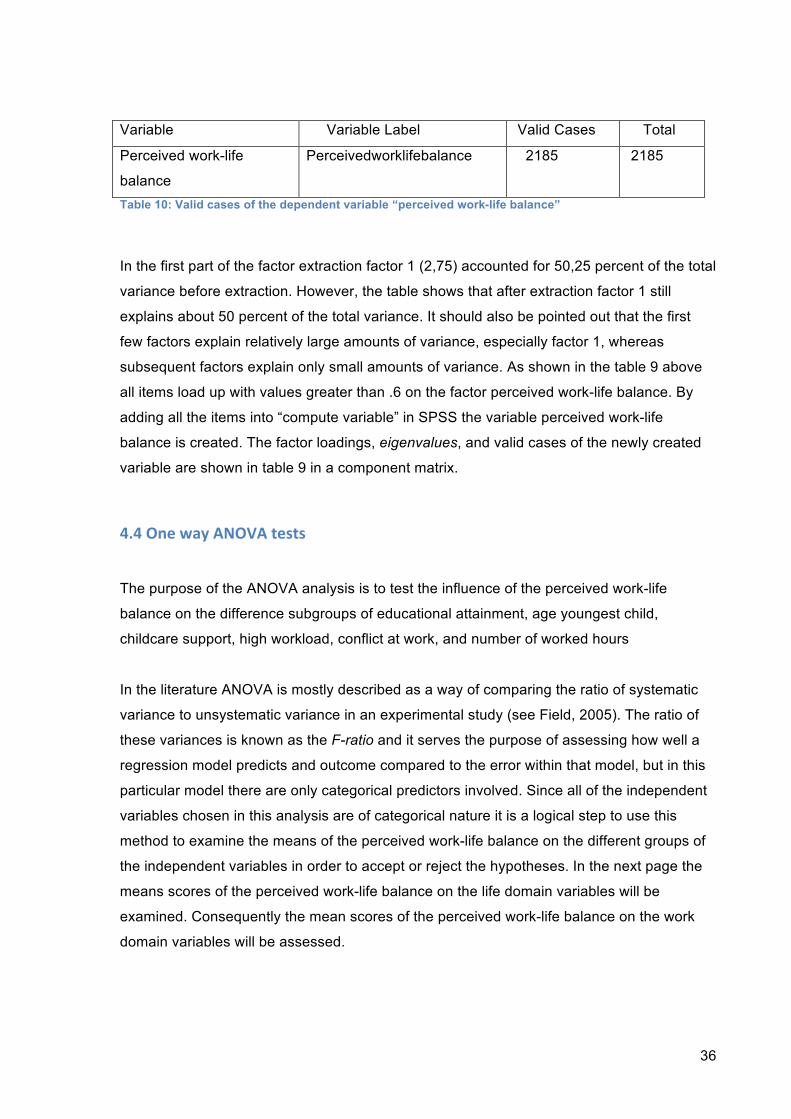
36
Variable Variable Label Valid Cases Total
Perceived work-life
balance
Perceivedworklifebalance 2185 2185
Table 10: Valid cases of the dependent variable “perceived work-life balance”
In the first part of the factor extraction factor 1 (2,75) accounted for 50,25 percent of the total
variance before extraction. However, the table shows that after extraction factor 1 still
explains about 50 percent of the total variance. It should also be pointed out that the first
few factors explain relatively large amounts of variance, especially factor 1, whereas
subsequent factors explain only small amounts of variance. As shown in the table 9 above
all items load up with values greater than .6 on the factor perceived work-life balance. By
adding all the items into “compute variable” in SPSS the variable perceived work-life
balance is created. The factor loadings, eigenvalues, and valid cases of the newly created
variable are shown in table 9 in a component matrix.
4.4 One way ANOVA tests
The purpose of the ANOVA analysis is to test the influence of the perceived work-life
balance on the difference subgroups of educational attainment, age youngest child,
childcare support, high workload, conflict at work, and number of worked hours
In the literature ANOVA is mostly described as a way of comparing the ratio of systematic
variance to unsystematic variance in an experimental study (see Field, 2005). The ratio of
these variances is known as the F-ratio and it serves the purpose of assessing how well a
regression model predicts and outcome compared to the error within that model, but in this
particular model there are only categorical predictors involved. Since all of the independent
variables chosen in this analysis are of categorical nature it is a logical step to use this
method to examine the means of the perceived work-life balance on the different groups of
the independent variables in order to accept or reject the hypotheses. In the next page the
means scores of the perceived work-life balance on the life domain variables will be
examined. Consequently the mean scores of the perceived work-life balance on the work
domain variables will be assessed.
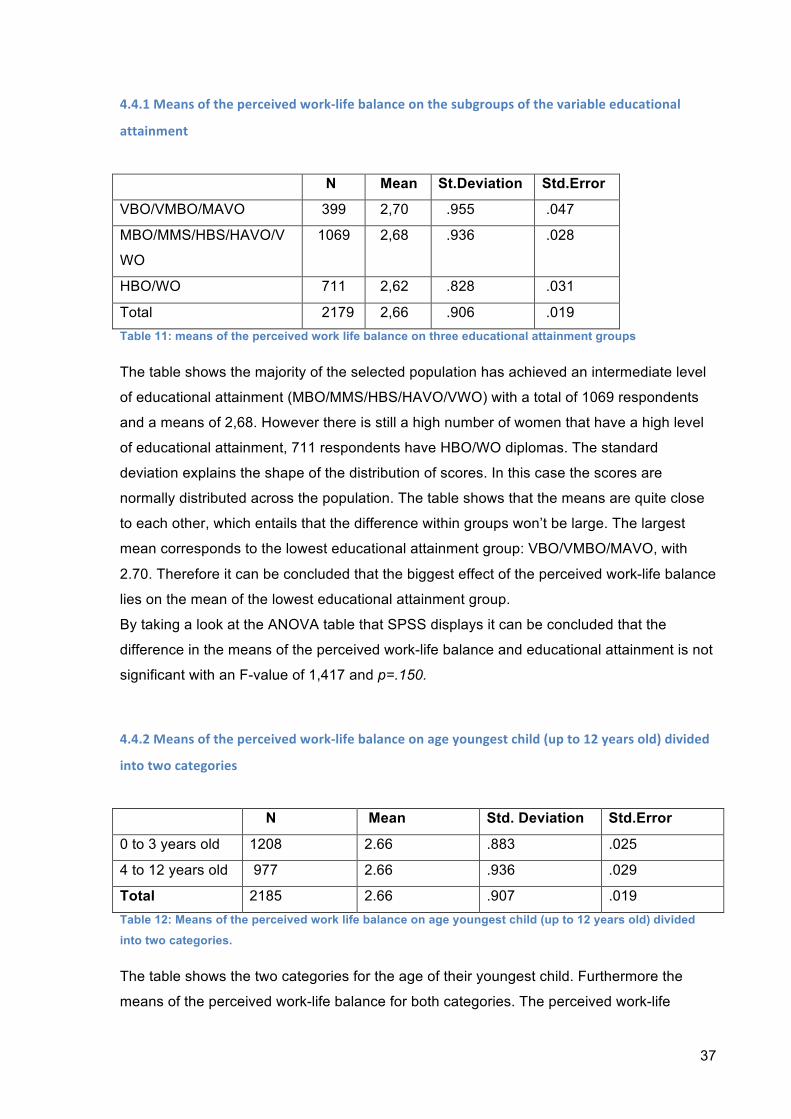
37
4.4.1 Means of the perceived work-‐life balance on the subgroups of the variable educational
attainment
N Mean St.Deviation Std.Error
VBO/VMBO/MAVO 399 2,70 .955 .047
MBO/MMS/HBS/HAVO/V
WO
1069 2,68 .936 .028
HBO/WO 711 2,62 .828 .031
Total 2179 2,66 .906 .019 Table 11: means of the perceived work life balance on three educational attainment groups
The table shows the majority of the selected population has achieved an intermediate level
of educational attainment (MBO/MMS/HBS/HAVO/VWO) with a total of 1069 respondents
and a means of 2,68. However there is still a high number of women that have a high level
of educational attainment, 711 respondents have HBO/WO diplomas. The standard
deviation explains the shape of the distribution of scores. In this case the scores are
normally distributed across the population. The table shows that the means are quite close
to each other, which entails that the difference within groups won’t be large. The largest
mean corresponds to the lowest educational attainment group: VBO/VMBO/MAVO, with
2.70. Therefore it can be concluded that the biggest effect of the perceived work-life balance
lies on the mean of the lowest educational attainment group.
By taking a look at the ANOVA table that SPSS displays it can be concluded that the
difference in the means of the perceived work-life balance and educational attainment is not
significant with an F-value of 1,417 and p=.150.
4.4.2 Means of the perceived work-‐life balance on age youngest child (up to 12 years old) divided
into two categories
N Mean Std. Deviation Std.Error
0 to 3 years old 1208 2.66 .883 .025
4 to 12 years old 977 2.66 .936 .029
Total 2185 2.66 .907 .019 Table 12: Means of the perceived work life balance on age youngest child (up to 12 years old) divided
into two categories.
The table shows the two categories for the age of their youngest child. Furthermore the
means of the perceived work-life balance for both categories. The perceived work-life
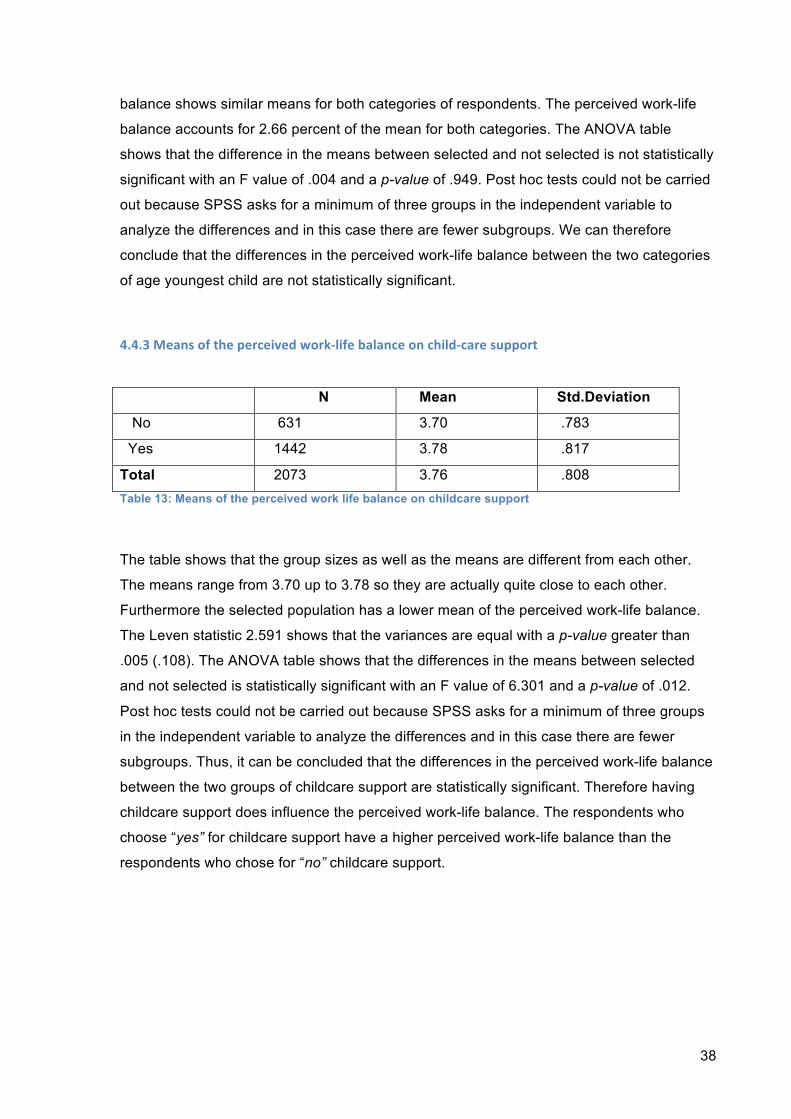
38
balance shows similar means for both categories of respondents. The perceived work-life
balance accounts for 2.66 percent of the mean for both categories. The ANOVA table
shows that the difference in the means between selected and not selected is not statistically
significant with an F value of .004 and a p-value of .949. Post hoc tests could not be carried
out because SPSS asks for a minimum of three groups in the independent variable to
analyze the differences and in this case there are fewer subgroups. We can therefore
conclude that the differences in the perceived work-life balance between the two categories
of age youngest child are not statistically significant.
4.4.3 Means of the perceived work-‐life balance on child-‐care support
N Mean Std.Deviation
No 631 3.70 .783
Yes 1442 3.78 .817
Total 2073 3.76 .808 Table 13: Means of the perceived work life balance on childcare support
The table shows that the group sizes as well as the means are different from each other.
The means range from 3.70 up to 3.78 so they are actually quite close to each other.
Furthermore the selected population has a lower mean of the perceived work-life balance.
The Leven statistic 2.591 shows that the variances are equal with a p-value greater than
.005 (.108). The ANOVA table shows that the differences in the means between selected
and not selected is statistically significant with an F value of 6.301 and a p-value of .012.
Post hoc tests could not be carried out because SPSS asks for a minimum of three groups
in the independent variable to analyze the differences and in this case there are fewer
subgroups. Thus, it can be concluded that the differences in the perceived work-life balance
between the two groups of childcare support are statistically significant. Therefore having
childcare support does influence the perceived work-life balance. The respondents who
choose “yes” for childcare support have a higher perceived work-life balance than the
respondents who chose for “no” childcare support.
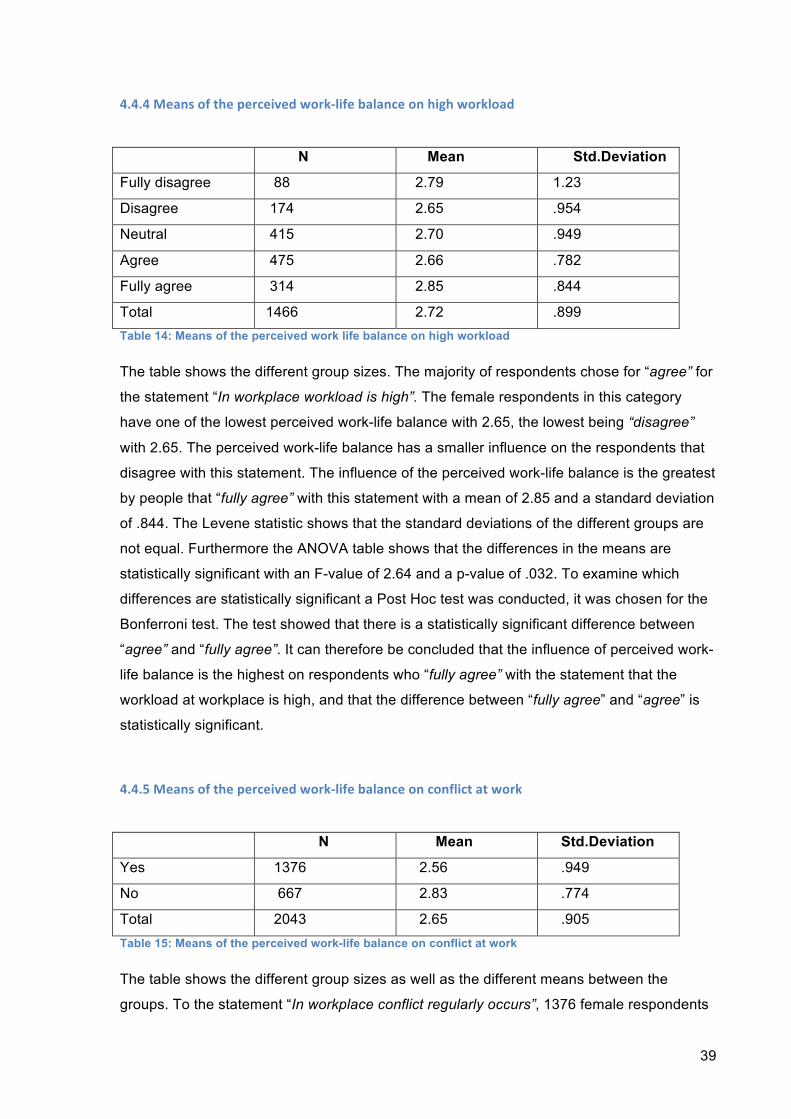
39
4.4.4 Means of the perceived work-‐life balance on high workload
N Mean Std.Deviation
Fully disagree 88 2.79 1.23
Disagree 174 2.65 .954
Neutral 415 2.70 .949
Agree 475 2.66 .782
Fully agree 314 2.85 .844
Total 1466 2.72 .899 Table 14: Means of the perceived work life balance on high workload
The table shows the different group sizes. The majority of respondents chose for “agree” for
the statement “In workplace workload is high”. The female respondents in this category
have one of the lowest perceived work-life balance with 2.65, the lowest being “disagree”
with 2.65. The perceived work-life balance has a smaller influence on the respondents that
disagree with this statement. The influence of the perceived work-life balance is the greatest
by people that “fully agree” with this statement with a mean of 2.85 and a standard deviation
of .844. The Levene statistic shows that the standard deviations of the different groups are
not equal. Furthermore the ANOVA table shows that the differences in the means are
statistically significant with an F-value of 2.64 and a p-value of .032. To examine which
differences are statistically significant a Post Hoc test was conducted, it was chosen for the
Bonferroni test. The test showed that there is a statistically significant difference between
“agree” and “fully agree”. It can therefore be concluded that the influence of perceived work-
life balance is the highest on respondents who “fully agree” with the statement that the
workload at workplace is high, and that the difference between “fully agree” and “agree” is
statistically significant.
4.4.5 Means of the perceived work-‐life balance on conflict at work
N Mean Std.Deviation
Yes 1376 2.56 .949
No 667 2.83 .774
Total 2043 2.65 .905 Table 15: Means of the perceived work-life balance on conflict at work
The table shows the different group sizes as well as the different means between the
groups. To the statement “In workplace conflict regularly occurs”, 1376 female respondents
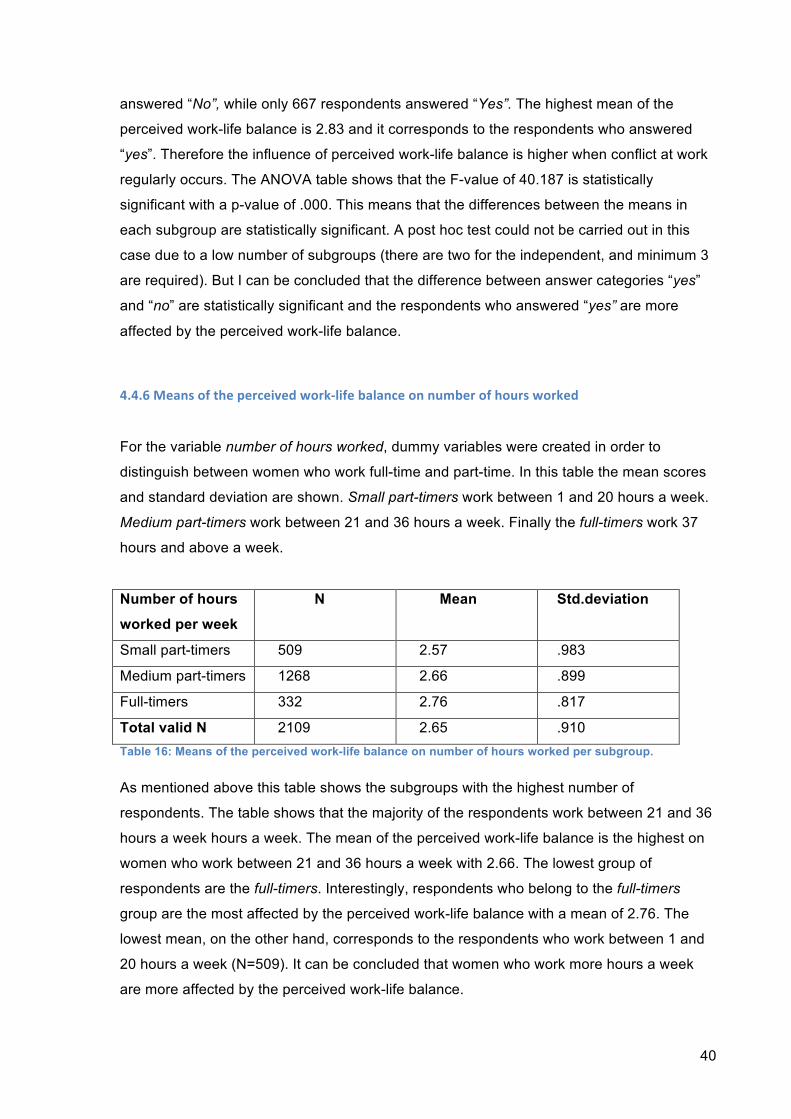
40
answered “No”, while only 667 respondents answered “Yes”. The highest mean of the
perceived work-life balance is 2.83 and it corresponds to the respondents who answered
“yes”. Therefore the influence of perceived work-life balance is higher when conflict at work
regularly occurs. The ANOVA table shows that the F-value of 40.187 is statistically
significant with a p-value of .000. This means that the differences between the means in
each subgroup are statistically significant. A post hoc test could not be carried out in this
case due to a low number of subgroups (there are two for the independent, and minimum 3
are required). But I can be concluded that the difference between answer categories “yes”
and “no” are statistically significant and the respondents who answered “yes” are more
affected by the perceived work-life balance.
4.4.6 Means of the perceived work-‐life balance on number of hours worked
For the variable number of hours worked, dummy variables were created in order to
distinguish between women who work full-time and part-time. In this table the mean scores
and standard deviation are shown. Small part-timers work between 1 and 20 hours a week.
Medium part-timers work between 21 and 36 hours a week. Finally the full-timers work 37
hours and above a week.
Number of hours
worked per week
N Mean Std.deviation
Small part-timers 509 2.57 .983
Medium part-timers 1268 2.66 .899
Full-timers 332 2.76 .817
Total valid N 2109 2.65 .910 Table 16: Means of the perceived work-life balance on number of hours worked per subgroup.
As mentioned above this table shows the subgroups with the highest number of
respondents. The table shows that the majority of the respondents work between 21 and 36
hours a week hours a week. The mean of the perceived work-life balance is the highest on
women who work between 21 and 36 hours a week with 2.66. The lowest group of
respondents are the full-timers. Interestingly, respondents who belong to the full-timers
group are the most affected by the perceived work-life balance with a mean of 2.76. The
lowest mean, on the other hand, corresponds to the respondents who work between 1 and
20 hours a week (N=509). It can be concluded that women who work more hours a week
are more affected by the perceived work-life balance.
41
The ANOVA table shows that the F-value 4.54 is statistically significant with a p-value of
.011. The following step was therefore to carry out Post-Hoc tests. The Tukey HSD Post-
Hoc tests showed that there is a statistically significant difference between women who
work between 1 and 20 hours per week (small part-timers), and women who work 37 hours
or more per week (full-timers) with a p value of .008.
4.5 Regression analyses
In a regression analysis the regression coefficients are defined by differences between
group means. The bigger the differences between the group means, the greater the
differences between the regression line and the grand mean. The regression coefficients
are only significant when p < .05. In the first part of the analysis, we tested the means of the
dependent variable perceived work-life balance on the different groups of each independent
variable (each with different sample sizes) with one-way ANOVA.
In the regression analysis three different models were examined. One model included only
the life domain variables: educational attainment, age youngest child, and childcare support.
The next model examined the life domain variables and the work domain variables; number
of hours worked, and conflict at work. However, this model excluded one variable of the
work domain: high workload. This variable was included in the third model, and this proved
to be highly significant for the overall influence of this model on the perceived work-life
balance. The third model therefore includes all variables from both domains. Using the
ENTER method the third model accounts for most of the influence of the perceived work-life
balance. The third model clearly shows that all the variables of the work domain are more
influential to the perceived work-life balance of the female respondents compared to the life
variables (child-care support and age youngest child tested significant). Furthermore, all of
the regression coefficients of the work domain variables in the third model test significant (p
> .05) on the influence of the independent variables on the perceived work-life balance. This
is why model 3 was chosen to explain the correlations between the life and work domain
variables on the perceived work-life balance. In the next section each hypothesis will be
examined independently beginning first with the life domain variables: educational
attainment (divided into low, middle, high), age youngest child, and child-care support.
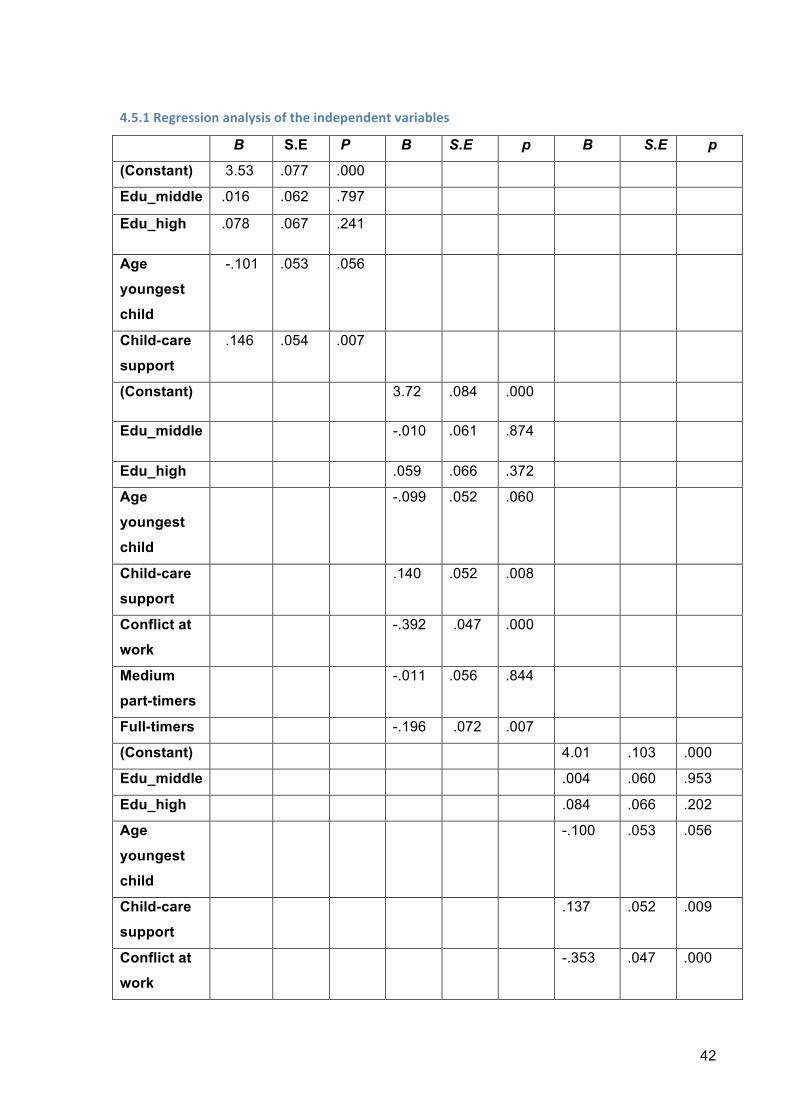
42
4.5.1 Regression analysis of the independent variables
B S.E P B S.E p B S.E p
(Constant) 3.53 .077 .000
Edu_middle .016 .062 .797
Edu_high .078 .067 .241
Age
youngest
child
-.101 .053 .056
Child-care
support
.146 .054 .007
(Constant) 3.72 .084 .000
Edu_middle -.010 .061 .874
Edu_high .059 .066 .372
Age
youngest
child
-.099 .052 .060
Child-care
support
.140 .052 .008
Conflict at
work
-.392 .047 .000
Medium
part-timers
-.011 .056 .844
Full-timers -.196 .072 .007
(Constant) 4.01 .103 .000
Edu_middle .004 .060 .953
Edu_high .084 .066 .202
Age
youngest
child
-.100 .053 .056
Child-care
support
.137 .052 .009
Conflict at
work
-.353 .047 .000
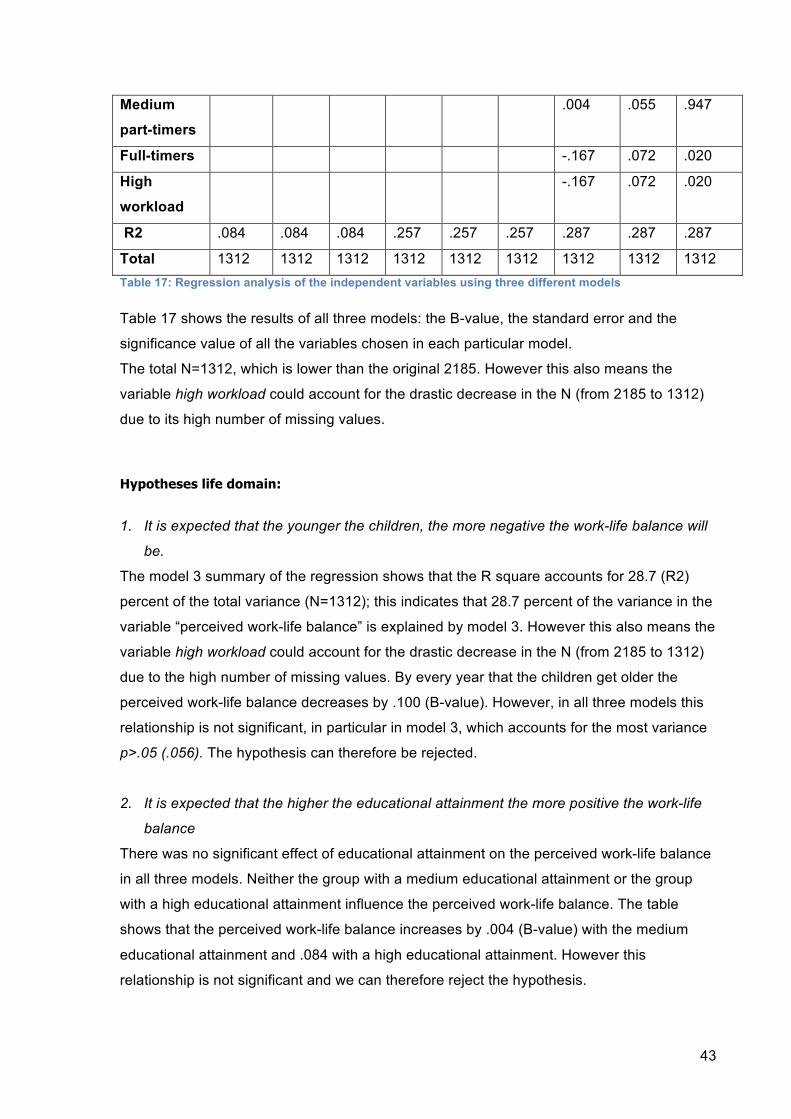
43
Medium
part-timers
.004 .055 .947
Full-timers -.167 .072 .020
High
workload
-.167 .072 .020
R2 .084 .084 .084 .257 .257 .257 .287 .287 .287
Total 1312 1312 1312 1312 1312 1312 1312 1312 1312 Table 17: Regression analysis of the independent variables using three different models
Table 17 shows the results of all three models: the B-value, the standard error and the
significance value of all the variables chosen in each particular model.
The total N=1312, which is lower than the original 2185. However this also means the
variable high workload could account for the drastic decrease in the N (from 2185 to 1312)
due to its high number of missing values.
Hypotheses life domain:
1. It is expected that the younger the children, the more negative the work-life balance will
be.
The model 3 summary of the regression shows that the R square accounts for 28.7 (R2)
percent of the total variance (N=1312); this indicates that 28.7 percent of the variance in the
variable “perceived work-life balance” is explained by model 3. However this also means the
variable high workload could account for the drastic decrease in the N (from 2185 to 1312)
due to the high number of missing values. By every year that the children get older the
perceived work-life balance decreases by .100 (B-value). However, in all three models this
relationship is not significant, in particular in model 3, which accounts for the most variance
p>.05 (.056). The hypothesis can therefore be rejected.
2. It is expected that the higher the educational attainment the more positive the work-life
balance
There was no significant effect of educational attainment on the perceived work-life balance
in all three models. Neither the group with a medium educational attainment or the group
with a high educational attainment influence the perceived work-life balance. The table
shows that the perceived work-life balance increases by .004 (B-value) with the medium
educational attainment and .084 with a high educational attainment. However this
relationship is not significant and we can therefore reject the hypothesis.
44
3. It is expected that more childcare support will lead to a positive work-life balance.
There was a significant effect found between childcare support and the perceived work-life
balance. For the women who have childcare support the perceived work-life balance
increases by .137 (B-value). This value is significant with a p<.05 (.009). The hypothesis
can therefore be confirmed.
Hypothesis work domain
4. It is expected that a higher number of worked hours will lead to a negative perceived
work-life balance.
The last two models show a significant effect between the number of worked hours and the
perceived work-life balance. However when high workload is excluded on model two,
medium part-timers (B= -.011) and full-timers (B= -.196) both have a negative effect on the
perceived work-life balance. Nonetheless, model three includes the variable high workload
and this changes the effect for medium part-timers, becoming a positive B value (B= .004),
however this effect is not significant. The negative correlation between full-timers and the
perceived work-life balance is significant both model 2 and 3.
Model 3 accounts for a bigger percentage of the variance of the perceived work-life
balance. The model shows that a higher number of hours will lead to a negative work-life
balance. The B-value shows a negative relationship between both variables. Moreover, with
every extra hour worked the perceived work-life balance decreases by -.167 and this effect
is significant with a p<. 05 (.020). The hypothesis can therefore be confirmed.
5. It is expected that more conflict at work will lead to a more negative perceived work-life
balance
Both model 2 and 3 show a significant effect between conflict at work and the perceived
work-life balance. Model 2 shows that more conflict at work will decrease the perceived
work-life balance by -.392. The B-value shows a negative relationship between both
variables. In addition, in model three once the variable high workload is included the B value
slightly decreases to -.353, but in both models the correlation is significant with a p< .05
(.000). The B value used to confirm this hypothesis is that of model 3 because it accounts
for the most variance (R2= 28.7 percent) in the dependent variable perceived work-life
balance. This means that more conflict at work decreases the perceived work-life balance
by -.353. The hypothesis can therefore be confirmed.
45
6. It is expected that a higher workload will lead to a negative perceived work-life balance
The last model shows a significant relationship between a high workload and the perceived
work-life balance. The higher the workload is the more negative the perceived work-life
balance will be. The B-value shows this negative relationship. It shows that with more
workload the perceived work-life balance will decrease by -.095. The model is significant
with p<.05 (.020). The negative relationship and its significance confirm the hypothesis.
4.6 Conclusion data analysis
In the conclusion the results from the data analysis will be discussed. The results will then
be compared to studies that were examined previously in the literature research. The
variables will be examined in their respective domains: life and work.
4.6.1 Childcare support and the perceived work-‐life balance
The influence of childcare support on the perceived work-life balance was not significant
and the hypothesis was rejected. The more childcare support a working woman has, the
more positive her perceived work-life balance will be.
The literature research also showed that childcare responsibilities have a negative
relationship with the perceived work-life balance of women in particular. Crompton and
Lyonette (2006) argued that because of a “traditional” division of labour in many European
countries, women end up carrying the burden of domestic tasks including childcare
responsibilities. After many years this arrangement has not changed and women are still
seen as primarily responsible for the household, which inevitably affects their perceived
work-life balance in a negative way.
4.6.2 Age of youngest child and the perceived work-‐life balance
The literature showed that very small children do not make a difference everything else
being equal (see Pichler, 2008). Nonetheless, women with children aged three to five (0.10)
and children aged six to eleven (0.05) reported slightly lower levels of perceived work-life
balance. This study showed similar findings. There was no significant effect of age of
youngest child on the perceived work-life balance of working mothers. In model 3 the R
squared showed that 28.7 percent accounts for the variance in the perceived work-life
balance. Furthermore, by every year that the children get older the perceived work-life
balance decreases by .100 (B-value). However, in all three models this relationship is not
significant p>.05 (.056). The hypothesis was therefore rejected.
46
4.6.3 Educational attainment and the work-‐life balance
The literature showed that educational attainment has a minor effect on the work-life
balance. In the study of Pichler (2008), education accounted for 2 percent of the variance in
the variable work-life balance. In this study education accounted for only .004 (B-value
medium educational attainment), and .084 (B-value high educational attainment)
respectively, and the correlation was not significant. The hypothesis was therefore rejected.
The analyses showed that educational attainment does not have a significant influence of
the perceived work-life balance of working mothers.
4.6.4 Number of worked hours and the perceived work-‐life balance
The literature shows that the number of worked hours is one of the more significant
determinants of the perceived work-life balance. Pichler’s study (2008) showed that part-
time women report high levels of perceived work-life balance as indicated by a negative
interaction term of -0.06. Dex & Bond (2005) found that weekly hours clearly played a large
part in determining individuals’ perceived work-life balance. Compared with the excluded
reference category of 36-39 hours per week, the work life score of individuals who worked
less than this tended to be lower, especially those working under twenty hours per week.
The work-life scores of those who worked more than 40 hours per week were higher than
those who worked under 40 hours.
In this study, model 3 of the regression analysis accounts for a bigger percentage of the
variance of the perceived work-life balance. The model shows that a higher number of hours
will lead to a negative perceived work-life balance. The B-value shows a negative
relationship between both variables. Moreover, with every extra hour worked the perceived
work-life balance decreases by -.167 and this effect is significant with a p<. 05 (.020). The
hypothesis was confirmed and was concluded that women who work full time have a
negative perceived work-life balance.
4.6.5 Conflict at work, high workload, and the perceived work-‐life balance
From the literature research it was concluded that work-related subjective aspects also
contribute to the explanation of the perceived work-life balance, in particular fulltime hours,
conflict at work and high workload (job demands). The results of Hill et al. (2004) show that
within-domain and boundary-spanning demands such as long work hours, job demands,
conflict, elder-care responsibility, and job-related travel generally were negatively relate to
47
work-life balance. In addition, the results showed that within-domain and boundary-
spanning demands such as long work hours, job demands, conflict, elder-care
responsibility, and job-related travel were generally mainly related to work-life balance.
Similar results were found in this study for the variables conflict at work and high workload.
The B value used to confirm the hypothesis created for the variable conflict at work is that of
model 3 because it accounts for the most variance (R2= 28.7 percent) in the dependent
variable perceived work-life balance. This means that more conflict at work decreases the
perceived work-life balance by -.353. The hypothesis was confirmed.
Despite a somewhat different question wording the underlying ideas about the work-life
balance in large-scale surveys remains similar. Work-life balance is threatened if people are
too tired from work to do necessary things at home (Pichler, 2008), or if they cannot perform
according to their roles because of the time they spend on their job and if household or
family responsibilities impede concentration at work. These issues will be further examined
in the next chapter.
48
5. Conclusion and Discussion
The last chapter deals with the evaluation of the results that were gathered from the
literature research and the empirical analysis. This will help to reiterate the validity of the
analysis in this particular subject matter. The discussion puts the analysis in perspective
and includes restrictions as well as recommendations for further research.
5.1 Answer to the central question
The purpose of this analysis was to examine whether childcare support, age youngest child,
educational attainment, conflict at work, high workload, and number of hours worked
affected the perceived work-life balance. The chosen research population was working
women living with a partner and children up to 12 years old. The central question was
formulated as follows:
• How do child-care support, age youngest child, educational attainment, number of
hours worked, conflict at work, and high workload, influence the perceived work-life
balance of working mothers?
After the analysis it is possible to answer the central question of this dissertation. The rest of
this chapter will examine the dependent variable perceived work-life balance. The
operationalization of the dependent variable perceived work-life balance chosen for this
study will be compared to the operationalization discussed in the literature research.
5.2 The perceived work-‐life balance
The literature research showed that most of the work-life balance studies examine
negotiation processes that involve different interests and different areas of life, including the
possibilities to attain the individually desired conditions, such as working time, and thereby
maintain or improve the quality of life. The term work-life balance is based on the
assumption that these are two individual and clearly separated spheres, the interplay of
which significantly affects the quality of life. Some authors used a 22-item scale to
differentiate between various forms (time-based; strain based) of work-to-family and family-
to-work conflicts (see Kelloway et al. 1999; Noor, 2003). Although these measures deal with
49
the issues at hand from a slightly different perspective, they apply the same conceptual
ideas to the study of work-life balance. Qualitative research, such as the one by Hyman et
al. (2005) often investigates the nature of the boundaries between work and home (family).
This highlights a troublesome distinction between work and home, which cannot be
sustained in all situations (e.g. shift work, work on short notice, etc) and thus negatively
affects the subjective feelings of balance (Pichler, 2008).
In another study, Crooker et al., (2002) asserted that higher levels of life complexity and
dynamism experienced by individuals could result in lower levels of perceived work-life
balance. However, this relationship will vary with the munificence and accessibility of
resources in one’s environment as well as with individual differences of values and
personality traits. As a result, they incorporated the impact of four sets of moderating
variables, two macro-level variables and two micro-level variables, on the relationship
between life complexity/dynamism and work-life balance. At the micro-level, the relationship
is influenced by the personal value system (Rokeach, 1973) and individual applies and
holds dear (value intensity) as well as the values that are shared across domains of one’s
life (values pivotal space) (Chatman, 1989).
Crooker et al., (2002) focused particularly on those personality constructs that may explain
how individuals respond to complexity and dynamism in life.
In this study it was important to include satisfaction in terms of both domains. Thus the
operationalization of the perceived work-life balance was based on items that explained the
extent to which the respondents were satisfied with aspects of both the work and life
domain:
• Satisfaction with timing of work
• Satisfaction with work stress
• Satisfaction with time left for family
• Satisfaction with taking days off
• Satisfaction with taking days off for sick relatives
These five variables are interval and the Likert items ranged from 1= “Highly dissatisfied”,
2= “Dissatisfied”, 3= “Neutral”, 4= “Satisfied”, and 5= “Highly satisfied.
The PCA analysis showed a Cronbach’s alpha of 81,6 percent, which is highly reliable in the
social sciences. It was mentioned earlier that a common interpretation of Cronbach’s alpha
is that it measures “undimensionality”, i.e. the extent to which the scale measures one
underlying factor or construct. This means that when there is one factor underlying the data,
Cronbach’s alpha is a measure of the strength of that factor. As shown earlier in the table 9,
the PCA analysis showed that all items loaded up with values greater than .6 on the factor
perceived work-life balance.
50
5.3 Discussion: Limitations and ideas for further research
The analyses carried out in this study have shown that the chosen life domain aspects,
especially the presence of small children, barely contribute to the explanation of the
perceived work-life balance. One life domain that proved significant in most of the analyses
was childcare support. This is important to consider when thinking about women’s work-life
balance.
The literature research also showed that the importance of child-care couldn’t be
undermined. Dual-earner families in The Netherlands are increasingly dependent on
support from grandparents, babysitter, crèche, in order to leave their children to go to work.
It is important to do further research on whether having this support influences the
perceived work-life balance positively.
In addition, future studies and government policies should not encourage policies that treat
women primarily as mothers. More importantly, these policies should focus on how working
women with children can be supported by promoting job positions that suit their career
preferences rather than offering benefits that will continue to encourage gender inequalities
in the labour market.
As mentioned earlier the perceived work-life balance is constantly threatened if people are
too tired from work to do necessary chores at home (see Pichler, 2008; Hochschild, 1997), if
they cannot perform according to their roles because of the time they spend on their job and
if household or family responsibilities impede concentration at work. Women nowadays are
still consumed by unpaid work, particularly when there are children in the family. The results
showed that the age of the children is not significant but the childcare support remains an
important factor when determining the perceived work-life balance.
Kahn et al (1964) argued the nature of one’s relations with his/her role senders affects the
way working mothers experience and respond to imbalance, created mostly by role conflict.
A very prevalent form of conflict is role overload. Overload could be regarded as a kind of
inter-sender conflict in which various role senders may hold legitimate expectations that a
person perform a wide variety of tasks, all of which are often mutually incompatible (Kahn et
al., 1964). Individuals are likely to experience overload as a conflict of priorities. Therefore
role conflict and ambiguity tend to create special problems of adjustment for the individual
and this in turn affects the work-life balance. It is costly for the person and for the
organizational unit in which the individual works. The results of this study seem to confirm
role conflict. If these women work too long, have constant conflict at work, and a high
51
workload, then the perceived work-life balance will be influenced in a negative way, and this
in turn will affect the role overload of this women.
Similarly, Hochschild (1997) coined the term “time bind” to imply a situation in which both
men and women have limited amounts of time available to allocate to the home and the
work domain. Thus, time becomes a valuable resource to families. As the first shift (at the
workplace) takes more time, the second shift (at home) becomes more hurried and
rationalized. The longer the workday at the office, the more pressure to hurry home and to
segment the remains of family time. This is similar to the results found on this study. The
work variables seem to be more influential in the perceived work-life balance of working
women, therefore these variables affect their lives the most. This is also why the life domain
variable childcare support proved significant. It is important that these women have the
childcare support needed when dealing with demands from the workplace.
This certainly has important implications for policy, as it suggests that women are ready to
welcome new household arrangements where paid work and domestic responsibilities are
more equally shared. This could also relieve the current pressure, and perhaps role
overload, exerted on fulltime working women.
Ideas for further research include identifying and examining the institutional barriers that
prevent the achievement of a work-life balance, in particular negative employer attitudes
towards family-friendly work policies.
It is important to consider the limitations of this study. The variables that were tested vary
immensely with the situation in which people find themselves. Therefore perceptions
change because people adjust to the varying situations in their lives. The data used was
cross-sectional therefore it could not be examined for perceptions over a period of time.
This naturally affects the validity of the results acquired. The perceived work-life balance
remains a difficult variable and concept to measure and understand within certain contexts.
This is mainly because different researchers use different concepts to measure the balance.
The domain of “life” remains the more difficult concept to measure since only a few number
of the life domain variables affect the perceived work-life balance but also because
examiners always choose different “life” variables, which often do not affect the balance at
all.
The results of this study are a reflection of these shortcomings. Large-scale social surveys
have settled with a limited number of determinants in order to facilitate cross-national
comparisons. However, uniformity in these measures is crucial but comes unfortunately at
52
the expense of the functionality of the concept. Moreover because the “life” domain remains
fairly unspecified and varies greatly, large-scale surveys produce rather habitual measures
of the perceived work-life balance, which are often more favourable to employment-related
explanations. It has become evident after the analysis that the “work “ domain remains the
more powerful determinant of a perceived balance. It is hard to believe that the perceived
work-life balance is almost irrelevant to subjective wellbeing. Therefore a suggestion for
further research is that more information should be provided about the extent to which
conflicts between “life” and “work” domain impact on broader measures of subjective
wellbeing.
Another alternative is to measure conflict within the family independently from work-related
aspects and vice versa. Additionally, researchers could also include more specific
references to more particular aspects of life (for example an evaluation of time spend with
children and also examine the different kinds of support used by each respondents as well
as examine the costs of using such support. This measurement will provide a different
perspective on the measurement of the perceived work-life balance and will open the door
for alternative agendas involving the examination of the work-life balance.
53
Bibliography
Artikel CBS (2007a) Jonge vrouwen hoger opgeleid dan mannen.
http://www.cbs.nl/nl-NL/menu/themas/onderwijs/publicaties/artikelen/archief/2007/2007-
2143-wm.htm?RefererType=Favorite
Barnett, R.C. & Baruch, G.K. (1987) Social roles, gender, and psychological distress. In
R.C. Barnett, L. Biener, & G.K. Baurch (Eds), Gender and stress: 122-141. New York: The
Free Press.
Batt, R., & Valcour, P.M (2003) Human resources practices as predictors of work-family
outcomes and employee turnover. Industrial Relations, Vol.42: 189-220.
Behson S.J. (2002), Which dominates? The relative importance of work–family
organisational support and general organisational context on employee outcomes. Journal
of Vocational Behavior, Vol.61: 53-72.
Byrne, U. (2005) Work-life balance: Why are we talking about it at al? Business Information
Review; Vol. 22(1): 53-59
Chatman, J.A (1989). Improving interactional organizational research: A model of person-
organization fit. Academy of Management Review, Vol.14: 333-349.
Craig, Lyn (2006) Children and the revolution: a time-diary analysis of the impact of
motherhood on daily workload. Journal of Sociology, Vol. 42(2): 125–43.
Craig, Lyn (2007) Contemporary Motherhood: The Impact of Children on Adult Time.
Aldershot: Ashgate.
Crompton, R. & Lyonette, C. (2006). Work-life “Balance” in Europe. Acta Sociologica, Vol. 4:
379-393.
Crooker, K.J., Smith, F.L.,Tabak, F. (2002). Creating work-life balance: A model of pluralism
across life domains. Human Resource Development Review, Vol.1: 387-419.
54
Dex, S., & Bond, S. (2005). Measuring work-life balance and its covariates. Work,
Employment and Society, Vol.19: 627-637.
Dey. I. (2006). Wearing out the work ethic: Population ageing, fertility and work-life balance.
Journal of Social Policy, Vol. 35: 671-688.
Edwards, J.R & Rothbard, N.P (1999). Work and family stress and wellbeing: An
examination of person-environment fit in the work and family domains. Organizational
Behaviour and Human Decision Processes, Vol.77: 85-129.
Fagan, C. and Burchell, B. (2002) Gender, jobs and working conditions in the European
Union, European Foundation for the Improvement of Living and Working Conditions, Dublin.
Field, A (2005) Discovering Statistics Using SPSS. London: Sage Publications.
Fleetwood, S. (2007) Why work-life balance now? International Journal of Human
Resources Management, 18: 287-400.
Greenhaus, J. H., & Beutell, N. J. (1985). Sources of conflict between work and family roles.
Academy of Management Review, Vol.10: 76-88.
Greenhaus J.H, Collins K.M and Shaw J.D. (2003) The relation between work–family
balance and quality of life, Journal of Vocational Behavior, Vol.63: 510–531.
Hertz, R (1986) More equal than others: Women and Men in Dual-Career Marriages.
Berkeley, University of California Press.
Hildebrandt, E., & Littig, B. (2006). Concepts, approaches and problems of work-life
balance. European Societies, 8: 215-222.
Hill, E.J., Martinson, V. K., Ferris, M., & Baker, R.Z. (2004). Beyond the mommy track.
Journal of Family and Economic Issues, Vol.25: 121-136.
Hochschild, A. R. (1997). The Time Bind: When work becomes home and home becomes
work, New York: Metropolitan Books.
Hochschild, A. R. (1989). The second shift. New York: Avon Books.
55
Hughes, D., Galinsky, E (1988) Balancing work and family lives: Research and corporate
applications. In A.E Gottfried & A.W. Gottfried (Eds.). Maternal employment and children’s
development: 233-268. New York: Plenum.
Hyman, J., Scholarios, D. & Baldry, C. (2005). Getting on or getting by? Employee flexibility
and coping strategies for home and work. Work, Employment and Society, 19: 705-725.
Kahn, R. L., Wolfe, D. M., Quinn, R., Snoek J.D & Rosenthal, R. A. (1964). Organizational
Stress. New York: Wiley.
Kelloway, E.K, Gottlieb, B.H. & Braham, L. (1999). The source, nature, and direction of work
and family conflict: A longitudinal investigation. Journal of Occupational Health Psychology,
Vol.4: 337-346.
Knijn, T. & van Wel, F. (2001). Een wankel evenwicht. Arbeid en zorg in gezinnen met jonge
kinderen. Amsterdam: SWP.
Lundberg, U., Marberg, B. & Frankenhaeuser, M. (1994). The total workload of male and
female white-collar workers as related to age, occupational level, and number of children.
Scandinavian Journal of Pyschology, Vol.35: 315-327.
MacInnes, J. (2006). Work-life balance in Europe: A response to the baby bust or reward for
the baby boomers? European Societies, Vol. 8: 223-249.
Marks, S.R & Macdermid, S.M (1996). Multiple roles and the self: A theory of role balance.
Journal of Marriage and the Family, Vol.58: 417-432.
Milkie, M.A. Peltola, P. (1999) Playing All the Roles: Gender and the Work-Family Balancing
Act, Journal of Marriage and the Family, Vol. 61, No.2: 476- 49.
Ministerie van Onderwijs, Cultuur en Wetenschap (2008). Emancipatiebeleid 2008-2011.
Meer kansen voor vrouwen. Den Haag: Ministerie van OCW.
Noor, N.M. (2003) Work- and family-related variables, work-family conflict and women's
wellbeing: some observations', Community, Work & Family, Vol.6: (3), 297- 319.
56
Parkes, L.P & Langford P.H (2008) Work-life balance or work-life alignment? A test of the
importance of work-life balance for employee engagement and intention to stay in
organisations, Journal of Management and Organization Volume 14, 3: 267-284
Pichler, F. (2008) Determinants of Work-life Balance: Shortcomings in the Contemporary
Measurement of WLB, Aberdeen, UK, Soc Indic Res Vol. 92: 449-469.
Pleck, J.H. (1985) Working wives/working husbands, Beverly Hills, CA, Sage Publications.
Pleck, J.H. (1977) The work-family role system, Social Forces, 24: 417-427.
Portegijs, W., B. Hermans en V.Lalta (2006). Emancipatiemonitor 2006. Veranderingen in
de leefsituatie en levensloop. Den Haag: Sociaal en Cultureel Planbureau en Centraal
Bureau voor de Statistiek.
Powell, G.N & Mainiero, L.A. (1999). Managerial decision-making regarding alternative work
arrangements. Journal of Occupational and Organizational Psychology, 72: 41-57.
Robinson, J.P & Godbey, G. (1997). Time for life. University Park: The Pennsylvania State
University Press.
Rokeach, M (1973). The nature of human values. New York: Free Press.
Ross, C., Huber, J (1985) Hardship and Depression. Journal of Health and Social
Behaviour, Vol.26 (4): 312-327.
Shelton, B.A & John, D. (1996). The division of household labor. Annual Review of
Sociology, 22: 299-322.
Shelton, B.A. (1992). Women, men, and time: Gender differences in paid work, housework,
and leisure. New York: Greenwood press.
Steibler, N. (2009). Reported levels of Time-Based and Strain-based Conflict Between Work
and Family Roles in Europe: A Multilevel Approach. Soc Indic Res, 93: 469-488.
Sturges. J & Guest.D (2004) Working to live or living to work? Work– life balance early in
the career. Human Resource Management Journal, Vol.14: 5–16.
57
Tausig, M. & Fenwick, R. (2001) Unbinding time; Alternate work schedules and work-life
balance. Journal of Family and Economic Issues, 22: 101-119.
Tijdens, K.G, Dragstra, M., van Klaveren, M., Zorlu, A., Osse, P., Dagstra, A., Wetzels, C
(2002). Loonwijzers 2001/2002. Werk, lonen en beroepen van mannen en vrouwen in
Nederland. Amsterdam: Universiteit van Amsterdam.
Voydanoff, P. (2002). Linkages between the work-family interface and work, family, and
individual outcomes: An integrative model. Journal of Family Issues, 23: 138-164.