Embed Size (px)
Citation preview
ISSN: 1962-5361Disclaimer: This Philadelphia Fed working paper represents preliminary research that is being circulated for discussion purposes. The views expressed in these papers are solely those of the authors and do not necessarily reflect the views of the Federal Reserve Bank of Philadelphia or the Federal Reserve System. Any errors or omissions are the responsibility of the authors. Philadelphia Fed working papers are free to download at: https://philadelphiafed.org/research-and-data/publications/working-papers.
Working Papers
Financial Consequences of Identity Theft
Nathan BlascakFederal Reserve Bank of Philadelphia Consumer Finance Institute
Julia CheneyFederal Reserve Bank of Philadelphia Consumer Finance Institute
Robert HuntFederal Reserve Bank of Philadelphia Consumer Finance Institute
Vyacheslav MikhedFederal Reserve Bank of Philadelphia Consumer Finance Institute
Dubravka RitterFederal Reserve Bank of Philadelphia Consumer Finance Institute
Michael VoganAlly Bank
WP 20-33August 2020https://doi.org/10.21799/frbp.wp.2020.33
1
Financial Consequences of Identity Theft
Nathan Blascak Julia Cheney Robert Hunt
Vyacheslav Mikhed* Dubravka Ritter
Consumer Finance Institute, Federal Reserve Bank of Philadelphia Michael Vogan
Ally Bank
ABSTRACT
We examine how a negative shock from identity theft affects consumer credit market behavior. We show that the immediate effects of fraud on credit files are typically negative, small, and transitory. After those immediate effects fade, identity theft victims experience persistent increases in credit scores and declines in reported delinquencies, with a significant proportion of affected consumers transitioning from subprime-to-prime credit scores. Those consumers take advantage of their improved creditworthiness to obtain additional credit, including auto loans and mortgages. Despite having larger balances, these individuals default on their loans less than prior to identity theft.
Keywords: identity theft, fraud alert, consumer credit, credit performance, limited attention
JEL Codes: G5, D14, D18
________________________
* Corresponding author: Vyacheslav Mikhed, Federal Reserve Bank of Philadelphia, Ten Independence Mall, Philadelphia, PA, 19106; phone: 215-574-7111; fax: 215-574-7101; email: [email protected]. Blascak, Cheney, Hunt, Ritter: Ten Independence Mall, Philadelphia, PA, 19106; Vogan: Ally Bank. We wish to thank Dennis Carlson, Amy Crews Cutts, Bradley Dear, April Ferguson, and Henry Korytkowski of Equifax for their assistance with the data. We thank Marieke Bos, Anat Bracha, Chris Carroll, Ronel Elul, Dan Grodzicki, Andrew Hertzberg, Lynn Langton, Wenli Li, Brianna Middlewood, Susan Herbst-Murphy, Blake Prichard, Peter Schnall, Victor Stango, Jialan Wang, Chet Wiermanski, Stephanie Wilshusen, and anonymous referees for their helpful suggestions and Bryant Wright for his excellent research assistance. We especially thank Loretta Mester for making this research possible. We thank seminar participants at the Federal Reserve Bank of Philadelphia, the Federal Reserve Bank of Cleveland, Charles River Associates, the Boulder Summer Conference on Consumer Financial Decision Making, the FDIC Consumer Research Symposium, the Cherry Blossom Financial Education Spring Institute, the Digital Information Policy Scholars Conference, the Workshop on the Economics of Information Security, the 2016 RAND Behavioral Finance Forum, the Second Quadrant Behavioural Finance Conference, and the Public Policy Conference on the Law & Economics of Privacy and Data Security for their comments.
Disclaimer: This Philadelphia Fed working paper represents preliminary research that is being circulated for discussion purposes. The views expressed in this paper are solely those of the authors and do not necessarily reflect the views of the Federal Reserve Bank of Philadelphia, the Federal Reserve System, or Equifax, Inc. Any errors or omissions are the responsibility of the authors. No statements here should be treated as legal advice. Philadelphia Fed working papers are free to download at https://philadelphiafed.org/research-and-data/publications/working-papers.
2
1. Introduction
Because of a number of recent massive data breaches and numerous smaller scale data losses,
sensitive personal information of hundreds of millions of consumers regularly becomes subject
to potential criminal use, including identity theft. Such personal information may include
consumer names, dates of birth, or Social Security numbers (SSNs) as well as trade-level data for
financial accounts. The prevalence and magnitude of identity theft in the United States has been
widely documented and publicized in recent years. The U.S. Bureau of Justice Statistics reported
that, in 2016, 26 million U.S. consumers (about 10 percent of adults) were victims of at least one
incident of identity theft. These victims reported gross financial losses of approximately $17.5
billion (Harrell, 2019) and experienced significant emotional distress owing to the fraud.1 Yet,
much less is known about the consequences of identity theft for individual consumers or about
consumers’ response to identity theft, particularly in the context of their credit behavior.
We contribute new insights on the effects of identity theft on consumer credit outcomes
by assembling a new, unique data set combining anonymized consumer credit records with
information about instances of actual and suspected identity theft. In particular, we focus on
individuals with extended fraud alerts, which require a police or comparable report with credible
evidence of identity theft. To identify the effect of identity theft on consumer credit outcomes,
we use the plausibly exogenous timing of fraud occurrence and formulate an event-study
methodology, comparing victimized consumers to not-yet-victimized consumers who are
arguably similar along unobservables.
Exploiting the plausibly exogenous timing of identity theft and our unique data, we
provide evidence on three broad research questions. First, we examine the immediate effect of
identity theft on consumer credit outcomes shortly before and including victimization (as proxied
by fraud alert filing). Second, we examine consumer credit outcomes after the immediate effects
of fraud are removed. Third, we provide evidence of long-term consequences of identity theft on
consumer creditworthiness, borrowing, repayment, and loan default.
For the first question, we document that identity theft leads to additional credit inquiries
(applications for credit) in victims’ credit files, new credit cards opened in their name, and an
1 Net losses for consumers are much less frequent and typically small in magnitude. Harrell (2019) is based on the Identity Theft Supplement to the National Crime Victimization Survey (NCVS). For detailed information on the NCVS and its methodology, visit https://www.bjs.gov/index.cfm?ty=dcdetail&iid=245.

3
abnormal rate of reverse address changes (reversals of a temporary address change to the original
address). These changes are consistent with criminals applying for credit with stolen consumer
information, being approved for new credit cards using the stolen information to impersonate
actual consumers, and deceiving lenders into sending these cards to new addresses where
criminals can collect them. These fraudulent activities negatively affect consumers’ overall credit
standing as represented by the Risk Score.2 Risk Scores of identity theft victims decline by 4
points, on average, relative to the group of identity theft victims who have not yet been
victimized, with severely affected consumers experiencing Score declines of 14 points and others
becoming subprime as a result of the fraud.
Second, we find that many of the negative consequences of identity theft observed
immediately on impact quickly disappear from credit bureau records. In particular, credit
inquiries, the number of new credit cards, and address reversals all decrease significantly and
quickly. Further, we observe positive changes to consumer credit attributes initially unaffected
by fraud. For example, we observe significant and persistent reductions in the number of
accounts in third-party collections and major derogatory events, while the share of card balances
in good standing increases. The removal of fraudulent information from affected individuals’
credit bureau files alone is insufficient to explain these incremental positive changes.
Consistent with the improvements in individual credit characteristics, we find that fraud
victims’ Risk Scores increase by an average of 10 points after the immediate effects of identity
theft fade. For many of these consumers, this Risk Score increase is larger than the decrease in
the Score due to fraud (which is 4 points on average). We also observe that the proportion of
fraud victims with prime Scores increases by 5 percentage points (11 percent) — a substantial
increase — after filing an extended fraud alert. Becoming a prime consumer carries a substantial
economic benefit, as previous studies have shown that prime borrowers are more likely to be
approved for credit and tend to receive better terms of credit (e.g., lower annual percentage
rates), even for marginal consumers.
We also document that this population of consumers, who transition from subprime to
prime Risk Scores, uses their improved creditworthiness to apply for additional credit. In
particular, we find that these consumers apply for new auto loans and increase the number of
2 We use the term Risk Score or Score to refer to a proprietary credit score provided to us by Equifax. Subprime borrowers are defined as those with Scores less than or equal to 660, while prime borrowers have Scores above 660.
4
such loans and balances on them. Similarly, some of these consumers apply for new mortgages,
acquire additional loans, and increase mortgage balances. Despite having additional mortgage
and auto loans and increased balances on them, these subprime-to-prime transition consumers
are able to perform on the loans as well as or better than they did before identity theft.
While we cannot definitively rule out alternative mechanisms that may explain the short-
run impact of identity theft on credit attributes, we provide suggestive evidence that consumer
inattention to credit reports is the most plausible explanation for the patterns in consumer credit
attributes that we observe. The short-run improvements in Risk Scores, major derogatory events,
collection accounts, and card balances in good standing suggest that many identity theft victims
were not actively scrutinizing their credit reports prior to their victimization. The fact that many
of these attributes improved more than they deteriorated on impact suggests that consumers were
not aware of preexisting errors in their reports and corrected those shortly after being victimized.
This explanation is consistent with prior studies showing that consumers have errors in their
reports and do not pay attention to these records (e.g., Federal Trade Commission (2012) finds
that 26 percent of consumers have material errors in their credit reports and 13 percent
experienced credit score changes after the errors were corrected). The persistent improvement in
the management of open accounts, as reflected in improved Risk Scores, suggests that consumers
are more attentive to their credit than they were before they were victimized.
The finding that some victims of identity theft use their improved creditworthiness to
apply for new credit is consistent with prior studies showing that consumers apply for credit after
positive shocks to their credit scores.3 We contribute to this literature by showing a similar
tendency among a population of identity theft victims. We also document that this credit
expansion does not lead to additional defaults in the long run for this population of consumers.
This finding is in contrast to some prior studies of credit expansions under different
circumstances (e.g., Musto (2004) finds that borrowers are more likely to default on credit
obtained after a bankruptcy flag removal, thus suggesting that this removal results in a loss of
important information). Overall, our findings imply that, even for a population of consumers
with more severe identity theft and larger out-of-pocket (OOP) losses, identity theft is not likely
3 For example, Gross, Notowidigdo, and Wang (2020) show that borrowing on cards, auto loans, and mortgages rises after credit score increases following bankruptcy flag removals. Similar effects are documented by Musto (2004); Bos, Breza, and Liberman (2018); Herkenhoff, Phillips, and Cohen-Cole (2018); and Dobbie et al. (2016).
5
to lead to long-term credit damage or consumer withdrawal from credit markets. On the contrary,
identity theft events may serve as a teachable moment for consumers who were previously not
knowledgeable about credit bureau records or consumer credit markets more broadly.
2. Contributions to the Literature
This paper contributes to several existing literatures. First, our paper relates to a large and
growing literature showing that individuals in a variety of contexts pay limited attention to and
do not process information completely when making important decisions. Previous work has
demonstrated that investors react less than optimally to information readily available to them at
no cost (Barber and Odean, 2008; DellaVigna and Pollet, 2009; Hirshleifer, Lim, and Teoh,
2009, 2011), that consumers either forget or fail to incorporate relevant consumption-related
decisions (Grubb, 2015; Lacetera, Pope, and Sydnor, 2012), and that providing relevant
information to consumers may increase attention and improve financial outcomes (Stango and
Zinman, 2014; Bracha and Meier, 2015). Our work is also closely associated to the theoretical
work on inattention and salience (DellaVigna, 2009; Gabaix and Laibson, 2000, 2001; Gabaix et
al., 2006; Bordalo, Gennaioli, and Shleifer, 2013a, 2013b). We add to this broad literature by
showing that identity theft may serve as a salient, negative event that reminds consumers to
check credit reports, correct any errors, and potentially exhibit care and attention to their credit.
Second, our paper contributes to the literature on fraud in financial markets. While much
of this literature focuses on the parties that commit fraud, such as financial advisors (Dimmock,
Gerken, and Graham, 2018; Dimmock and Gerken, 2012; Egan, Matvos, and Seru, 2019;
Qureshi and Sokobin, 2015), CEOs (Khanna, Kim, and Lu, 2015; Agrawal, Jaffe, and Karpoff,
1999), and firms (Piskorski, Seru, and Witkin, 2015; Povel, Singh, and Winton, 2007; Dyck,
Morse, and Zingales, 2010, 2014), we examine the effects of fraud on victims’ credit outcomes.
Our study complements research on the effects of fraud on investment decisions by individuals
and households (Gurun, Stoffman, and Yonker, 2018; Giannetti and Yang, 2016). We add to
these studies by showing evidence of the effects of identity theft on consumer borrowing
decisions in credit markets.
Third, our empirical findings add to the literature that examines the consequences of
identity theft on consumers. However, unlike previous studies that focused on consumer
6
confidence in payment systems (e.g., Sullivan, 2010) and payment choice (Cheney et al., 2012;
Kahn and Liñares-Zegarra, 2016; Stavins, 2013; Kosse, 2013), this paper examines how identity
theft can affect consumers’ credit performance and credit variables. This study is also related to
papers considering the tradeoff between information security and data privacy (Acquisti, 2004;
Anderson and Moore, 2007) and incentives for consumers to prevent identity theft (Federal
Trade Commission, 2003; Cheney, 2003).
3. Consumer Credit Bureau Records and Identity Theft
3.1 Information Contained in Consumer Credit Bureau Records
In this paper, we examine the financial consequences of identity theft on consumer credit
attributes and subsequent consumer use of their improved creditworthiness using detailed credit
bureau records. A consumer credit report is an organized record of an individual’s interaction
with the credit market. Typically, a report will include information on the number, size, age,
composition, and repayment status of the consumer’s loans or lines of credit. A credit report may
also include information obtained from public records, such as bankruptcy filings. In the United
States, the three largest credit reporting agencies with national scope are Equifax, Experian, and
TransUnion.
3.2 Extended Fraud Alerts
In 2003, the Fair and Accurate Credit Transactions Act (FACTA) became law, amending the Fair
Credit Reporting Act (FCRA) of 1970. One of the goals of FACTA was to improve protections
for consumers affected by identity theft. FACTA permits consumers to obtain free copies of their
credit reports from each of the three major bureaus once a year. FACTA also required federal
regulators to develop “red flag” indicators of identity theft to aid in detecting identity theft. It
also required credit reporting agencies to block information that results from identity theft and to
implement a set of indicators or credit file flags that inform creditors that a consumer was, or
may have been, a victim of identity theft. The credit file flags include extended fraud alerts that
we use in this paper.
7
The elaborate process of filing for an extended fraud alert implies that practically all
filers of these alerts have been victimized.4 In particular, extended fraud alert filers must submit
a police report or an Identity Theft Report to place the alert in their credit bureau files. An
Identity Theft Report requires detailed information on the accounts that were compromised and
accompanying evidence of identity theft or fraud. Providing such evidence requires both time
and effort. In addition, consumers face criminal penalties for falsifying information in these
reports.5 Thus, filers of these alerts are unlikely to place alerts in their credit bureau files simply
because of worry, out of an abundance of caution, or for a related reason.
After an Identity Theft Report or a police report has been filed, the consumer can add an
extended fraud alert to his or her credit report. Extended fraud alerts require a creditor to take
additional steps in verifying the consumer’s identity when a request is made to open a new credit
account, increase an existing credit line, or issue an additional card associated with an existing
credit account. The consumer specifies a telephone number or other reasonable contact method
as part of the alert documentation. All creditors must contact the consumer by the method
specified in the alert to verify the consumer’s identity in the case of any of the previous
applications. Once filed, an extended fraud alert remains in a consumer’s credit file for seven
years unless the consumer chooses to remove it earlier than that. In addition, an extended fraud
alert removes the consumer’s credit file from lists of prescreened credit and insurance offers for
five years. Under FACTA, when a consumer files an alert with one national credit bureau, the
information submitted by the consumer is communicated to the other two major bureaus.
An important element of the rights established in FACTA (and some state laws) is the
opportunity for the consumer to obtain — at no cost — a copy of his or her credit report from
each of the three credit bureaus when filing a fraud alert. Receiving these reports gives
consumers a chance to detect and dispute fraudulent accounts or delinquencies on compromised
accounts as well as any other errors in their credit reports. If the information in a consumer’s
4 Cheney et al. (2014) provide evidence suggesting that most consumers who file initial alerts, credit freezes, or credit monitoring are often acting out of precaution rather than being actual victims. We choose to focus on extended fraud alerts in this study to be conservative about potential false positives, but we recognize that this implies additional false negatives. 5 FACTA, §111, defines an Identity Theft Report as, at a minimum, “a report that alleges an identity theft; that is a copy of an official, valid report filed by a consumer with an appropriate Federal, State, or local law enforcement agency, including the United States Postal Inspection Service, or such other government agency deemed appropriate by the Federal Trade Commission; and the filing of which subjects the person filing the report to criminal penalties related to the filing of false information if, in fact, the information in the report is false.”
8
credit report cannot be verified by the creditor, the credit bureaus are required to remove this
information and to prevent it from reappearing in subsequent reports. It is important to note that
requesting a credit report or filing a fraud alert by itself does not remove fraudulent charges from
credit accounts with individual creditors and does not prevent data on already open but not-yet-
disputed fraudulent accounts from being added to the credit report. Even after filing an alert,
consumers need to identify fraudulent information and dispute this information.
4. Data Description
To explore the effect of identity theft on consumer credit, we use the Federal Reserve Bank of
New York (FRBNY) Consumer Credit Panel (CCP)/Equifax data set, combined with a unique
data set detailing the timing (placement) and type of fraud alerts that the Consumer Finance
Institute obtained from Equifax. The FRBNY CCP/Equifax data set contains credit
characteristics from an anonymized 5 percent random sample of credit bureau records of U.S.
consumers.6 The FRBNY CCP/Equifax is an unbalanced panel in which new individuals are
included over time as they obtain or first report an SSN to a lender (e.g., after immigrating to the
United States), open their first credit accounts, or establish their first public record. Similarly,
consumers are dropped from the sample when they die, change their SSNs, or “age off”
following a prolonged period of inactivity and no new items of public record. The sample is
designed to produce a panel with entry and exit behavior similar to the population that uses credit
or has a credit history (Lee and van der Klaauw, 2010).
We examine the credit files of individuals continuously present in the data set in all
quarters from Q1:2008 to Q3:2013 so that we can trace the credit histories of these consumers
and mitigate concerns about “fragments” in our data (Wardrip and Hunt, 2013).7 Our sample
consists of about 10.8 million consumers. We observe that approximately 53,000 of that sample
6 The sample is constructed by selecting consumers with at least one public record or one credit account currently reported and with one of five numbers in the last two digits of their SSNs as the method of randomly selecting the sample. Equifax uses SSNs to assemble the data set, but the actual SSNs are not shared with researchers. In addition, the data set does not include any names, actual addresses, demographics (other than age), or other codes that could identify specific consumers or creditors. Our data on fraud alerts span Q1:2008 to Q3:2013. 7 Our results are comparable if we relax this restriction and instead include up to 22 quarters before and after the fraud alert is filed for each consumer (i.e., credit outcomes from Q1:2003 to Q1:2019 for consumers with fraud alerts first filed between Q1:2008 and Q3:2013). These results are included in Appendix Figures A5–A9.
9
filed a first extended fraud alert in Q1:2008 or thereafter.8 In much of the following analysis, we
examine changes in variables in event time — the number of quarters before or after an extended
fraud alert first appears.
Within the FRBNY CCP/Equifax data set, we have access to rich consumer-level
information on mortgage accounts, home equity revolving accounts, auto loans, bankcard
accounts, student loans, and other loan accounts as well as public record and collection agency
data. The FRBNY CCP/Equifax contains limited personal background information, such as the
consumer’s age and geographic information in the form of a scrambled address, state, zip code,
metropolitan statistical area, and U.S. Census tract and block. We also have a credit score (the
Risk Score) and the number of inquiries (i.e., applications for credit or insurance). Using the
research design in our study (described in detail in Section 5), we examine the number of and
balances on revolving accounts, the proportion of cards in good standing, total credit card limit,
and many other consumer characteristics. Table 1 presents the descriptive statistics for the
sample of extended alert filers in our data set.
4.1 Timing and Evidence of Fraud Removal
FACTA requires that credit reporting agencies block information resulting from identity theft
four days after accepting a consumer’s dispute identifying this information. The agencies must
notify information furnishers that the information they submitted will be blocked from the
consumer’s credit file. This notification triggers actions required by FACTA for furnishers of the
information, including that the furnisher may not continue to report this information to any credit
reporting agency. Another option available to all consumers, not just identity theft victims,
through the FCRA is the right to dispute errors (inaccurate or incomplete information) in credit
reports. When such a dispute is verified, it may result in a change to or deletion of information in
a consumer’s credit report.
We cannot directly observe what kind of information is blocked or for what reasons.
However, the manner in which each quarter of the FRBNY CCP/Equifax data is assembled
implies that any fraud existing in the quarters preceding the filing of an extended fraud alert
8 We call these first extended fraud alerts to distinguish between the quarter in which the alert is placed in the file and the subsequent quarters during which the alert is effective. In other words, we use the term to distinguish between the flow and stock of consumers with fraud alerts in our data.
10
remains in the data. That is because, generally speaking, when a new quarter of data is added to
the FRBNY CCP/Equifax, the information contained in the previous quarters is not revised. In
this sense, this dataset is similar to other real-time data sets used by researchers. It is important to
emphasize that this property of the data does not necessarily apply to the actual credit report
information that consumers and creditors access every day. When an error is discovered in
information contained in those credit bureau files, the erroneous information no longer appears
anywhere in the credit history that a consumer or a creditor can see.9
5. Research Design
5.1 Identification Strategy
To identify the effects of identity theft on consumer credit outcomes, we exploit plausibly
exogenous variation in the timing of identity theft victimization for consumers in our data. Our
strategy can address the possible obstacle of endogenous selection into extended alert filing.
Ideally, to identify the effect of fraud, we would compare extended alert filers with all nonfilers
or a selected group of nonfilers. However, since not every victim of identity theft or fraud files
an extended fraud alert with a credit bureau,10 extended alert filers may be more motivated or
attentive than victimized nonfilers. It is possible that such unobservable factors would be
correlated with the way individuals manage their credit, pay their bills, or borrow money. If we
were to simply compare extended alert filers with all nonfilers, we may not be able to separate
the effects of fraud from the effect of unobservable motivation to file an alert, and our estimates
may suffer from selection bias.
9 It is possible that the timing of the placement of extended fraud alerts may not coincide perfectly with changes in credit variables. For example, consumers who file their alerts at the end of the third month of a quarter may not have their credit file updated until the first month of the following quarter. We considered the changes in key credit variables across event time by the month of extended alert filing to address this concern. Our results (available in Appendix Figure A15) indicate that both the timing of fraud and the effect of placement of fraud alerts do not systematically differ by the filing month. 10 According to Harrell (2019), about 8 percent of all identity theft victims contact a credit bureau following identity theft. Of those consumers, 68 percent placed a fraud alert in their file, while 18 percent provided a police report to the credit bureau. Among consumers suffering from more severe forms of identity theft, such as opening new accounts in the consumer’s name, about 33 percent of victims contact a credit bureau, and about a third of those provide a police report to the credit bureau.
11
To account for any potential selection on observable or unobservable characteristics, we
propose an identification strategy that relies on the variation in the timing of victimization and
alert filing (treatment) to identify the effect of fraud on credit bureau characteristics. Since all
individuals in this sample file an extended alert at some point in time, we avoid the selection-on-
unobservables issue because the individuals in our sample are similarly motivated to file an alert
once they have discovered evidence of fraud. Simply stated, we use the plausibly exogenous
timing of fraud occurrence to compare the outcomes of already victimized extended alert filers
with the outcomes of not-yet-victimized extended alert filers.
We present additional evidence that potential endogenous timing of filing and reverse
causality do not represent threats to causal inference in our study. We also discuss each of these
possible empirical challenges in the following subsections. In addition, we compare fraud alert
filers to all identity theft victims and offer suggestions on the external validity of our results.
5.1.1 Exogeneity of Extended Alert Timing
One concern about our empirical strategy is that the timing of the extended fraud alert may not
be exogenous. Based on available evidence of identity theft as a crime of opportunity more than
targeting, and our examination of patterns in aggregate alert filings (e.g., the monthly frequency
of new extended fraud alerts plotted in Figure 1) in our data, we believe the timing of identity
theft itself to be exogenous at the consumer level. But it is possible that individuals may not
discover identity theft for a long time, allowing for incidents to accumulate before filing an alert.
There may also be an endogenous lag between discovering identity theft and filing an alert,
where some consumers have more unobservable motivation to act faster than others. This could
result in better credit outcomes for individuals who file more quickly relative to those who file
less quickly. Both an accumulation of fraud over time and an endogenous lag in alert filing
would violate our assumption that extended alert filing is a good proxy for victimization.
Evidence from the National Crime Victimization Survey (NCVS), administered by the
Bureau of Justice Statistics, does not support either of these hypotheses. Panel A of Figure A1
shows that, for identity theft victims, almost 50 percent of respondents discover misuse of their
information within 24 hours, and 95 percent of respondents discover fraud within one quarter.
Panel B of Figure A1 shows that, for individuals who file an alert with a credit bureau, more than
86 percent of respondents report discovering identity theft within a quarter. Identity theft victims
12
also manage to clear up their credit and financial problems within the same timeframe as
discovery (Figure A1, panel C). Similar to discovery timing, 97 percent of respondents report
clearing up all financial problems because of identity theft within one quarter. Taken together,
these results show that identity theft victims discover fraud and take corrective actions quickly.
Nevertheless, to control for other potential time-invariant, unobservable factors that may
be correlated with consumer credit outcomes, we estimate all our models with individual fixed
effects. By adding individual fixed effects, we also control for individual-specific time-invariant
factors that may be correlated with the timing of victimization.
5.1.2 Reverse Causality
The other potential challenge to identification is reverse causality. Instead of consumers
correcting credit reports in response to identity theft, some consumers may set out to clean their
credit files in preparation for a mortgage or other major credit application. During this process,
consumers may discover negative episodes in their reports — such as fraud — because they are
actively applying for credit and paying more attention to their reports. This hypothesis implies
that such consumers are likely to have indicators of fraudulent activity (e.g., address change
reversals, new accounts that are closed immediately, and increases in delinquent accounts) in
their files at any time before they file an extended fraud alert.
Our results summarized in Figure 2 — discussed in more detail in the following section
— do not support the hypothesis that consumers who file extended fraud alerts are simply
engaged in credit file repair before a major credit application or some other event. In particular,
panels A, C, and D in Figure 2 show that fraud-related activity is tightly concentrated just before
the alert filing or at the time of filing and not distributed across the quarters prior to alert filing.
Survey evidence from the NCVS also supports our conclusion that individuals who
experience identity theft were not typically in the process of shopping for credit, with
approximately only 1 percent of respondents who were victims of identity theft stating that they
discovered misuse upon applying for credit, bank accounts, or loans.
13
5.1.3 External Validity
Based on our analysis of data collected for three different waves of the NCVS (2012, 2014, and
2016), presented in Table 2, extended alert filers are not that different from all identity theft
victims in their characteristics. On average, extended fraud alert filers (who, in the NCVS,
represent only about 2 percent of all identity theft victims) are somewhat more likely to be
minority and low-income consumers, and to suffer significant OOP losses as a result of identity
theft. This last characteristic is consistent with their ability to file an extended fraud alert, which
would require convincing evidence of identity theft for filing. Total OOP losses reported in the
NCVS include: the amount lost by a victim not compensated by a lender, insurance, or another
provider; and indirect costs associated with the crime (late fees, overdraft and bounced check
fees, legal fees, and miscellaneous expenses incurred dealing with the event).
While we do not claim that the results of our study are generalizable to all identity theft
victims, the population of victims we examine is interesting as it includes individuals with large
OOP losses, minorities, and low-income individuals. These groups of consumers can be more
vulnerable to identity theft and less prepared to deal with its consequences. In addition, the fact
that extended alert filers are more likely to suffer OOP losses and have larger amounts in these
losses may suggest that our estimated effects are the upper bounds of potential effects of identity
theft on all victims (who may be less inclined to file an alert since they do not have any OOP
losses).
5.2 Econometric Methodology
In our main analysis, we estimate the following event-study regression model:
𝑌𝑌𝑖𝑖𝑖𝑖 = 𝛽𝛽0 + ∑ 𝛽𝛽1𝑒𝑒𝑇𝑇𝑒𝑒22𝑒𝑒=−8 + 𝛿𝛿𝑖𝑖 + 𝑋𝑋𝑖𝑖𝑖𝑖𝛾𝛾 + 𝜀𝜀𝑖𝑖𝑖𝑖, (1)
where Y is an outcome variable of interest, and T is a set of event time dummy variables relative
to the time of extended fraud alert filing. For example, T2i is equal to 1 when two quarters have
passed since alert filing and 0 otherwise. This approach measures the changes in the outcome
variables up to eight quarters before fraud alert filing (to observe preexisting trends, if any), at
the time of the filing, and up to 22 quarters after alert filing. These are all relative to the omitted
period, which is quarters 22 to 9 before the alert filing. The vector of individual-level controls Xit
includes a fifth-order polynomial in age, state fixed effects, calendar time fixed effects, and the
14
interactions of state and calendar time fixed effects. We also include individual fixed effects,
𝛿𝛿𝑖𝑖.11 Standard errors are clustered at the individual level.
As previously mentioned, the data used in these regressions only include extended fraud
alert filers. Hence, the only source of variation exploited is the variation in the time of
victimization and fraud alert filing. This specification is standard in the literature and is used by
Gallagher (2014); Gross, Notowidigdo, and Wang (2020); and Dobkin et al. (2018).
6. The Effects of Identity Theft on Consumer Credit Characteristics
In this section, we use the econometric strategy described in Section 5 to examine three research
questions. First, we examine what happens to filers when they experience identity theft. Second,
we explore filers’ credit performance after identity theft (including any cleanup of fraudulent
information from credit records). Third, we document long-term effects of identity theft on credit
performance, borrowing and use of credit, loan default, and other consumer interactions with the
credit markets. We summarize our results for these three lines of inquiry in Figures 2–7. All
figures report coefficients from the distributed lag regression model specified in Equation (1) for
a number of outcome measures. The coefficients show the difference in the outcome variables
between already victimized consumers and not-yet-victimized individuals over the time before
and after identity theft. In addition to point estimates displayed as dots, all figures provide 95
percent confidence intervals as vertical bands. In the following subsections, we discuss our
results for all consumers and for some consumers with more pronounced effects.
6.1 Evidence of Identity Theft
We document changes in four credit variables that can be affected by identity theft and fraud in
Figure 2. These variables include credit applications, number of new revolving accounts, reverse
address changes, and Risk Scores. We show the effects of identity theft on these outcomes in the
four panels of Figure 2 and discuss them in detail in the following paragraphs.
Panel A of Figure 2 displays a very large and transitory increase in the number of credit
applications that coincides with the quarter the extended alert is filed. Relative to the base period
11 Note that we cannot include fixed effects for the cohort of fraud alert filing in this specification because they would be perfectly collinear with individual fixed effects. As a robustness test (not shown), we included cohort fixed effects and zip code fixed effects, but omitted individual fixed effects, and obtained almost identical results.
15
(quarters 22 to 9 before alert filing), the average number of inquiries increases from 0.4 in the
quarter before alert filing to 0.6 at the time of filing. The coefficient can be interpreted as six out
of 10 consumers accumulating one additional credit application shortly before the fraud occurs.
This increase is consistent with consumers’ personal information being stolen by criminals and
used to apply for credit. It is possible that consumers become aware of identity theft because this
spike in applications triggers letters or phone calls from creditors. Results from the NCVS show
that almost 50 percent of identity theft victims discover identity theft through such
communications. The number of inquiries decreases to pre-fraud level by the third quarter after
alert filing and remains on a downward trend.
Panel B of Figure 2 plots the average number of new revolving accounts for fraud victims
before and after they file an alert (revolving accounts include general-purpose credit cards issued
by banks and credit unions as well as revolving credit offered by retailers for purchases made at
their stores). This figure shows that new revolving accounts begin to increase sharply a few
quarters before the fraud alert filing and peak one quarter before filing. On average, one out of
10 fraud victims have one new revolving account opened during that time. This finding is
consistent with criminals using consumers’ stolen personal information to open new revolving
accounts. Fraud victims have, on average, between 0.05 and 0.1 fewer new revolving accounts in
the quarter after identity theft or fraud. The number of new accounts declines quickly once the
fraud is discovered and extended fraud alert filed. It remains suppressed for up to 22 quarters
after identity theft.
Certain types of identity theft and subsequent fraud involve criminals changing the
address on the consumer’s financial accounts, which can trigger a change in the address that
creditors report to the credit bureau.12 In our data, we are unable to distinguish between
fraudulent and genuine address changes. However, we can see if an address change is reversed to
the original address in the subsequent quarter. Thus, we can compare the pattern of reverse
address changes at the time an extended fraud alert is filed with patterns prior to and after the
event.13 Panel C of Figure 2 plots the fraction of fraud alert filers who revert their address to the
12 Criminals may change addresses when taking over existing accounts, or they may apply for new accounts using the consumer’s name but a different address. 13 Recall that consumer address changes may be reversed in the credit bureau file after the discovery of fraud, but the history of address changes in the FRBNY CCP/Equifax is not updated and, therefore, is not affected by the reversal.
16
prior quarter’s address over event time. The coefficients imply that around 1 percent of victims
reverse address changes at the time of fraud and an additional 1.5 percent of victims do the same
one quarter after alert filing. Thus, we find evidence of a sharp increase in reverse address
changes at the time the fraud alert is filed and one quarter after, consistent with the consumer
reversing address changes made by criminals.
Finally, panel D of Figure 2 shows a transitory decline in Risk Score of about 4 points
shortly before the fraud alert filing and a subsequent recovery in the quarters after filing.
However, the average increase in Scores that follows is typically larger than the transitory
decline. On average, Risk Scores increase by about 10 points relative to the omitted period at the
time of the fraud alert; we will revisit this finding in the next subsection.
The increases in inquiries, reverse address changes, and number of new revolving
accounts near the time of the fraud alert filing, as well as the decline in Risk Score shortly before
the placement of the fraud alert, provide convincing evidence that identity theft occurred
certainly within a year before the fraud alert was filed, if not exactly in the same quarter in which
the alert was filed.
6.2 Persistent Changes in Credit Performance After Identity Theft
In addition to the previously discussed indicators of identity theft in quarters just before and just
after alert filing, panels A, B, and D of Figure 2 allow us to observe differences in the credit
outcomes of fraud victims in the medium to long term, up to five years following alert filing. In
particular, these panels show the number of credit inquiries, the number of new revolving
accounts, and Risk Score for up to 22 quarters after fraud occurrence. While panel D of Figure 2
shows that, on average, victimized consumers’ Risk Scores are 10 or more points higher even
five years after fraud, these consumers do not apply for credit as much as they did before fraud,
and they have, on average, 0.2 fewer credit inquiries per quarter in this period (Figure 2, panel
A). Consistent with this reduced number of inquiries, the number of new revolving accounts is
about 0.12 lower for fraud victims five years out (panel B). These results also indicate that the
persistent improvement in Risk Score after identity theft may be explained in part by reductions
in the number of inquiries and the number of new revolving accounts after fraud. The reductions
in both of these credit variables can positively affect Risk Scores.
17
To examine the reasons behind the improved creditworthiness of identity theft victims,
we consider measures of credit performance such as the proportion of balances in good standing,
the incidence of third-party collections, and derogatory events. Figure 3 provides evidence on the
performance of fraud victims with credit products several years after identity theft. Panel A of
Figure 3 shows that consumers keep a higher proportion of their card balances in good standing
after fraud. Fraud victims also reduce the incidence of major derogatory events on cards by about
4 percentage points (panel B) and the incidence of third-party collections by 6 percentage points
to 7 percentage points (panel C). These three measures of credit performance capture different
margins of adjustment in debt repayment behavior. Card balances in good standing (current)
represent the strictest definition of performance (i.e., repaying debts on time without any delay).
Major derogatory events on cards capture more serious delinquency such as charge offs,
bankruptcies, and internal collections. Third-party collections are delinquent accounts placed for
collection with external firms that specialize in recovering at least a portion of an outstanding
debt that a consumer owes. Noteworthy, all these measures of performance improve upon
identity theft and remain better for as long as five years after fraud.
The sharp declines in the incidence of derogatory events and third-party collections at the
time of an alert filing might result from consumers disputing fraudulent accounts and other
incorrect information in their credit reports. However, the persistence of these effects suggests
that consumers changed their repayment habits to keep more credit accounts in good standing
and out of collections as shown by the long-term effects of fraud on these variables. To
summarize our findings, we plot the share of the population with prime Scores (higher than 660)
in our sample in panel D of Figure 3. Consistent with the decline in the average Risk Score
before alert filing shown in Figure 2, this figure shows that fraud activity at event time 𝑒𝑒 = −1
lowers the share of prime consumers by 1.7 percentage points. However, after fraud, the share of
prime consumers increases by 3.4 percentage points relative to the base period, which is a 5.1
percentage point increase relative to the quarter before fraud. This is an 11 percent increase over
the sample average of 46 percent of prime consumers. The share of prime consumers continues
to grow over time, and it is 7 percentage points higher after five years relative to the baseline
period.
It is important to note that the mechanical credit file “cleaning” (i.e., removal of
fraudulent information from credit bureau files) is insufficient to explain these incremental
18
positive changes in consumer behavior on existing credit accounts following fraud. The most
plausible explanation for our results is that consumers paid little attention to their credit report
information prior to suffering identity theft and began paying more attention after the incident.
Several sources show that consumers do not pay close attention to their credit reports, credit
scores, or other credit information. For example, according to a 2013 poll conducted by the
National Foundation for Credit Counseling, 60 percent of adults 18 years or older had not
checked their credit scores in the previous 12 months, and 65 percent had not reviewed their
credit reports. Similarly, the Bureau of Justice Statistics found that only 42 percent of non-
victims reported that they had checked their credit reports in the past 12 months; this number
increased to 62 percent among identity theft victims (Harrell, 2019).
Given the nature and potential economic effects of identity theft, it is likely that a fraud
incident may increase the salience of credit information, increase the cost of acquiring/retaining
credit, or encourage increased monitoring of credit reports and/or scores. Identity theft victims
experience a number of negative feelings (e.g., shock, anger, anxiety) that may be action-
inducing because of the seriousness of the event in a way that additional disclosures or reminders
are not. Evidence from the NCVS shows that the number of victims who acknowledged checking
their credit report increased by up to 15 percentage points upon victimization, and the number of
victims who checked their bank or credit card statements increased by up to 26 percentage
points.14
Although we cannot directly test the inattention hypothesis with our data, our empirical
results are suggestive that a behavior change occurred after the fraud incident. In particular, the
persistent changes we observe across multiple credit outcomes provide suggestive evidence of
improved attention immediately after identity theft. Most importantly, in Figure 3, we observe
that individuals experience fewer severe negative credit outcomes, such as accounts in
collections or past due, in the quarters after identity theft. Our evidence that these measures are
significantly and persistently lower throughout the post-theft period is consistent with consumers
paying more attention to their credit information and possibly managing their accounts better. On
the other hand, these results are inconsistent with the idea of a simple mechanical adjustment to
14 These statistics are based on authors’ calculations using the public-use NCVS Identity Theft Supplement data set.
19
credit outcomes because of one-time removal of fraudulent information from consumers’ credit
files.
6.3 Which Consumers Improve Their Performance?
The increases in average Risk Score — and, consequently, the share of consumers who are prime
credit risks — several years following identity theft that we documented in the previous section
have potentially far-reaching economic consequences, as they may allow borrowers to obtain
more credit and at better terms. For example, on average, the annual percentage rate (APR) on a
30-year, fixed-rate mortgage decreases from 4.7 percent to 3.7 percent when a borrower moves
from the 620–639 FICO score range to the 660–679 range.15 Bracha and Meier (2015) show that
moving from the 620–679 score range to the 680–739 range can decrease credit card interest
rates by 3.5 percentage points (from 19.1 percent to 15.5 percent, on average). Thus, positive
changes in the Risk Score may allow borrowers to save on financing expenses and have more
access to credit to smooth negative income or expense shocks.
While any increase in credit scores may improve credit access and terms of credit,
crossing into a higher score “bucket” is especially beneficial. While there are several thresholds
in scores affecting creditworthiness, the most significant is the subprime-prime distinction as
documented extensively in the previous literature. We, therefore, focus on the group of
consumers who crossed this threshold after identity theft. We define consumers as transitioning
from the subprime to prime status if their Risk Scores are less than or equal to 660 in any of the
four quarters before identity theft and are more than 660 at the time of alert filing or any of the
four quarters after filing (we use data on Scores in a few quarters before Q1:2008 and after
Q3:2013 to assign consumers into the subprime-to-prime transition group).
To provide additional support for this distinction and motivation to study this group of
consumers, we document changes in credit performance of the subprime-to-prime transition
group in Figure 4. Comparing results in Figure 4 (subprime-to-prime transition group) to the
results in Figures 2 and 3 (all borrowers), we can conclude that the subprime-to-prime transition
group experiences improvements in credit performance that are three to five times the magnitude
for all consumers. For example, the long-term increase in Risk Scores after identity theft was 10
15 This example is based on the national average mortgage interest rates provided by FICO on August 8, 2016.
20
points for all consumers. For the subprime-to-prime consumers, it is nearly 50 points in the year
after fraud and slowly declining to a relatively steady level of about 30 extra points compared to
the pre-theft levels. In general, the subprime-to-prime transition group experiences considerably
larger improvements in credit performance, although the magnitude of the increase is more likely
to diminish over time. Whereas, for all consumers the improvements in performance are
considerably lower but somewhat more persistent over time.
Next we turn to an examination of the ways in which consumers — specifically, the
subprime-to-prime transition consumers — use their improved creditworthiness in interactions
with the credit markets following severe identity theft.
6.4 Consumer Use of Improved Credit Standing After Identity Theft
In this section, we consider how consumers use credit after identity theft and whether lenders
alter the supply of credit to these individuals. While some identity theft victims appear to be
more creditworthy after cleaning up their files (as we document in the previous sections), we
examine if these consumers apply and receive more credit from lenders, which particular types
of credit they receive, and how they perform on this additional debt. We show results for the
subprime-to-prime transition group in Figures 5–7. These figures depict the changes in the use of
credit cards (Figure 5), auto loans (Figure 6), and mortgage loans (Figure 7). The comparable
results for all filers can be found in Appendix Figures A2–A4.
When it comes to credit cards, the majority of changes to credit card accounts appears to
occur in the first year following a fraud alert filing. In Figure 5, panel A shows that around 1
percent of consumers become new credit card holders in a few quarters preceding and following
identity theft. We define a new cardholder as someone who transitions from having no cards in
the previous quarter to having at least one card in the current quarter. It is important to note that
the probability of becoming a new cardholder can increase because of identity theft or legitimate
activities of consumers.
Figure 5, panel B shows that more consumers in the subprime-to-prime transition group
reduce their total number of credit cards after initial increases in cards at the time of identity
theft. On average, consumers have 0.2 fewer cards in the year after identity theft compared with
their pre-theft levels, which is a 10 percent decrease over the sample average of two cards per
21
consumer. Total card balances (panel C) and total card limits (panel D) mirror the reduction in
the number of cards in panel B. Some previous studies argue that card limits can capture the
supply of unsecured credit, while card balances represent the demand for such credit (e.g., Gross
and Souleles, 2002). Based on these definitions, both the supply of and demand for unsecured
credit seem to contract in the year following identity theft. However, in the long run, card
balances, limits, number of cards, and the probability to become a new cardholder return to pre-
fraud levels.
We present the changes in automobile borrowing (auto loans) after identity theft in
Figure 6. Panel A shows that around 1 percent of consumers in the subprime-to-prime transition
group become new auto loan holders (defined as switching from zero loans to a positive number
of loans) in each of the three quarters following identity theft. This is a significant effect since,
on average, only 2.2 percent of consumers become new auto loan holders per quarter in our
sample (see Table 1). The average number of auto loans (panel B) increases by about 0.1 by the
end of the second post-theft year, which is a 20 percent increase relative to the sample average.
Auto loan balances (panel C) also increase to around $3,500 relative to the pre-theft levels,
which is a 50 percent increase relative to the mean balances. Even with this new credit, the share
of auto balances in good standing (current or paid as agreed) increases significantly (panel D).
These results for auto loans are significant for a number of reasons. First, auto loans are
used to finance purchases of automobiles, which are durable consumption goods. Thus, we find
evidence that some identity theft victims use their improved creditworthiness to finance durable
consumption. Second, we do not find evidence that consumers withdraw from the credit markets
after identity theft. To the contrary, some consumers use their better creditworthiness to borrow
more and finance consumption. Third, despite additional debt, these consumers still perform well
on these new loans.
Next, we examine the use of mortgage credit after identity theft and summarize our
results in Figure 7. Similar to the auto loan results, we find that a significant number of
consumers in the subprime-to-prime transition group become new mortgage holders after
identity theft (panel A). Around 1 percent to 1.5 percent of these consumers become new
mortgage holders in the first six quarters post-theft. The number of mortgages (panel B) grows
after identity theft to a cumulative effect of 0.25 additional mortgages (these credit products have
long maturities, so the cumulative effect on them may be larger than for other products that are
22
designed to be repaid faster). Panel C shows that mortgage loan balances gently increase as a
result of new mortgage activity relative to the pre-theft levels. As with auto loans, the share of
mortgage balances in good standing (panel D) increases significantly after fraud by around 0.02,
although the effect is not precisely estimated for quarters later in our period of observation.
Overall, the subprime-to-prime transition group shows clear evidence of increased credit
usage following the experienced improvement in creditworthiness after identity theft. Despite
holding additional auto and mortgage loans and increased balances for these credit products,
consumers continue to perform better (or, at least, no worse than before theft) on these accounts
for at least five years following identity theft. Interestingly, looking at panel A of each of the
product charts (Figures 5–7), it appears that credit cards are the only product with increased
activity prior to alert filing, which may include fraud, while auto loans or mortgages do not show
such activity. This pattern is consistent with the idea that identity theft fraud is more prevalent in
credit cards than mortgages or auto loans.
7. Robustness Checks
7.1 Controlling for Long-Term Event Time Trends
As can be seen in Figure 4, panel D, some credit variables, such as Risk Score, may have long-
term trends in event time. These long-term trends may be explained by mean reversion in Risk
Score and other variables. For example, positive changes in Risk Scores may attrite simply
because the effects of credit information corrections or fraud removal decrease over time as they
receive less weight in the current Score.
To separate the effect of mean reversion in credit variables from the longer-term effects
of fraud, we estimate the following parametric model adopted from Dobkin et al. (2018):
𝑌𝑌𝑖𝑖𝑖𝑖 = 𝛽𝛽0 + 𝛽𝛽1𝑒𝑒 + 𝛽𝛽2𝑒𝑒2 + 𝛽𝛽31𝑒𝑒≥0 + 𝛽𝛽41𝑒𝑒≥0 × 𝑒𝑒 + 𝛽𝛽51𝑒𝑒≥0 × 𝑒𝑒2 + 𝛽𝛽61−4≤𝑒𝑒≤−1 +
𝛽𝛽71−4≤𝑒𝑒≤−1 × 𝑒𝑒 + 𝛿𝛿𝑖𝑖 + 𝑋𝑋𝑖𝑖𝑖𝑖𝛾𝛾 + 𝜀𝜀𝑖𝑖𝑖𝑖 .
(2)
In this specification, e denotes fraud event time (from −22 to 22), 1𝑒𝑒≥0 is an indicator
variable equal to 1 for nonnegative event time, and 1−4≤𝑒𝑒≤−1 is an indicator variable for the
event time periods from 𝑒𝑒 = −4 to 𝑒𝑒 = −1. All other variables are as defined in Equation (1).
23
The specification in this model is motivated by the patterns in the data observed using the
nonparametric specification in Equation (1). In particular, our earlier results show evidence of
fraud shortly before alert filing and a discontinuous change in credit attributes at the time of alert
filing. These two patterns motivate us to allow for discontinuous (intercept) shifts at the time of
fraud (𝑒𝑒 = −4 to 𝑒𝑒 = −1) and after fraud (𝑒𝑒 ≥ 0). We also allow for a quadratic trend in event
time. However, because this trend may shift after fraud, we interact the quadratic trend with the
positive time indicator. Finally, we interact the linear component of the trend with the fraud time
indicator.16 While the specification in Equation (2) does not allow for individual specific trends
in event time, we relax this constraint in Section 7.4 and find very similar results.
Table 3 summarizes results for the 20 credit outcomes we consider estimated using
Equation (2). The coefficients on the event time variables in this table reveal the presence of
trends independent of the treatment (victimization) in some credit variables. Even after
controlling for the long-run trends in these variables, we find effects of fraud on credit attributes
on impact, which are similar to our results in Figures 2–3 and A2–A4. There is some attrition in
these initial effects, as indicated by the interactions of time trends with the after-fraud indicator
variable. For example, the coefficients on the interactions indicate that about 4 points of the
initial jump in the Risk Score dissipate 11 quarters after the fraud event. Overall, these results are
very similar to our main results obtained without controlling for long-term event time trends.
7.2 Balanced Panel
As we describe in detail in Section 4, our main data set is balanced in calendar time (all
individuals are observed in every quarter between Q1:2008 and Q3:2013), but, by design, these
data are not balanced in event time. This is because we include all consumers who file extended
fraud alerts in this period and, thus, some of them will be observed for many quarters before alert
filing (e.g., a 2013 filer), while others will have mostly post-filing history (e.g., a 2008 filer).
One concern with this feature of the data is that we rely on different cohorts of filers to estimate
effects pre-fraud and post-fraud. To address this concern, we expand our data set to include
credit outcomes from Q1:2003 to Q1:2019 for all fraud alert filers that appear in the FRBNY
16 Since there are only four periods for which the fraud time indicator is equal to 1, we do not interact it with the square of event time to avoid multicollinearity.
24
CCP/Equifax and who filed their fraud alerts between Q1:2008 and Q3:2013. With this
expansion, every fraud victim is linked with outcome data for up to 24 quarters before alert filing
and up to 22 quarters after fraud. In addition, we balance this panel in event time by removing all
individuals who are not present in the data in event quarter -22 and 22 (people may have no data
because they have not entered the FRBNY CCP/Equifax yet or they exited it because of death or
migration). These restrictions reduce the sample to 42,799 individuals. We report results for this
sample balanced in event time in Appendix Figures A5–A9. The results are largely comparable
to our base results reported in Figures 2–3 and A2–A4.
7.3 Heterogeneous Effects: Consumers without Credit Inquiries Before Fraud
To understand whether the effects of identity theft vary depending on the credit characteristics of
the borrower, we study the effects of fraud on consumers without credit inquiries before and at
the time of identity theft and compare these effects with the results for all consumers. Credit
inquiries may capture two activities: (1) shopping for credit by consumers, and (2) shopping for
credit by criminals using stolen consumer personal information. We hypothesize that consumers
without inquiries may be (1) less attached to the credit market and less attentive to their credit
information, and (2) subject to existing account fraud or other fraud that does not result in credit
inquiries. Studying consumers without credit inquires also allows us to test if our base results are
affected by reverse causality, where some consumers shop for credit, discover fraud, and then
clean their credit bureau files.
Results for the estimation of Equation (1) for consumers without inquiries in the three
quarters before and the quarter of fraud can be found in Appendix Figures A10–A14. Even
though we use data for Q1:2008–Q3:2013 in these figures, we rely on credit inquiries data in a
few quarters before Q1:2008 and after Q3:2013 to assign consumers into this category. The
decline in credit inquiries at the time of fraud shown in panel A of Figure A10 is mechanical (we
only include people without inquiries in this period), but the other results are not. Our results
suggest that no-inquiry fraud victims experience larger positive effects after victimization on
credit performance indicators (e.g., incidence of derogatory events and third-party collections,
share of card balances current, Risk Score). This finding might suggest that this subgroup of
consumers exhibited more inattention before the fraud than the victim population as a whole.

25
The results for no-inquiry victims in Figures A12–A14 are in general similar to the results for the
whole population of alert filers. These consumers reduce their credit card activity but obtain
more mortgage credit, increase auto loan balances, and keep more balances in good standing.
These consumers still apply for credit after fraud as suggested by the number of inquiries in
Figure A11. Overall, the findings for no-inquiry consumers suggest that these consumers are
similar to all consumers and they do not withdraw from credit markets and use their improved
creditworthiness to obtain new credit.
7.4 Controlling for Individual-Level Mean Reversion
As mentioned previously, the econometric model in Equation (2) assumes a common mean
reversion for all individuals in both the pre- and post-alert filing time periods. If there is
substantial heterogeneity in mean reversion across individuals, imposing a common mean
reversion across individuals may mask the true effect of fraud on individuals. Because of the
granular nature of our data, we have a long-time series for each individual in our sample, which
can allow for panels to have their own individual time trends.
To distinguish the effect of mean reversion from that of fraud, we specify a model similar
to that of Musto (2004):
𝑌𝑌𝑖𝑖𝑖𝑖 = 𝛽𝛽0 + 𝛿𝛿𝑖𝑖 + 𝛿𝛿𝑖𝑖 × 𝑡𝑡 + 𝛿𝛿𝑖𝑖 × 𝑡𝑡2 + 𝛽𝛽1𝐷𝐷𝑖𝑖𝑖𝑖 + 𝛼𝛼𝑖𝑖 + 𝜀𝜀𝑖𝑖𝑖𝑖 , (3)
where 𝛿𝛿𝑖𝑖 is an individual fixed effect to be estimated and 𝛿𝛿𝑖𝑖 × 𝑡𝑡 + 𝛿𝛿𝑖𝑖 × 𝑡𝑡2 is an individual-level
quadratic time trend.17 The variable of interest in this specification is 𝐷𝐷𝑖𝑖𝑖𝑖, an indicator variable
equal to 1 when individual 𝑖𝑖 has an extended fraud alert filed at time 𝑡𝑡. This variable captures the
difference in a variable of interest between the times before and after filing an extended fraud
alert. By specifying an individual quadratic time trend for each consumer, we can more precisely
separate the effect of mean reversion from the effect of the extended fraud alert.
We present results of this analysis with the specification in Equation (3) for all our
variables of interest in Appendix Table A1. In most cases, the estimates are quantitatively similar
to those previously reported and highly statistically significant. After controlling for individual
17 As mentioned in the previous sections, use of individual-level quadratic time trends is motivated by heterogeneity and non-linearity in trends in credit outcomes observed in the data. Estimates using a linear time trend produce similar results.
26
fixed effects and individual mean reversion, we find that post-theft identity theft victims gain 14
points in Risk Scores, 1 percent of them reverse address changes, and they have more card
balances in good standing and lower incidence of third-party collection and major derogatory
events. Reported 𝑅𝑅2 is high because the estimated individual effects, along with the individual
quadratic time trends, account for a significant portion of the variation in these credit variables.
8. Discussion and Conclusion
This paper uses a unique data set of anonymized U.S. credit bureau records, including details on
extended fraud alert filings, to examine the effects of identity theft on Risk Scores, access to
credit, and credit portfolios. We classify those individuals who place an extended fraud alert in
their credit bureau files as the most likely identity theft victims because this type of fraud alert
requires them to file a police report (with accompanying evidence of identity theft and penalties
for misrepresenting this information). The nature of the extended fraud alert filing system and
our data provide us with unique advantages relative to other studies of consumer financial fraud.
In particular, given the high burden of proof necessary to file an alert, our analysis is highly
unlikely to suffer from Type I errors, providing strong internal validity for our results.
Our findings may not be generalizable to all identity theft victims as most victims do not
file an alert. However, comparing characteristics of identity theft victims who file and do not file
alerts, which are summarized in Table 2, we can conclude that fraud alert filers are similar to
nonfiling victims along many dimensions. The most significant differences between victims who
file and do not file an alert are the presence and size of out-of-pocket (OOP) losses and race.
Based on the size of OOP losses, we argue that alert filers are more likely to be victims of more
severe identity theft and have a higher chance to experience OOP losses and lose more OOP than
a typical identity theft victim. Even for this population of more severe cases of identity theft, we
do not find evidence of persistent credit profile damage from identity theft.
In addition, our results show that shortly before alert filing, identity theft decreases the
average Risk Scores of victims and increases new (likely fraudulent) card accounts, inquiries,
and instances of reverse address changes. The negative effects stemming directly from identity
theft generally persist between one and two quarters. After these initial effects are removed, Risk
Scores of fraud victims rise by an average of 10 points, increasing the proportion of fraud
27
victims with prime Scores by 5 percentage points, or 11 percent. For many consumers, this effect
is persistent over time and remains for as long as 20 quarters after the fraud (at approximately 10
points in the long term). We also find that victims have more card balances in good standing and
a lower average incidence of derogatory events and third-party collections. The persistence of the
reduction in the incidence of major derogatory and third-party collection events is particularly
striking.
We also document that some victims take advantage of their improved financial standing
to obtain additional credit. In particular, we find evidence that those individuals who transition
from being subprime to prime consumers obtain additional auto loans and mortgages. We
observe increases in the number of new loans, total loans, and balances for these individuals.
This finding is especially important because car loans and mortgages are used to finance large
durable consumption purchases or investment in real estate. Despite having additional loans and
higher balances on them, this population manages their credit as well as or better than before
identity theft by keep a larger fraction of balances in good standing.
Our empirical results provide robust evidence that allow us to evaluate the plausibility of
a number of potential drivers for the identified effects and their persistence. In particular, we
argue that limited attention may play an important role in explaining the behavior of identity
theft victims. The asymmetric positive impact on key credit variables upon impact of identity
theft, where credit performance improved by more after the event than it deteriorated before the
event, suggests that consumers were not focused on their credit reports prior to victimization.
The persistent improvement over time to consumer credit attributes suggests at least two
conclusions. First, consumers may be paying increased attention to their credit and credit reports
for a substantial period after identity theft. Second, the fact that some consumers apply and
obtain additional credit may imply that they take advantage of their better creditworthiness and
do not shy away from credit markets. These are important findings to understand the impact of
identity theft on the interactions of consumers with credit markets after identity theft incidents.
28
References
Acquisti, A. 2004. “Privacy and Security of Personal Information.” In Economics of Information Security, edited by L. Jean Camp and Stephen Lewis, 179–186. Boston: Kluwer Academic Publishers.
Agrawal, A., J. Jaffe, and J. Karpoff. 1999. “Management Turnover and Governance Changes
Following the Revelation of Fraud.” Journal of Law & Economics 42, 309–342. Anderson, R., and T. Moore. 2007. “Information Security Economics — and Beyond.” In
Advances in Cryptology — CRYPTO 2007, edited by Alfred Menezes, 68–91. New York: Springer Berlin Heidelberg.
Barber, B., and T. Odean. 2008. “All That Glitters: The Effect of Attention on the Buying
Behavior of Individual and Institutional Investors.” Review of Financial Studies 21, 785–818. Bordalo, P., N. Gennaioli, and A. Shleifer. 2013a. “Salience and Asset Prices.” American
Economic Review: Papers & Proceedings 103, 623–628. Bordalo, P., N. Gennaioli, and A. Shleifer. 2013b. “Salience and Consumer Choice.” Journal of
Political Economy 121, 803–843. Bos, M., E. Breza, and A. Liberman. 2018. “The Labor Market Effects of Credit Market
Information.” Review of Financial Studies 31(6), 2005–2037. Bracha, A., and S. Meier. 2015. “Nudging Credit Scores in the Field: The Effect of Text
Reminders on Creditworthiness in the United States.” Federal Reserve Bank of Boston Working Paper 15-2.
Cheney, J. 2003. “Identity Theft: A Pernicious and Costly Fraud.” Federal Reserve Bank of
Philadelphia Payment Cards Center Discussion Paper 03-18. Cheney, J., R. Hunt, K. Jacob, R. Porter, and B. Summers. 2012. “The Efficiency and Integrity of
Payment Card Systems: Industry Views on the Risks Posed by Data Breaches.” Federal Reserve Bank of Philadelphia Payment Cards Center Discussion Paper 12-04.
Cheney, J., R. Hunt, V. Mikhed, D. Ritter, and M. Vogan. 2014. “Consumer Use of Fraud Alerts
and Credit Freezes: An Empirical Analysis.” Federal Reserve Bank of Philadelphia Payment Cards Center Discussion Paper 14-04.
DellaVigna, S. 2009. “Psychology and Economics: Evidence from the Field.” Journal of
Economic Literature 47, 315–372. DellaVigna, S., and J. Pollet. 2009. “Investor Inattention and Friday Earnings Announcements.”
Journal of Finance 64, 709–749.
29
Dimmock, S., and W. Gerken. 2012. “Predicting Fraud by Investment Managers.” Journal of Financial Economics 105, 153–173.
Dimmock, S., W. Gerken, and N. Graham. 2018. “Is Fraud Contagious? Coworker Influence on
Misconduct by Financial Advisors.” Journal of Finance 73(3), 1417–1450. Dobbie, W., P. Goldsmith-Pinkham, N. Mahoney, and J. Song. 2016. “Bad Credit, No Problem?
Credit and Labor Market Consequences of Bad Credit Reports.” National Bureau of Economic Research Working Paper 22711.
Dobkin, C., A. Finkelstein, R. Kluender, and M. Notowidigdo. 2018. “The Economic
Consequences of Hospital Admissions.” American Economic Review 108(2), 308‒352. Dyck, A., A. Morse, and L. Zingales. 2010. “Who Blows the Whistle on Corporate Fraud?”
Journal of Finance 65, 2213–2253. Dyck, A., A. Morse, and L. Zingales. 2014. “How Pervasive Is Corporate Fraud?” Rotman
School of Management Working Paper 2222608. Egan, M., G. Matvos, and A. Seru. 2019. “The Market for Financial Adviser Misconduct.”
Journal of Political Economy 127(1), 233‒295. Federal Trade Commission. 2003. Identity Theft Survey Report. Washington, D.C.: Federal
Trade Commission. Federal Trade Commission. 2012. Report to Congress Under Section 319 of the Fair and
Accurate Credit Transactions Act of 2003. Washington, D.C.: Federal Trade Commission. Gabaix, X., and D. Laibson. 2000. “A Boundedly Rational Decision Algorithm.” American
Economic Review 90, 433–438. Gabaix, X., and D. Laibson. 2001. “The 6D Bias and the Equity Premium Puzzle.” NBER
Macroeconomics Annual 16, 257–312. Gabaix, X., D. Laibson, G. Moloche, and S. Weinberg. 2006. “Costly Information Acquisition:
Experimental Analysis of Boundedly Rational Model.” American Economic Review 96, 1043–1068.
Gallagher, J. 2014. “Learning About an Infrequent Event: Evidence from Flood Insurance Take-
Up in the United States.” American Economic Journal: Applied Economics 6, 206–233. Giannetti, M., and T. Yue Yang. 2016. “Corporate Scandals and Household Stock Market
Participation.” Journal of Finance 71, 2591–2636. Gross, D., and N. Souleles. 2002. “An Empirical Analysis of Personal Bankruptcy and
Delinquency.” Review of Financial Studies 15, 319–47.
30
Gross, T., M. Notowidigdo, and J. Wang. 2020. “The Marginal Propensity to Consume over the Business Cycle.” American Economic Journal: Macroeconomics 12(2), 351–384.
Grubb, M. 2015. “Consumer Inattention and Bill-Shock Regulation.” Review of Economic
Studies 82, 219–257. Gurun, U., N. Stoffman, and S. Yonker. 2018. “Trust Busting: The Effect of Fraud on Investor
Behavior.” Review of Financial Studies 31, 1341–1376. Harrell, E. 2019. “Victims of Identity Theft, 2016.” U.S. Department of Justice, Bureau of
Justice Statistics, Bulletin NCJ 251147. Herkenhoff, K., G. Phillips, and E. Cohen-Cole. 2018. “The Impact of Consumer Credit Access
on Self-Employment and Entrepreneurship.” Social Science Research Network Working Paper 3305920.
Hirshleifer, D., S. Seongyeon Lim, and S. Hong Teoh. 2009. “Driven to Distraction: Extraneous
Events and Underreaction to Earnings News.” Journal of Finance 64, 2289–2325. Hirshleifer, D., S. Seongyeon Lim, and S. Hong Teoh. 2011. “Limited Investor Attention and
Stock Market Misreactions to Accounting Information.” Review of Asset Pricing Studies 1, 35–73.
Kahn, C., and J. Liñares-Zegarra. 2016. “Identity Theft and Consumer Payment Choice: Does
Security Really Matter?” Journal of Financial Services Research 50, 121–159. Khanna, V., E. Kim, and Y. Lu. 2015. “CEO Connectedness and Corporate Fraud.” Journal of
Finance 70, 1203–1252. Kosse, A. 2013. “Do Newspaper Articles on Card Fraud Affect Debit Card Usage?” Journal of
Banking and Finance 37, 5382–5391. Lacetera, N., D. Pope, and J. Sydnor. 2012. “Heuristic Thinking and Limited Attention in the Car
Market.” American Economic Review 102, 2206–2236. Lee, D., and W. van der Klaauw. 2010. “An Introduction to the FRBNY Consumer Credit
Panel.” Federal Reserve Bank of New York Staff Report 479. Musto, D. 2004. “What Happens When Information Leaves a Market? Evidence from
Postbankruptcy Consumers.” Journal of Business 77, 725–748. Piskorski, T., A. Seru, and J. Witkin. 2015. “Asset Quality Misrepresentation by Financial
Intermediaries: Evidence from the RMBS Market.” Journal of Finance 70, 2635–2678. Povel, P., R. Singh, and A. Winton. 2007. “Booms, Busts, and Fraud.” Review of Financial
Studies 20, 1219–1254.
31
Qureshi, H., and J. Sokobin. 2015. “Do Investors Have Valuable Information About Brokers?” FINRA Office of the Chief Economist Working Paper.
Stango, V., and J. Zinman. 2014. “Limited and Varying Consumer Attention: Evidence from
Shocks to the Salience of Bank Overdraft Fees.” Review of Financial Studies 27, 990–1030. Stavins, J. 2013. “Security of Retail Payments: The New Strategic Objective.” Federal Reserve
Bank of Boston Public Policy Discussion Paper 13-9. Sullivan, R. 2010. “The Changing Nature of U.S. Card Payment Fraud: Industry and Public
Policy Options.” Federal Reserve Bank of Kansas City Economic Review (Second Quarter 2010).
Wardrip, K., and R. Hunt. 2013. “Residential Migration, Entry, and Exit as Seen Through the
Lens of Credit Bureau Data.” Federal Reserve Bank of Philadelphia Payment Cards Center Discussion Paper 13-04.
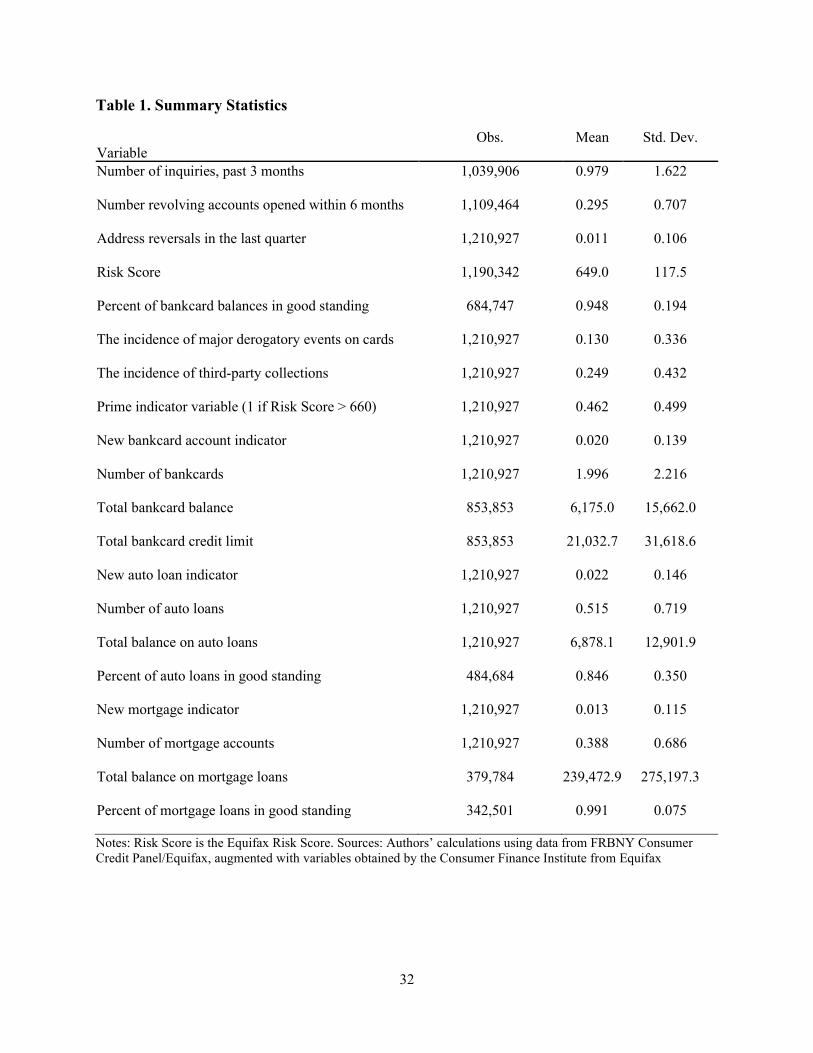
32
Table 1. Summary Statistics
Variable Obs. Mean Std. Dev.
Number of inquiries, past 3 months 1,039,906 0.979 1.622
Number revolving accounts opened within 6 months 1,109,464 0.295 0.707
Address reversals in the last quarter 1,210,927 0.011 0.106
Risk Score 1,190,342 649.0 117.5
Percent of bankcard balances in good standing 684,747 0.948 0.194
The incidence of major derogatory events on cards 1,210,927 0.130 0.336
The incidence of third-party collections 1,210,927 0.249 0.432
Prime indicator variable (1 if Risk Score > 660) 1,210,927 0.462 0.499
New bankcard account indicator 1,210,927 0.020 0.139
Number of bankcards 1,210,927 1.996 2.216
Total bankcard balance 853,853 6,175.0 15,662.0
Total bankcard credit limit 853,853 21,032.7 31,618.6
New auto loan indicator 1,210,927 0.022 0.146
Number of auto loans 1,210,927 0.515 0.719
Total balance on auto loans 1,210,927 6,878.1 12,901.9
Percent of auto loans in good standing 484,684 0.846 0.350
New mortgage indicator 1,210,927 0.013 0.115
Number of mortgage accounts 1,210,927 0.388 0.686
Total balance on mortgage loans 379,784 239,472.9 275,197.3
Percent of mortgage loans in good standing 342,501 0.991 0.075
Notes: Risk Score is the Equifax Risk Score. Sources: Authors’ calculations using data from FRBNY Consumer Credit Panel/Equifax, augmented with variables obtained by the Consumer Finance Institute from Equifax
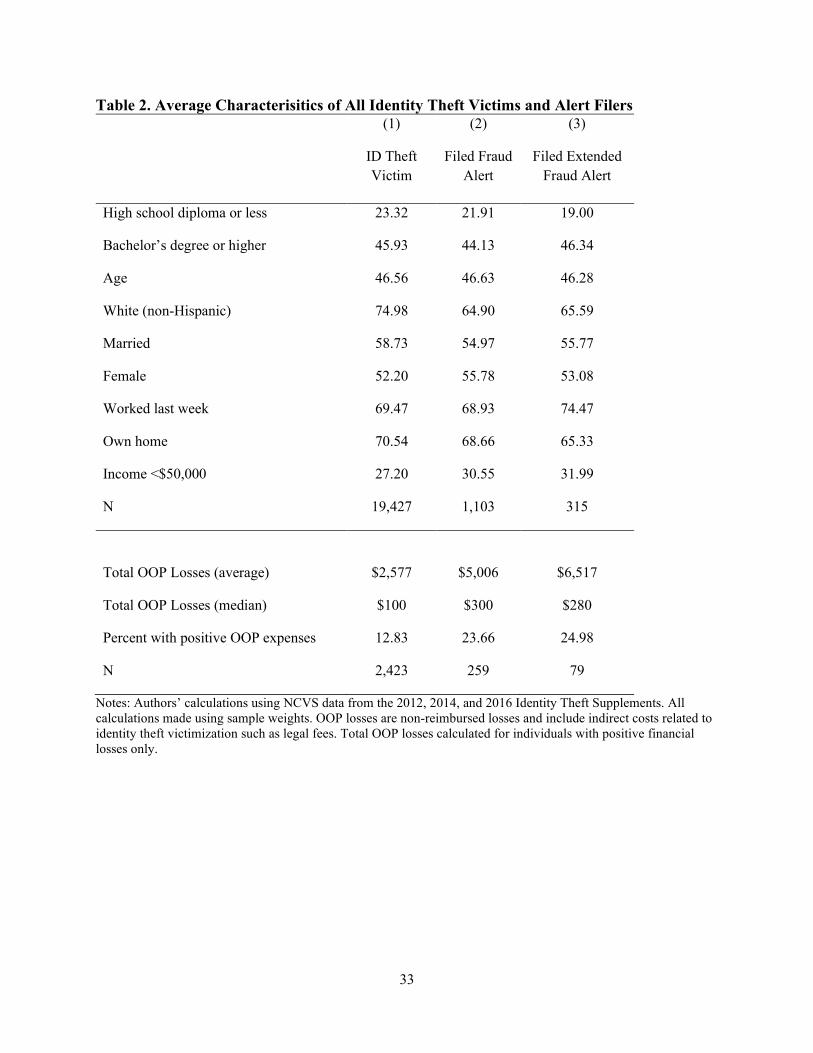
33
Table 2. Average Characterisitics of All Identity Theft Victims and Alert Filers (1)
ID Theft Victim
(2)
Filed Fraud Alert
(3)
Filed Extended Fraud Alert
High school diploma or less 23.32 21.91 19.00
Bachelor’s degree or higher 45.93 44.13 46.34
Age 46.56 46.63 46.28
White (non-Hispanic) 74.98 64.90 65.59
Married 58.73 54.97 55.77
Female 52.20 55.78 53.08
Worked last week 69.47 68.93 74.47
Own home 70.54 68.66 65.33
Income <$50,000 27.20 30.55 31.99
N 19,427 1,103 315
Total OOP Losses (average) $2,577 $5,006 $6,517
Total OOP Losses (median) $100 $300 $280
Percent with positive OOP expenses 12.83 23.66 24.98
N 2,423 259 79
Notes: Authors’ calculations using NCVS data from the 2012, 2014, and 2016 Identity Theft Supplements. All calculations made using sample weights. OOP losses are non-reimbursed losses and include indirect costs related to identity theft victimization such as legal fees. Total OOP losses calculated for individuals with positive financial losses only.
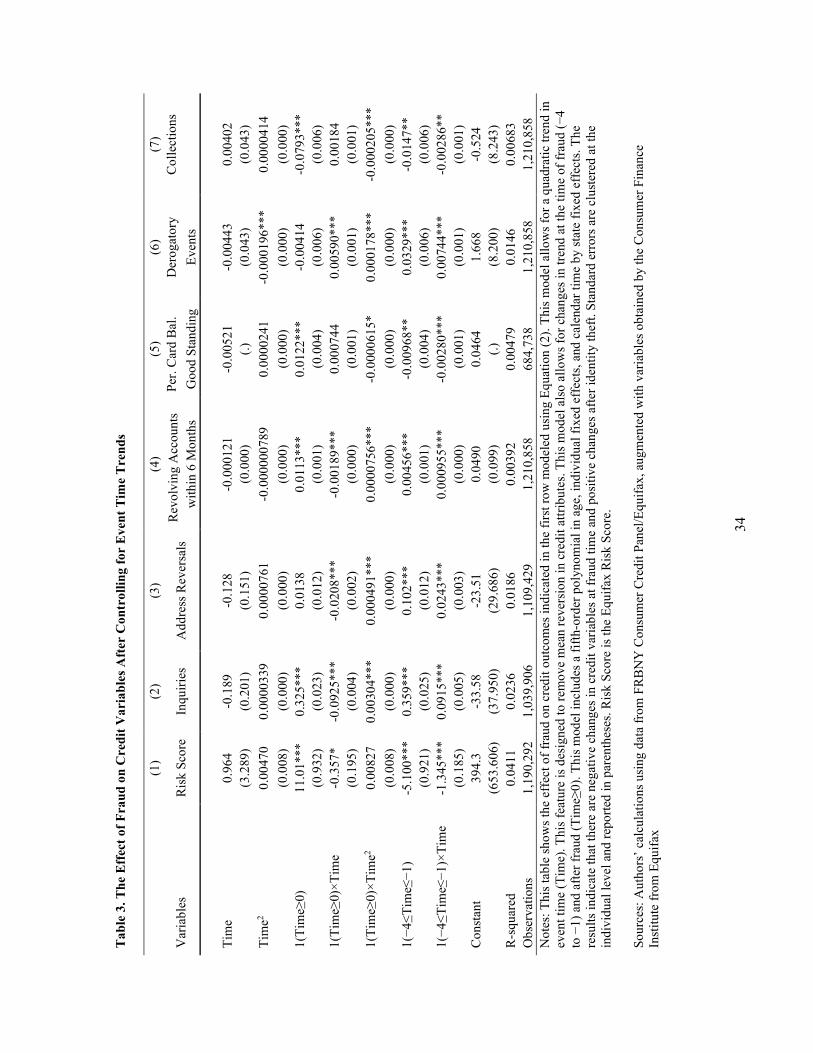
34
Tab
le 3
. The
Eff
ect o
f Fra
ud o
n C
redi
t Var
iabl
es A
fter
Con
trol
ling
for
Eve
nt T
ime
Tre
nds
(1
) (2
) (3
) (4
) (5
) (6
) (7
)
Var
iabl
es
Ris
k Sc
ore
Inqu
iries
A
ddre
ss R
ever
sals
R
evol
ving
Acc
ount
s Pe
r. C
ard
Bal
. D
erog
ator
y C
olle
ctio
ns
with
in 6
Mon
ths
Goo
d St
andi
ng
Even
ts
Tim
e 0.
964
-0.1
89
-0.1
28
-0.0
0012
1 -0
.005
21
-0.0
0443
0.
0040
2
(3.2
89)
(0.2
01)
(0.1
51)
(0.0
00)
(.)
(0.0
43)
(0.0
43)
Tim
e2 0.
0047
0 0.
0000
339
0.00
0076
1 -0
.000
0007
89
0.00
0024
1 -0
.000
196*
**
0.00
0041
4
(0
.008
) (0
.000
) (0
.000
) (0
.000
) (0
.000
) (0
.000
) (0
.000
) 1(
Tim
e≥0)
11
.01*
**
0.32
5***
0.
0138
0.
0113
***
0.01
22**
* -0
.004
14
-0.0
793*
**
(0
.932
) (0
.023
) (0
.012
) (0
.001
) (0
.004
) (0
.006
) (0
.006
) 1(
Tim
e≥0)
×Tim
e -0
.357
* -0
.092
5***
-0
.020
8***
-0
.001
89**
* 0.
0007
44
0.00
590*
**
0.00
184
(0
.195
) (0
.004
) (0
.002
) (0
.000
) (0
.001
) (0
.001
) (0
.001
) 1(
Tim
e≥0)
×Tim
e2 0.
0082
7 0.
0030
4***
0.
0004
91**
* 0.
0000
756*
**
-0.0
0006
15*
0.00
0178
***
-0.0
0020
5***
(0
.008
) (0
.000
) (0
.000
) (0
.000
) (0
.000
) (0
.000
) (0
.000
) 1(
−4≤T
ime≤
−1)
-5.1
00**
* 0.
359*
**
0.10
2***
0.
0045
6***
-0
.009
68**
0.
0329
***
-0.0
147*
*
(0.9
21)
(0.0
25)
(0.0
12)
(0.0
01)
(0.0
04)
(0.0
06)
(0.0
06)
1(−4
≤Tim
e≤−1
)×Ti
me
-1.3
45**
* 0.
0915
***
0.02
43**
* 0.
0009
55**
* -0
.002
80**
* 0.
0074
4***
-0
.002
86**
(0.1
85)
(0.0
05)
(0.0
03)
(0.0
00)
(0.0
01)
(0.0
01)
(0.0
01)
Con
stan
t 39
4.3
-33.
58
-23.
51
0.04
90
0.04
64
1.66
8 -0
.524
(653
.606
) (3
7.95
0)
(29.
686)
(0
.099
) (.)
(8
.200
) (8
.243
) R
-squ
ared
0.
0411
0.
0236
0.
0186
0.
0039
2 0.
0047
9 0.
0146
0.
0068
3 O
bser
vatio
ns
1,19
0,29
2 1,
039,
906
1,10
9,42
9 1,
210,
858
684,
738
1,21
0,85
8 1,
210,
858
Not
es: T
his t
able
show
s the
eff
ect o
f fra
ud o
n cr
edit
outc
omes
indi
cate
d in
the
first
row
mod
eled
usi
ng E
quat
ion
(2).
This
mod
el a
llow
s for
a q
uadr
atic
tren
d in
ev
ent t
ime
(Tim
e). T
his f
eatu
re is
des
igne
d to
rem
ove
mea
n re
vers
ion
in c
redi
t attr
ibut
es. T
his m
odel
als
o al
low
s for
cha
nges
in tr
end
at th
e tim
e of
frau
d (−
4 to
−1)
and
afte
r fra
ud (T
ime≥
0). T
his m
odel
incl
udes
a fi
fth-o
rder
pol
ynom
ial i
n ag
e, in
divi
dual
fixe
d ef
fect
s, an
d ca
lend
ar ti
me
by st
ate
fixed
eff
ects.
The
re
sults
indi
cate
that
ther
e ar
e ne
gativ
e ch
ange
s in
cred
it va
riabl
es a
t fra
ud ti
me
and
posi
tive
chan
ges a
fter i
dent
ity th
eft.
Stan
dard
err
ors a
re c
lust
ered
at t
he
indi
vidu
al le
vel a
nd re
porte
d in
par
enth
eses
. Ris
k Sc
ore
is th
e Eq
uifa
x R
isk
Scor
e.
Sour
ces:
Aut
hors
’ cal
cula
tions
usi
ng d
ata
from
FR
BN
Y C
onsu
mer
Cre
dit P
anel
/Equ
ifax,
aug
men
ted
with
var
iabl
es o
btai
ned
by th
e C
onsu
mer
Fin
ance
In
stitu
te fr
om E
quifa
x
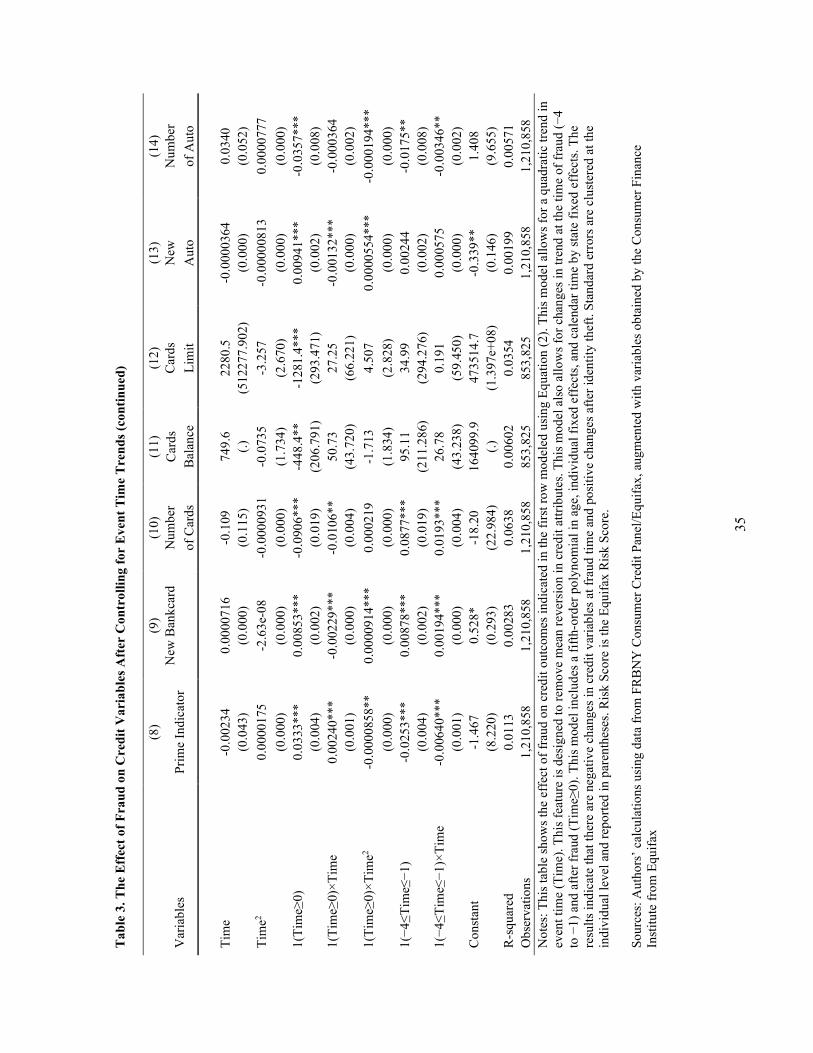
35
Tab
le 3
. The
Eff
ect o
f Fra
ud o
n C
redi
t Var
iabl
es A
fter
Con
trol
ling
for
Eve
nt T
ime
Tre
nds (
cont
inue
d)
(8
) (9
) (1
0)
(11)
(1
2)
(13)
(1
4)
Var
iabl
es
Prim
e In
dica
tor
New
Ban
kcar
d N
umbe
r C
ards
C
ards
N
ew
Num
ber
of
Car
ds
Bal
ance
Li
mit
Aut
o of
Aut
o
Tim
e -0
.002
34
0.00
0071
6 -0
.109
74
9.6
2280
.5
-0.0
0003
64
0.03
40
(0
.043
) (0
.000
) (0
.115
) (.)
(5
1227
7.90
2)
(0.0
00)
(0.0
52)
Tim
e2 0.
0000
175
-2.6
3e-0
8 -0
.000
0931
-0
.073
5 -3
.257
-0
.000
0081
3 0.
0000
777
(0
.000
) (0
.000
) (0
.000
) (1
.734
) (2
.670
) (0
.000
) (0
.000
) 1(
Tim
e≥0)
0.
0333
***
0.00
853*
**
-0.0
906*
**
-448
.4**
-1
281.
4***
0.
0094
1***
-0
.035
7***
(0.0
04)
(0.0
02)
(0.0
19)
(206
.791
) (2
93.4
71)
(0.0
02)
(0.0
08)
1(Ti
me≥
0)×T
ime
0.00
240*
**
-0.0
0229
***
-0.0
106*
* 50
.73
27.2
5 -0
.001
32**
* -0
.000
364
(0
.001
) (0
.000
) (0
.004
) (4
3.72
0)
(66.
221)
(0
.000
) (0
.002
) 1(
Tim
e≥0)
×Tim
e2 -0
.000
0858
**
0.00
0091
4***
0.
0002
19
-1.7
13
4.50
7 0.
0000
554*
**
-0.0
0019
4***
(0
.000
) (0
.000
) (0
.000
) (1
.834
) (2
.828
) (0
.000
) (0
.000
) 1(
−4≤T
ime≤
−1)
-0.0
253*
**
0.00
878*
**
0.08
77**
* 95
.11
34.9
9 0.
0024
4 -0
.017
5**
(0
.004
) (0
.002
) (0
.019
) (2
11.2
86)
(294
.276
) (0
.002
) (0
.008
) 1(
−4≤T
ime≤
−1)×
Tim
e -0
.006
40**
* 0.
0019
4***
0.
0193
***
26.7
8 0.
191
0.00
0575
-0
.003
46**
(0.0
01)
(0.0
00)
(0.0
04)
(43.
238)
(5
9.45
0)
(0.0
00)
(0.0
02)
Con
stan
t -1
.467
0.
528*
-1
8.20
16
4099
.9
4735
14.7
-0
.339
**
1.40
8
(8.2
20)
(0.2
93)
(22.
984)
(.)
(1
.397
e+08
) (0
.146
) (9
.655
) R
-squ
ared
0.
0113
0.
0028
3 0.
0638
0.
0060
2 0.
0354
0.
0019
9 0.
0057
1 O
bser
vatio
ns
1,21
0,85
8 1,
210,
858
1,21
0,85
8 85
3,82
5 85
3,82
5 1,
210,
858
1,21
0,85
8 N
otes
: Thi
s tab
le sh
ows t
he e
ffec
t of f
raud
on
cred
it ou
tcom
es in
dica
ted
in th
e fir
st ro
w m
odel
ed u
sing
Equ
atio
n (2
). Th
is m
odel
allo
ws f
or a
qua
drat
ic tr
end
in
even
t tim
e (T
ime)
. Thi
s fea
ture
is d
esig
ned
to re
mov
e m
ean
reve
rsio
n in
cre
dit a
ttrib
utes
. Thi
s mod
el a
lso
allo
ws f
or c
hang
es in
tren
d at
the
time
of fr
aud
(−4
to −
1) a
nd a
fter f
raud
(Tim
e≥0)
. Thi
s mod
el in
clud
es a
fifth
-ord
er p
olyn
omia
l in
age,
indi
vidu
al fi
xed
effe
cts,
and
cale
ndar
tim
e by
stat
e fix
ed e
ffec
ts. T
he
resu
lts in
dica
te th
at th
ere
are
nega
tive
chan
ges i
n cr
edit
varia
bles
at f
raud
tim
e an
d po
sitiv
e ch
ange
s afte
r ide
ntity
thef
t. St
anda
rd e
rror
s are
clu
ster
ed a
t the
in
divi
dual
leve
l and
repo
rted
in p
aren
thes
es. R
isk
Scor
e is
the
Equi
fax
Ris
k Sc
ore.
So
urce
s: A
utho
rs’ c
alcu
latio
ns u
sing
dat
a fr
om F
RB
NY
Con
sum
er C
redi
t Pan
el/E
quifa
x, a
ugm
ente
d w
ith v
aria
bles
obt
aine
d by
the
Con
sum
er F
inan
ce
Inst
itute
from
Equ
ifax
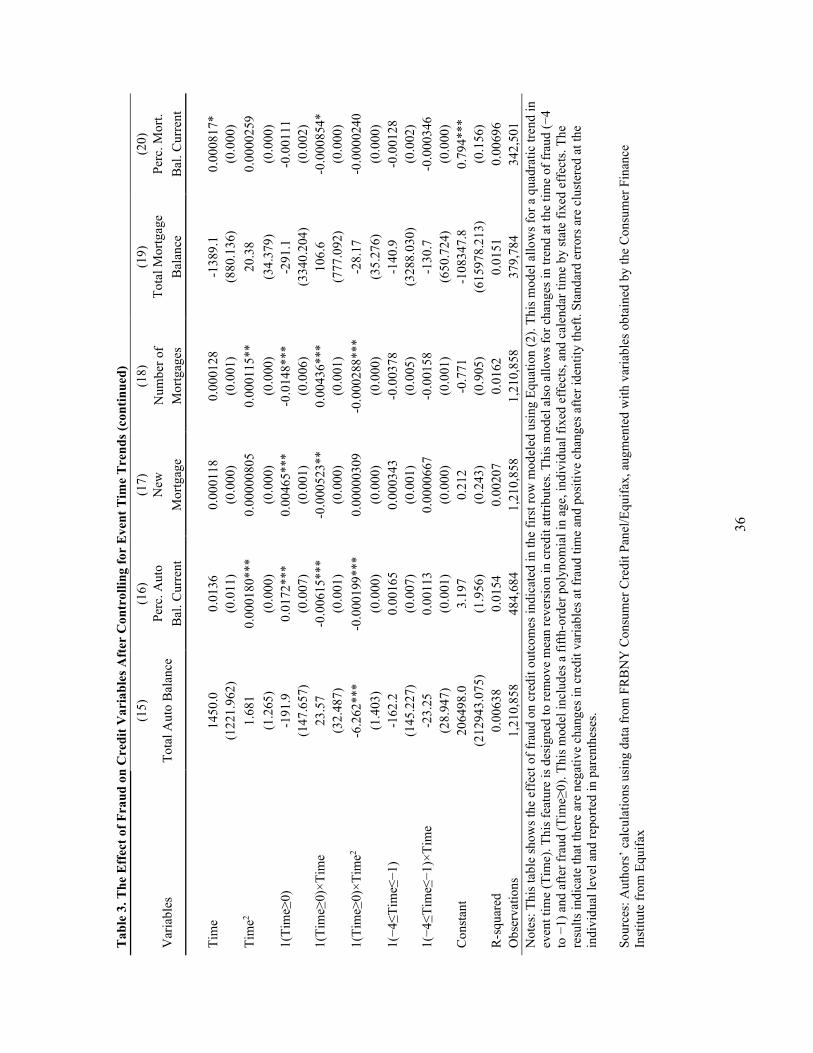
36
Tab
le 3
. The
Eff
ect o
f Fra
ud o
n C
redi
t Var
iabl
es A
fter
Con
trol
ling
for
Eve
nt T
ime
Tre
nds (
cont
inue
d)
(1
5)
(16)
(1
7)
(18)
(1
9)
(20)
Var
iabl
es
Tota
l Aut
o B
alan
ce
Perc
. Aut
o N
ew
Num
ber o
f To
tal M
ortg
age
Perc
. Mor
t. B
al. C
urre
nt
Mor
tgag
e M
ortg
ages
B
alan
ce
Bal
. Cur
rent
Tim
e 14
50.0
0.
0136
0.
0001
18
0.00
0128
-1
389.
1 0.
0008
17*
(1
221.
962)
(0
.011
) (0
.000
) (0
.001
) (8
80.1
36)
(0.0
00)
Tim
e2 1.
681
0.00
0180
***
0.00
0008
05
0.00
0115
**
20.3
8 0.
0000
259
(1
.265
) (0
.000
) (0
.000
) (0
.000
) (3
4.37
9)
(0.0
00)
1(Ti
me≥
0)
-191
.9
0.01
72**
* 0.
0046
5***
-0
.014
8***
-2
91.1
-0
.001
11
(1
47.6
57)
(0.0
07)
(0.0
01)
(0.0
06)
(334
0.20
4)
(0.0
02)
1(Ti
me≥
0)×T
ime
23.5
7 -0
.006
15**
* -0
.000
523*
* 0.
0043
6***
10
6.6
-0.0
0085
4*
(3
2.48
7)
(0.0
01)
(0.0
00)
(0.0
01)
(777
.092
) (0
.000
) 1(
Tim
e≥0)
×Tim
e2 -6
.262
***
-0.0
0019
9***
0.
0000
0309
-0
.000
288*
**
-28.
17
-0.0
0002
40
(1
.403
) (0
.000
) (0
.000
) (0
.000
) (3
5.27
6)
(0.0
00)
1(−4
≤Tim
e≤−1
) -1
62.2
0.
0016
5 0.
0003
43
-0.0
0378
-1
40.9
-0
.001
28
(1
45.2
27)
(0.0
07)
(0.0
01)
(0.0
05)
(328
8.03
0)
(0.0
02)
1(−4
≤Tim
e≤−1
)×Ti
me
-23.
25
0.00
113
0.00
0066
7 -0
.001
58
-130
.7
-0.0
0034
6
(28.
947)
(0
.001
) (0
.000
) (0
.001
) (6
50.7
24)
(0.0
00)
Con
stan
t 20
6498
.0
3.19
7 0.
212
-0.7
71
-108
347.
8 0.
794*
**
(2
1294
3.07
5)
(1.9
56)
(0.2
43)
(0.9
05)
(615
978.
213)
(0
.156
) R
-squ
ared
0.
0063
8 0.
0154
0.
0020
7 0.
0162
0.
0151
0.
0069
6 O
bser
vatio
ns
1,21
0,85
8 48
4,68
4 1,
210,
858
1,21
0,85
8 37
9,78
4 34
2,50
1 N
otes
: Thi
s tab
le sh
ows t
he e
ffec
t of f
raud
on
cred
it ou
tcom
es in
dica
ted
in th
e fir
st ro
w m
odel
ed u
sing
Equ
atio
n (2
). Th
is m
odel
allo
ws f
or a
qua
drat
ic tr
end
in
even
t tim
e (T
ime)
. Thi
s fea
ture
is d
esig
ned
to re
mov
e m
ean
reve
rsio
n in
cre
dit a
ttrib
utes
. Thi
s mod
el a
lso
allo
ws f
or c
hang
es in
tren
d at
the
time
of fr
aud
(−4
to −
1) a
nd a
fter f
raud
(Tim
e≥0)
. Thi
s mod
el in
clud
es a
fifth
-ord
er p
olyn
omia
l in
age,
indi
vidu
al fi
xed
effe
cts,
and
cale
ndar
tim
e by
stat
e fix
ed e
ffec
ts. T
he
resu
lts in
dica
te th
at th
ere
are
nega
tive
chan
ges i
n cr
edit
varia
bles
at f
raud
tim
e an
d po
sitiv
e ch
ange
s afte
r ide
ntity
thef
t. St
anda
rd e
rror
s are
clu
ster
ed a
t the
in
divi
dual
leve
l and
repo
rted
in p
aren
thes
es.
So
urce
s: A
utho
rs’ c
alcu
latio
ns u
sing
dat
a fr
om F
RB
NY
Con
sum
er C
redi
t Pan
el/E
quifa
x, a
ugm
ente
d w
ith v
aria
bles
obt
aine
d by
the
Con
sum
er F
inan
ce
Inst
itute
from
Equ
ifax
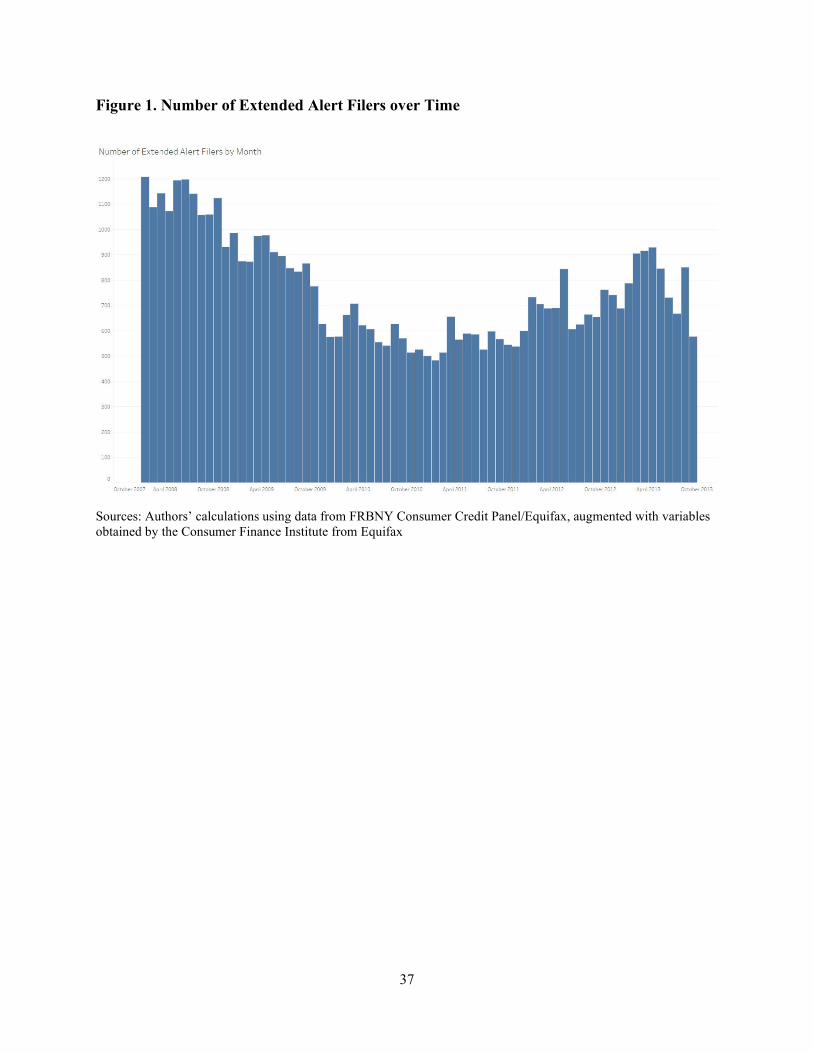
37
Figure 1. Number of Extended Alert Filers over Time
Sources: Authors’ calculations using data from FRBNY Consumer Credit Panel/Equifax, augmented with variables obtained by the Consumer Finance Institute from Equifax
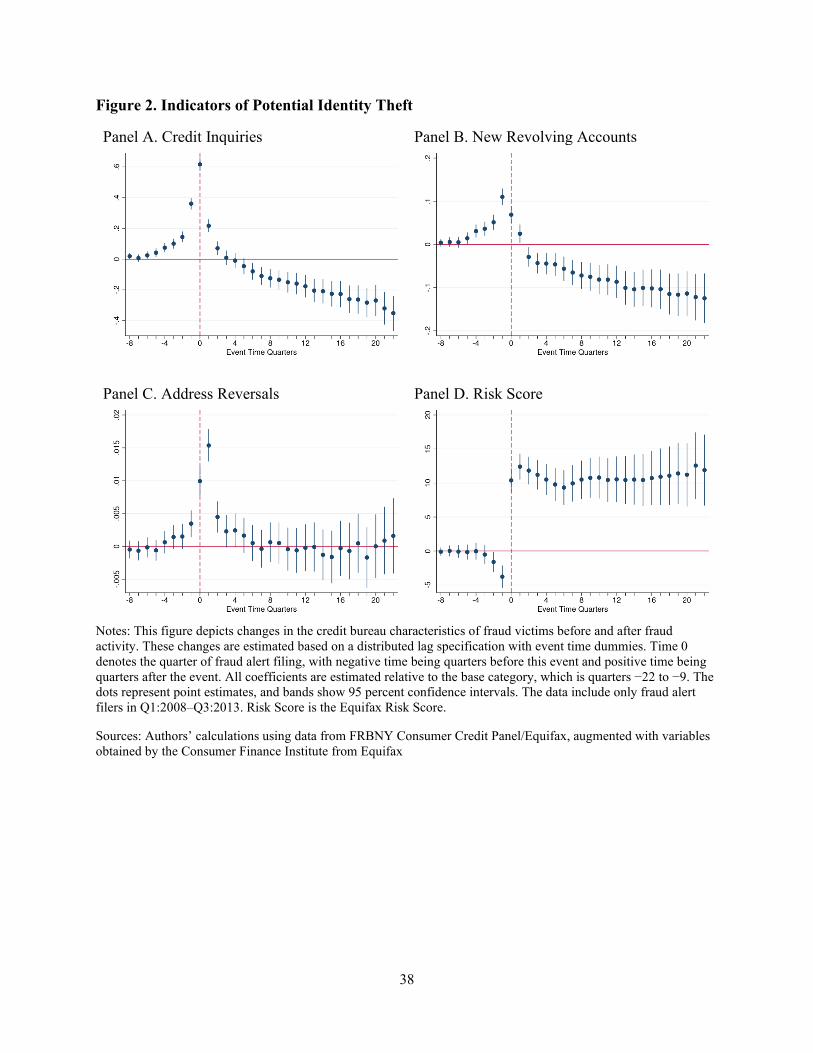
38
Figure 2. Indicators of Potential Identity Theft
Panel A. Credit Inquiries
Panel B. New Revolving Accounts
Panel C. Address Reversals
Panel D. Risk Score
Notes: This figure depicts changes in the credit bureau characteristics of fraud victims before and after fraud activity. These changes are estimated based on a distributed lag specification with event time dummies. Time 0 denotes the quarter of fraud alert filing, with negative time being quarters before this event and positive time being quarters after the event. All coefficients are estimated relative to the base category, which is quarters −22 to −9. The dots represent point estimates, and bands show 95 percent confidence intervals. The data include only fraud alert filers in Q1:2008–Q3:2013. Risk Score is the Equifax Risk Score.
Sources: Authors’ calculations using data from FRBNY Consumer Credit Panel/Equifax, augmented with variables obtained by the Consumer Finance Institute from Equifax
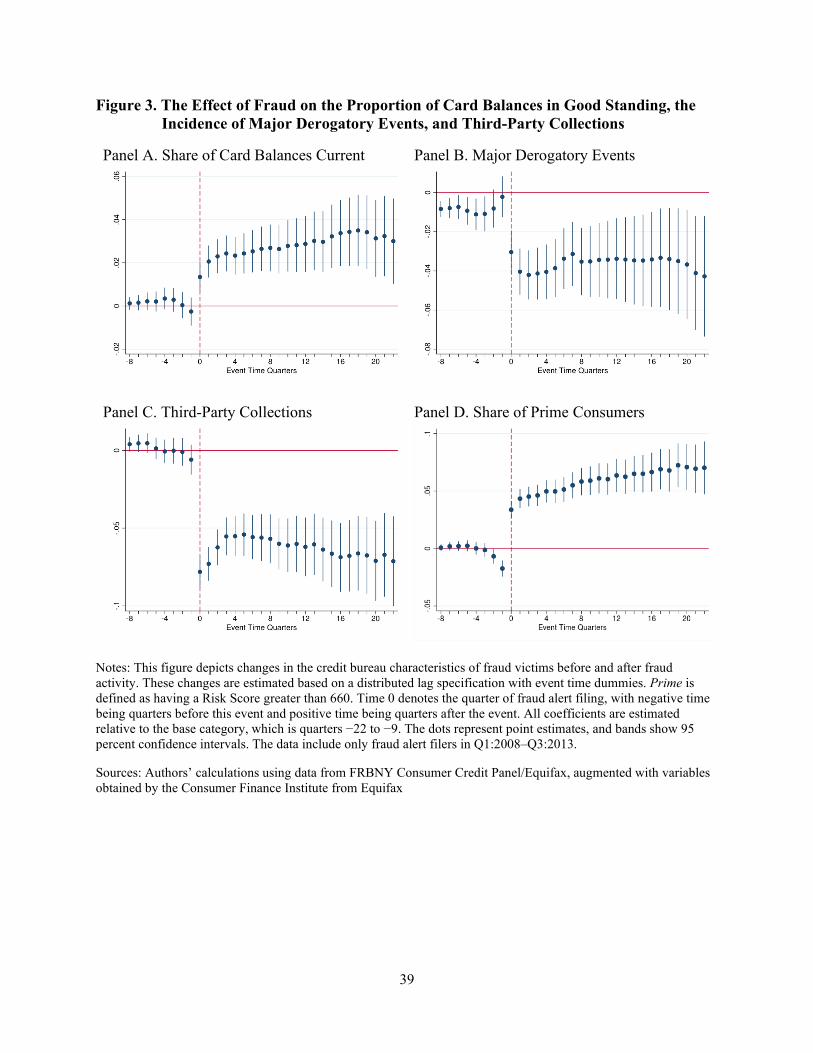
39
Figure 3. The Effect of Fraud on the Proportion of Card Balances in Good Standing, the Incidence of Major Derogatory Events, and Third-Party Collections
Panel A. Share of Card Balances Current
Panel B. Major Derogatory Events
Panel C. Third-Party Collections
Panel D. Share of Prime Consumers
Notes: This figure depicts changes in the credit bureau characteristics of fraud victims before and after fraud activity. These changes are estimated based on a distributed lag specification with event time dummies. Prime is defined as having a Risk Score greater than 660. Time 0 denotes the quarter of fraud alert filing, with negative time being quarters before this event and positive time being quarters after the event. All coefficients are estimated relative to the base category, which is quarters −22 to −9. The dots represent point estimates, and bands show 95 percent confidence intervals. The data include only fraud alert filers in Q1:2008–Q3:2013.
Sources: Authors’ calculations using data from FRBNY Consumer Credit Panel/Equifax, augmented with variables obtained by the Consumer Finance Institute from Equifax
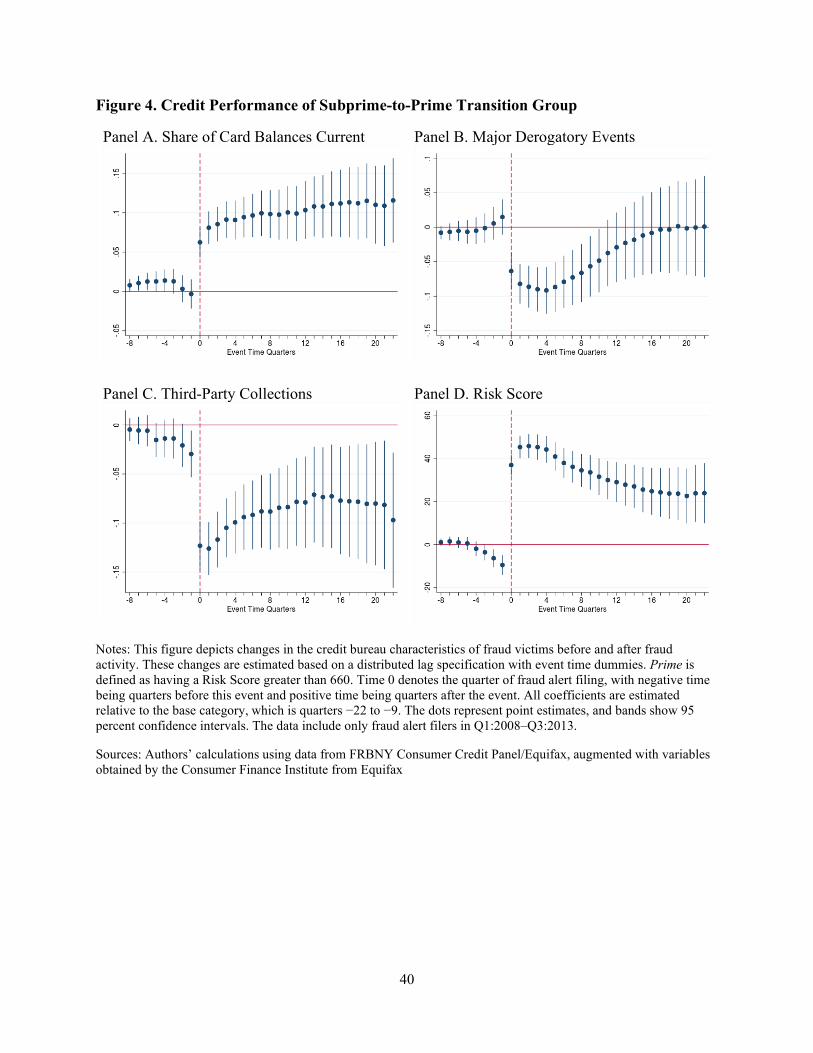
40
Figure 4. Credit Performance of Subprime-to-Prime Transition Group
Panel A. Share of Card Balances Current
Panel B. Major Derogatory Events
Panel C. Third-Party Collections
Panel D. Risk Score
Notes: This figure depicts changes in the credit bureau characteristics of fraud victims before and after fraud activity. These changes are estimated based on a distributed lag specification with event time dummies. Prime is defined as having a Risk Score greater than 660. Time 0 denotes the quarter of fraud alert filing, with negative time being quarters before this event and positive time being quarters after the event. All coefficients are estimated relative to the base category, which is quarters −22 to −9. The dots represent point estimates, and bands show 95 percent confidence intervals. The data include only fraud alert filers in Q1:2008–Q3:2013.
Sources: Authors’ calculations using data from FRBNY Consumer Credit Panel/Equifax, augmented with variables obtained by the Consumer Finance Institute from Equifax
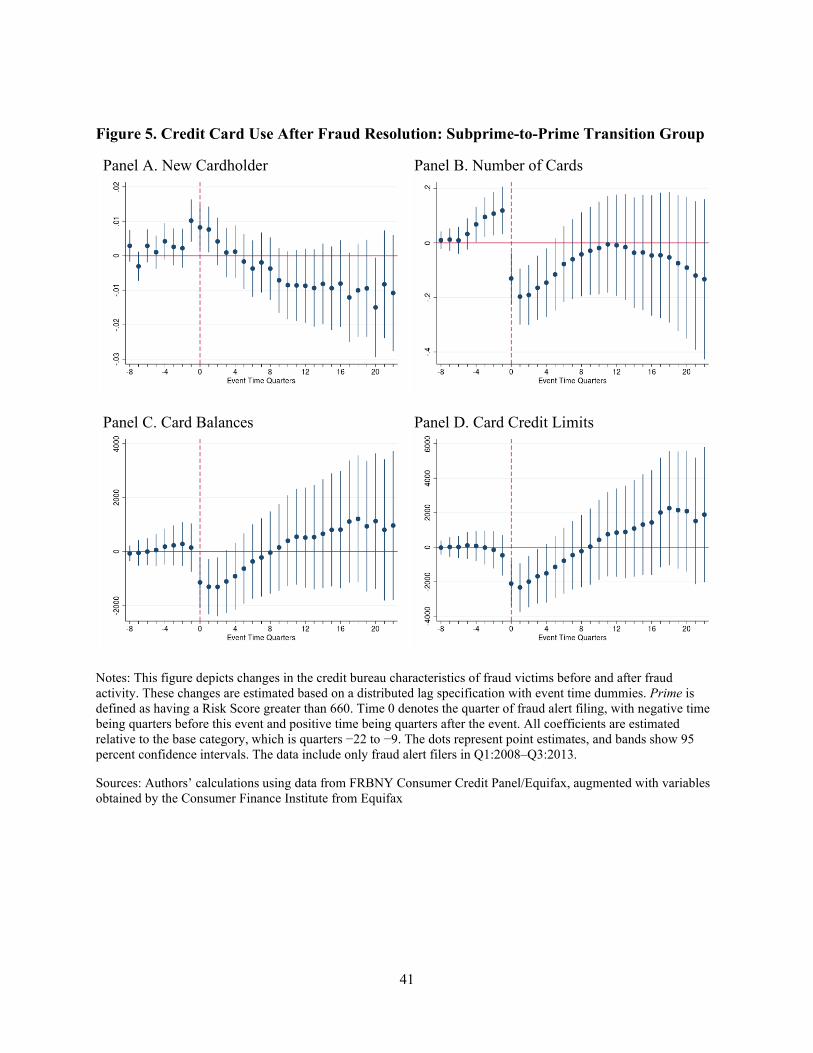
41
Figure 5. Credit Card Use After Fraud Resolution: Subprime-to-Prime Transition Group
Panel A. New Cardholder
Panel B. Number of Cards
Panel C. Card Balances
Panel D. Card Credit Limits
Notes: This figure depicts changes in the credit bureau characteristics of fraud victims before and after fraud activity. These changes are estimated based on a distributed lag specification with event time dummies. Prime is defined as having a Risk Score greater than 660. Time 0 denotes the quarter of fraud alert filing, with negative time being quarters before this event and positive time being quarters after the event. All coefficients are estimated relative to the base category, which is quarters −22 to −9. The dots represent point estimates, and bands show 95 percent confidence intervals. The data include only fraud alert filers in Q1:2008–Q3:2013.
Sources: Authors’ calculations using data from FRBNY Consumer Credit Panel/Equifax, augmented with variables obtained by the Consumer Finance Institute from Equifax
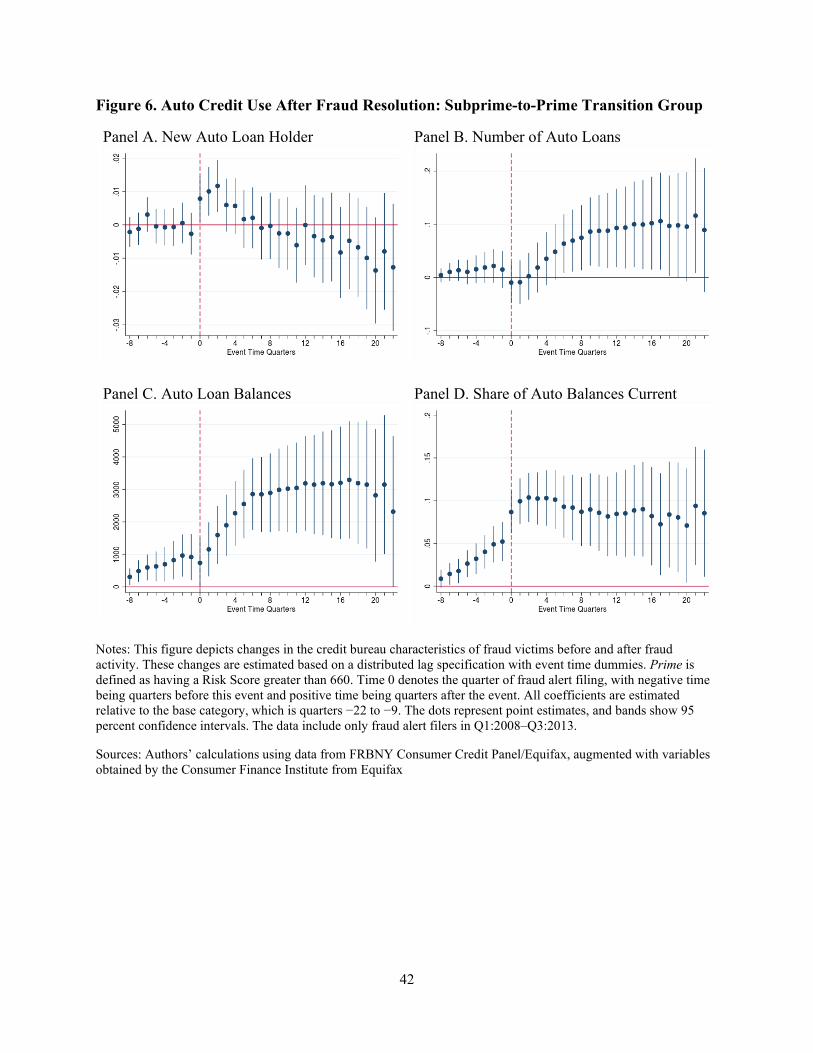
42
Figure 6. Auto Credit Use After Fraud Resolution: Subprime-to-Prime Transition Group
Panel A. New Auto Loan Holder
Panel B. Number of Auto Loans
Panel C. Auto Loan Balances
Panel D. Share of Auto Balances Current
Notes: This figure depicts changes in the credit bureau characteristics of fraud victims before and after fraud activity. These changes are estimated based on a distributed lag specification with event time dummies. Prime is defined as having a Risk Score greater than 660. Time 0 denotes the quarter of fraud alert filing, with negative time being quarters before this event and positive time being quarters after the event. All coefficients are estimated relative to the base category, which is quarters −22 to −9. The dots represent point estimates, and bands show 95 percent confidence intervals. The data include only fraud alert filers in Q1:2008–Q3:2013.
Sources: Authors’ calculations using data from FRBNY Consumer Credit Panel/Equifax, augmented with variables obtained by the Consumer Finance Institute from Equifax
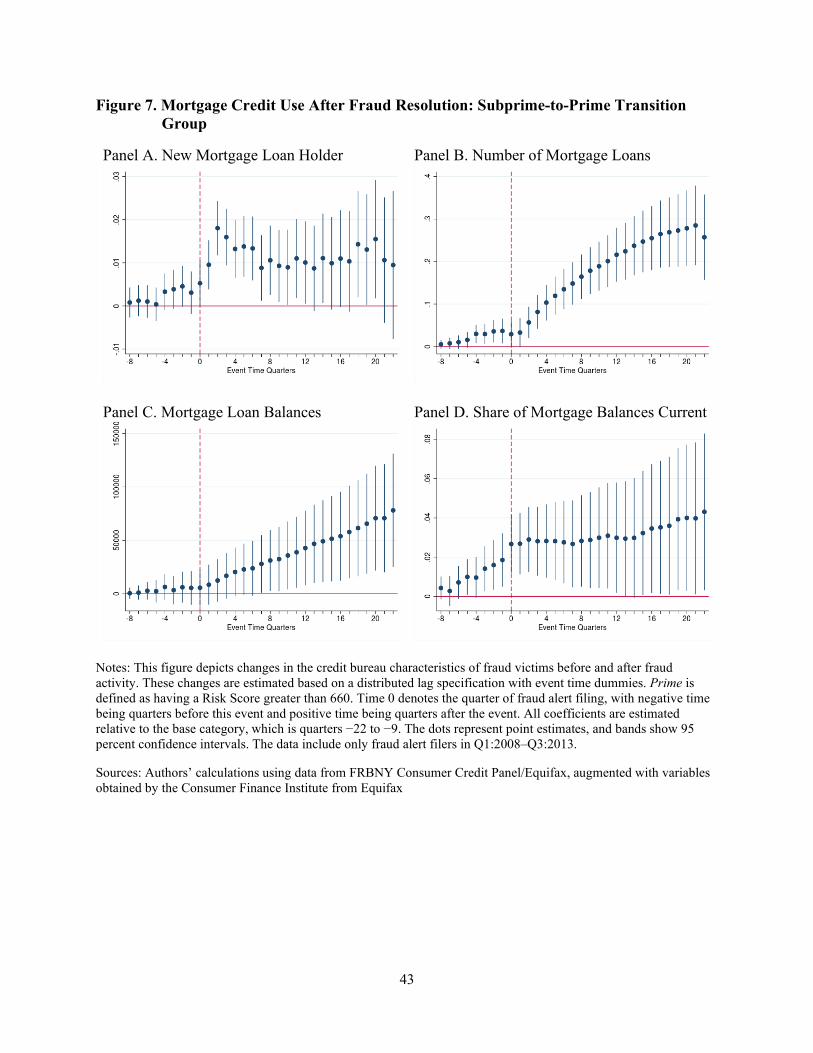
43
Figure 7. Mortgage Credit Use After Fraud Resolution: Subprime-to-Prime Transition Group
Panel A. New Mortgage Loan Holder
Panel B. Number of Mortgage Loans
Panel C. Mortgage Loan Balances
Panel D. Share of Mortgage Balances Current
Notes: This figure depicts changes in the credit bureau characteristics of fraud victims before and after fraud activity. These changes are estimated based on a distributed lag specification with event time dummies. Prime is defined as having a Risk Score greater than 660. Time 0 denotes the quarter of fraud alert filing, with negative time being quarters before this event and positive time being quarters after the event. All coefficients are estimated relative to the base category, which is quarters −22 to −9. The dots represent point estimates, and bands show 95 percent confidence intervals. The data include only fraud alert filers in Q1:2008–Q3:2013.
Sources: Authors’ calculations using data from FRBNY Consumer Credit Panel/Equifax, augmented with variables obtained by the Consumer Finance Institute from Equifax
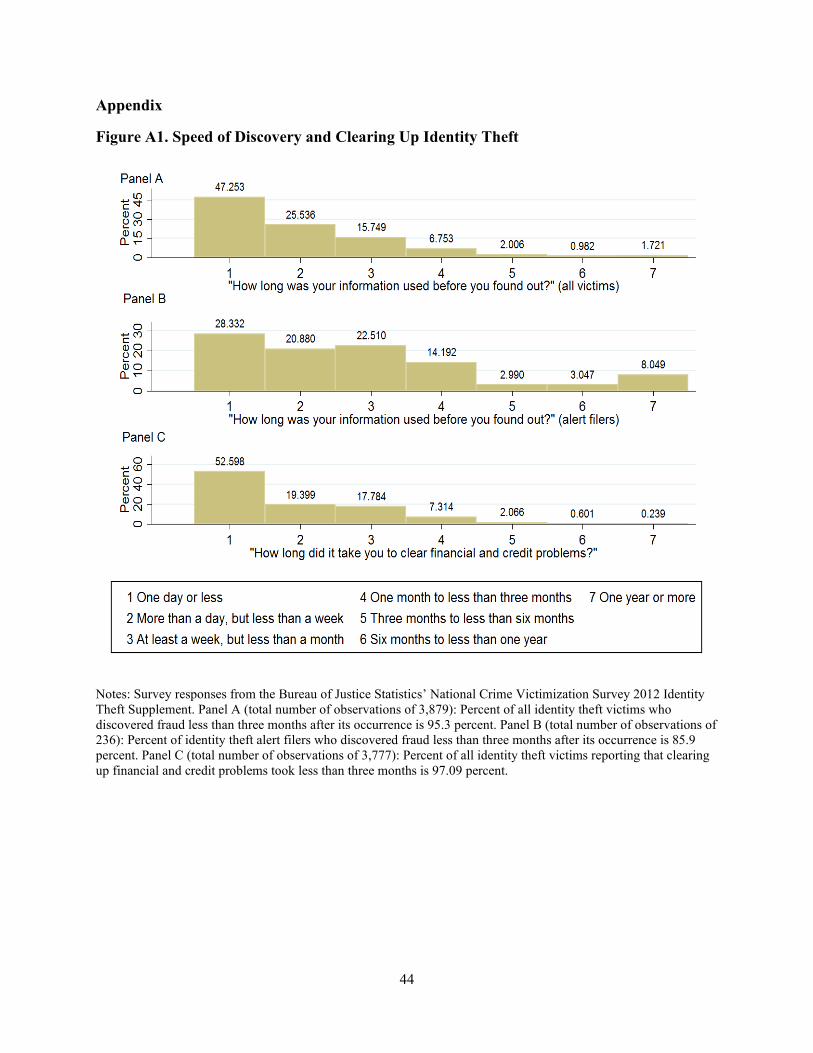
44
Appendix
Figure A1. Speed of Discovery and Clearing Up Identity Theft
Notes: Survey responses from the Bureau of Justice Statistics’ National Crime Victimization Survey 2012 Identity Theft Supplement. Panel A (total number of observations of 3,879): Percent of all identity theft victims who discovered fraud less than three months after its occurrence is 95.3 percent. Panel B (total number of observations of 236): Percent of identity theft alert filers who discovered fraud less than three months after its occurrence is 85.9 percent. Panel C (total number of observations of 3,777): Percent of all identity theft victims reporting that clearing up financial and credit problems took less than three months is 97.09 percent.
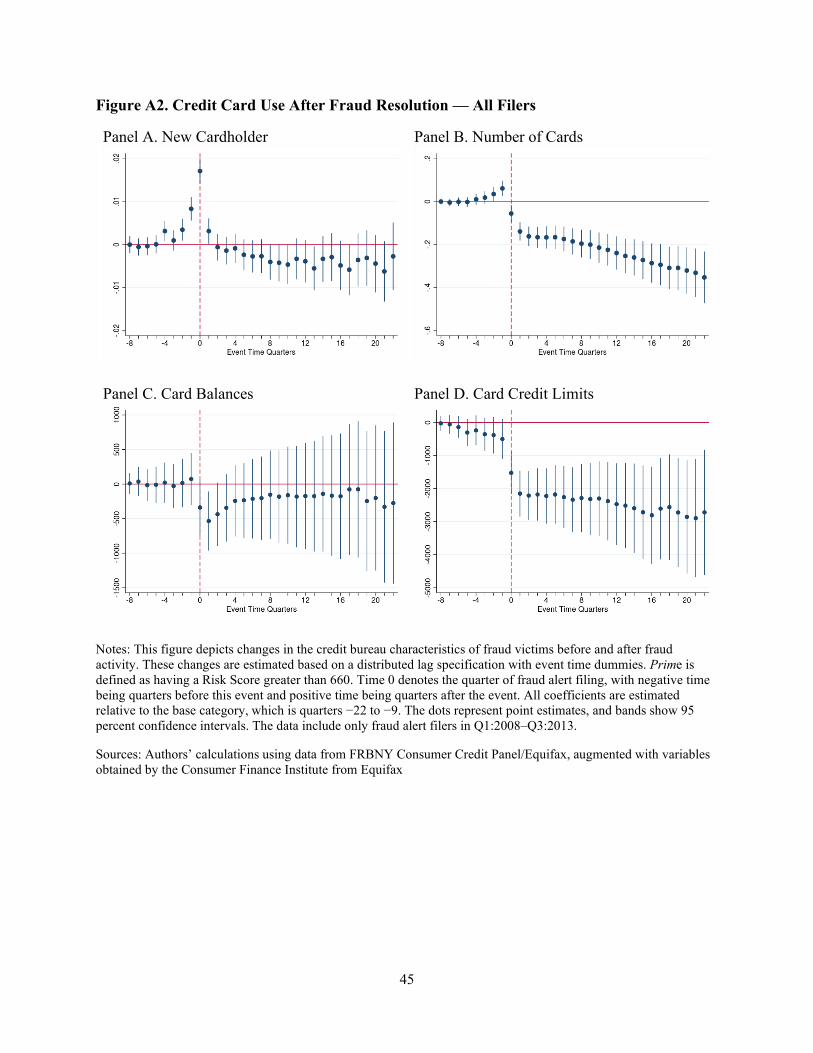
45
Figure A2. Credit Card Use After Fraud Resolution — All Filers
Panel A. New Cardholder
Panel B. Number of Cards
Panel C. Card Balances
Panel D. Card Credit Limits
Notes: This figure depicts changes in the credit bureau characteristics of fraud victims before and after fraud activity. These changes are estimated based on a distributed lag specification with event time dummies. Prime is defined as having a Risk Score greater than 660. Time 0 denotes the quarter of fraud alert filing, with negative time being quarters before this event and positive time being quarters after the event. All coefficients are estimated relative to the base category, which is quarters −22 to −9. The dots represent point estimates, and bands show 95 percent confidence intervals. The data include only fraud alert filers in Q1:2008–Q3:2013.
Sources: Authors’ calculations using data from FRBNY Consumer Credit Panel/Equifax, augmented with variables obtained by the Consumer Finance Institute from Equifax
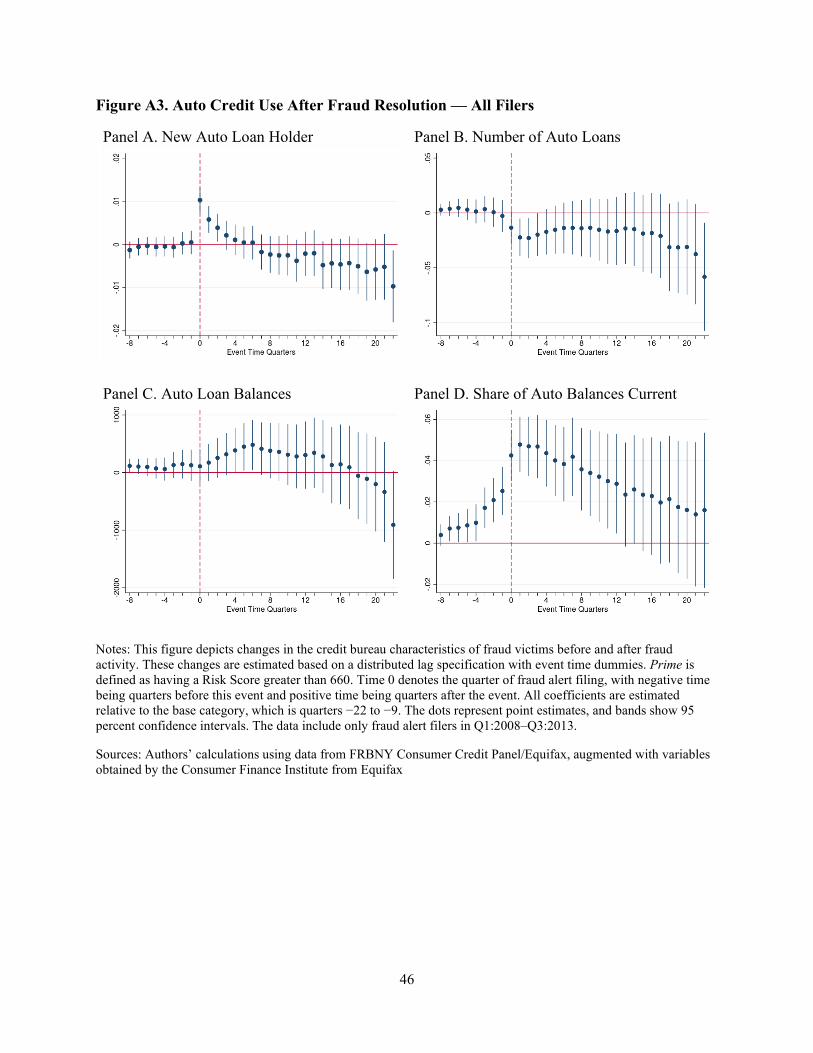
46
Figure A3. Auto Credit Use After Fraud Resolution — All Filers
Panel A. New Auto Loan Holder
Panel B. Number of Auto Loans
Panel C. Auto Loan Balances
Panel D. Share of Auto Balances Current
Notes: This figure depicts changes in the credit bureau characteristics of fraud victims before and after fraud activity. These changes are estimated based on a distributed lag specification with event time dummies. Prime is defined as having a Risk Score greater than 660. Time 0 denotes the quarter of fraud alert filing, with negative time being quarters before this event and positive time being quarters after the event. All coefficients are estimated relative to the base category, which is quarters −22 to −9. The dots represent point estimates, and bands show 95 percent confidence intervals. The data include only fraud alert filers in Q1:2008–Q3:2013.
Sources: Authors’ calculations using data from FRBNY Consumer Credit Panel/Equifax, augmented with variables obtained by the Consumer Finance Institute from Equifax
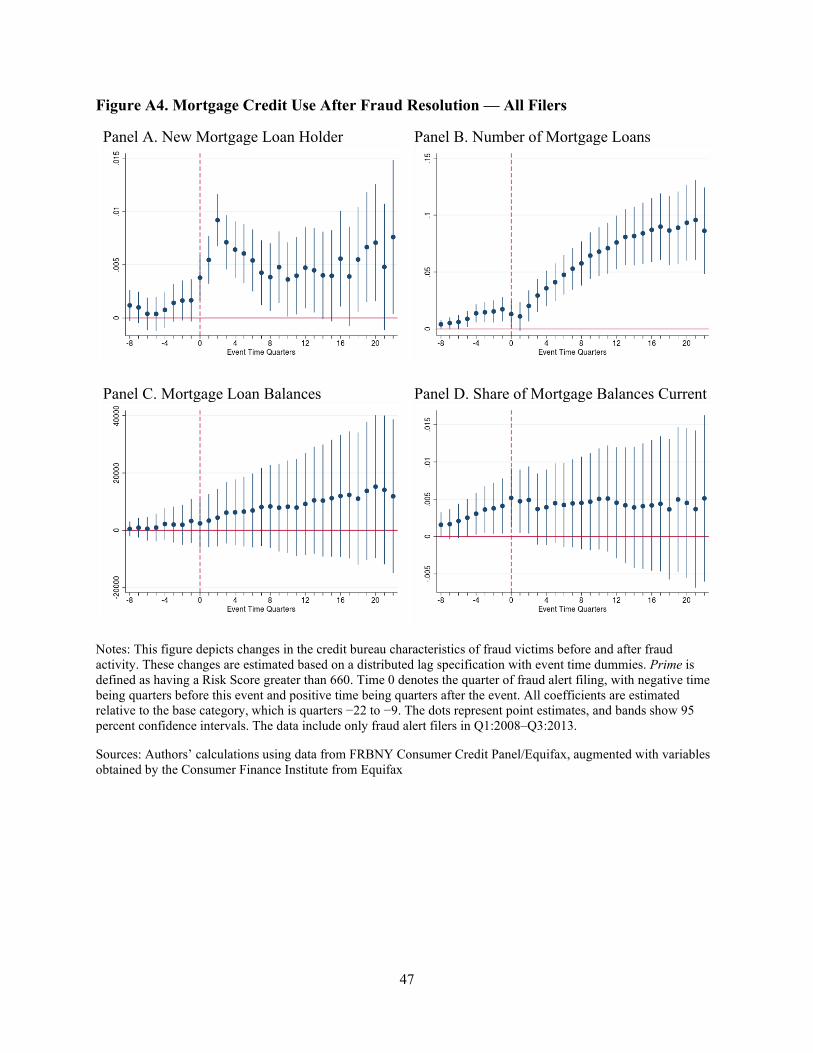
47
Figure A4. Mortgage Credit Use After Fraud Resolution — All Filers
Panel A. New Mortgage Loan Holder
Panel B. Number of Mortgage Loans
Panel C. Mortgage Loan Balances
Panel D. Share of Mortgage Balances Current
Notes: This figure depicts changes in the credit bureau characteristics of fraud victims before and after fraud activity. These changes are estimated based on a distributed lag specification with event time dummies. Prime is defined as having a Risk Score greater than 660. Time 0 denotes the quarter of fraud alert filing, with negative time being quarters before this event and positive time being quarters after the event. All coefficients are estimated relative to the base category, which is quarters −22 to −9. The dots represent point estimates, and bands show 95 percent confidence intervals. The data include only fraud alert filers in Q1:2008–Q3:2013.
Sources: Authors’ calculations using data from FRBNY Consumer Credit Panel/Equifax, augmented with variables obtained by the Consumer Finance Institute from Equifax
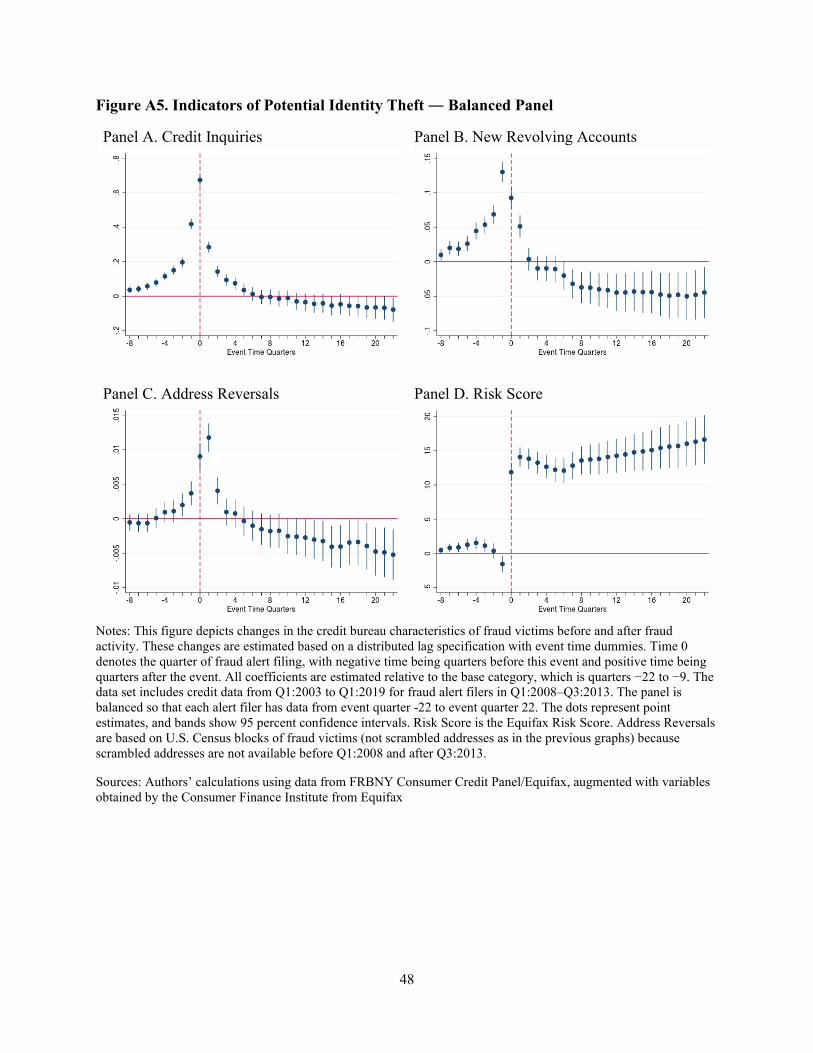
48
Figure A5. Indicators of Potential Identity Theft ― Balanced Panel
Panel A. Credit Inquiries
Panel B. New Revolving Accounts
Panel C. Address Reversals
Panel D. Risk Score
Notes: This figure depicts changes in the credit bureau characteristics of fraud victims before and after fraud activity. These changes are estimated based on a distributed lag specification with event time dummies. Time 0 denotes the quarter of fraud alert filing, with negative time being quarters before this event and positive time being quarters after the event. All coefficients are estimated relative to the base category, which is quarters −22 to −9. The data set includes credit data from Q1:2003 to Q1:2019 for fraud alert filers in Q1:2008–Q3:2013. The panel is balanced so that each alert filer has data from event quarter -22 to event quarter 22. The dots represent point estimates, and bands show 95 percent confidence intervals. Risk Score is the Equifax Risk Score. Address Reversals are based on U.S. Census blocks of fraud victims (not scrambled addresses as in the previous graphs) because scrambled addresses are not available before Q1:2008 and after Q3:2013.
Sources: Authors’ calculations using data from FRBNY Consumer Credit Panel/Equifax, augmented with variables obtained by the Consumer Finance Institute from Equifax
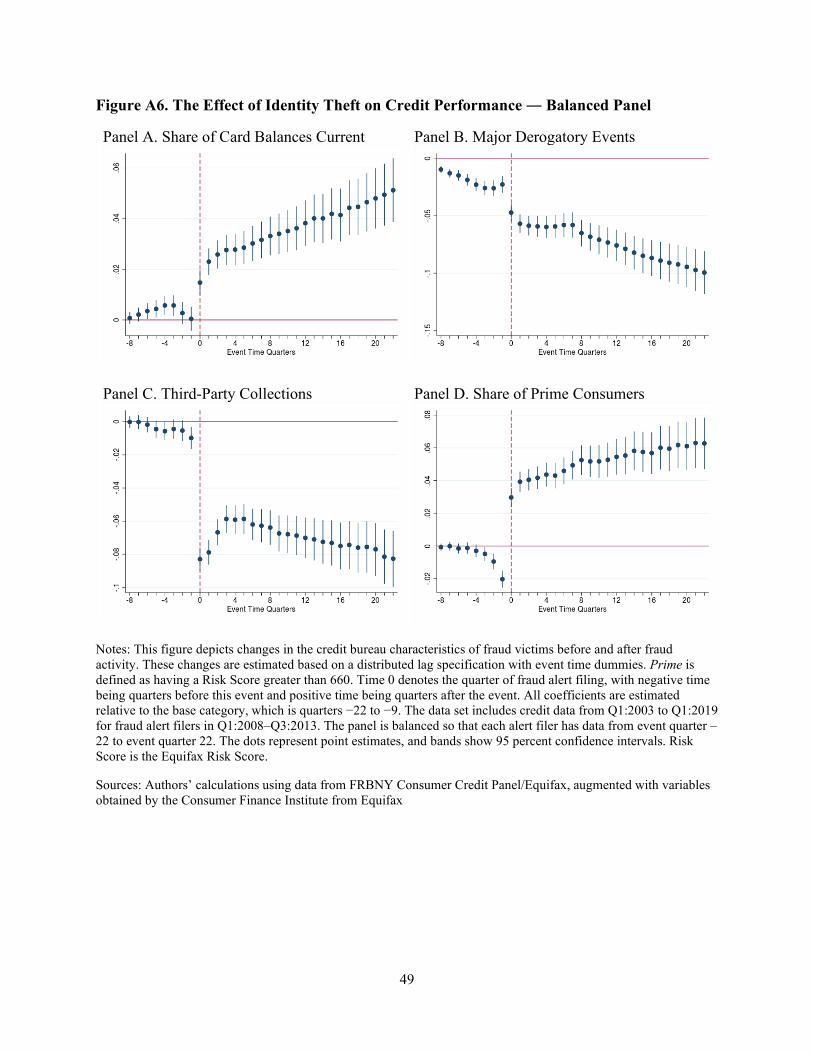
49
Figure A6. The Effect of Identity Theft on Credit Performance ― Balanced Panel
Panel A. Share of Card Balances Current
Panel B. Major Derogatory Events
Panel C. Third-Party Collections
Panel D. Share of Prime Consumers
Notes: This figure depicts changes in the credit bureau characteristics of fraud victims before and after fraud activity. These changes are estimated based on a distributed lag specification with event time dummies. Prime is defined as having a Risk Score greater than 660. Time 0 denotes the quarter of fraud alert filing, with negative time being quarters before this event and positive time being quarters after the event. All coefficients are estimated relative to the base category, which is quarters −22 to −9. The data set includes credit data from Q1:2003 to Q1:2019 for fraud alert filers in Q1:2008–Q3:2013. The panel is balanced so that each alert filer has data from event quarter –22 to event quarter 22. The dots represent point estimates, and bands show 95 percent confidence intervals. Risk Score is the Equifax Risk Score.
Sources: Authors’ calculations using data from FRBNY Consumer Credit Panel/Equifax, augmented with variables obtained by the Consumer Finance Institute from Equifax
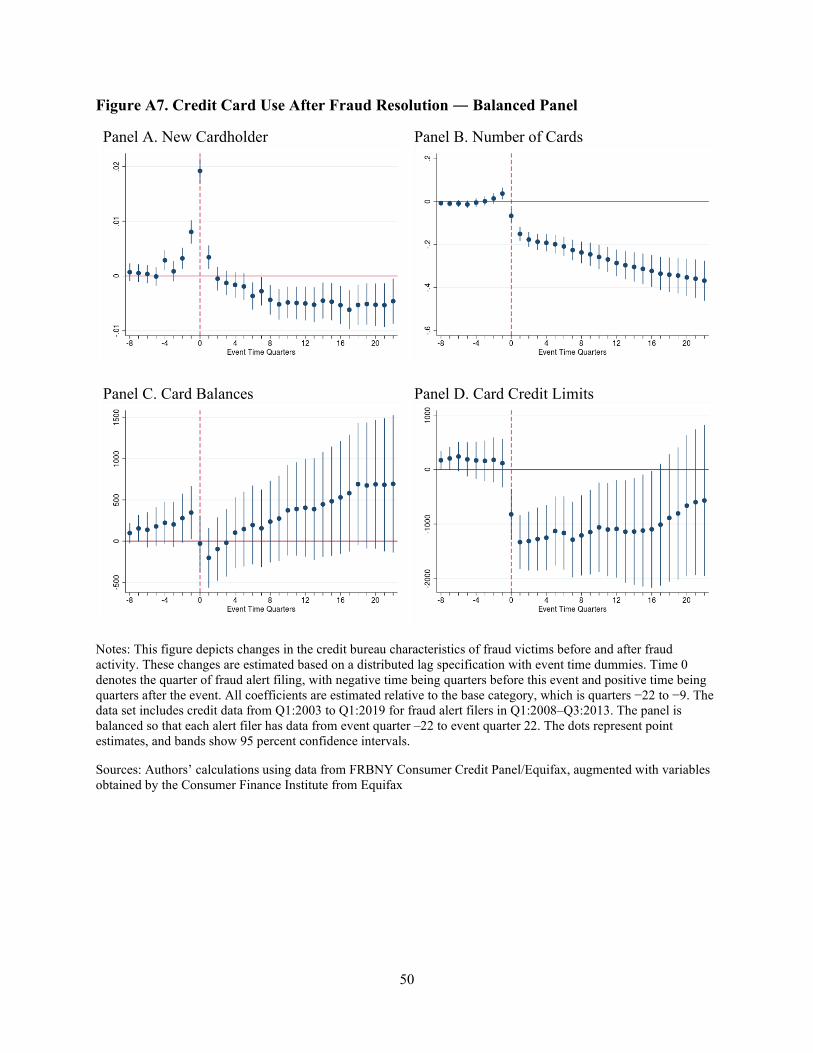
50
Figure A7. Credit Card Use After Fraud Resolution ― Balanced Panel
Panel A. New Cardholder
Panel B. Number of Cards
Panel C. Card Balances
Panel D. Card Credit Limits
Notes: This figure depicts changes in the credit bureau characteristics of fraud victims before and after fraud activity. These changes are estimated based on a distributed lag specification with event time dummies. Time 0 denotes the quarter of fraud alert filing, with negative time being quarters before this event and positive time being quarters after the event. All coefficients are estimated relative to the base category, which is quarters −22 to −9. The data set includes credit data from Q1:2003 to Q1:2019 for fraud alert filers in Q1:2008–Q3:2013. The panel is balanced so that each alert filer has data from event quarter –22 to event quarter 22. The dots represent point estimates, and bands show 95 percent confidence intervals.
Sources: Authors’ calculations using data from FRBNY Consumer Credit Panel/Equifax, augmented with variables obtained by the Consumer Finance Institute from Equifax
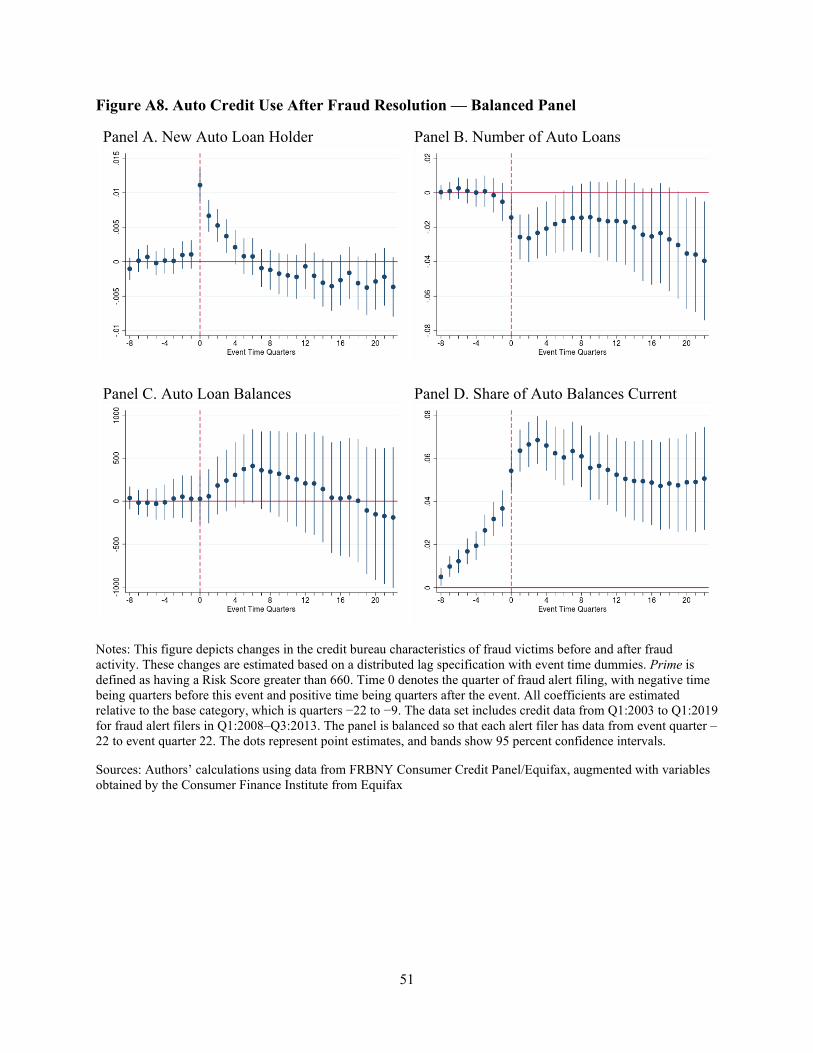
51
Figure A8. Auto Credit Use After Fraud Resolution — Balanced Panel
Panel A. New Auto Loan Holder
Panel B. Number of Auto Loans
Panel C. Auto Loan Balances
Panel D. Share of Auto Balances Current
Notes: This figure depicts changes in the credit bureau characteristics of fraud victims before and after fraud activity. These changes are estimated based on a distributed lag specification with event time dummies. Prime is defined as having a Risk Score greater than 660. Time 0 denotes the quarter of fraud alert filing, with negative time being quarters before this event and positive time being quarters after the event. All coefficients are estimated relative to the base category, which is quarters −22 to −9. The data set includes credit data from Q1:2003 to Q1:2019 for fraud alert filers in Q1:2008–Q3:2013. The panel is balanced so that each alert filer has data from event quarter –22 to event quarter 22. The dots represent point estimates, and bands show 95 percent confidence intervals.
Sources: Authors’ calculations using data from FRBNY Consumer Credit Panel/Equifax, augmented with variables obtained by the Consumer Finance Institute from Equifax
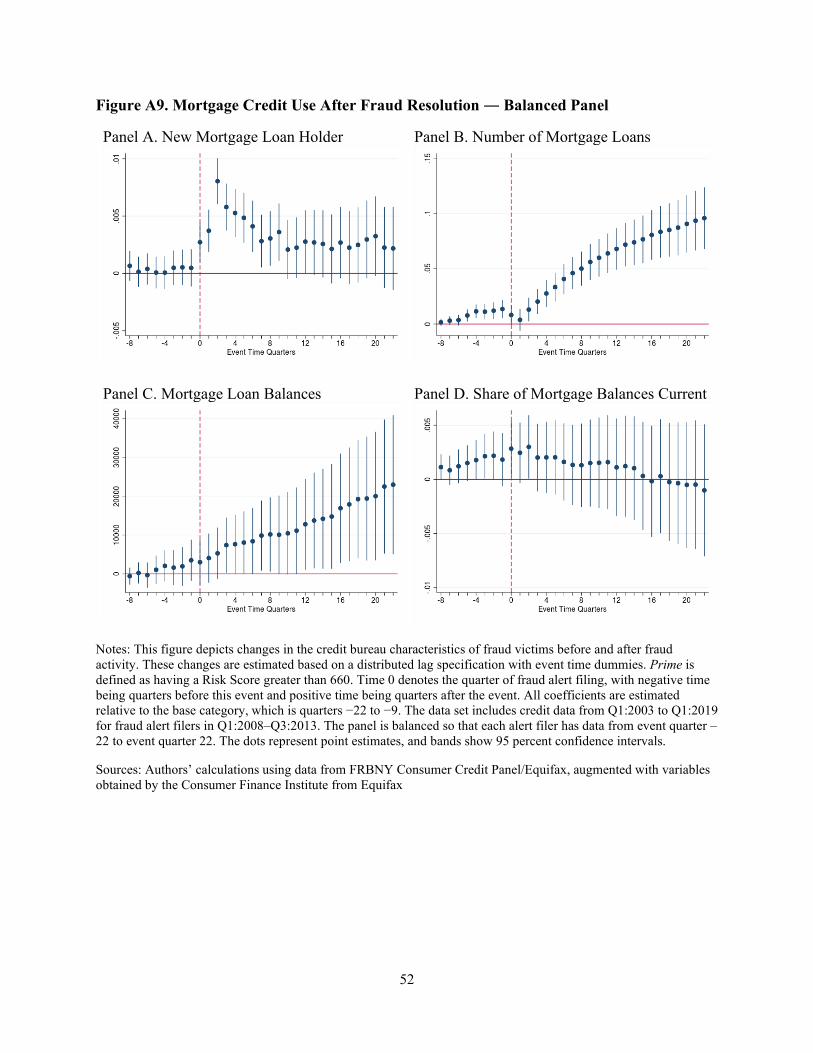
52
Figure A9. Mortgage Credit Use After Fraud Resolution ― Balanced Panel
Panel A. New Mortgage Loan Holder
Panel B. Number of Mortgage Loans
Panel C. Mortgage Loan Balances
Panel D. Share of Mortgage Balances Current
Notes: This figure depicts changes in the credit bureau characteristics of fraud victims before and after fraud activity. These changes are estimated based on a distributed lag specification with event time dummies. Prime is defined as having a Risk Score greater than 660. Time 0 denotes the quarter of fraud alert filing, with negative time being quarters before this event and positive time being quarters after the event. All coefficients are estimated relative to the base category, which is quarters −22 to −9. The data set includes credit data from Q1:2003 to Q1:2019 for fraud alert filers in Q1:2008–Q3:2013. The panel is balanced so that each alert filer has data from event quarter –22 to event quarter 22. The dots represent point estimates, and bands show 95 percent confidence intervals.
Sources: Authors’ calculations using data from FRBNY Consumer Credit Panel/Equifax, augmented with variables obtained by the Consumer Finance Institute from Equifax
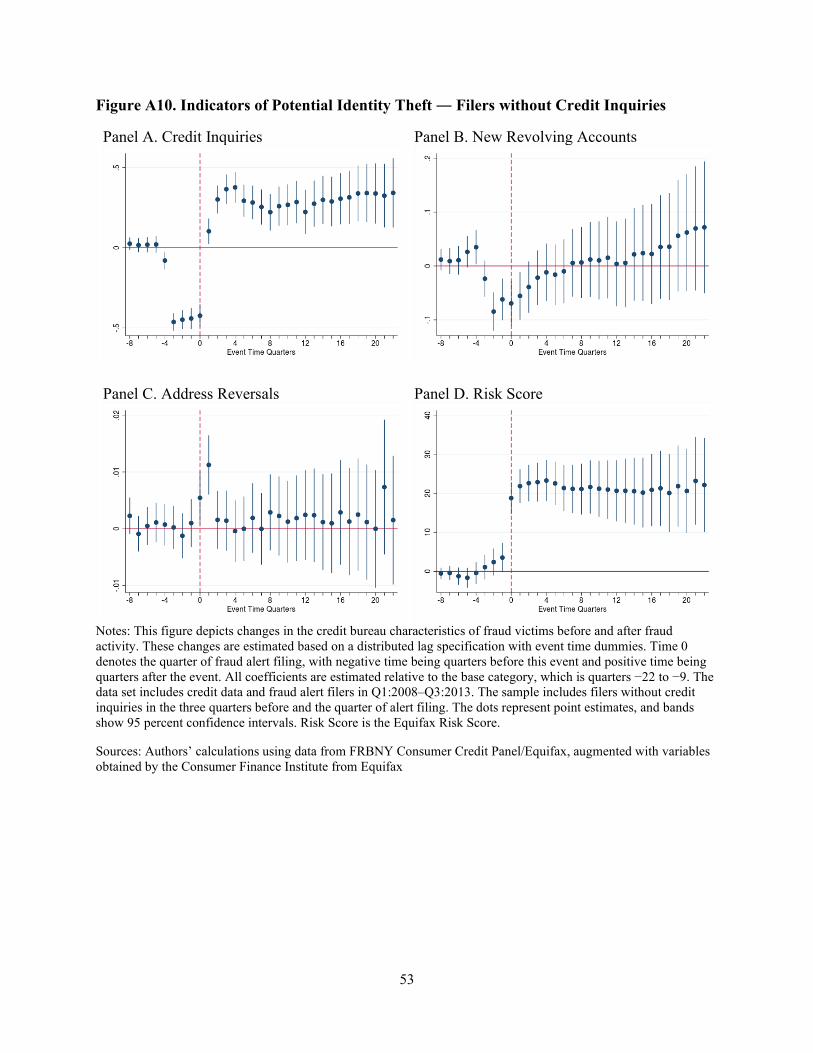
53
Figure A10. Indicators of Potential Identity Theft ― Filers without Credit Inquiries
Panel A. Credit Inquiries
Panel B. New Revolving Accounts
Panel C. Address Reversals
Panel D. Risk Score
Notes: This figure depicts changes in the credit bureau characteristics of fraud victims before and after fraud activity. These changes are estimated based on a distributed lag specification with event time dummies. Time 0 denotes the quarter of fraud alert filing, with negative time being quarters before this event and positive time being quarters after the event. All coefficients are estimated relative to the base category, which is quarters −22 to −9. The data set includes credit data and fraud alert filers in Q1:2008–Q3:2013. The sample includes filers without credit inquiries in the three quarters before and the quarter of alert filing. The dots represent point estimates, and bands show 95 percent confidence intervals. Risk Score is the Equifax Risk Score.
Sources: Authors’ calculations using data from FRBNY Consumer Credit Panel/Equifax, augmented with variables obtained by the Consumer Finance Institute from Equifax
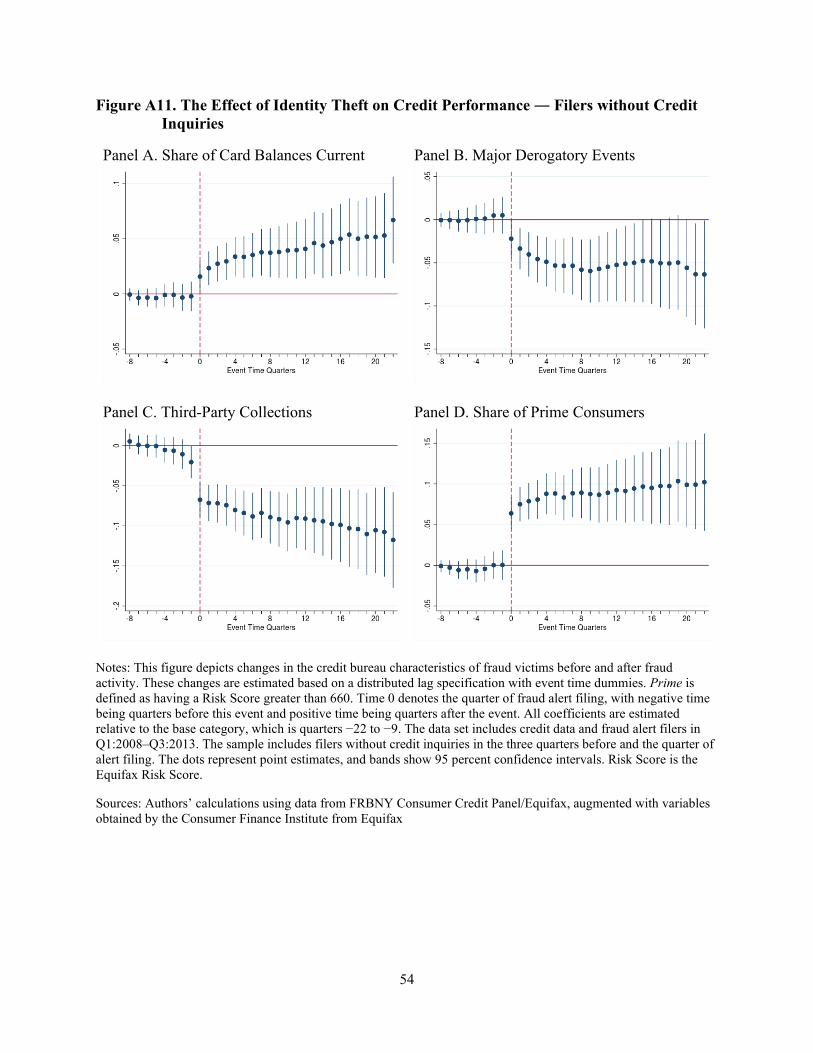
54
Figure A11. The Effect of Identity Theft on Credit Performance ― Filers without Credit Inquiries
Panel A. Share of Card Balances Current
Panel B. Major Derogatory Events
Panel C. Third-Party Collections
Panel D. Share of Prime Consumers
Notes: This figure depicts changes in the credit bureau characteristics of fraud victims before and after fraud activity. These changes are estimated based on a distributed lag specification with event time dummies. Prime is defined as having a Risk Score greater than 660. Time 0 denotes the quarter of fraud alert filing, with negative time being quarters before this event and positive time being quarters after the event. All coefficients are estimated relative to the base category, which is quarters −22 to −9. The data set includes credit data and fraud alert filers in Q1:2008–Q3:2013. The sample includes filers without credit inquiries in the three quarters before and the quarter of alert filing. The dots represent point estimates, and bands show 95 percent confidence intervals. Risk Score is the Equifax Risk Score.
Sources: Authors’ calculations using data from FRBNY Consumer Credit Panel/Equifax, augmented with variables obtained by the Consumer Finance Institute from Equifax
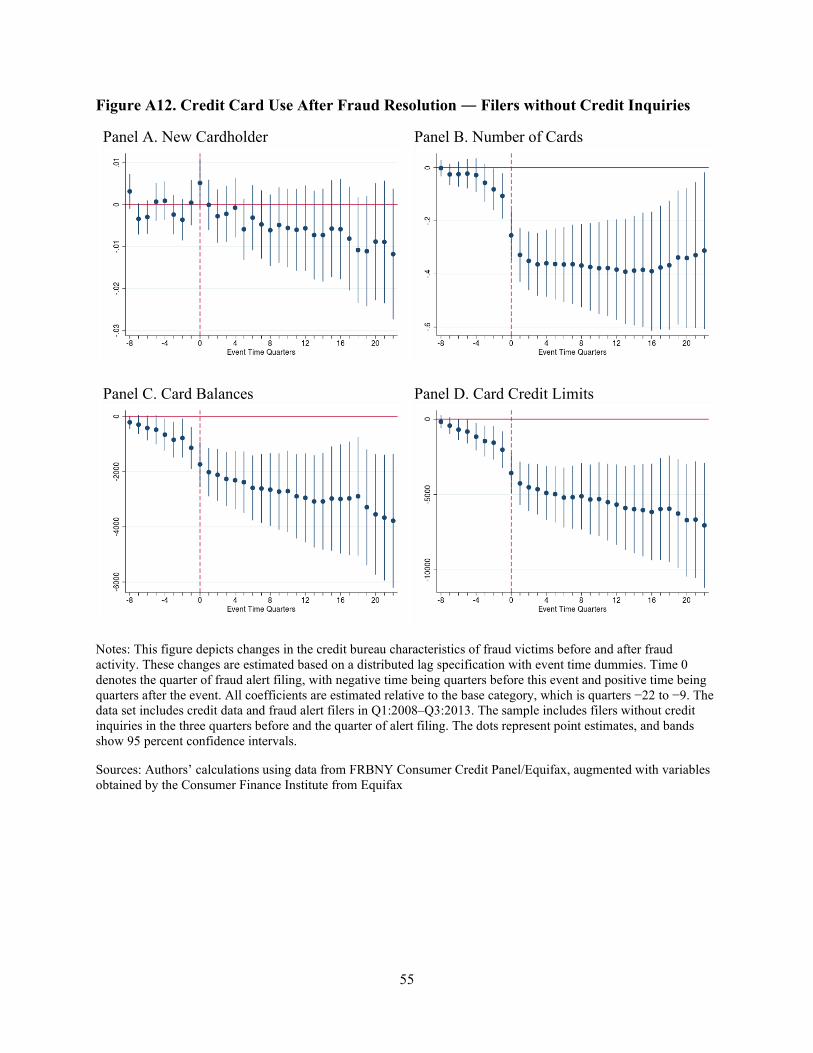
55
Figure A12. Credit Card Use After Fraud Resolution ― Filers without Credit Inquiries
Panel A. New Cardholder
Panel B. Number of Cards
Panel C. Card Balances
Panel D. Card Credit Limits
Notes: This figure depicts changes in the credit bureau characteristics of fraud victims before and after fraud activity. These changes are estimated based on a distributed lag specification with event time dummies. Time 0 denotes the quarter of fraud alert filing, with negative time being quarters before this event and positive time being quarters after the event. All coefficients are estimated relative to the base category, which is quarters −22 to −9. The data set includes credit data and fraud alert filers in Q1:2008–Q3:2013. The sample includes filers without credit inquiries in the three quarters before and the quarter of alert filing. The dots represent point estimates, and bands show 95 percent confidence intervals.
Sources: Authors’ calculations using data from FRBNY Consumer Credit Panel/Equifax, augmented with variables obtained by the Consumer Finance Institute from Equifax
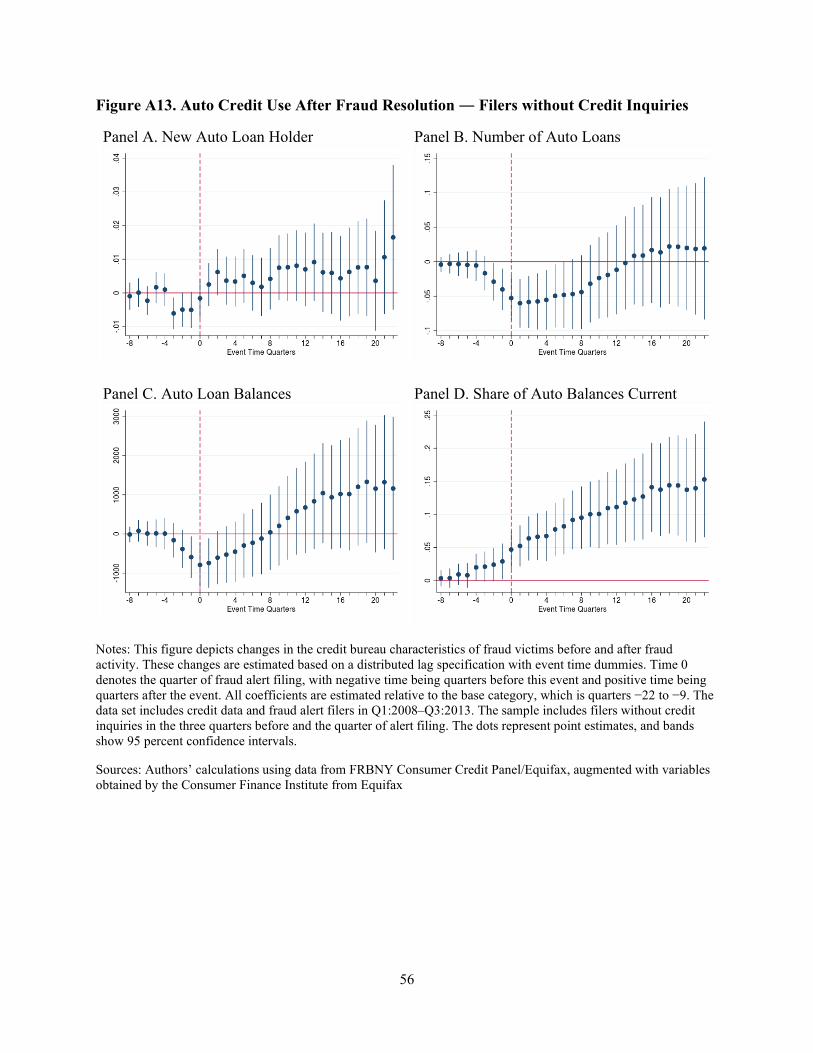
56
Figure A13. Auto Credit Use After Fraud Resolution ― Filers without Credit Inquiries
Panel A. New Auto Loan Holder
Panel B. Number of Auto Loans
Panel C. Auto Loan Balances
Panel D. Share of Auto Balances Current
Notes: This figure depicts changes in the credit bureau characteristics of fraud victims before and after fraud activity. These changes are estimated based on a distributed lag specification with event time dummies. Time 0 denotes the quarter of fraud alert filing, with negative time being quarters before this event and positive time being quarters after the event. All coefficients are estimated relative to the base category, which is quarters −22 to −9. The data set includes credit data and fraud alert filers in Q1:2008–Q3:2013. The sample includes filers without credit inquiries in the three quarters before and the quarter of alert filing. The dots represent point estimates, and bands show 95 percent confidence intervals.
Sources: Authors’ calculations using data from FRBNY Consumer Credit Panel/Equifax, augmented with variables obtained by the Consumer Finance Institute from Equifax
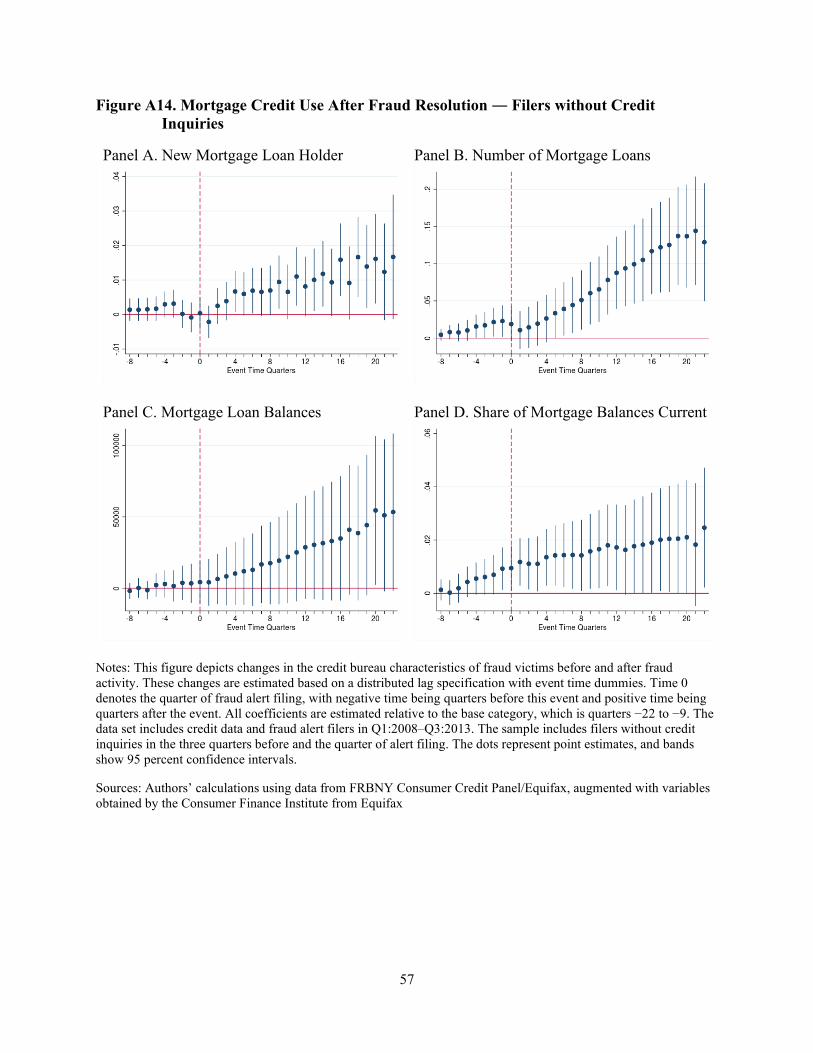
57
Figure A14. Mortgage Credit Use After Fraud Resolution ― Filers without Credit Inquiries
Panel A. New Mortgage Loan Holder
Panel B. Number of Mortgage Loans
Panel C. Mortgage Loan Balances
Panel D. Share of Mortgage Balances Current
Notes: This figure depicts changes in the credit bureau characteristics of fraud victims before and after fraud activity. These changes are estimated based on a distributed lag specification with event time dummies. Time 0 denotes the quarter of fraud alert filing, with negative time being quarters before this event and positive time being quarters after the event. All coefficients are estimated relative to the base category, which is quarters −22 to −9. The data set includes credit data and fraud alert filers in Q1:2008–Q3:2013. The sample includes filers without credit inquiries in the three quarters before and the quarter of alert filing. The dots represent point estimates, and bands show 95 percent confidence intervals.
Sources: Authors’ calculations using data from FRBNY Consumer Credit Panel/Equifax, augmented with variables obtained by the Consumer Finance Institute from Equifax
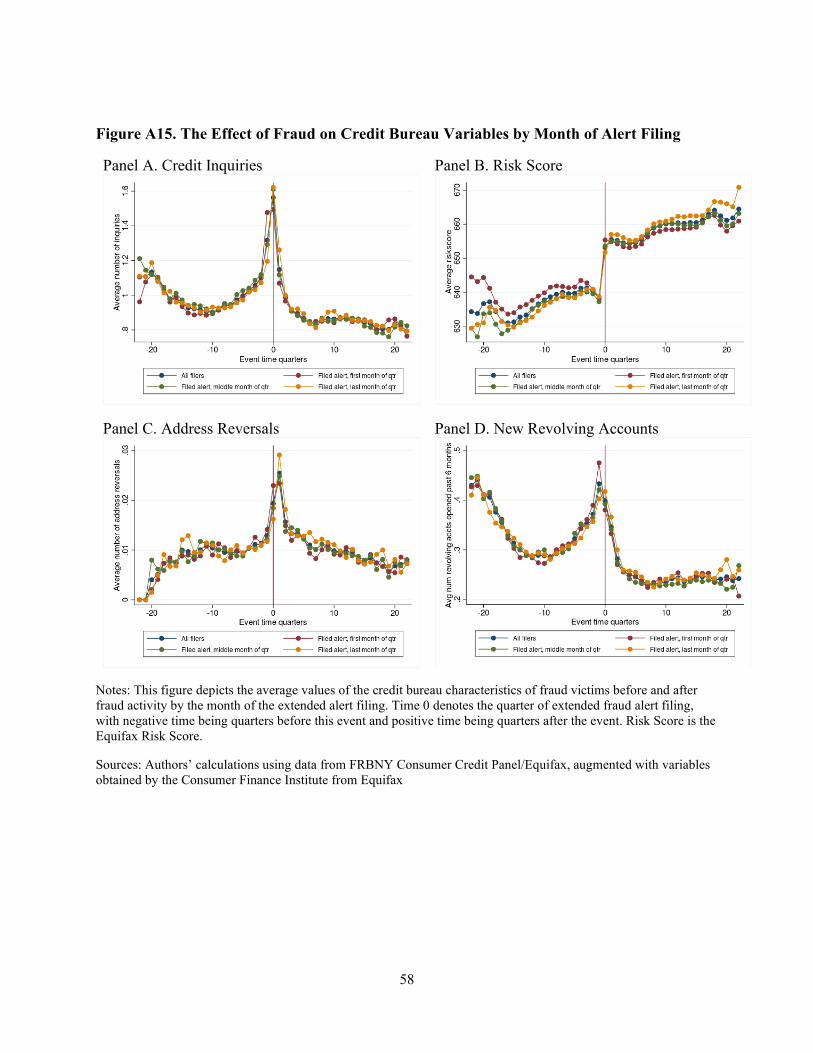
58
Figure A15. The Effect of Fraud on Credit Bureau Variables by Month of Alert Filing
Panel A. Credit Inquiries
Panel B. Risk Score
Panel C. Address Reversals
Panel D. New Revolving Accounts
Notes: This figure depicts the average values of the credit bureau characteristics of fraud victims before and after fraud activity by the month of the extended alert filing. Time 0 denotes the quarter of extended fraud alert filing, with negative time being quarters before this event and positive time being quarters after the event. Risk Score is the Equifax Risk Score.
Sources: Authors’ calculations using data from FRBNY Consumer Credit Panel/Equifax, augmented with variables obtained by the Consumer Finance Institute from Equifax
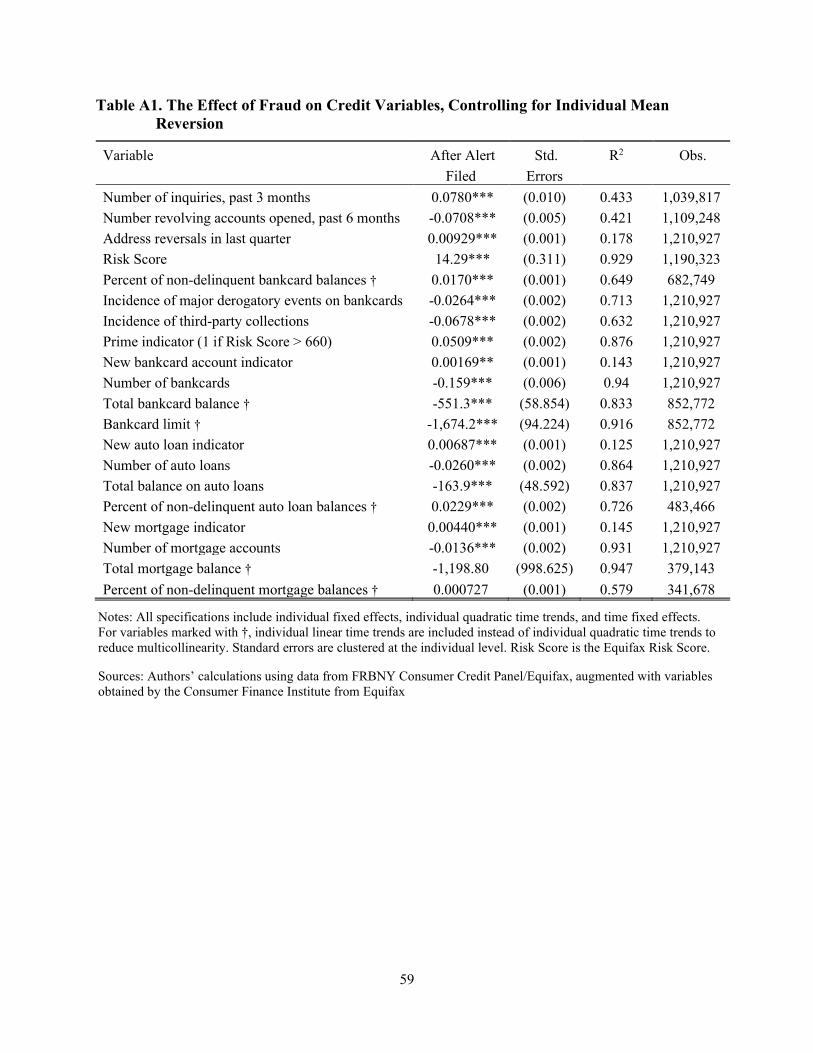
59
Table A1. The Effect of Fraud on Credit Variables, Controlling for Individual Mean Reversion
Variable After Alert Std. R2 Obs. Filed Errors
Number of inquiries, past 3 months 0.0780*** (0.010) 0.433 1,039,817 Number revolving accounts opened, past 6 months -0.0708*** (0.005) 0.421 1,109,248 Address reversals in last quarter 0.00929*** (0.001) 0.178 1,210,927 Risk Score 14.29*** (0.311) 0.929 1,190,323 Percent of non-delinquent bankcard balances † 0.0170*** (0.001) 0.649 682,749 Incidence of major derogatory events on bankcards -0.0264*** (0.002) 0.713 1,210,927 Incidence of third-party collections -0.0678*** (0.002) 0.632 1,210,927 Prime indicator (1 if Risk Score > 660) 0.0509*** (0.002) 0.876 1,210,927 New bankcard account indicator 0.00169** (0.001) 0.143 1,210,927 Number of bankcards -0.159*** (0.006) 0.94 1,210,927 Total bankcard balance † -551.3*** (58.854) 0.833 852,772 Bankcard limit † -1,674.2*** (94.224) 0.916 852,772 New auto loan indicator 0.00687*** (0.001) 0.125 1,210,927 Number of auto loans -0.0260*** (0.002) 0.864 1,210,927 Total balance on auto loans -163.9*** (48.592) 0.837 1,210,927 Percent of non-delinquent auto loan balances † 0.0229*** (0.002) 0.726 483,466 New mortgage indicator 0.00440*** (0.001) 0.145 1,210,927 Number of mortgage accounts -0.0136*** (0.002) 0.931 1,210,927 Total mortgage balance † -1,198.80 (998.625) 0.947 379,143 Percent of non-delinquent mortgage balances † 0.000727 (0.001) 0.579 341,678
Notes: All specifications include individual fixed effects, individual quadratic time trends, and time fixed effects. For variables marked with †, individual linear time trends are included instead of individual quadratic time trends to reduce multicollinearity. Standard errors are clustered at the individual level. Risk Score is the Equifax Risk Score.
Sources: Authors’ calculations using data from FRBNY Consumer Credit Panel/Equifax, augmented with variables obtained by the Consumer Finance Institute from Equifax